Article

Transcriptome Analysis Reveals Fruit Quality Formation in Actinidia eriantha Benth

1
Sanming Academy of Agricultural Sciences, Shaxian 365051, China
2
The Key Laboratory of Crop Genetic Improvement and Innovative Utilization in Fujian Province (Mountain Area), Shaxian 365051, China
3
Fruit Tree Research Institute of Fujian Academy of Agricultural Sciences, Fuzhou 350002, China
4
Institute of Horticultural Plant Bioengineering, Fujian Agriculture and Forestry University, Fuzhou 350002, China
*
Authors to whom correspondence should be addressed.
Plants 2023, 12(24), 4079; https://doi.org/10.3390/plants12244079
Submission received: 21 October 2023 / Revised: 26 November 2023 / Accepted: 29 November 2023 / Published: 6 December 2023
(This article belongs to the Special Issue Recent Advances in Horticultural Plant Genomics)

Abstract

:
Actinidia chinensis Planch. is a fruit tree originating from China that is abundant in the wild. Actinidia eriantha Benth. is a type of A. chinensis that has emerged in recent years. The shape of A. eriantha is an elongated oval, and the skin is covered with dense, non-shedding milk-white hairs. The mature fruit has flesh that is bright green in colour, and the fruit has a strong flavour and a grass-like smell. It is appreciated for its rich nutrient content and unique flavour. Vitamin C, sugar, and organic acids are key factors in the quality and flavour composition of A. eriantha but have not yet been systematically analysed. Therefore, we sequenced the transcriptome of A. eriantha at three developmental stages and labelled them S1, S2, and S3, and comparisons of S1 vs. S2, S1 vs. S3, and S2 vs. S3 revealed 1218, 4019, and 3759 upregulated differentially expressed genes and 1823, 3415, and 2226 downregulated differentially expressed genes, respectively. Furthermore, the upregulated differentially expressed genes included 213 core genes, and Gene Ontology enrichment analysis showed that they were enriched in hormones, sugars, organic acids, and many organic metabolic pathways. The downregulated differentially expressed genes included 207 core genes, which were enriched in the light signalling pathway. We further constructed the metabolic pathways of sugars, organic acids, and vitamin C in A. eriantha and identified the genes involved in vitamin C, sugar, and organic acid synthesis in A. eriantha fruits at different stages. During fruit development, the vitamin C content decreased, the carbohydrate compound content increased, and the organic acid content decreased. The gene expression patterns were closely related to the accumulation patterns of vitamin C, sugars, and organic acids in A. eriantha. The above results lay the foundation for the accumulation of vitamin C, sugars, and organic acids in A. eriantha and for understanding flavour formation in A. eriantha.

1. Introduction

As a fruit tree native to China, Actinidia eriantha has become one of the most popular in recent years. A. eriantha is rich in nutrients, and the fruit contains a large amount of vitamin C (Vc), dietary fibre, and a variety of mineral nutrients [1]. In addition, A. eriantha contains approximately 500 to 1379 mg/100 g fresh weight (FW) of Vc; thus, it is not inferior to other varieties of kiwifruit [2]. However, more studies have been performed on the synthesis and metabolism of Vc in Actinidia chinensis and Actinidia deliciosa than in A. eriantha. In addition, A. eriantha is popular for its moderate sweetness and acidity and its unique flavour [3]. Sugar and acid components are important fruit quality components of research interest and have important effects on fruit’s flavour. However, research on kiwifruit has focused on A. chinensis and A. deliciosa, which contain fructose, glucose, and sucrose [4], and quinic acid, malic acid, and citric acid as the primary acid components [5]. To date, the formation of unique A. eriantha flavours and the composition of sugars and organic acids have been less studied.
Sweetness is one of the primary factors used to measure fruit quality [6]. The content and composition ratio of sugar compounds such as sucrose, fructose, and glucose determine the sweetness and flavour of fruits [7,8]. For example, fructose is the main sugar substance in apples and pears [9,10], while sucrose is the main sugar substance in watermelon and cantaloupe [11,12]. Furthermore, previous studies have shown that different varieties of kiwifruit have different main sugar substances. In the fruit of kiwifruit ‘Hort 16A’, glucose is the most abundant, followed by fructose, while sucrose is the least abundant [13]. On the other hand, in the fruit of ‘Mitsuko’ kiwifruit, sucrose is the main sugar substance, and the contents of glucose and fructose are relatively low [14]. Sucrose, one of the key substances in plant metabolism, provides an important material foundation for plant growth and development. The synthesis of sucrose in plants is mainly regulated by sucrose synthase (SUS), which controls the synthesis of UDP-glucose for sucrose formation [15]. Subsequently, sucrose is converted into fructose and glucose by neutral invertase. Additionally, fructose and glucose can be phosphorylated by fructokinase and hexokinase, forming fructose-6-phosphate and glucose-6-phosphate [16].
Acidity is another important indicator that determines fruit quality [17]. The main organic acids in fruits are usually malic acid, citric acid, tartaric acid, and succinic acid. Additionally, different organic acids have varying levels of acidity, with malic acid being the strongest and tartaric acid being the weakest. The proportion of organic acids to sugar substances in fruit determines the balance of sweetness and acidity [18]. Furthermore, quinic acid and citric acid are the main organic acids found in kiwifruit ‘Ganmi 6’, yellow-fleshed kiwifruit ‘Jinshi 1’, and A. chinensis [19,20,21]. However, some studies also suggest that malic acid is a major component of organic acids in kiwifruit [22,23]. Moreover, malic acid and citric acid, as key intermediates in the tricarboxylic acid cycle, also participate in plant respiration and energy metabolism [24]. The types and levels of organic acids in fruits play a crucial role in determining the quality and unique flavour of horticultural crops.
Vc is an essential nutrient for the human body that cannot be synthesized endogenously and thus needs to be obtained from external sources. There are four pathways for the synthesis of Vc in plants, namely, the L-galactose, D-galactose, L-gulose, and myo-inositol pathways [25,26,27,28]. Additionally, plants have a Vc recycling pathway. Previous studies have shown that the majority of plants use the L-galactose and D-galactose pathways as the main routes of Vc synthesis. Kiwifruit also predominantly synthesizes Vc via these two pathways. However, there was significant variation in the Vc content among the different kiwifruit varieties. The fruits of A. deliciosa ‘Hayward’ contain 65.5 mg/100 g FW of Vc. The Vc content of the fruit of A. deliciosa ranged from 29 mg/100 g FW to 80 mg/100 g FW. The Vc content of the fruit of sanuki gold was more than three times that of A. deliciosa ‘Hayward’. In Actinidia arguta fruit, the Vc content ranges from 37 to 185 mg/100 g FW [29,30].
As a technology to study the transcription of all genes in cells at the overall level, transcriptome sequencing has extensive applications in plant function research. Transcriptome sequencing was used to identify many genes related to flowering and fruiting in rabbit-eye blueberry (Vaccinium ashei) [31]. Using transcriptome sequencing, Lycium ruthenicum provides the basis for functional and molecular biology studies on its fruit colouration [32]. Transcriptome sequencing of different stages of fruit development helped to elucidate the molecular mechanism of Pyrus bretschneideri Rehd fruit ripening [33]. In addition, transcriptome techniques have been used in fruit trees such as Prunus armeniaca L. [34,35] and Rosa roxburghii [36]. A. chinensis Planch. is a perennial deciduous fruiting woody vine of Actinidia, Actinidiaceae. A. eriantha is a unique germplasm resource of kiwifruit in China, and more than 300 accessions have been recorded and evaluated. At present, most A. eriantha are found in the wild. A. eriantha ‘White’, A. eriantha ‘Shanong 18’, and A. eriantha ‘Ganmi 6’ are the dominant A. eriantha, and only one hybridized cultivar, A. eriantha ‘Jinyan’, has been registered. A. eriantha fruits are rich in Vc, minerals, and a variety of amino acids, with unique flavours [37]. Therefore, the synthesis and accumulation of vitamins, sugars, and organic acids during the growth and development process play a crucial role in the fruit quality and its unique flavour. Previous transcriptomic studies on kiwifruit have analysed its microsatellite markers for population genetics studies and the new formation mechanisms of the early maturity traits in kiwifruit [38]. However, systematic analysis and determination of the Vc, sugar, and organic acid contents in kiwifruit have not been reported. Therefore, this study used transcriptome sequencing technology to analyse samples from different stages of fruit growth and development of A. eriantha [39]. The transcriptome results showed that many differentially expressed genes (DEGs) were identifiable during the development of A. eriantha fruits. Similarly, we identified 213 and 207 core upregulated and downregulated genes among the DEGs. The Gene Ontology (GO) enrichment showed that the 213 core upregulated DEGs were mainly enriched in hormones, sugars, organic acids, and many organic matter metabolism pathways, and the 207 core downregulated DEGs showed a greatly reduced response to light during A. eriantha ripening. To further understand the fruit flavour formation of A. eriantha, we further constructed a synthesis pathway of sugar, organic acids, and Vc during fruit development in A. eriantha. Furthermore, we measured the contents of sugars, organic acids, and Vc during fruit development. Finally, we verified the relationship between genes and Vc, sugar, and organic acid using real-time fluorescence quantitative PCR (RT–qPCR). This study provides a reference for understanding the formation of thw unique flavours in A. eriantha, which can be used for genetic breeding and variety improvement.

2. Results

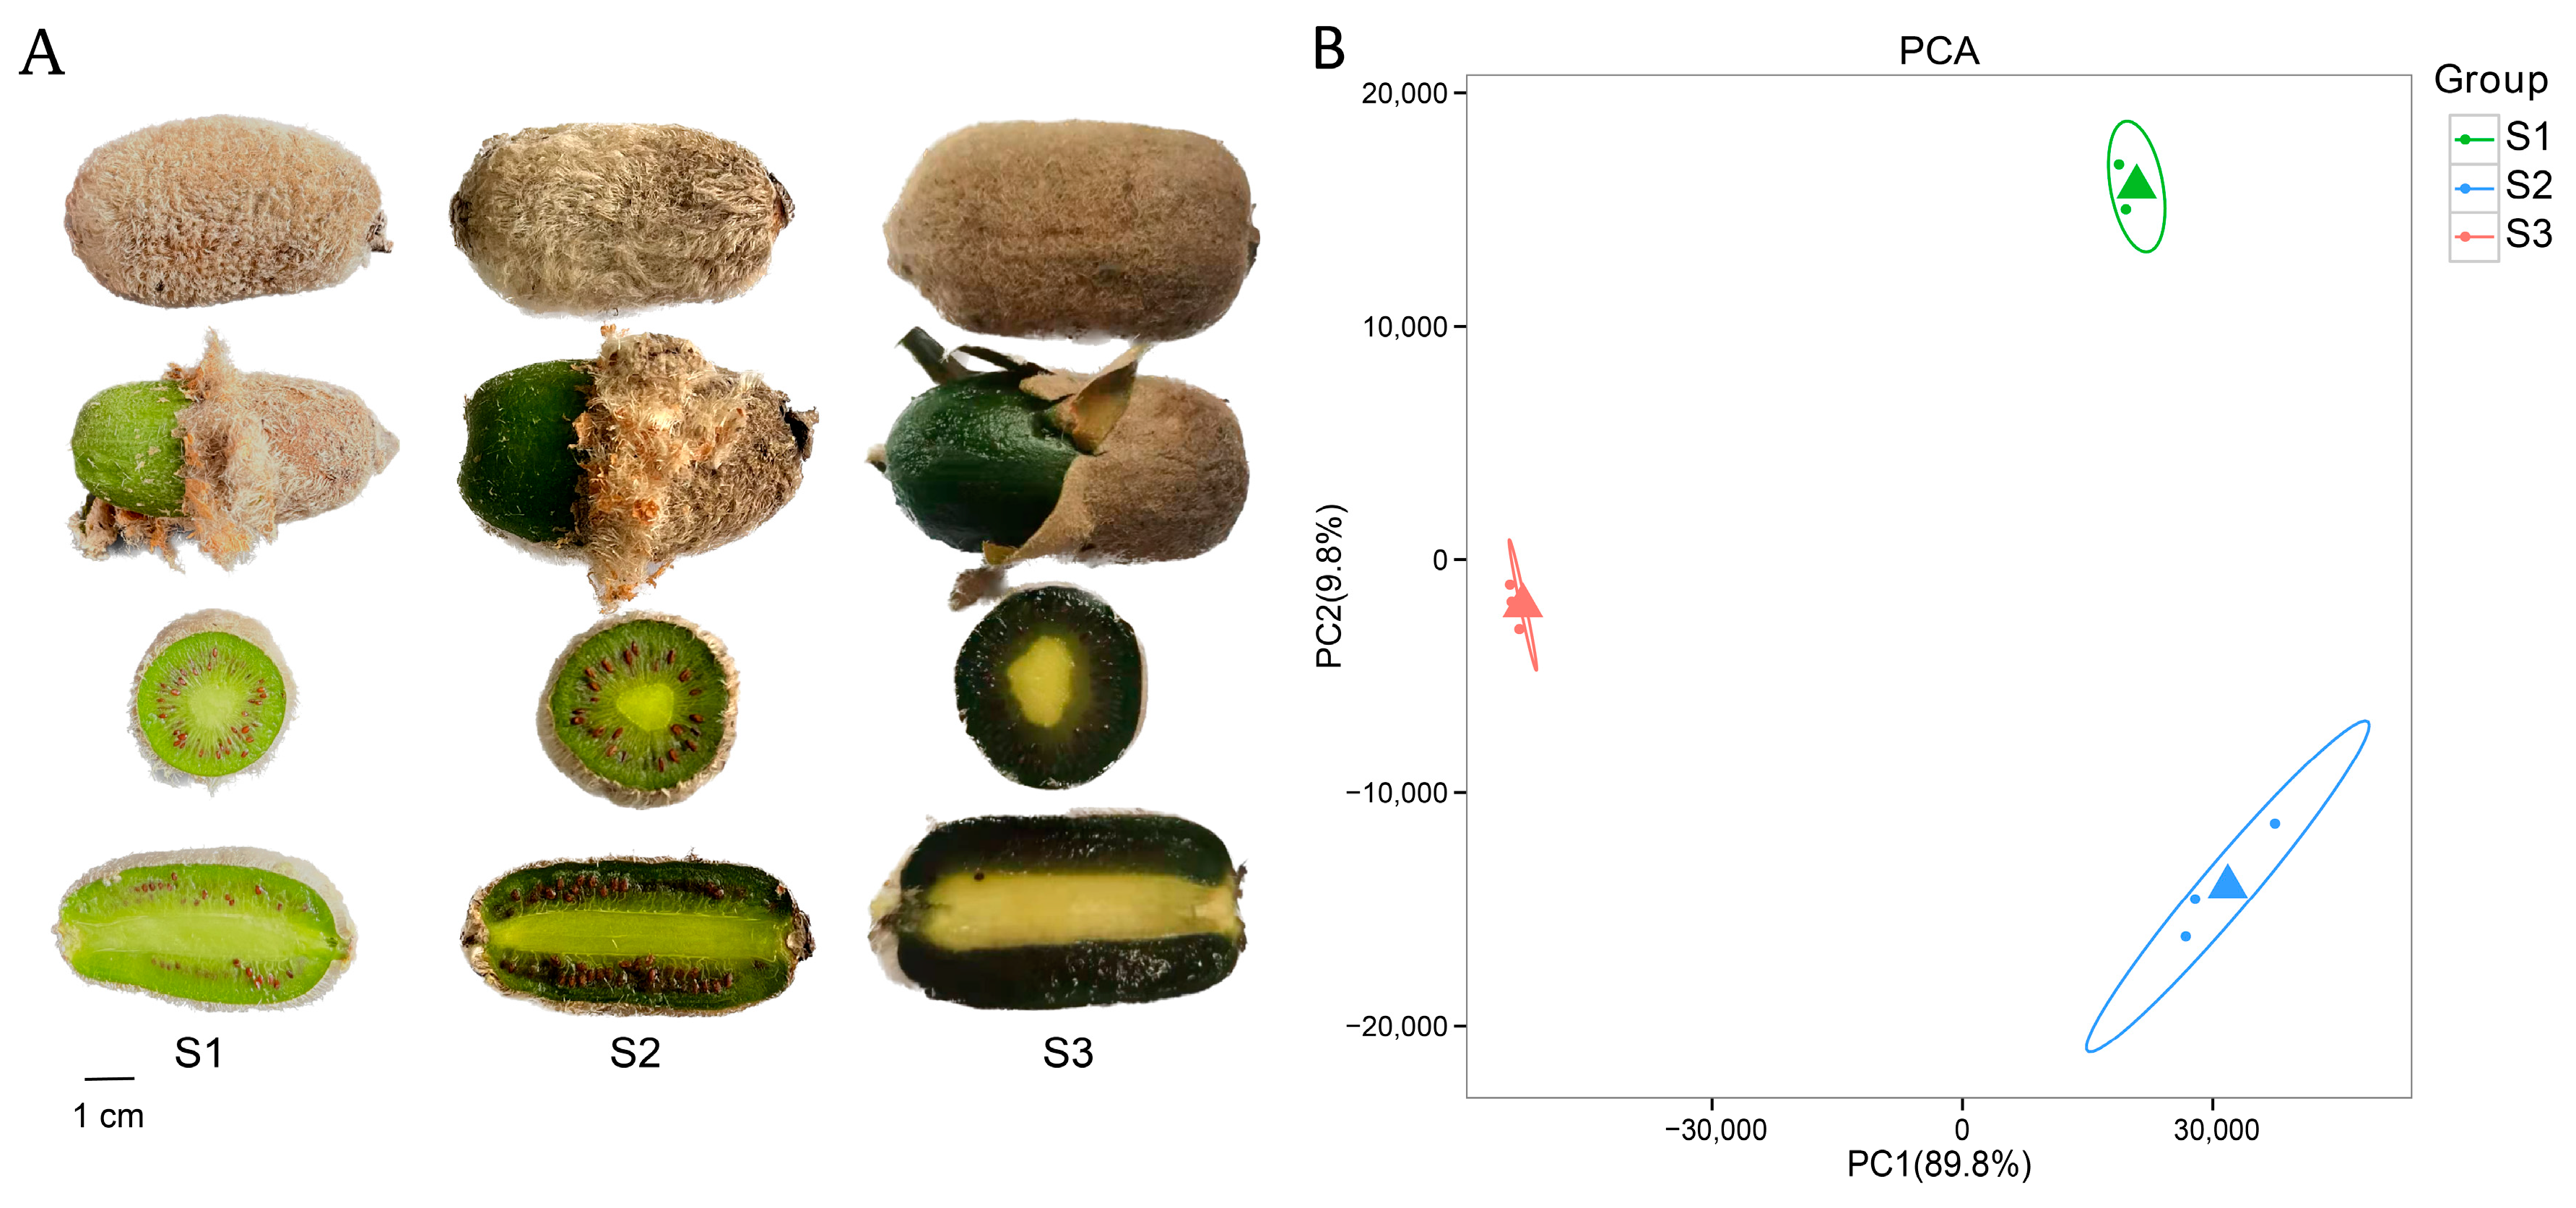
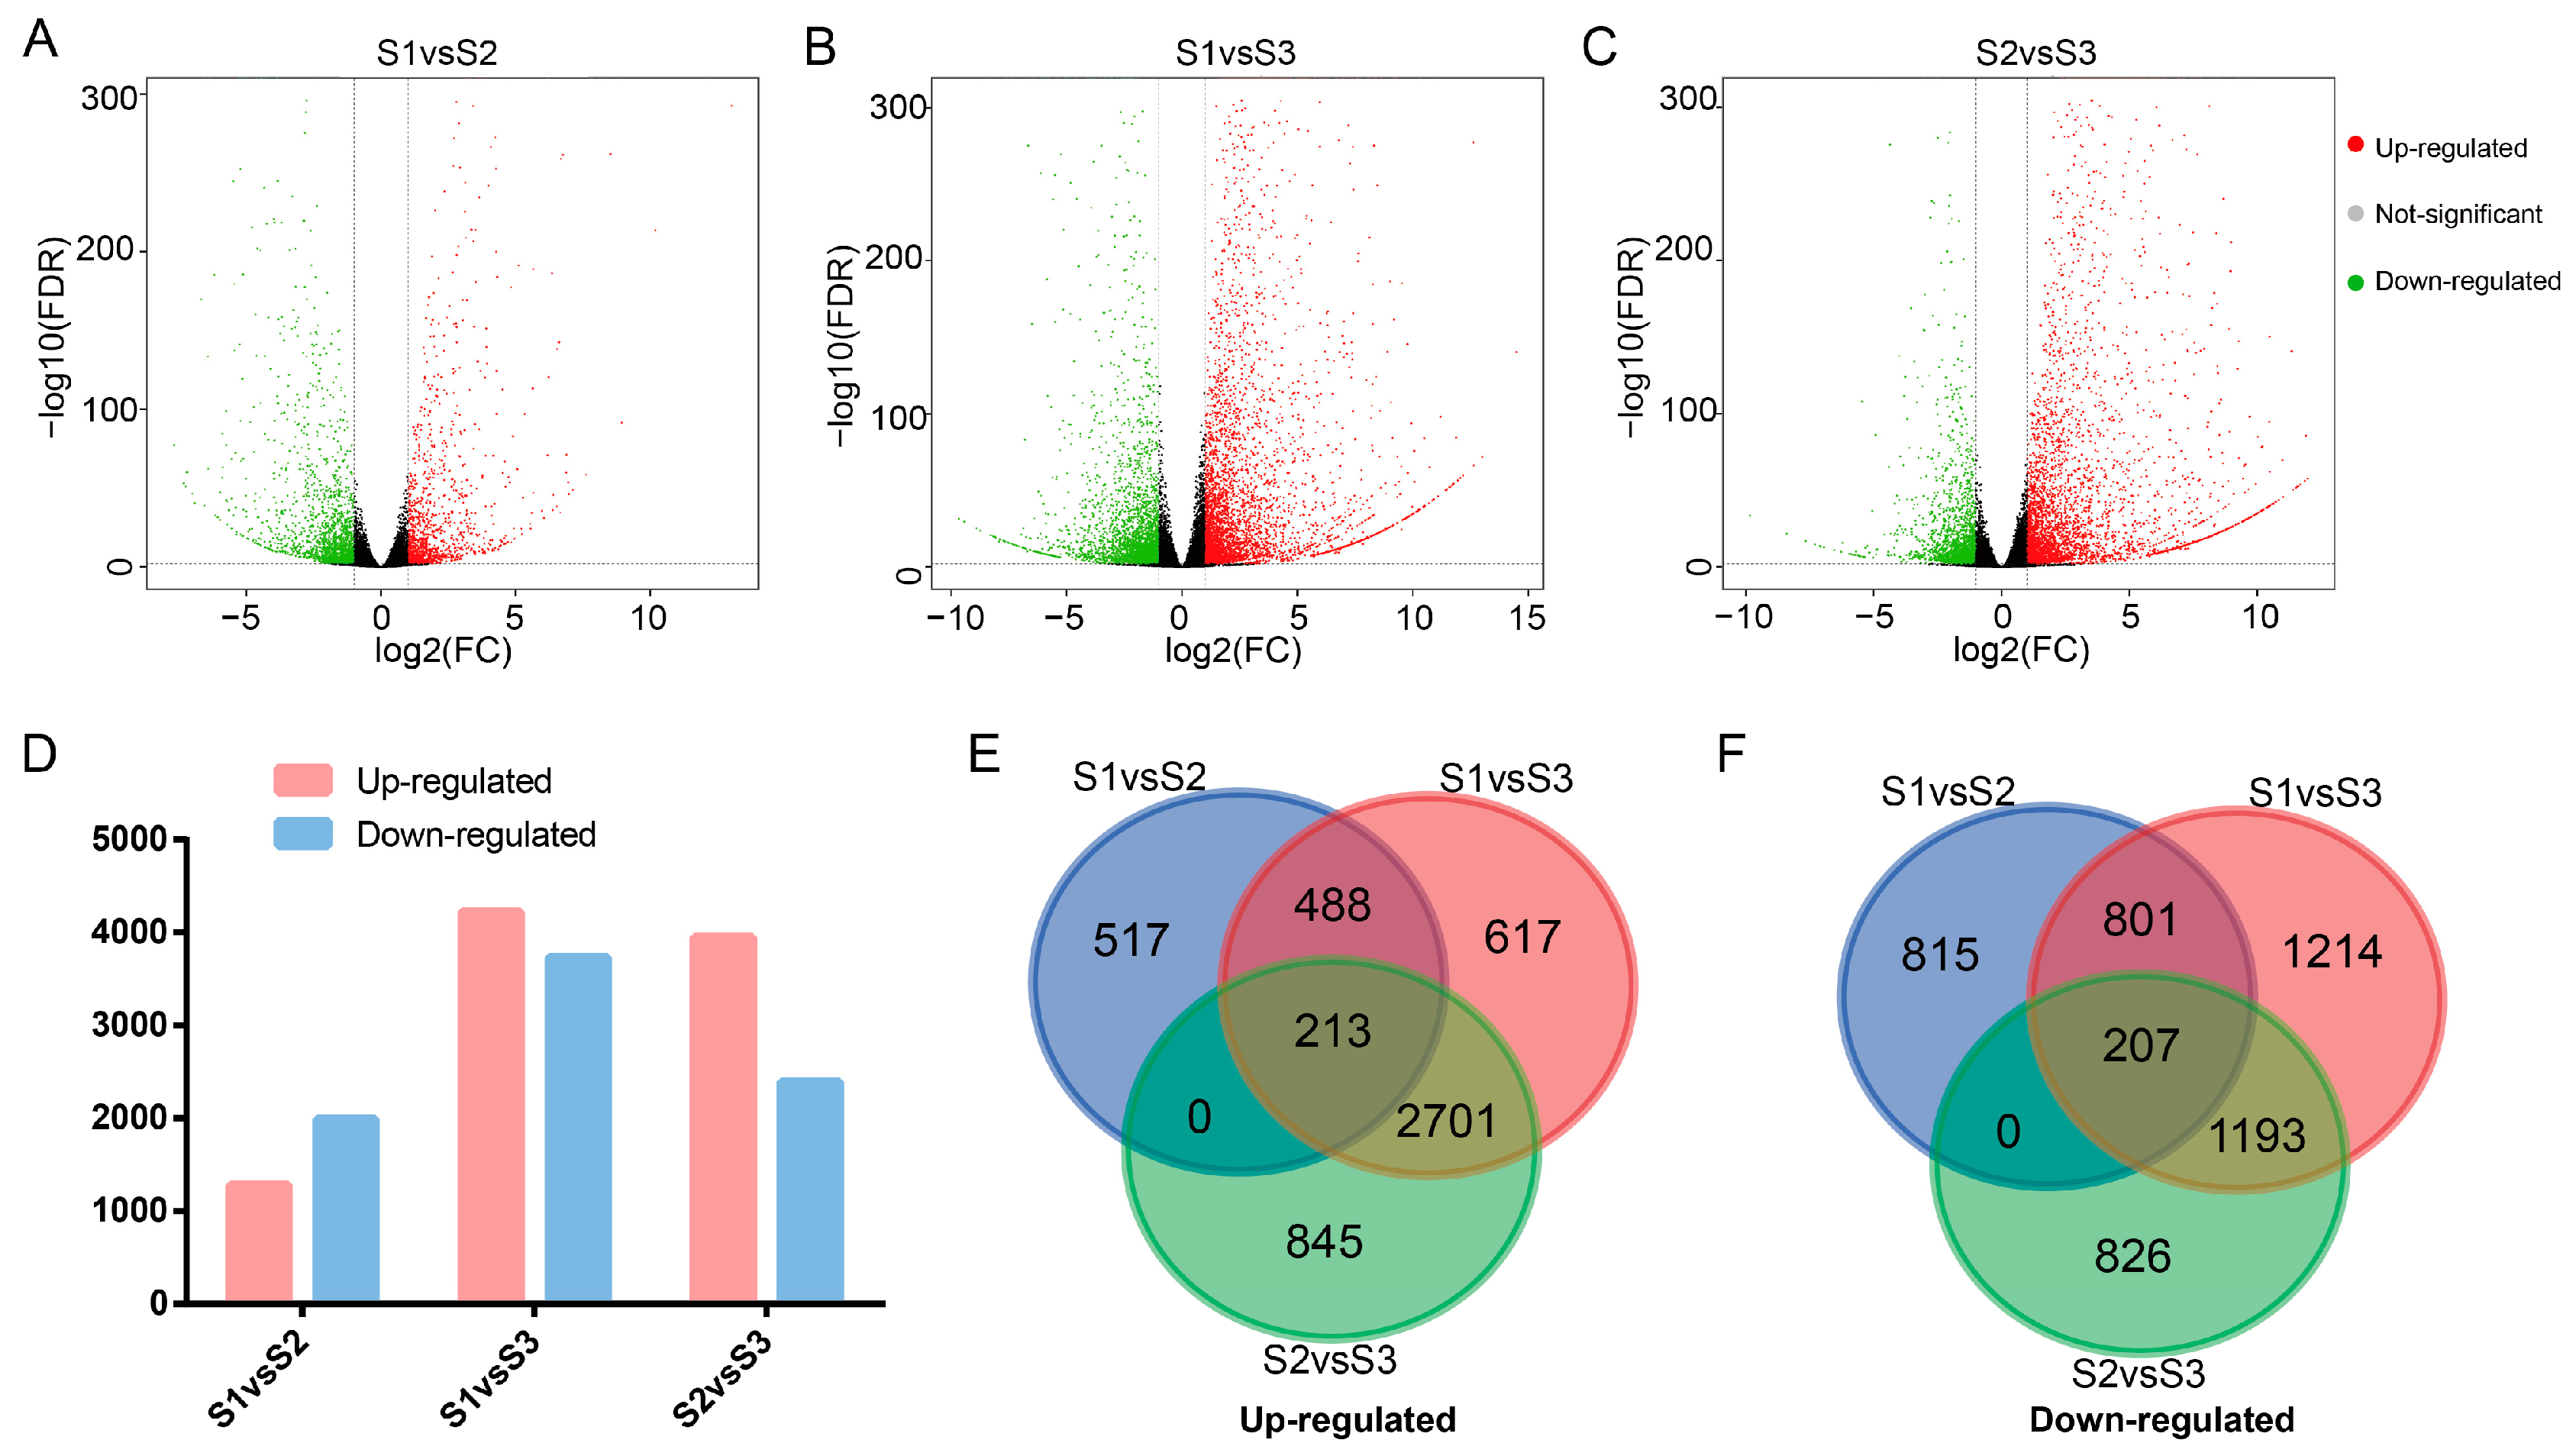
2.1. Transcriptomic Analysis of A. eriantha

Transcriptome sequencing was performed using nine samples of A. eriantha at different stages of growth and development (Figure 1A). The sequencing yielded 57.60 Gb of raw data, with a Qphred 30 (Q30, the probability of correct sequencing for one base is 99.99%) of all data greater than 93.35% (Supplemental Table S2). Further low-quality read data were removed using the Fsatp software with the default parameters and aligned with the A. eriantha genome, and the alignment rate was 82.37% to 84.11% (Supplemental Table S3). The results indicate a high quality of transcriptome data for sequencing. In addition, the results of principal component analysis (PCA) showed that the three biological replicates of the three samples clustered together and that principal component 1 (PC1) explained 89.8% of the observed variation, representing the difference between the samples (Figure 1B).
To gain insight into the dynamic changes in gene expression during A. eriantha ripening, we analysed the fragments per kilobase of exon model per million mapped fragments (FPKM) of data from three stages. We identified 1218, 4019, and 3759 upregulated differentially expressed genes and 1823, 3415, and 2226 distinct downregulated differentially expressed genes in S1 vs. S2, S1 vs. S3, and S2 vs. S3, respectively (Figure 2A–D). Moreover, further analysis of these DEGs revealed that the upregulated DEGs included 213 core genes (Figure 2E), and the downregulated DEGs included 207 core genes (Figure 2F). Therefore, we further performed a GO enrichment analysis on these core genes. The 213 core upregulated DEGs were mainly enriched in hormones, sugars, organic acids, and many organic matter metabolism pathways (Supplemental Table S4), indicating an important role in the accumulation and metabolism of hormones and organic matter during the maturation of A. eriantha. However, the GO enrichment of 207 core downregulated DEGs showed a greatly reduced response to light during A. eriantha ripening (Supplemental Table S5).

2.2. Analysis of the Vc Synthesis Pathway in A. eriantha

Vc is one of the important factors in A. eriantha quality. To understand the dynamic changes in Vc content during fruit ripening, we constructed the Vc anabolic pathway (Figure 3A) of A. eriantha. The galactose and inositol pathways make limited contributions to Vc synthesis in plants. Therefore, in this paper, the expression profile of Vc synthesis-related genes in A. eriantha was constructed based on the L-galactose pathway, galacturonate pathway, and recycling pathway. The results showed that the expression patterns of genes in the L-galactose pathway, galacturonate pathway, and recycling pathway were consistent during the development of A. eriantha. They are highly expressed in early and middle fruit development, while gene expression decreases after fruit maturity. Furthermore, we determined the Vc content (Figure 3B) at the three stages of A. eriantha development. The results showed that the Vc content was significantly reduced after fruit maturation compared with early fruit development. However, the expression trends of five, two, and six genes in the L-galactose pathway, the galacturonic acid pathway, and the recycling pathway, respectively, showed inconsistencies with the pattern of Vc accumulation in Chinese kiwifruit (Figure 3A,B). Therefore, to further elucidate the correlation between Vc accumulation and gene expression in A. eriantha, we conducted RT–qPCR analysis of these genes in the above three pathways. In the L-galactose pathway, we screened five genes from the glucose-6-phosphate isomerase (PGI), mannose-6-phosphate isomerase (PMI), GDP-D-mannose pyrophosphorylase (GMP), and GDP-L-galactose phosphorylase (GGP) gene families (Figure 4A). Among the five genes, the PGI (DTZ79_10g09380) and GMP (DTZ79_13g11340) expression levels increased during fruit development. However, the expression of PGI (DTZ79_10g12530) and PMI (DTZ79_02g10970) decreased during fruit development, while GGP (DTZ79_29g10040) expression was decreased at S2 and peaked at S3. In addition, in the galacturonate pathway, the D-galacturonate reductase (GalUR) (DTZ79_13g02680) and aldonolactonase (Alase) (DTZ79_03g07860) expression levels decreased with fruit development (Figure 4B). In the Vc recycling pathway, we selected six genes (Figure 4C). The expression of L-ascorbate peroxidase (APX) (DTZ79_25g10570) peaked at S2, and the expression of APX (DTZ79_05g07210) increased with fruit ripening. Two genes of the L-ascorbate oxidase (AO) (DTZ79_27g07430 and DTZ79_27g07610) and two genes of the monodehydroascorbate reductase (MDHAR) (DTZ79_27g01630 and DTZ79_27g11730) decreased in expression as the fruit matured. The above results indicate that Vc in A. eriantha accumulates significantly at the early stages of fruit development while the accumulation pattern of Vc was basically consistent with the expression pattern of the gene.

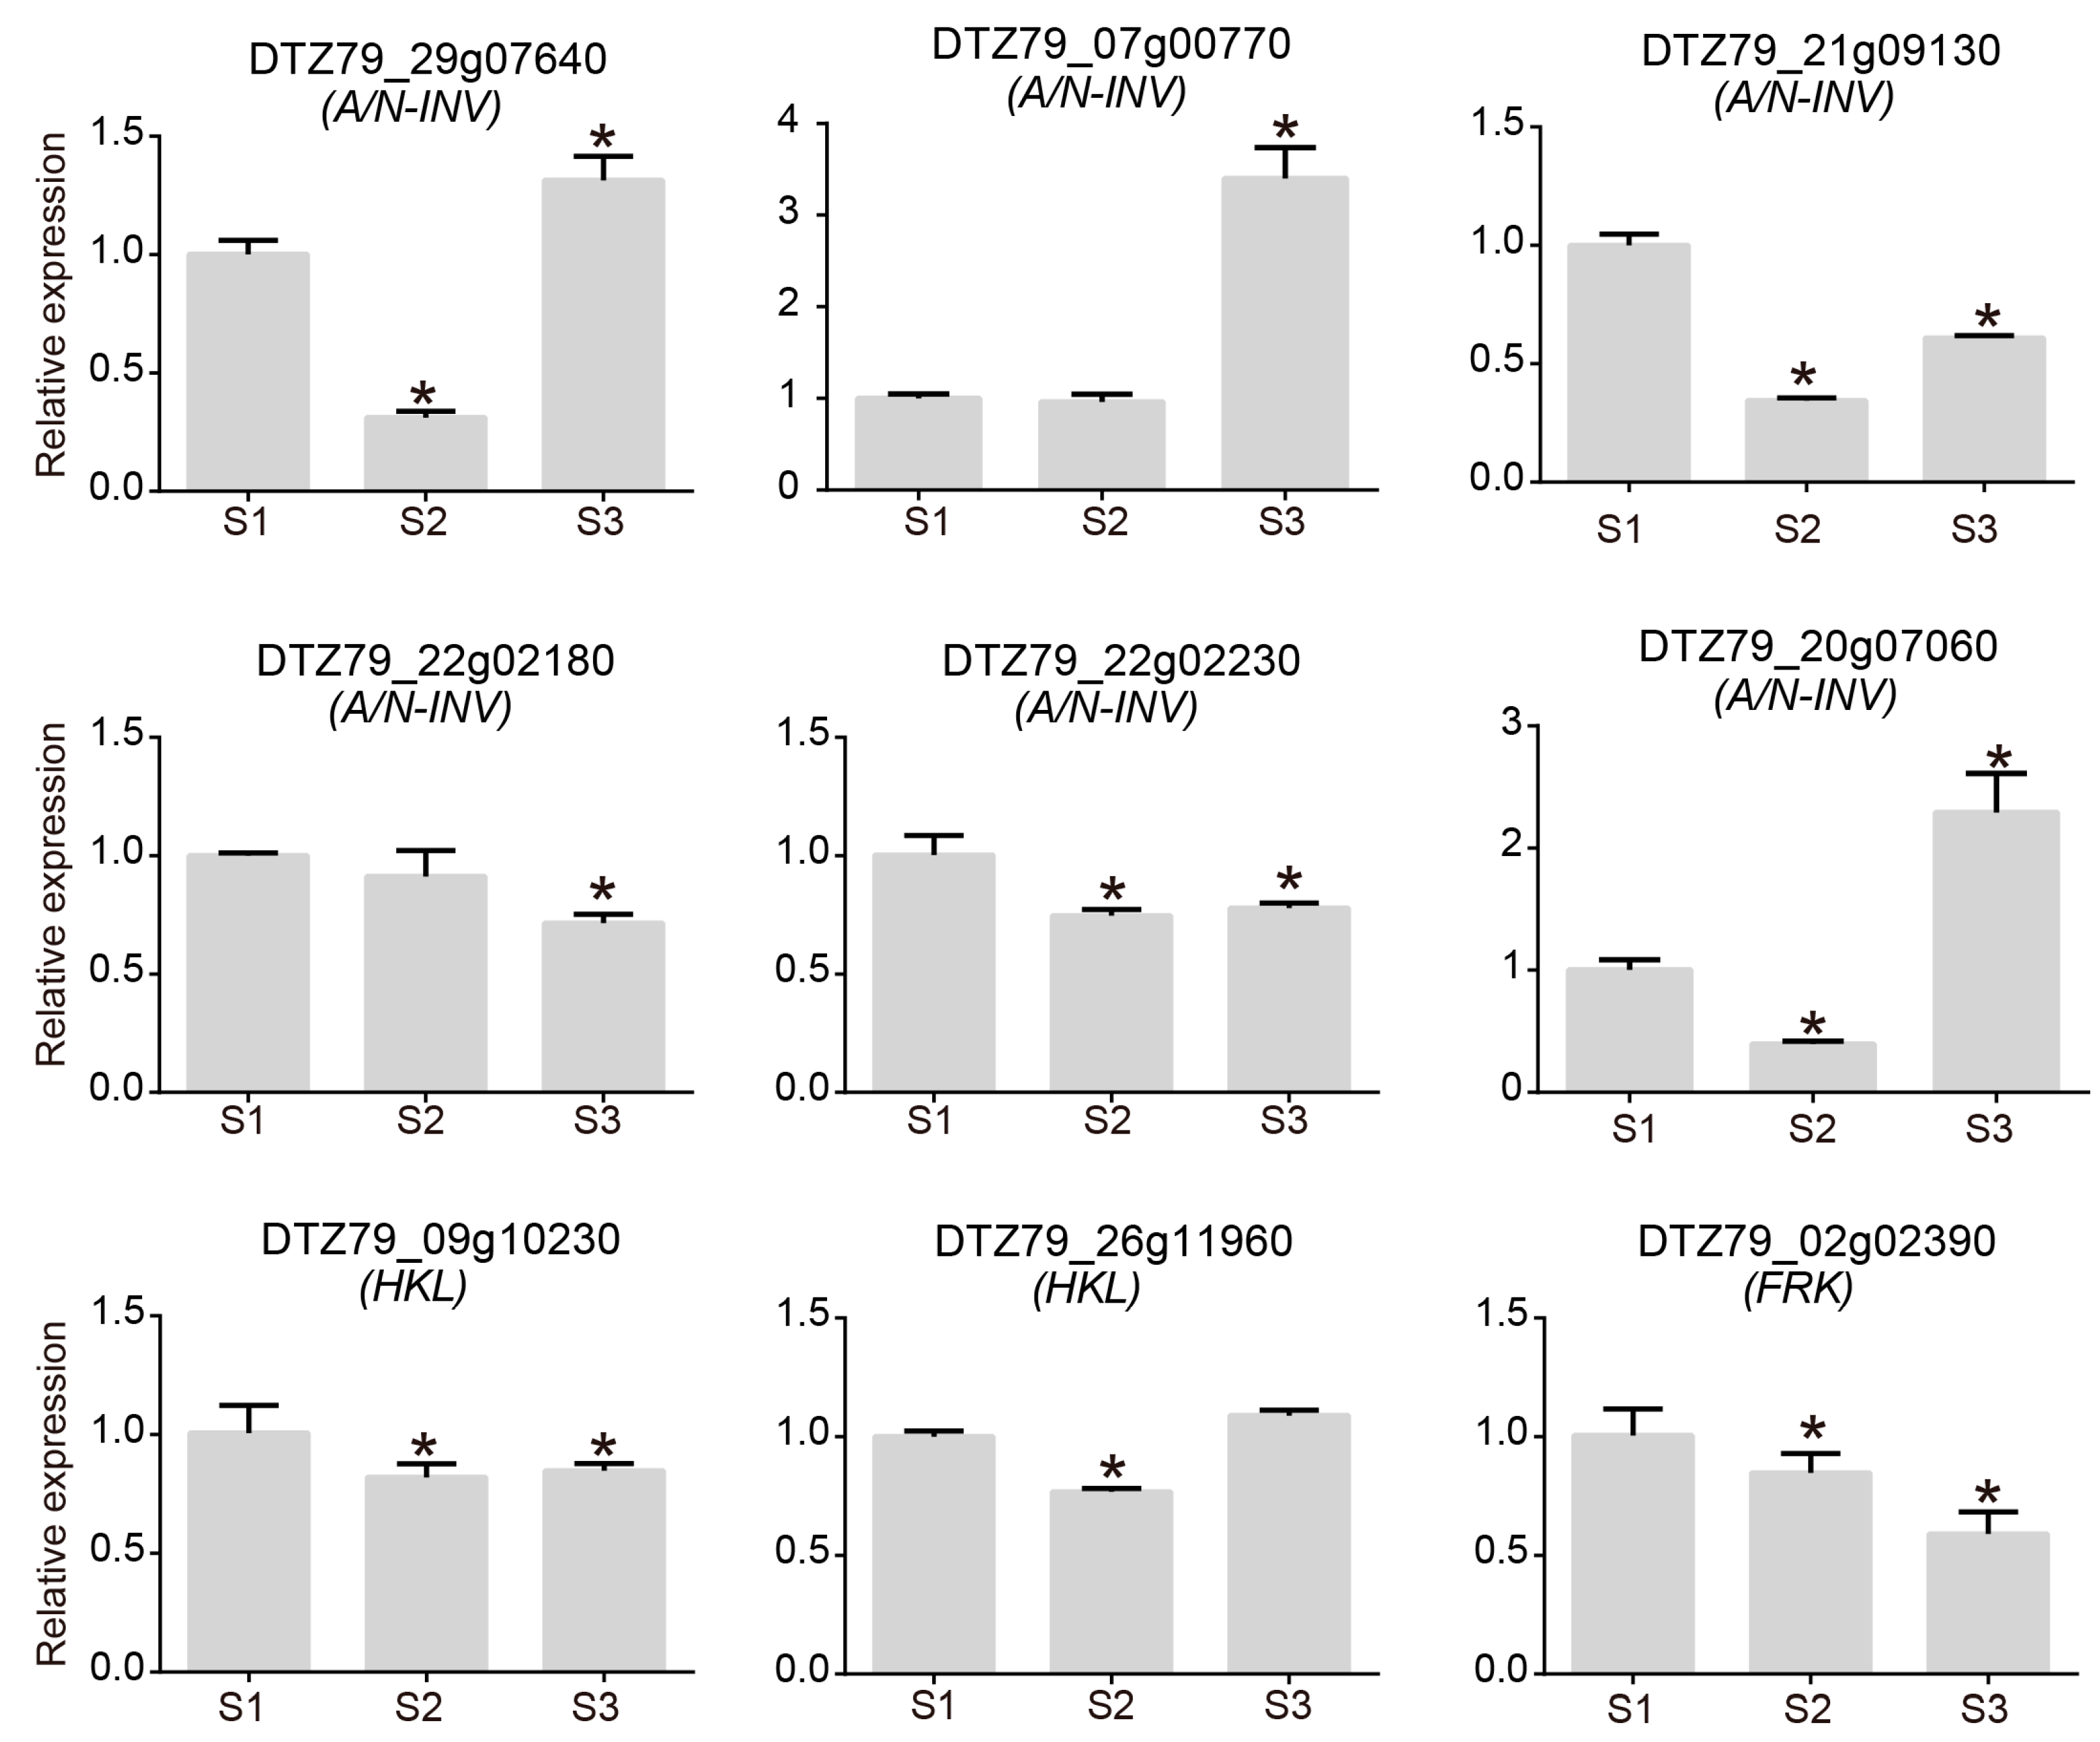
2.3. Analysis of the Sugar Metabolic Pathway in A. eriantha

Sugar compounds are one of the main factors of kiwifruit’s flavour and fruit quality. To explore the anabolism of sugars in A. eriantha, several major sugar synthesis pathways were constructed in this study. The results showed that many genes involved in the synthesis of sucrose, fructose, and glucose were highly expressed during fruit ripening (Figure 5A). Among the 11 members of invertase (A/N-INV) that regulate the conversion of sucrose into fructose and glucose, 8 were highly expressed during fruit ripening. The above results indicate that the accumulation of sugar during the ripening process of A. eriantha shows a positive correlation with fruit ripening. In addition, we further analysed the contents of total sugar, sucrose, fructose, and glucose in the flesh of A. eriantha during the three stages of fruit ripening (Figure 5B). During the ripening process of A. eriantha, the contents of total sugar, sucrose, fructose, and glucose significantly increased and reached their peak at fruit maturity. To further validate the relationship between genes and sugar accumulation, we conducted RT–qPCR analysis of the expression patterns of six A/N-INV genes, two hexokinase-like (HKL) genes, and one fucokinase-like (FRK) gene during fruit development. Among the six A/N-INV genes, three members showed an increase in expression levels as the fruit matured, while three members showed a decrease in expression levels as the fruit matured. This result suggests that different members are involved in the synthesis of A. eriantha sugars at different stages. Moreover, the expression levels of HKL and FRK also decreased with fruit maturation (Figure 6). This suggests a decrease in the phosphorylation of sugars during the later stages of A. eriantha fruit development. The above results suggest that increased expression of some sugar synthesis genes and decreased expression of sugar phosphorylation genes contribute to sugar accumulation in A. eriantha.

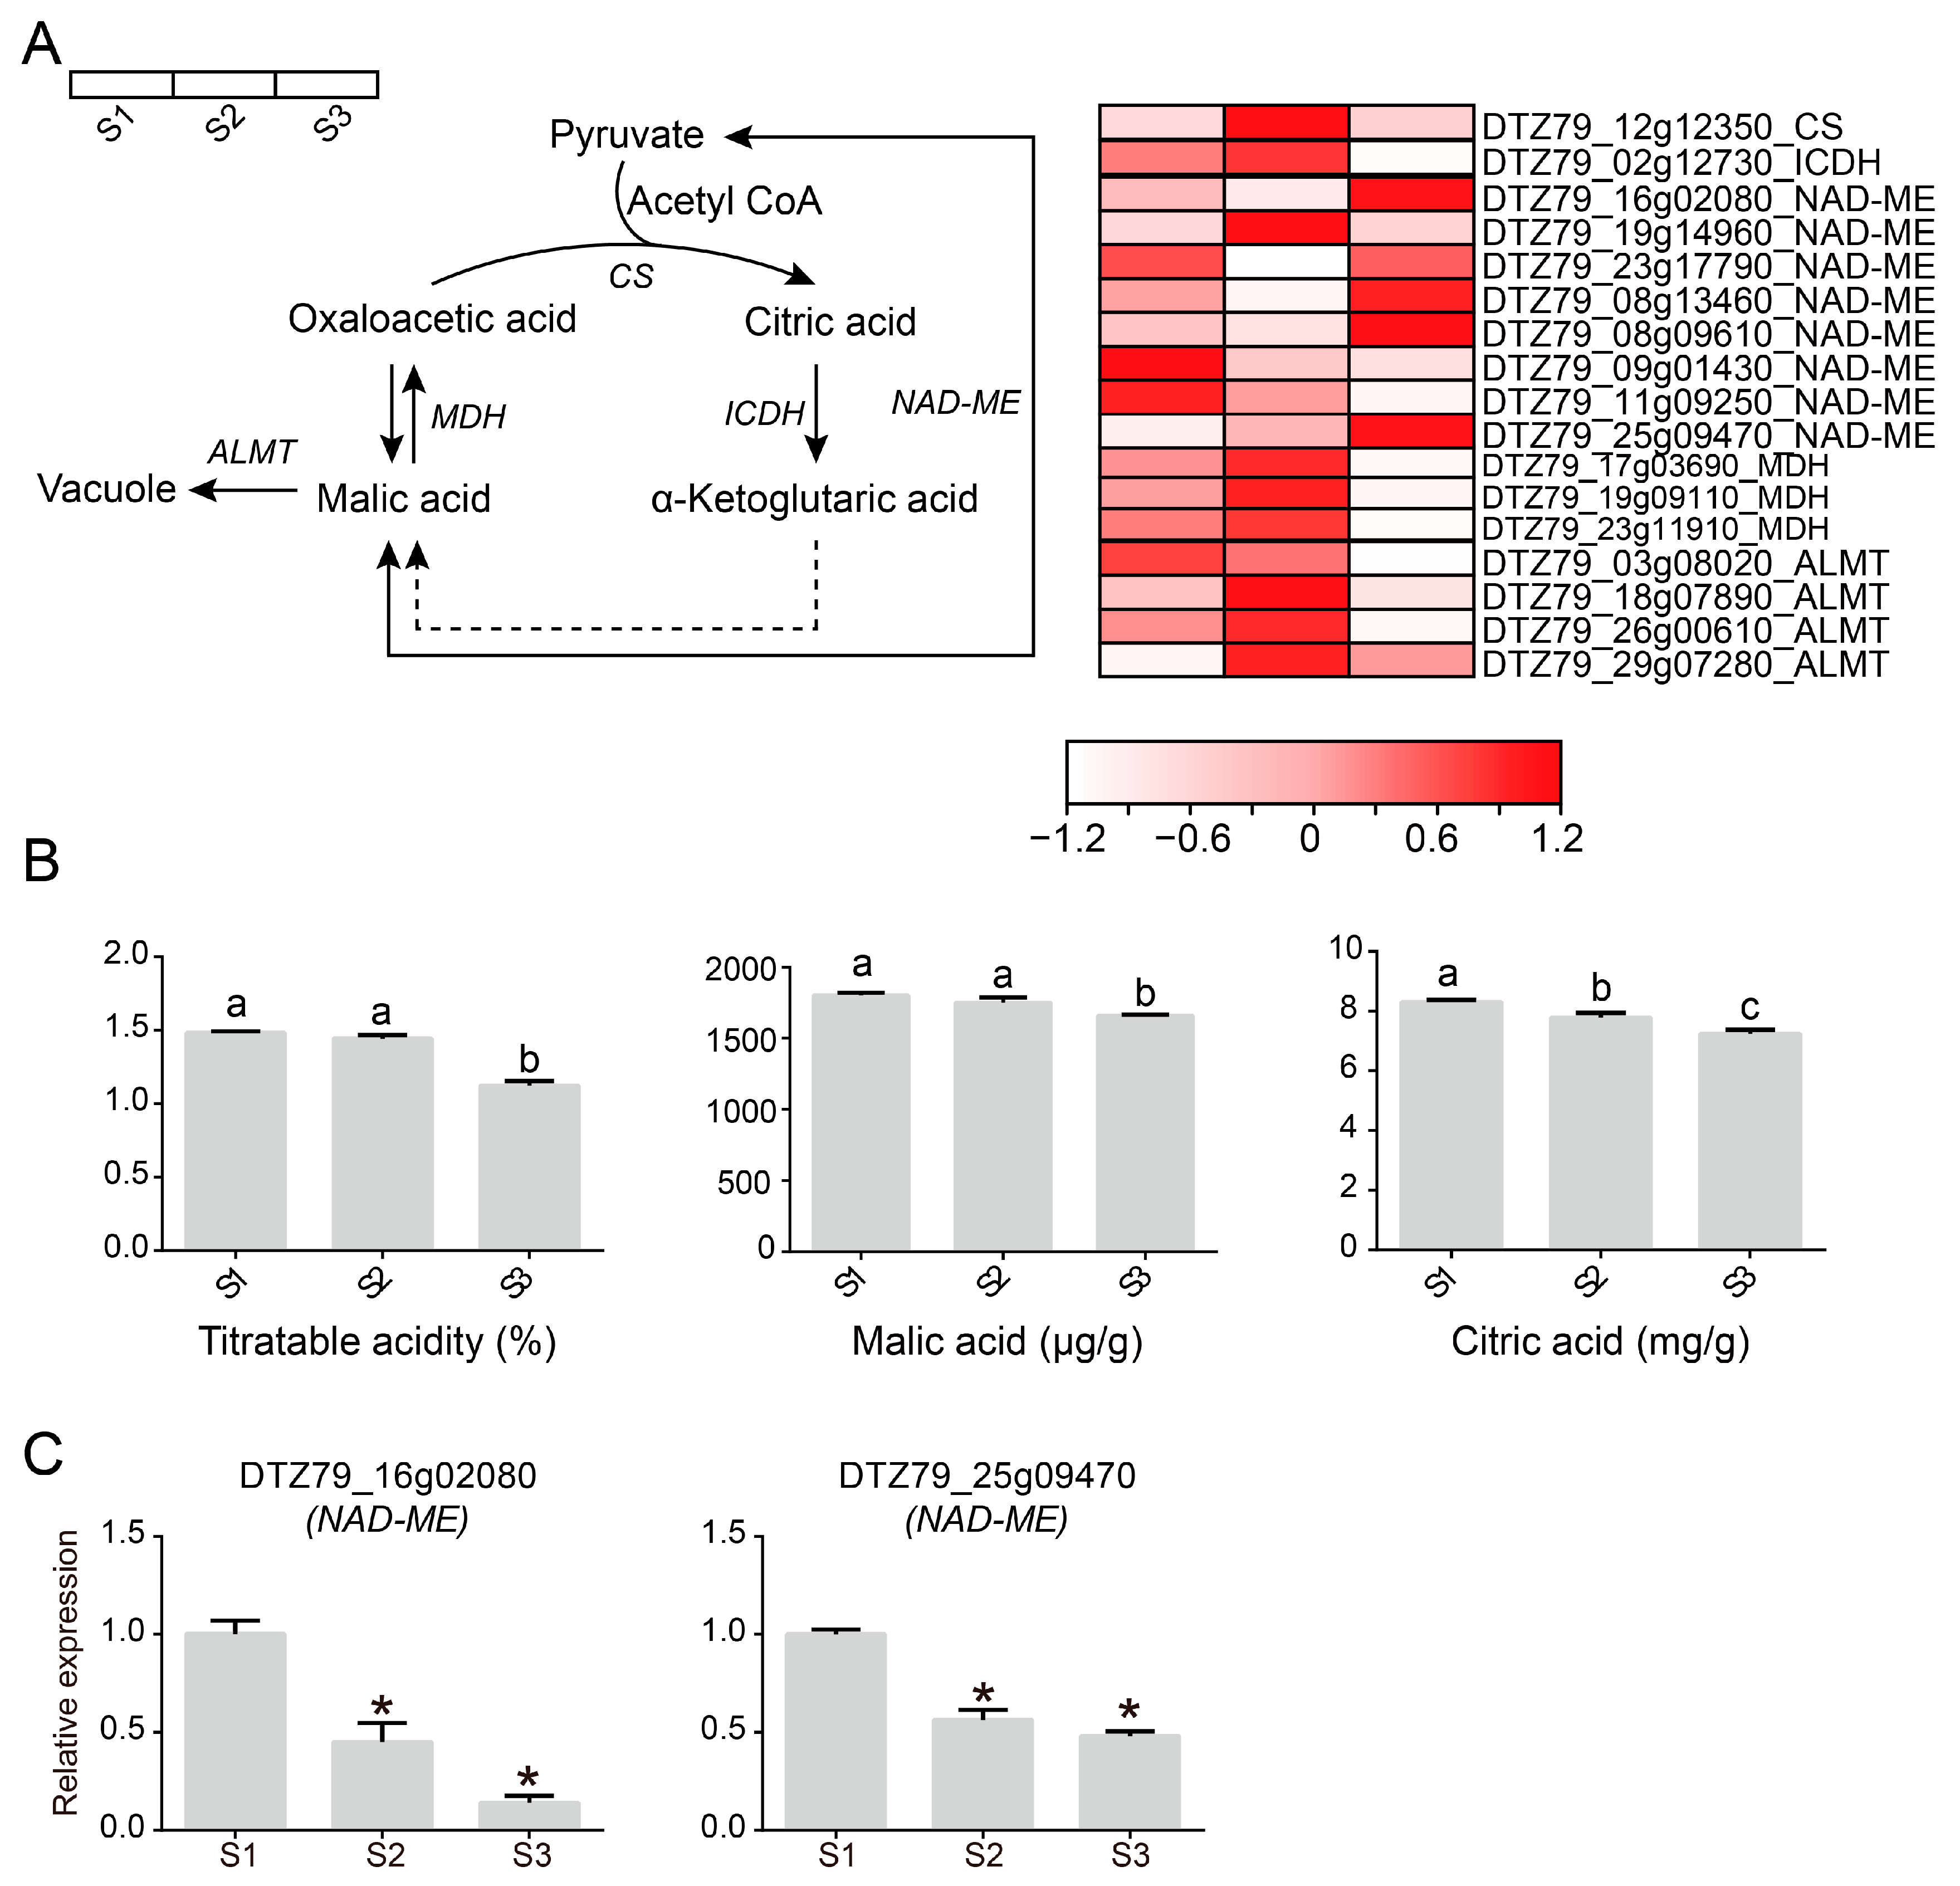
2.4. Analysis of the Organic Acid Metabolism Pathway in A. eriantha

Organic acids, as flavouring substances in fruits, play a crucial role in the formation of special flavours in fruits. To investigate the accumulation of organic acids in A. eriantha, we constructed a metabolic pathway of organic acids that showed a downward trend (Figure 7A). NAD-dependent malic enzyme (NAD-ME), as an important gene for the synthesis of malic acid, also has a high expression level during the ripening of A. eriantha. However, the accumulation of malic acid mainly depends on the transport of AL-activated malate transporter (ALMT) to the vacuoles for storage. However, the expression level of ALMT is relatively low during the maturation of A. eriantha. Therefore, the high expression of NAD-ME does not promote the accumulation of malic acid, and malic acid may be involved in other metabolic pathways. In addition, we further measured the contents of titratable acid, malic acid, and citric acid in the flesh of A. eriantha during the three stages of fruit ripening. The results showed that during the ripening process of A. eriantha, the content of organic acids significantly decreased (Figure 7B). The expression of NAD-ME differed from the accumulation pattern of organic acids. Therefore, according to transcriptome data, we selected two NAD-ME members with the largest expression differences during fruit ripening and carried out RT–qPCR analysis (Figure 7C). The results showed that the expression levels of these two NAD-ME genes significantly decreased during fruit ripening. The above results indicate that the content of organic acids decreases during the maturation process of A. eriantha and that the decrease in organic acid content is related to gene expression.

3. Discussion

Kiwifruit is a perennial fruiting woody vine originating from China. Although there are abundant wild resources of kiwifruit in China, there are significant differences in quality and shape between different varieties of kiwifruit. Therefore, it is very important to obtain a deeper understanding of the quality of kiwifruit and the formation of its unique flavour. A. eriantha, with a high Vc content, unique fruit flavour, and other characteristics, has become the most popular variety on the market together with A. chinensis, A. deliciosa, and Actinidia arguta [40].
Sugar and acid, as some of the most important qualities of fruits, have always been a research hotspot. During the development process of A. eriantha fruits, total sugar, sucrose, fructose, and glucose continue to accumulate. The accumulation pattern of sugar compounds in kiwifruit is similar to that in fruits such as dates, pears, and watermelons [41,42,43]. Furthermore, sucrose is the main carbohydrate compound in A. eriantha, with a proportion of approximately 80%, while the contents of fructose and glucose are similar to those in A. arguta [44]. The contents of sucrose, fructose, and glucose in A. chinensis ‘Hort 16A’ are similar [14]. The contents of titratable acid, malic acid, and citric acid in A. eriantha fruit decreased with ripening, and the content was the lowest at ripening. The content of citric acid is much higher than that of malic acid, which is also true for A. chinensis ‘Hort 16A’ and A. arguta [14,44]. In addition, the accumulation pattern of organic acids in kiwifruit is opposite to that in apples, peaches, plums, and loquats [41,45,46]. Therefore, even in different varieties of kiwifruit within the same species, there are significant differences in the accumulation patterns of sugar compounds and organic acids. The synthesis and metabolism of carbohydrate compounds and organic acids are key to fruit quality, and they are usually not regulated by a single gene. For example, previous studies on sugar and organic acids and related genes in fruits such as watermelon [11], peaches [42], and citrus [47] have shown that a single gene has a limited contribution to the overall accumulation of sugar and organic acids in the fruit. Therefore, we constructed a pathway for the synthesis of sugars and organic acids in A. eriantha and studied the expression profiles of genes involved in sugar and organic acid synthesis in A. eriantha during fruit development. Our results show that the genes involved in sugar and organic acid synthesis during A. eriantha fruit development have a basically similar expression trend with related sugars and organic acids. Furthermore, using transcriptome sequencing and RT–qPCR we found that the accumulation of organic acids in Trichotomis is directly related to organic acid synthesis genes. The three key gene families are the CS gene family, NAD-ME gene family and the ALMT gene family. ALMT and NAD-ME regulate the accumulation of malic acid in peaches, while SUS and A/N-INV participate in the accumulation of carbohydrates, which is similar to that in A. eriantha [48,49]. In the Chinese dwarf cherry (CeraSUS humilis, Bge.), key genes for the synthesis of organic acids and sugars are similar to those of A. eriantha [50]. In addition, similar studies in oriental melon [51], sweet cherry [52], and other fruit trees showed similar results to A. eriantha. Together, these results suggest that the accumulation patterns of sugars and organic acids may differ from those of other species, but the key genes are basically the same.
Vc is a necessary substance for the metabolism and growth of all Viridiplantae, and kiwifruit is one of the fruits with the highest Vc content on the market. This study shows that the content of Vc in A. eriantha fruit gradually decreases with fruit development. The accumulation pattern of Vc in A. eriantha is similar to that reported in previous studies on other kiwifruit species [53,54,55]. A. eriantha accumulates a large amount of Vc at the early stages of fruit development in the same way as apples [56] and peaches [57]. In addition, Vc is regulated by four linear and cyclic pathways. These pathways include dozens of enzymes that directly or indirectly participate in the metabolic reaction of Vc [26,27,28,58]. Furthermore, cloning and genetic transformation experiments were conducted on key genes in the Vc synthesis pathway, and no significant increase in Vc content was found [59,60,61,62,63], indicating that Vc is a multigene-, multinetwork-regulated substance. Subsequently, we constructed a pathway for the synthesis of Vc in A. eriantha and analysed the expression patterns of the key genes involved. The results showed that most of the genes involved in Vc synthesis were highly expressed at the early and middle stages of A. eriantha fruit development, and their expression levels decreased during fruit ripening. The specific expression of these genes is significantly correlated with fruit development, indicating that the development of A. eriantha fruit may be an important signal regulating gene expression. As a rate-limiting enzyme in the L-galactose pathway, GGP has a critical role in Vc synthesis in higher plants [64,65]. Numerous studies have shown that the expression level of GGP is closely related to the Vc content in plants and in kiwifruit [59,64,66,67,68]. The galacturonate pathway, as the second discovered Vc synthesis pathway in plant species, has also been shown to play a role in plant Vc synthesis [58,69]. Although it is not the main Vc synthesis pathway in plants, it is also a pathway for Vc in plants and is closely related to the synthesis of Vc [70,71]. In this study, the L-galactose pathway and the galacturonate pathway were constructed, and the key enzymes were found to be highly correlated with the Vc accumulation pattern in A. eriantha, reflecting the important role of the L-galactose pathway and the galacturonate pathway in the Vc synthesis of A. eriantha fruit. The pathway of vitamin synthesis and metabolism in higher plants is very complex. Understanding the accumulation and metabolism of Vc in A. eriantha can help us fully utilize the germplasm resources of kiwifruit. This study utilized high-throughput sequencing and molecular biology experiments to preliminarily explore the genes of A. eriantha and their function in Vc synthesis.
In conclusion, the transcriptome sequencing technique was used to identify gene expression during A. eriantha fruit development, providing important information for studying the dynamic changes in gene expression and helping identify key genes that regulate A. eriantha fruit development. In addition, the data can be used to identify specific functions of new genes and functional genomes, providing valuable information for the molecular breeding and germplasm resource development of kiwifruit and laying the foundation for genetic research on A. eriantha.

4. Materials and Methods

4.1. Plant Material

In this study, the wild A. eriantha materials were collected at the kiwifruit base of Xiamao Town, Shaxian District, the Sanming Research Institute of Agricultural Sciences. According to many years of cultivation observations, the whole A. eriantha fruit development process takes approximately 210 to 240 days. For this reason, the samples were collected at 180 days (S1), 210 days (S2), and 240 days (S3) after flowering; 10 to 20 fruits were picked each time, the flesh of the peeled fruits was taken as the experimental material, and the experiment was repeated 3 times. Samples were snap-frozen in liquid nitrogen and stored in a −80 °C refrigerator.

4.2. cDNA Library Construction and Transcriptome Sequencing

For more than 10 A. eriantha from the same period, the samples were ground, and the experiment was repeated with 3 biological replicates. The total RNA was subsequently extracted from the A. eriantha samples at different developmental stages using TRIzolTM RNA extraction reagent (Thermo Fisher, 15596026, Waltham, MA, USA) according to the instructions. The RNA concentration of the samples was measured using a NanoDrop 2000 (Thermo Fisher Scientific, Wilmington, DE, USA), and the RNAn integrity was further assessed using an RNA Nano 6000 from the Agilent 2100 bioanalyzer system (Agilent Technologies, Santa Clara, CA, USA). One microgram of RNA from each sample was used in the NEBNext UltraTM RNA Library Prep Kit (New England BioLabs, Ltd., Ipswich, MA, USA) to construct cDNA libraries of samples from different stages of kiwifruit development. Finally, transcriptome sequencing was performed using double-end sequencing on the Illumina platform.

4.3. Transcriptome Data Analysis

Raw data from transcriptome sequencing were subjected to data quality control using the Fastp.0.23.4 software [72]. The filtered data were aligned with the kiwifruit genome sequence (https://kiwifruitgenome.org/, accessed on 23 August 2023). Subsequently, the results of HISAT2 [73] were compressed and sorted using the SAMtools.1.18 software [74]. Then, the FPKM value for each gene was calculated using the FeatureCounts script 2.16.0 [75]. Finally, we constructed the expression level of the genes in each sample into an expression matrix using the Trinity.2.15.1 software [76].

4.4. Differential Gene Analysis and Enrichment Analysis

Differential genes between the different samples were obtained using the DESeq2 R package calculation. DESeq2 provides statistical routines for determining differential expression in digital gene expression data using a model based on the negative binomial distribution. The resulting p values were adjusted using the Benjamini–Hochberg approach for controlling the false discovery rate. Genes with an adjusted p value < 0.01 and |log2 fold change| > 1 found using DESeq2 were assigned as differentially expressed. In addition, using the GO and KEGG databases, functional enrichment and channel significance enrichment were performed for differential genes between the selected samples using the ClusterProfiler R package 4.10.0 [77].

4.5. Vc, Sugar and Organic Acid Determination

An ascorbic acid (ASA) content assay kit (Solarbio® BC1230, Beijing, China) was used to determine the Vc content. For each sample, a total of 0.1 g of the sample was ground well, 1 mL of extract was added, the sample was centrifuged, the supernatant was removed, and the microplate reader wavelength was adjusted to 534 nm for index determination. The glucose content was tested using a Glucose Content Assay Kit (Solarbio® BC2505, Beijing, China), a 0.1 g tissue sample was weighed, 1 mL of distilled water was added, and the sample was ground in a 95 °C water bath for 10 min. After cooling, the sample was subjected to centrifugation, the supernatant was removed, and the microplate reader wavelength was adjusted to 505 nm for index measurement. For sucrose content detection, the Plant Sucrose Content Assay Kit (Solarbio® BC2465, Beijing, China) was utilized. First, 0.1 g of the sample was weighed and ground at normal temperature, followed by the addition of 0.5 mL of extract with proper grinding. The sample was then quickly transferred into a centrifuge tube, placed in an 80 °C water bath for 10 min, and, after cooling, the supernatant was removed. Then, 2 mg of the reagent was added and decolouring was conducted at 80 °C for 30 min, followed by the addition of 0.5 mL of extract. The supernatant was removed, and the enzyme wavelength was adjusted to 480 nm for index determination. For testing the fructose content, the Plant Tissue Fructose Content Assay Kit (Solarbio® BC2455, Beijing, China) was used. Approximately 0.1 g of the sample was weighed, and 1 mL of extract was added, followed by proper grinding. The sample was then placed in an 80 °C water bath for 10 min, and then was centrifuged. The supernatant was removed, followed by the addition of 2 mg of reagent and decolouration at 80 °C for 30 min. Then, 1 mL of extract was added followed by centrifugation at the standard temperature, with the microplate wavelength adjusted to 480 nm for index determination. The total sugar content test was performed using the Total Carbohydrate Content Assay Kit (Solarbio® BC2715, Beijing, China). For citric acid content detection, the Citric Acid (CA) Content Assay Kit (Solarbio® BC2155, Beijing, China) was used, with 0.1 g of tissue weighed, to which 1 mL of reagent was added for ice bath homogenization, followed by centrifugation. The supernatant was placed on ice, and the microplate reader was adjusted to 545 nm for index determination. For malic acid content detection, the Malic Acid Content Assay kit (Solarbio® BC5495, Beijing, China) was used, weighing out a 0.1 g tissue sample, adding 1 mL of extract, and conducting ice bath grinding of the sample. The sample was then centrifuged to produce the supernatant, and the microplate reader was adjusted to 450 nm for index determination. The titratable acid content was tested according to the international standard GB12293-90《Fruit and vegetable products -Determination of titratable acidity》.

4.6. Quantitative Analysis

The total RNA was extracted at the 3 stages of kiwifruit development using the TRIzolTM RNA extraction kit (Thermo Fisher, 15596026, Waltham, MA, USA). The concentration of the RNA from each sample was determined using a NanoDrop 2000 (Thermo Scientific, MA, USA), and the integrity of the RNA was determined using gel electrophoresis. The total RNA was subsequently reverse-transcribed to quantify the desired cDNA using the PrimeScriptTM RT reagent kit reverse transcription kit (TaKaRa, Tokyo, Japan) according to the instructions. The RT–qPCR was performed using an ABI QuantStudio 3-sequence detection system (Applied Biosystems, Waltham, MA, USA) using the SYBR Premix Ex Taq Kit (TaKaRa, Tokyo, Japan) with the following reaction conditions: 95 °C for 3 min, 40 cycles of 95 °C for 15 s, 56 °C for 30 s, and 72 °C for 20 s. The reference gene TCTB was used for normalization, the expression data were calculated using the 2∆∆Ct formula, and the difference was calculated using the SPSS 20.0 software (LSD method, p < 0.05). The primers used for quantification are listed in Supplemental Table S1.

Supplementary Materials

The following supporting information can be downloaded at https://www.mdpi.com/article/10.3390/plants12244079/s1. Table S1: Primers used in this study; Table S2: Statistical table of the sequencing data; Table S3: Statistics of the matching rate of Actinidia eriantha Benth. transcriptome data; Table S4: GO analysis of 213 core upregulated differential genes; Table S5: GO analysis of 207 core downregulated differential genes.

Author Contributions

Conceptualization, X.F.; methodology, J.J.; software, W.L.; validation, Z.L. and P.Y.; formal analysis, P.W. and W.Y.; investigation, P.W., Y.C. and X.F.; resources, Y.C.; data curation, P.W.; writing—original draft preparation, P.W.; writing—review and editing, P.W.; project administration, Y.C. All authors have read and agreed to the published version of the manuscript.

Funding

This research was supported in part by the Fujian Agricultural Guidance (Key) Project (no. 2021N0046) and the “14th Five-Year Plan” Fujian Province Seed Industry Innovation and Industrialization Project (no. zycxny2021010).

Data Availability Statement

All sequencing data, including those of the genome and transcriptome, can be found in the China National Center for Bioinformation database (PRJCA014460).

Conflicts of Interest

The authors declare no conflict of interest.

References

  1. Liao, G.; He, Y.; Li, X.; Zhong, M.; Xu, X. Effects of bagging on fruit flavor quality and related gene expression of AsA synthesis in Actinidia eriantha. Sci. Hortic. 2019, 256, 108511. [Google Scholar] [CrossRef]
  2. Du, G.; Li, M.; Ma, F.; Liang, D. Antioxidant capacity and the relationship with polyphenol and Vitamin C in Actinidia fruits–ScienceDirect. Food Chem. 2009, 113, 557–562. [Google Scholar] [CrossRef]
  3. Huang, C.H.; Tao, J.J.; Liao, G.L.; Xie, M.; Xu, X.B. Dynamic changes of phenol and antioxidant capacity during fruit development of three Actinidia species (kiwifruit). Sci. Hortic.-Amsterdam 2020, 273, 109571. [Google Scholar] [CrossRef]
  4. Hale, T.; Hassell, R.; Phillips, T. Taste Panel Perception of Sweetness as it Correlates to Refractometer Measurements and HPLC Analysis of Sugar Content. Hortscience 2004, 39, 879. [Google Scholar] [CrossRef]
  5. Gang, W.; Tao, W.; Delin, P.; Zhanhui, J.; Jiyu, Z.; Zhongren, G. The Components and Contents of Organic Acid in Kiwifruit Fruits from Different Cultivars. J. Agric. 2017, 7, 81–84. [Google Scholar]
  6. Ackermann, J.; Fischer, M.; Amado, R. Changes in sugars, acids, and amino acids during ripening and storage of apples (cv. Glockenapfel). J. Agric. Food Chem. 1992, 40, 1131–1134. [Google Scholar] [CrossRef]
  7. Kroger, M.; Meister, K.; Kava, R. Low-calorie Sweeteners and Other Sugar Substitutes: A Review of the Safety Issues. Compr. Rev. Food Sci. Food Saf. 2010, 5, 35–47. [Google Scholar] [CrossRef]
  8. Pangborn, R. Relative Taste Intensities of Selected Sugars and Organic Acids. J. Food Sci. 2006, 28, 726–733. [Google Scholar] [CrossRef]
  9. Zhang, H.P.; Wu, J.Y.; Qin, G.H.; Yao, G.F.; Qi, K.J.; Wang, L.F.; Zhang, S.L. The role of sucrose-metabolizing enzymes in pear fruit that differ in sucrose accumulation. Acta Physiol. Plant. 2014, 36, 71–77. [Google Scholar] [CrossRef]
  10. Wu, J.; Gao, H.; Zhao, L.; Liao, X.; Chen, F.; Wang, Z.; Hu, X. Chemical compositional characterization of some apple cultivars. Food Chem. 2007, 103, 88–93. [Google Scholar] [CrossRef]
  11. Ren, Y.; Guo, S.; Zhang, J.; He, H.; Sun, H.; Tian, S.; Gong, G.; Zhang, H.; Levi, A.; Tadmor, Y.; et al. A Tonoplast Sugar Transporter Underlies a Sugar Accumulation QTL in Watermelon. Plant Physiol. 2018, 176, 836–850. [Google Scholar] [CrossRef] [PubMed]
  12. Lingle, S.E.; Dunlap, J.R. Sucrose Metabolism in Netted Muskmelon Fruit during Development. Plant Physiol. 1987, 84, 386–389. [Google Scholar] [CrossRef]
  13. Richardson, A.C.; Boldingh, H.L.; Mcatee, P.A.; Gunaseelan, K.; Luo, Z.; Atkinson, R.G.; David, K.M.; Burdon, J.N.; Schaffer, R.J. Fruit development of the diploid kiwifruit, Actinidia chinensis “Hort16A”. BMC Plant Biol. 2011, 11, 182. [Google Scholar] [CrossRef]
  14. Gook, J.; Kenji, K.; Kataoka, B. Physical and compositional characteristics of “Mitsuko” and local hardy kiwifruits in Japan. Hortic. Environ. Biotechnol. 2012, 53, 1–8. [Google Scholar] [CrossRef]
  15. Koch, K. Sucrose metabolism: Regulatory mechanisms and pivotal roles in sugar sensing and plant development. Curr. Opin. Plant Biol. 2004, 7, 235–246. [Google Scholar] [CrossRef]
  16. Rolland, F.; Baena-Gonzalez, E.; Sheen, J. Sugar Sensing and Signaling in Plants: Conserved and Novel Mechanisms. Annu. Rev. Plant Biol. 2006, 57, 675–709. [Google Scholar] [CrossRef] [PubMed]
  17. Montero, T.M.; Mollá, E.M.; Esteban, R.M.; López-Andréu, F.J. Quality attributes of strawberry during ripening. Sci. Hortic. 1996, 65, 239–250. [Google Scholar] [CrossRef]
  18. Giné Bordonaba, J.; Terry, L.A. Manipulating the taste-related composition of strawberry fruits (Fragaria × ananassa) from different cultivars using deficit irrigation. Food Chem. 2010, 122, 1020–1026. [Google Scholar] [CrossRef]
  19. Jiang, Q.; Wang, Z.; Hu, G.; Yao, X. Genome-wide identification and characterization of AP2/ERF gene superfamily during flower development in Actinidia eriantha. BMC Genomics 2022, 23, 1–16. [Google Scholar] [CrossRef]
  20. Wang, R.; Shu, P.; Zhang, C.; Zhang, J.; Chen, Y.; Zhang, Y.; Du, K.; Xie, Y.; Li, M.; Ma, T.; et al. Integrative analyses of metabolome and genome-wide transcriptome reveal the regulatory network governing flavor formation in kiwifruit (Actinidia chinensis). New Phytol. 2022, 233, 373–389. [Google Scholar] [CrossRef]
  21. Jiang, Z.; Huang, Q.; Jia, D.; Zhong, M.; Tao, J.; Liao, G.; Huang, C.; Xu, X. Characterization of Organic Acid Metabolism and Expression of Related Genes During Fruit Development of Actinidia eriantha “Ganmi 6”. Plants 2020, 9, 332. [Google Scholar] [CrossRef]
  22. Macrae, E.A.; Bowen, J.H.; Stec, M.G.H. Maturation of kiwifruit (Actinidia deliciosa cv Hayward) from two orchards: Differences in composition of the tissue zones. J. Sci. Food Agric. 2010, 47, 401–416. [Google Scholar] [CrossRef]
  23. Marsh, K.; Attanayake, S.; Walker, S.; Gunson, A.; Macrae, E.A. Acidity and taste in kiwifruit. Postharvest Biol. Technol. 2004, 32, 159–168. [Google Scholar] [CrossRef]
  24. Etienne, A.M.G.; Lobit, P.D.M.; Bugaud, C. What controls fleshy fruit acidity? A review of malate and citrate accumulation in fruit cells. J. Exp. Bot. 2013, 34, 1451–1469. [Google Scholar] [CrossRef] [PubMed]
  25. Agius, F.; Amaya, I.; Botella, M.A.; Valpuesta, V. Functional analysis of homologous and heterologous promoters in strawberry fruits using transient expression. J. Exp. Bot. 2005, 56, 37–46. [Google Scholar] [CrossRef] [PubMed]
  26. Wolucka, B.A.; Van Montagu, M. GDP-Mannose 3′, 5′-Epimerase Forms GDP-L-gulose, a Putative Intermediate for the de Novo Biosynthesis of Vitamin C in Plants. J. Biol. Chem. 2003, 278, 47483–47490. [Google Scholar] [CrossRef] [PubMed]
  27. Davey, M.W.; Montagu, M.; Inze, D.; Sanmartin, M.; Kanellis, A.; Smirnoff, N.; Benzie, I.; Strain, J.J.; Favell, D.; Fletcher, J. Review plant L-ascorbic acid: Chemistry, function, metabolism, bioavailability and effects of processing. J. Sc. Food Agr. 2000, 80, 825–860. [Google Scholar] [CrossRef]
  28. Wheeler, G.L.; Jones, M.A.; Smirnoff, N. The biosynthetic pathway of vitamin C in higher plants. Nature 1998, 393, 365–369. [Google Scholar] [CrossRef]
  29. Nishiyama, I.; Yamashita, Y.; Yamanaka, M.; Shimohashi, A.; Fukuda, T.; Oota, T. Varietal Difference in Vitamin C Content in the Fruit of Kiwifruit and Other Actinidia Species. J. Agric. Food Chem. 2004, 52, 5472–5475. [Google Scholar] [CrossRef]
  30. Cai-Hong, Z.; Peng, Z.; Zheng-Wang, J.; Sheng-Mei, W.; Fei, H.; Li-Yun, X.U.; Hong-Wen, H. Dynamic Changes of Carbohydrate and Vitamin C in Fruits of Actinidia chinensis and A. eriantha during Growth Season. Plant Sci. J. 2011, 4, 319–330. [Google Scholar] [CrossRef]
  31. Gao, X.; Wang, L.; Zhang, H.; Zhu, B.; Lv, G.; Xiao, J. Transcriptome analysis and identification of genes associated with floral transition and fruit development in rabbiteye blueberry (Vaccinium ashei). PLoS ONE 2021, 16, e259119. [Google Scholar] [CrossRef]
  32. Qi, Y.; Wei, H.; Gu, W.; Shi, W.; Jiang, L.; Deng, L.; Liu, X. Transcriptome profiling provides insights into the fruit color development of wild Lycium ruthenicum Murr. from Qinghai-Tibet Plateau. Protoplasma 2021, 258, 33–43. [Google Scholar] [CrossRef] [PubMed]
  33. Xie, M.; Huang, Y.; Zhang, Y.; Wang, X.; Yang, H.; Yu, O.; Dai, W.; Fang, C. Transcriptome profiling of fruit development and maturation in Chinese white pear (Pyrus bretschneideri Rehd). BMC Genom. 2013, 14, 823. [Google Scholar] [CrossRef] [PubMed]
  34. Ester Garcia-Gomez, B.S.J.L. Identification of QTLs linked to fruit quality traits in apricot (Prunus armeniaca L.) and biological validation through gene expression analysis using qPCR. Mol. Breed. 2019, 39, S96–S101. [Google Scholar] [CrossRef]
  35. García-Gómez, B.E.; Ruiz, D.; Salazar, J.A.; Rubio, M.; Martínez-Gómez, P. Analysis of Metabolites and Gene Expression Changes Relative to Apricot (Prunus armeniaca L.) Fruit Quality During Development and Ripening. Front. Plant Sci. 2020, 11, 1269. [Google Scholar] [CrossRef] [PubMed]
  36. Su, L.; Zhang, T.; Wu, M.; Zhong, Y.; Cheng, Z.M. Transcriptome and Metabolome Reveal Sugar and Organic Acid Accumulation in Rosa roxburghii Fruit. Plants 2023, 12, 3036. [Google Scholar] [CrossRef] [PubMed]
  37. Jia, H.; Tao, J.; Zhong, W.; Jiao, X.; Chen, S.; Wu, M.; Gao, Z.; Huang, C. Nutritional Component Analyses in Different Varieties of Actinidia eriantha Kiwifruit by Transcriptomic and Metabolomic Approaches. Int. J. Mol. Sci. 2022, 6, 217. [Google Scholar] [CrossRef]
  38. Liao, G.; Liu, Q.; Xu, X.; He, Y.; Li, Y.; Wang, H.; Ye, B.; Huang, C.; Zhong, M.; Jia, D. Metabolome and Transcriptome Reveal Novel Formation Mechanism of Early Mature Trait in Kiwifruit. Front. Plant Sci. 2021, 12, 760496. [Google Scholar] [CrossRef]
  39. Xiong, Y.; Yan, P.; Du, K.; Li, M.; Xie, Y.; Gao, P. Nutritional component analyses of kiwifruit in different development stages by metabolomic and transcriptomic approaches. J. Sci. Food Agr. 2020, 100, 2399–2409. [Google Scholar] [CrossRef]
  40. Jeong, H.R.; Cho, H.S.; Cho, Y.S.; Kim, D.O. Changes in phenolics, soluble solids, vitamin C, and antioxidant capacity of various cultivars of hardy kiwifruits during cold storage. Food Sci. Biotechnol. 2020, 29, 1763–1770. [Google Scholar] [CrossRef]
  41. Umer, M.J.; Bin Safdar, L.; Gebremeskel, H.; Zhao, S.; Yuan, P.; Zhu, H.; Kaseb, M.O.; Anees, M.; Lu, X.; He, N.; et al. Identification of key gene networks controlling organic acid and sugar metabolism during watermelon fruit development by integrating metabolic phenotypes and gene expression profiles. Hortic. Res. 2020, 7, 193. [Google Scholar] [CrossRef] [PubMed]
  42. Peng, Q.; Wang, L.; Ogutu, C.; Liu, J.; Liu, L.; Mollah, M.; Han, Y. Functional Analysis Reveals the Regulatory Role of PpTST1 Encoding Tonoplast Sugar Transporter in Sugar Accumulation of Peach Fruit. Int. J. Mol. Sci. 2020, 21, 1112. [Google Scholar] [CrossRef] [PubMed]
  43. Zhang, Y.; Fernie, A.R. On the role of the tricarboxylic acid cycle in plant productivity. J. Integr. Plant Biol. 2018, 60, 1199–1216. [Google Scholar] [CrossRef] [PubMed]
  44. Huiqin, Z.; Ming, X.; Jinping, X.; Liqiu, Z.; Genhua, S. Characterization of fruit development of the diploid kiwifruit, Actinidia eriantha “White”. J. Fruit. Sci. 2015, 32, 238–246. [Google Scholar] [CrossRef]
  45. Famiani, F.; Battistelli, A.; Moscatello, S.; Cruzcastillo, J.G.; Walker, R.P. The organic acids that are accumulated in the flesh of fruits: Occurrence, metabolism and factors affecting their contents—A review. Rev. Chapingo Ser. Hortic. 2015, 21, 97–128. [Google Scholar] [CrossRef]
  46. Yao, Y.X.; Ming, L.; Liu, Z.; You, C.X.; Wang, D.M.; Zhai, H.; Hao, Y.J. Molecular cloning of three malic acid related genes MdPEPC, MdVHA-A, MdcyME and their expression analysis in apple fruits. Sci. Hortic. 2009, 122, 404–408. [Google Scholar] [CrossRef]
  47. Li, S.; Yin, X.; Xie, X.; Allan, A.C.; Ge, H.; Shen, S.; Chen, K. The Citrus transcription factor, CitERF13, regulates citric acid accumulation via a protein-protein interaction with the vacuolar proton pump, CitVHA-c4. Sci. Rep. 2016, 6, 20151. [Google Scholar] [CrossRef]
  48. Zheng, B.; Zhao, L.; Jiang, X.; Cherono, S.; Liu, J.; Ogutu, C.; Ntini, C.; Zhang, X.; Han, Y. Assessment of organic acid accumulation and its related genes in peach. Food Chem. 2021, 334, 127567. [Google Scholar] [CrossRef]
  49. Vimolmangkang, S.; Zheng, H.; Peng, Q.; Jiang, Q.; Wang, H.; Fang, T.; Liao, L.; Wang, L.; He, H.; Han, Y. Assessment of Sugar Components and Genes Involved in the Regulation of Sucrose Accumulation in Peach Fruit. J. Agr. Food Chem. 2016, 64, 6723–6729. [Google Scholar] [CrossRef]
  50. Guo, C.; Wang, P.; Zhang, J.; Guo, X.; Mu, X.; Du, J. Organic acid metabolism in Chinese dwarf cherry [Cerasus humilis (Bge. ) Sok.] is controlled by a complex gene regulatory network. Front. Plant Sci. 2022, 13, 982112. [Google Scholar] [CrossRef]
  51. Cheng, H.; Kong, W.; Tang, T.; Ren, K.; Zhang, K.; Wei, H.; Lin, T. Identification of Key Gene Networks Controlling Soluble Sugar and Organic Acid Metabolism During Oriental Melon Fruit Development by Integrated Analysis of Metabolic and Transcriptomic Analyses. Front. Plant Sci. 2022, 13, 830517. [Google Scholar] [CrossRef] [PubMed]
  52. Yang, H.; Tian, C.; Ji, S.; Ni, F.; Fan, X.; Yang, Y.; Sun, C.; Gong, H.; Zhang, A. Integrative analyses of metabolome and transcriptome reveals metabolomic variations and candidate genes involved in sweet cherry (Prunus avium L. ) fruit quality during development and ripening. PLoS ONE 2021, 16, e260004. [Google Scholar] [CrossRef]
  53. Bulley, S.M.; Rassam, M.; Hoser, D.; Otto, W.; Schünemann, N.; Wright, M.; Macrae, E.; Gleave, A.; Laing, W. Gene expression studies in kiwifruit and gene over-expression in Arabidopsis indicates that GDP-L-galactose guanyltransferase is a major control point of vitamin C biosynthesis. J. Exp. Bot. 2009, 60, 765–778. [Google Scholar] [CrossRef] [PubMed]
  54. Shu, P.; Zhang, Z.; Wu, Y.; Chen, Y.; Li, K.; Deng, H.; Zhang, J.; Zhang, X.; Wang, J.; Liu, Z.; et al. A comprehensive metabolic map reveals major quality regulations in red-flesh kiwifruit (Actinidia chinensis). New Phytol. 2023, 238, 2064–2079. [Google Scholar] [CrossRef] [PubMed]
  55. Li, M.; Ma, F.; Liang, D.; Li, J.; Wang, Y. Ascorbate Biosynthesis during Early Fruit Development Is the Main Reason for Its Accumulation in Kiwi. PLoS ONE 2010, 5, e14281. [Google Scholar] [CrossRef] [PubMed]
  56. Li, M.; Chen, X.; Wang, P.; Ma, F. Ascorbic Acid Accumulation and Expression of Genes Involved in Its Biosynthesis and Recycling in Developing Apple Fruit. J. Am. Soc. Hortic. Sci. 2011, 136, 231–238. [Google Scholar] [CrossRef]
  57. Imai, T.; Ban, Y.; Terakami, S.; Yamamoto, T.; Moriguchi, T. L-Ascorbate biosynthesis in peach: Cloning of six L-galactose pathway-related genes and their expression during peach fruit development. Physiol. Plant. 2010, 136, 139–149. [Google Scholar] [CrossRef]
  58. Agius, F.; González-Lamothe, R.; Caballero, J.L.; Muñoz-Blanco, J.; Botella, M.A.; Valpuesta, V. Engineering increased vitamin C levels in plants by overexpression of a D-galacturonic acid reductase. Nat. Biotechnol. 2003, 21, 177–181. [Google Scholar] [CrossRef]
  59. Bulley, S.; Wright, M.; Rommens, C.; Yan, H.; Rassam, M.; Lin-Wang, K.; Andre, C.; Brewster, D.; Karunairetnam, S.; Allan, A.C.; et al. Enhancing ascorbate in fruits and tubers through over-expression of the l-galactose pathway gene GDP-l-galactose phosphorylase. Plant Biotechnol. J. 2012, 10, 390–397. [Google Scholar] [CrossRef]
  60. Qian, W.; Yu, C.; Qin, H.; Liu, X.; Zhang, A.; Johansen, I.E.; Wang, D. Molecular and functional analysis of phosphomannomutase (PMM) from higher plants and genetic evidence for the involvement of PMM in ascorbic acid biosynthesis in Arabidopsis and Nicotiana benthamiana. Plant J. 2007, 49, 399–413. [Google Scholar] [CrossRef]
  61. Giovannoni, S.; Foster, R.; Rappe, M.; Epstein, S. New Cultivation Strategies Bring More Microbial Plankton Species into the Laboratory. Oceanography 2007, 20, 62–69. [Google Scholar] [CrossRef]
  62. Gatzek, S.; Wheeler, G.L.; Smirnoff, N. Antisense suppression of l-galactose dehydrogenase in Arabidopsis thaliana provides evidence for its role in ascorbate synthesis and reveals light modulated l-galactose synthesis. Plant J. 2002, 30, 541–553. [Google Scholar] [CrossRef] [PubMed]
  63. Keller, R.; Renz, F.S.A.; Kossmann, J. Antisense inhibition of the GDP-mannose pyrophosphorylase reduces the ascorbate content in transgenic plants leading to developmental changes during senescence. Plant J. 1999, 19, 131–141. [Google Scholar] [CrossRef]
  64. Linster, C.L.; Gomez, T.A.; Christensen, K.C.; Adler, L.N.; Young, B.D.; Brenner, C.; Clarke, S.G. Arabidopsis VTC2 Encodes a GDP-l-Galactose Phosphorylase, the Last Unknown Enzyme in the Smirnoff-Wheeler Pathway to Ascorbic Acid in Plants. J. Biol. Chem. 2007, 282, 18879–18885. [Google Scholar] [CrossRef] [PubMed]
  65. Laing, W.A.; Wright, M.A.; Cooney, J.; Bulley, S.M. The missing step of the l-galactose pathway of ascorbate biosynthesis in plants, an l-galactose guanyltransferase, increases leaf ascorbate content. Proc. Natl. Acad. Sci. USA 2007, 104, 9534–9539. [Google Scholar] [CrossRef] [PubMed]
  66. Sun, Y.; Yang, M.; An, H. Expression of GDP-L-galactose pyrophosphatase and its relationship with ascorbate accumulation in Rosa roxburghii. Acta Hortic. Sin. 2014, 41, 1175–1182. [Google Scholar]
  67. Mellidou, I.; Chagné, D.; Laing, W.A.; Keulemans, J.; Davey, M.W. Allelic Variation in Paralogs of GDP-l-Galactose Phosphorylase Is a Major Determinant of Vitamin C Concentrations in Apple Fruit. Plant Physiol. 2012, 160, 1613–1629. [Google Scholar] [CrossRef]
  68. Liu, X.; Wu, R.; Bulley, S.; Zhong, C.; Li, D. Kiwifruit MYBS1-like and GBF3 transcription factors influence L-ascorbic acid biosynthesis by activating transcription of GDP-L-galactose phosphorylase 3. New Phytol. 2022, 234, 1782–1800. [Google Scholar] [CrossRef]
  69. Cruz-Rus, E.; Botella, M.A.; Valpuesta, V.; Gomez-Jimenez, M.C. Analysis of genes involved in l-ascorbic acid biosynthesis during growth and ripening of grape berries. J. Plant Physiol. 2010, 167, 739–748. [Google Scholar] [CrossRef]
  70. Li, M.J.; Liu, J.; Liang, D.; Guo, C.; Ma, F. The relationship between GalUR expression and ascorbate accumulation in Kiwifruit. Acta Hortic. Sin. 2011, 38, 1641–1649. [Google Scholar]
  71. Li, M.J.; Ma, F.W.; Zhang, M.; Pu, F. Distribution and metabolism of ascorbic acid in apple fruits (Malus domestica Borkh cv. Gala). Plant Sci. 2008, 174, 606–612. [Google Scholar] [CrossRef]
  72. Chen, S. Ultrafast one-pass FASTQ data preprocessing, quality controland deduplication using fastp. iMeta 2023, 2, e107. [Google Scholar] [CrossRef]
  73. Kim, D.; Ben, L.; Salzberg, S.L. HISAT: A fast spliced aligner with low memory requirements. Nat. Methods 2015, 12, 357–360. [Google Scholar] [CrossRef]
  74. Li, H.; Handsaker, B.; Wysoker, A.; Fennell, T.; Ruan, J.; Homer, N.; Marth, G.; Abecasis, G.; Durbin, R. The Sequence Alignment/Map format and SAMtools. Bioinformatics 2009, 25, 2078–2079. [Google Scholar] [CrossRef]
  75. Yang, L.; Smyth, G.K.; Wei, S. featureCounts: An efficient general purpose program for assigning sequence reads to genomic features. Bioinformatics 2014, 30, 923–930. [Google Scholar] [CrossRef]
  76. Grabherr, M.G.; Haas, B.J.; Yassour, M.; Levin, J.Z.; Amit, I. Trinity: Reconstructing a full-length transcriptome without a genome from RNA-Seq data. Nat. Biotechnol. 2013, 29, 644–652. [Google Scholar] [CrossRef]
  77. Yu, G.; Wang, L.; Han, L.; He, Q. clusterProfiler: An R package for Statistical Analysis and Visualization of Functional Profiles for Genes and Gene Clusters. OMICS J. Integr. Biol. 2012, 16, 284–287. [Google Scholar] [CrossRef]
Figure 1. (A) The three developmental stages of A. eriantha fruit, S1: fruit at 180 days after flowering, S2: fruit at 210 days after flowering, S3: fruit at 240 days after flowering. (B) Principal component analysis of three fruit samples based on gene expression profiles.
Plants 12 04079 g001
Figure 2. DEGs during A. eriantha maturation. (AC) Volcano plot of DEGs between the three stages of A. eriantha ripening. (D) Number of DEGs. (E,F) Statistics of the core upregulated and downregulated DEGs.
Plants 12 04079 g002
Figure 3. Schematic diagram of the A. eriantha Vc metabolic pathway. (A) Metabolite and gene expression profiles of Vc synthesis in A. eriantha. AO: L-ascorbate oxidase; APX: L-ascorbate peroxidase; DHAR: dehydroascorbate reductase; GDH: L-galactose dehydrogenase; GGP: GDP-L-galactose phosphorylase; GLDH: L-galactono-1,4-lactone dehydrogenase; GME: GDP-D-mannose-3,5-epimerase; GMP: GDP-D-mannose pyrophosphorylase; GPP: L-galactose-1-phosphate phosphatase; MDHAR: monodehydroascorbate reductase; PGI: glucose-6-phosphate isomerase; PMI: mannose-6-phosphate isomerase; PMM: phosphomannomutase, Alase: aldonolactonase; GalUR: D-galacturonate reductase. Blue arrows indicate the L-galactose pathway, green arrows indicate the galacturonate pathway, and yellow arrows indicate the recycling pathway. (B) Determination of Vc content during A. eriantha development. Differential analysis was performed using the LSD method with p < 0.05.
Plants 12 04079 g003
Figure 4. Analysis of expression patterns of related genes in different Vc synthesis pathways in A. eriantha. (A) L-galactose pathway, (B) galacturonate pathway, (C) recycling pathway. Asterisks indicate significant difference.
Plants 12 04079 g004
Figure 5. Schematic diagram of the A. eriantha glucose metabolism pathway. (A) Pathway of sucrose, fructose, and glucose metabolism in A. eriantha. SUS: sucrose synthase, A/N-INVc: invertase, HXK: hexokinase, FRK: fructokinase, AGPase: ADP-glucose pyrophosphorylase, HKL: hexokinase-like, FKL: fructokinase-like. (B) Determination of total sugar, sucrose, fructose, and glucose contents in A. eriantha. Letters indicate significant difference.
Plants 12 04079 g005
Figure 6. Quantitative analysis of genes related to glucose metabolism in A. eriantha. Asterisks indicate significant difference.
Plants 12 04079 g006
Figure 7. Schematic diagram of organic acid metabolism pathways in A. eriantha. (A) Metabolic pathways of malic acid and citric acid in A. eriantha. CS: citrate synthase, ICDH: isocitrate dehydrogenase, ALMT: AL-activated malate transporter, MDH: malate dehydrogenase, NAD-ME: malic enzyme. (B) Determination of titratable acid, malic acid, and citric acid in A. eriantha. Letters indicate significant difference. (C) Analysis of the expression patterns of two NAD-ME genes during the maturation process of A. eriantha. Asterisks indicate significant difference.
Plants 12 04079 g007
Disclaimer/Publisher’s Note: The statements, opinions and data contained in all publications are solely those of the individual author(s) and contributor(s) and not of MDPI and/or the editor(s). MDPI and/or the editor(s) disclaim responsibility for any injury to people or property resulting from any ideas, methods, instructions or products referred to in the content.

