
Structural and Physiological Traits of Compound Leaves of Ceratonia siliqua Trees Grown in Urban and Suburban Ambient Conditions

 ,
,
Abstract
:1. Introduction
2. Results
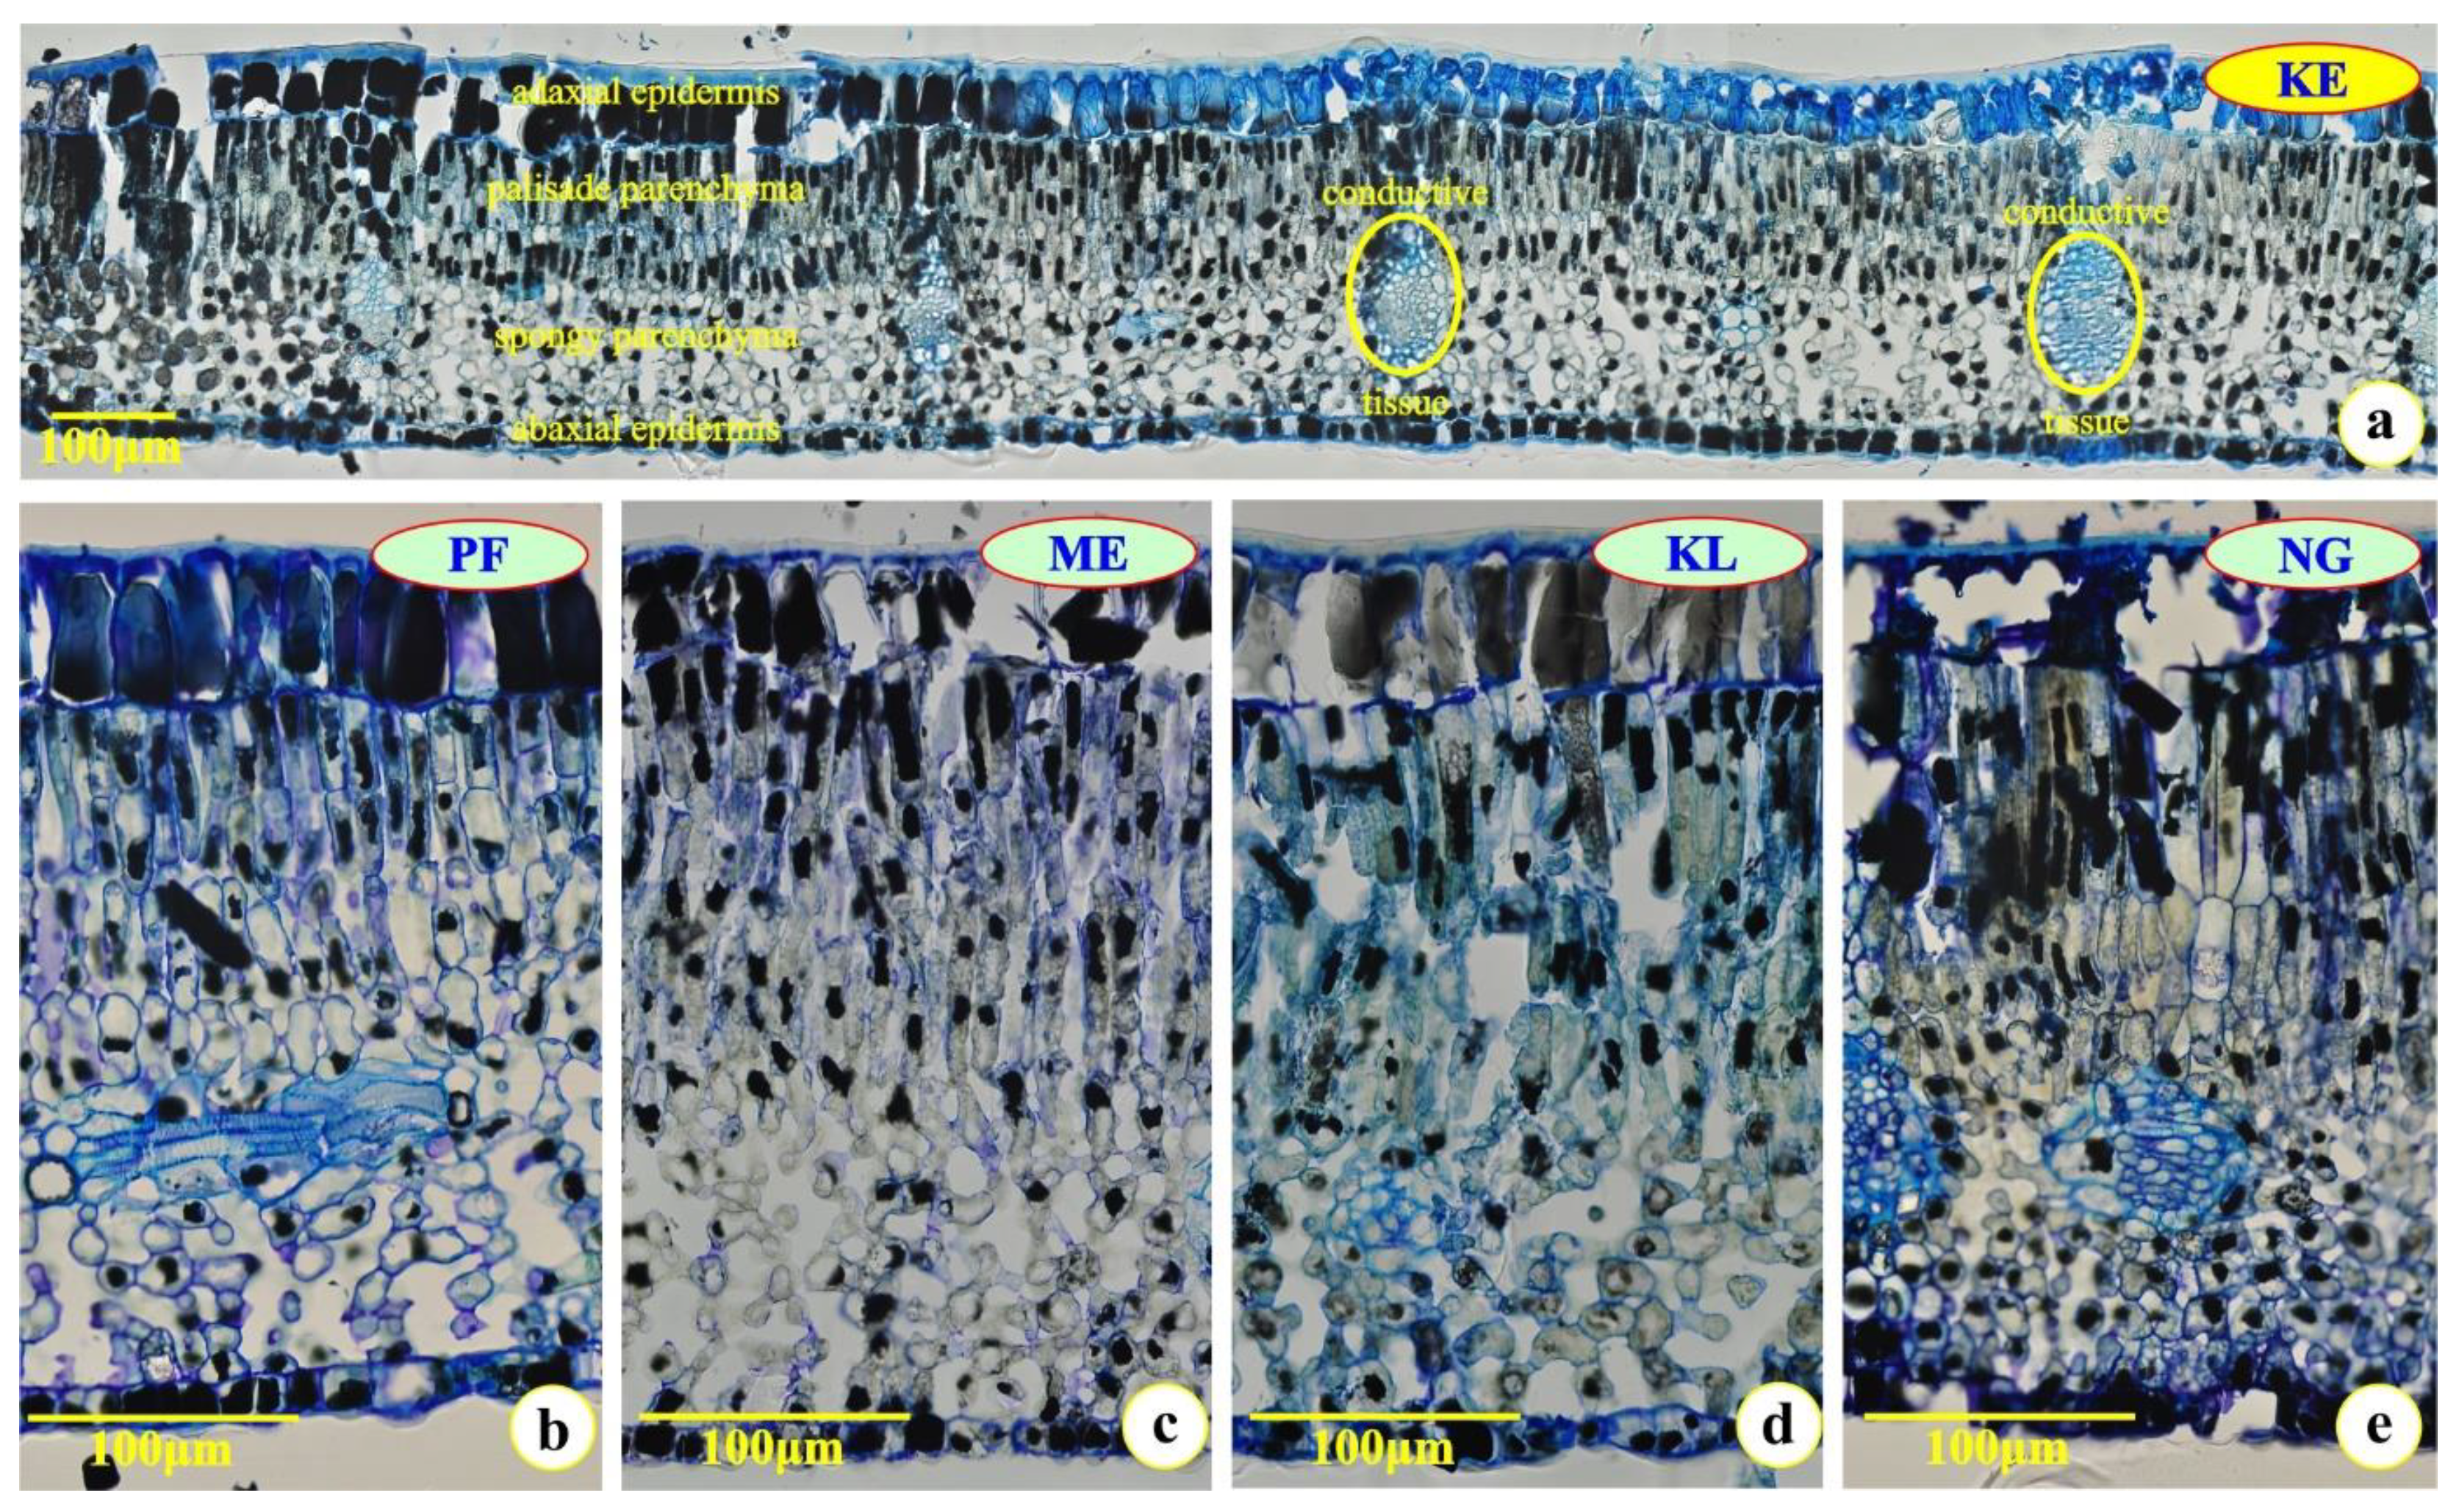
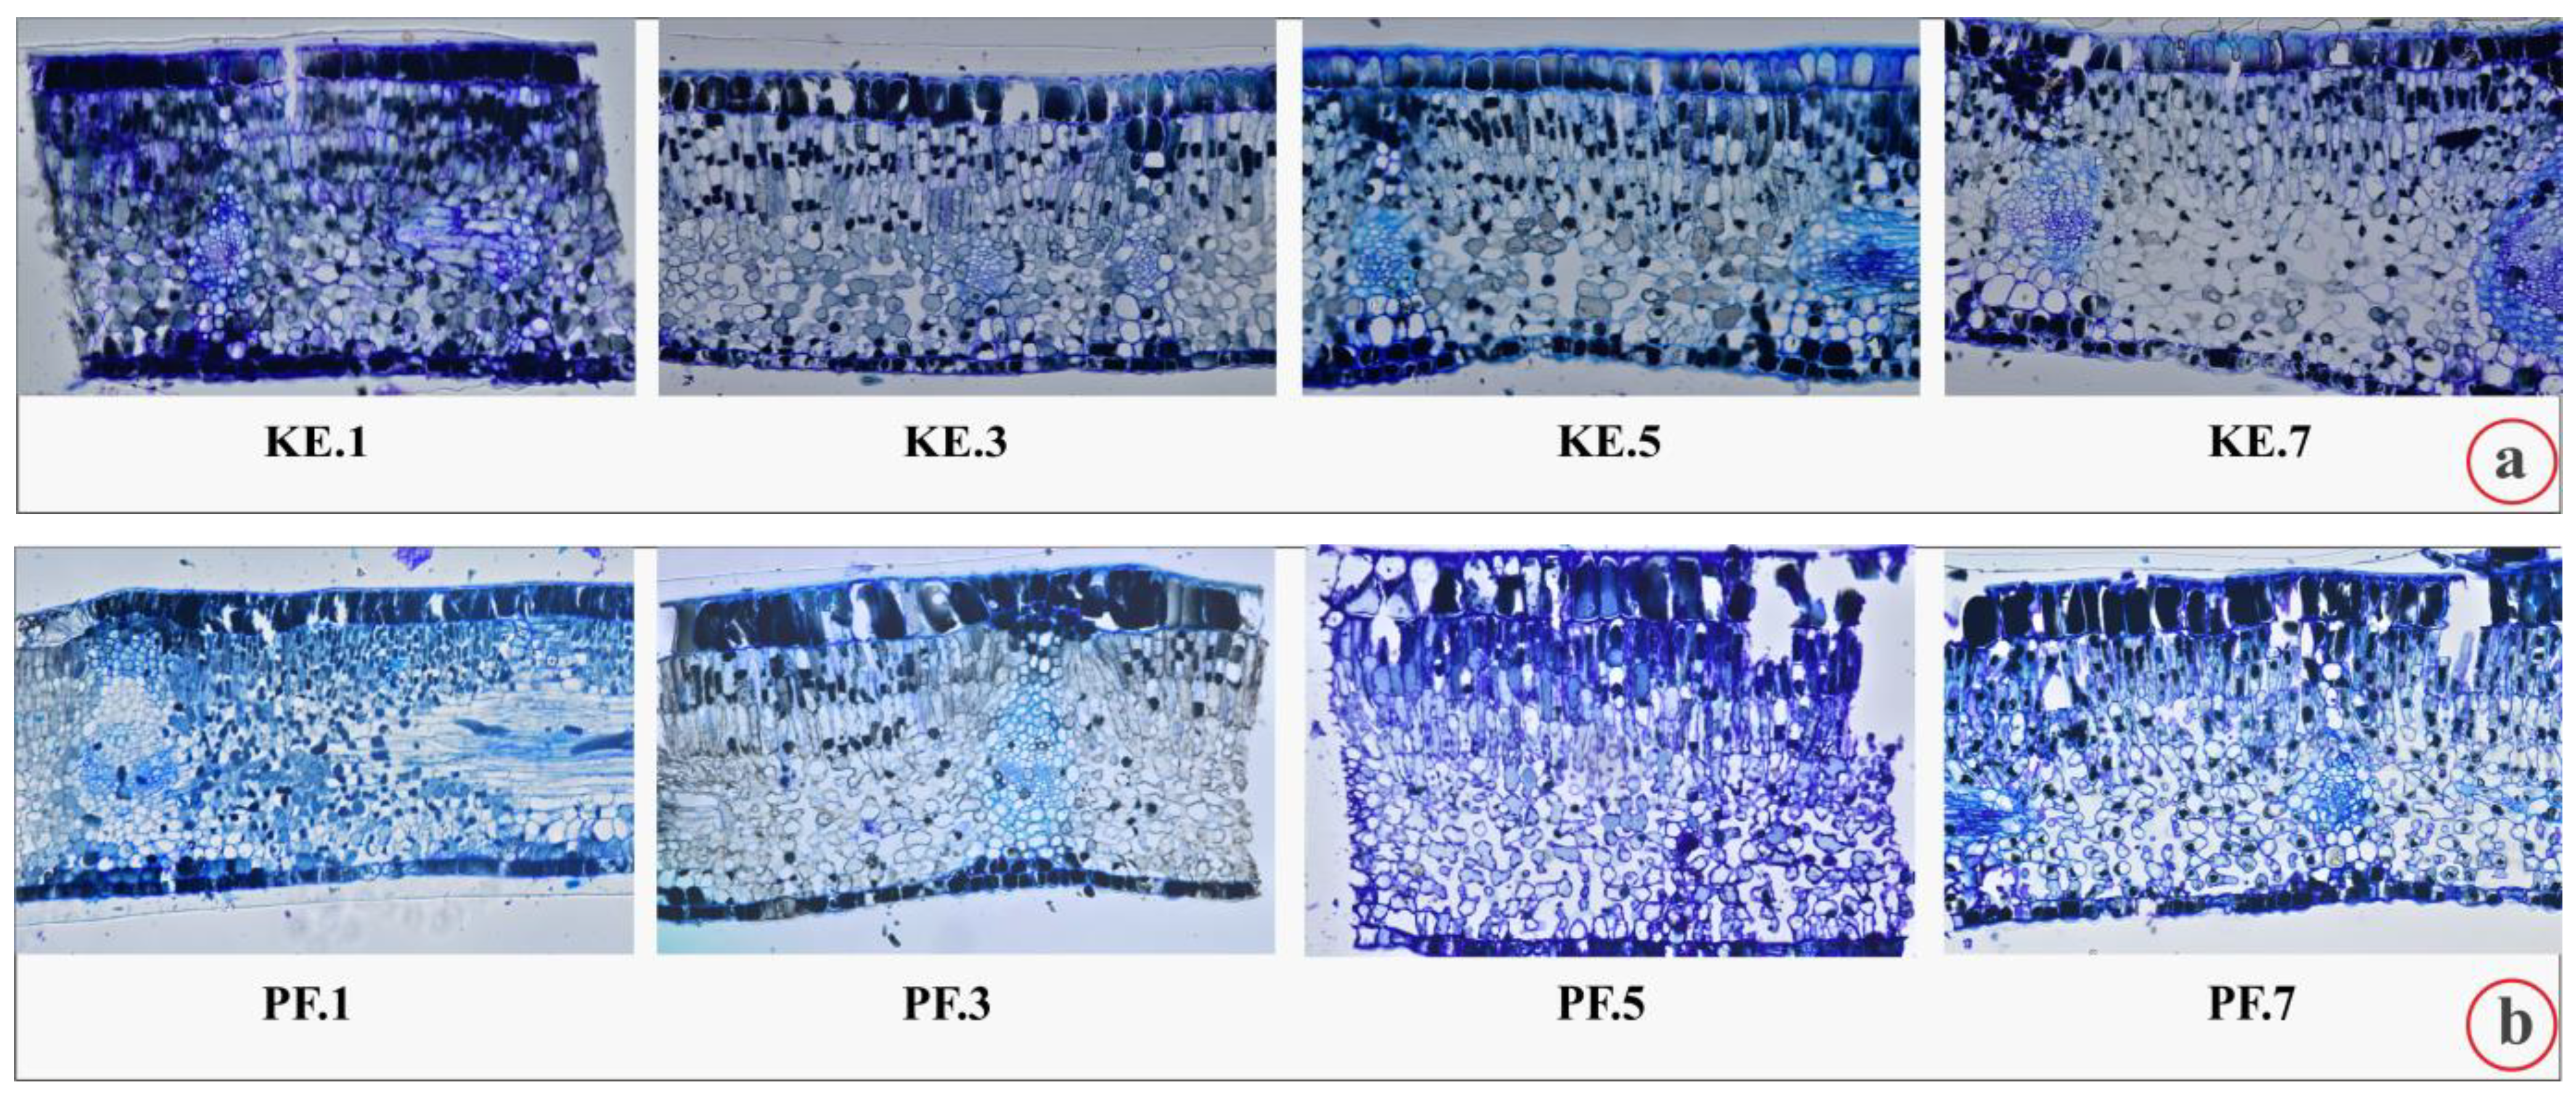
2.1. Leaf Histology
2.2. Physiological Traits
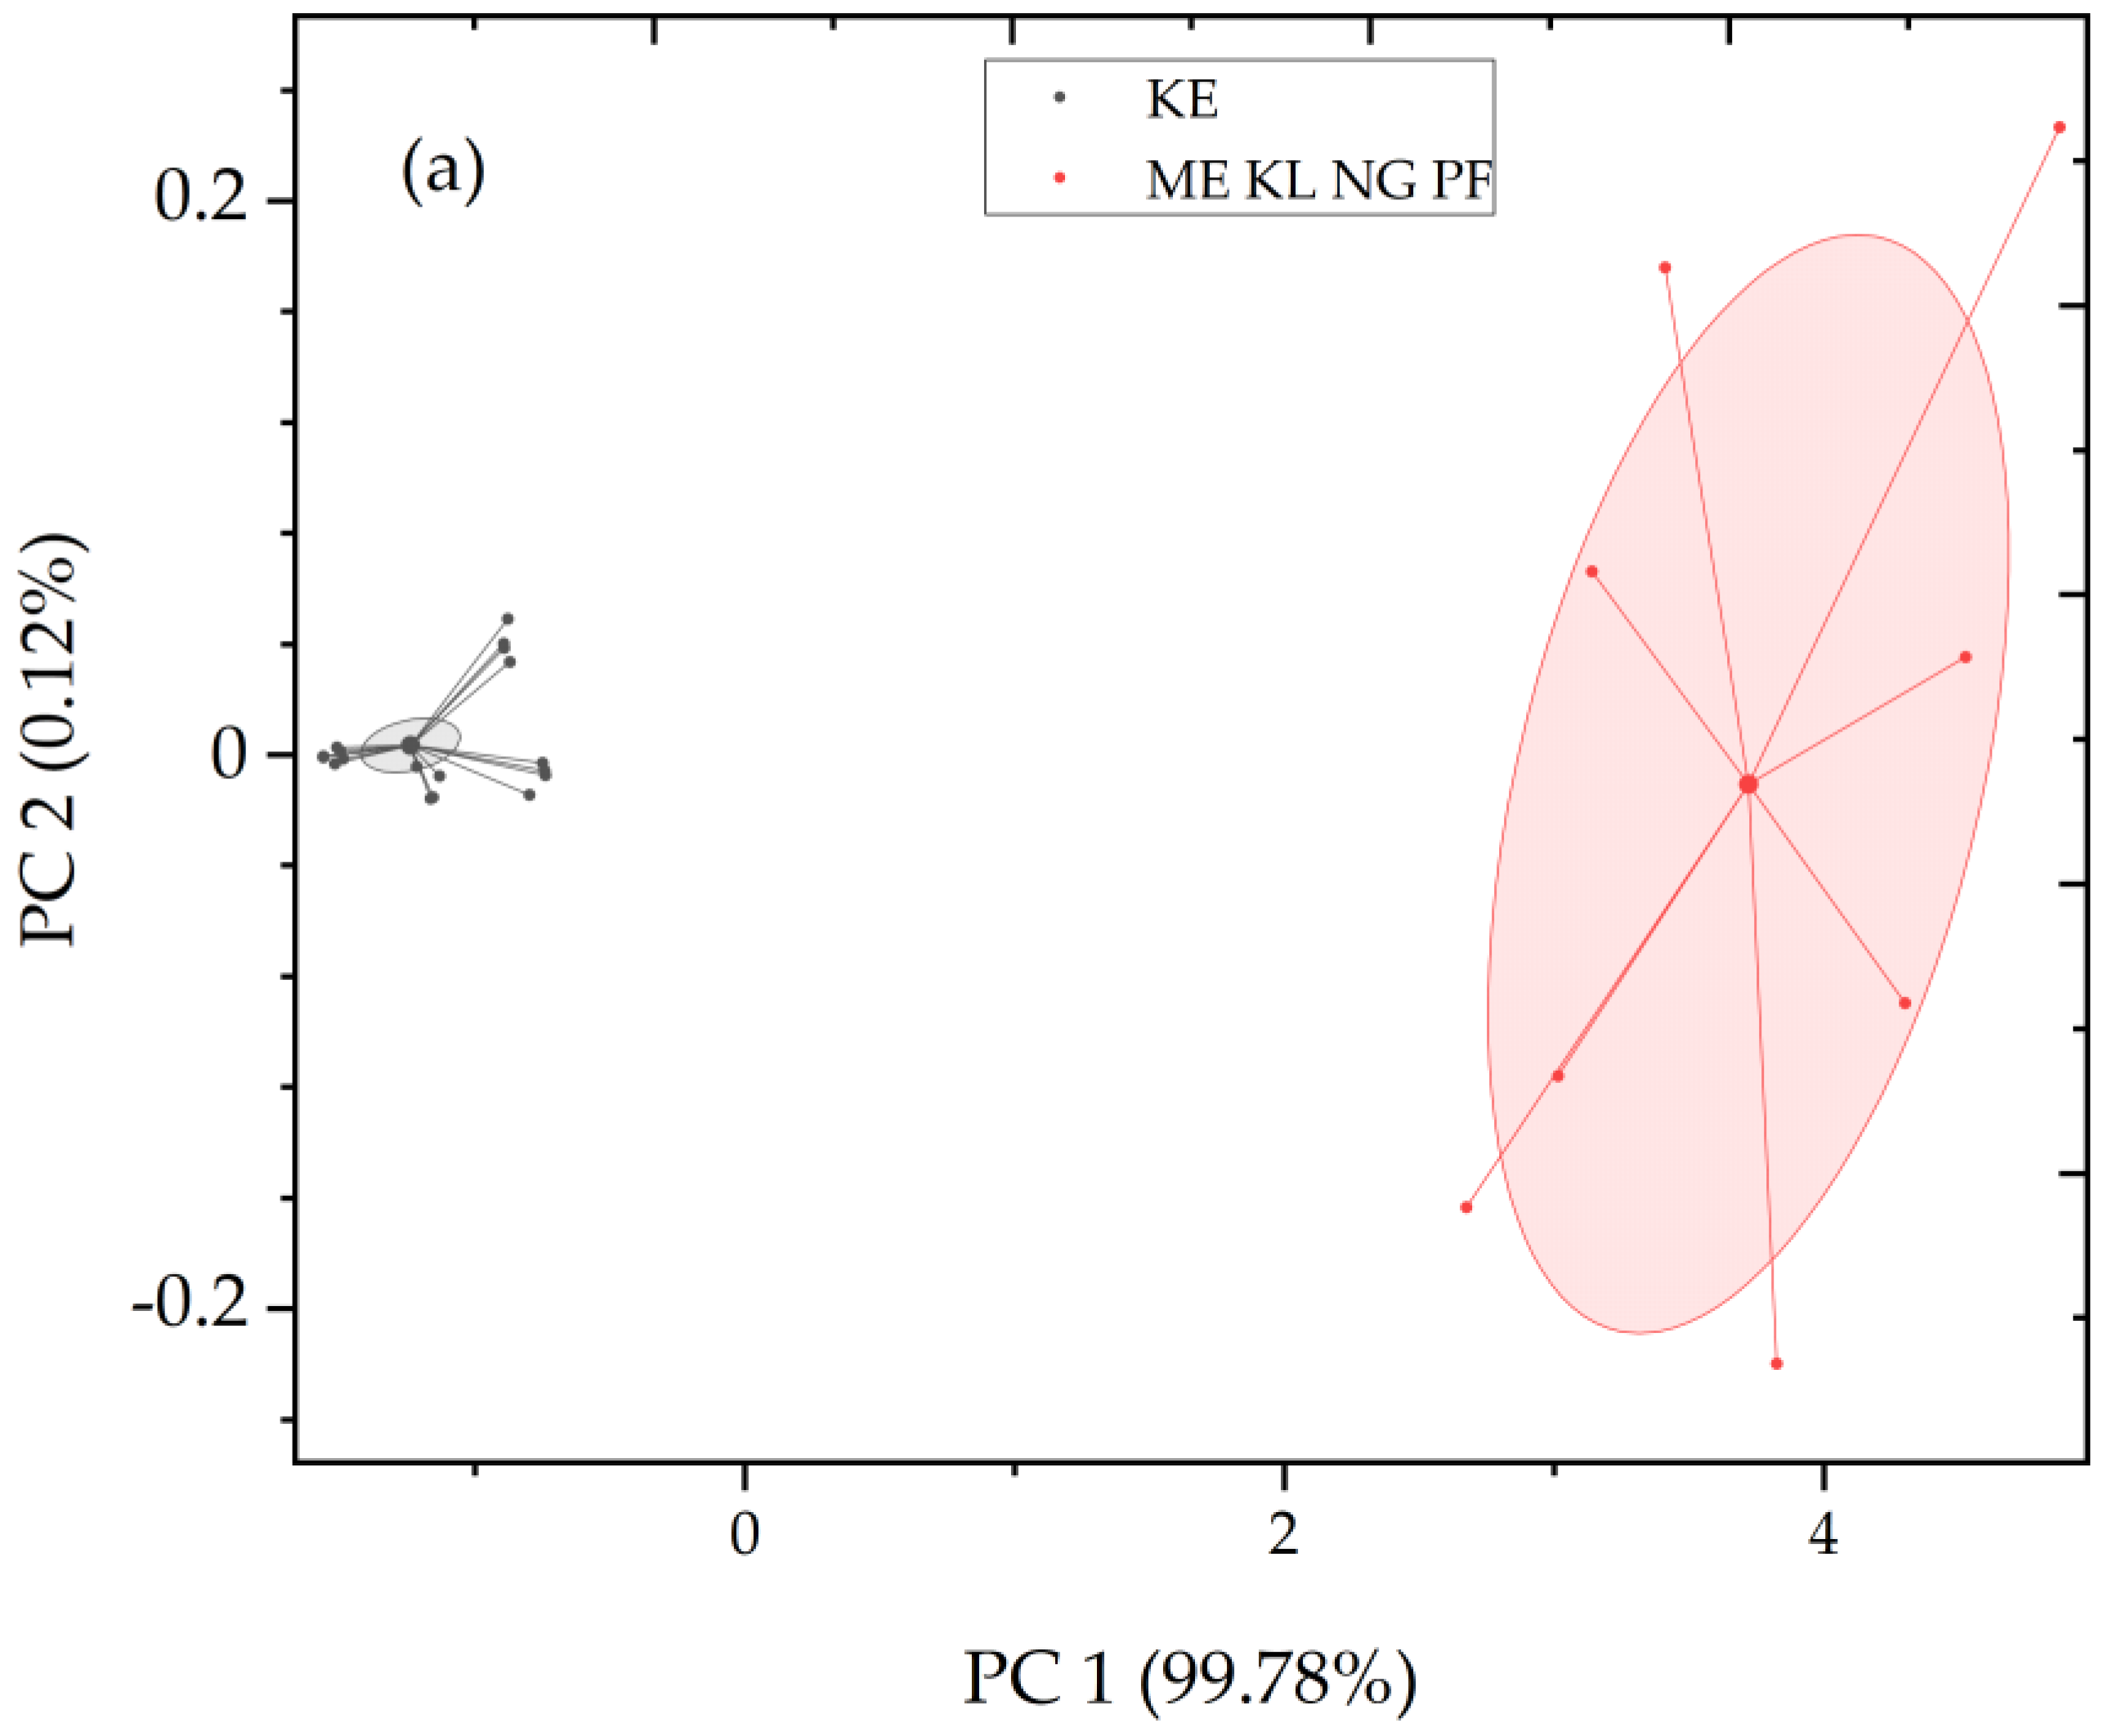
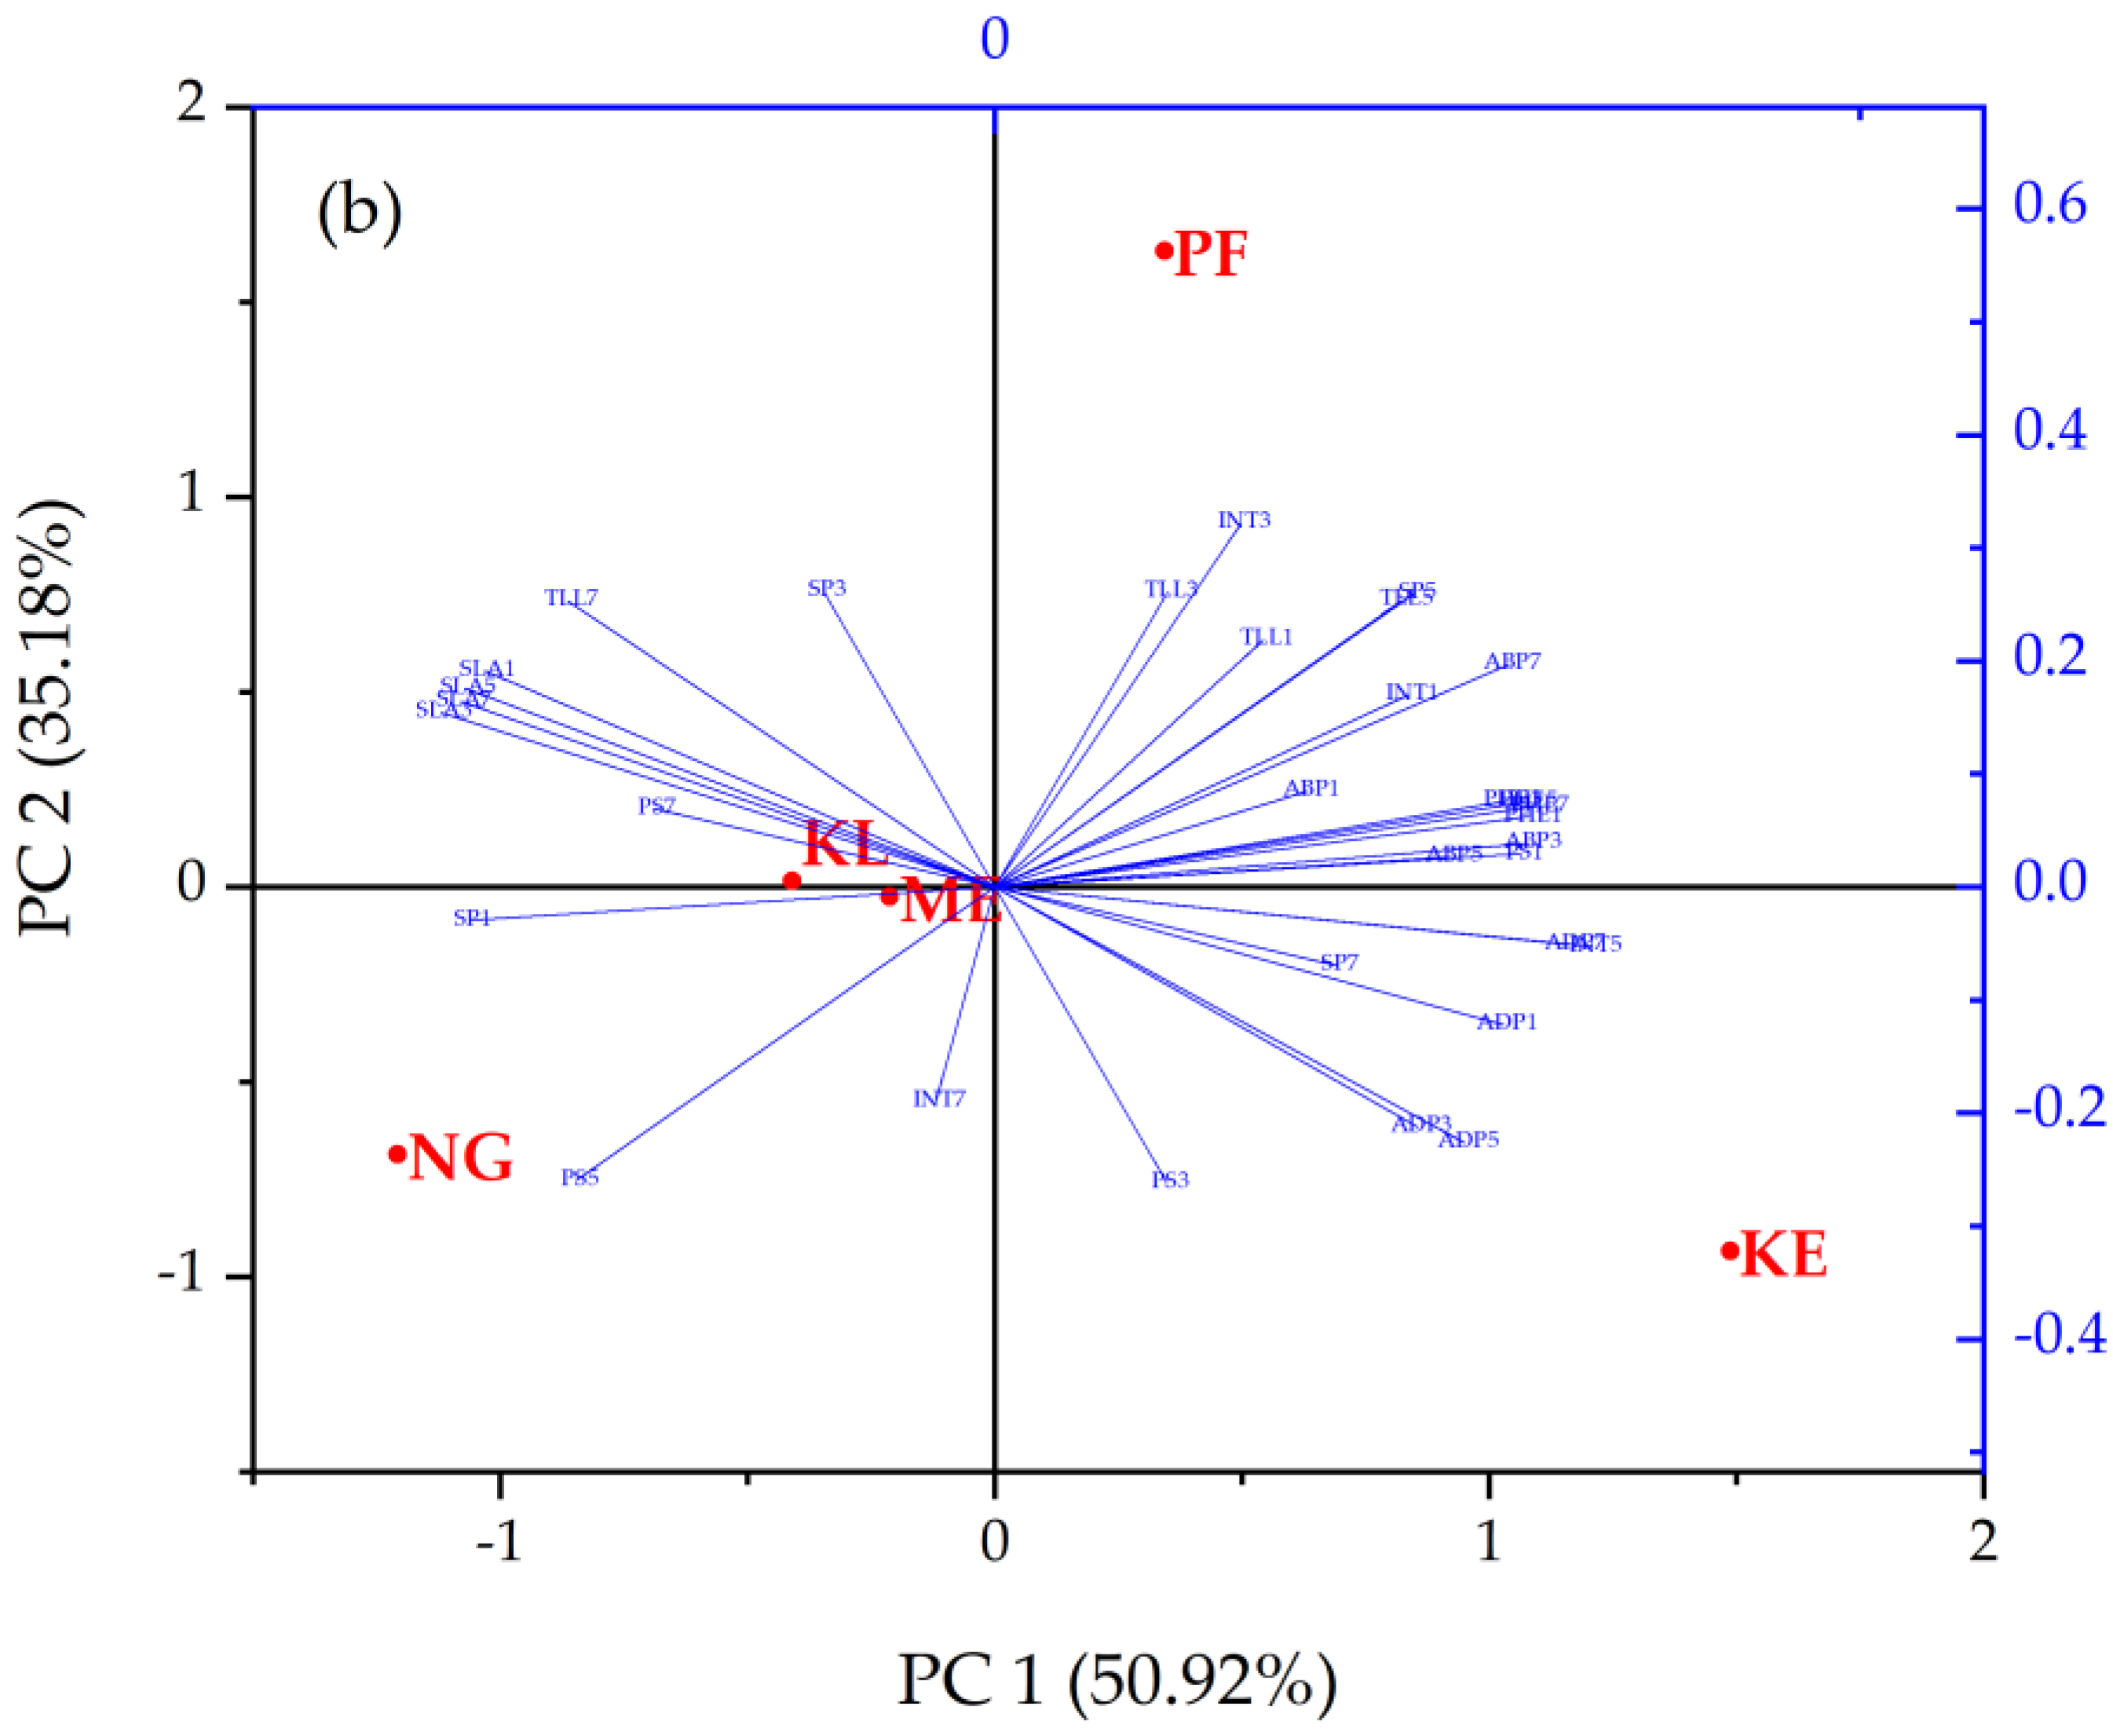
2.3. Principal Component Analysis
3. Discussion
4. Materials and Methods
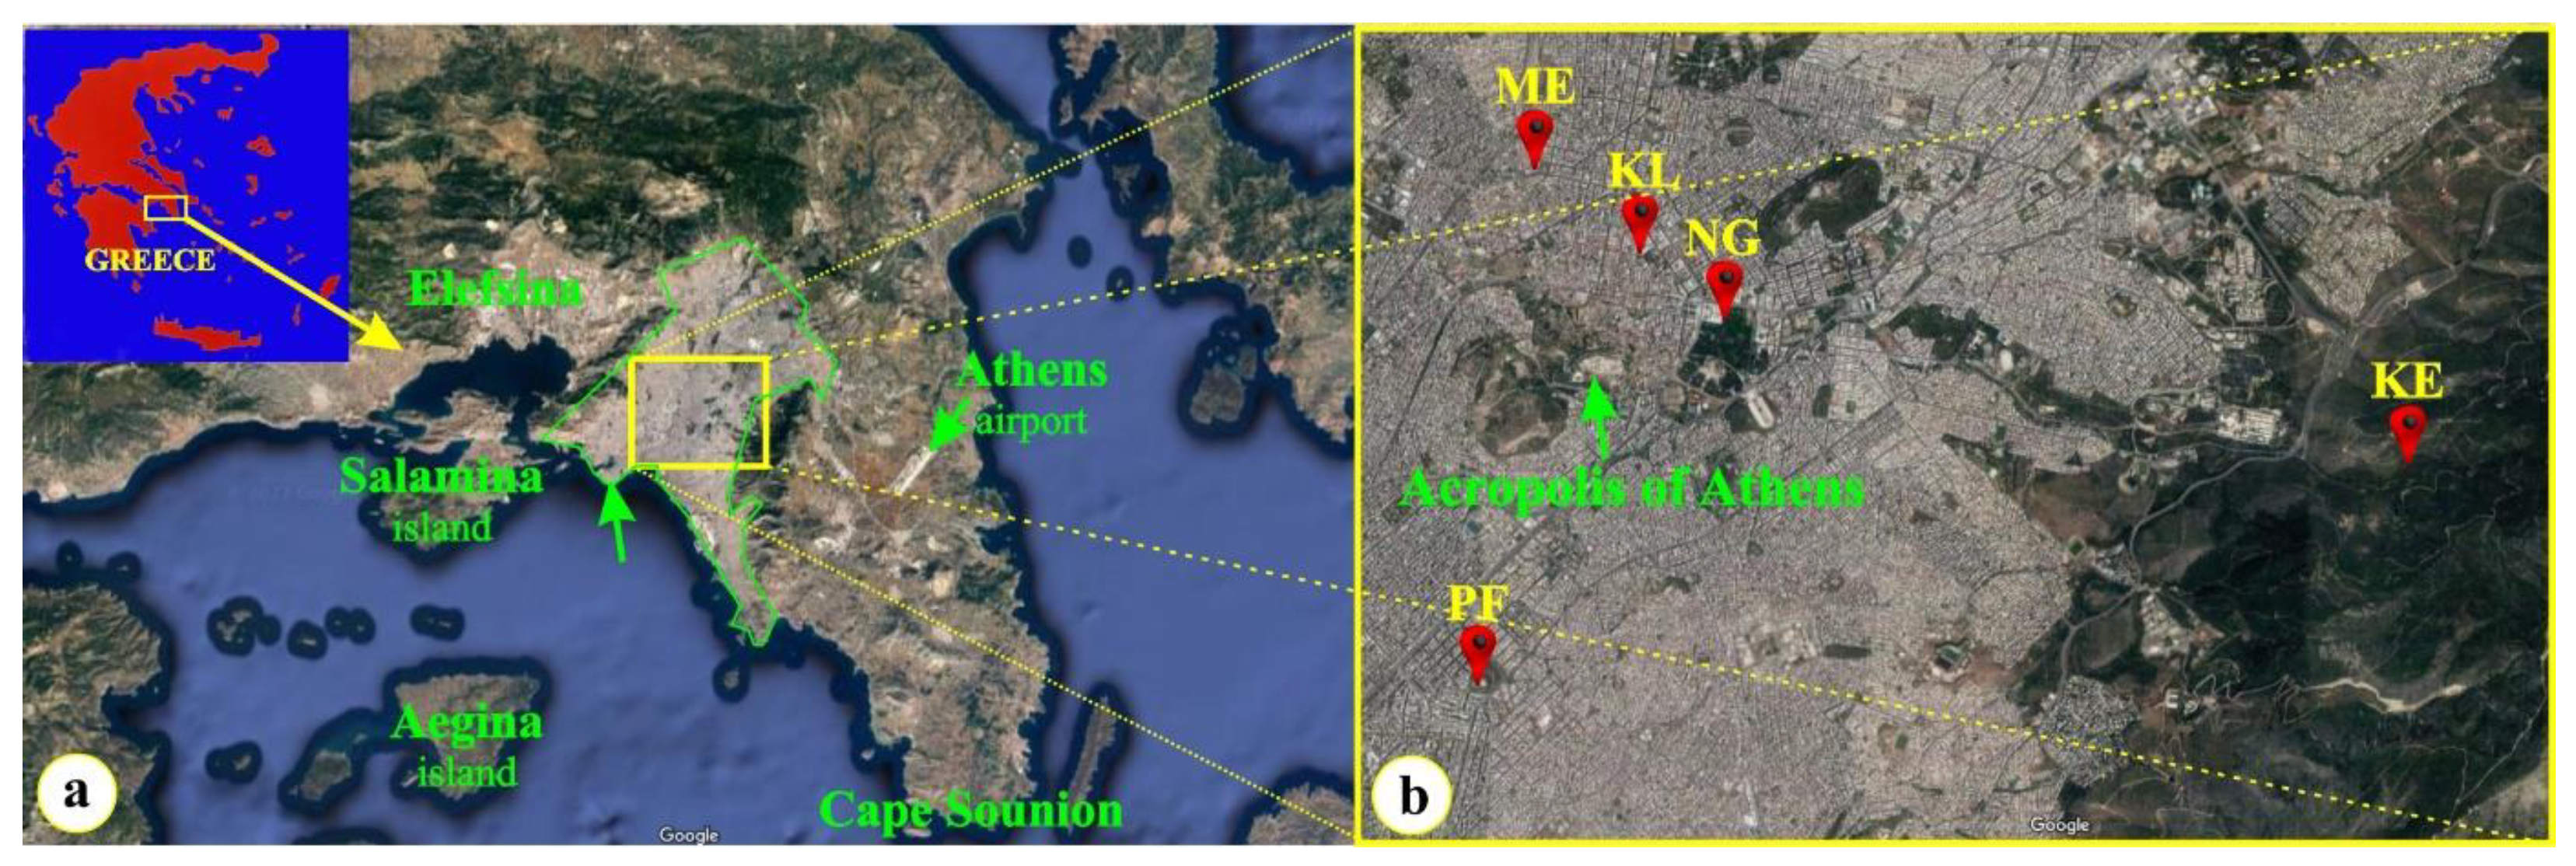
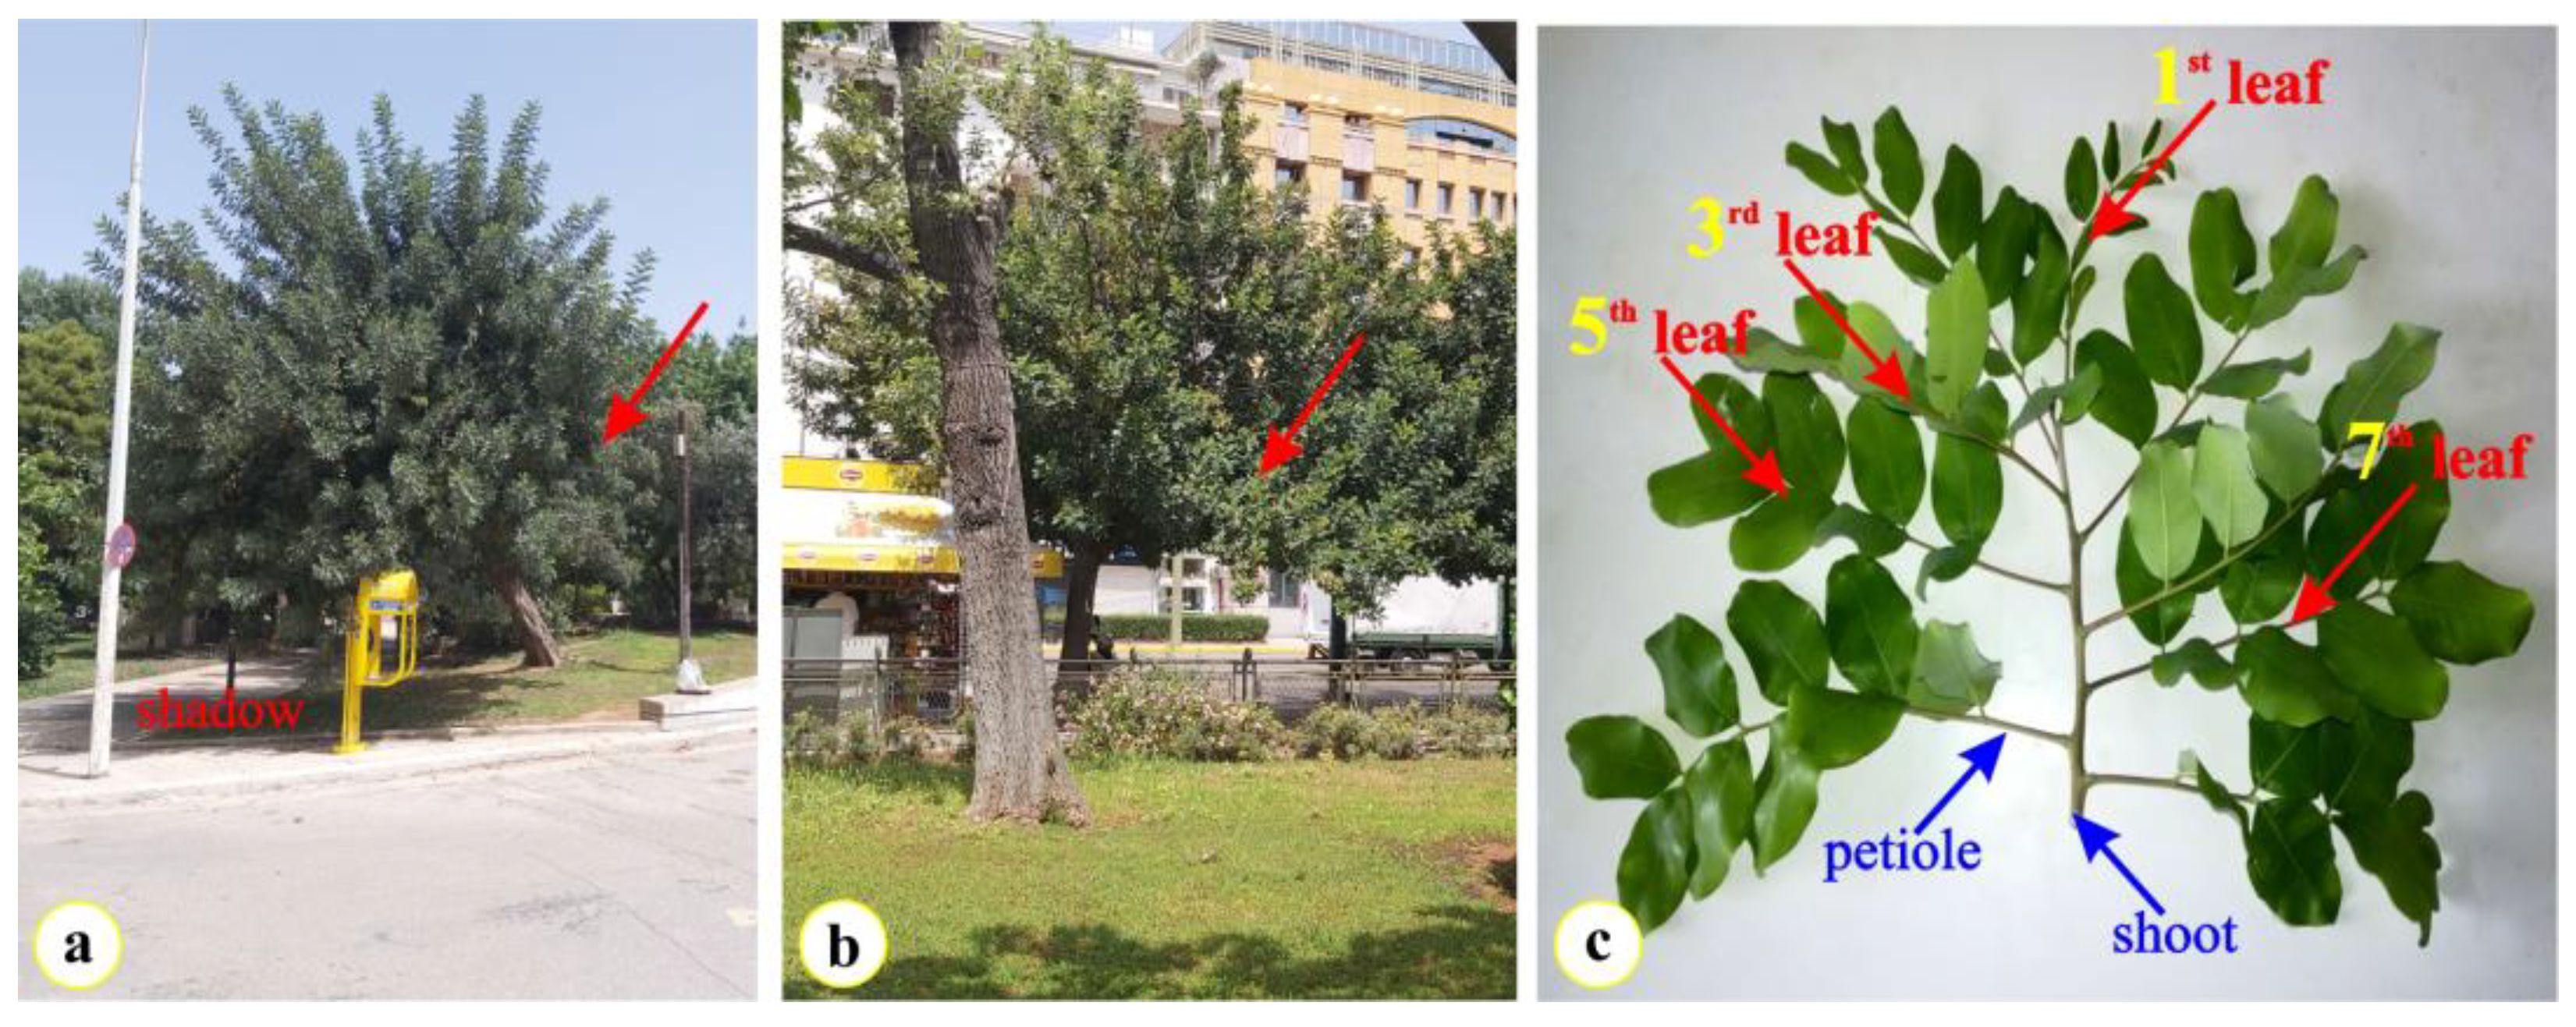
4.1. Plant Material and Sampling Sites
4.2. Climate
4.3. Air Pollutants
4.4. Plant Anatomy and Microscopy
4.5. Specific Leaf Area
4.6. Determination of Chlorophyll Content
4.7. Determination of Phenolic Content
4.8. Statistical Analysis
5. Conclusions
Author Contributions
Funding
Institutional Review Board Statement
Informed Consent Statement
Data Availability Statement
Acknowledgments
Conflicts of Interest
References
- Ramon-Laca, L.; Mabberley, D.J. The ecological status of the carob-tree (Ceratonia siliqua Leguminosae) in the Mediterranean. Bot. J. Linn. Soc. 2004, 144, 431–436. [Google Scholar] [CrossRef]
- Viruel, J.; Le Galliot, N.; Pironon, S.; Nieto Feliner, G.; Suc, J.P.; Lakhal-Mirleau, F.; Juin, M.; Selva, M.; Dagher Kharrat, M.B.; Ouahmane, L.; et al. A strong east–west Mediterranean divergence supports a new phylogeographic history of the carob tree (Ceratonia siliqua, Leguminosae) and multiple domestications from native populations. J. Biogeogr. 2020, 47, 460–471. [Google Scholar] [CrossRef] [Green Version]
- Goor, A.; Nurock, M. The carob. In The Fruits of the Holy Land; Israel University Press: Jerusalem, Israel, 1968; pp. 255–267. [Google Scholar]
- Zohary, D. Domestication of the carob (Ceratonia siliqua L.). Isr. J. Plant Sci. 2002, 50, 141–145. [Google Scholar] [CrossRef]
- Jahns, S. A late Holocene pollen diagram from the Megaris Greece, giving possible evidence for cultivation of Ceratonia siliqua L. during the last 2000 years. Veget. Hist. Archaeobot. 2003, 12, 127–130. [Google Scholar] [CrossRef]
- Dafni, A.; Khatib, S.A. The carob as a blessed and accursed tree. In The Cultural Value of Trees; Wall, J., Ed.; Routledge: London, UK, 2022; pp. 134–147. [Google Scholar]
- Özcan, M.M.; Arslan, D.; Gökçalık, H. Some compositional properties and mineral contents of carob (Ceratonia siliqua) fruit, flour and syrup. Int. J. Food Sci. Nutr. 2007, 58, 652–658. [Google Scholar] [CrossRef] [PubMed]
- Azab, A. Carob (Ceratonia siliqua): Super Food and Medicine. Literature Update. Eur. Chem. Bull. 2020, 9, 306–318. [Google Scholar] [CrossRef]
- Brassesco, M.E.; Brandão, T.R.; Silva, C.L.; Pintado, M. Carob bean (Ceratonia siliqua L.): A new perspective for functional food. Trends Food Sci. Technol. 2021, 114, 310–322. [Google Scholar] [CrossRef]
- Spizzirri, U.G.; Abduvakhidov, A.; Caputo, P.; Crupi, P.; Muraglia, M.; Rossi, O.C.; Clodoveo, M.L.; Aiello, F.; Restuccia, D. Kefir enriched with carob (Ceratonia siliqua L.) leaves extract as a new ingredient during a gluten-free bread-making process. Fermentation 2022, 8, 305. [Google Scholar] [CrossRef]
- Rodríguez-Solana, R.; Romano, A.; Moreno-Rojas, J.M. Carob pulp: A nutritional and functional by-product worldwide spread in the formulation of different food products and beverages. A Review. Processes 2021, 9, 1146. [Google Scholar] [CrossRef]
- Makhzoumi, J.M. The changing role of rural landscapes: Olive and carob multi-use tree plantations in the semiarid Mediterranean. Landsc. Urban Plan. 1997, 37, 115–122. [Google Scholar] [CrossRef]
- Manaut, N.; Sanguin, H.; Ouahmane, L.; Bressan, M.; Thioulouse, J.; Baudoin, E.; Galiana, A.; Hafidi, M.; Prin, Y.; Duponnois, R. Potentialities of ecological engineering strategy based on native arbuscular mycorrhizal community for improving afforestation programs with carob trees in degraded environments. Ecol. Eng. 2015, 79, 113–119. [Google Scholar] [CrossRef]
- Eshghi, S.; Rostami, A.A.; Jamali, B. Carob tree: A suitable species for the future. Acta Hortic. 2016, 1190, 67–70. [Google Scholar] [CrossRef]
- Mitrakos, K. A theory for Mediterranean plant life. Acta Oecol. 1980, 1, 245–252. [Google Scholar]
- Rhizopoulou, S.; Mitrakos, K. Water relations of evergreen sclerophylls I. Seasonal changes in the water relations of eleven species from the same environment. Ann. Bot. 1990, 65, 171–178. [Google Scholar] [CrossRef]
- Rhizopoulou, S.; Meletiou-Christou, M.S.; Diamantoglou, S. Water relations for sun and shade leaves of four Mediterranean evergreen sclerophylls. J. Exp. Bot. 1991, 42, 627–635. [Google Scholar] [CrossRef]
- Christodoulakis, N.S. Structural diversity and adaptations in some Mediterranean evergreen sclerophyllous species. Environ. Exp. Bot. 1992, 32, 295–305. [Google Scholar] [CrossRef]
- Nunes, M.A.; Linskens, H.F. Some aspects of the structure and regulation of Ceratonia siliqua L. stomata. Port. Acta Biol. A 1980, 16, 165–174. [Google Scholar]
- Diamantoglou, S.; Mitrakos, K. Leaf longevity in Mediterranean evergreen sclerophylls. In Components of Productivity of Mediterranean Climate Regions; Margaris, N.S., Mooney, H.A., Eds.; Dr W. Junk Publishers: The Hague, The Netherlands, 1981; pp. 17–19. [Google Scholar]
- Correia, M.J.; Coelho, D.; David, M.M. Response to seasonal drought in three cultivars of Ceratonia siliqua: Leaf growth and water relations. Tree Physiol. 2001, 21, 645–653. [Google Scholar] [CrossRef] [Green Version]
- Rhizopoulou, S. Aspects of cell wall extensibility in Ceratonia siliqua L. Flora–Morphol. Distrib. Funct. Ecol. Plants 2004, 199, 327–333. [Google Scholar] [CrossRef] [Green Version]
- Rhizopoulou, S.; Davies, W.J. Influence of soil drying on root development, water relations and leaf growth of Ceratonia siliqua L. Oecologia 1991, 88, 41–47. [Google Scholar] [CrossRef]
- Pratikakis, E.; Rhizopoulou, S.; Psaras, G.K. A phi layer in roots of Ceratonia siliqua L. Bot. Acta 1998, 111, 93–98. [Google Scholar] [CrossRef]
- Martins-Loução, M.A. Carob (Ceratonia siliqua L.). In Legumes and Oilseed Crops I. Biotechnology in Agriculture and Forestry; Bajaj, Y.P.S., Ed.; Springer: Berlin/Heidelberg, Germany, 1990. [Google Scholar] [CrossRef]
- Christodoulakis, N.S.; Menti, J.; Galatis, B. Structure and development of stomata on the primary root of Ceratonia siliqua L. Ann. Bot. 2002, 89, 23–29. [Google Scholar] [CrossRef] [Green Version]
- Whitmore, M.E.; Davies, W.J.; Mansfield, T.A. Air pollution and leaf growth. In Control of Leaf Growth; Baker, N.R., Davies, W.J., Ong, C.K., Eds.; Cambridge University Press: Cambridge, UK, 1985; pp. 295–318. [Google Scholar]
- Allen, L.H., Jr. Plant responses to rising carbon dioxide and potential interactions with air pollutants. J. Environ. Qual. 1990, 19, 15–34. [Google Scholar] [CrossRef]
- Kyparissis, A.; Drilias, P.; Petropoulou, Y.; Grammatikopoulos, G.; Manetas, Y. Effects of UV-B radiation and additional irrigation on the Mediterranean evergreen sclerophyll Ceratonia siliqua L. under field conditions. Plant Ecol. 2001, 154, 187–193. [Google Scholar] [CrossRef]
- Kouki, M.; Manetas, Y. Resource availability affects differentially the levels of gallotannins and condensed tannins in Ceratonia siliqua. Biochem. Syst. Ecol. 2002, 30, 631–639. [Google Scholar] [CrossRef]
- Eldahshan, O.A. Isolation and structure elucidation of phenolic compounds of carob leaves grown in Egypt. Curr. Res. J. Biol. Sci. 2011, 3, 52–55. [Google Scholar]
- Stanković, M.; Ćurčić, S.; Zlatić, N.; Bojović, B. Ecological variability of the phenolic compounds of Olea europaea L. leaves from natural habitats and cultivated conditions. Biotechnol. Biotechnol. Equip. 2017, 31, 499–504. [Google Scholar] [CrossRef] [Green Version]
- Locosselli, G.M.; de Camargo, E.P.; Moreira, T.C.L.; Todesco, E.; de Fátima Andrade, M.; de André, C.D.S.; Singer, J.M.; Schwandner Ferreira, L.; Do Nascimento, P.H.; Buckeridge, M.S. The role of air pollution and climate on the growth of urban trees. Sci. Total Environ. 2019, 666, 652–661. [Google Scholar] [CrossRef]
- Papazian, S.; Blande, J.D. Dynamics of plant responses to combinations of air pollutants. Plant Biol. 2020, 22, 68–83. [Google Scholar] [CrossRef]
- Levei, L.; Cadar, O.; Babalau-Fuss, V.; Kovacs, E.; Torok, A.I.; Levei, E.A.; Ozunu, A. Use of Black Poplar Leaves for the Biomonitoring of Air Pollution in an Urban Agglomeration. Plants 2021, 10, 548. [Google Scholar] [CrossRef]
- Sgrigna, G.; Baldacchini, C.; Dreveck, S.; Cheng, Z.; Calfapietra, C. Relationships between air particulate matter capture efficiency and leaf traits in twelve tree species from an Italian urban-industrial environment. Sci. Total Environ. 2020, 718, 1373. [Google Scholar] [CrossRef] [PubMed]
- Papadopoulou, S.; Rhizopoulou, S.; Meletiou-Christou, M.S.; Stratakis, E. Biomonitoring Air Pollution in Carob Leaves. Biol. Life Sci. Forum 2021, 4, 50. [Google Scholar] [CrossRef]
- Kolyva, F.; Rhizopoulou, S.; Meletiou-Christou, M.S.; Stratakis, E. Physiological Characteristics of Expanding and Expanded Leaves of Vitis vinifera L. cv. Assyrtiko in Climate Change Conditions. Biol. Life Sci. Forum 2021, 4, 55. [Google Scholar] [CrossRef]
- del Carmen Redondo-Bermúdez, M.; Gulenc, I.T.; Cameron, R.W.; Inkson, B.J. ‘Green barriers’ for air pollutant capture: Leaf micromorphology as a mechanism to explain plants capacity to capture particulate matter. Environ. Pollut. 2021, 288, 117809. [Google Scholar] [CrossRef] [PubMed]
- Xing, Y.; Brimblecombe, P. Role of vegetation in deposition and dispersion of air pollution in urban parks. Atmos. Environ. 2019, 201, 73–83. [Google Scholar] [CrossRef]
- Volkov, A.G.; Ranatunga, D.R.A. Plants as environmental biosensors. Plant Signal. Behav. 2006, 1, 105–115. [Google Scholar] [CrossRef] [PubMed] [Green Version]
- Snyder, E.G.; Watkins, T.H.; Solomon, P.A.; Thoma, E.D.; Williams, R.W.; Hagler, G.S.; Shelow, D.; Hindin, D.A.; Kilaru, V.J.; Preuss, P.W. The changing paradigm of air pollution monitoring. Environ. Sci. Technol. 2013, 47, 11369–11377. [Google Scholar] [CrossRef] [PubMed]
- Costa, R.; Fraga, H.; Fernandes, P.M.; Santos, J.A. Implications of future bioclimatic shifts on Portuguese forests. Reg. Environ. Change 2017, 17, 117–127. [Google Scholar] [CrossRef]
- Chimona, C.; Rhizopoulou, S. Water economy through matching plant root elongation to Mediterranean landscapes. World J. Res. Rev. 2017, 5, 22–24. [Google Scholar] [CrossRef]
- Selmi, W.; Weber, C.; Rivière, E.; Blond, N.; Mehdi, L.; Nowak, D. Air pollution removal by trees in public green spaces in Strasbourg city, France. Urban For. Urban Green. 2016, 17, 192–201. [Google Scholar] [CrossRef] [Green Version]
- Sarah, P.; Zhevelev, H.M.; Atar, O.Z. Urban Park soil and vegetation: Effects of natural and anthropogenic factors. Pedosphere 2015, 25, 392–404. [Google Scholar] [CrossRef]
- Li, X.; Zhang, C.; Li, W.; Ricard, R.; Meng, Q.; Zhang, W. Assessing street-level urban greenery using Google Street View and a modified green view index. Urban For. Urban Green. 2015, 14, 675–685. [Google Scholar] [CrossRef]
- Petrova, S.T. Biomonitoring study of air pollution with Betula pendula Roth., from Plovdiv, Bulgaria. Ecol. Balk. 2011, 3, 1–10. [Google Scholar]
- Mukherjee, A.; Agrawal, M. Pollution response score of tree species in relation to ambient air quality in an urban area. Bull. Environ. Contam. Toxicol. 2015, 96, 197–202. [Google Scholar] [CrossRef] [PubMed]
- Molnár, V.É.; Tóthmérész, B.; Szabó, S.; Simon, E. Urban tree leaves’ chlorophyll-a content as a proxy of urbanization. Air Qual. Atmos. Health 2018, 11, 665–671. [Google Scholar] [CrossRef]
- Meletiou-Christou, M.S.; Banilas, G.P.; Bardis, C.; Rhizopoulou, S. Plant biomonitoring: Impact of urban environment on seasonal dynamics of storage substances and chlorophylls of oleander. Glob. Nest J. 2011, 13, 395–404. [Google Scholar]
- Rini, S.; Masud, Z.A.; Nasrullah, N.; Bey, A.; Tjitrosemito, S. Tolerance levels of roadside trees to air pollutants based on relative growth rate and air pollution tolerance index. HAYATI J. Biosci. 2008, 15, 123. [Google Scholar] [CrossRef] [Green Version]
- Khalid, N.; Masood, A.; Noman, A.; Aqeel, M.; Qasim, M. Study of the responses of two biomonitor plant species (Datura alba & Ricinus communis) to roadside air pollution. Chemosphere 2019, 235, 832–841. [Google Scholar] [CrossRef]
- Khosropour, E.; Attarod, P.; Shirvany, A.; Pypker, T.G.; Bayramzadeh, V.; Hakimi, L.; Moeinaddini, M. Response of Platanus orientalis leaves to urban pollution by heavy metals. J. For. Res. 2019, 30, 1437–1445. [Google Scholar] [CrossRef]
- Kiyomizu, T.; Yamagishi, S.; Kume, A.; Hanba, Y.T. Contrasting photosynthetic responses to ambient air pollution between the urban shrub Rhododendron × pulchrum and urban tall tree Ginkgo biloba in Kyoto city: Stomatal and leaf mesophyll morpho-anatomies are key traits. Trees 2019, 33, 63–77. [Google Scholar] [CrossRef]
- Rashidi, F.; Jalili, A.; Babaie Kafaki, S.; Hodgson, J. Anatomical responses of leaves of Black Locust (Robinia pseudoacacia L.) to urban pollutant gases and climatic factors. Trees 2012, 26, 363–375. [Google Scholar] [CrossRef]
- Gibadulina, I.I.; Larionov, M.V.; Maslennikova, N.N. Anatomical and morphological features of the leaves of Tilia cordata Mill. as an indicator of the adaptive capabilities of the species to the conditions of the urban environment. IOP Conf. Ser. Earth Environ. Sci. 2022, 988, 032082. [Google Scholar] [CrossRef]
- Poorter, H.; De Jong, R.O.B. A comparison of specific leaf area, chemical composition and leaf construction costs of field plants from 15 habitats differing in productivity. New Phytol. 1999, 143, 163–176. [Google Scholar] [CrossRef] [Green Version]
- Treado, J.D.; Roddy, A.B.; Théroux-Rancourt, G.; Zhang, L.; Ambrose, C.; Brodersen, C.R.; Stattuck, M.D.; O’Hern, C.S. Localized growth and remodelling drives spongy mesophyll morphogenesis. J. R. Soc. Interface 2022, 19, 20220602. [Google Scholar] [CrossRef] [PubMed]
- Grant, R.H. Partitioning of biologically active radiation in plant canopies. Int. J. Biometeorol. 1997, 40, 26–40. [Google Scholar] [CrossRef]
- Vogelmann, T.C.; Martin, G. The functional significance of palisade tissue: Penetration of directional versus diffuse light. Plant Cell Environ. 1993, 16, 65–72. [Google Scholar] [CrossRef]
- Mattson, W.J.; Julkunen-Tiitto, R.; Herms, D.A. CO2 enrichment and carbon partitioning to phenolics: Do plant responses accord better with the protein competition or the growth differentiation balance models? Oikos 2005, 111, 337–347. [Google Scholar] [CrossRef]
- Stavrou, I.J.; Christou, A.; Kapnissi-Christodoulou, C.P. Polyphenols in carobs: A review on their composition, antioxidant capacity and cytotoxic effects, and health impact. Food Chem. 2018, 269, 355–374. [Google Scholar] [CrossRef]
- Ben Amor, A.; Rahmani, R.; Bennani, L.; Ben Yahia, L.; Ben Atia Zrouga, K.; Chaira, N.; Nagaz, K. Investigation of phenolic compounds potential to reduce dust pollution of pomegranate trees. Int. J. Phytoremediation 2022. [Google Scholar] [CrossRef]
- Kutiel, P. Slope aspect effect on soil and vegetation in a Mediterranean ecosystem. Isr. J. Plant Sci. 1992, 41, 243–250. [Google Scholar]
- Catarino, F.M.; Correia, O.A.; Webb, E.; David, M. Morphological and physiological responses of the Mediterranean evergreen sclerophyll, Ceratonia siliqua, to different light intensities. In Components of Productivity of Mediterranean Climate Regions, Basic and Applied Aspects; Margaris, N.S., Mooney, H.A., Eds.; Dr W. Junk Publishers: The Hague, The Netherlands, 1981; pp. 5–15. [Google Scholar]
- Kolyva, F.; Stratakis, E.; Rhizopoulou, S.; Chimona, C.; Fotakis, C. Leaf surface characteristics and wetting in Ceratonia siliqua L. Flora–Morphol. Distrib. Funct. Ecol. Plants 2012, 207, 551–556. [Google Scholar] [CrossRef]
- Rodriguez, S.; Rocha, J.; Fernandes, M.; Ravishankar, A.P.; Steinbrück, N.; Cruz, R.; Bacelar, E.; Kickelbick, G.; Anand, S.; Crespí, A.L.; et al. The surfaces of the Ceratonia siliqua L. (Carob) leaflet: Insights from Physics and Chemistry. Langmuir 2021, 37, 2011–2028. [Google Scholar] [CrossRef] [PubMed]
- Pereira, R.F.; Rocha, J.; Nunes, P.; Fernandes, T.; Ravishankar, A.P.; Cruz, R.; Fernandes, M.; Anand, S.; Casal, S.; de Zea Bermudez, V.; et al. Vicariance between Cercis siliquastrum L. and Ceratonia siliqua L. Unveiled by the Physical-Chemical Properties of the Leaves’ Epicuticular Waxes. Front. Plant Sci. 2022, 13, 890647. [Google Scholar] [CrossRef]
- Dadkhah-Aghdash, H.; Rasouli, M.; Rasouli, K.; Salimi, A. Detection of urban trees sensitivity to air pollution using physiological and biochemical leaf traits in Tehran, Iran. Sci. Rep. 2022, 12, 15398. [Google Scholar] [CrossRef] [PubMed]
- Mitrakos, K. Winter low temperatures in mediterranean-type ecosystems. Ecol. Mediterr. 1982, 8, 95–102. [Google Scholar] [CrossRef]
- Mantzikou, E. Kinetics of Leaf Growth in Ceratonia siliqua. BA Diploma Thesis, Botany Section, Department of Biology, National and Kapodistrian University of Athens, Athens, Greece, 2003. [Google Scholar]
- Papadopoulou, S. Study of Morphometric Characteristics in Successive Compound and Simple Leaves of Four Evergreen Sclerophylls. BA Diploma Thesis, Botany Section, Department of Biology, National and Kapodistrian University of Athens, Athens, Greece, 2016. [Google Scholar]
- Christodoulakis, N.S.; Kogia, D.; Mavroeidi, D.; Fasseas, C. Anatomical and cytochemical investigation on the leaf of Teucrium polium L.: A pharmaceutical shrub of the Greek phryganic formations. J. Biol. Res. 2010, 14, 199–209. [Google Scholar]
- Garnier, E.; Shipley, B.; Roumet, C.; Laurent, G. A standardized protocol for the determination of specific leaf area and leaf dry matter content. Funct. Ecol. 2001, 15, 688–695. [Google Scholar] [CrossRef]
- Wilson, P.J.; Thompson, K.E.N.; Hodgson, J.G. Specific leaf area and leaf dry matter content as alternative predictors of plant strategies. New Phytol. 1999, 143, 155–162. [Google Scholar] [CrossRef]
- Lee, J.H.; Heuvelink, E. Simulation of leaf area development based on dry matter partitioning and specific leaf area for cut chrysanthemum. Ann. Bot. 2003, 91, 319–327. [Google Scholar] [CrossRef] [Green Version]
- Lichtenthaler, H.K.; Buschmann, C. Determinations of total carotenoids and chlorophylls a and b of leaf extracts in different solvents. Biochem. Soc. Trans. 1983, 11, 591–592. [Google Scholar] [CrossRef] [Green Version]
- Lichtenthaler, H.K.; Buschmann, C. Chlorophylls and carotenoids: Measurement and characterization by UV–VIS spectroscopy. Curr. Protoc. Food Anal. Chem. 2001, 1, F4.3.1–F4.3.8. [Google Scholar] [CrossRef]
- Wullschleger, S.D.; Norby, R.J.; Hendrix, D.L. Carbon exchange rates, chlorophyll content, and carbohydrate status of two forest tree species exposed to carbon dioxide enrichment. Tree Physiol. 1992, 10, 21–31. [Google Scholar] [CrossRef] [PubMed]
- Singleton, V.L.; Rossi, J.A. Colorimetry of total phenolics with phosphomolybdic-phosphotungstic acid reagents. AJEV 1965, 16, 144–158. [Google Scholar]
- Waterman, P.G.; Mole, S. Analysis of Phenolic Plant Metabolites; Blackwell: Oxford, UK, 1994. [Google Scholar]
- Dray, S.; Dufour, A.B. The ade4 package: Implementing the duality diagram for ecologists. J. Stat. Softw. 2007, 22. [Google Scholar] [CrossRef]
- Siberchicot, A.; Julien-Laferrière, A.; Dufour, A.B.; Thioulouse, J.; Dray, S. Adegraphics: An S4 lattice-based package for the representation of multivariate data. R J. 2017, 9, 198–212. [Google Scholar] [CrossRef]


| Names of Sampling Sites (Initials) | Latitude | Longitude |
|---|---|---|
| Metaxourgeio (ME) | 37.985817 E | 23.721294 N |
| Klafthmonos sq (KL) | 37.979542 E | 23.731402 N |
| National Garden (NG) | 37.975728 E | 23.738600 N |
| Kessariani aesthetic forest (KE) | 37.962400 E | 23.796639 N |
| Paleo Faliro (PF) | 37.930629 E | 23.717089 N |
| Sites | Leaflet (μm) | Periclinal Wall of Adaxial Epidermal Cells (μm) | Adaxial Epidermis (μm) | Mesophyll (μm) | Palisade Parenchyma (μm) | Spongy Parenchyma (μm) | Abaxial Epidermis (μm) | Periclinal Wall of Abaxial Epidermal Cells (μm) |
|---|---|---|---|---|---|---|---|---|
| first young | expanding | |||||||
| ME | 702.00 ± 12.35 b | 8.31 ± 0.19 c | 102.68 ± 8.97 a | 556.91 ± 8.53 a | 240.18 ± 9.36 ab | 316.73 ± 8.25 ab | 39.95 ± 2.98 c | 3.99 ± 0.99 c |
| KL | 711.81 ± 12.86 a | 8.98 ± 1.38 b | 105.01 ± 4.89 a | 558.93 ± 8.38 a | 238.23 ± 7.56 b | 320.70 ± 9.36 a | 45.92 ± 2.97 b | 5.66 ± 0.81 b |
| NG | 579.84 ± 9.67 d | 7.44 ± 0.90 d | 69.55 ± 2.54 c | 466.07 ± 9.74 c | 197.02 ± 7.48 c | 269.06 ± 10.20 d | 41.62 ± 4.69 bc | 4.51 ± 1.22 c |
| KE | 667.90 ± 10.97 c | 10.59 ± 0.77 a | 95.56 ± 5.85 b | 527.43 ± 9.56 b | 246.94 ± 8.27 a | 300.49 ± 9.82 c | 48.98 ± 3.07 a | 9.97 ± 1.57 a |
| PF | 712.94 ± 10.36 a | 8.15 ± 1.27 c | 100.59 ± 5.36 a | 559.39 ± 8.29 a | 244.91 ± 9.33 ab | 314.47 ± 10.29 ab | 49.73 ± 3.80 a | 5.47 ± 1.26 b |
| third expanding | ||||||||
| ME | 759.51 ± 7.49 a | 9.94 ± 1.46 b | 120.43 ± 3.53 a | 579.52 ± 8.24 a | 269.25 ± 9.70 a | 310.28 ± 9.45 a | 53.49 ± 3.36 b | 5.33 ± 1.13 c |
| KL | 758.49 ± 1.99 a | 9.55 ± 2.61 b | 120.02 ± 9.14 a | 582.73 ± 9.23 a | 267.88 ± 8.30 a | 314.86 ± 8.56 a | 53.61 ± 3.69 b | 5.98 ± 1.55 c |
| NG | 668.40 ± 6.93 d | 8.82 ± 1.44 c | 95.04 ± 3.39 c | 530.75 ± 9.94 c | 240.23 ± 7.88 c | 290.52 ± 9.46 c | 42.57 ± 3.65 c | 6.82 ± 1.10 b |
| KE | 716.21 ± 7.49 c | 12.00 ± 1.46 a | 106.34 ± 3.53 b | 560.86 ± 8.24 b | 258.43 ± 9.70 b | 302.43 ± 9.45 b | 55.08 ± 3.36 a | 10.01 ± 1.13 a |
| PF | 744.19 ± 10.36 b | 9.31 ± 0.96 b | 115.74 ± 2.54 a | 575.51 ± 9.87 a | 254.22 ± 10.22 b | 311.29 ± 8.25 a | 51.04 ± 2.45 b | 5.86 ± 1.02 c |
| fifth expanding | ||||||||
| ME | 760.77 ± 9.94 b | 12.87 ± 0.77 a | 122.59 ± 4.03 b | 591.76 ± 4.88 a | 272.47 ± 11.01 a | 319.29 ± 11.57 b | 52.85 ± 3.74 b | 7.64 ± 0.42 b |
| KL | 762.49 ± 8.71 b | 12.99 ± 0.76 a | 123.06 ± 5.93 b | 583.91 ± 10.69 b | 270.80 ± 7.45 a | 313.11 ± 10.73 b | 52.67 ± 4.36 b | 7.19 ± 0.87 b |
| NG | 723.57 ± 8.96 d | 10.27 ± 0.32 b | 111.75 ± 7.54 c | 563.69 ± 12.45 c | 267.11 ± 10.23 b | 296.57 ± 10.14 c | 43.37 ± 4.28 c | 7.55 ± 0.06 b |
| KE | 768.34 ± 6.90 c | 12.70 ± 0.26 a | 115.78 ± 8.77 c | 600.29 ± 7.02 a | 272.91 ± 5.89 a | 327.38 ± 1.98 a | 55.23 ± 5.89 a | 11.85 ± 0.11 a |
| PF | 784.15 ± 9.56 a | 10.09 ± 0.29 b | 138.58 ± 8.26 a | 597.16 ± 13.78 a | 268.55 ± 9.88 b | 328.61 ± 10.27 a | 51.16 ± 3.98 b | 6.75 ± 0.21 c |
| seventh expanding | ||||||||
| ME | 808.52 ± 8.89 a | 13.10 ± 1.55 b | 124.52 ± 6.74 b | 637.85 ± 12.19 a | 291.62 ± 7.16 a | 346.23 ± 15.16 a | 53.26 ± 1.99 b | 8.83 ± 1.52 c |
| KL | 806.83 ± 7.67 a | 13.02 ± 1.65 b | 122.01 ± 5.08 b | 634.60 ± 12.83 a | 290.74 ± 7.57 a | 343.86 ± 10.11 a | 53.57 ± 2.01 b | 8.66 ± 1.64 c |
| NG | 808.43 ± 9.35 a | 11.33 ± 1.47 c | 120.38 ± 5.02 b | 631.43 ± 10.32 a | 290.77 ± 6.99 a | 340.66 ± 10.78 a | 49.74 ± 2.77 c | 8.80 ± 1.06 c |
| KE | 787.03 ± 7.37 b | 14.26 ± 1.26 a | 123.06 ± 5.37 b | 609.55 ± 1.98 b | 275.17 ± 1.32 c | 338.80 ± 2.72 b | 57.05 ± 0.49 a | 12.01 ± 0.12 a |
| PF | 804.86 ± 9.86 a | 11.85 ± 2.89 c | 139.78 ± 7.02 a | 600.05 ± 10.64 c | 280.26 ± 10.65 b | 319.79 ± 10.03 c | 58.81 ± 5.33 a | 10.13 ± 2.45 b |
| third expanded | ||||||||
| ME | 951.00 ± 9.26 b | 13.98 ± 0.63 c | 133.95 ± 2.56 c | 757.23 ± 6.27 c | 438.41 ± 5.87 b | 318.82 ± 7.96 c | 57.36 ± 2.90 c | 9.22 ± 0.68 c |
| KL | 959.63 ± 7.70 b | 13.57 ± 0.40 c | 135.01 ± 5.22 c | 762.15 ± 6.42 c | 443.01 ± 5.49 b | 319.14 ± 6.84 c | 57.93 ± 2.57 c | 9.35 ± 0.49 c |
| NG | 1086.23 ± 5.31 a | 12.89 ± 0.45 d | 134.05 ± 3.49 c | 816.63 ± 4.73 a | 467.90 ± 5.54 a | 308.73 ± 6.27 d | 56.94 ± 1.03 c | 9.12 ± 0.46 c |
| KE | 838.00 ± 4.36 d | 16.65 ± 0.64 a | 157.00 ± 3.53 a | 623.45 ± 9.22 d | 289.36 ± 7.25 d | 334.09 ± 6.51 b | 70.24 ± 2.86 a | 13.02 ± 0.88 a |
| PF | 879.56 ± 8.15 c | 14.96 ± 0.60 b | 142.35 ± 4.36 b | 714.96 ± 4.60 b | 325.23 ± 8.11 c | 349.73 ± 6.32 a | 60.87 ± 2.42 b | 11.02 ± 0.89 b |
| SLA (cm2g−1) | KE | ME | KL | NG | PF |
|---|---|---|---|---|---|
| expanding leaf | |||||
| first | 54.64 ± 0.59 b | 90.87 ± 0.82 a | 93.36 ± 0.30 a | 91.29 ± 0.48 a | 90.47 ± 0.18 a |
| third | 57.74 ± 0.66 a | 90.26 ± 0.22 a | 94.58 ± 0.21 a | 92.69 ± 0.26 a | 90.98 ± 0.22 a |
| fifth | 57.31 ± 0.91 a | 90.45 ± 0.45 a | 94.22 ± 0.22 a | 91.93 ± 0.55 a | 90.54 ± 0.32 a |
| seventh | 57.01 ± 0.35 a | 89.36 ± 0.34 a | 94.13 ± 0.89 a | 91.30 ± 0.43 a | 89.16 ± 0.67 a |
| expanded leaf | |||||
| first | 33.56 ± 0.42 b | 57.82 ± 0.61 a | 54.54 ± 0.74 b | 56.38 ± 0.44 b | 56.28 ± 0.78 a |
| third | 34.79 ± 0.47 a | 56.86 ± 0.96 a | 54.16 ± 0.92 b | 56.68 ± 0.15 b | 55.31 ± 0.72 b |
| fifth | 34.97 ± 0.18 a | 56.47 ± 0.29 a | 55.57 ± 0.97 a | 58.59 ± 0.74 a | 55.44 ± 0.40 b |
| seventh | 35.61 ± 0.44 a | 57.37 ± 0.32 a | 55.35 ± 0.71 a | 58.93 ± 0.79 a | 55.18 ± 0.46 b |
| Expanding leaf | Linear regression of Chl versus SLA |
| first | y = 0.0112x + 0.8681, r = 0.5924, p < 0.05 |
| third | y = 0.0116x + 1.0718, r = 0.5559, p < 0.05 |
| fifth | y = 0.0117x + 1.2993, r = 0.4814, p < 0.05 |
| seventh | y = 0.0141x + 1.2137, r = 0.5014, p < 0.05 |
| Expanded leaf | |
| first | y = 0.0286x + 0.5587, r = 0.9525, p < 0.05 |
| third | y = 0.0249x + 1.2466, r = 0.9873, p < 0.05 |
| fifth | y = 0.0314x + 1.0531, r = 0.9994, p < 0.05 |
| seventh | y = 0.0317x + 1.0323, r = 0.9915, p < 0.05 |
| Expanding leaf | Linear regression of Phenolics versus SLA |
| first | y = −0.5182x + 148.56, r = 0.4714, p < 0.05 |
| third | y = −0.5241x + 148.19, r = 0.5013, p < 0.05 |
| fifth | y = −0.4214x + 137.52, r = 0.4862, p < 0.05 |
| seventh | y = −0.6034x + 146.92, r = 0.5609, p < 0.05 |
| Expanded leaf | |
| first | y = −0.7038x + 110.32, r = 0.9324, p < 0.05 |
| third | y = −0.7659x + 113.86, r = 0.9663, p < 0.05 |
| fifth | y = −0.6260x + 105.72, r = 0.8408, p < 0.05 |
| seventh | y = −0.7979x + 114.55, r = 0.9027, p < 0.05 |
| Time | KE | KE | KE | ME | ME | ME | KL | KL | KL | PF | PF | PF | NG | NG | NG |
|---|---|---|---|---|---|---|---|---|---|---|---|---|---|---|---|
| Month, Year | NO | NO2 | O3 | NO | NO2 | O3 | NO | NO2 | O3 | NO | NO2 | O3 | NO | NO2 | O3 |
| January 2022 | 2 | 16 | 64 | 89 | 44 | 9 | 48 | 30 | 15 | 31 | 40 | 59 | 49 | 28 | 16 |
| January 2021 | 2 | 9 | 50 | 52 | 41 | 8 | 23 | 19 | 25 | 15 | 25 | 55 | 22 | 20 | 24 |
| February 2022 | 2 | 15 | 70 | 55 | 46 | 11 | 32 | 26 | 22 | 18 | 38 | - | 31 | 27 | 23 |
| February 2021 | 2 | 11 | 57 | 60 | 48 | 13 | 29 | 23 | 22 | 19 | 35 | 30 | 30 | 23 | 21 |
| March 2022 | 1 | 12 | 72 | 37 | 40 | 24 | 18 | 20 | 30 | 5 | 25 | - | 19 | 21 | 31 |
| March 2021 | 1 | 12 | 66 | 19 | 39 | 19 | 16 | 25 | 43 | 6 | 26 | 60 | 17 | 25 | 42 |
| April 2022 | 1 | 7 | 86 | 14 | 33 | 40 | 8 | 14 | 44 | 2 | 9 | - | 9 | 14 | 40 |
| April 2021 | 2 | 12 | 66 | 18 | 42 | 19 | 18 | 28 | 60 | 5 | 25 | 81 | 12 | 28 | 58 |
| May 2022 | 1 | 10 | 84 | 25 | 43 | 19 | 11 | 15 | 21 | - | - | - | 12 | 14 | 20 |
| May 2021 | 1 | 7 | 88 | 15 | 48 | 12 | 13 | 30 | 62 | 5 | 30 | 83 | 12 | 29 | 53 |
| June 2022 | 2 | 11 | 81 | 15 | 37 | 29 | 9 | 13 | 11 | - | - | - | 10 | 14 | 13 |
| June 2021 | 1 | 11 | 105 | 15 | 47 | 15 | 15 | 31 | 60 | 5 | 29 | 88 | 16 | 30 | 59 |
| July 2021 | 1 | 6 | 115 | 10 | 46 | 41 | 17 | 35 | 67 | 5 | 20 | 95 | 17 | 36 | 65 |
| August 2021 | 1 | 8 | 113 | 15 | 43 | 33 | 25 | 35 | 50 | - | 26 | 90 | 24 | 35 | 48 |
| September 2021 | 1 | 8 | 9 6 | 29 | 53 | 30 | 33 | 45 | 47 | - | 25 | 80 | 32 | 44 | 47 |
| October 2021 | 1 | 7 | 71 | 30 | 45 | 26 | 28 | 32 | 38 | - | 23 | 68 | 28 | 30 | 36 |
| November 2021 | 2 | 10 | 58 | 56 | 48 | 14 | 38 | 34 | 32 | 13 | 30 | 54 | 37 | 33 | 30 |
| December 2021 | 2 | 10 | 57 | 67 | 33 | 11 | 43 | 36 | 33 | 12 | 29 | 48 | 39 | 32 | 33 |
Disclaimer/Publisher’s Note: The statements, opinions and data contained in all publications are solely those of the individual author(s) and contributor(s) and not of MDPI and/or the editor(s). MDPI and/or the editor(s) disclaim responsibility for any injury to people or property resulting from any ideas, methods, instructions or products referred to in the content. |
© 2023 by the authors. Licensee MDPI, Basel, Switzerland. This article is an open access article distributed under the terms and conditions of the Creative Commons Attribution (CC BY) license (https://creativecommons.org/licenses/by/4.0/).
Share and Cite
Papadopoulou, S.; Stefi, A.L.; Meletiou-Christou, M.-S.; Christodoulakis, N.S.; Gkikas, D.; Rhizopoulou, S. Structural and Physiological Traits of Compound Leaves of Ceratonia siliqua Trees Grown in Urban and Suburban Ambient Conditions. Plants 2023, 12, 514. https://doi.org/10.3390/plants12030514
Papadopoulou S, Stefi AL, Meletiou-Christou M-S, Christodoulakis NS, Gkikas D, Rhizopoulou S. Structural and Physiological Traits of Compound Leaves of Ceratonia siliqua Trees Grown in Urban and Suburban Ambient Conditions. Plants. 2023; 12(3):514. https://doi.org/10.3390/plants12030514
Chicago/Turabian StylePapadopoulou, Sophia, Aikaterina L. Stefi, Maria-Sonia Meletiou-Christou, Nikolaos S. Christodoulakis, Dimitrios Gkikas, and Sophia Rhizopoulou. 2023. "Structural and Physiological Traits of Compound Leaves of Ceratonia siliqua Trees Grown in Urban and Suburban Ambient Conditions" Plants 12, no. 3: 514. https://doi.org/10.3390/plants12030514
APA StylePapadopoulou, S., Stefi, A. L., Meletiou-Christou, M.-S., Christodoulakis, N. S., Gkikas, D., & Rhizopoulou, S. (2023). Structural and Physiological Traits of Compound Leaves of Ceratonia siliqua Trees Grown in Urban and Suburban Ambient Conditions. Plants, 12(3), 514. https://doi.org/10.3390/plants12030514