Article

Deciphering the Genetic Architecture of Color Variation in Whole Grain Rice by Genome-Wide Association

1
National Key Laboratory of Crop Genetic Improvement, Hubei Hongshan Laboratory, Huazhong Agricultural University, Wuhan 430070, China
2
College of Agriculture, Yangtze University, Jingzhou 434025, China
3
Institute of Crop Science, Chinese Academy of Agricultural Sciences, Beijing 100081, China
*
Author to whom correspondence should be addressed.
These authors contributed equally to this work.
Plants 2023, 12(4), 927; https://doi.org/10.3390/plants12040927
Submission received: 13 January 2023 / Revised: 10 February 2023 / Accepted: 13 February 2023 / Published: 17 February 2023
(This article belongs to the Special Issue Rice Genetics and Breeding)

Abstract

:
Whole grain rice is recommended in a natural healthy diet because of its high nutritional and healthful benefits compared to polished or white rice. The whole grain contains the pericarp with many assorted colors (such as brown, red, and black) associated with taste and commercial quality. The color attributes of whole grain or brown rice are usually undesirable and need to be improved. To decipher the genetic basis of color variation in the whole grain rice, we conducted a genome-wide association analysis of three parameters of grain colors (brightness, redness, and yellowness) in a panel of 682 rice accessions. Twenty-six loci were identified for the color parameters, implying that grain color is under polygenic control. Among them, some major-effect loci were co-localized with the previously identified genes such as Rc and Rd. To eliminate the possible mask of Rc on other loci influencing grain color, we performed the association analysis in a subset of the panel that excluded the pigmented (red and black) rice. Eighteen loci or SNPs were detected to be associated with grain color in the subpopulation, many of which were not reported before. Two significant peak SNP regions on chromosomes 1 and 9 were validated using near-isogenic lines. Based on differential expression analysis of annotated genes within the SNP regions and metabolic analysis of pooled extreme samples, we found at least three annotated genes as potential candidates involved in the flavonoid metabolic pathway related to pericarp color. These results provide insights into the genetic basis of rice grain color and facilitate genomic breeding to improve appearance and commercial quality of whole grain rice.

1. Introduction

Rice (Oryza sativa L.) is a major cereal crop and provides the main source of energy intake for over half of the global population. Milled or polished rice is usually consumed, because of its translucent and good taste in major rice-eating countries. However, the milling process of rice alters the nutrient composition and sensory attributes such as texture and color [1]. The polished rice obtained by removing the bran layer leads to a lack of essential vitamins, minerals, and other functional nutrient compounds [2]. Whole grain rice is the version of the unpolished grain (traditionally called brown rice) that contains the pericarp, aleurone, and germ. It is recommended in a naturally healthy diet and has gradually been accepted in developing countries, due to a valuable source of various nutritional and bioactive compounds that positively impact disease prevention [3,4,5].
The appearance quality of whole grain rice or brown rice greatly affects the market competitiveness. In particular, the color and texture of whole grain rice change the sensory perception and affect consumer acceptance. For example, Asian consumers preferred rice with a white appearance [6]. The grain color ranges from white to red, purple, and black in the pericarp because of some extant gathering of various flavonoids and phenolic metabolites [7,8]. Most rice varieties have a light brown or white pericarp, usually treated as white or non-pigmented rice; there is also pigmented rice, such as red and black rice, which accumulate proanthocyanidin and anthocyanin in the pericarp, respectively [8].
It is well-documented that many structural and regulatory genes associated with flavonoid biosynthesis confer grain colors in some pigmented cereals. Some major-effect genes for grain pigmentation have already been identified involving anthocyanin and proanthocyanidin biosynthesis [9]. For example, several key genes in the biosynthesis of anthocyanin, such as chalcone synthase (CHS), chalcone isomerase (CHI), dihydroflavonol 4-reductase (DFR), anthocyanin synthase (ANS), and UDP-glycosyltransferase (UGT), are associated with grain colors in cereal crops [3,10,11,12,13,14]. In rice, pericarp color is controlled by OsMYB3/Kala3, OsB2/Ra2/Kala4, Rc, and Rd/Kala1 [15,16,17]. The R2R3-MYB gene OsMYB3/Kala3 participates in the biosynthesis of anthocyanin [18]. The basic helix-loop-helix (bHLH) transcription factor OsB2/Kala4 controls anthocyanin production in the pericarp, producing black grains [19]. Meanwhile, Rc encoding a bHLH protein confers proanthocyanidin accumulation in the pericarp. The loss-of-function mutant Rc causes the change from red to white grains [20]. Rc interacts with Rd, producing red grains; Rd encoding a form of DFR enhances proanthocyanidin content in the pericarp. Rc generates brown grains in the absence of Rd, whereas Rd alone has no color phenotype [21,22].
In addition to the above-mentioned genes inferring the genetic variation in grain pigmentation, there are numerous quantitative trait loci or single nucleotide polymorphisms (SNPs) associated with color variation in rice grains [23,24,25,26,27]. These results indicate a polygenic inheritance of grain color. In addition, transcriptomic profiling and metabolomic analysis have identified certain structural and regulatory genes influencing the flavonoid biosynthesis pathway [28,29,30,31]. However, the genes and their metabolic products that explain the genetic variation in non-pigmented or white rice remain elusive.
To analyze the genetic basis of grain color, we carried out genome-wide association analysis (GWAS) of three parameters, brightness or lightness (L*), redness (a*), and yellowness (b*), in a panel of rice germplasms including pigmented and white rice. With the aim to explore the genetic variation in whole grain rice, we integrated near-isogenic lines with transcription profile and metabolic analysis to pinpoint candidate genes with significant SNPs associated with grain color. In addition to the major gene Rc, some candidate genes were identified for grain color variation. The results provide valuable information for the rice industry and the development of nutritional rice varieties to meet multiple needs.

2. Results

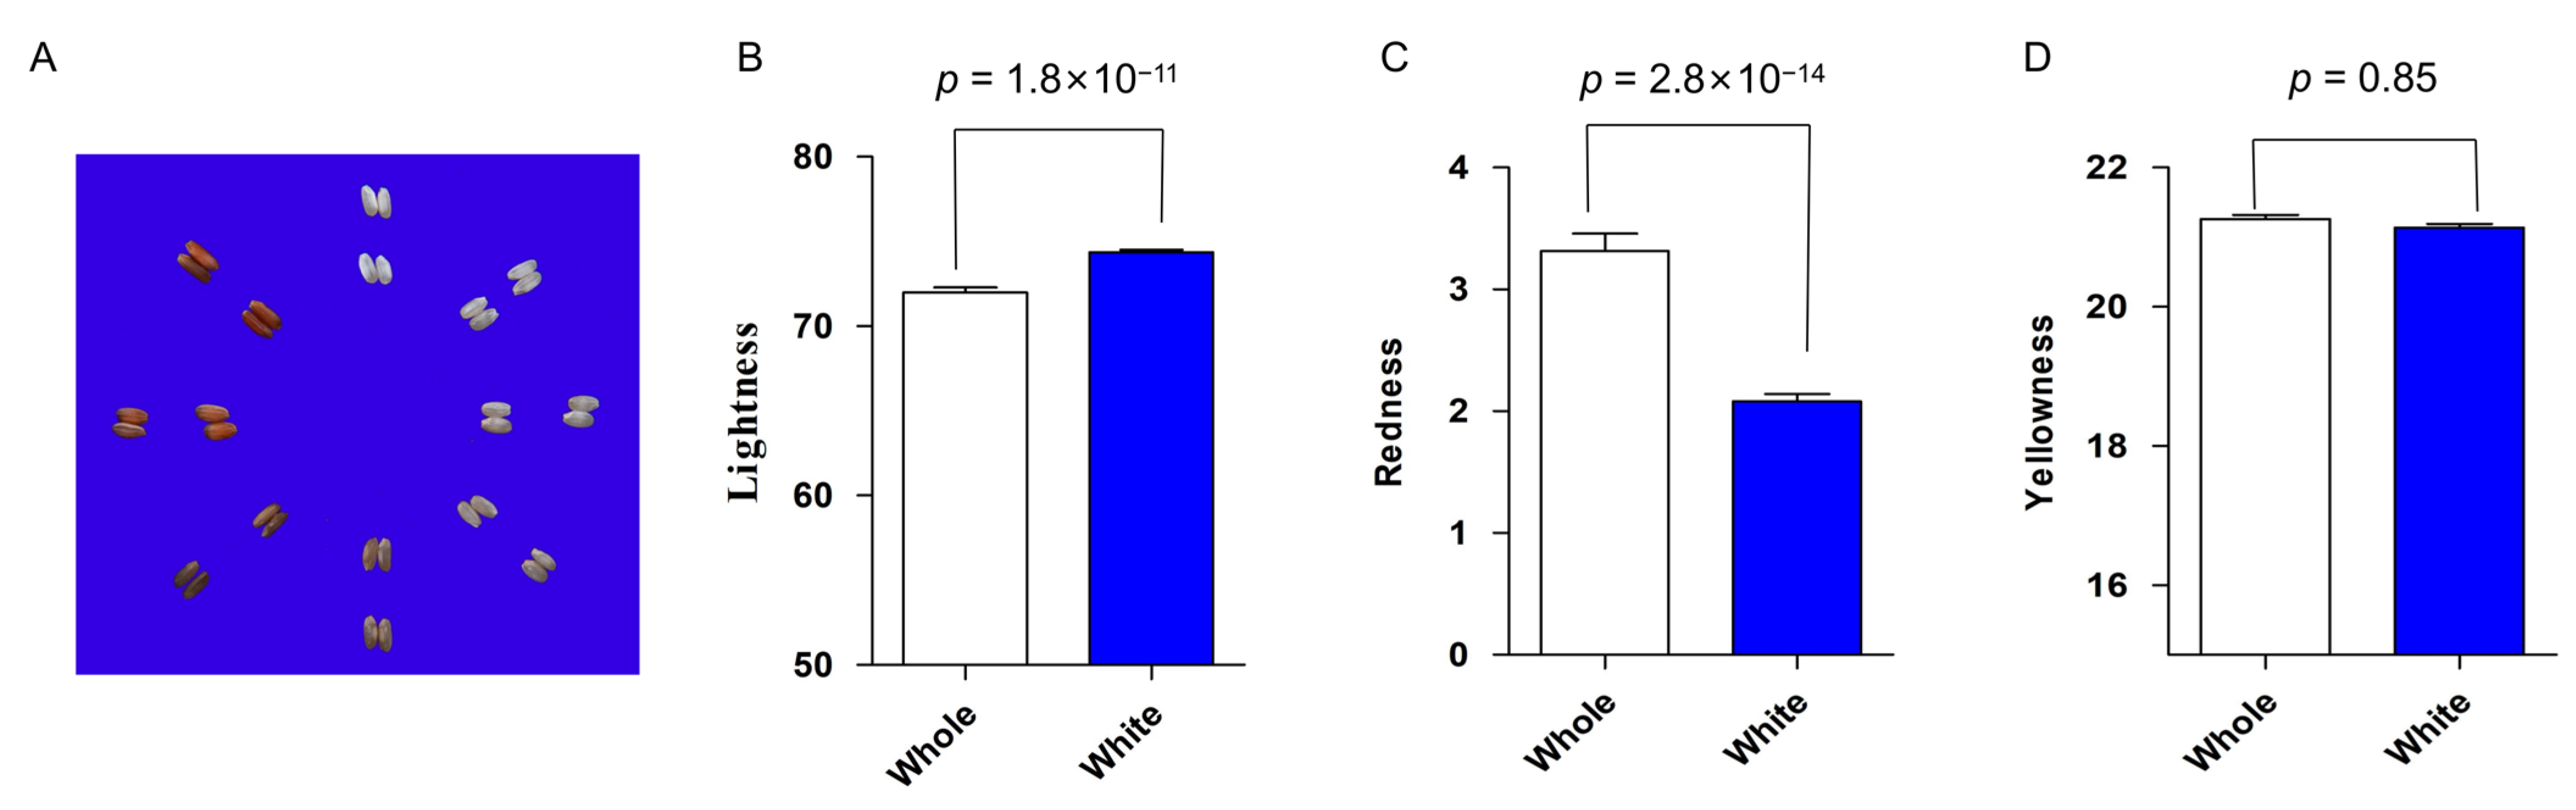
2.1. Large Variation in Rice Grain Color

A panel of 682 genome-sequenced rice accessions, including 597 white rice and 85 red or pigmented varieties, was divided into five groups (indica, japonica, Aus, Bas, and admix). Among them, 376 accessions belong to the indica group, and 202 varieties are classed into the japonica group. A principal component (PC) analysis of the population reveals that the first two PCs dominated the population structure and explained approximately 41.6% of the genetic variation (Figure 1A). In the population exists a large variance in grain color as reflected by the three parameters, ranging from 46.4 to 87.8 for brightness, from −7.5 to 16.7 for redness, and from 14.8 to 27.7 for yellowness (Figure 1B–D). In addition, brightness has a significant correlation with redness (r = −0.76, p < 0.0001), and yellowness is neither correlated with brightness nor redness. We observed significant differences in the two parameters brightness and redness among the five groups. The Aus group shows the significantly lowest mean value of brightness, while its mean value of redness is the highest of the five groups (Figure 1B,C). Notably, the whole population was also visually divided into white rice and red (or pigmented) rice, of which the white reveals a significantly higher mean value of brightness (74.2), a lower value of redness (2.2) than the whole with the pigmented (red) rice, but no significance in yellowness between the whole population and the white subpopulation (Figure 2A–D).

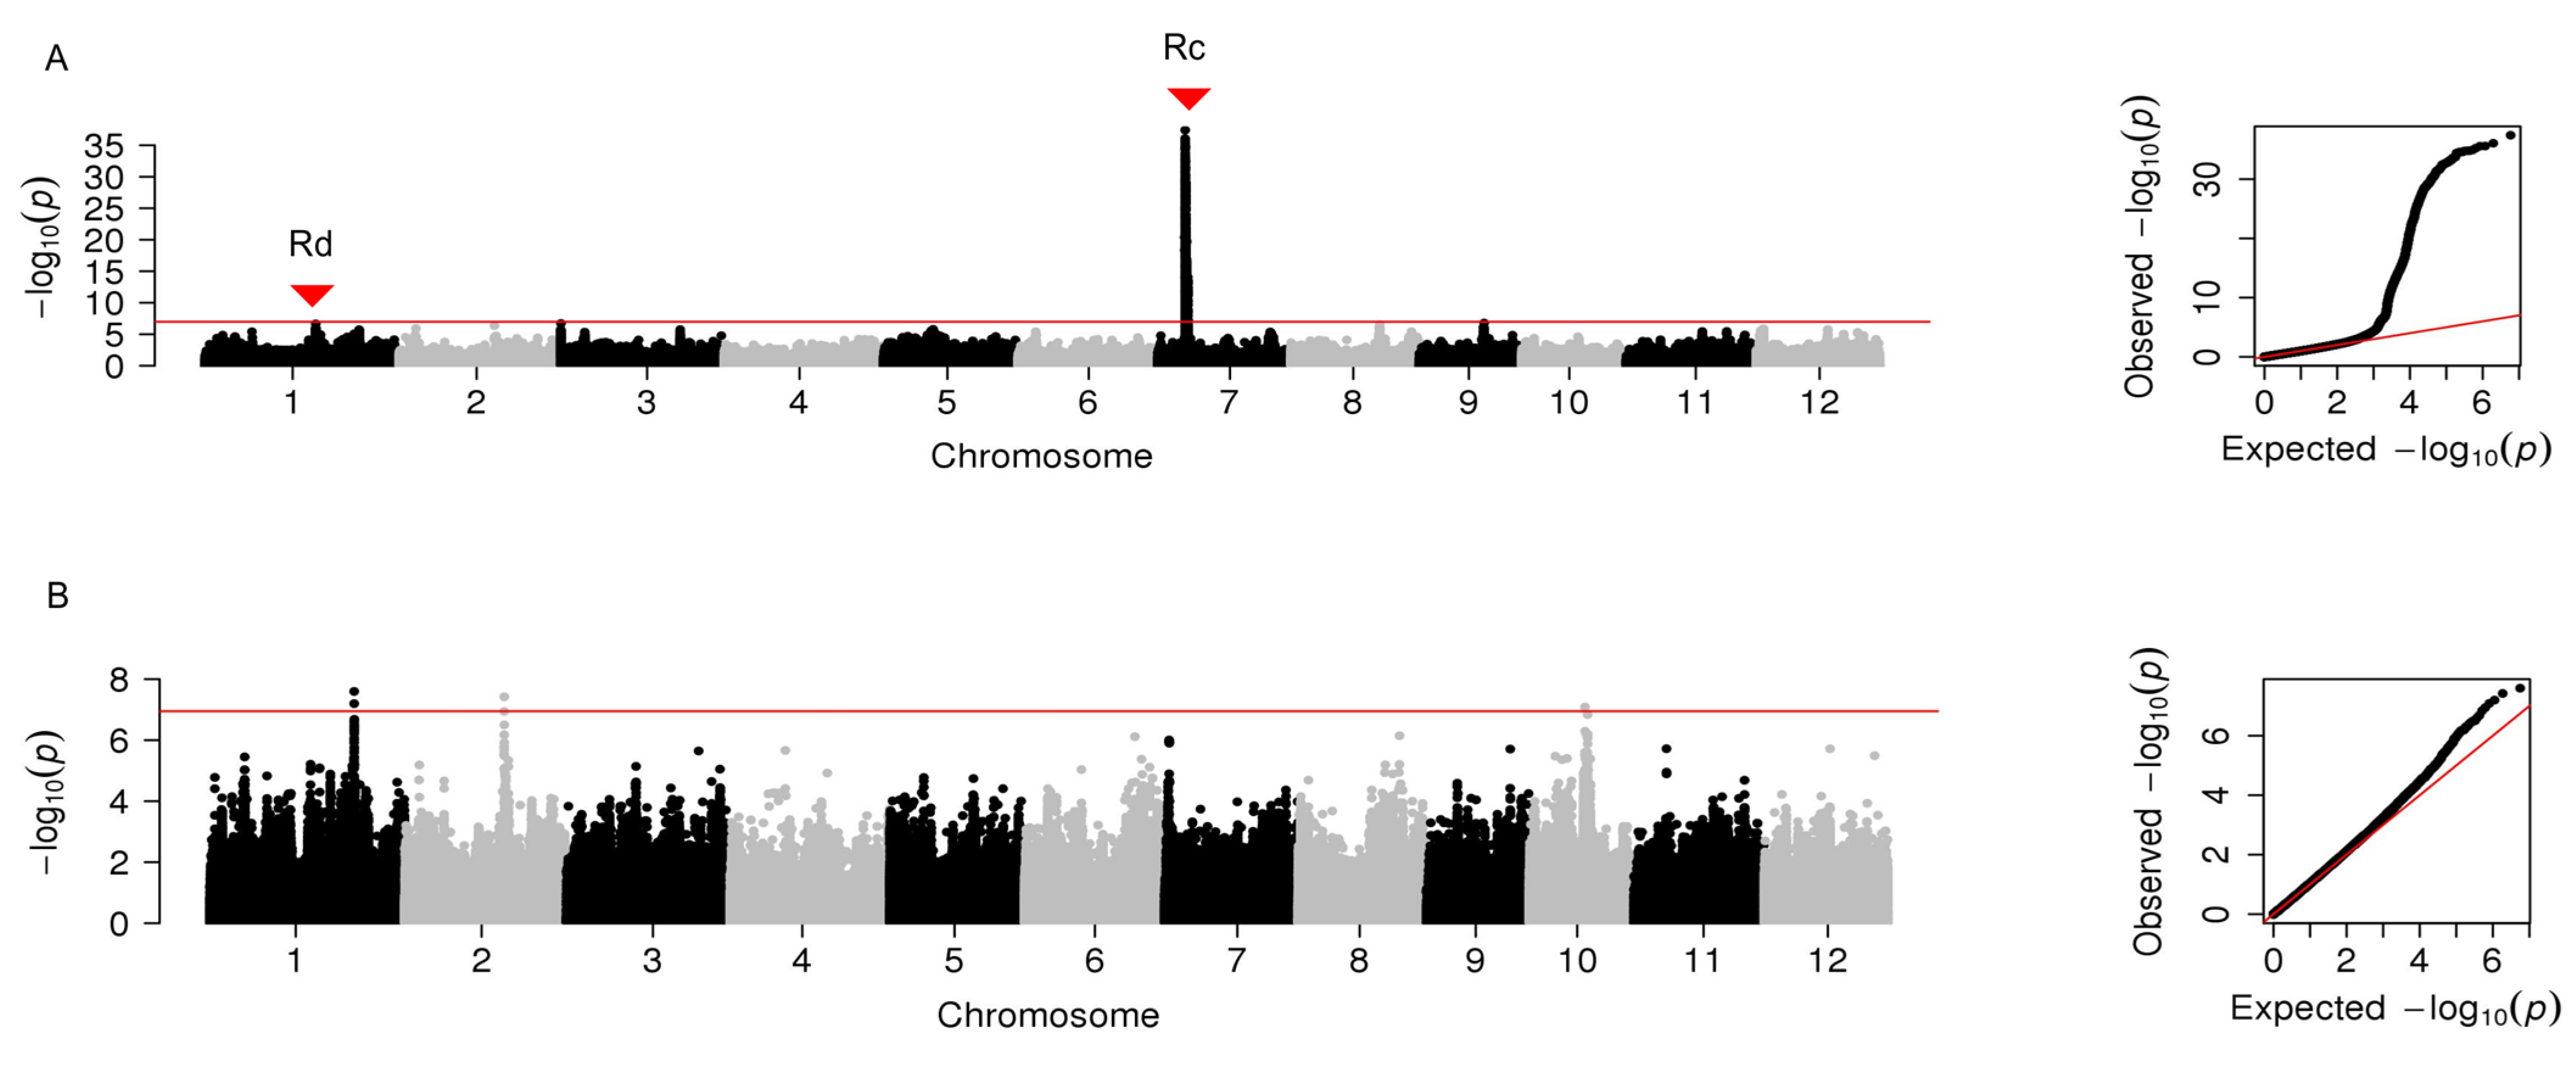
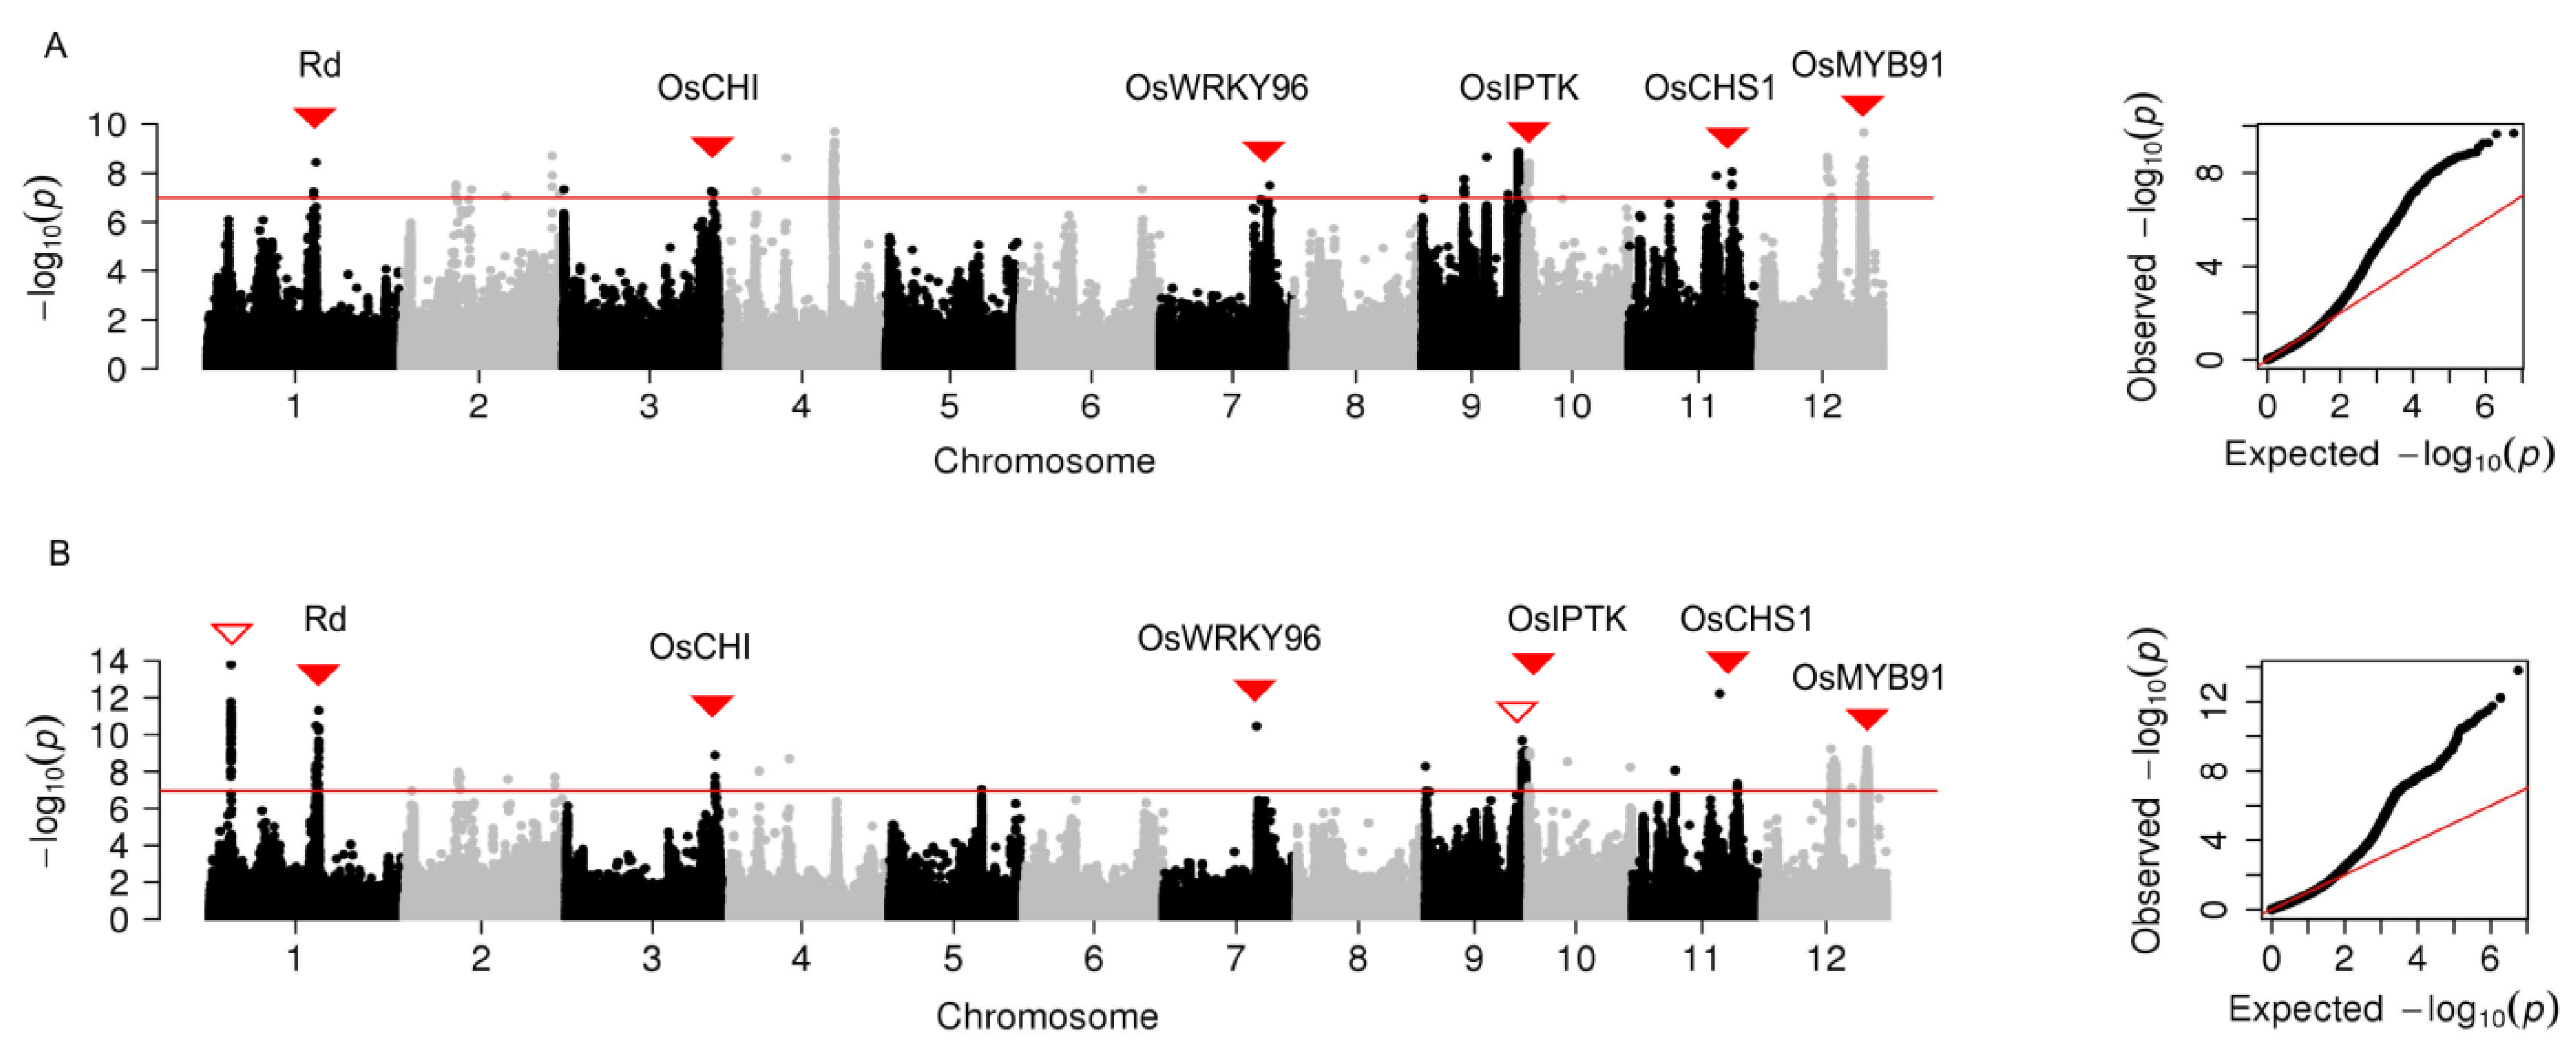
2.2. Genome-Wide Association Analysis of Grain Color

GWAS was performed for the three parameters of grain color in the whole population consisting of white and pigmented rice and in the subpopulation without the pigmented rice.
In the whole population, three significant peak SNPs were identified for brightness (L*) and distributed on chromosomes 1, 7, and 9, respectively (Figure 3A, Table S1). Among them, the peak SNP on chromosome 7 explained the largest phenotypic variation (39.3%); it overlapped with the previously reported gene Rc. The peak SNP on chromosome 1, nearby the Rd gene, explained phenotypic variation (0.9%).
In the subpopulation, three peak SNPs were significantly associated with brightness and located on chromosomes 1, 2, and 10, respectively (Figure 3B, Table S2). Notably, Rc and Rd were undetected in the subpopulation.
For the redness (a*), six peak SNPs were identified on chromosomes 2, 3, 6, 7, and 9, respectively. Among them, the peak SNPs on chromosome 6 overlapped with OsUGT and explained phenotypic variation (22.9%). The peak SNPs on chromosome 7 localized with Rc had the most considerable contribution to the phenotypic variation (42.2%) in the whole population (Figure 4A, Table S1). However, no locus with consecutive SNPs was identified for redness in the subpopulation that excluded pigmented rice (Figure 4B).
For the yellowness (b*), 17 significant peak SNPs were identified in the whole population (Table S1). Fifteen significant SNPs were detected in the subpopulation in which the pigmented accessions were removed (Table S2). Ten were found commonly in both populations (Tables S1 and S2). Among them, six peak regions were co-localized with the genes related to secondary metabolites, such as Os01g42460 (Rd), Os03g60509 (OsCHI), Os07g40570 (OsWRKY96), Os10g01480 (OsIPTK), and Os11g32650 (OsCHS1) for flavonoid metabolites, and Os12g38400 (OsMYB91) for phenolic metabolites (Figure 5). These genes involved in the synthesis of phenolamines and flavonoids may cause a pigment accumulation in the pericarp [3,30]. Intriguingly, four significant SNP regions were detected differently in either the whole population or the subpopulation. For example, one lead SNP (rs4708052) on chromosome 1 with the highest p-value (1.57 × 10⁻¹⁴) was identified in the subpopulation and explained approximately 3.5% of the yellowness variance (Figure 5B, Table S2). Another peak SNP (rs24028124) on chromosome 4 with a higher p-value was identified only in the whole population and explained approximately 4.5% of the yellowness variance (Figure 5A, Tables S1 and S2). These results indicate that some loci involved in grain yellowness assayed by yellowness may be independent of the previously reported genes for pigment accumulation.

2.3. Validation of the Effect of Lead SNP Regions on Grain Yellowness

To verify the effects of the peak SNPs (rs4708052 on chromosome 1 and rs21614928 on chromosome 9) identified for grain yellowness in the subpopulation, we used a backcrossing scheme to generate near-isogenic lines (NILs) that contain only a single segment encompassing the SNPs of interest in the same background of ZS97. Two obtained NILs (N001 and N107) exhibited an apparent difference in grain color as reflected by redness and yellowness (Figure 6A and Figure 7A). The redness and yellowness values were significantly higher in the NILs than the control (ZS97), while no difference was observed in the brightness value against ZS97 (Figure 6B–D and Figure 7B–D), indicating that two peak SNP regions both influence grain yellowness.

2.4. Expression Analysis of Candidate Genes in Two Significant Regions

To identify potential candidate genes for the peak SNPs, we used the China Rice Data Center database to search annotated genes in a 200 kb region around the target SNPs (https://ricedata.cn/gene/, accessed on 1 November 2022). The genomic region (4.61–4.81 Mb) on chromosome 1 surrounding the peak SNP (rs4708052) contains 14 annotated genes. To narrow into the candidates, the expression profile across various tissues was analyzed (http://rice.uga.edu/cgi-bin/gbrowse/rice/, accessed on 1 December 2022). The results exhibited that Os01g09246, Os01g09260, and Os01g09280 were predominantly expressed in young seeds at 5 and 10 days after pollination (DAP) and in the 25 DAP endosperm (Figure 6E). Further analysis of three major haplotypes (n > 34) of the genes based on their sequence variation (http://ricevarmap.ncpgr.cn/, accessed on 1 December 2022) revealed significant differences in yellowness between these haplotypes. Hap1 of Os01g09246 and Os01g09260 dominated in japonica and exhibited significantly higher yellowness values than the other two haplotypes, which dominated in indica (Figure 6F), whereas the gene Os01g09280 had no significant difference between Hap1 and Hap2. Therefore, the former two genes (Os01g09246 and Os01g09260) specifically expressed in seeds may be the most likely candidates affecting flavonoid synthesis that cause differences in pericarp color.
Similar analyses were performed for the peak SNP region (21.51–21.71 Mb) on chromosome 9. This region contains 34 annotated genes. The expression profile revealed that the two genes, Os09g37520 and Os09g37610, were highly expressed in 5 DAP and 10 DAP young seeds (Figure 7E). Os09g37520 has three major haplotypes in the whole population, but there is no significant difference in grain yellowness among the three haplotypes (Figure 7F). This gene encodes a DUF-containing protein, which contains a bZIP domain that promotes proanthocyanidin synthesis [31]. Os09g37610 has two major haplotypes in the population, of which Hap1 is significantly higher yellowness compared to another haplotype (Figure 7F). The gene encodes a multidrug and toxin extrusion protein, which may be associated with anthocyanin transport [32].

2.5. Metabolite Analysis of Pooled Samples with Different Grain Colors

To determine whether some metabolites influence rice grain color, we selected 40 accessions with extremely higher or lower yellowness values from the white subpopulation to construct two extreme pools, each containing 20 samples for metabolite analysis (Figure 8A). The extremely high pool had the yellowness values ranging from 23.7 to 25.5, while the low pool had the yellowness values ranging from 17.7 to 18.9. The metabolic analysis of the two pools using liquid chromatography-mass spectrometry revealed 36 differentially expressed metabolites (Figure 8B). These metabolites were enriched on lipids (75.0%), flavonoids (11.1%), and terpenoids (8.3%). Most (28/36) of the differentially expressed metabolites were up-regulated in the high yellowness pool.
Intriguingly, some key secondary metabolites such as chrysoeriol-O-feruloylhexoside, C-hexosyl-apigenin-O-feruloylhexoside, p-Coumaroyl-2-hydroxyputrescine, and ferulic acid were up-regulated by one-fold or more in the high yellowness pool compared to the low pool. In line with these data, the peak SNP region harboring Os09g37520 and Os09g37610 overlapped with the previously reported locus for C-pentosyl-chrysoeriol O-feruloylhexoside accumulation [30].

3. Discussion

Whole grain rice, particularly pigmented (red, purple, and black) rice, is becoming increasingly popular due to its high nutritional value and potential health benefits compared with milled or polished rice [3,5]. Most whole grain rice is white or non-pigmented rice. Even so, it is still rich in nutrients, such as protein, fiber, oils, minerals, and functional metabolites, and has a wide variance in grain color that significantly influence consumer acceptance. However, the genetic basis of grain color variation remains elusive. In the present study, 26 peak SNPs or loci were identified for grain colors in 682 rice accessions using a GWAS approach, indicating that rice grain color is a complex phenotype under polygenic control. Compared with the GWAS results from rice grain color in the whole population and the non-pigmented population (Tables S1 and S2), we found that grain brightness and grain redness assayed by the parameters L* and a* are controlled mainly by Rc, which regulates proanthocyanidin synthesis [20]. Grain yellowness assayed by b* is largely affected by minor genes, each explaining phenotypic variation of less than 5% (Figure 5, Table S2). Moreover, GWAS revealed ten significant peak SNPs or loci identified in common for yellowness in the populations no matter whether pigmented rice contained them or not. These results suggest that the expression of the minor genes for yellowness may be independent of the Rc regulatory pathway. Rc was reported as a domesticated or selected gene. The mutant rc was fixed in approximately 97% of white rice [20,21]. Therefore, it is comprehensible that only a few loci identified for redness in the white rice, as a small part of the redness variation was retained. In contrast, the yellowness of rice grains was neither selected for nor received any attention during rice domestication, which led to an unexpected large variance in yellowness in rice. Consistent with this case, several SNPs are identified associated with yellowness in rice germplasms.
In the present study, genomic tools including GWAS, transcription profile, and metabolite analysis were applied to identify significant loci and candidate genes for grain color. The combined analyses largely enhance the precision of SNP identification and narrow down candidate genes directly. In this context, numerous loci with candidate genes were identified in the population of pigmented and white rice, several of them co-localizing with the previously reported genes involved in the anthocyanin or proanthocyanidin synthesis pathway, such as Rc, OsCHI, OsMYB91, and OsWRKY96 [3,30,33,34]. Meanwhile, many were not reported before (Table S2). In particular, using the GWAS and NIL validation, we verified the effects of two novel peak SNPs or genomic regions on chromosomes 1 and 9 for grain color. We could nominate three potential candidate genes of these loci for grain yellowness variation through gene expression profiles, haplotype analysis, and pooled metabolite analysis. These results will help in further transgenic experiments to functionally characterize the gene(s) responsible for the variation in grain color. In addition, we found significant differences in the contents of 36 metabolic components between the two groups pooled on extreme yellowness values, most of which are flavonoids and lipids. The higher flavonoids or lipids may contribute to strong grain yellowness reflected by the higher value of the parameter b*. Previous studies revealed that the content of flavonoids was significantly correlated with the color of rice grain [35], and phenolic metabolites and flavonoids in colored rice were more than twice that of white rice [36]. Taken together, our results suggest that a wide variance of particular metabolic components exists in the pericarp or bran layers, leading to the change from white and light-colored to brown in non-pigmented rice.
Currently, as most customers prefer white rice, the cultivated high-yielding rice varieties generally have white pericarps. To meet the challenge of increasing demand for nutritional quality, it has become a priority in breeding programs to develop whole grain rice varieties with beneficial nutrients, good palatability, and favorable pericarp color [37]. Our findings provide some important insights into the genetic basis of rice grain color and the identification and manipulation of novel genes for appropriate color values of brightness, redness, and yellowness. In this context, the pyramiding of genes increased brightness and decreased yellowness, which may be an option designed to develop desirable white whole grain rice. Further exploration of natural germplasms with desired metabolites and creating molecular markers of target genes will facilitate employing genomic breeding approaches to develop whole grain rice varieties with high nutritious and commercial qualities.

4. Materials and Methods

4.1. Plant Materials

A panel of 682 rice accessions from 3K RGP was used for GWAS (Wang et al. 2018). Based on their genomic variation, the population was divided into five subgroups, Indica or Xian (376), Japonica or Geng (202), Aus (77), Admix (22), and Bas (5). Near-isogenic lines (NILs) that carry a particular single genomic segment of interest were constructed previously using a marker-assisted selection backcross scheme, in which the recurrent recipient was indica variety Zhenshan 97 (ZS97) and the donor was japonica variety Nipponbare (NIP). Briefly, ZS97 was crossed with NIP, and the F1 was backcrossed with ZS97 four times to the BC4F1 generation. At BC4F2, the NILs carrying a particular introduced segment in the similar ZS97 background were selected using an Infinium RICE6K array containing 5102 SNPs [38]. The plant materials were cultivated in the experimental field at Wuhan (30.4° N, 114.2° E).

4.2. Measurement of Grain Colors

Seeds for rice accession were fresh-harvested and dried naturally, then stored in the dark at 4 °C until use. About 20 g of healthy seeds were dehulled with a rice huller (JLG-II, Institute of Grain Storage, Chengdu, China) to produce brown rice. Grain color was measured with a color difference meter (CR400, Konica Minolta, Japan). System color correction was standardized using the black and white plate provided by the CR400 instrument, with five repeated measurements for each sample. Color parameters were expressed as L*, a*, and b* values. L* is defined as the brightness or lightness index, indicating black and white, 0 is black, 100 is white, and between 0–100 is gray; a* indicates the range from red to green, and the positive value is red and the negative value is green; b* represents the range from blue to yellow, and the positive value is yellow and negative value is blue [23,25].

4.3. Genome-Wide Association Analysis

Genome-wide association analysis was performed as described in the previous study by using the 32 M SNP dataset. Briefly, the 32 M SNP dataset was downloaded from 3K RGP in the RFGB 2.0 dataset [39]. SNPs were filtered using the criteria of having less than 20% of missing data and minor allele frequency (MAF) >0.05. A total of 75,329 independent SNPs were obtained, and ADMIXTURE and GCTA software were used to analyze the population structure and principle component in the panel of rice accessions [40]. To detect trait–SNP associations for grain color, 448,430 high-quality SNPs were used in SVS software package v8.4.0 with a mixed linear model [41]. R-package (https://cran.r-project.org/package=qqman, accessed on 1 November 2022) was used to produce Manhattan and quantile-quantile plots. The threshold to declare the significant association was set as 2.23 × 10⁻⁶.

4.4. Expression Profile Analysis

Expression data of candidate genes were downloaded from the Rice Genome Annotation Project database (http://rice.uga.edu/cgi-bin/gbrowse/rice/, accessed on 10 November 2022) for analysis. The tissues include the seedling shoot, leaf, and young seeds, the embryo (em), and endosperm (en) at 5, 10, or 25 days after pollination (DAP). Data were log10-transformed for statistical analysis to improve normality. A heatmap for various tissue data was performed by using a heatmap package in MetaboAnalyst (https://www.metaboanalyst.ca/, accessed on 15 November 2022).

4.5. Metabolite Determination

Metabolite extraction was performed according to the method described previously [42]. Briefly, approximately 0.1 g of brown rice powder was extracted overnight at 4 °C with 1.0 mL of 70% aqueous methanol. After centrifuging at 12,000 rpm for 10 min, the supernatant was filtered using a syringe-facilitated 13 mm diameter nylon filter with a pore size of 0.22 μm (SCAA-104, Shanghai, China). The filtrate was dried under nitrogen gas for approximately 4 h at room temperature, and then dissolved in 200 μL of methanol. A liquid chromatography-mass spectrometry (LC-MS) system (LCMS-8060, Kyoto, Japan) was used for the relative quantification of metabolites. Metabolite data were log2-transformed for statistical analysis to improve normality. Student’s t-test was used to determine differentially present metabolites between the extreme pools at p < 0.05 with absolute log2 FC (fold change) ≥1. Heatmap for differentially present metabolites was performed in OmicStudio tools (https://www.omicstudio.cn/tool, accessed on 10 November 2022).

5. Conclusions

This study found large variations in three parameters of grain color in a panel of rice germplasms. Grain brightness and redness are mainly controlled by Rc, while grain yellowness is affected by numerous minor-effect genes. Six loci are co-localized or overlapped with the genes related to flavonoid metabolites. Eight loci are newly identified to be associated with grain color in the non-pigmented rice, of which three candidate genes, Os01g09246, Os01g09260, and Os09g37610, are mined for grain yellowness by genome-wide association analysis combined with transcription profile and pooled metabolic analysis. These results shed light on the genetic basis of grain color and facilitate exploring favorable genes and developing whole grain rice varieties with high nutritious and desirable commercial qualities through molecular breeding strategies.

Supplementary Materials

The following supporting information can be downloaded at: https://www.mdpi.com/article/10.3390/plants12040927/s1. Table S1: Significant SNPs associated with three parameters of rice grains in the whole population identified by genome-wide association study. Table S2: Significant SNPs associated with three parameters of rice grains in the subpopulation identified by genome-wide association study.

Author Contributions

Conceptualization, S.Y.; methodology, W.W., X.Q., F.Z. and Z.W.; software, X.Q. and W.W.; validation, S.Y., X.Q. and W.W.; formal analysis, W.W., X.Q. and W.S.; investigation, W.W., Z.W. and T.X.; resources, X.Q.; data curation, W.W., X.Q. and J.X.; writing—original draft preparation, W.W. and X.Q.; writing—review and editing, S.Y. and W.W.; funding acquisition, S.Y. All authors have read and agreed to the published version of the manuscript.

Funding

This research was funded by the National Natural Science Foundation of China (No. 31971864), Wuhan Science and Technology Major Project (No. 2022021302024850), and the Earmarked Fund for China Agriculture Research System (CARS-01).

Data Availability Statement

The datasets supporting the conclusions of this article are included within the article (and its Additional Files).

Conflicts of Interest

The authors declare no conflict of interest. The funder had no role in the design of the study; in the collection, analyses, or interpretation of data; in the writing of the manuscript; or in the decision to publish the results.

References

  1. Shao, Y.; Hu, Z.; Yu, Y.; Mou, R.; Zhu, Z.; Beta, T. Phenolic acids, anthocyanins, proanthocyanidins, antioxidant activity, minerals and their correlations in non-pigmented, red, and black rice. Food Chem. 2018, 239, 733–741. [Google Scholar] [CrossRef] [PubMed]
  2. Bouis, H.E.; Chassy, B.M.; Ochanda, J.O. Genetically modified food crops and their contribution to human nutrition and food quality. Trends Food Sci. Technol. 2003, 14, 191–209. [Google Scholar] [CrossRef]
  3. Mbanjo, E.G.N.; Kretzschmar, T.; Jones, H.; Ereful, N.; Blanchard, C.; Boyd, L.A.; Sreenivasulu, N. The Genetic Basis and Nutritional Benefits of Pigmented Rice Grain. Front. Genet. 2020, 11, 229. [Google Scholar] [CrossRef] [PubMed] [Green Version]
  4. Mir, S.A.; Shah, M.A.; Bosco, S.J.D.; Sunooj, K.V.; Farooq, S. A review on nutritional properties, shelf life, health aspects, and consumption of brown rice in comparison with white rice. Cereal Chem. 2020, 97, 895–903. [Google Scholar] [CrossRef]
  5. Brotman, Y.; Llorente-Wiegand, C.; Oyong, G.; Badoni, S.; Misra, G.; Anacleto, R.; Parween, S.; Pasion, E.; Tiozon, R.N.; Anonuevo, J.J.; et al. The genetics underlying metabolic signatures in a brown rice diversity panel and their vital role in human nutrition. Plant J. 2021, 106, 507–525. [Google Scholar] [CrossRef]
  6. Gondal, T.A.; Keast, R.S.J.; Shellie, R.A.; Jadhav, S.R.; Gamlath, S.; Mohebbi, M.; Liem, D.G. Consumer Acceptance of Brown and White Rice Varieties. Foods 2021, 10, 1950. [Google Scholar] [CrossRef]
  7. Kim, T.; Kim, S.; Park, Y.; Lim, S.-H.; Ha, S.-H.; Park, S.; Lee, B.; Kim, J. Metabolite Profiling Reveals Distinct Modulation of Complex Metabolic Networks in Non-Pigmented, Black, and Red Rice (Oryza sativa L.) Cultivars. Metabolites 2021, 11, 367. [Google Scholar] [CrossRef]
  8. Zhao, D.; Zhang, C.; Li, Q.; Liu, Q. Genetic control of grain appearance quality in rice. Biotechnol. Adv. 2022, 60, 108014. [Google Scholar] [CrossRef]
  9. Zhuang, H.; Lou, Q.; Liu, H.; Han, H.; Wang, Q.; Tang, Z.; Ma, Y.; Wang, H. Differential Regulation of Anthocyanins in Green and Purple Turnips Revealed by Combined De Novo Transcriptome and Metabolome Analysis. Int. J. Mol. Sci. 2019, 20, 4387. [Google Scholar] [CrossRef] [Green Version]
  10. Shih, C.H.; Chu, H.; Tang, L.K.; Sakamoto, W.; Maekawa, M.; Chu, I.K.; Wang, M.; Lo, C. Functional characterization of key structural genes in rice flavonoid biosynthesis. Planta 2008, 228, 1043–1054. [Google Scholar] [CrossRef]
  11. Han, Y.Y.; Wang, J.W.; Han, N.; Liu, Q.J.; Liu, T.M.; Guan, F.M.; Ming, F. Duplication and sequence divergence of rice chalcone synthase genes. Russ. J. Plant Physiol. 2009, 56, 417–422. [Google Scholar] [CrossRef]
  12. Cheng, A.-X.; Han, X.-J.; Wu, Y.-F.; Lou, H.-X. The Function and Catalysis of 2-Oxoglutarate-Dependent Oxygenases Involved in Plant Flavonoid Biosynthesis. Int. J. Mol. Sci. 2014, 15, 1080–1095. [Google Scholar] [CrossRef] [PubMed] [Green Version]
  13. Sun, X.; Zhang, Z.; Chen, C.; Wu, W.; Ren, N.; Jiang, C.; Yu, J.; Zhao, Y.; Zheng, X.; Yang, Q.; et al. The C–S–A gene system regulates hull pigmentation and reveals evolution of anthocyanin biosynthesis pathway in rice. J. Exp. Bot. 2018, 69, 1485–1498. [Google Scholar] [CrossRef] [PubMed] [Green Version]
  14. Lap, B.; Rai, M.; Tyagi, W. Playing with colours: Genetics and regulatory mechanisms for anthocyanin pathway in cereals. Biotechnol. Genet. Eng. Rev. 2021, 37, 1–29. [Google Scholar] [CrossRef] [PubMed]
  15. Wang, C.; Shu, Q. Fine mapping and candidate gene analysis of purple pericarp gene Pb in rice (Oryza sativa L.). Chin. Sci. Bull. 2007, 52, 3097–3104. [Google Scholar] [CrossRef]
  16. Rahman, M.; Lee, K.E.; Lee, E.S.; Matin, M.N.; Lee, D.S.; Yun, J.S.; Kim, J.B.; Kang, S.G. The genetic constitutions of complementary genes Pp and Pb determine the purple color variation in pericarps with cyanidin-3-O-glucoside depositions in black rice. J. Plant Biol. 2013, 56, 24–31. [Google Scholar] [CrossRef]
  17. Maeda, H.; Yamaguchi, T.; Omoteno, M.; Takarada, T.; Fujita, K.; Murata, K.; Iyama, Y.; Kojima, Y.; Morikawa, M.; Ozaki, H.; et al. Genetic dissection of black grain rice by the development of a near isogenic line. Breed. Sci. 2014, 64, 134–141. [Google Scholar] [CrossRef] [PubMed] [Green Version]
  18. Zheng, J.; Wu, H.; Zhao, M.; Yang, Z.; Zhou, Z.; Guo, Y.; Lin, Y.; Chen, H. OsMYB3 is a R2R3-MYB gene responsible for anthocyanin biosynthesis in black rice. Mol. Breed. 2021, 41, 51. [Google Scholar] [CrossRef]
  19. Oikawa, T.; Maeda, H.; Oguchi, T.; Yamaguchi, T.; Tanabe, N.; Ebana, K.; Yano, M.; Ebitani, T.; Izawa, T. The Birth of a Black Rice Gene and Its Local Spread by Introgression. Plant Cell 2015, 27, 2401–2414. [Google Scholar] [CrossRef] [Green Version]
  20. Sweeney, M.T.; Thomson, M.J.; Pfeil, B.E.; McCouch, S. Caught Red-Handed:RcEncodes a Basic Helix-Loop-Helix Protein Conditioning Red Pericarp in Rice. Plant Cell 2006, 18, 283–294. [Google Scholar] [CrossRef] [PubMed] [Green Version]
  21. Furukawa, T.; Maekawa, M.; Oki, T.; Suda, I.; Iida, S.; Shimada, H.; Takamure, I.; Kadowaki, K.-I. The Rc and Rd genes are involved in proanthocyanidin synthesis in rice pericarp. Plant J. 2006, 49, 91–102. [Google Scholar] [CrossRef] [PubMed]
  22. Wang, J.; Deng, Q.; Li, Y.; Yu, Y.; Liu, X.; Han, Y.; Luo, X.; Wu, X.; Ju, L.; Sun, J.; et al. Transcription Factors Rc and OsVP1 Coordinately Regulate Preharvest Sprouting Tolerance in Red Pericarp Rice. J. Agric. Food Chem. 2020, 68, 14748–14757. [Google Scholar] [CrossRef]
  23. Tan, Y.F.; Sun, M.; Xing, Y.Z.; Hua, J.P.; Sun, X.L.; Zhang, Q.F.; Corke, H. Mapping quantitative trait loci for milling quality, protein content and color characteristics of rice using a recombinant inbred line population derived from an elite rice hybrid. Theor. Appl. Genet. 2001, 103, 1037–1045. [Google Scholar] [CrossRef]
  24. Jin, L.; Xiao, P.; Lu, Y.; Shao, Y.; Shen, Y.; Bao, J. Quantitative Trait Loci for Brown Rice Color, Phenolics, Flavonoid Contents, and Antioxidant Capacity in Rice Grain. Cereal Chem. 2009, 86, 609–615. [Google Scholar] [CrossRef]
  25. Shao, Y.; Jin, L.; Zhang, G.; Lu, Y.; Shen, Y.; Bao, J. Association mapping of grain color, phenolic content, flavonoid content and antioxidant capacity in dehulled rice. Theor. Appl. Genet. 2010, 122, 1005–1016. [Google Scholar] [CrossRef] [PubMed]
  26. Zhong, H.; Liu, S.; Zhao, G.; Zhang, C.; Peng, Z.; Wang, Z.; Yang, J.; Li, Y. Genetic Diversity Relationship Between Grain Quality and Appearance in Rice. Front. Plant Sci. 2021, 12, 708996. [Google Scholar] [CrossRef]
  27. Yang, W.; Chen, L.; Zhao, J.; Wang, J.; Li, W.; Yang, T.; Dong, J.; Ma, Y.; Zhou, L.; Chen, J.; et al. Genome-Wide Association Study of Pericarp Color in Rice Using Different Germplasm and Phenotyping Methods Reveals Different Genetic Architectures. Front. Plant Sci. 2022, 13, 841191. [Google Scholar] [CrossRef] [PubMed]
  28. Lee, J.-S.; Sreenivasulu, N.; Hamilton, R.S.; Kohli, A. Brown Rice, a Diet Rich in Health Promoting Properties. J. Nutr. Sci. Vitaminol. 2019, 65, S26–S28. [Google Scholar] [CrossRef] [Green Version]
  29. Oh, J.-H.; Lee, Y.-J.; Byeon, E.-J.; Kang, B.-C.; Kyeoung, D.-S.; Kim, C.-K. Whole-genome resequencing and transcriptomic analysis of genes regulating anthocyanin biosynthesis in black rice plants. 3 Biotech 2018, 8, 115. [Google Scholar] [CrossRef] [Green Version]
  30. Chen, W.; Gao, Y.; Xie, W.; Gong, L.; Lu, K.; Wang, W.; Li, Y.; Liu, X.; Zhang, H.; Dong, H.; et al. Genome-wide association analyses provide genetic and biochemical insights into natural variation in rice metabolism. Nat. Genet. 2014, 46, 714–721. [Google Scholar] [CrossRef]
  31. Yi, D.; Zhang, H.; Lai, B.; Liu, L.; Pan, X.; Ma, Z.; Wang, Y.; Xie, J.; Shi, S.; Wei, Y. Integrative Analysis of the Coloring Mechanism of Red Longan Pericarp through Metabolome and Transcriptome Analyses. J. Agric. Food Chem. 2020, 69, 1806–1815. [Google Scholar] [CrossRef] [PubMed]
  32. Zhao, J.; Huhman, D.; Shadle, G.; He, X.-Z.; Sumner, L.W.; Tang, Y.; Dixon, R.A. MATE2 Mediates Vacuolar Sequestration of Flavonoid Glycosides and Glycoside Malonates in Medicago truncatula. Plant Cell 2011, 23, 1536–1555. [Google Scholar] [CrossRef] [PubMed] [Green Version]
  33. Chen, C.; Zhou, G.; Chen, J.; Liu, X.; Lu, X.; Chen, H.; Tian, Y. Integrated Metabolome and Transcriptome Analysis Unveils Novel Pathway Involved in the Formation of Yellow Peel in Cucumber. Int. J. Mol. Sci. 2021, 22, 1494. [Google Scholar] [CrossRef] [PubMed]
  34. Xia, D.; Zhou, H.; Wang, Y.; Li, P.; Fu, P.; Wu, B.; He, Y. How rice organs are colored: The genetic basis of anthocyanin biosynthesis in rice. Crop J. 2021, 9, 598–608. [Google Scholar] [CrossRef]
  35. Ham, T.-H.; Kwon, S.W.; Ryu, S.-N.; Koh, H.-J. Correlation Analysis between Grain Color and Cyanidin-3-glucoside Content of Rice Grain in Segregate Population. Plant Breed. Biotechnol. 2015, 3, 160–166. [Google Scholar] [CrossRef] [Green Version]
  36. Min, B.; Gu, L.; McClung, A.M.; Bergman, C.J.; Chen, M.-H. Free and bound total phenolic concentrations, antioxidant capacities, and profiles of proanthocyanidins and anthocyanins in whole grain rice (Oryza sativa L.) of different bran colours. Food Chem. 2012, 133, 715–722. [Google Scholar] [CrossRef]
  37. Yu, S.; Ali, J.; Zhou, S.; Ren, G.; Xie, H.; Xu, J.; Yu, X.; Zhou, F.; Peng, S.; Ma, L.; et al. From Green Super Rice to green agriculture: Reaping the promise of functional genomics research. Mol. Plant 2021, 15, 9–26. [Google Scholar] [CrossRef]
  38. Sun, W.Q.; Zhou, Q.L.; Yao, Y.; Qiu, X.J.; Xie, K.; Yu, S.B. Identification of genomic regions and the isoamylase gene for reduced grain chalkiness in rice. PLoS ONE 2015, 10, e0122013. [Google Scholar] [CrossRef]
  39. Wang, C.; Yu, H.; Huang, J.; Wang, W.; Faruquee, M.; Zhang, F.; Zhao, X.; Fu, B.; Chen, K.; Zhang, H.; et al. Towards a deeper haplotype mining of complex traits in rice with RFGB v2.0. Plant Biotechnol. J. 2019, 18, 14–16. [Google Scholar] [CrossRef] [Green Version]
  40. Wang, W.; Zhang, F.; Liu, D.; Chen, K.; Du, B.; Qiu, X.; Xu, J.; Xing, D. Distribution characteristics of selenium, cadmium and arsenic in rice grains and their genetic dissection by genome-wide association study. Front. Genet. 2022, 13, 1007896. [Google Scholar] [CrossRef] [PubMed]
  41. Qiu, X.; Yang, J.; Zhang, F.; Niu, Y.; Zhao, X.; Shen, C.; Chen, K.; Teng, S.; Xu, J. Genetic dissection of rice appearance quality and cooked rice elongation by genome-wide association study. Crop J. 2021, 9, 1470–1480. [Google Scholar] [CrossRef]
  42. Chen, W.; Gong, L.; Guo, Z.; Wang, W.; Zhang, H.; Liu, X.; Yu, S.; Xiong, L.; Luo, J. A Novel Integrated Method for Large-Scale Detection, Identification, and Quantification of Widely Targeted Metabolites: Application in the Study of Rice Metabolomics. Mol. Plant 2013, 6, 1769–1780. [Google Scholar] [CrossRef] [PubMed] [Green Version]
Figure 1. Principal component analysis (PC) of rice accessions based on single nucleotide polymorphisms indicates the population structure with five major groups. (A) PC analysis shows two main components; (BD) brightness, redness, and yellowness of grain color. Ind, Indica (Xian); Jap, Japonica (Geng); Aus, Aus group; Adm, admixture; Bas, Basmati group; n, number of accessions. The different lowercase letters above the boxplot indicate significant differences among the five groups by LSD test.
Plants 12 00927 g001
Figure 2. Genetic variation in grain color in rice germplasm. (A) Representative grain colors in the whole population, (B) brightness, (C) redness, (D) yellowness; p-values are given by Student’s t-test.
Plants 12 00927 g002
Figure 3. Manhattan plots of genome-wide association analysis for grain brightness in 12 chromosomes and quantile-quantile plots of p-values conducted in the whole population (A) and the subpopulation that excluded pigmented rice (B). The horizontal red line represents the significance threshold of p-value 2.23 × 10⁻⁶. Two cloned genes are indicated with solid triangles.
Plants 12 00927 g003
Figure 4. Manhattan plots of genome-wide association analysis for grain redness in 12 chromosomes and quantile-quantile plots of p-values conducted in the whole population (A) and the subpopulation that excluded pigmented rice (B). The horizontal red line represents the significance threshold of p-value 2.23 × 10⁻⁶. Two previously identified genes for flavonoid biosynthesis are indicated with solid triangles.
Plants 12 00927 g004
Figure 5. Manhattan plots of genome-wide association analysis for grain yellowness in 12 chromosomes and quantile-quantile plots of p-values conducted in the whole population (A) and the subpopulation that excluded pigmented rice (B). The horizontal red line represents the significance threshold of p-value 2.23 × 10⁻⁶. Several previously identified genes are indicated with solid triangles, and two novel candidate genes are highlighted with hollow triangles.
Plants 12 00927 g005
Figure 6. Validation of the effect of the peak region on grain color and candidate gene analysis of rs4708052 on chromosome 1. (A) Graphic genotype of NIL (N001) showing a single introduced segment containing the region of interest covering the candidate genes. (BD) Three parameters of grain color of ZS97 and NIL; p-values are given by Student’s t-test. (E) Expression profile of candidate genes in various tissues including seedling shoot, leaf, and young seeds, embryo (em), endosperm (en) at 5, 10, or 25 days after pollination (DAP). (F) Schematic candidate genes with sequence variations indicated and significant differences in the mean values of grain color (column b*) between main haplotypes (Hap); n, number of accessions; different letters appended to the mean ± SD indicate significance at p < 0.05.
Plants 12 00927 g006
Figure 7. Validation of the effect of peak region on grain color and candidate gene analysis of rs21614928 on chromosome 9. (A) Graphic genotype of NIL (N107) showing single introduced segment containing the particular region with candidate genes. (BD) Three parameters of grain color of ZS97 and NIL; p-values are given by Student’s t-test. (E) Expression profile of candidate genes in various tissues including seedling shoot, leaf, and young seeds, embryo (em), endosperm (en) at 5, 10, or 25 days after pollination (DAP). (F) Schematic candidate genes with sequence variations indicated and differences in the mean values of grain color (column b*) between main haplotypes (Hap); n, number of accessions; different letters appended to the mean ± SD indicate a significance at p < 0.05.
Plants 12 00927 g007
Figure 8. Metabolite analysis of two extreme samples pooled by yellowness. (A) Distribution of yellowness values in the subpopulation without pigmented rice, showing two pools with extremely low or high mean yellowness values. (B) Heatmap of differently expressed metabolites for the extreme pools. Three repeats for each pool (D and G pool) were conducted for metabolite analyses.
Plants 12 00927 g008
Disclaimer/Publisher’s Note: The statements, opinions and data contained in all publications are solely those of the individual author(s) and contributor(s) and not of MDPI and/or the editor(s). MDPI and/or the editor(s) disclaim responsibility for any injury to people or property resulting from any ideas, methods, instructions or products referred to in the content.

