Article

Phenology and Diversity of Weeds in the Agriculture and Horticulture Cropping Systems of Indian Western Himalayas: Understanding Implications for Agro-Ecosystems

1
Department of Ethnobotany, Institute of Botany, Ilia State University, Tbilisi 0162, Georgia
2
Department of Botany, Government Degree College (Women), Kupwara 193222, India
3
GIS Centre, Forest Research Institute (FRI), PO New Forest, Dehradun 248006, India
4
Institute of Food and Agricultural Sciences, University of Florida, Gainesville, FL 32962, USA
5
Department of Botany, University of Okara, Okara 56300, Pakistan
6
School of Public Health, University of California, Berkeley, 2121 Berkeley Way, Berkeley, CA 94704, USA
7
Department of Food Industries, Faculty of Agriculture, Damietta University, Damietta 34511, Egypt
8
Department of Plant Production, College of Food & Agriculture Sciences, King Saud University, P.O. Box 2460, Riyadh 11451, Saudi Arabia
*
Author to whom correspondence should be addressed.
Plants 2023, 12(6), 1222; https://doi.org/10.3390/plants12061222
Submission received: 14 February 2023 / Revised: 3 March 2023 / Accepted: 3 March 2023 / Published: 8 March 2023
(This article belongs to the Special Issue Ecology and Management of Invasive Plants)

Abstract

:
Weeds are a major threat to agriculture and horticulture cropping systems that reduce yield. Weeds have a better ability to compete for resources compared to the main crops of various agro-ecosystems and act as a major impediment in reducing overall yield. They often act as energy drains in the managed agroecosystems. We studied weed infestation for five different agro-ecosystems in the part of Indian Western Himalayas represented by paddy, maize, mustard, apple and vegetable orchards. Systematic random sampling was done to record flowering phenology and diversity of weeds during the assessment period 2015–2020. We recorded 59 weed species, taxonomically distributed among 50 genera in 24 families. The Asteraceae family has the most species (15% species), followed by Poaceae (14% species), and Brassicaceae (12% species). The Therophytes were the dominant life form followed by Hemicryptophytes. The majority of the weeds were shown to be at their most blooming in the summer (predominantly from June to July). The Shannon index based diversity of weeds ranged from 2.307–3.325 for the different agro-ecosystems. The highest number of weeds was in the horticulture systems (apple > vegetable) followed by agriculture fields (maize > paddy > mustard). Agriculture and horticulture cropping systems were distinguished using indicator species analysis, which was supported by high and significant indicator values for a number of species. Persicaria hydropiper, Cynodon dactylon, Poa annua, Stellaria media, and Rorippa palustris had the highest indicator value in agriculture cropping systems, while Trifolium repens, Phleum pratense, and Trifolium pratense had the highest indicator value in horticulture cropping systems. We found that eleven weed species were unique to apple gardens followed by nine in maize, four in vegetables, two in mustard and one in paddy fields. Spatial turnover (βsim) and nestedness-resultant components (βsne) of species dissimilarity revealed dissimilarity lower than 50% among the five cropping systems. The study is expected to assist in formulating an appropriate management strategy for the control of weed infestation in the study region.

1. Introduction

The vegetated land can broadly be categorized into forested and agricultural landscapes. In vegetated lands, weed invasion has been referred to as one of the prominent threats after climate change [1,2,3,4]. Weeds are a group of specialized plants that have evolved along temporal and spatial scales because of their large seed production, aggressive reproduction, high regenerative capacity, and large phenotypic plasticity [5]. The weed plants are considered unwanted and undesirable at a particular site [6,7]. Among the various biological stresses, weeds are known as one of the most detrimental to crop production [8,9]. In addition, these weeds provide shelter to numerous pests of crop plants and, thus, indirectly become a cause of many crop diseases [10]. Weeds are notorious for decreasing crop yield and are found to be economically more detrimental than bacteria, fungi, insects or other crop pests in many situations. For instance, it has been estimated that weeds result in about USD 11 billion of economic losses every year in India [11].
Weeds often invade human-controlled settings, such as agricultural fields, orchards, parks, and lawns. The presence of weeds in agricultural settings is well-known from the beginning of civilization; however, their role in agriculture and horticulture is recognized only in recent decades [12]. The broad ecological amplitude of weeds facilitates them to invade a broad range of habitats and ecological niches. The presence of weeds in the agricultural and horticulture fields compete with the native plants to affect yield [10]. Although horticulture is considered one of the subdivisions of agriculture, they differ in management practices and the kind of plants grown. Thus, it might be possible that similar land under a different regime of management for growing different crops may influence selective weed infestation. This provides an opportunity to investigate the weed invasion in these two different land use classes. At the same time, the information on the phenological events of weed is important for formulating effective control and management [13,14].
The documentation of weeds in different crop fields is important for the management and control of weeds [15,16]. The identification and documentation of weed invasion are important for formulating various strategies for managing the weeds [17]. Management decisions for agriculture and horticulture fields are dependent upon the phenological information of crops for improving yield [13] while the phenological calendar of weeds is important for formulating their effective eradication strategy. In the study landscape, most of the weeds are invasive and not native to the place. There is a need to understand the type, pattern, and impacts of weeds and invasive species for improving the targeted yields of the selected cropping system. However, there is a wide knowledge gap in invasive species research in developing countries and it acts as a decisive impediment to managing invasion. Developing countries lag far behind developed countries in invasive species research [18]. Specifically, Asian countries are represented poorly in the scientific literature on invasive species. Such a lag and data deficit must not be considered an indicator of low invasion risk or low intensity of invasion in developing countries. Rather, this indicates less effort being made to explore the invasive species, less documentation, and insufficient action on data availability.
For supplementing the existing knowledge base on invasive weeds, we present here a comprehensive assessment to achieve the objectives of (i) documenting various weeds in agriculture (paddy, maize, and mustard) and horticulture (apple and vegetable) systems of the study region, (ii) identification as native vs. exotic, (iii) diversity assessment of weed under different cropping systems, and (iv) understanding flowering phenology of weeds. We also attempt to address research queries on crop specificity of weeds to a given cropping system and to assess whether a specific cropping system has more diverse weeds than another. The findings will supplement existing knowledge on invasive weeds amid a dearth of knowledge for the study region. At the same time, a similar approach can be adopted for collecting vital information on weeds for other study regions.

2. Results

The study recorded 59 weed species, taxonomically distributed among 50 genera in 24 families (Table 1). The perennial weeds were 28 in number constituting 48% of the total encountered weeds in all of the cropping systems. The other life span categories were annual (39%), annual–biennial (7%), and annual–biennial–perennials (3%) having 23, 4, and 2 weed species, respectively (Table 1). The distribution of species among 24 families is lopsided, with 4 families accounting for half of the species and 20 families for the other half. 15 families were represented by the presence of just single species. The Asteraceae was the dominant family with 9 species (15%) followed by Poaceae with 8 species (14%), Brassicaceae with 7 species (12%), and Plantaginaceae with 5 species (8%). The rest of the species was represented by Fabaceae, Lamiaceae, Polygonaceae, Ranunculaceae, Amaranthaceae, and other families (Table 1). The monotypic families are Apiaceae, Boraginaceae, Asparagaceae, Caryophyllaceae, Chenopodiaceae, Cyperaceae, Euphorbiaceae, Fumariaceae, Geraniaceae, Rosaceae. Further enumeration is represented in Table 1.

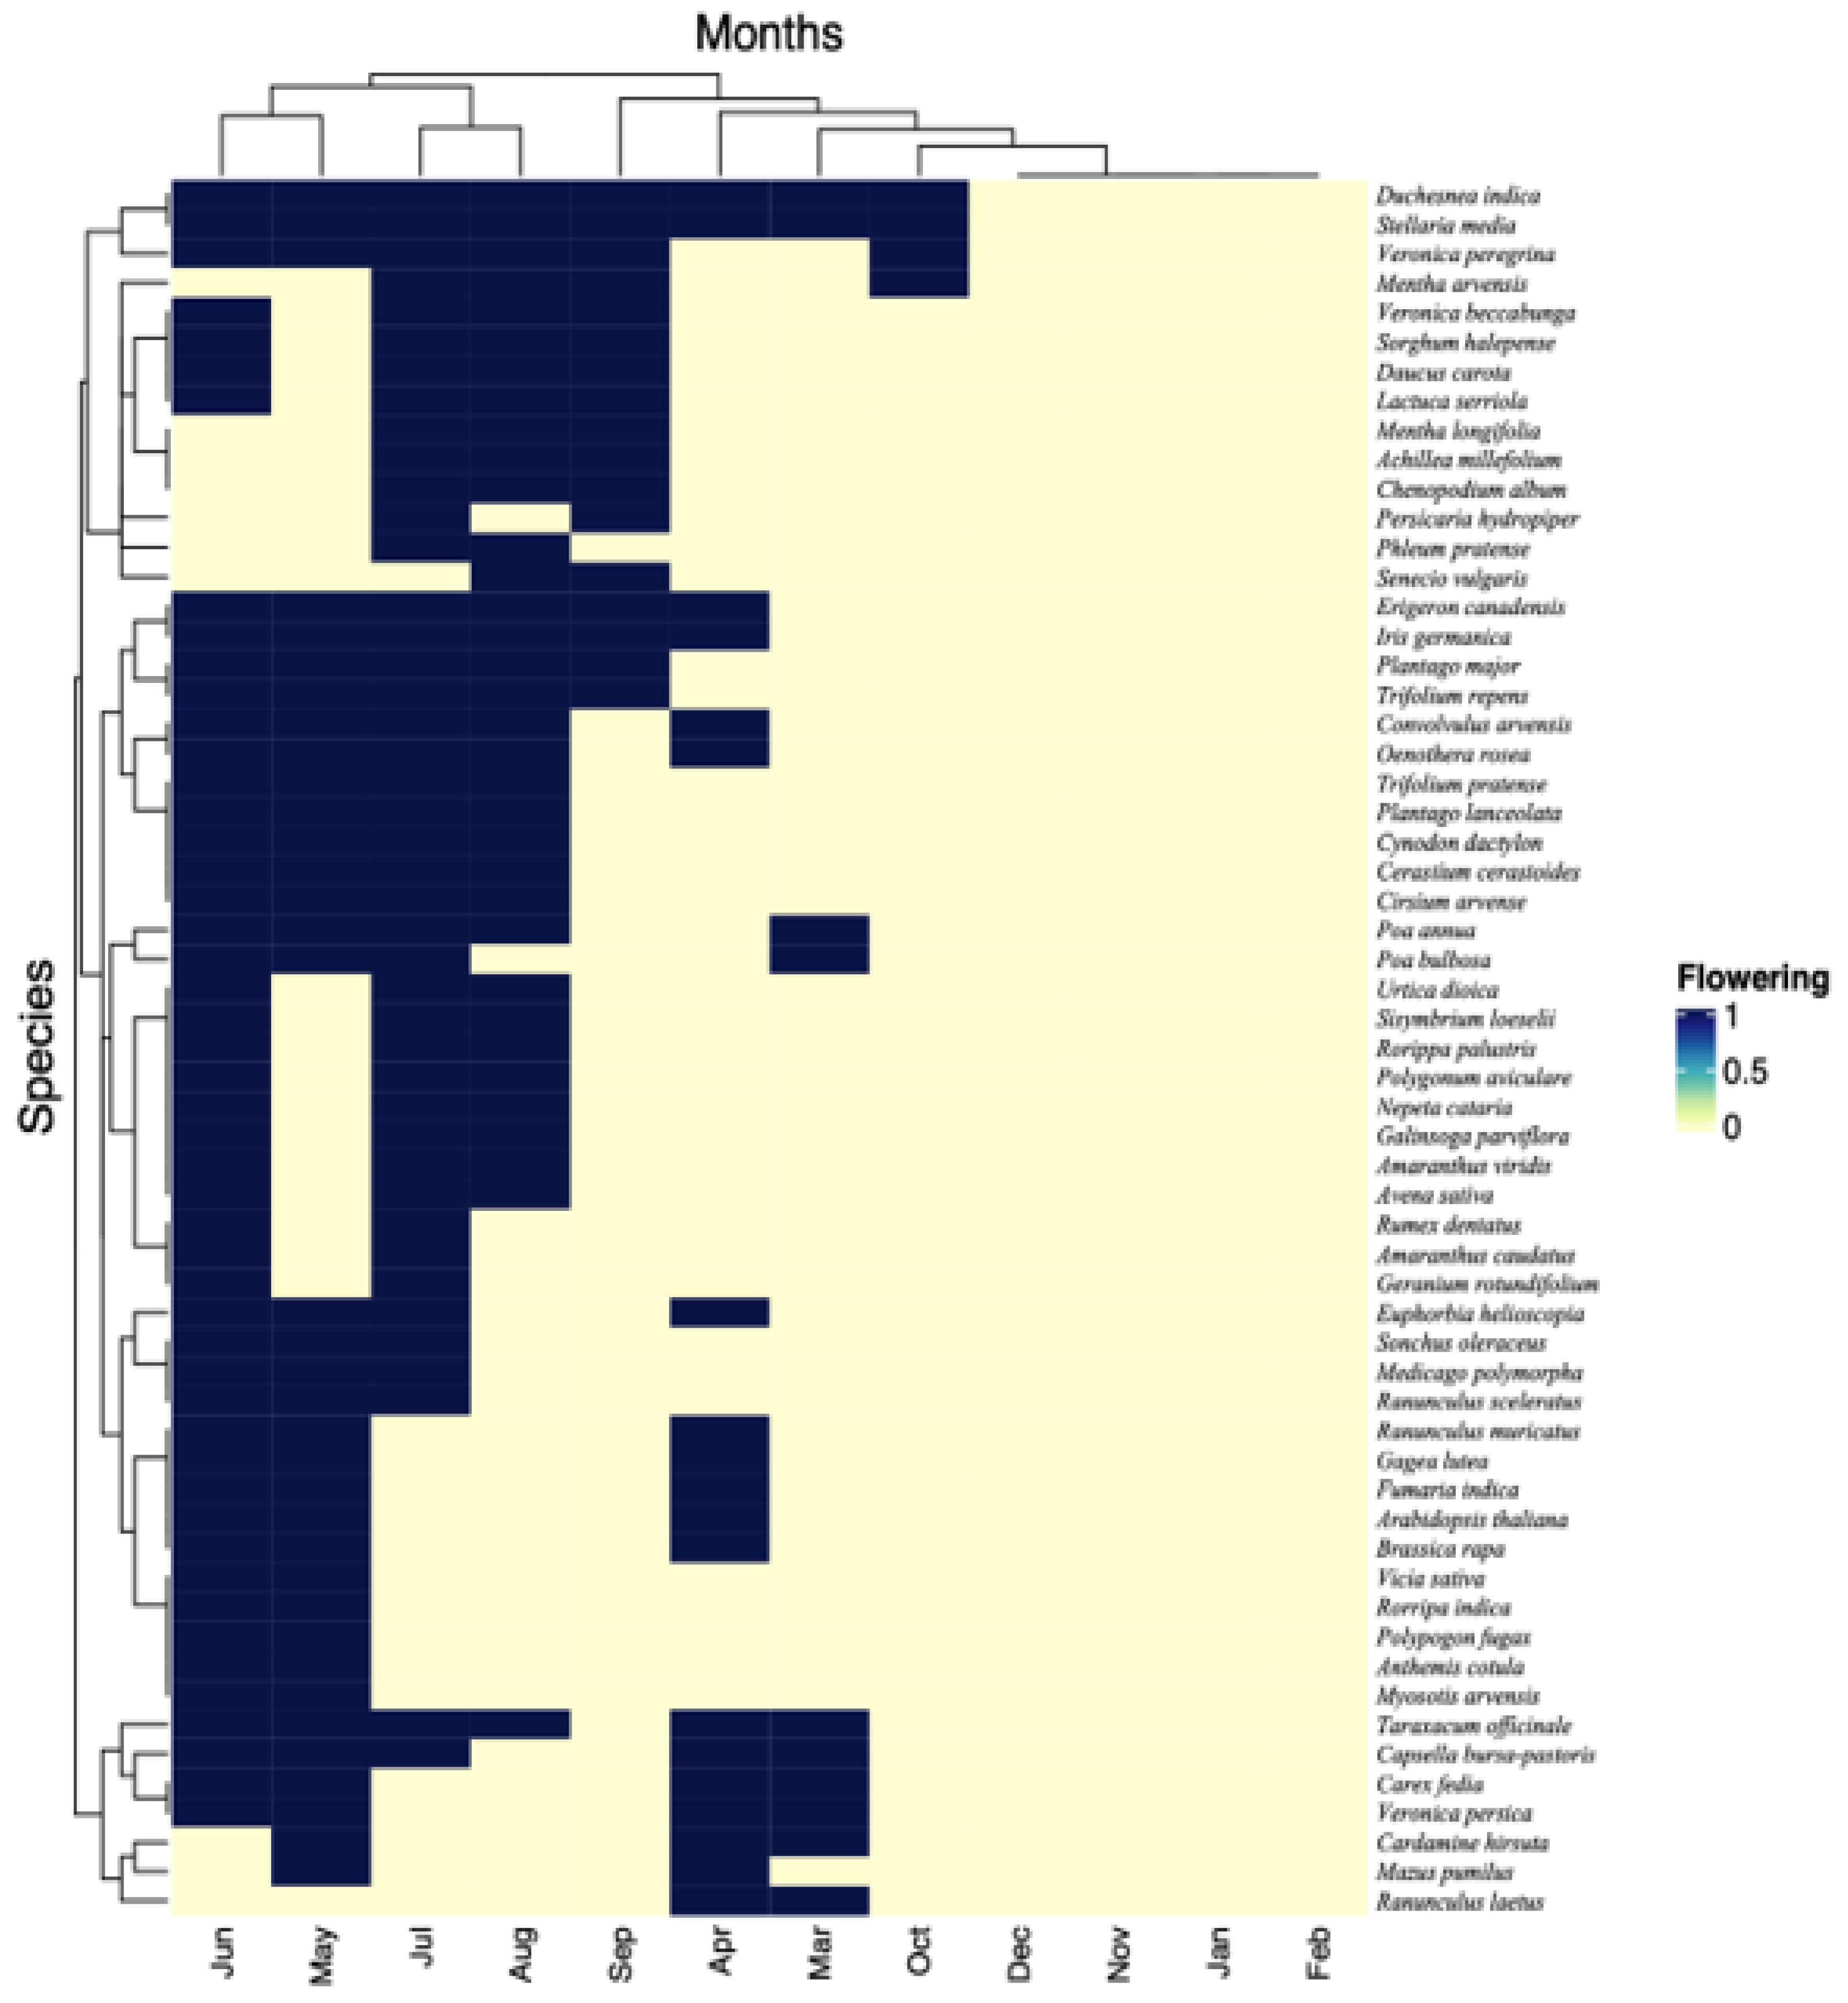
2.1. Functional Traits Including Flowering Phenology

The analysis of floristic distribution using Raunkiaer’s life form revealed that the therophytes with 35 species forming 59% of the plant community were the dominant life form in the study region, followed by hemicryptophytes with 19 (32%), and geophytes with 5 (9%) (Table 1). The phytogeographical analysis revealed that the maximum weed species (34 in number, 58%) recorded is native, while many (25 in number, 42%) are alien (Table 1). The phenological spectrum of weed flora was presented mainly by the flowering period of each species. The present study’s weed flora displayed a wide range of blooming phenology (Table 1, Figure 1). Different species flower through various seasons. We observed that most of the weeds (77%) (e.g., Achillea millefolium, Amaranthus viridis, Avena sativa, Daucus carota, Galinsoga parviflora, Geranium rotundifolium, Nepeta cataria, Polygonum aviculare, Achillea millefolium, Lactuca serriola, Persicaria hydropiper and Phleum pratense) flowered from May to August (Table 1, Figure 1). A few weeds showed flowers in other months of the year, such as Brassica rapa, Capsella bursa-pastoris, Cardamine hirsuta, Ranunculus arvensis, Mazus pumilus, Rumex hastatus, Viola odorata, Tussilago farfara and Sigesbeckia orientalis which bloomed between September and April. This observed variance in the phenological response of blooming across different weeds was ascribed to seasonal temperature variations. The majority of weeds exhibited their peak blooming in the summer, primarily in June and July. The blossoming season typically began at the beginning of spring and lasted until the end of summer (Table 1, Figure 1). The clustering of weeds based on flowering phenology is presented in Figure 1, where weeds grouped in one limb are more similar in flowering timings and show proximity to each other.

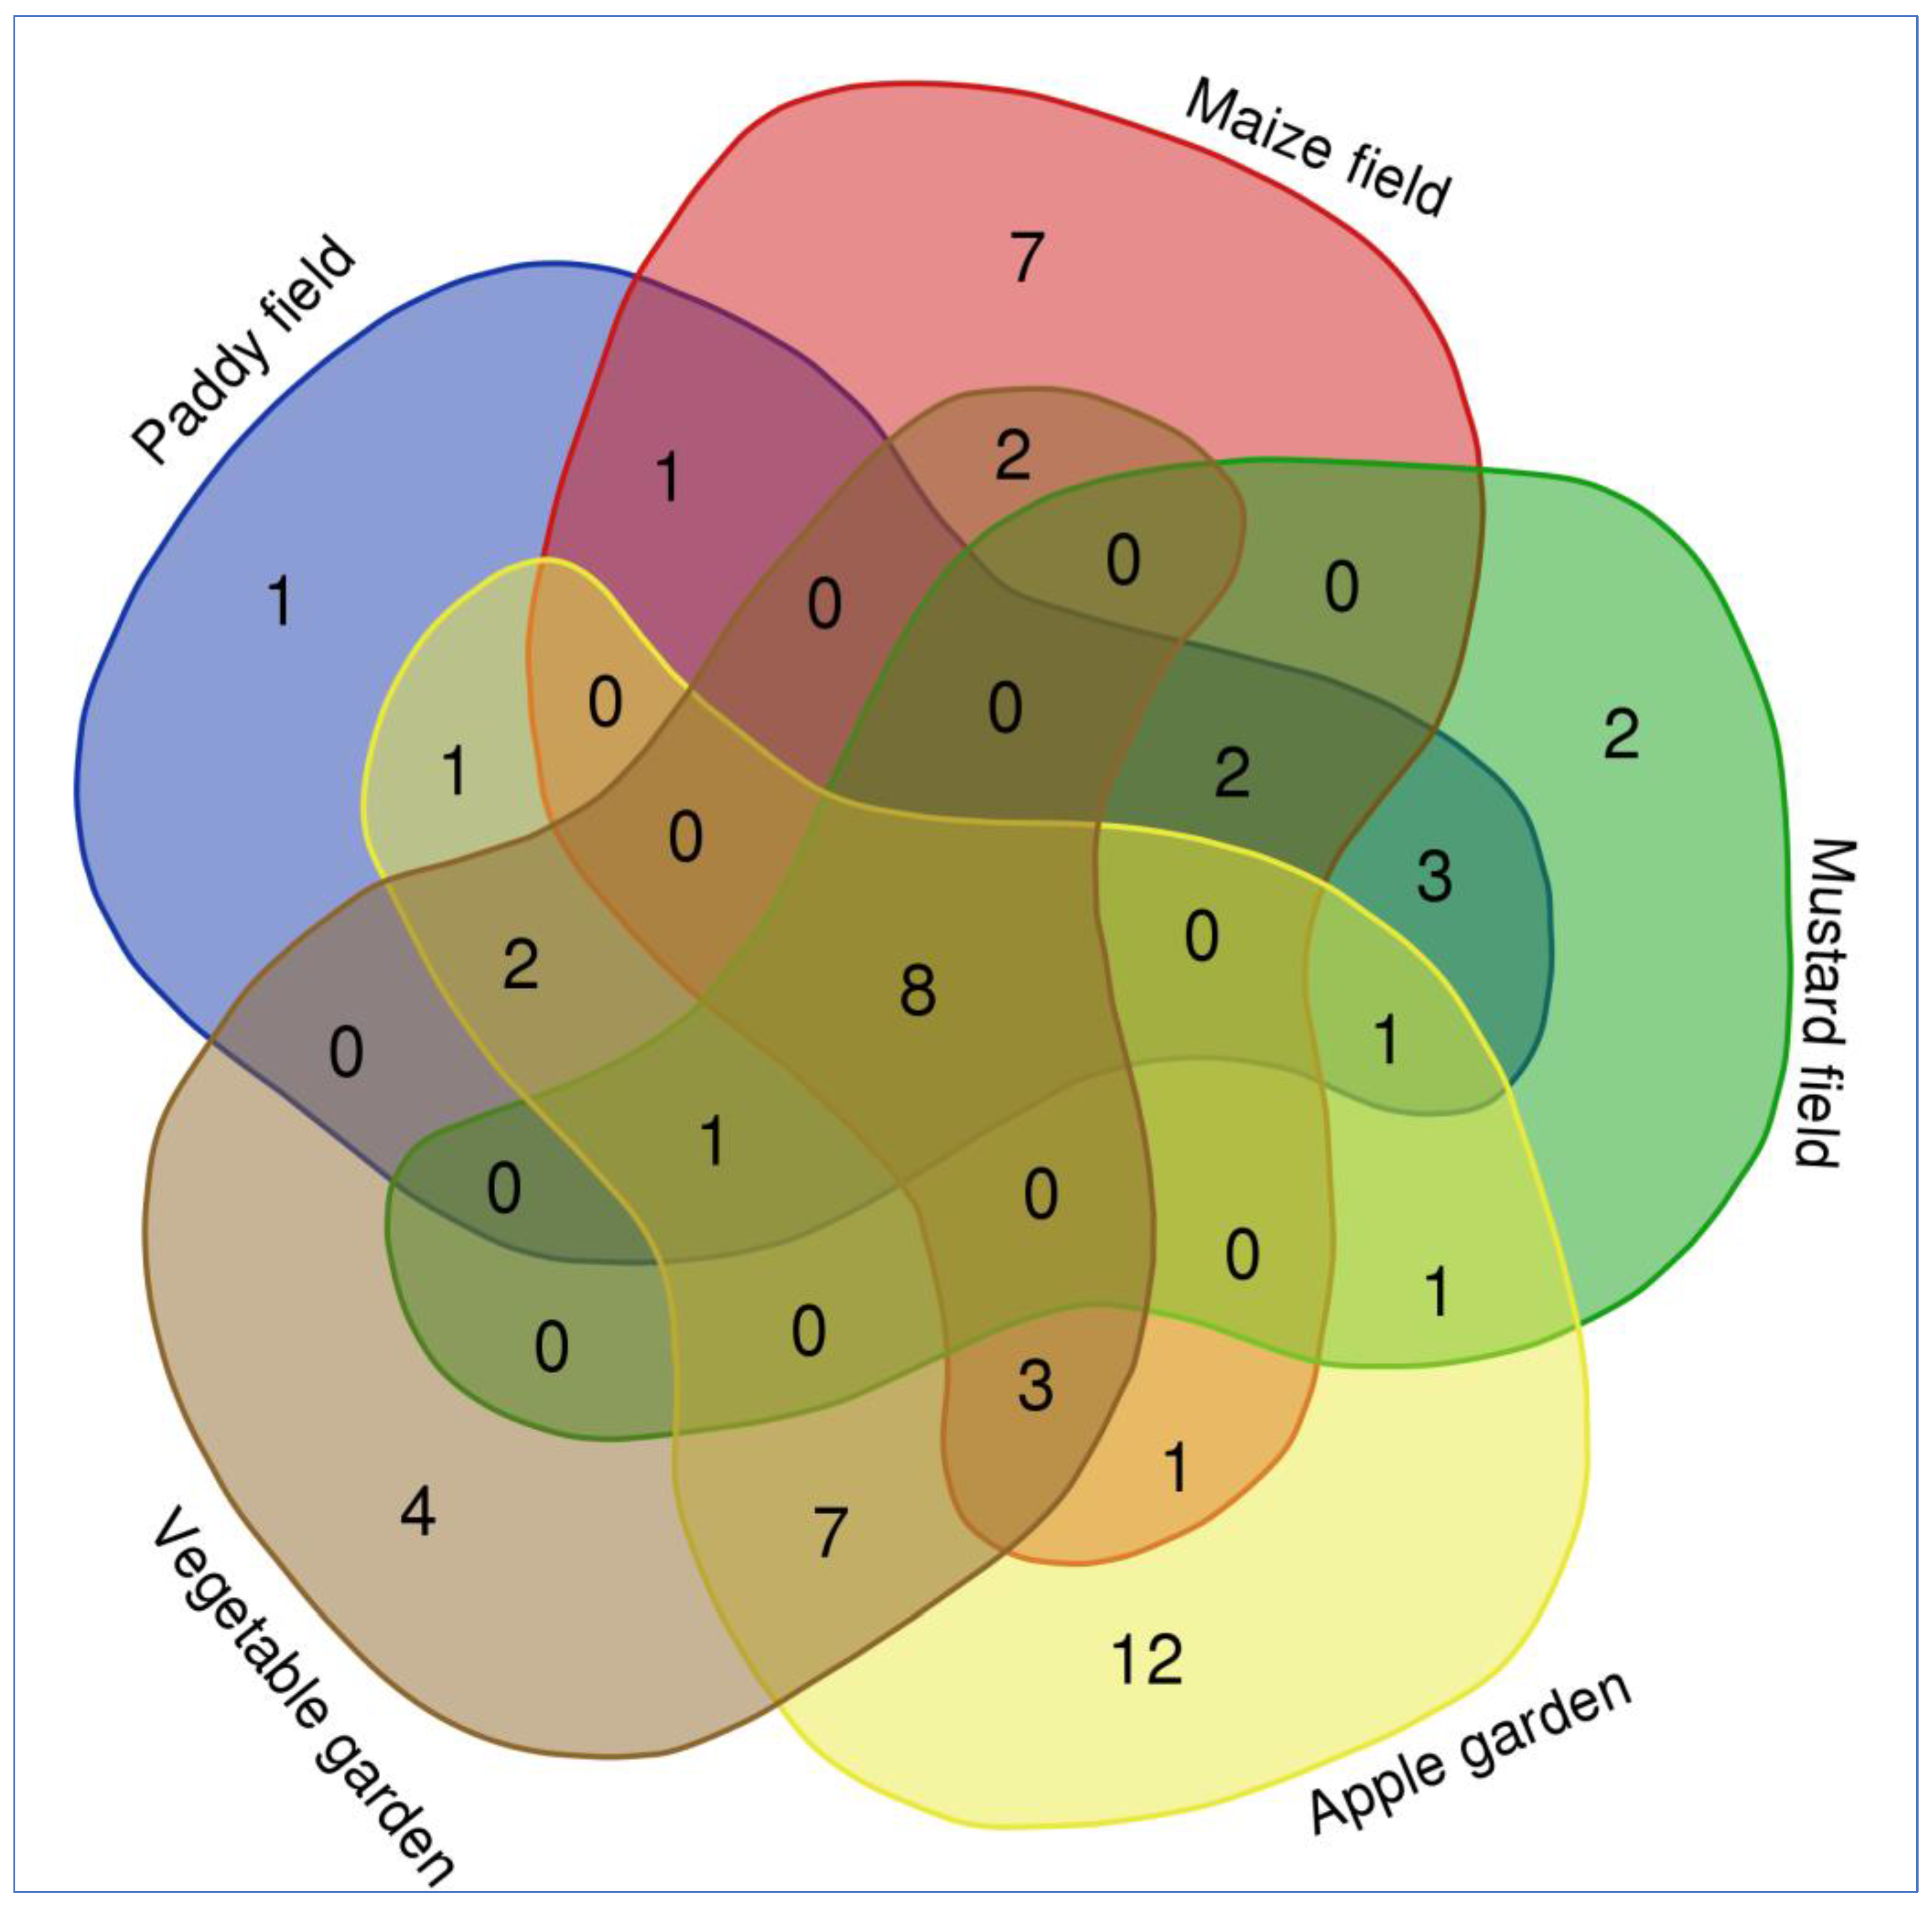
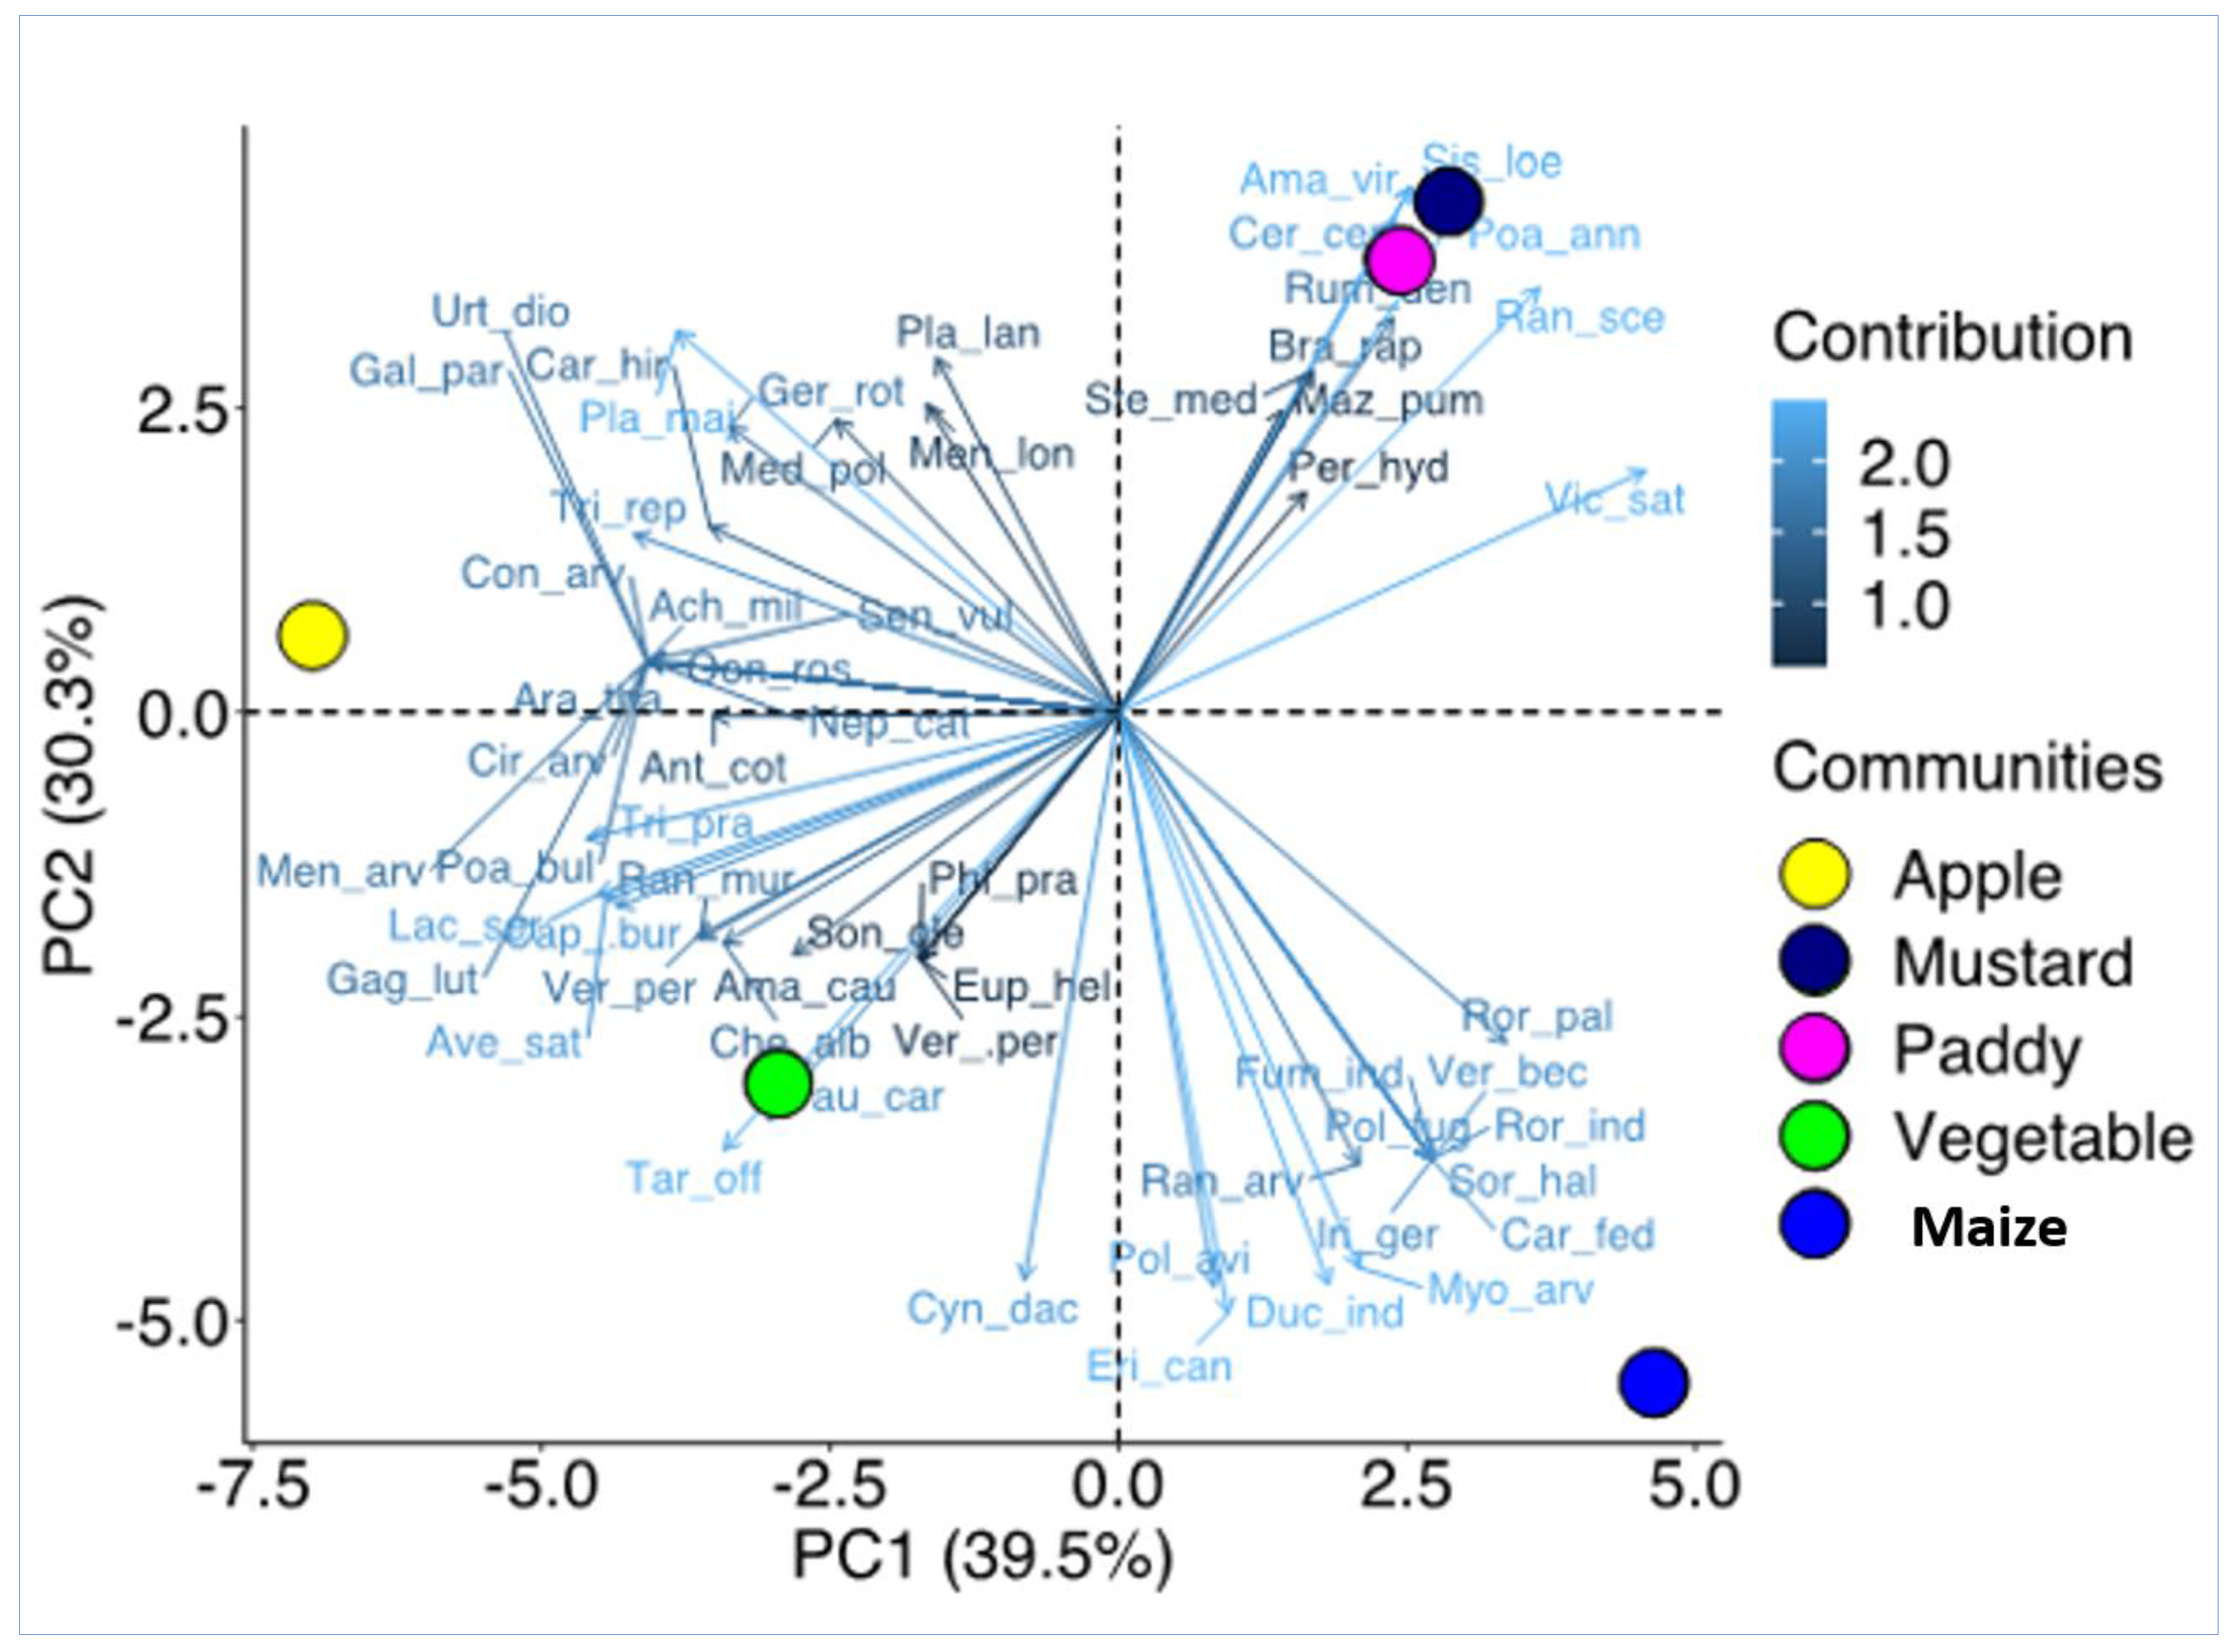
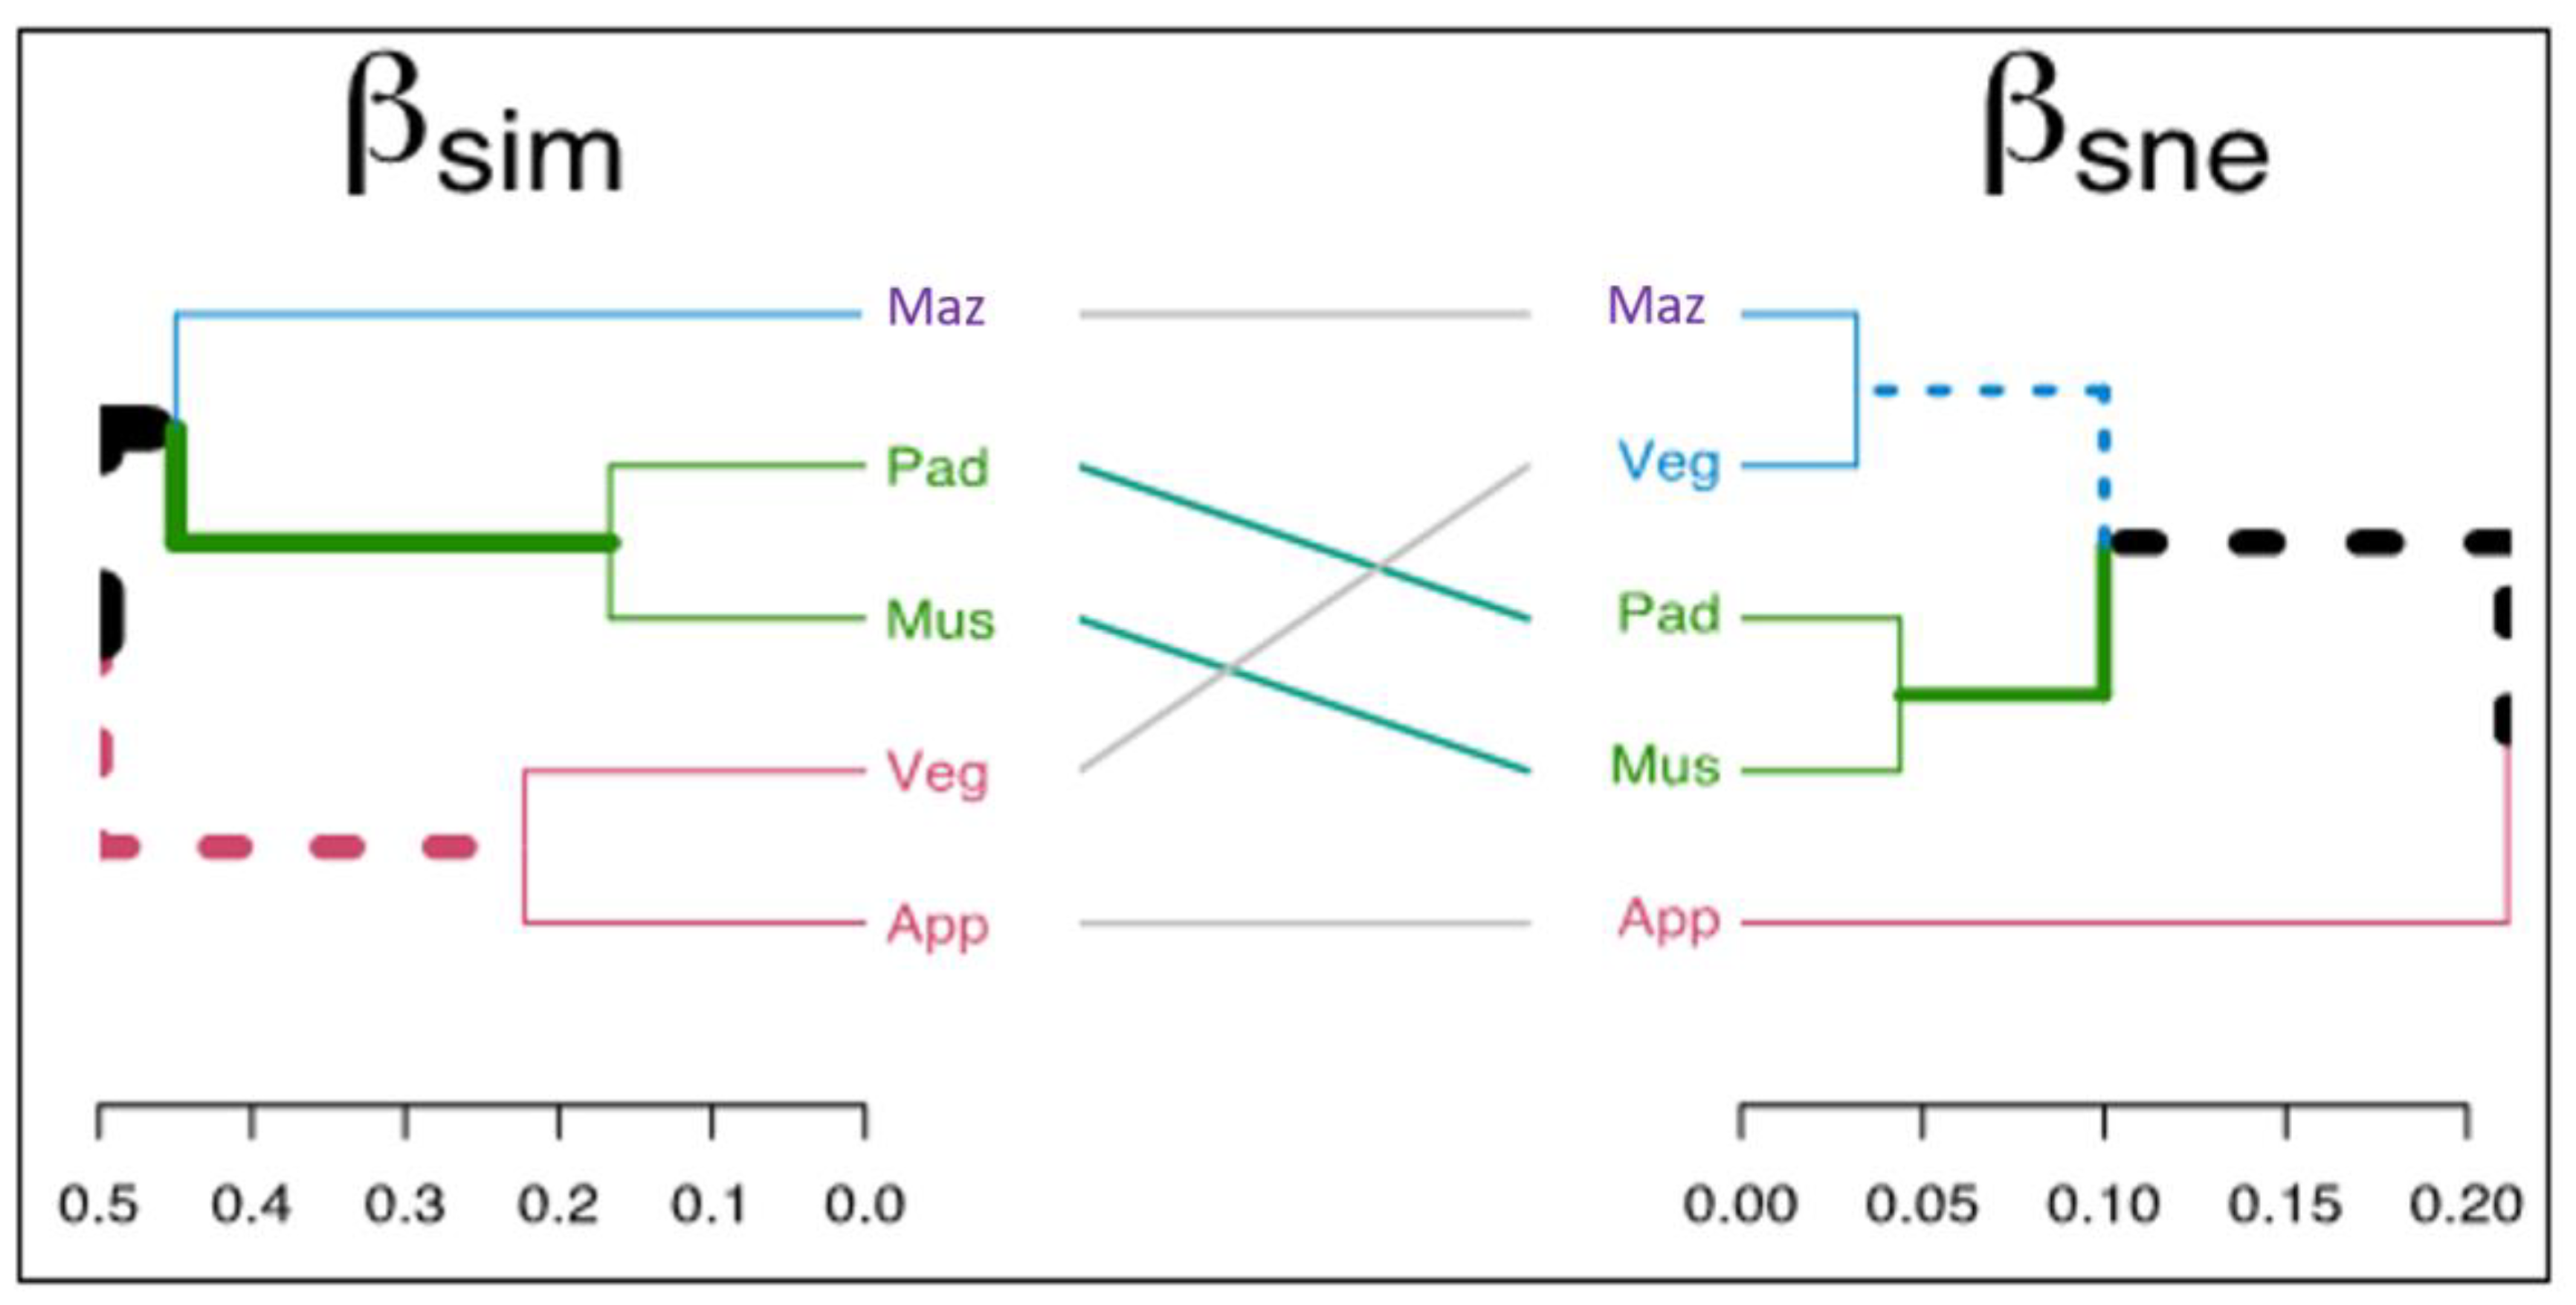
2.2. Weed Distribution and Their Diversity in Agriculture and Horticulture Systems

The horticulture management interventions in the apple and vegetable orchards were found to have more weeds compared to the agriculture systems. Among agriculture systems, maize has the highest number of weeds followed by mustard and paddy. The apple garden had significantly higher weed diversity (3.325) than the mustard (2.307). The value of weed dominance based on the Simpson index ranges from 0.835 to 0.955 (Table 2). The other indices of weed diversity in five cropping systems are presented in Table 2.

2.3. Indicator Species Analysis

The indicator species analysis showed the separation between the paddy, maize, and mustard from apple garden and vegetable fields, as evidenced by high and substantial indicator values for several species. In the paddy field, Persicaria hydropiper and Poa annua had the highest indication value, while Cynodon dactylon, Poa annua, and Rorippa palustris had the highest indicator value for maize fields. In mustard fields, the indicator species with significant p-value were Stellaria media and Poa annua. Trifolium repens and Poa annua had the highest indicator value in the apple garden, while in vegetable fields, the Phleum pratense and Trifolium pratense had the highest indicator value. Poa annua was the indicator species in all four types of agriculture fields excluding vegetable fields (Figure 2).
It was observed that eleven weed species were unique to the apple garden followed by nine species in the maize field, four species in the vegetable garden, two species in the mustard field, and one species in the paddy field (Figure 3). However, eight species were common in all habitat types that included Erigeron canadensis L., Persicaria hydropiper Delarbre, Plantago major L., Poa annua L., Polygonum aviculare L., Rumex dentatus L., Trifolium pratense L., Trifolium repens L. Similarly, nine species were common between apple and vegetable orchards. Three weed species were common between apple, vegetable, and maize cropping systems. One weed species was common between a maize field and a vegetable orchard. The Venn diagram depicted in Figure 4 shows the number of weed species unique to a specific cropping system and common among different cropping systems. PCA analysis showed four distinct groups based on the composition and IVI of the weed species. Apple, vegetables, and maize were distinctly separated from each other, while mustard and paddy had a similar composition of weeds (Figure 4).
The species Achillea millefolium, Arabidopsis thaliana, Cirsium arvense, Convolvulus arvensis, Gagea elegans, Oenothera rosea, Poa bulbosa, Nepeta cataria, Senecio vulgaris, Medicago polymorpha, Urticadioica are unique to apple growing fields and species Carexfedia, Fumaria indica, Sorghum halepense, Rorippaindica, Iris germanica, Polypogon fugax, Veronica anagallis-aquatica, Myosotis arvensis were unique to vegetable fields. Weed plants such as Carex fedia, Fumaria indica, Sorghum halepense, Rorippaindica, Iris germanica, Polypogon fugax, Veronica anagallis-aquatica, Myosotis arvensis are specific to the maize field. The species linked to paddy and mustard fields are Lactuca serriola, Mentha arvensis, Amaranthus caudatus, Avena sativa, Capsella bursa-pastoris, Ranunculus muricatus, Chenopodium album, Veronica persica, Galinsoga parviflora (Figure 4).
Spatial turnover (βsim) and nestedness-resultant components (βsne) of species dissimilarity revealed dissimilarity lower than 50% among the five crops (Figure 5). In the βsim cluster, we observed three distinct clusters; one made up of apple and vegetable, another of paddy and mustard, and the last one only of maize. Maize showed a difference of 44–50% in weed composition when compared to the other four crops. Apple crops showed a difference in weed composition of 35% and 38% when compared to paddy and mustard, respectively. In addition, vegetable crops had 45% and 50% different weed species when compared to paddy and mustard, respectively. On the other hand, the highest value in the βsne cluster was 21%, showing that the number of species between crops is similar, differing by less than 21%. This highest value was found between apple and mustard. Moreover, the number of weed species in apple crops was 19% different from paddy. The other relationships between crops regarding βsne had less than a 12% difference in weed species number.

3. Discussion

The first step in dealing with the problem of weeds is their identification and documentation not just for a specific location or region but also for the specific cropping systems. The current study would help in formulating management strategies in dealing with weeds. We could find only a limited such studies for the part of IWH while there is a lack of information on weed for most of the regions of India. The findings will help in an improved understanding of weed infestation under the different agroecosystems. As the foremost and important step in weed management is the proper identification of different weeds, their phenological attributes, and habitat preference; the present study provides essential insight for effective weed management.
The presence of weeds in agricultural settings drains nutrients and moisture from the soil and prevents sunlight to reach the plants [19]. As a result, it decreases the yield of crops significantly [20]. Thus, it is imperative to understand the distribution pattern and diversity of weeds in different cropping systems for their effective management to sustain crop yield [10]. The number of species found in the present study is more than what other researchers in other Himalayan locations have discovered. A total of 35 weeds from 33 genera and 18 families were recorded by Khan et al. [21] from the Ochawala valley in the Pakistani district of Charsadda. According to Haq et al. [22], the Pakistani district of Nowshera’s onion crop had a total of 21 species. In the Pakistani Himalayas’ Mohmand Agency, Ali et al. [23] discovered 63 weed species. We could not find such studies for our study region, i.e., the Kupwara district of Jammu and Kashmir, India. A higher number of weed species was reported from the families belonging to Asteraceae, Poaceae, and Brassicaceae. The Asteraceae family shows habitat diversity because of its wide ecological amplitude. Khan et al. [21] reported Poaceae as the dominant weed family from Pakistan Himalayas. Several researchers reported Asteraceae as the dominant family of weeds from other regions [24,25,26]. Interestingly, other Himalayan regions were also dominantly occupied with the above-mentioned families as reported in previous studies [21,27]. The current analysis reveals an uneven distribution of species among families, and 9 of those families were monotypic. These results are fairly equivalent to prior reported values from other western Himalayan locations [21,24,28].
The comparative percentage of dissimilar life form to an existing flora in a specific region or spot is called its biological spectrum [29]. The biological spectrum reveals how plants have changed to cope with their micro- and macro-climates, and it contains significant physiognomic traits that are frequently used in vegetation research [30,31]. The most common group of biological forms were therophytes, followed by hemicryptophytes and geophytes. Therophytes, which are the dominating life form in the studied region, is a sign of significant biotic disturbances on the habitat caused by activities such as grazing, farming, road building, etc. This life form is typically linked to adverse dry environmental conditions [32,33,34,35]. Our findings agree with the previous studies [36,37,38]. Therophytes dominating in such disturbed habitat zones increase the number of species through the introduction of alien annual weedy forbs such as Anthemis cotula, Amaranthus caudatus, Galinsoga parviflora, etc. [33,39]. The plausible reason for the predominance of hemicryptophytes is due to the available open space and high rate of reproduction [40]. Due to their deep perennial portions, the geophytes only emerge during a brief spring and stay dormant during adverse seasons [41].
The paddy, maize, and mustard were separated from apple orchards and vegetable fields according to the indicator species analysis, which was supported by high and significant indicator values for a number of species. Interesting, each Venn diagram created for each type of habitat across the cropping systems showed a similar pattern (Figure 3). The results from the Venn diagram depicted that eleven species were unique to the apple garden followed by nine species in the maize field, four species in the vegetable garden, two species in the mustard field and one species in the paddy field. The consequence of differential habitat selection results from evolutionary adjustment of species to environmental variables [42]. Species establish under the prolonged prevailing circumstances to function better in a cropping habitat relative to the other habitats [43].

4. Materials and Methods
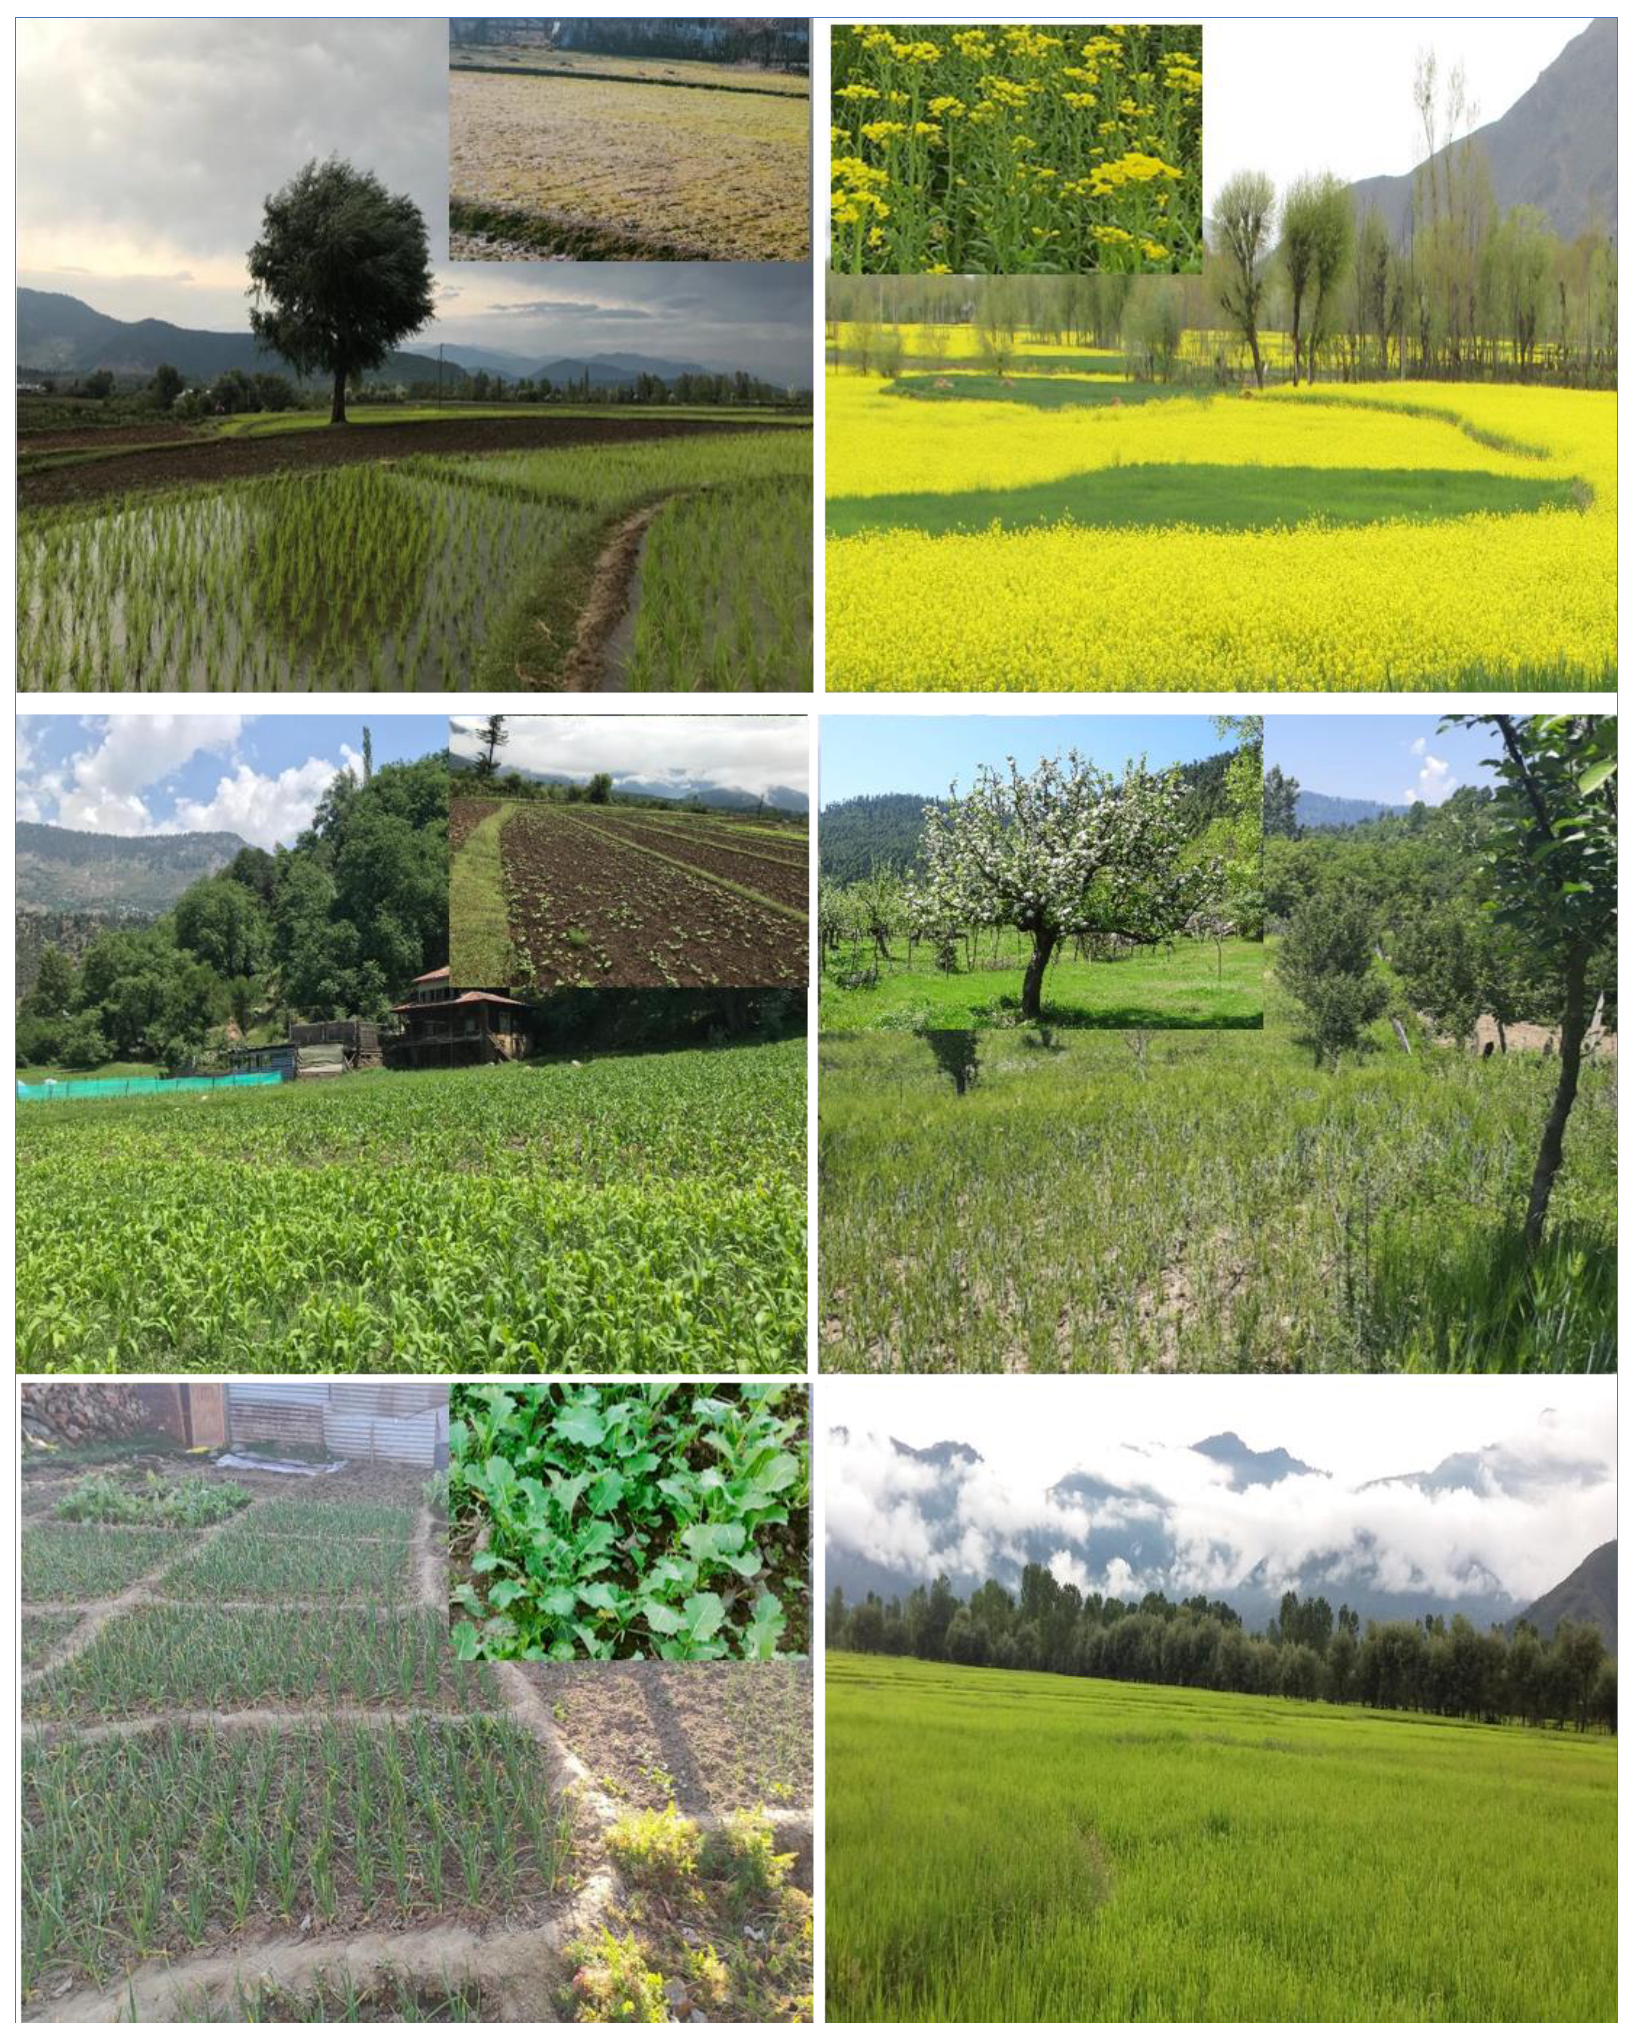
The study involved field-based surveys for five consecutive years (2015–2020) to collect information on weed listing, diversity assessment under different cropping systems, and flowering phenology. The standard taxonomic procedure was followed for the collection of plant specimens. The specimens were identified using relevant taxonomic literature and were further authenticated by matching the plant specimens kept in the herbarium of the Centre for Biodiversity and Taxonomy, University of Kashmir. The herbarium of the center has been recognized by the International Bureau for Plant Taxonomy and Nomenclature, New York with acronym KASH (http://taxonomy.uok.edu.in/Main/AboutUs.aspx/ accessed on 8 May 2022). Details on sampling and analysis are discussed in this section ahead.

4.1. Study Area

The study was conducted for the Kupwara district of Jammu and Kashmir state, located in the Indian Western Himalayas (IWH). The IWH represents one of the most sensitive ecosystems (http://www.knowledgeportal-nmshe.in/ accessed on 8 May 2022) with very rich biodiversity where many species are rare and endemic [3]. At the same time, the region faces the threat of weed invasion making it vulnerable to ill effects of invasion while the other factors making the region vulnerable include proximity to streams, slopes, and elevations [44]. District Kupwara is the northernmost geographical part of the Kashmir Himalaya in the IWH. Its geographical area is 2379 km2, situated at a height of around 1616 m amsl. The region extends between the latitudes of 34.17–34.21 E and the longitudes of 73.10–73.16N (Figure 6). It is the backward frontier of the Kashmir Himalayas, with a line of control abutting it to the northwest. The river Kishenganga, originates in the Himalayas and flows from east to west, through the outer areas of Kupwara. The region harbours a large number of weeds because of a broad range of physical land features having large climatic variations across the region. In addition, this part of Himalaya has diverse cropping pattern with a large variety of cultivated crops where few weeds are recognised as crop specific weed [45]. The dominant vegetation of the area is represented by Himalayan dry temperate forests, Himalayan moist temperate forests and Sub-Alpine forests [46]. Scrub forest vegetation intersperse the different forest types at higher altitudes. Patches of grassland meadows are also quite common here (Figure 6).

4.2. Sampling Design and Analysis

Preliminary field surveys were carried out to obtain an understanding about the nature of the terrain, vegetation, distribution and accessibility in the study area. After that, five cropping types in two distinct systems of agriculture and horticulture were identified for the assessment. The agriculture system constituted of paddy, maize and mustard cultivation while the horticulture system consisted of apple and vegetable gardens. Systematic random vegetation sampling was carried out to record floral diversity in the different habitats during the year 2015–2020. In total, 250 quadrates of size 5 m × 5 m were laid down for sampling. This constituted 50 plots in each of the five selected cropping systems. The sampling was done to ensure field enumeration for all of the three distinct seasons (i.e., winter, summer, rainy) as few of the weed species were not perennial and their occurrence was reported only during a specific season (Figure 7). The selection of plot size was carried out by drawing species vs. area curve, where we found that the number of weed species presence counted was usually saturated at the selected size of 5 m × 5 m size. Species listing of weeds was simply taken as the count of the total number of different weeds occurring in all of the sampled study quadrates for a selected cropping system. The dominating weed species present in a particular agricultural system were identified using the Importance Value Index (IVI) of weeds (Supplementary Materials). The IVI was calculated by adding the relative frequency, relative abundance, and relative density of each weed species in a given cropping system [47]. Field notebooks were used to record in-depth field observations on ecological characteristics for each species, such as blooming phenology, habit, and Raunkiaer’s life form [48,49]. The native phytogeographical distribution of the plant species gathered from the study region was obtained using secondary sources such as floras, manuals, and recently published research papers [45] and specialized internet web pages of Germplasm Resource Information Network (GREEN) https://www.ars-grin.gov/ accessed on 8 May 2022 and www.efloras.org/ accessed on 8 May 2022. Based on data sources that were accessible, plant species were divided into native and alien species. The diversity indices i.e., Shannon–Wiener index [50], Simpson diversity index [51], and Evenness index [52] were calculated using the standard formula.
The Venn diagram evaluates the unique and common species among cropping systems by using Bioinformatics & Evolutionary Genomics tool (available at http://bioinformatics.psb.ugent.be/webtools/Venn/ accessed on 5 June 2022). Principal Component Analysis (PCA) was done to visualize the weed associations between crops using the package “vegan” in the software R 4.0.0 [53,54]. In order to compare the β-diversity of weeds at the habitat and landscape levels, we also calculated β-diversity, which was produced as a ratio of the regional and local diversity. We used the spatial turnover (Simpson pairwise dissimilarity) and nestedness-resultant components (nestedness-fraction of Sorensen pairwise dissimilarity) of β-diversity analysis applying “Sorensen” as family of dissimilarity index while the Dissimilarity analysis was conducted in the package “betapart” [55]. In addition, indicator species analysis was used to identify the key weed species for each habitat type using PAST software [56]. Indicator values were computed according to Dufrêne and Legendre [57], and the statistical significance of the maximum indicator value was determined using the Monte Carlo Test of significance [58].

5. Conclusions

This study provides a comprehensive understanding of the distribution and diversity of weeds under the various management interventions that distinguish cropping systems from agriculture and horticulture systems. The findings are expected to assist farm managers to develop effective management plans to control and eradicate weeds infestation in the paddy, maize, mustard, apple, and vegetable agro-ecosystems of the IWH region. Such studies provide essential information to manage weeds where lack of sufficient data on weeds is one of the major constraints for formulating an effective weed management plan. The flowering phenology of weeds will help to establish an effective time for the application of herbicides or to implement manual weeding operations (i.e., removal of weeds) in the field, as the most appropriate weeding time is before the flowering of weeds. The dominant weeds and their clustered flowering phenological timings in a year for each of the dominant cropping systems will further help to identify an ideal time in a year for implementing weeding operations to achieve optimum results of weed eradication.

Supplementary Materials

The following supporting information can be downloaded at: https://www.mdpi.com/article/10.3390/plants12061222/s1, Table S1: Database of importance value index (IVI) of recorded species from different cropping systems of western Himalayas.

Author Contributions

Conceptualization, S.M.H. and F.A.L.; methodology, S.M.H. and M.K.; software, E.S.C. and M.W.; validation, S.M.H., R.C. and M.W.; formal analysis, M.W. and M.K.; investigation, S.M.H. and F.A.L.; resources, E.A.M.; data curation, M.W.; writing—original draft preparation, S.M.H.; writing—review and editing, H.O.E., F.A.L. and M.K.; visualization, F.A.L.; supervision, H.O.E.; project administration, R.C.; funding acquisition, H.O.E. All authors have read and agreed to the published version of the manuscript.

Funding

Researchers Supporting Project number (RSP2023R118), King Saud University.

Data Availability Statement

All obtained data are provided in the research article.

Acknowledgments

The authors would like to thank Researchers Supporting Project number (RSP2023R118), King Saud University, Riyadh, Saudi Arabia.

Conflicts of Interest

The authors declare no conflict of interest.

References

  1. Kumar, M.; Kalra, N.; Ravindranath, N.H. Assessing the response of forests to environmental variables using a dynamic global vegetation model: An Indian perspective. Curr. Sci. 2020, 118, 700–701. [Google Scholar]
  2. Kumar, M.; Kalra, N.; Khaiter, P.; Ravindranath, N.H.; Singh, V.; Singh, H.; Sharma, S.; Rahnamayan, S. PhenoPine: A simulation model to trace the phenological changes in Pinus roxhburghii in response to ambient temperature rise. Ecol. Modell. 2019, 404, 12–20. [Google Scholar] [CrossRef]
  3. Kumar, M.; Rawat, S.P.S.; Singh, H.; Ravindranath, N.H.; Kalra, N. Dynamic forest vegetation models for predicting impacts of climate change on forests: An Indian perspective. Indian J. For. 2018, 41, 1–12. [Google Scholar]
  4. Rawat, A.S.; Kalra, N.; Singh, H.; Kumar, M. Application of vegetation models in India for understanding the forest ecosystem processes. Indian For. 2020, 146, 99–100. [Google Scholar] [CrossRef]
  5. Richards, C.L.; Bossdorf, O.; Muth, N.Z.; Gurevitch, J.; Pigliucci, M. Jack of all trades, master of some? On the role of phenotypic plasticity in plant invasions. Ecol. Lett. 2006, 9, 981–993. [Google Scholar] [CrossRef] [PubMed] [Green Version]
  6. D’antonio, C.; Meyerson, L.A. Exotic plant species as problems and solutions in ecological restoration: A synthesis. Rest. Ecol. 2002, 10, 703–713. [Google Scholar] [CrossRef] [Green Version]
  7. Holzner, W.; Numata, M. Biology and Ecology of Weeds; Springer Science & Business Media: Berlin/Heidelberg, Germany, 2013; Volume 2. [Google Scholar]
  8. Einhellig, F.A. Interactions involving allelopathy in cropping systems. Agron. J. 1996, 88, 886–893. [Google Scholar] [CrossRef]
  9. Weston, L.A.; Duke, S.O. Weed and crop allelopathy. Crit. Rev. Plant Sci. 2003, 22, 367–389. [Google Scholar] [CrossRef]
  10. Zimdahl, R.L. Fundamentals of Weed Science; Academic Press: Cambridge, MA, USA, 2018. [Google Scholar]
  11. Sinden, J.; Jones, R.; Hester, S.; Odom, D.; Kalisch, C.; James, R.; Cacho, O.; Griffith, G. The Economic Impact of Weeds in Australia; Technical Series 8; CRC for Australian Weed Management: Glen Osmond, Australia, 2004.
  12. Derpsch, R.; Friedrich, T.; Kassam, A.; Li, H. Current status of adoption of no-till farming in the world and some of its main benefits. Int. J. Biol. Eng. 2010, 3, 1–25. [Google Scholar]
  13. Chmielewski, F.M. Phenology in agriculture and horticulture. In Phenology: An Integrative Environmental Science; Springer: Berlin/Heidelberg, Germany, 2013; pp. 539–561. [Google Scholar]
  14. Kumar, M.; Padalia, H.; Nandy, S.; Singh, H.; Khaiter, P.; Kalra, N. Does spatial heterogeneity of landscape explain the process of plant invasion? A case study of Hyptis suaveolens from Indian Western Himalaya. Environ. Monit. Assess. 2019, 191, 794. [Google Scholar] [CrossRef]
  15. Norsworthy, J.K.; Bond, J.; Scott, R.C. Weed management practices and needs in Arkansas and Mississippi rice. Weed Technol. 2013, 27, 623–630. [Google Scholar] [CrossRef]
  16. Haq, S.M.; Hamid, M.; Lone, F.A.; Singh, B. Himalayan hotspot with Alien Weeds: A case study of biological spectrum, phenology, and diversity of weedy plants of high altitude mountains in District Kupwara of J&K Himalaya, India. Proc. Natl. Acad. Sci. India Sect. B Boil. Sci. 2021, 91, 139–152. [Google Scholar]
  17. Ward, S.M.; Cousens, R.D.; Bagavathiannan, M.V.; Barney, J.N.; Beckie, H.J.; Busi, R.; Davis, A.S.; Dukes, J.S.; Forcella, F.; Freckleton, R.P.; et al. Agricultural weed research: A critique and two proposals. Weed Sci. 2014, 62, 672–678. [Google Scholar] [CrossRef] [Green Version]
  18. Nunez, M.A.; Pauchard, A. Biological invasions in developing and developed countries: Does one model fit all? Biol. Invas. 2010, 12, 707–714. [Google Scholar] [CrossRef]
  19. Monaco, T.J.; Weller, S.C.; Ashton, F.M. Weed Science: Principles and Practices; John Wiley & Sons: Hoboken, NJ, USA, 2022. [Google Scholar]
  20. Forbes, J.C.; Forbes, J.C.; Watson, D. Plants in Agriculture; Cambridge University Press: Cambridge, UK, 1992. [Google Scholar]
  21. Khan, M.; Hussain, F.; Musharaf, S. Floristic composition and biological characteristics of the vegetation of Sheikh Maltoon Town District Mardan, Pakistan. Annu. Res. Rev. Biol. 2013, 31, 31–41. [Google Scholar]
  22. Ul Haq, Z.; Gul, B.; Shah, S.M.; Razaq, A.; Raza, H. Ecological characteristics of weeds of onion crop of University of Peshawar Botanical Garden, District Nowshera, Pakistan. Pak. J. Weed Sci. Res. 2016, 22, 263–267. [Google Scholar]
  23. Ali, A.; Badshah, L.; Hussain, F.; Shinwari, Z.K. Floristic composition and ecological characteristics of plants of chail valley, district Swat, Pakistan. Pak. J. Bot. 2016, 48, 1013–1026. [Google Scholar]
  24. Zeb, U.; Ali, S.; Li, Z.H.; Khan, H.; Shahzad, K.; Shuaib, M.; Ihsan, M. Floristic diversity and ecological characteristics of weeds at Atto Khel Mohmand Agency, KPK, Pakistan. Acta Ecol. Sin. 2017, 37, 363–367. [Google Scholar] [CrossRef]
  25. Iqbal, M.; Khan, S.M.; Khan, M.A.; Ahmad, Z.; Ahmad, H. A novel approach to phytosociological classification of weeds flora of an agro-ecological system through Cluster, Two Way Cluster and Indicator Species Analyses. Ecol. Indic. 2018, 84, 590–606. [Google Scholar] [CrossRef]
  26. Nafeesa, Z.; Haq, S.M.; Bashir, F.; Gaus, G.; Mazher, M.; Anjum, M.; Rasool, A.; Rashid, N. Observations on the floristic, life-form, leaf-size spectra and habitat diversity of vegetation in the Bhimber hills of Kashmir Himalayas. Acta Ecol. Sin. 2021, 41, 228–234. [Google Scholar] [CrossRef]
  27. Chhetri, N.B.K.; Shrestha, K.K. Floristic diversity and important value indices of tree species in lower Kanchenjunga Singhalila ridge Eastern Nepal. Am. J. Plant Sci. 2019, 10, 248–263. [Google Scholar] [CrossRef] [Green Version]
  28. Haq, S.M.; Malik, A.H.; Khuroo, A.A.; Rashid, I. Floristic composition and biological spectrum of Keran-a remote valley of northwestern Himalaya. Acta Ecol. Sin. 2019, 39, 372–379. [Google Scholar] [CrossRef]
  29. Pichi-Sermolli, R.E. An index for establishing the degree of maturity in plant communities. J. Ecol. 1948, 36, 85–90. [Google Scholar] [CrossRef]
  30. Saxena, A.K.; Pandey, P.; Singh, J.S. Biological Spectrum and other structural functional attributes of the vegetation of Kumaun Himalaya. Vegetatio 1982, 49, 111–119. [Google Scholar] [CrossRef]
  31. Sahu, S.C.; Dhal, N.K.; Datt, B. Environmental implications of Biological spectrum vis-a-vis tree species diversity in two protected forests (PFs) of Gandhamardan hill ranges, Eastern Ghats, India. Environmentalist 2012, 32, 420–432. [Google Scholar] [CrossRef]
  32. Waheed, M.; Haq, S.M.; Arshad, F.; Bussmann, R.W.; Iqbal, M.; Bukhari, N.A.; Hatamleh, A.A. Grasses in Semi-Arid Lowlands—Community Composition and Spatial Dynamics with Special Regard to the Influence of Edaphic Factors. Sustainability 2022, 14, 14964. [Google Scholar] [CrossRef]
  33. Mamariani, F.; Joharchi, M.R.; Ejtehadi, H.; Emadzade, K. Contributions to the flora and vegetation of Binalood mountain range, NE Iran: Floristic and chorological studies in Fereizi region. JCMR 2009, 1, 1–18. [Google Scholar]
  34. Vakhlamova, T.; Rusterholz, H.P.; Kanibolotskaya, Y.; Baur, B. Effects of road type and urbanization on the diversity and abundance of alien species in roadside verges in Western Siberia. Plant Ecol. 2016, 217, 241–252. [Google Scholar] [CrossRef]
  35. Rashid, I.; Haq, S.M.; Lembrechts, J.J.; Khuroo, A.A.; Pauchard, A.; Dukes, J.S. Railways redistribute plant species in mountain landscapes. J. Appl. Ecol. 2021, 58, 967–1980. [Google Scholar] [CrossRef]
  36. Asim, Z.I.; Haq, F.; Iqbal, A. Phenology, life form and leaf spectra of the vegetation of kokarai valley, district swat. J. Biol. Environ. Sci. 2016, 9, 23–31. [Google Scholar]
  37. Rahman, I.U.; Afzal, A.; Iqbal, Z.; Ijaz, F.; Ali, N.; Asif, M.; Alam, J.; Majid, A.; Hart, R.; Bussmann, R.W. First insights into the floristic diversity, biological spectra and phenology of Manoor Valley, Pakistan. Pak. J. Bot. 2018, 50, 1113–1124. [Google Scholar]
  38. Rahman, I.U.; Afzal, A.; Iqbal, Z.; Abd Allah, E.F.; Alqarawi, A.A.; Calixto, E.S.; Ali, N.; Ijaz, F.; Kausar, R.; Alsubeie, M.S.; et al. Role of multivariate approaches in floristic diversity of Manoor Valley (Himalayan Region), Pakistan. Appl. Ecol. Environ. Res. 2019, 17, 1475–1498. [Google Scholar] [CrossRef]
  39. Joly, M.; Bertrand, P.; Gbangou, R.Y.; White, M.C.; Dubé, J.; Lavoie, C. Paving the way for invasive species: Road type and the spread of common ragweed (Ambrosia artemisiifolia). Environ. Manag. 2011, 48, 514–522. [Google Scholar] [CrossRef]
  40. Khan, W.; Khan, S.M.; Ahmad, H.; Alqarawi, A.A.; Shah, G.M.; Hussain, M.; Abd_Allah, E.F. Life forms, leaf size spectra, regeneration capacity and diversity of plant species grown in the Thandiani forests, district Abbottabad, Khyber Pakhtunkhwa, Pakistan. Saud. J. Biol. Sci. 2018, 25, 94–100. [Google Scholar] [CrossRef] [Green Version]
  41. Hussain, F.; Shah, S.M.; Badshah, L.; Durrani, M.J. Diversity and ecological characteristics of flora of Mastuj valley, district Chitral, Hindukush range, Pakistan. Pak. J. Bot. 2015, 47, 495–510. [Google Scholar]
  42. Rosenzweig, M.L. A theory of habitat selection. Ecology 1981, 62, 327–335. [Google Scholar] [CrossRef]
  43. Cornwell, W.K.; Schwilk, D.W.; Ackerly, D.D. A trait-based test for habitat filtering: Convex hull volume. Ecology 2006, 87, 1465–1471. [Google Scholar] [CrossRef]
  44. Olokeogun, O.S.; Kumar, M. An indicator based approach for assessing the vulnerability of riparian ecosystem under the influence of urbanization in the Indian Himalayan city, Dehradun. Ecol. Indic. 2020, 119, 106796. [Google Scholar] [CrossRef]
  45. Andrabi, S.M.; Reshi, Z.A.; Shah, M.A.; Qureshi, S. Studying the patterns of alien and native floras of some habitats in Srinagar city, Kashmir, India. Ecol. Processes 2015, 4, 2. [Google Scholar] [CrossRef] [Green Version]
  46. Haq, S.M.; Khuroo, A.A.; Malik, A.H.; Rashid, I.; Ahmad, R.; Hamid, M.; Dar, G.H. Forest ecosystems of Jammu and Kashmir state. In Biodiversity of the Himalaya: Jammu and Kashmir State; Springer: Singapore, 2020; pp. 191–208. [Google Scholar]
  47. Curtis, J.T.; Mcintosh, R.P. The interrelations of certain analytic and synthetic phytosociological characters. Ecology 1950, 31, 434–455. [Google Scholar] [CrossRef]
  48. Raunkiaer, C. The Life Forms of Plants and Statistical Plant Geography; Being the Collected Papers of C. Raunkiaer; Clarendon Press: Oxford, UK, 1934. [Google Scholar]
  49. Perez-Harguindeguy, N.; Diaz, S.; Garnier, E.; Lavorel, S.; Poorter, H.; Jaureguiberry, P.; Bret-Harte, M.S.; Cornwell, W.K.; Craine, J.M.; Gurvich, D.E.; et al. New handbook for standardised measurement of plant functional traits worldwide. Aust. Bot. 2013, 61, 167–234. [Google Scholar] [CrossRef]
  50. Shannon, C.E. A mathematical theory of communication. Bell Syst. Tech. J. 1948, 27, 379–423. [Google Scholar] [CrossRef] [Green Version]
  51. Simpson, E.H. Measurement of diversity. Nature 1949, 163, 688. [Google Scholar] [CrossRef]
  52. Pielou, E.C. Ecological Diversity; No. 574.524018 P5; Wiley: Hoboken, NJ, USA, 1975. [Google Scholar]
  53. Oksanen, J.; Blanchet, F.G.; Friendly, M.; Kindt, R.; Legendre, P.; McGlinn, D.; Minchin, P.R.; O’Hara, R.B.; Simpson, G.L.; Solymos, P.; et al. vegan: Community Ecology Package, R package Version 2.5-2; 2018. Available online: https://cran.r-project.org/web/packages/vegan/vegan.pdf (accessed on 8 June 2022).
  54. Team, R.D.C. A Language and Environment for Statistical Computing. 2009. Available online: https://www.R-project.org (accessed on 8 June 2022).
  55. Baselga, A.; Orme, D.; Villeger, S.; De Bortoli, J.; Leprieur, F.; Baselga, M.A. Package ‘betapart’. Partitioning Beta Diversity into Turnover and Nestedness Components, Version 1.5.6; 2018. Available online: https://cran.r-project.org/web/packages/betapart/betapart.pdf (accessed on 8 June 2022).
  56. Waheed, M.; Haq, S.M.; Fatima, K.; Arshad, F.; Bussmann, R.W.; Masood, F.R.; Alataway, A.Z.; Dewidar, A.F.; Almutairi, K.; Elansary, H.O.; et al. Ecological Distribution Patterns and Indicator Species Analysis of Climber Plants in Changa Manga Forest Plantation. Diversity 2022, 14, 988. [Google Scholar] [CrossRef]
  57. Dufrêne, M.; Legendre, P. Species assemblages and indicator species: The need for a flexible asymmetrical approach. Ecol. Monogr. 1997, 67, 345–366. [Google Scholar] [CrossRef]
  58. Haq, S.M.; Amjad, M.S.; Waheed, M.; Bussmann, R.W.; Proćków, J. The floristic quality assessment index as ecological health indicator for forest vegetation: A case study from Zabarwan Mountain Range, Himalayas. Ecol. Indic. 2022, 145, 109670. [Google Scholar] [CrossRef]
Figure 1. Two-way cluster analysis based on Sorenson’s similarity index and flowering phenology of weeds.
Plants 12 01222 g001
Figure 2. Indicator species analysis diagram showing the most significant indicator species in the agriculture and horticulture systems (paddy, maize, mustard, apple, vegetable). Horizonal lengths show contribution of individual species as indicator values based on combining values for relative abundance, relative density and relative frequency, and p-values are shown with bar colour (0 to 100) representing Monte Carlo test of significance of the observed maximum indicator value for each species. The highest indicator values are shown within rectangles. The importance value index for indicator species were as Poa annua (292), followed by Persicaria hydropiper (91), Trifolium repens (73), Trifolium pratense (69), Stellaria media (59), Cynodon dactylon (46), Ranunculus sceleratus (38), Rorippa palustris (30), and Phleum pratense (25). The bar in the figure shows the indicator species with a significant p-value. The bigger the dot, the more significant the p-value of the species.
Plants 12 01222 g002
Figure 3. Venn diagram showing the distribution of the number of weed species occurring in different cropping systems of Kupwara district, Jammu and Kashmir, India.
Plants 12 01222 g003
Figure 4. Principle Component Analysis (PCA) illustrating the relationship of weed species and the five cropping systems evaluated for the Kupwara district, Jammu and Kashmir, India. The contribution scale shows how much each weed species contributes to the PCA. (Full name of the species can be referred to in Table 1).
Plants 12 01222 g004
Figure 5. Dissimilarity cluster based on spatial turnover (βsim) and nestedness-resultant components (βsne) of beta diversity components of weeds in five different cropping systems of Kupwara district, Jammu and Kashmir, India. (App—Apple, Veg—Vegetable, Mus—Mustard, Pad—Paddy, Maz—Maize).
Plants 12 01222 g005
Figure 6. Map of the study area showing the location with dominant forest types in upper panel and lower panel showing sampling sites in the Kupwara district, Jammu and Kashmir state, India. The locations of apple, mustard, paddy, vegetable, and maize sites are indicative of sampling sites that included winter, summer and rainy season sampling and they do not represent the number of samples.
Plants 12 01222 g006
Figure 7. The photograph depicts the studied agriculture and horticulture systems in the study area, 1. (Top left): paddy field in winter and summer season, 2. (Top right): mustard field in rainy and summer season, 3. (Middle left): maize field in summer and rainy season, 4. (Middle right): apple garden in rainy and summer season, 5. (Bottom left): vegetable garden in winter and summer season, 6. (Bottom right): paddy field in rainy season.
Plants 12 01222 g007
Table 1. Description of weeds in the part of Indian Western Himalayas (IWH), Kupwara district, Jammu & Kashmir, represented by their scientific name, family, dominance in different cropping systems shown by the Important Value Index (IVI), origin (native/exotic), flowering phenology and Raunkiaer life form. (Life span: A = annual, B = biennial, P = perennial, A-B = annual-biennial, A-B-P = annual-biennial-perennials. Dominant weeds in either of the cropping systems have been highlighted in bold along with their top three IVI values).
Scientific NameFamilyLife SpanAgricultureHorticultureOriginFloweringRaunkiaer
PaddyMaizeMustardAppleVegetablePhenologyLifeform
Achillea millefolium Linn.AsteraceaeP0002.740NativeJuly–Sept.Hemicryptophyte
Amaranthus caudatus L.AmaranthaceaeP0002.7411.20ExoticJune–Aug.Therophyte
Amaranthus viridis L.AmaranthaceaeA7.4507.8500ExoticJune–Aug.Therophyte
Anthemis cotula L.AsteraceaeA8.35008.3212.13ExoticMay–JuneTherophyte
Arabidopsis thaliana (L.) Heynh.BrassicaceaeA0007.230ExoticApril–JuneTherophyte
Avena sativa L.PoaceaeA00011.1314.24ExoticJune–Aug.Therophyte
Brassica rapa L.BrassicaceaeA0013.2600ExoticApril–JuneHemicryptophyte
Capsella bursa-pastoris (L.) Medik.BrassicaceaeA0006.789.34NativeMarch–JulyTherophyte
Cardamine hirsuta L.BrassicaceaeB11.010013.026.05NativeMarch–MayTherophyte
Carex fedia NeesCyperaceaeP020.63000NativeMarch–JuneHemicryptophyte
Cerastium cerastoides (L.)CaryophyllaceaeA3.7607.1900NativeMay–Aug.Therophyte
Chenopodium album L.ChenopodiaceaeA0005.0512.61ExoticJuly–Sept.Therophyte
Cirsium arvense (L.) Scop.AsteraceaeP0002.080ExoticMay–Aug.Hemicryptophyte
Convolvulus arvensis L.ConvolvulaceaeP0003.370ExoticApril–Aug.Therophyte
Cynodon dactylon (L.) Pers.PoaceaeP021.21013.3211.47NativeMay–Aug.Hemicryptophyte
Daucus carota L.ApiaceaeB02.9704.188.41ExoticJune–Sept.Hemicryptophyte
Duchesnea indica (Andrews) Teschem.RosaceaeP014.51007.41NativeMarch–Oct.Hemicryptophyte
Erigeron canadensis L.AsteraceaeA-B5.1716.735.627.2812.61ExoticApril–Sept.Therophyte
Euphorbia helioscopia L.EuphorbiaceaeA00003.29ExoticApril–JulyTherophyte
Fumaria indica (Hausskn.) PugsleyPapaveraceaeA05.64000NativeApril-JuneTherophyte
Gagea lutea (L.) Ker Gawl.LiliaceaeP0003.370NativeApril–JuneGeophyte
Galinsoga parviflora Cav.AsteraceaeA0003.750ExoticJune–Aug.Therophyte
Geranium rotundifolium L.GeraniaceaeP3.2903.5610.510NativeJune–JulyTherophyte
Iris kashmiriana BakerIridaceaeP06.39000NativeApril–JunGeophyte
Lactuca serriola L.AsteraceaeA0004.625.63NativeJuly–Sept.Therophyte
Mazus pumilus (Burm.f.) SteenisMazaceaeA6.670000NativeApril–MayTherophyte
Medicago polymorpha L.FabaceaeA007.929.810ExoticApril–JuneTherophyte
Mentha arvensis L.LamiaceaeP0005.350NativeJuly–Oct.Hemicryptophyte
Mentha longifolia (L.) Huds.LamiaceaeP7.47005.920ExoticJuly–Sept.Hemicryptophyte
Myosotis arvensis (L.) HillBoraginaceaeP018.93007.38ExoticMay–JuneTherophyte
Nepeta cataria L.LamiaceaeP0003.370NativeJune–Aug.Hemicryptophyte
Oenothera rosea L’Hér. ex AitonOnagraceaeP0006.350NativeApril–Aug.Therophyte
Persicaria hydropiper DelarbrePolygonaceaeA56.7114.923.919.366.05NativeJuly–Sept.Therophyte
Phleum pratense L.PoaceaeP000025.15NativeJuly–Aug.Hemicryptophyte
Plantago lanceolata L.PlantaginaceaeA-B-P7.4707.925.059.38NativeMay–Aug.Therophyte
Plantago major L.PlantaginaceaeP6.315.076.927.616.51NativeMay–Sept.Hemicryptophyte
Poa annua L.PoaceaeA95.6442.0399.2234.7521.26NativeMarch–Aug.Therophyte
Poa bulbosa L.PoaceaeP00010.540NativeMarch–JulyHemicryptophyte
Polygonum aviculare L.PolygonaceaeA4.9618.555.289.3910.27NativeJune–Aug.Therophyte
Polypogon fugax Nees ex Steud.PoaceaeP019.19000NativeMay–JuneTherophyte
Ranunculus arvensis L.RanunculaceaeP016.2102.770NativeMarch–AprilHemicryptophyte
Ranunculus muricatus L.RanunculaceaeA-B-P0004.6210.14ExoticApril–JuneTherophyte
Ranunculus sceleratus L.RanunculaceaeP15.535.9116.1300ExoticMay–JulyTherophyte
Rorippa palustris (L.) BesserBrassicaceaeA-B8.6421.17000NativeJune–Aug.Geophyte
Rorippa indica (L.) Hiern.BrassicaceaeA-B05.76000NativeApril–JuneGeophyte
Rumex dentatus L.PolygonaceaeP13.874.7115.122.7510.28NativeJune–JulyHemicryptophyte
Senecio vulgaris L.AsteraceaeA-B0002.080ExoticApril–Sept.Therophyte
Sisymbrium loeselii L.BrassicaceaeA11.01011.8400ExoticJune–Aug.Therophyte
Sonchus oleraceus L.AsteraceaeA00005.62ExoticMay–JulyTherophyte
Sorghum halepense (L.) Pers.PoaceaeP08.61000ExoticJune–Sept.Geophyte
Stellaria media (L.) Vill.PoaceaeA0058.9300NativeMarch–Oct.Therophyte
Taraxacum officinale WeberAsteraceaeP03.3105.737.41NativeMarch–Aug.Hemicryptophyte
Trifolium pratense L.FabaceaeP9.498.4110.0719.6321.28NativeMay–Aug.Hemicryptophyte
Trifolium repens L.FabaceaeP11.215.8612.5733.1910.14NativeMay–Sept.Hemicryptophyte
Urtica dioica L.UrticaceaeP0004.960ExoticJune–Aug.Therophyte
Veronica anagallis-aquatica L.PlantaginaceaeP08.12000NativeJune–Sept.Hemicryptophyte
Veronica peregrina L.PlantaginaceaeA000013.47ExoticMay–Oct.Therophyte
Veronica persica Poir.PlantaginaceaeA0006.6414.24NativeMarch–JulyTherophyte
Vicia sativa L.FabaceaeA5.214.716.3100ExoticMay–JuneTherophyte
Table 2. Presence of weeds in the agriculture and horticulture systems of Kupwara, Jammu and Kashmir, India presented as different indices.
IndicesAgricultureHorticulture
Paddy FieldMaize FieldMustard FieldApple GardenVegetable Garden
Species number2024183727
Dominance0.1530.0620.1640.0480.045
Shannon2.4122.9552.3073.3253.197
Simpson0.8470.9370.8350.9510.955
Evenness0.5570.8010.5580.7510.905
Disclaimer/Publisher’s Note: The statements, opinions and data contained in all publications are solely those of the individual author(s) and contributor(s) and not of MDPI and/or the editor(s). MDPI and/or the editor(s) disclaim responsibility for any injury to people or property resulting from any ideas, methods, instructions or products referred to in the content.

