Article

Photosynthesis Product Allocation and Yield in Sweet Potato in Response to Different Late-Season Irrigation Levels

College of Resources and Environmental Sciences, Qingdao Agricultural University, Qingdao 266109, China
*
Author to whom correspondence should be addressed.
Plants 2023, 12(9), 1780; https://doi.org/10.3390/plants12091780
Submission received: 10 March 2023 / Revised: 21 April 2023 / Accepted: 23 April 2023 / Published: 26 April 2023
(This article belongs to the Special Issue Strategies to Improve Water-Use Efficiency in Plant Production)

Abstract

:
Soil water deficit is an important factor affecting the source–sink balance of sweet potato during its late-season growth, but water regulation during this period has not been well studied. Therefore, the aim of this study was to determine the appropriate irrigation level in late-season sweet potato, and the effect of irrigation level on accumulation and allocation of photosynthetic products. In this study, two yield-based field trials (2021–2022) were conducted in which five late-season irrigation levels set according to the crop evapotranspiration rate were tested (T0: non-irrigation, T1: 33% ETc, T2: 75% ETc, T3: 100% ETc, T4: 125% ETc). The effects of the different irrigation levels on photosynthetic physiological indexes, 13C transfer allocation, water use efficiency (WUE), water productivity (WP), and the yield and economic benefit of sweet potato were studied. The results showed that late-season irrigation significantly increased the total chlorophyll content and net photosynthetic rate of functional leaves, in addition to promoting the accumulation of above-ground-source organic biomass (p < 0.05). The rate of 13C allocation, maximum accumulation rate (Vmax), and average accumulation rate (Vmean) of dry matter in storage root were significantly higher under T2 irrigation than under the other treatments (p < 0.05). This suggests that both non-irrigation (T0) and over-irrigation (T4) were not conducive to the transfer and allocation of photosynthetic products to storage roots in late-season sweet potato. However, moderate irrigation (T2) effectively promoted the source–sink balance, enhanced the source photosynthetic rate and stimulated the sink activity, such that more photosynthate was allocated to the storage sink. The results also showed that T2 irrigation treatments significantly increased yield, WUE and WP compared to T0 and T4 (p < 0.05), suggesting that moderate irrigation (T2) can significantly promote the potential of storage root production and field productivity. There was a close relationship between economic benefit and marketable sweet potato yield, and both were highest under T2 (p < 0.05), increasing by 36.1% and 59.9% compared with T0 over the two-year study period. In conclusion, irrigation of late-season sweet potato with 75% evapotranspiration (T2) can improve both the yield and production potential. Together, these results support the use of late-season water management in the production of sweet potato.

1. Introduction

Source and sink, and specifically their establishment, development and balance, are important determinants of the economic yield of crops [1]. In the source–sink relationship, plant water is a crucial and manageable factor [2]. Understanding the myriad plant processes and mechanisms that determine crop water requirements is a prerequisite for improving agronomic performance [3,4].
Sweet potato [Ipomoea batatas (L.)] is a food crop that is highly stress resistant and adaptable [5]. However, while sweet potato is moderately drought-tolerant, it is sensitive to water deficit, particularly during its early (establishment) stage of growth, which includes early vine development and storage root initiation [6]. The early stage is also vital for establishing the source–sink relationship [7]. Consequently, the water supply for sweet potato rooting and branching is often guaranteed through measures such as plastic mulching and adequate seedling watering [6]. In addition to stimulating the development and early initiation of storage roots [8], sufficient soil moisture ensures proper storage root bulking and the maintenance of leaf area during mid-season, which contributes to the development of the source–sink relationship [9]. Fortunately, summer rainfall can fully meet the water demand during this period. Regions of most areas of northern China that produce sweet potato are prone to variable soil moisture, and fluctuations in soil moisture during the autumn months may affect crop survival, performance, and final yield and quality of storage roots [10]. During the late stage of sweet potato (the “balance stage” of the source–sink relationship), however, water management is no longer carried out and there is a reliance on natural precipitation to maintain growth [7,11]. Consequently, the importance of water regulation during the late stage of sweet potato cultivation has not been well studied.
Source–sink balance is an ideal state reached in the late growth stage of sweet potato, when the photosynthetic efficiency of the source leaves and proportion of synthesized photosynthate distributed to the storage roots are highest. During the late growth period, prolonged maintenance of a balanced source–sink relationship prevents insufficient growth of source leaves, which would reduce photosynthetic efficiency, as well as their excessive growth (which would reduce the proportion of photosynthates distributed to storage roots) [12]. In sweet potato, a prolonged soil moisture deficit during the mid and late growth stages limits canopy development, and thus, photosynthetic activity, which ultimately affects storage root development, bulking, yield, and quality [13]. Jones et al. (1985) noted a larger effect of a soil moisture deficit during the storage root bulking stage of sweet potato than during the initial stage of its vegetative growth. Accordingly, producers often use drip irrigation to achieve multiple irrigation cycles and thereby effectively alleviate seasonal drought [14]. Late-season irrigation after drought has been studied in potato [15], onion [16] and tomato [17]. However, while Thomson et al. (1992) and Gajanayake et al. (2016)conducted water management and modelling studies in sweet potato, the focus in both cases was the middle growth period, such that little is known about the effects of late-season irrigation [18,19]. Excess soil moisture has detrimental effects on the growth and development of field crops [20], and reduces the storage root yield of sweet potato [21], but the appropriate irrigation level for late-season sweet potato remains unclear. Information on the responses of sweet potato to different irrigation levels is limited, as is information on optimum soil moisture during late-stage growth and storage root yield processes.
It is widely used to study the absorption and allocation of carbon by plants using 13C isotope tracer technique. [9,22,23]. Therefore, 13C leaf marker technology was used to quantitatively study the transfer and allocation of photosynthetic products in late-season sweet potato. The objectives of this study were to (1) explore the appropriate irrigation level in the late-season for high-yield, WUE, WP and economic return sweet potato production; and (2) explore the impact of the irrigation level on the source–sink of sweet potato, including the transfer and allocation of photosynthates thereto.

2. Results

2.1. Effects of Irrigation Levels on the Dynamics of Dry Matter Accumulation by Sweet Potato during the Late Season

Three samplings (S1–S3) were conducted during the two-year experiment (2021–2022). The results showed that irrigation treatments (T1–T4) significantly increased the above-ground and subsurface biomass of sweet potato compared with the non-irrigation treatment (T0) (p < 0.05). Above-ground biomass increased with increasing irrigation amount and was significantly higher in T4 than in the other treatments. However, with the increase in irrigation amount, the below-ground biomass showed a trend of initially increasing and then decreasing. When the irrigation amount exceeded that in T2, underground biomass began to decline although it was always higher than in T0. Over time, the root–shoot ratio of each treatment steadily increased, without a significant difference from T0 to T2; however, it was consistently higher in those treatments than in T3 and T4 (p < 0.05) (Table 1). The results showed that late-season irrigation increased both the above- and below-ground biomass of sweet potato, and that the irrigation level of T2 led to the accumulation of more below-ground biomass.

2.2. Effects of Irrigation Levels on Chlorophyll Content and Photosynthetic Parameters during Late-Season Sweet Potato Growth

Dynamic monitoring of the chlorophyll content of the functional leaves of sweet potato showed decreases in the contents of Chl-a, Chl-b and Chl-n over time, albeit to a lesser extent in the irrigated (T1–T4) than non-irrigated (T0) treatments. At all three samplings (S1–S3), irrigation (T1–T4) increased the contents of Chl-a, Chl-b and Chl-n in functional leaves over that measured at T0 during S1 and S2. The Chl-a content in the irrigation treatments increased in the order T2 > T4 > T3 > T1, whereas Chl-b and Chl-n were higher in T2 than in the other treatments. At S3, the contents of Chl-a, Chl-b and Chl-n decreased rapidly under the different treatments (Figure 1). Compared with non-irrigation (T0), late-season irrigation slowed the decline in chlorophyll content in functional leaves mainly at S1 and S2.
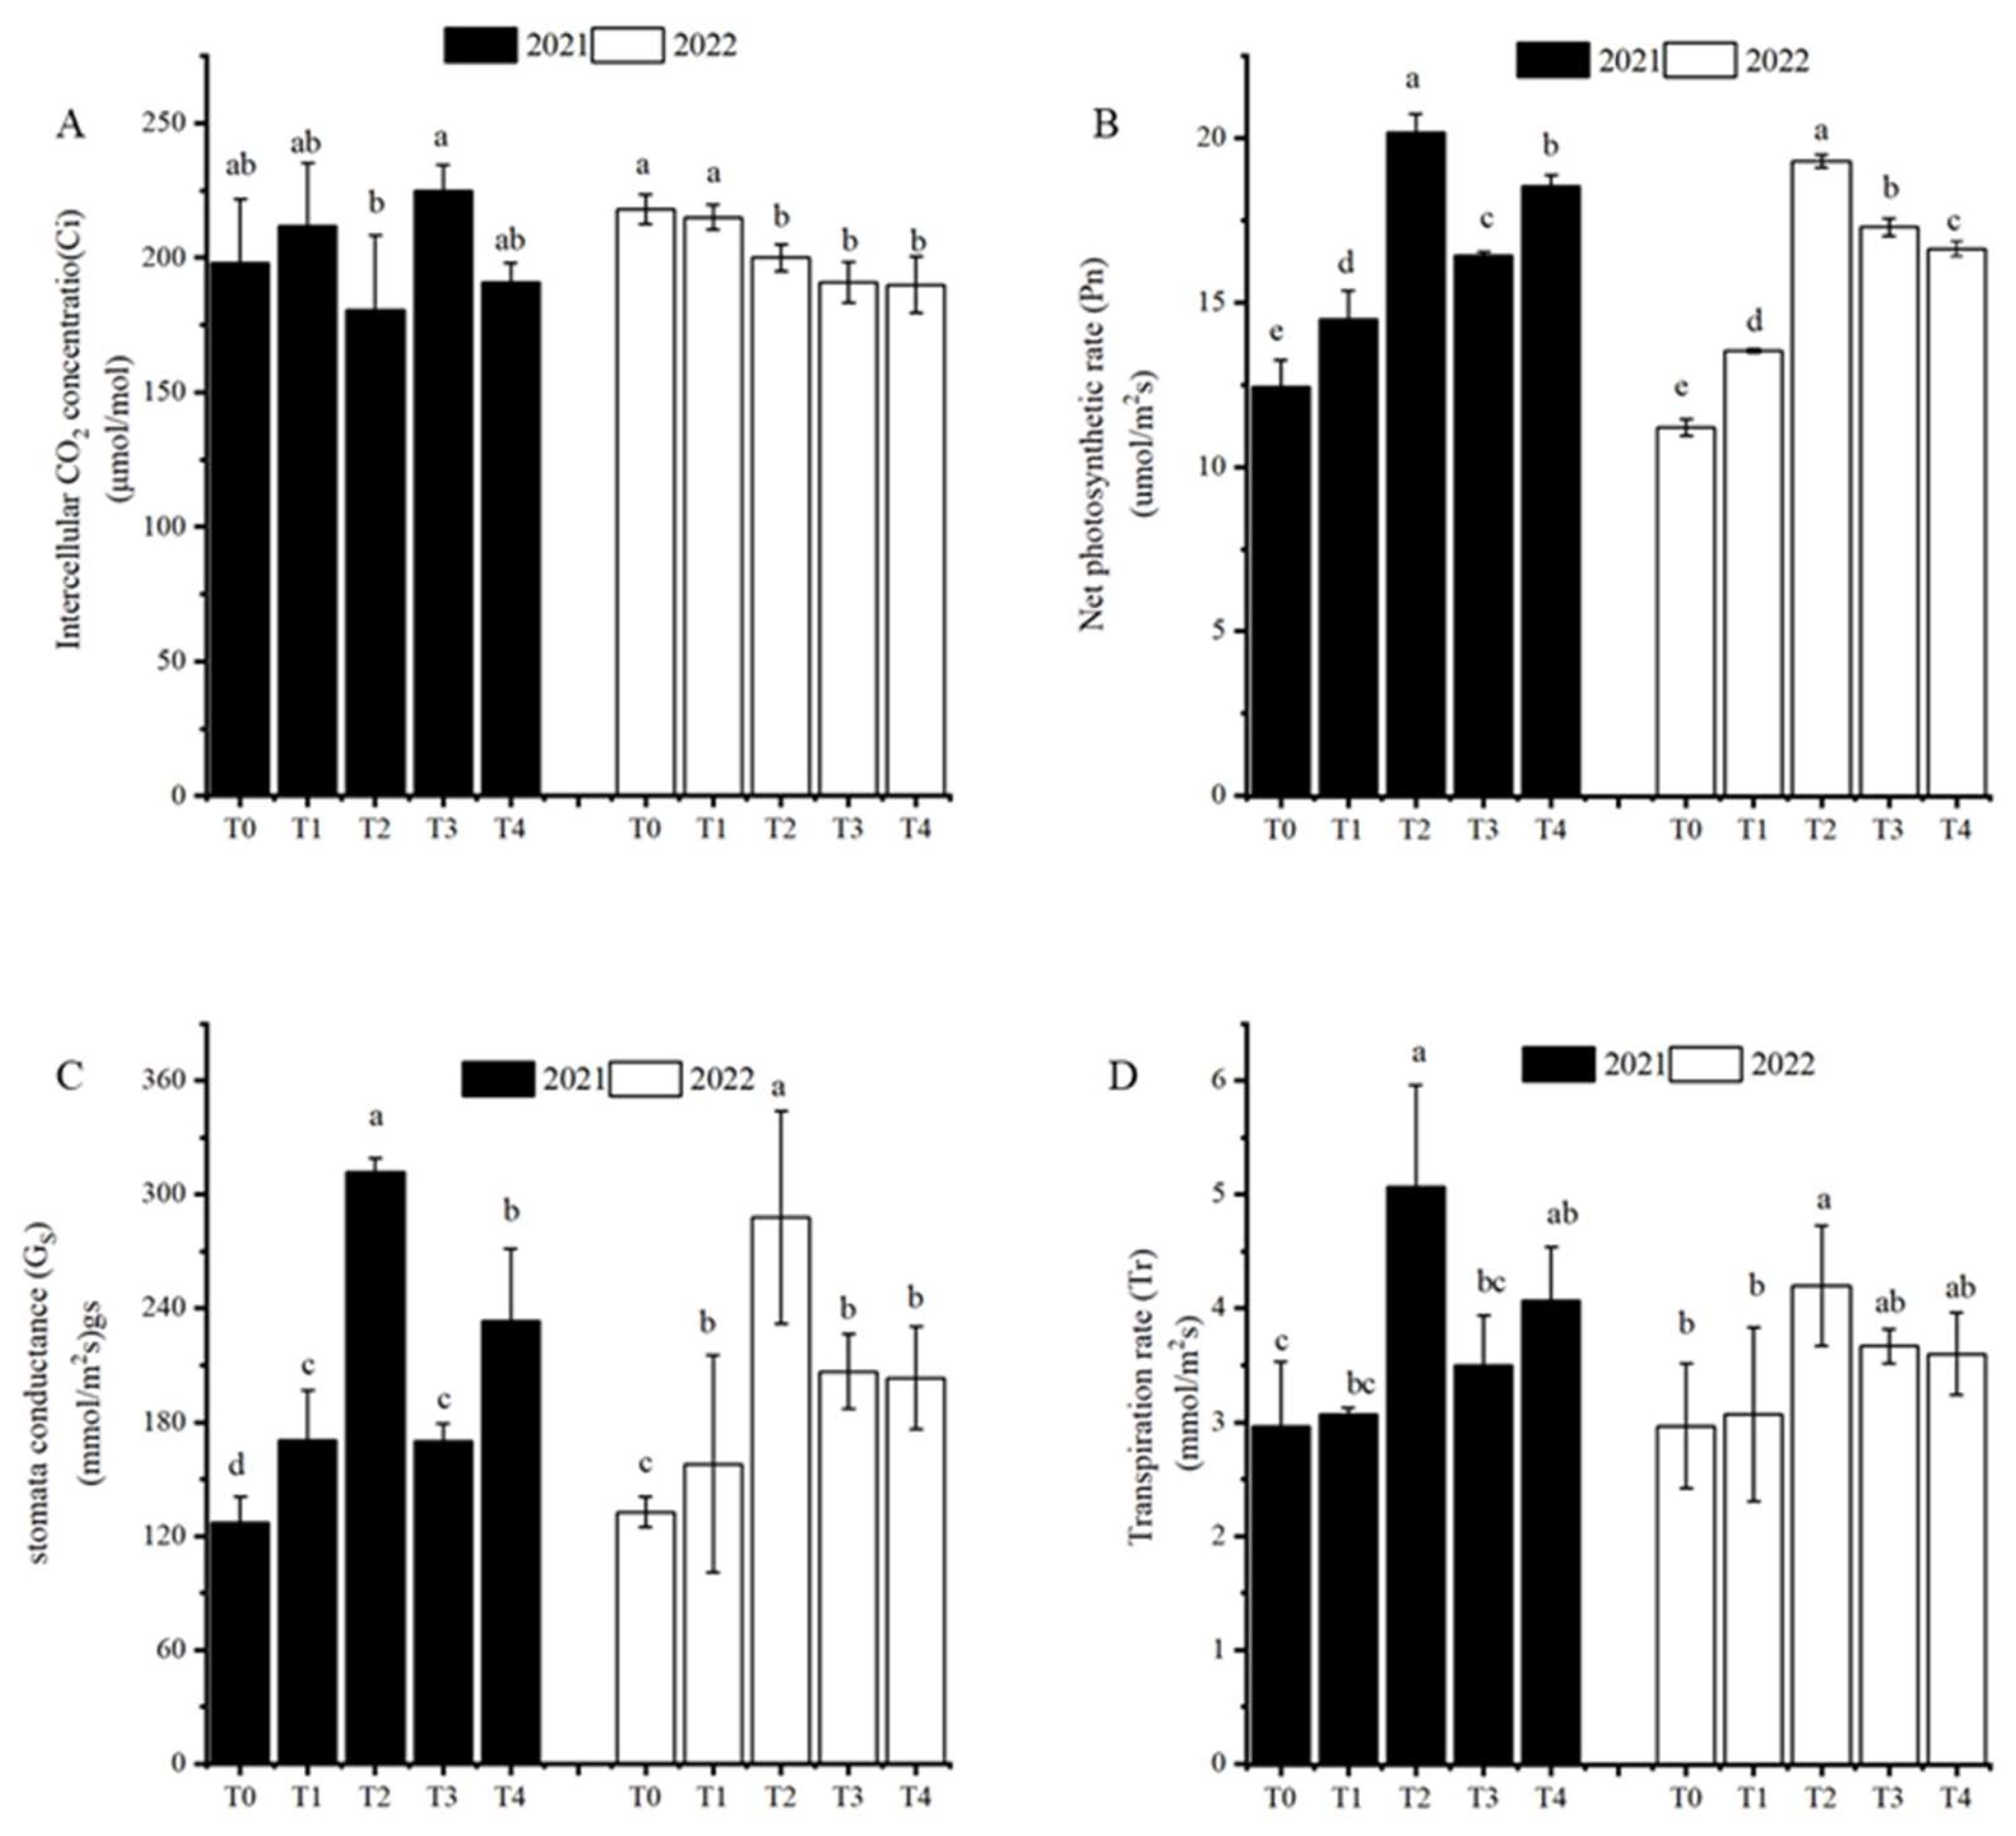
Late-season irrigation had differential effects on the intercellular carbon dioxide concentration (Ci), net photosynthetic rate (Pn), transpiration rate (Tr) and stomatal conductance (Gs). In 2021 and 2022, Ci under T0 was significantly higher than under T2, but not significantly different from that in T1. All irrigation treatments (T1–T4) significantly increased the Pn and Gs of functional leaves compared with the non-irrigation treatment (T0) (p < 0.05). Pn and Gs were significantly higher under T2 than under T1, T3 and T4 (p < 0.05). Over the two-year period, Tr showed an increasing trend as the level of irrigation increased, but when the irrigation amount exceeded that of T2, the trend reversed and Tr decreased. Thus, late-season irrigation, especially at the T2 level, improved the net photosynthetic rate, stomatal conductance, and transpiration rate of functional leaves (Figure 2).

2.3. Effects of Irrigation Levels on 13C Accumulation and Allocation in Late-Season Sweet Potato Growth

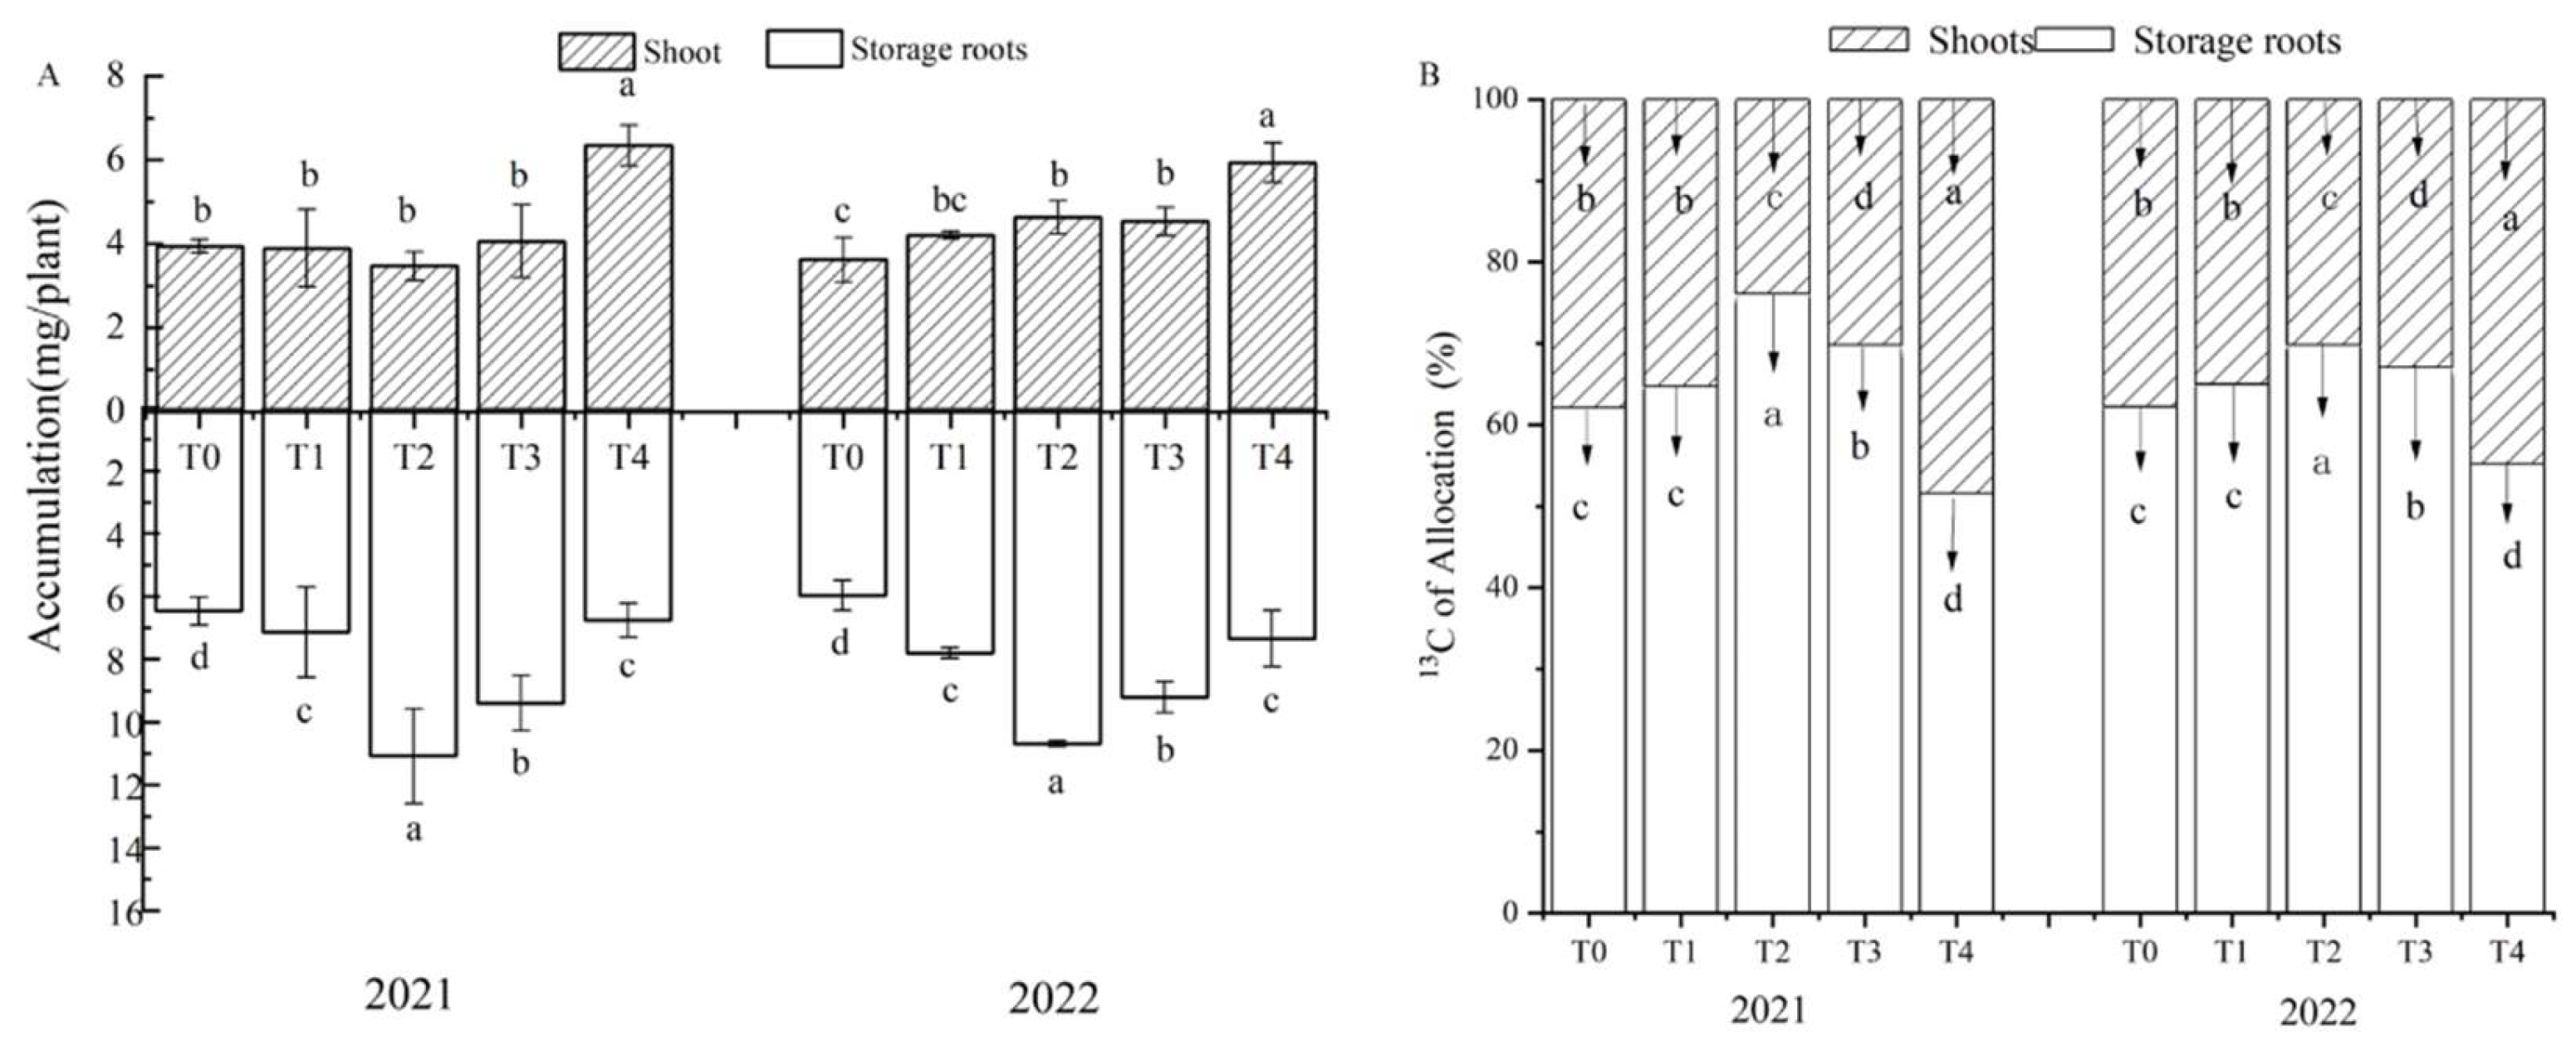
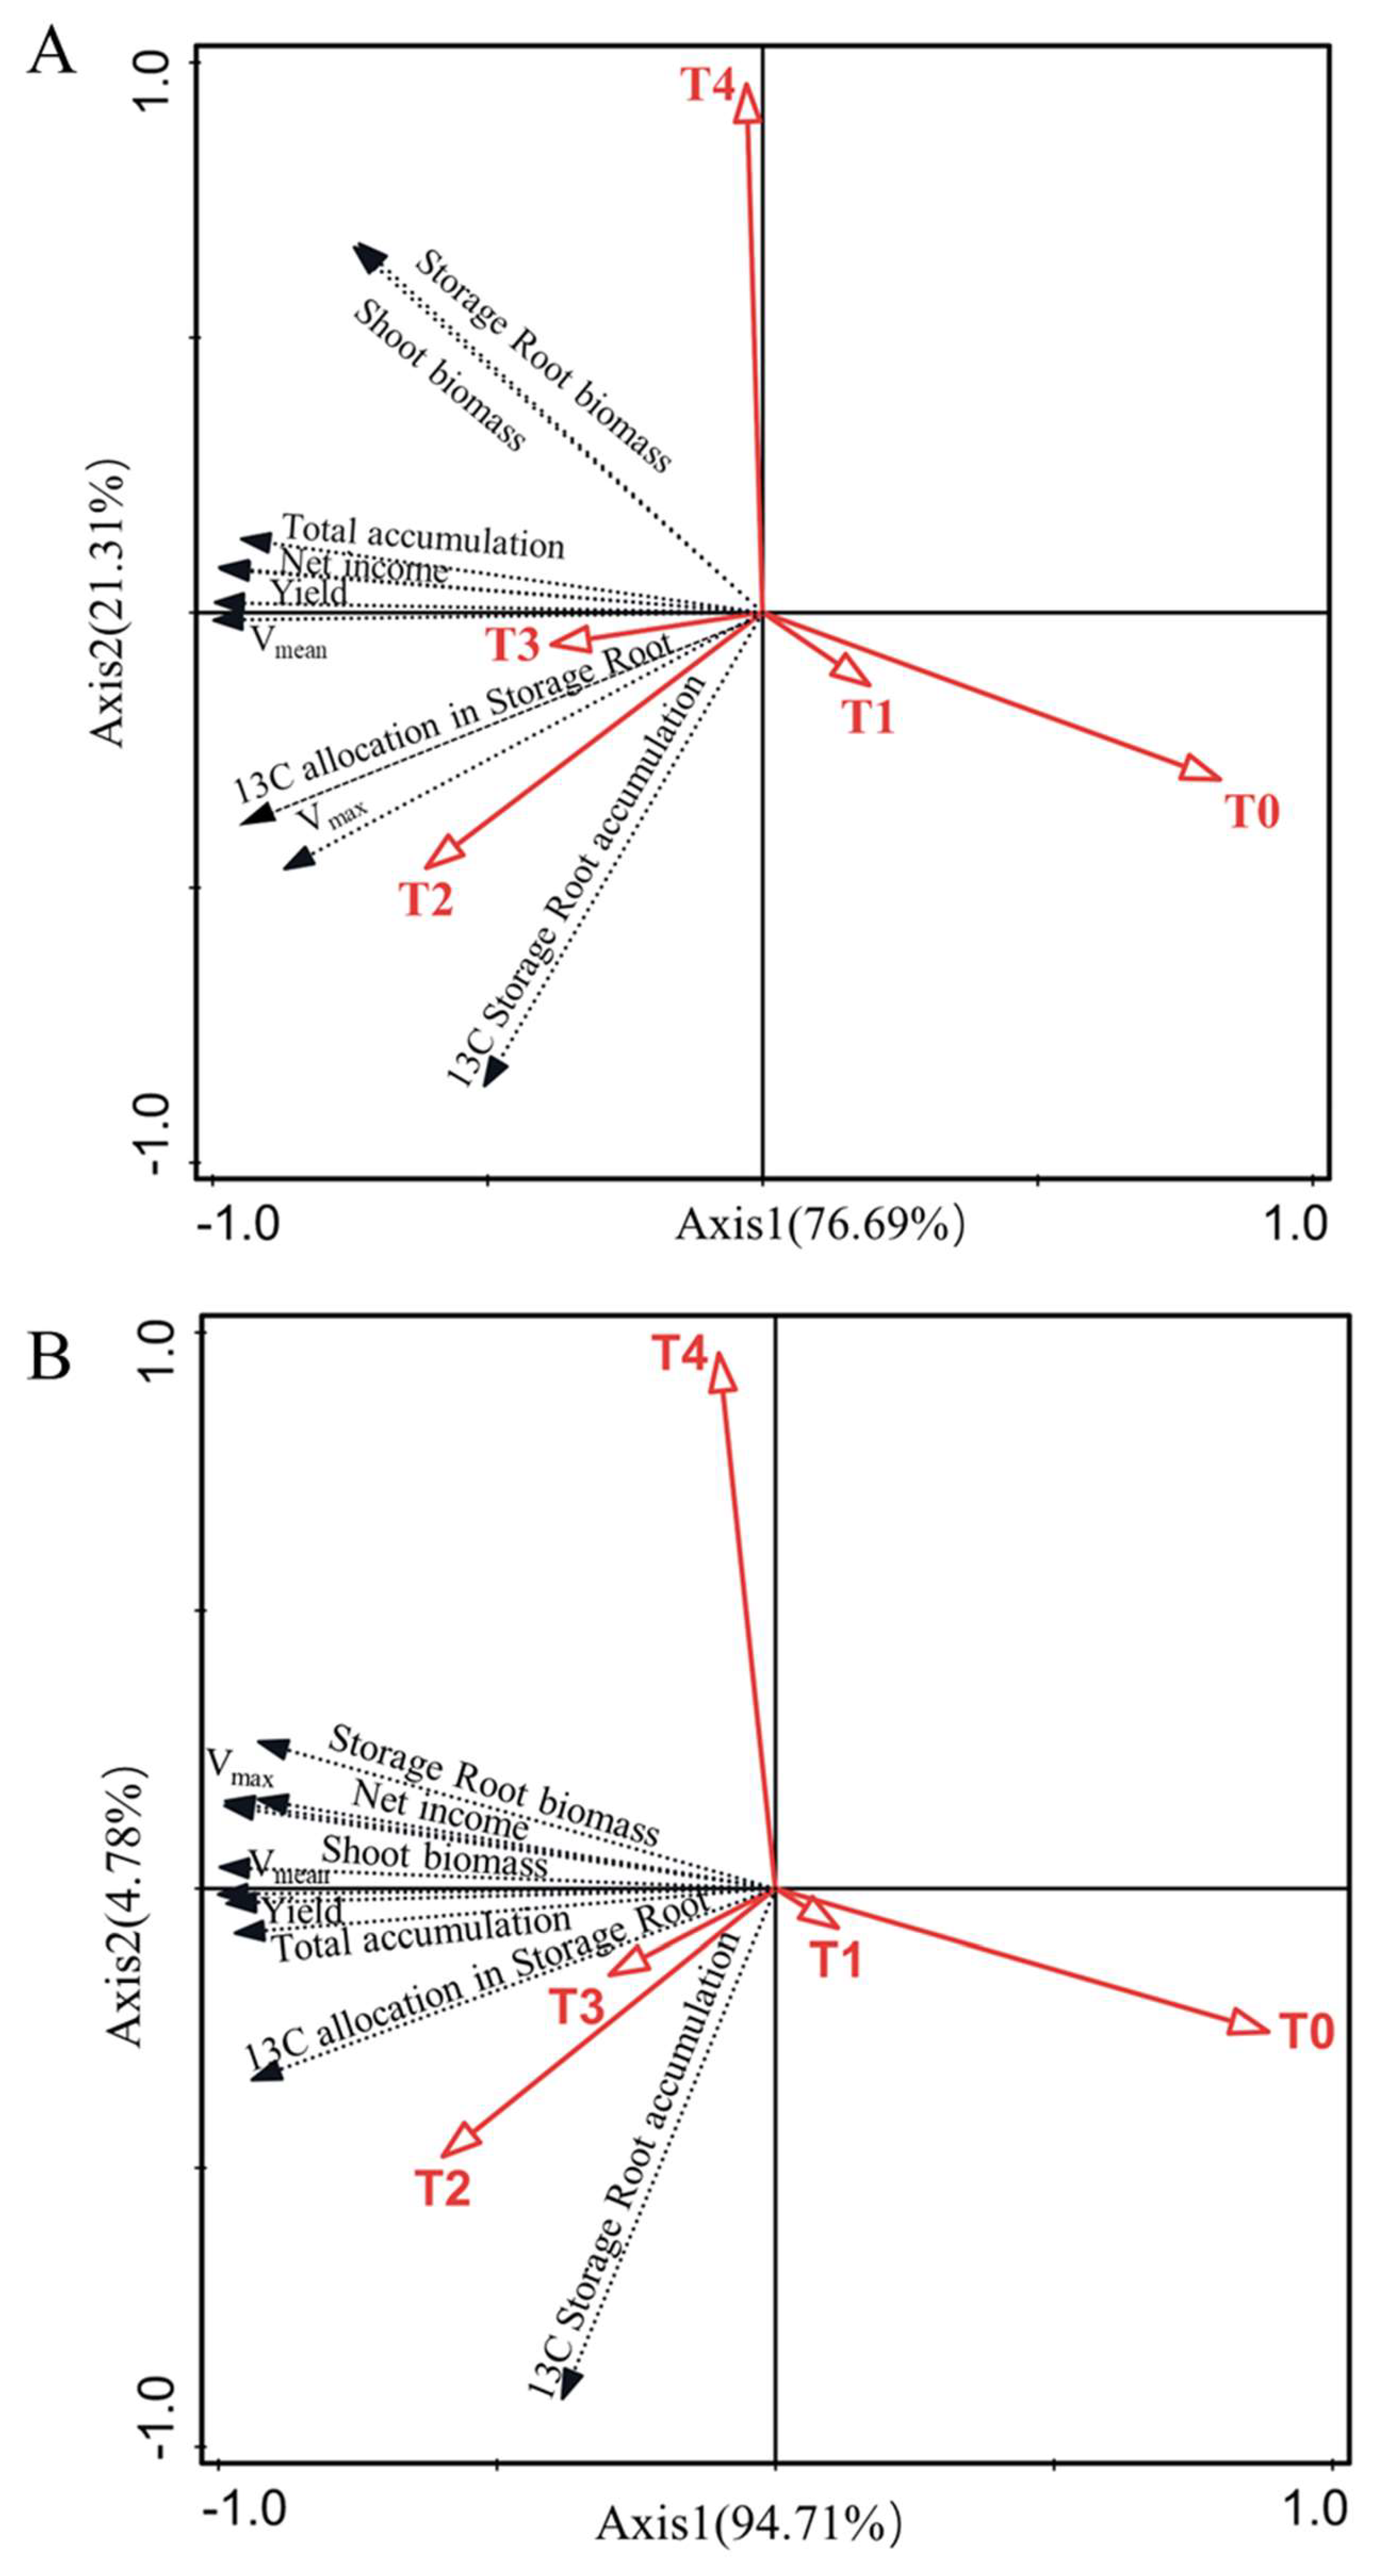
Supplemental irrigation at the bulking stage (124 days) significantly changed the accumulation and allocation rate of 13C in the shoots and storage roots of sweet potato (p < 0.05; Figure 3). 13C accumulation in sweet potato storage root was significantly higher under the different irrigation levels than under non-irrigation (T0) (p < 0.05). 13C accumulated in sweet potato storage root under irrigation in the order T2 > T3 > T1 > T4, and there was a significant difference between the T2 treatment and the other three treatments (p < 0.05). 13C accumulation in whole plants was similar to that in storage roots under the different treatments. By contrast, 13C accumulation in the above-ground parts of the plant did not significantly differ between the non-irrigation and irrigation treatments in 2021 (except compared to T4) (Figure 3A). Thus, 13C accumulation was higher in the irrigation than non-irrigation treatments in 2021 than 2022, and the difference was significant in the T2–T4 treatments. Under T0 and T4, the 13C allocation rate was significantly reduced in stems and leaves, but significantly increased in storage roots (Figure 3B). These results indicated that appropriate amounts of irrigation, exemplified by the T2 treatment, promote the allocation and accumulation of photosynthetic products in storage roots. Neither non-irrigation nor excessive irrigation was conducive to the allocation of 13C to storage roots. Redundancy analysis (RDA) showed that an irrigation level based on 75% evapotranspiration (T2) correlated well with total 13C accumulation by sweet potato, 13C accumulation by each organ, and the 13C allocation rate of the storage root (Figure 4).

2.4. Effects of Irrigation Level on the Dynamics of Dry Matter Accumulation in Storage Root

Dry matter accumulation by storage root was well-fitted using a logistics function (R2 > 0.99) (Table 2). The results showed that late-season irrigation changed the termination time and duration of rapid dry matter accumulation in sweet potato roots. In 2021, compared with T0 (non-irrigation), the end time (t2) of the rapid accumulation of storage root dry matter under irrigation was delayed by 3–4 days and the duration (T) was extended by 2–5 days. In 2022, the corresponding values were 3–6 days and 1 day. Moreover, late-season irrigation also affected the accumulation rate of dry matter. Compared with T0, the Vmean under irrigation (T1–T4) was significantly increased by 12.90–27.10% and 8.94–16.67% in 2021 and 2022, respectively (T2 > T3 > T4 > T1); however, the Vmean began to decline when the irrigation amount exceeded that of T2. The maximum accumulation rate (Vmax) in T0 was lower than that in T1–T4 (T2 > T3 > T1 > T4). The Vmax in T0 was 13.69% and 17.56% lower than that in T2 in 2021 and 2022, respectively. The variation in the trend of the theoretical maximum accumulation (Wmax) was similar to that in the Vmean, with irrigation (T1–T4) increasing the Wmax compared with non-irrigation (T0). These results demonstrated the importance of irrigating sweet potato during the late-season of its growth. Irrigation maintained at the T2 and T3 levels prolonged the rapid accumulation time and increased the accumulation rate of dry matter, thus aiding achievement of the maximum theoretical yield (Table 2). The RDA showed that the Vmean and Vmax were significantly positively correlated with the T2 and T3 treatments, but significantly negatively correlated with T0 and T1 (Figure 4).

2.5. Effects of Irrigation Level on the Yield and Water Use Efficiency of Sweet Potato

A two-way analysis of variance showed that irrigation and year had no significant interaction with yield, but irrigation and year had significant effects on yield. Compared with non-irrigation, the yield of sweet potato under the irrigated treatments was significantly increased by 13.30–28% and 11.7–20.0% in 2021 and 2022, respectively (p < 0.05). Among the irrigation treatments, the yield obtained with T2 was significantly higher than that obtained with T4 and T1, but did not significantly differ from that obtained with T3. The RDA showed significant positive correlations of production with the T2 and T3 treatments, while the correlations of production with the T0, T1 and T4 treatments were weak (Figure 4). Late-season irrigation increased the moisture content of the 0–60-cm soil layer, as well as the actual evapotranspiration of sweet potato. In the two-way analysis of variance, the changes in WUE and WP were significantly affected by irrigation, but were independent of year. WUE in the T0 and T4 treatments was significantly lower than in the T1–T3 treatments. Compared with the T2 treatment, the WUE of T0 and T4 decreased by 15.13% and 13.42%, respectively. WP was significantly higher under irrigation than non-irrigation (p < 0.05) conditions and was, on average, 19.13% higher in the T2 than T0 treatment. These results showed that moderate irrigation (T2) during the late-season growth can significantly increase the yield and water utilisation of sweet potato (Table 3).

2.6. Effects of Late-Season Irrigation on the Economic Benefits of Sweet Potato

Compared with T0 (non-irrigation), irrigation (T1−T4) improved the net profitability of sweet potato by $1377.74–2483.18 US ha−1 in 2021 and by $1764.00–3644.41 US ha−1 in 2022. Net profitability according to the level of irrigation was in the order T2 > T3 > T4 > T1. However, irrigation also increased the total investment, mainly due to the added costs of utilities and labour. Irrigation according to T2 increased the total yield (>150 g) by an average of 36.1% compared with T0 over the two years of the study. These results show that late-season irrigation can increase the commodity yield, and thus, net profitability of sweet potato (Table 4). According to the RDA, net profit correlated positively with irrigation, and there was a significant positive correlation between net profit and the T2 treatment (Figure 4).

3. Discussion

3.1. Effects of Late-Season Irrigation on Biomass, Chlorophyll Concentrations and Photosynthetic Parameters of Sweet Potato

In this study, field experiments were conducted to explore the effects of different irrigation levels on sweet potato during its late growth stage, and thus on its yield. Although the metabolic centre of sweet potato begins to shift from stem to storage root during the bulk expansion stage, insufficient or excessive leaf biomass accumulation will negatively affect the storage root yield of sweet potato [24]. In this study, dynamic sampling (S1–S3) of late-season sweet potato showed that irrigation significantly increased the plant’s above-ground and subsurface biomass over that achieved with no irrigation (Table 1). However, with increasing irrigation, the above-ground parts of sweet potato increased consistently, whereas below-ground biomass first increased and then decreased. This result suggested that an appropriate irrigation level can positively influence both above- and below-ground sweet potato parts, and therefore the yield.
Photosynthesis is the physiological basis of plant growth, and the absorption, transfer and transformation of light energy by plants are mainly completed through leaf chlorophyll [25]. However, plant leaves are extremely sensitive to the soil water conditions: an insufficient water supply will accelerate leaf senescence, resulting in a significant decline in the photosynthetic rate [26]. This study showed that late irrigation, especially at T2 irrigation level, could significantly slow the decline in chlorophyll content in functional leaves (Figure 1). This phenomenon may occur because irrigation promotes metabolic activity of chloroplasts, reduces the accumulation of reactive oxygen species, protects chloroplast membrane structure, and thus, reduces chlorophyll degradation [5,27]. This indicated that moderate irrigation of late-season sweet potato could slow down senescence of leaves and prolong the functional period of leaves [28,29,30]. In this study, the trends of Pn and Gs were similar, and under irrigation, both were significantly higher than in the non-irrigation treatment (Figure 2), in accordance with the previous findings of Ma, Morrison and Voldeng (1995) and Riekert and Robert (2008) that irrigation improves stomatal conductance, and thus, the photosynthetic rate [5,31]. This may reflect the increase in soil water content and leaf water potential, and stomatal openness (and thus, the carbon dioxide fixation rate induced by irrigation) [32], but may also be related to the degree of leaf senility. Haimeirong and Kubota (2003) and Niari and Abdollah (2012) found that stomatal conductance correlated negatively with the degree of leaf senility in sweet potato and wheat, respectively, and that irrigation slowed leaf senility; consequently, gas exchange in leaves was promoted and the photosynthetic rate increased [33,34]. The results showed that moderate irrigation of late-season sweet potato can prolong the functional period of the source and improve its photosynthetic efficiency. This is necessary to stimulate sink activity.

3.2. Effects of Late-Season Irrigation on the Relationships among 13C Allocation, Storage Root Enlargement and the Source–Sink Relationship of Sweet Potato

The photosynthate capacity of source leaves and transport capacity of photosynthate products from source to reservoir are important for storage root yield [35]. This study found that moderate irrigation significantly increased the total accumulation of 13C and the allocation rate in the storage roots of sweet potato as compared with non-irrigation (T0) and overirrigation (T4) (Figure 3), which was consistent with the rule also found in Li et al. (2021) for irrigation of mid-season sweet potato [9]. The results showed moderate irrigation improves the source–sink relationship, and thus, the transport of assimilates to storage. Non-irrigated (T0) and overirrigation (T4) were not conducive to the transfer and allocation of photosynthetic products to storage roots. This may be due to the fact that irrigation enhanced the photosynthate ability of the source and increased the fixation of photosynthate in the shoot [36]. No irrigation inhibits the growth of the source, leading to insufficient photosynthetic products to transport to storage roots. Over-irrigation leads to overgrowth of shoot and leaf, more allocation of photosynthetic products to metabolic sink (immature leaf), and less allocation to storage sink (root tuber) [37].
Source–sink coordination to achieve a balanced condition is a prerequisite for achieving a high crop yield [38]. Increasing sink strength is an important strategy to improve crop production potential, and sink strength can be expressed by the product of sink size and sink activity [35]. Ferreirah (2019) identified an S-shaped growth curve of dry matter accumulation in sweet potato storage roots [39]. A logistic function is a typical S-shaped growth curve that accurately quantifies crop growth [40,41]. Our fitting of the logistic function describing dry matter accumulation in storage root showed that, compared with non-irrigation, both a delay in the termination time of rapid dry matter accumulation in storage roots and prolongation of the process were achieved with irrigation. Late-season irrigation, especially at T2 irrigation level, significantly increased the rate of rapid dry matter accumulation (Vmax and Vmean) (sink activity) in storage roots (Table 2). The results showed that the transfer and allocation of photosynthate from source to sink under irrigation at late-season was that source increased the allocation of photosynthate to sink by stimulated activity of sink. The probable reason was that irrigation treatment prolonged functional period of source leaves as well as the net photosynthetic rate, thus increased the source strength [42].

3.3. Effects of Late-Season Irrigation on Sweet Potato Yield and Water Use Efficiency

As sweet potato is a moderately drought-tolerant crop, water management in the middle and late stages of its growth has been largely ignored. Consequently, the potential production capacity of sweet potato is often not fully developed and the yields are unreliable [43]. However, when the water supply is insufficient, sweet potato production is reduced due to drought stress, whereas when the water supply exceeds demand, water resources are wasted [43]. Determining the appropriate irrigation level for sweet potato will improve both its yield and WUE [44]. Studies using evapotranspiration to guide the irrigation of other crops have reported that an ETc of 70–100% results in higher yields and better WUE. Shammout et al. (2018) obtained the highest yield of sweet pepper (Capsicum annuum L.) under 80% ETc irrigation [45]. The field study of Yang (2017) showed that the yield and quality of potato, as well as WUE, were highest during the whole growth period when irrigation was based on 80% ETc [46]. In a field study conducted in an arid area in northwest China, Zheng et al. (2012) found that 100% ETc irrigation in the early and middle growth stages, and 40% ETc irrigation in the late growth stage, increased the yield and WUE of onion [16]. In the study of Mattar et al. (2020), 100% ETc irrigation improved tomato yield, fruit quality and irrigated WUE compared with 70% ETc irrigation [17]. Our results showed that late-season irrigation increased sweet potato yield, WUE and WP, but when the irrigation amount exceeded 75% ETc (T2), they declined. This is similar to the results obtained by Smittle et al. (1992) through field experiments and Gajanayake and Reddy (2016) through greenhouse experiments, which achieved the maximum yield under ETc 76% and ETc 72% irrigation, respectively [18,19]. Inconsistencies among studies may be due to differences in the type and variety of crops studied, as well in the environmental conditions, such as soil type and air temperature [47,48]. In summary, moderate irrigation (75% ETc) in the late-season not only improves irrigation WUE, but also results in high yields and should thus be implemented in agricultural production.

4. Materials and Methods

4.1. Experimental Site Description

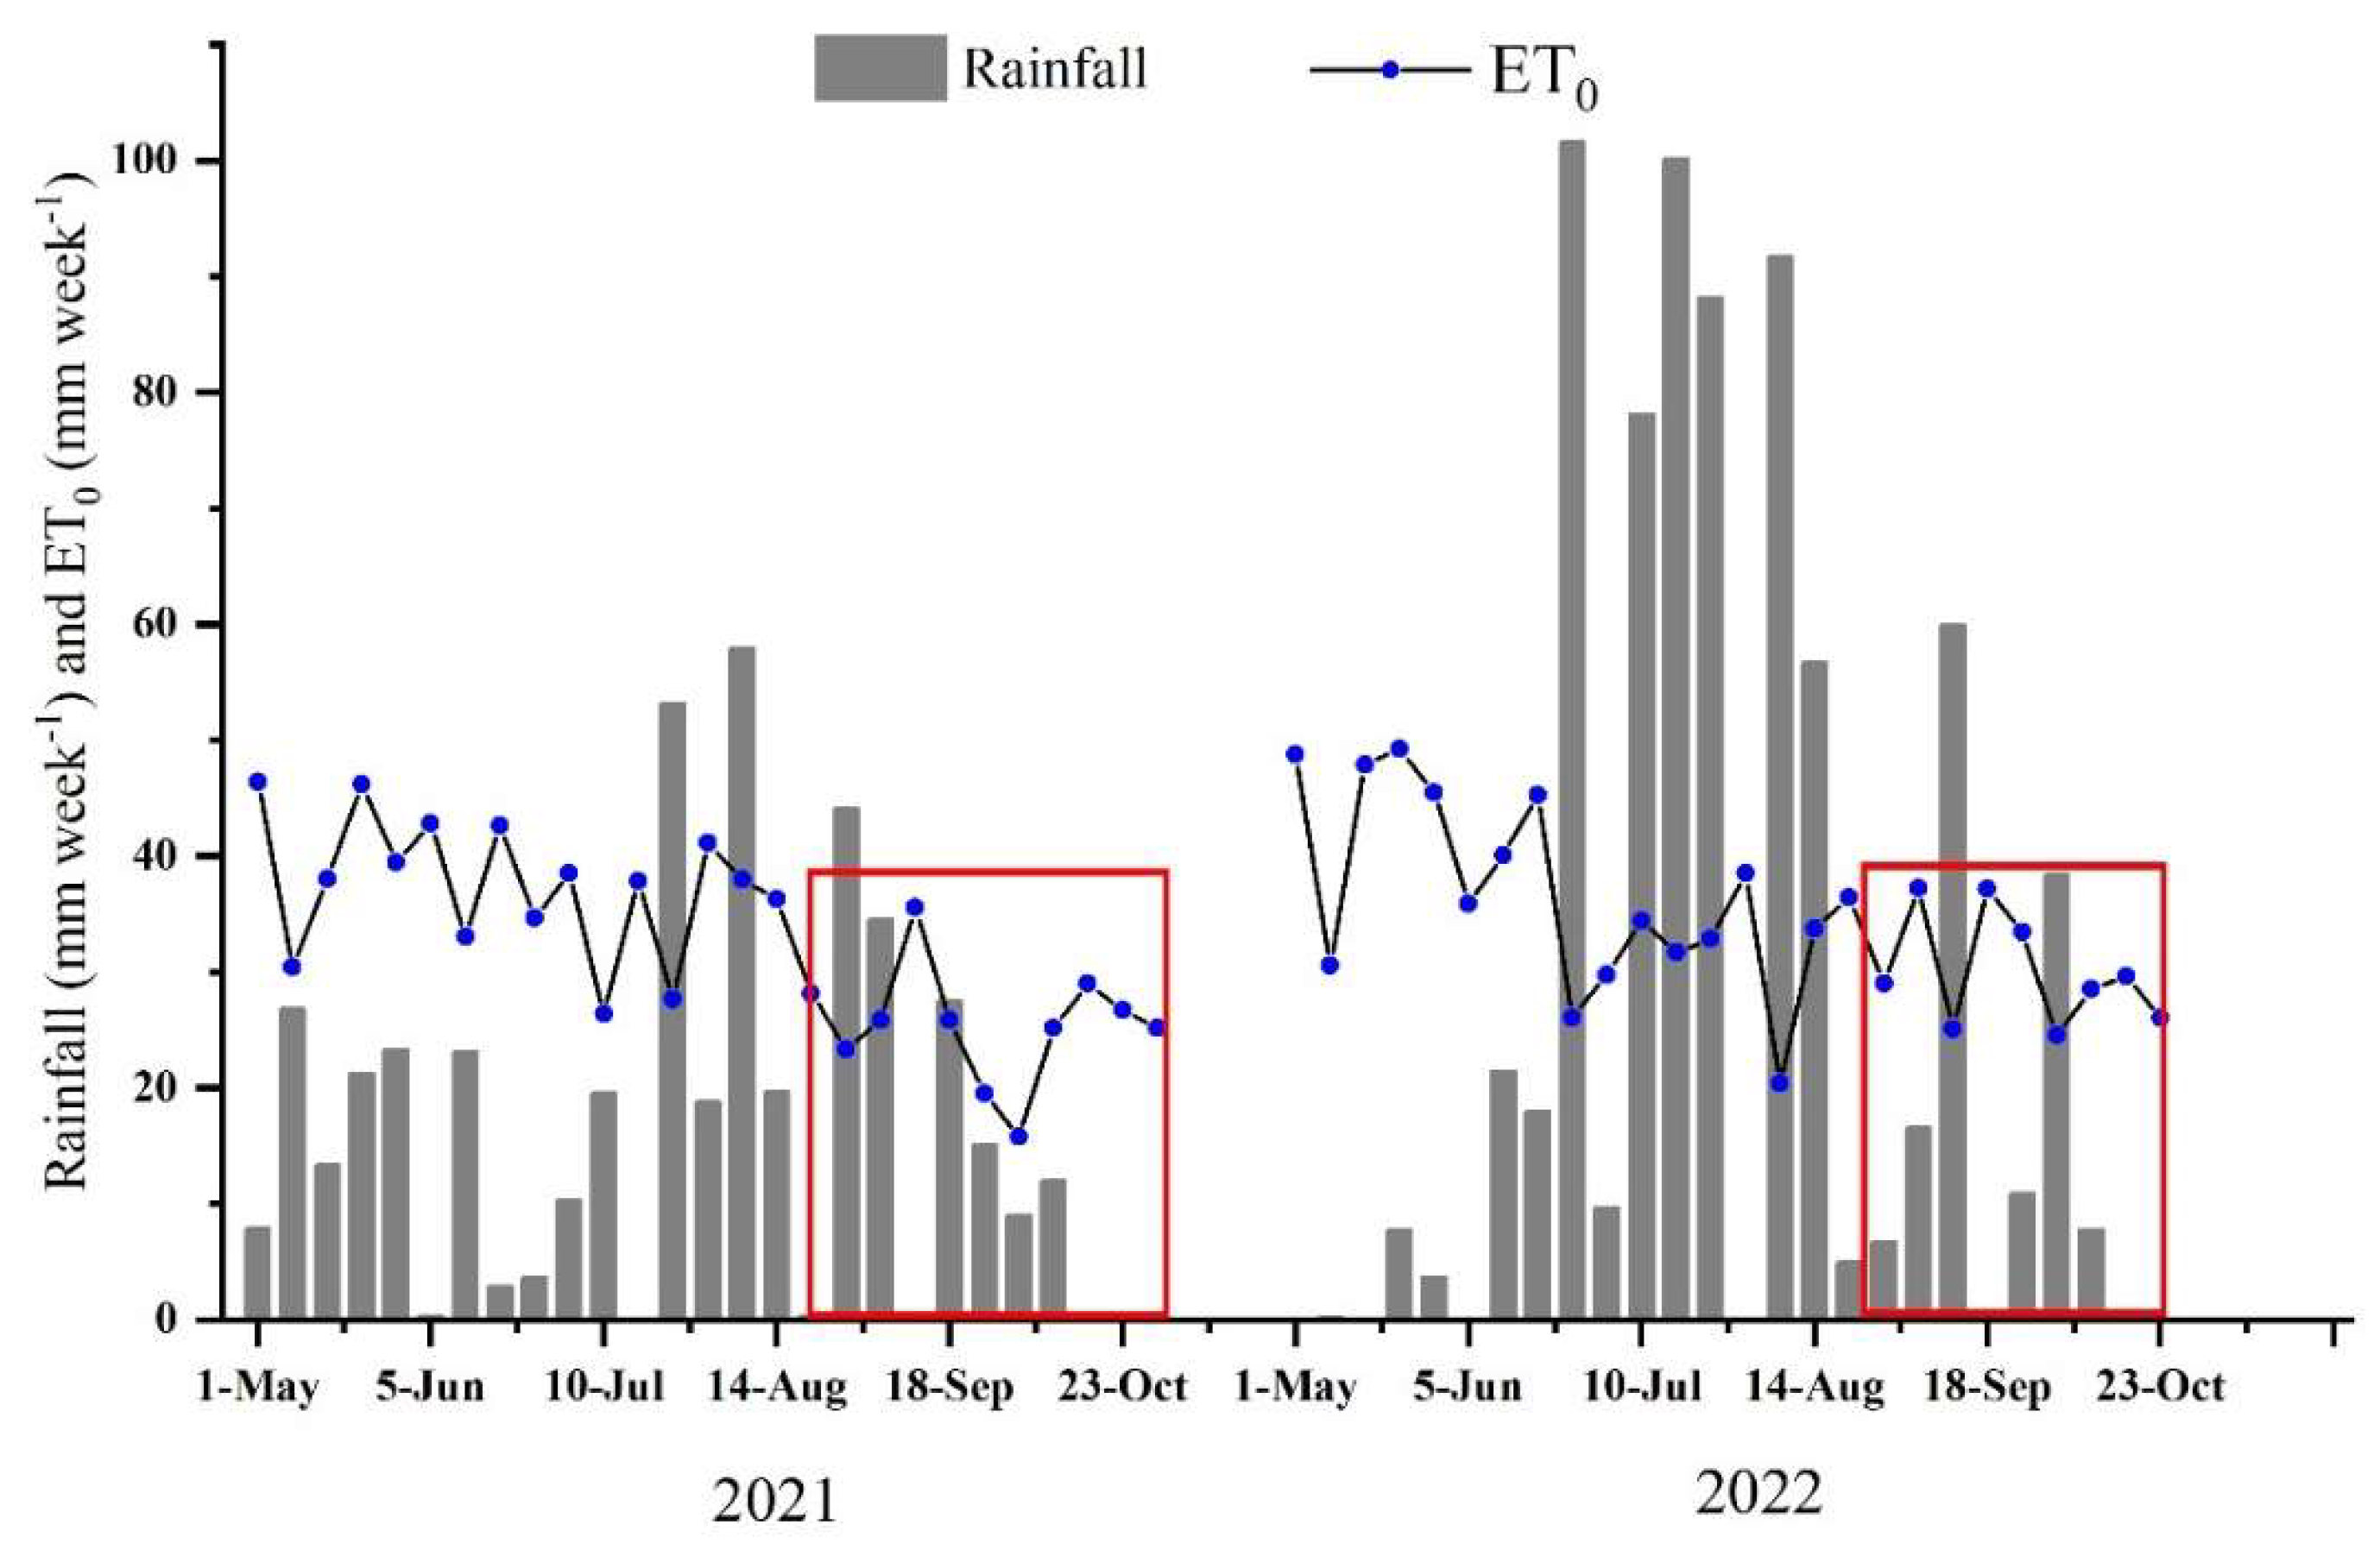
The field experiment was performed at a semi-humid site, i.e., the Nan village experimental base in Pingdu city, Shandong, China (36°53′ N, 120°13′ E) during 2021 and 2022. The climate is temperate semi-humid with an average annual precipitation of 630 mm, approximately 51% occurring between July and August. The local mean annual air temperature is 12.9 °C, according to the local average levels over the last 30 years (hppts://data.cma.cn (accessed on 10 August 2021)). A weather station was installed near the experimental area to monitor and record meteorological data. The mean air temperature was 22.47 °C and 22.37 °C, and the total net radiation was 2657.97 MJ m−2 and 2580.56 MJ m−2 in the 2021 and 2022 growing seasons, respectively. Precipitation and reference evapotranspiration during the 2021 and 2022 growing seasons are shown in Figure 5. The average sand, silt and clay contents in the 0−60-cm soil profile were measured with a laser particle size analyzer (BT-9300ST, Dandong baite, Liaoning, China) The soil consists of 19.5% clay (<0.002 mm), 43.2% silt (0.002–0.05 mm), and 37.3% sand (0.05–2.0 mm). It has a field water holding capacity of 28.5% and a permanent wilting coefficient of 12.1%. The average bulk density in the 0–60 cm soil layer is 1.3 g cm−3. The top layer of soil (20 cm) has a pH of 6.7, organic carbon of 11.7 g kg−1, total nitrogen of 60.4 g kg−1, available p of 19.4 mg kg−1, and available K of 66.5 mg kg−1, respectively.

4.2. Experimental Design and Treatments

The experimental variety of sweet potato was Yan 25, which is the main fresh food variety in northern China. The 2021 crop was planted on 20 May and the 2022 crop on 25 May. The plant is cultivated in raised bed, mulched film mode. In the late-season, five experimental treatments based on the evapotranspiration rate (ETc) were established: non-irrigation (T0), 33% ETc (T1), 75% ETc (T2), 100% ETc (T3), and 125% ETc (T4) (Table 5). A random block design was adopted with triplicates of each treatment. The area of each plot was 50 m2 (length: 10 m, width: 5 m) and the plot planting density was 200 plants (40,000 plants per hectare). It was used to dynamically monitor the volumetric water content of the soil layer between 0 and 60 cm. A soil moisture sensor (QY-800S, Qingyi, Hebei, China) was installed in each plot. The soil moisture sensor adopts a layered monitoring structure, and the underground soil is equipped with a soil moisture measuring point every 20 cm to dynamically monitor the soil moisture in the corresponding range. The applied fertilizer dose was 75 kg hm−2 for superphosphate, 150 kg hm−2 for urea, and 150 kg hm−2 for potassium sulphate.

4.3. Irrigation Treatments

The crop reference evapotranspiration rate (ET0) was calculated in the test area based on daily meteorological data, using the FAO 56 Penman–Monteith equation [49], adapted in Equation (1).
ET 0 = 0 . 408 Δ R n G + γ 900 T + 273 u 2 ( e x e a ) Δ + γ ( 1 + 0 . 34 u 2 )  
where ET0 is the reference evapotranspiration rate (mm d−1); Rn is the net radiation (MJ m−2 day−1); G is the soil heat flux (MJ m−2 day−1); γ is the psychrometric constant (kPa °C−1); T is the air temperature at 2 m height (°C); u2 is the wind speed at 2 m height (m s−1); es is the saturation vapor pressure (kPa); ea is the actual vapor pressure (kPa); and Δ is the slope of the vapor pressure curve (kPa °C−1). The crop growth coefficient Kc was calculated according to Equation (2), and the crop evapotranspiration rate (ETc) was obtained with Equation (3). When the soil water content in the 0–20 cm layer was less than 60% of the field capacity, irrigation was carried out after calculation of the irrigation amount according to Equations (4) and (5). Thereafter, supplementary irrigation was conducted every 7–15 days.
K c = K c a + 0 . 04 u 2 2 0 . 04 RH min 45   ×   h 3 0 . 3
ET c = ET 0   ×   K c
ET m = 0 n ET c  
I = ET m P ,   ( ET m     P ,   I = 0 )
where Kc is the crop growth coefficient, which varies according to growth stage (for sweet potato, values range from 0.65 to 1.15 [49]; K c a is the crop coefficient calculated under standard conditions of the different growth stages (obtained from FAO 56 data); RHmin is the minimum daily relative mean humidity during a given growth stage (%); h is the average height of the crop during a given growth stage (m) and u2 is the wind speed at 2 m height (m s−1). In Equation (3), ETc is the daily crop evapotranspiration (mm d−1). In Equation (4), ETm is the cumulative evapotranspiration over the monitoring period and n is the number of days between irrigations. In Equation (5), I is the irrigation amount (mm) and P is the effective rainfall (mm); when the rainfall is >5 mm within 24 h, it is the effective rainfall.

4.4. Data Collection

4.4.1. Determination of Sweet Potato Biomass

We collected samples on experimental days 36, 100, 115, 124, 134, 144, 150 (harvest date 2022), and 160 (harvest date 2021). We randomly sampled 6 whole sweet potatoes under each treatment. Shoots and storage roots were separated and taken to the laboratory for determination of fresh weights and partially decomposed; they were dried at 80 °C for 48 h to constant weight.

4.4.2. Determination of Chlorophyll Content

Samples were obtained on experimental days 124, 134 and 144. Six whole sweet potatoes were randomly sampled under each treatment and processed using the acetone ethanol solution colorimetric method. Briefly, a portion (0.1 g) of the fourth functional leaf was added to 50 mL of acetone ethanol solution (4.5:4.5:1) in the dark for 48 h, after which absorbance was determined at wavelengths of 663 and 645 nm. The contents of chlorophyll a (Chl-a), chlorophyll b (Chl-b) and total chlorophyll (Chl-n) were calculated according to Equations (6)–(8), respectively:
C a = 12 . 72 A 663 2 . 69 A 645
C b = 22 . 88 A 645 4 . 67 A 663
C T = C a + C b = 20 . 19 A 645 8 . 05 A 663
where Ca is the Chl-a content (mg g−1), Cb is the Chl-b content (mg g−1), CT is the Chl-n content (mg g−1), and A663 and A645 are the absorbances of the extracted chloroplast pigment at 663 and 645 nm, respectively.

4.4.3. Determination of Photosynthetic Parameters of Sweet Potato Leaves

Seven days after the first supplemental irrigation, six plants were randomly selected from each treatment. The net photosynthetic rate (Pn), stomatal conductance (Gs), transpiration rate (Tr), and the leaf internal CO2 concentration (Ci) of the fourth and fifth functional leaves of each plant were measured by CIRAS-3 portable photosynthesis system (CIRAS-3, Hansha, Boston, MA, USA).

4.4.4. Logistic Regression Equation and Parameters

Samples were obtained on experimental days 36, 100, 115, 144, and 150, with six whole sweet potatoes randomly sampled under each treatment. Dry matter accumulation in the storage root of sweet potato increased with time and could be described by a typical S-shaped growth curve. A logistic function was used to fit the dry matter accumulation dynamics of storage root (Equation (9)).
W = W max 1 + ae bt
where t is the sampling day (d), W is the dry matter of sweet potato tuber (g plant−1), e is a mathematical constant (e = 2.71828), Wmax is the maximum dry matter of sweet potato tuber (g plant−1) and parameters a and b are related to the environmental conditions in the field. The values of a and b, which were derived from the logistic regression, can be used as shown in Equations (11)–(15) to calculate the initiation (t1) and termination (t2) times of dry matter accumulation by sweet potato tuber, the duration of these periods (T), and the maximum rate (Vmax) and average rate (Vmean) of rapid dry matter accumulation by sweet potato tuber:
t 1 = 1 b ln 2 + 3 a
t 2 = 1 b ln 2 3 a
V max = W max × b 4
V mean = W max × b ln 9 a
T = t 1 + t 2

4.4.5. 13C labelling of Sweet Potato Leaves and Determination of the 13C Accumulation and Allocation Ratio

Seven days after the first supplemental irrigation of sweet potato (122 days), the plants were labelled with 13CO2 (13C 99%). Three plants with uniform growth were selected from each plot, and the fourth and fifth leaves of the longest stem were chosen for labelling. The leaves to be marked were sealed in a PVC transparent plastic film bag with a volume of ~40 mL, into which 5 mL of 13CO2 gas was injected from a syringe. Photosynthesis was allowed to proceed for 2 h, after which the transparent plastic bags were removed; the whole plant was harvested 2 days later. The harvested underground parts and storage roots were dried and crushed. Isotope ratio mass spectrometry was used to determine δ13C and total carbon content (C%). The latter measurements were carried out at the stable isotope laboratory of the Department of Plant Science of the University of California (Davis, CA, USA). The calculations are shown in Equations (15)–(18).
Fi % = δ 13 C + 1000 × R Standard δ 13 C + 1000 × R Standard + 1000 × 100 %
(RStandard is the carbon isotope standard ratio, RStandard = 0.0112372)
C 13 i ( μ g / g ) = Total   C Sample   Weight × Fi F Nattural × 10 4
total carbon accumulation (g) = biomass(g) × total carbon content of sweet potato organs (%)
C 13   allocation   rate % = C 13   accumulation   in   the   organ total C 13   accumlation   in   the   plant × 100 %

4.4.6. Sweet Potato Evapotranspiration and Water Use Efficiency

A soil moisture sensor (QY-800S, Qingyi, Hebei, China) was used to measure the soil moisture content at the 60-cm soil layer. Soil measurements were performed before planting, after harvest, and before and after irrigation. Total water consumption or actual evapotranspiration (ETa, mm) was calculated during the growing season using the soil water balance equation (Equation (19)):
ET a = I + P + C R R F D P ± Δ S
where ETa is the actual evapotranspiration (mm) during the growing season, I is the amount of irrigation water applied (mm), P is the precipitation (mm), CR is the capillary rise (mm), DP is the percolation (mm), RF is the runoff (mm) and ΔS is the change in soil moisture content (mm). CR was considered to be zero because the groundwater table was 2 m below the surface; runoff was also assumed to be insignificant because the field was flat, and DP was considered negligible because the soil water content below 60 cm did not reach field capacity on any sampling date.
Crop water use efficiency (WUE, kg ha−1 mm−1) was calculated as the ratio of the sweet potato yield per unit area to total water consumption for the whole season. Water productivity (WP, kg ha−1 mm−1) was calculated as the ratio of sweet potato yield per unit area to the total irrigation and precipitation amount for the whole season, as shown in Equations (20) and (21):
WUE = Y ET a  
WP = Y TWU  
where Y is the sweet potato yield (kg ha−1), ETa (mm) is the corresponding actual amount of crop evapotranspiration during each growing season, and TWU (mm) is the total water irrigation and precipitation amount.

4.4.7. Economic Analysis

Economic return was estimated as shown in Equations (22)–(26):
Economic return ($US ha−1) = Storage roots yield benefit ($US ha−1) − Total cost ($US ha−1)
Storage roots yield benefit ($US ha−1) = Storage roots yield (kg ha−1) × Sweet potato price (US $kg−1)
Toal cost ($US ha−1) = land use fee ($US ha−1) + machinery operating cost ($US ha−1) + irrigation equipment cost ($US ha−1) + fertilizer cost ($US ha−1) + pesticide cost ($US ha−1) + seedling cost (US $ha−1) + labour cost ($US h−1) + electricity cost (m3 ha−1) + water cost (m3 ha−1)
Electricity cost (m3 ha−1) = irrigation amount (m3) × electricity price ($US m−3)
Water cost (m3 ha−1) = irrigation amount (m3) × water price ($US m−3)

4.5. Data Analyses

In order to observe the differences between the treatments, SPSS 20.0 was used to analyze the variance of each indicator data to compare the effective difference between the treatments. The LSD method compared the significance of the difference between the averages. The logistic equation was performed with Curve Expert Professional 2.6.5 software. In order to clarify the correlation between soil moisture, chlorophyll content in leaves, photosynthetic parameters, characteristic parameters of logistics model, 13C accumulation, yield and water use efficiency, RDA (redundancy analysis) was performed using Canoco 5.0.

5. Conclusions

In northern China, timely irrigation of late-season sweet potato not only reduced the soil water deficit, but also enhanced the physiological functions of sweet potato. Late-season irrigation prolonged the functional period of functional leaves, promoted dry matter accumulation, increased the yield, and resulted in greater economic benefits. The 75% ETc (T2) moderate irrigation effectively promoted the source–sink balance, enhanced the source photosynthetic rate and stimulated the sink activity, such that more photosynthate is allocated to the storage sink, resulting in a high yield. Over-irrigation at 125% ETc (T4) increased the source capacity, but caused more photosynthates to be allocated to the metabolic sink supporting the growth of young leaves, which was not conducive to a good source–sink balance of sweet potato and did not increase production, causing waste of water resources. Thus, 75% ETc (T2) irrigation should be implemented for late-season sweet potato, as it improves the yield of this important crop, and by extension, farmers’ incomes.

Author Contributions

Conceptualization, H.L.; methodology, M.Z. and H.L.; investigation, M.Z. and Y.S.; resources, Q.L.; writing—original draft preparation, M.Z.; writing—review and editing, M.Z.; editing and project administration, H.L. and S.W. All authors have read and agreed to the published version of the manuscript.

Funding

This work was supported by the China Agriculture Research System [No. CARS-10-B11] And the High-level Talent Fund of Qingdao Agricultural University (20210059).

Data Availability Statement

Not applicable.

Acknowledgments

This research was funded by the China Agriculture Research System (No. CARS-10-B11) and the High-level Talent Fund of Qingdao Agricultural University (20210059). We are thankful for the constructive comments received from anonymous reviewers and the editors.

Conflicts of Interest

No conflicts of interest exist in the submission of this manuscript. The work described herein was original research that has not been previously published, and is not under consideration for publication elsewhere, in whole or in part. All authors listed have approved the enclosed manuscript for publication.

References

  1. Sonnewald, U.; Fernie, A.R. Next-generation strategies for understanding and influencing source-sink relations in crop plants. Curr. Opin. Plant Biol. 2018, 43, 63–70. [Google Scholar] [CrossRef]
  2. Gajanayake, B.; Reddy, K.R.; Shankle, M.W.; Arancibia, R.A. Growth, developmental, and physiological responses of two sweetpotato (Ipomoea batatas L. [Lam]) cultivars to early season soil moisture deficit. Sci. Hortic. 2014, 168, 218–228. [Google Scholar] [CrossRef]
  3. Reddy, A.R.; Chaitanya, K.V.; Vivekanandan, M. Drought-induced responses of photosynthesis and antioxidant metabolism in higher plants. J. Plant Physiol. 2004, 161, 1189–1202. [Google Scholar] [CrossRef] [PubMed]
  4. Zhao, C.X.; Guo, L.Y.; Jaleel, C.A.; Shao, H.B.; Yang, H.B. Prospectives for applying molecular and genetic methodology to improve wheat cultivars in drought environments. C. R. Biol. 2008, 331, 579–586. [Google Scholar] [CrossRef]
  5. Van Heerden, P.D.R.; Laurie, R. Effects of prolonged restriction in water supply on photosynthesis, shoot development and storage root yield in sweet potato. Physiol. Plant. 2008, 134, 99–109. [Google Scholar] [CrossRef]
  6. Gajanayake, B.; Reddy, K.R.; Shankle, M.W.; Arancibia, R.A.; Villordon, A.O. Quantifying Storage Root Initiation, Growth, and Developmental Responses of Sweetpotato to Early Season Temperature. Agron. J. 2014, 106, 1795–1804. [Google Scholar] [CrossRef]
  7. Kwak, S.S. Biotechnology of the sweetpotato: Ensuring global food and nutrition security in the face of climate change. Plant Cell Rep. 2019, 38, 1361–1363. [Google Scholar] [CrossRef]
  8. Villordon, A.; LaBonte, D.; Solis, J.; Firon, N. Characterization of Lateral Root Development at the Onset of Storage Root Initiation in ‘Beauregard’ Sweetpotato Adventitious Roots. HortScience 2012, 47, 961–968. [Google Scholar] [CrossRef]
  9. Li, S.; Zhao, L.; Sun, N.; Liu, Q.; Li, H. Photosynthesis product allocation and yield in sweetpotato with different irrigation levels at mid-season. Agric. Water Manag. 2021, 246, 106708. [Google Scholar] [CrossRef]
  10. Zhang, H.Y.; Xie, B.T.; Duan, W.X.; Dong, S.X.; Wang, B.Q.; Zhang, L.M.; Shi, C.Y. Effects of drought stress at different growth stages on photosynthetic efficiency and water consumption characteristics in Sweet potato. Appl. Ecol. 2018, 29, 1943–1950. [Google Scholar]
  11. Rankine, D.R.; Cohen, J.E.; Taylor, M.A.; Coy, A.D.; Simpson, L.A.; Stephenson, T.; Lawrence, J.L. Parameterizing the FAO AquaCrop Model for Rainfed and Irrigated Field-Grown Sweet Potato. Agron. J. 2015, 107, 375–387. [Google Scholar] [CrossRef]
  12. Zierer, W.; Rüscher, D.; Sonnewald, U.; Sonnewald, S. Tuber and Tuberous Root Development. Annu. Rev. Plant Biol. 2021, 72, 551–580. [Google Scholar] [CrossRef]
  13. Lewthwaite, S.L.; Triggs, C.M. Sweet potato cultivar response to prolonged drought. In Proceedings of the 42nd Agronomy Society Conference; Lincoln University: Canterbury, New Zealand, 2012. [Google Scholar]
  14. Ngigi, S.N.; Savenije, H.H.; Thome, J.N.; Rockström, J.; de Vries, F.P. Agro-hydrological evaluation of on-farm rainwater storage systems for supplemental irrigation in Laikipia district, Kenya. Agric. Water Manag. 2005, 73, 21–41. [Google Scholar] [CrossRef]
  15. Nagaz, K.; El Mokh, F.; Alva, A.K.; Masmoudi, M.M.; Ben Mechlia, N. Potato Response to Different Irrigation Regimes Using Saline Water. Irrig. Drain. 2016, 65, 654–663. [Google Scholar] [CrossRef]
  16. Zheng, J.; Huang, G.; Wang, J.; Huang, Q.; Pereira, L.S.; Xu, X.; Liu, H. Effects of water deficits on growth, yield and water productivity of drip-irrigated onion (Allium cepa L.) in an arid region of Northwest China. Irrig. Sci. 2012, 31, 995–1008. [Google Scholar] [CrossRef]
  17. Mattar, M.A.; Zin El-Abedin, T.K.; Alazba, A.A.; Al-Ghobari, H.M. Soil water status and growth of tomato with partial root-zone drying and deficit drip irrigation techniques. Irrig. Sci. 2020, 38, 163–176. [Google Scholar] [CrossRef]
  18. Thompson, P.G.; Smittle, D.A.; Hall, M.R. Relationship of Sweetpotato Yield and Quality to Amount of Irrigation. HortScience 1992, 27, 23–26. [Google Scholar] [CrossRef]
  19. Gajanayake, B.; Reddy, K.R. Sweetpotato Responses to Mid- and Late-Season Soil Moisture Deficits. Crop Sci. 2016, 56, 1865–1877. [Google Scholar] [CrossRef]
  20. Rao, R.; Li, Y. Management of Flooding Effects on Growth of Vegetable and Selected Field Crops. HortTechnology 2003, 13, 610–616. [Google Scholar] [CrossRef]
  21. Siqinbatu, Y.K.; Hirai, H.; Endo, R.; Shibuya, T. Effects of water contents and CO2 concentrations in soil on growth of sweet potato. Field Crop. Res. 2013, 152, 36–43. [Google Scholar] [CrossRef]
  22. Huang, H.; Zhou, M.; Liang, B.; Xiang, D.; Li, H. Effects of atmospheric CO2 on canopy uptake of gaseous ammonia by tomato (Lycopersicum esculentum Mill.) in polytunnel vegetable production systems. Sci. Hortic. 2022, 293, 110739. [Google Scholar] [CrossRef]
  23. Huan, L.; Jin-Qiang, W.; Qing, L. Photosynthesis product allocation and yield in sweet potato with spraying exogenous hormones under drought stress. J. Plant Physiol. 2020, 253, 153265. [Google Scholar] [CrossRef] [PubMed]
  24. Pérez-Pazos, J.V.; Rosero, A.; Martínez, R.; Pérez, J.; Morelo, J.; Araujo, H.; Burbano-Erazo, E. Influence of morpho-physiological traits on root yield in sweet potato (Ipomoea batatas Lam.) genotypes and its adaptation in a sub-humid environment. Sci. Hortic. 2021, 275, 10970. [Google Scholar] [CrossRef]
  25. Liu, J.; Friebe, V.M.; Frese, R.N.; Jones, M.R. Polychromatic solar energy conversion in pigment-protein chimeras that unite the two kingdoms of (bacterio)chlorophyll-based photosynthesis. Nat. Commun. 2020, 11, 1542. [Google Scholar] [CrossRef]
  26. Saeedipour, S.; Moradi, F. Effect of Drought at the Post-anthesis Stage on Remobilization of Carbon Reserves and Some Physiological Changes in the Flag Leaf of Two Wheat Cultivars Differing in Drought Resistance. J. Agric. Sci. 2011, 3, 81. [Google Scholar] [CrossRef]
  27. Igamberdiev, A.U.; Mikkelsen, T.N.; Ambus, P.; Bauwe, H.; Lea, P.J.; Gardeström, P. Photorespiration Contributes to Stomatal Regulation and Carbon Isotope Fractionation: A Study with Barley, Potato and Arabidopsis Plants Deficient in Glycine Decarboxylase. Photosynth. Res. 2004, 81, 139–152. [Google Scholar] [CrossRef]
  28. Verma, V.; Foulkes, M.J.; Worland, A.J.; Sylvester-Bradley, R.; Caligari, P.D.S.; Snape, J.W. Mapping quantitative trait loci for flag leaf senescence as a yield determinant in winter wheat under optimal and drought-stressed environments. Euphytica 2004, 135, 255–263. [Google Scholar] [CrossRef]
  29. Xu, X.; Zhang, Y.; Li, J.; Zhang, M.; Zhou, X.; Zhou, S.; Wang, Z. Optimizing single irrigation scheme to improve water use efficiency by manipulating winter wheat sink-source relationships in Northern China Plain. PLoS ONE 2018, 13, e0193895. [Google Scholar] [CrossRef]
  30. Gouveia, C.S.; Ganança, J.F.; Slaski, J.; Lebot, V.; de Carvalho, M.Â.P. Variation of carbon and isotope natural abundances (delta(15)N and delta(13)C) of whole-plant sweet potato (Ipomoea batatas L.) subjected to prolonged water stress. J. Plant Physiol. 2019, 243, 153052. [Google Scholar] [CrossRef]
  31. Ma, B.L.; Morrison, M.J.; Voldeng, H.D. Leaf Greenness and Photosynthetic Rates in Soybean. Crop Sci. 1995, 35, 1411–1414. [Google Scholar] [CrossRef]
  32. Haimeirong, F.; Kubota, F.; Yoshimura, Y. Estimation of Photosynthetic Activity from the Electron Transport Rate of Photosystem 2 in a Film-Sealed Leaf of Sweet Potato, Ipomoea batatas Lam. Photosynthetica 2002, 40, 337–341. [Google Scholar] [CrossRef]
  33. Haimeirong, F.; Kubota, F. The Effects of Drought Stress and Leaf Ageing on Leaf Photosynthesis and Electron Transport in Photosystem 2 in Sweet Potato (Ipomoea batatas Lam.) Cultivars. J. Photosynth. 2003, 41, 253–258. [Google Scholar] [CrossRef]
  34. Khamssi, N.N.; Najaphy, A. Comparison of photosynthetic components of wheat genotypes under rain-fed and irrigated conditions. Photochem. Photobiol. 2012, 88, 76–80. [Google Scholar] [CrossRef] [PubMed]
  35. White, A.C.; Rogers, A.; Rees, M.; Osborne, C.P. How can we make plants grow faster? A source–sink perspective on growth rate. J. Exp. Bot. 2016, 67, 31–45. [Google Scholar] [CrossRef] [PubMed]
  36. Laurie, R.N.; Laurie, S.M.; Du Plooy, C.P.; Finnie, J.F.; Van Staden, J. Yield of Drought-Stressed Sweet Potato in Relation to Canopy Cover, Stem Length and Stomatal Conductance. J. Agric. Sci. 2015, 7, 201. [Google Scholar] [CrossRef]
  37. Ning, Y.; Ma, H.; Zhang, H.; Wang, J.; Xu, X.; Zhang, Y. Response of Sweetpotato in Source-Sink Relationship Establishment, Expanding, and Balance to Nitrogen Application Rates. Acta Agron. Sin. 2015, 41, 432–439. [Google Scholar] [CrossRef]
  38. Smith, A.M.; Stitt, M. Coordination of carbon supply and plant growth. Plant Cell Environ. 2007, 30, 1126–1149. [Google Scholar] [CrossRef]
  39. Ferreira, M.A.M.; Andrade, V.C.; Oliveira, A.J.; Ferreira, E.A.; Brito, O.G.; Silva, L.R. Physiological characterization of plant growth in sweet potato. Hortic. Bras. 2019, 37, 112–118. [Google Scholar] [CrossRef]
  40. Xue, J.; Zhao, Y.; Gou, L.; Shi, Z.; Yao, M.; Zhang, W. How High Plant Density of Maize Affects Basal Internode Development and Strength Formation. Crop Sci. 2016, 56, 3295–3306. [Google Scholar] [CrossRef]
  41. Xiangbei, D.; Lingcong, K.; Min, X.; Xinyue, Z. Split application improving sweetpotato yield by enhancing photosynthetic and sink capacity under reduced nitrogen condition. Field Crop. Res. 2019, 238, 56–63. [Google Scholar] [CrossRef]
  42. Keutgen, N.; Mukminah, F.; Roeb, G.W. Sink strength and photosynthetic capacity influence tuber development in sweet potato. J. Hortic. Sci. Biotechnol. 2002, 77, 106–115. [Google Scholar] [CrossRef]
  43. Daryanto, S.; Wang, L.; Jacinthe, P.A. Drought effects on root and tuber production: A meta-analysis. Agric. Water Manag. 2016, 176, 122–131. [Google Scholar] [CrossRef]
  44. Mulovhedzi, N.E.; Araya, N.A.; Mengistu, M.G.; Fessehazion, M.K.; Du Plooy, C.P.; Araya, H.T.; Van der Laan, M. Estimating evapotranspiration and determining crop coefficients of irrigated sweet potato (Ipomoea batatas) grown in a semi-arid climate. Agric. Water Manag. 2020, 233, 106099. [Google Scholar] [CrossRef]
  45. Shammout, M.A.W.; Qtaishat, T.; Rawabdeh, H.; Shatanawi, M. Improving Water Use Efficiency under Deficit Irrigation in the Jordan Valley. Sustainability 2018, 10, 431. [Google Scholar] [CrossRef]
  46. Yang, H.; Liu, H.; Zheng, J.; Huang, Q. Effects of regulated deficit irrigation on yield and water productivity of chili pepper (Capsicum annuum L.) in the arid environment of Northwest China. Irrig. Sci. 2018, 36, 61–74. [Google Scholar] [CrossRef]
  47. Rykaczewska, K. The Impact of High Temperature during Growing Season on Potato Cultivars with Different Response to Environmental Stresses. Am. J. Plant Sci. 2013, 4, 2386–2393. [Google Scholar] [CrossRef]
  48. Walworth, J.L.; Carling, D.E. Tuber initiation and development in irrigated and non-irrigated potatoes. Am. J. Potato Res. 2002, 79, 387–395. [Google Scholar] [CrossRef]
  49. Allen, R.G.; Pereira, L.S.; Raes, D.; Smith, M. Crop Evapotranspiration-Guidelines for Computing Crop Water Requirements; FAO: Italy, Rome, 1998. [Google Scholar]
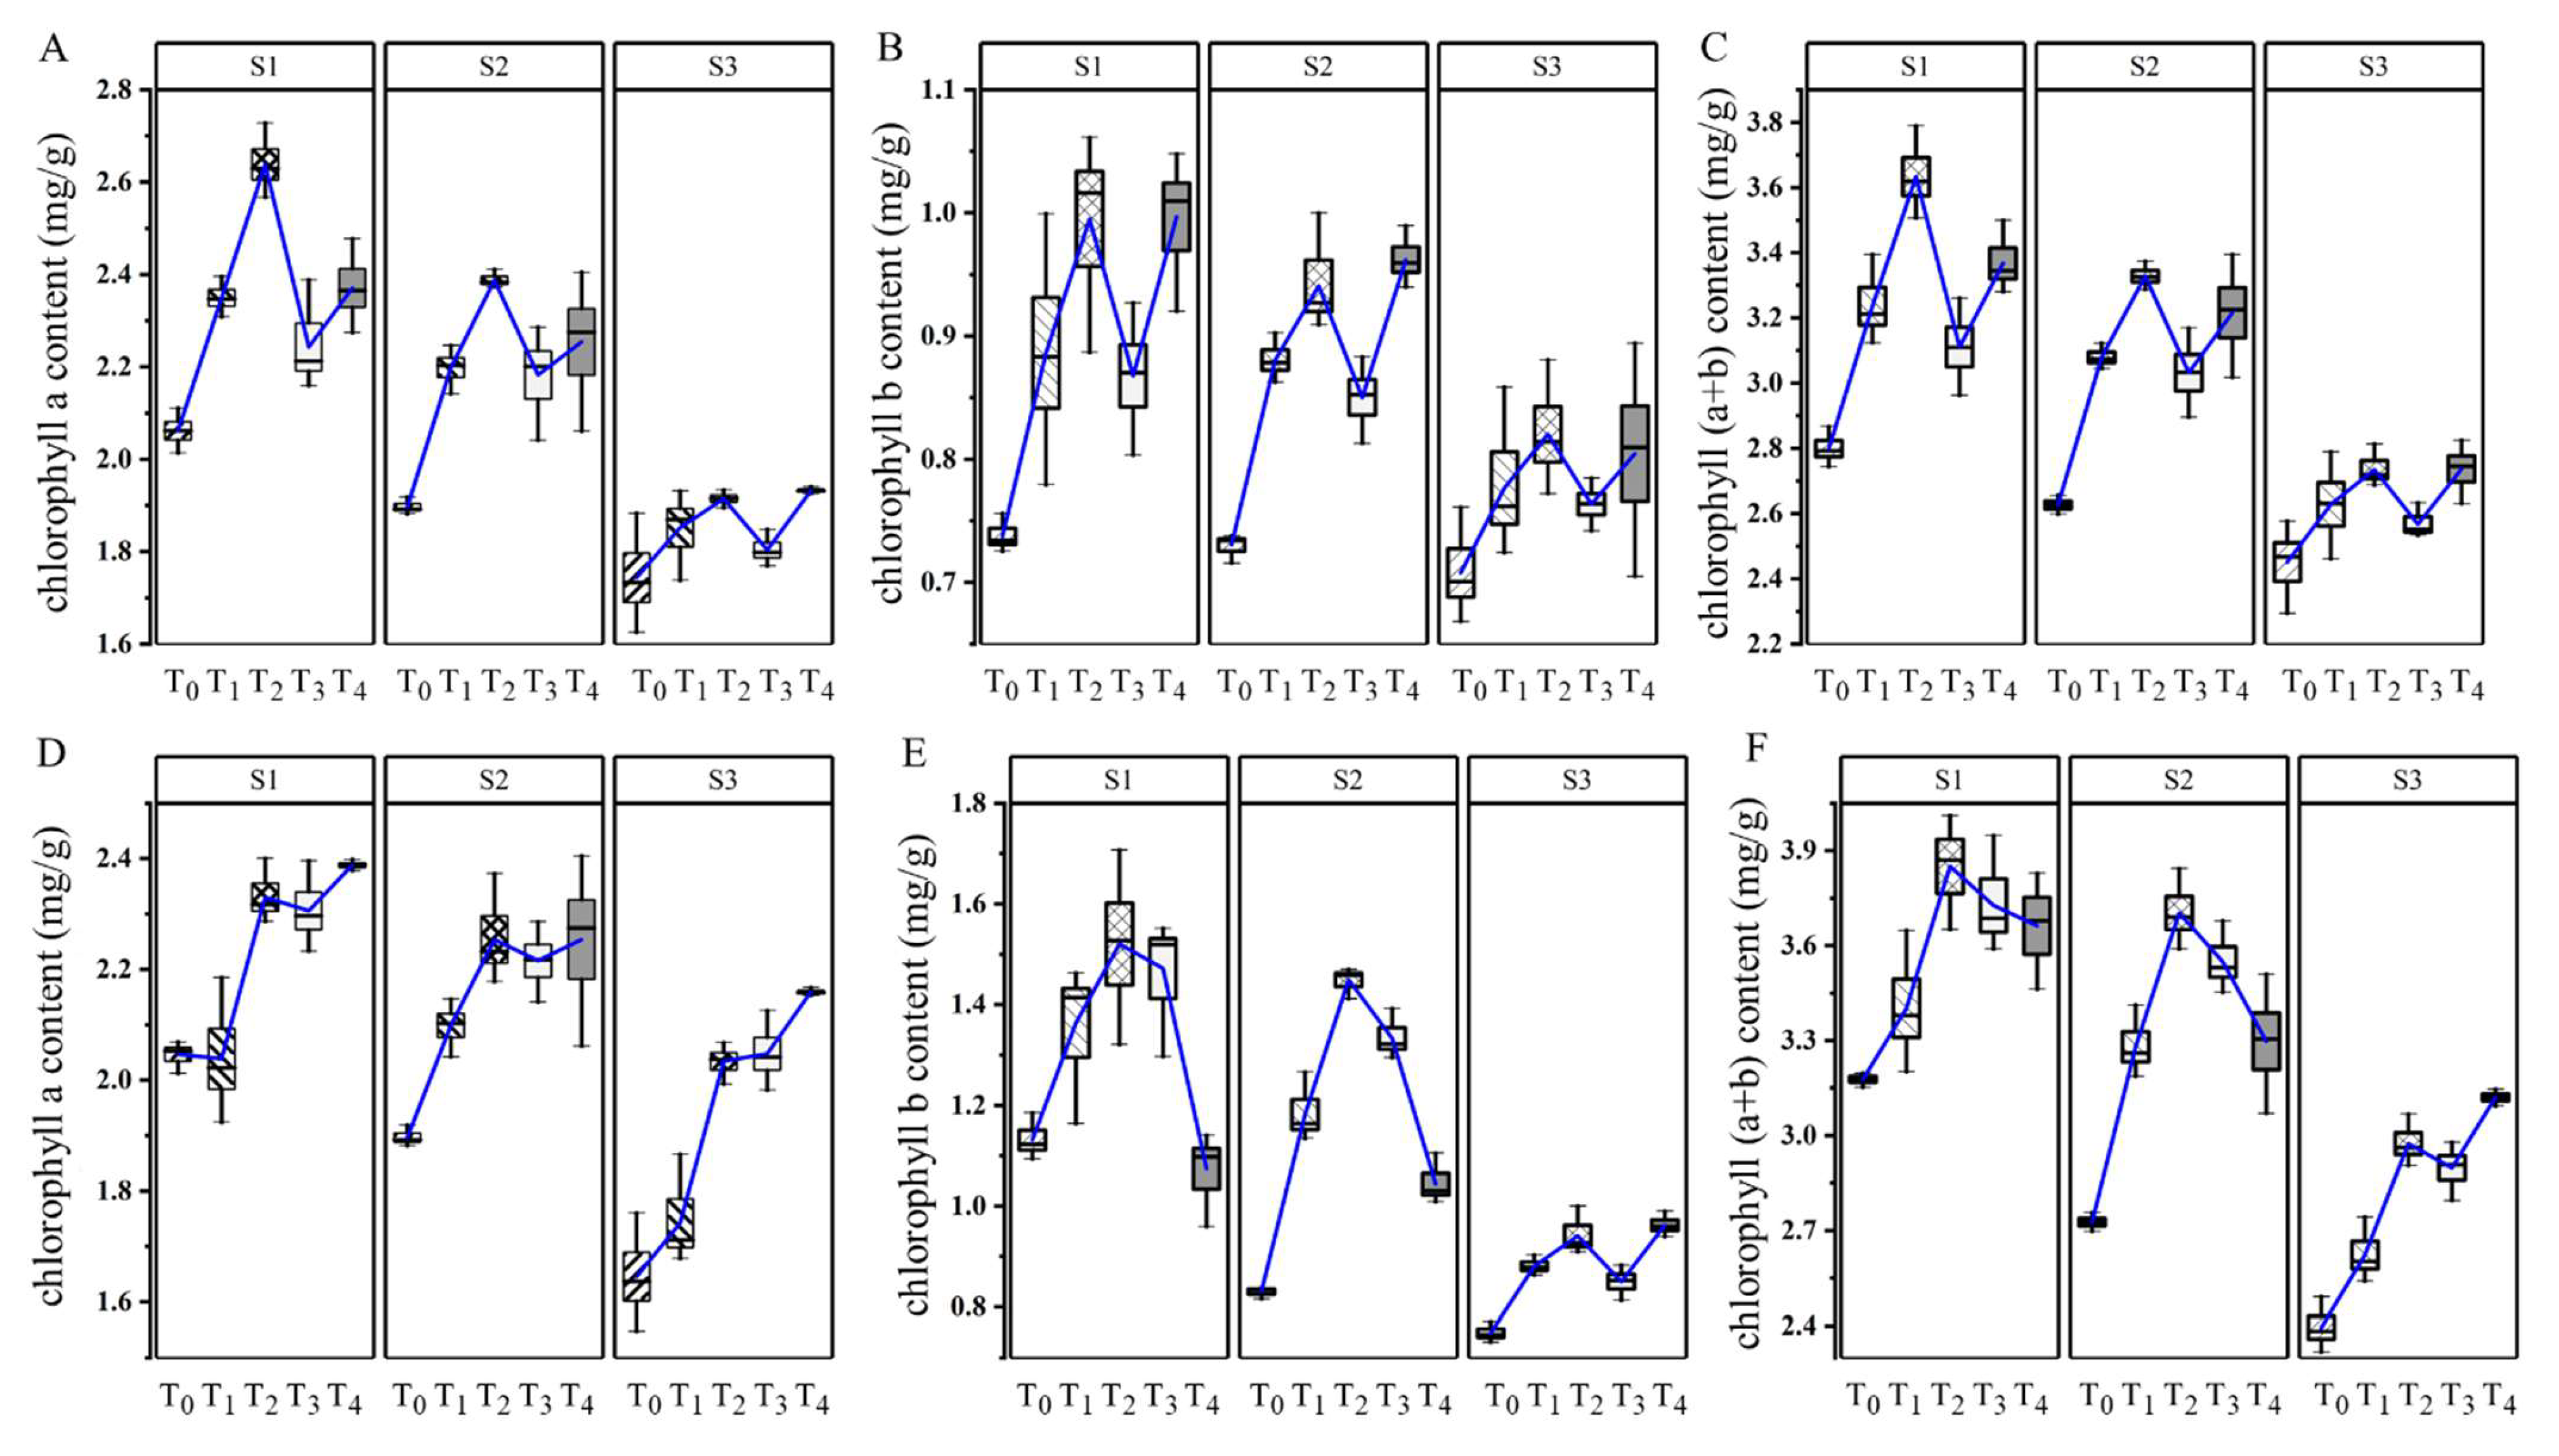
Figure 1. Dynamic effects of irrigation levels (T0–T4) on chlorophyll a content (A,D), chlorophyll b content (B,E) and total chlorophyll (a + b) (C,F) during late-season sweet potato growth in 2021 (AC) and 2022 (DF). S1–S3 represent 124, 134, and 144 days after transplantation, respectively.
Plants 12 01780 g001
Figure 2. Effects of irrigation levels (T0–T4) on the photosynthetic parameters of sweet potato during its late-season growth. Intercellular carbon dioxide concentration (A), net photosynthetic rate (B), transpiration rate (C) and stomatal conductance (D). Different lowercase letters in the same period indicate a significant difference (p < 0.05); the same letter indicates no significant difference (p < 0.05).
Plants 12 01780 g002
Figure 3. Effects of irrigation levels (T0–T4) on 13C accumulation (A) and the 13C allocation rate (B) in the shoots and storage roots of sweet potato in 2021 and 2022. Different lowercase letters in the same period indicate a significant difference (p < 0.05); the same letter indicates no significant difference (p < 0.05).
Plants 12 01780 g003
Figure 4. Redundancy analysis of irrigation level, yield, net profit, 13C accumulation and the 13C allocation rate in sweet potato shoots and storage roots based on a logistics function. (A) Data for the year 2021: axis 1, 76.69%; axis 2, 21.31%. (B) Data for the year 2022: axis 1, 94.71%; axis 2, 4.78%.
Plants 12 01780 g004
Figure 5. Precipitation and reference evapotranspiration during the whole sweet potato growth period, as determined in the study area from 2021 to 2022. The two red boxes represent rainfall and reference evapotranspiration during the 2021 and 2022 trials, respectively.
Plants 12 01780 g005
Table 1. Effects of irrigation levels on above- and below-ground dry matter mass in the late-season stage of sweet potato growth.
YearTreatmentShoot Biomass (g/plant)Storage Root Biomass (g/plant)Storage Root/Shoot
S1S2S3S1S2S3S1S2S3
2021T090.00 ± 2.53 d90.67 ± 2.53 c89.55 ± 1.97 d174.12 ± 5.72 c186.62 ± 4.95 d200.74 ± 0.39 d1.93 ± 0.12 ab2.06 ± 0.05 a2.24 ± 0.04 a
T1106.40 ± 3.15 c109.68 ± 3.7 b113.55 ± 5.28 c189.58 ± 9.50 bc211.82 ± 5.59 c227.57 ± 0.94 c1.78 ± 0.11 abc1.93 ± 0.02 ab2.00 ± 0.09 bc
T2113.20 ± 6.74 bc119.68 ± 6.74 b121.00 ± 4.63 bc228.76 ± 5.76 a239.27 ± 5.73 a257.00 ± 0.78 a2.02 ± 0.10 a2.00 ± 0.10 a2.12 ± 0.09 ab
T3123.07 ± 3.61 b128.35 ± 5.20 b130.11 ± 4.39 b204.50 ± 3.83 b227.34 ± 3.30 ab244.35 ± 1.11 ab1.66 ± 0.07 b1.77 ± 0.07 b1.88 ± 0.05 c
T4137.47 ± 5.15 a141.05 ± 2.62 a143.00 ± 3.24 a208.44 ± 3.48 b219.62 ± 4.47 bc235.73 ± 0.80 bc1.52 ± 0.08 c1.56 ± 0.06 c1.65 ± 0.04 d
2022T0100.66 ± 6.45 d101.53 ± 4.39 c103.86 ± 3.41 c133.67 ± 9.92 b143.67 ± 8.57 b155.41 ± 3.17 c1.34 ± 0.18 a1.42 ± 0.07 a1.50 ± 0.04 a
T1111.37 ± 4.63 cd112.30 ± 5.54 c114.13 ± 9.14 c147.63 ± 16.45 a159.27 ± 1.87 a173.57 ± 2.45 b1.24 ± 0.16 a1.42 ± 0.06 a1.53 ± 0.11 a
T2121.32 ± 11.78 bc125.68 ± 10.45 b128.82 ± 7.65 b149.31 ± 10.13 a162.15 ± 9.92 a178.70 ± 2.71 a1.16 ± 0.10 ab1.29 ± 0.09 ab1.39 ± 0.10 ab
T3128.56 ± 6.24 ab130.53 ± 8.49 ab134.27 ± 7.60 ab149.23 ± 6.64 a161.56 ± 5.71 a176.68 ± 1.48 ab1.08 ± 0.09 ab1.24 ± 0.07 bc1.32 ± 0.06 bc
T4140.80 ± 8.15 a142.54 ± 4.08 a145.20 ± 5.61 a151.56 ± 6.03 a161.77 ± 7.73 a174.73 ± 0.51 ab1.33 ± 0.11 b1.14 ± 0.09 c1.20 ± 0.05 c
Note: S1–S3 represent 124, 134, and 144 days after transplantation, respectively. Data are expressed as mean ± SE. Different lowercase letters in the same period indicate a significant difference (p < 0.05); the same letter indicates no significant difference (p < 0.05).
Table 2. Characteristic parameters of the dynamic curve of dry matter accumulation in sweet potato roots.
YearTreatment
(ETc)
Modelt1t2TVmeanVmaxWmax
dddg d−1g d−1g plant−1
2021T0Y = 205.93/(1 + 1431,594.12e−0.1232X)
R2 = 0.9979
107129221.556.18205.93
T1Y = 238.60/(1 + 625,644.62e−0.1138X)
R2 = 0.9983
109133241.756.56238.60
T2Y = 280.66/(1 + 218,869.20e−0.1022X)
R2 = 0.9934
108133251.977.16280.66
T3Y = 262.62/(1 + 290,040.10e−0.1056X)
R2 = 0.9986
107132251.896.89262.62
T4Y = 252.81/(1 + 131,844.28e−0.0993X)
R2 = 0.9986
106133271.796.26252.81
2022T0Y = 154.24/(1 + 342,7650.28e−0.1374X)
R2 = 0.9941
100119191.235.30154.13
T1Y = 173.87/(1 + 7,382,425.82e−0.1393X)
R2 = 0.9930
104123191.346.06171.87
T2Y = 182.62/(1 + 6,612,877.62e−0.1399X)
R2 = 0.9940
103122191.436.39177.62
T3Y = 177.75/(1 + 5,899,178.32e−0.1384X)
R2 = 0.9962
103122191.386.15175.75
T4Y = 175.37/(1 + 7,821,166.95e−0.1380X)
R2 = 0.9970
105125201.346.05175.37
Note: t1 and t2 are, respectively, the initiation and termination times of dry matter accumulation by storage root per plant (d); T is the duration of dry matter accumulation by storage root per plant (d); Vmax is the maximum rate of dry matter accumulation by storage root per plant (g d−1); Vmeam is the average rate of dry matter accumulation by storage root per plant (g d−1); and Wmax is the maximum theoretical dry matter accumulation by storage root per plant (g plant−1).
Table 3. Seasonal components of water balance, including actual evapotranspiration (ETa), sweet potato yield, water use efficiency (WUE) and water productivity (WP), for all irrigation treatments in 2021 and 2022.
YearTreatmentI
(mm)
P
(mm)
ΔS
(mm)
Eta
(mm)
Yield
(t ha−1)
WUE
(kg ha−1 mm−1)
WP
(kg ha−1 mm−1)
2021T013.50418.4824.02456.0040.14 ± 0.39 d88.03 ± 0.84 c92.93 ± 0.89 d
T124.40418.4826.31469.2045.50 ± 0.94 c96.97 ± 2.01 b102.73 ± 2.13 b
T238.30418.4832.69489.5051.38 ± 1.62 a104.97 ± 1.59 a112.48 ± 1.70 a
T346.60418.4839.50504.6048.87 ± 1.11 ab96.86 ± 2.20 b105.08 ± 2.38 bc
T454.90418.4854.65528.0046.77 ± 0.80 bc88.57 ± 1.52 c98.80 ± 1.69 c
2022T013.50465.3625.94504.8038.86 ± 0.15 c76.98 ± 1.79 d81.15 ± 1.89 c
T118.50465.3627.87511.7043.41 ± 0.61 b84.83 ± 0.97 ab89.72 ± 1.03 b
T224.90465.3631.43521.7046.65 ± 0.91 a89.42 ± 0.16 a95.15 ± 0.17 a
T328.70465.3639.32533.4044.15 ± 0.50 ab82.77 ± 1.94 b89.36 ± 2.10 b
T432.60465.3645.50543.5043.63 ± 0.08 b80.28 ± 0.28 c87.62 ± 0.30 b
Significance
Water(W) ****
Year(Y) **NSNS
W × Y NSNSNS
Data are expressed as mean ± SE. Different lowercase letters for the same period indicate a significant difference (p < 0.05); the same letter indicates no significant difference (p < 0.05). * and ** are significant at p < 0.05 and p < 0.01, respectively. NS is not significance.
Table 4. Effects of irrigation level on the economic benefits of sweet potato in late 2021 and 2022.
YearTreatmentInput Value of Consumable Items ($US ha−1)Total InputOutput Value of Consumable Items ($US ha−1)Total OutputOutput/InputNet Income
($US ha−1)
Land Use Fee and Seedling CostMachinery Operating CostIrrigation Equipment CostPesticide and Fertilizer CostElectricity and Water CostLabour Cost($US ha−1)≥150 g<150 g ($US ha−1)
2021T0147054621054610.40697.543479.939562.7710.589573.3432.756093.41
T1147054621054618.79701.203491.9910,953.79.4410,963.143.147471.15
T2147054621054629.49705.873507.3612,066.5217.4412,083.953.458576.59
T3147054621054635.88708.663516.5411,728.8010.9511,739.753.348223.21
T4147054621054642.27711.453525.7211,233.9710.2711,244.243.197718.52
2022T0147054621054610.40697.543479.937999.7985.858085.6432.324605.71
T1147054621054614.25699.223485.469773.0582.139855.1722.836369.71
T2147054621054619.17701.373492.5411,673.7068.9711,742.663.368250.12
T3147054621054622.10702.643496.7410,958.0366.7511,024.783.157528.04
T4147054621054625.10703.953501.0610,858.6365.4810,924.113.127423.06
Note: fixed production inputs include the land use fee, $630 US ha−1; machinery operation, $546 US ha−1; irrigation equipment, $210 US ha−1; pesticide, $126 US ha−1; fertiliser, $420 US ha−1 and seedlings, $840 US ha−1. The price of sweet potato with a weight ≥150 g (marketable sweet potato) was $0.25 US kg−1 (2021) and $0.34 US kg−1 (2022). The price of sweet potato with a weight < 150 g was $0.056 US kg−1 (2021 and 2022). Labour cost, $2.24 US h−1; electricity, $0.035 US m−3; water, $0.042 US m−3. Data required for the economic return calculation were collected from a survey of local farms conducted during both study years.
Table 5. Dates and crop coefficient (Kc) values for each sweet potato growth stage and the total amount of water applied during the study period.
Growth StagesDuration (days) K c a (Kc) AdjustedWater Applied (mm)
T0T1T2T3T4
202120 May–27 October
Planting1 13.5013.5013.5013.5013.50
initial410.50 81.5081.5081.5081.5081.50
Mid-season511.15 165.70165.70165.70165.70165.70
Late season670.650.60172.20181.18196.10204.37212.64
Seasonal160 431.98442.90456.80465.07473.34
202225 May–23 October
Planting1 13.5013.5013.5013.5013.50
initial400.50 105.60105.6105.60105.60105.60
Mid-season501.15 206.00206.00206.00206.00206.00
Late-season590.650.63153.76158.79165.19169.00172.81
Seasonal150 478.86483.89490.29494.10497.91
Disclaimer/Publisher’s Note: The statements, opinions and data contained in all publications are solely those of the individual author(s) and contributor(s) and not of MDPI and/or the editor(s). MDPI and/or the editor(s) disclaim responsibility for any injury to people or property resulting from any ideas, methods, instructions or products referred to in the content.