Article

Different Phenotypic, Photosynthetic, and Physiological Responses to Flooding between Q. nuttallii and Q. palustris

1
College of Forestry, Nanjing Forestry University, Nanjing 210037, China
2
Co-Innovation Center for Sustainable Forestry in Southern China, Nanjing Forestry University, Nanjing 210037, China
3
College of Civil Engineering, Nanjing Forestry University, Nanjing 210037, China
*
Authors to whom correspondence should be addressed.
Plants 2024, 13(12), 1658; https://doi.org/10.3390/plants13121658
Submission received: 7 May 2024 / Revised: 12 June 2024 / Accepted: 12 June 2024 / Published: 15 June 2024
(This article belongs to the Section Plant Response to Abiotic Stress and Climate Change)

Abstract

:
Flooding stress is an increasingly serious problem in wetlands, often affecting large areas of crops and timber production areas. The current study aimed to explore the species differences in responses to flooding stress between Q. nuttallii and Q. palustris in an outdoor environment. All the tested plants survived after a 60-day flooding treatment that left 5 cm of water above the soil surface. This suggests that the two species are flood-tolerant, so they can be applied in the construction of riparian protection forests and wetland restoration. Compared with control conditions, flooding treatment significantly decreased seedling height and diameter and the Pn, Gs, Tr, Fv/Fm, ABS/CSm, TR0/CSm, ET0/CSm, RE0/CSm, IAA, and GA3 content and significantly increased the content of MDA, H2O2, soluble sugars, SOD, POD, ADH, ABA, and JA. Under control conditions, Q. nuttallii showed significantly greater growth and photosynthetic capability than Q. palustris. In contrast, Q. palustris exhibited less inhibition of growth and photosynthesis, oxidative stress levels, and antioxidant enzyme activities than Q. nuttallii under flooding conditions. The findings indicate that Q. palustris has better defense mechanisms against the damage caused by flooding stress than Q. nuttallii. Q. nuttallii was more sensitive and responsive to flooding than Q. palustris.

1. Introduction

Flood stress caused by climate change and human activities related to heavy rainfall, poor irrigation, and drainage practices is an increasingly serious problem in wetlands [1,2,3]. The land area affected by flooding is more than 17 million km2 worldwide [4]. Excessive soil water reduces the oxygen diffusion rate, as gases diffuse into water at a 104 lower rate than in air [5]. After inundation with water, the soil environment becomes hypoxic as residual oxygen is consumed by the respiration of roots and microorganisms [5,6]. Flooding is becoming a significant environmental stressor affecting the production of crops and woody plants in large areas [7]. In the last 50 years, the area of arable land per capita has decreased from 0.32 ha to 0.21 ha due to climate change and the growing world population, and this area is expected to shrink further to 0.16 ha per capita by 2030 [5]. Therefore, understanding how plants, especially woody plants, function under flooding conditions is critical to introducing or improving flood-tolerant forage species in production.
Depending on the tolerance of plants, the greatest challenge posed by flooding is its ability to severely damage plant cells and organs and, ultimately, restrict physiological functions due to the lack of oxygen supply [8,9]. Anatomical changes and low O2 stress avoidance help plants tolerate floods [7,10,11]. Plants using the former strategy may try to avoid prolonged hypoxia by changing their morphological and anatomical adaptations, which may improve tissue regeneration and plant survival [4,12]. Plants using the latter strategy can conserve energy and carbohydrates to prolong survival by slowing down metabolic processes until a flooding event is over and the plant tissue enters a steady state [11,13]. Maintaining alcoholic fermentation under flooding conditions is crucial for anoxia tolerance in woody plants as it ensures the generation of ATP during flooding [10]. However, fermentation must proceed at a higher rate than respiration due to the higher amount of energy produced in mitochondrial respiration (38 mol of ATP per mol of glucose) compared with alcoholic fermentation (2 mol of ATP per mol of glucose) [10,12]. Consequently, flooded roots of plants need more carbohydrates, which could be essential for plant survival in prolonged hypoxic conditions.
Oaks (Quercus L.) are a major component of subtropical and temperate forests in the northern hemisphere. There are approximately three hundred species in this genus [14]. The oak is a dominant forest species in China, playing a key role in maintaining the biodiversity and stability of its ecosystems [14,15]. Previous studies reported that the cultivation of oaks is becoming increasingly important as a stabilizer of ecosystems with increasing climate extremes [16]. Nevertheless, the quality of oak seedlings is inconsistent, resulting in suboptimal reforestation of oaks [17]. The slow growth of the initial aboveground seedlings of oak species, high rates of acorn predation, and growth inhibition by flooding were cited as possible causes of oak regeneration problems in lowland deciduous forests [18,19]. Uncovering the potential physiological mechanisms involved in flooding is crucial for selecting and cultivating flood-tolerant plant species.
The sensitivity of oaks to flooding has been reported to vary widely. The white oak (Quercus alba L.) and water oak (Quercus nigra L.) showed similar physiological responses to flooding, whereas the duration of flooding required to induce physiological changes varied by species [16,20]. The marginally flood-tolerant sessile oak (Quercus petraea (Mattuschka) Liebl.) showed two distinct phases of flood response, during which physiological changes in seedlings predominated for the first three days, and substantial morphological and anatomical shifts also occurred during this period [16,21]. Previous studies reported that Q. nuttallii and Q. palustris showed resistance to waterlogging, which is desirable from both wildlife and timber production perspectives [22,23,24]. However, whether the two different oak species’ physiological response patterns and flood resistance are uniform remains unclear. Therefore, studies of different time points in physiological parameters including photosynthesis, biochemistry, and phytohormones in different species are needed to explore the causal relationship between the flooding tolerance and physiological parameters of these two oak species. Such studies will provide a knowledge base for selecting tree species that can adapt to climate change.
This study was conducted to determine the dynamic physiological responses of oak species (Q. nuttallii and Q. palustris) to flooding stress and the consistency of these responses. In addition, the causal relationship between flooding tolerance and the physio-biochemical parameters of oak genotypes was investigated. We predicted that (i) flooding stress would inhibit plant growth and leaf photosynthesis, decrease stomatal conductance and Fv/Fm, and increase MDA, H2O2, antioxidant enzyme, and ABA content. (ii) Since Q. nuttallii performs better under natural conditions than Q. palustris, we expected Q. nuttallii to perform better under flooding conditions.

2. Results

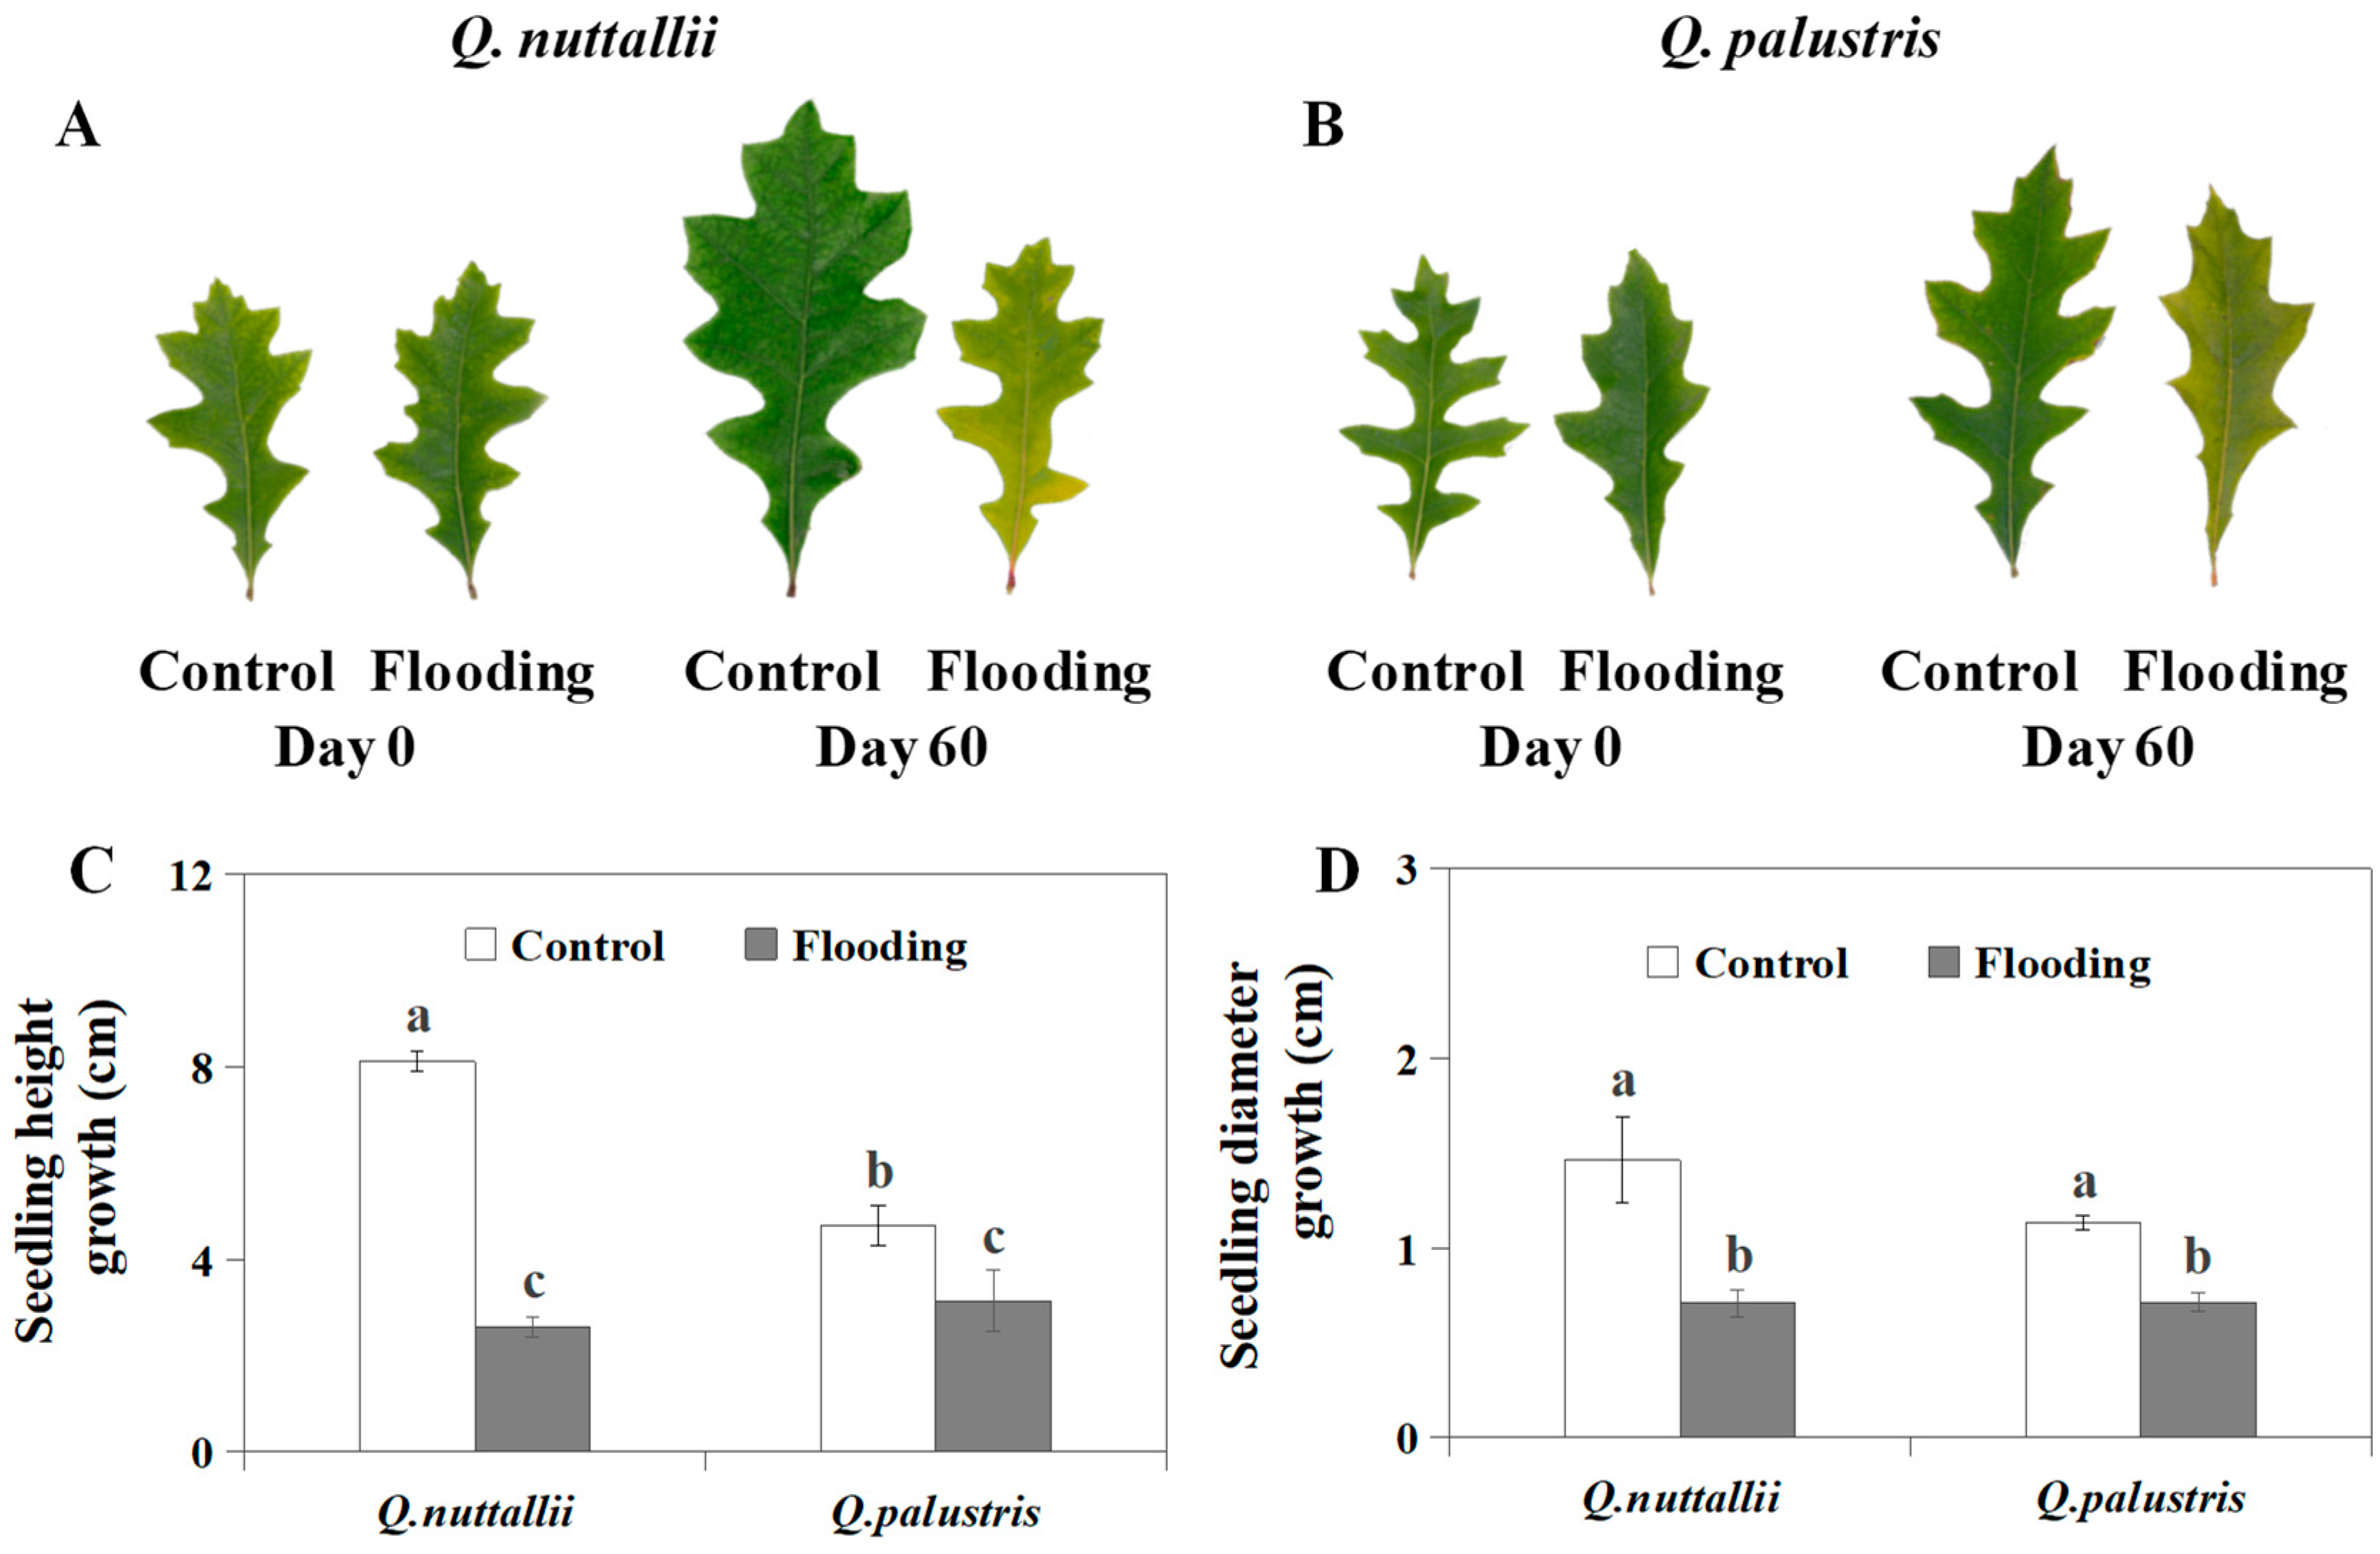
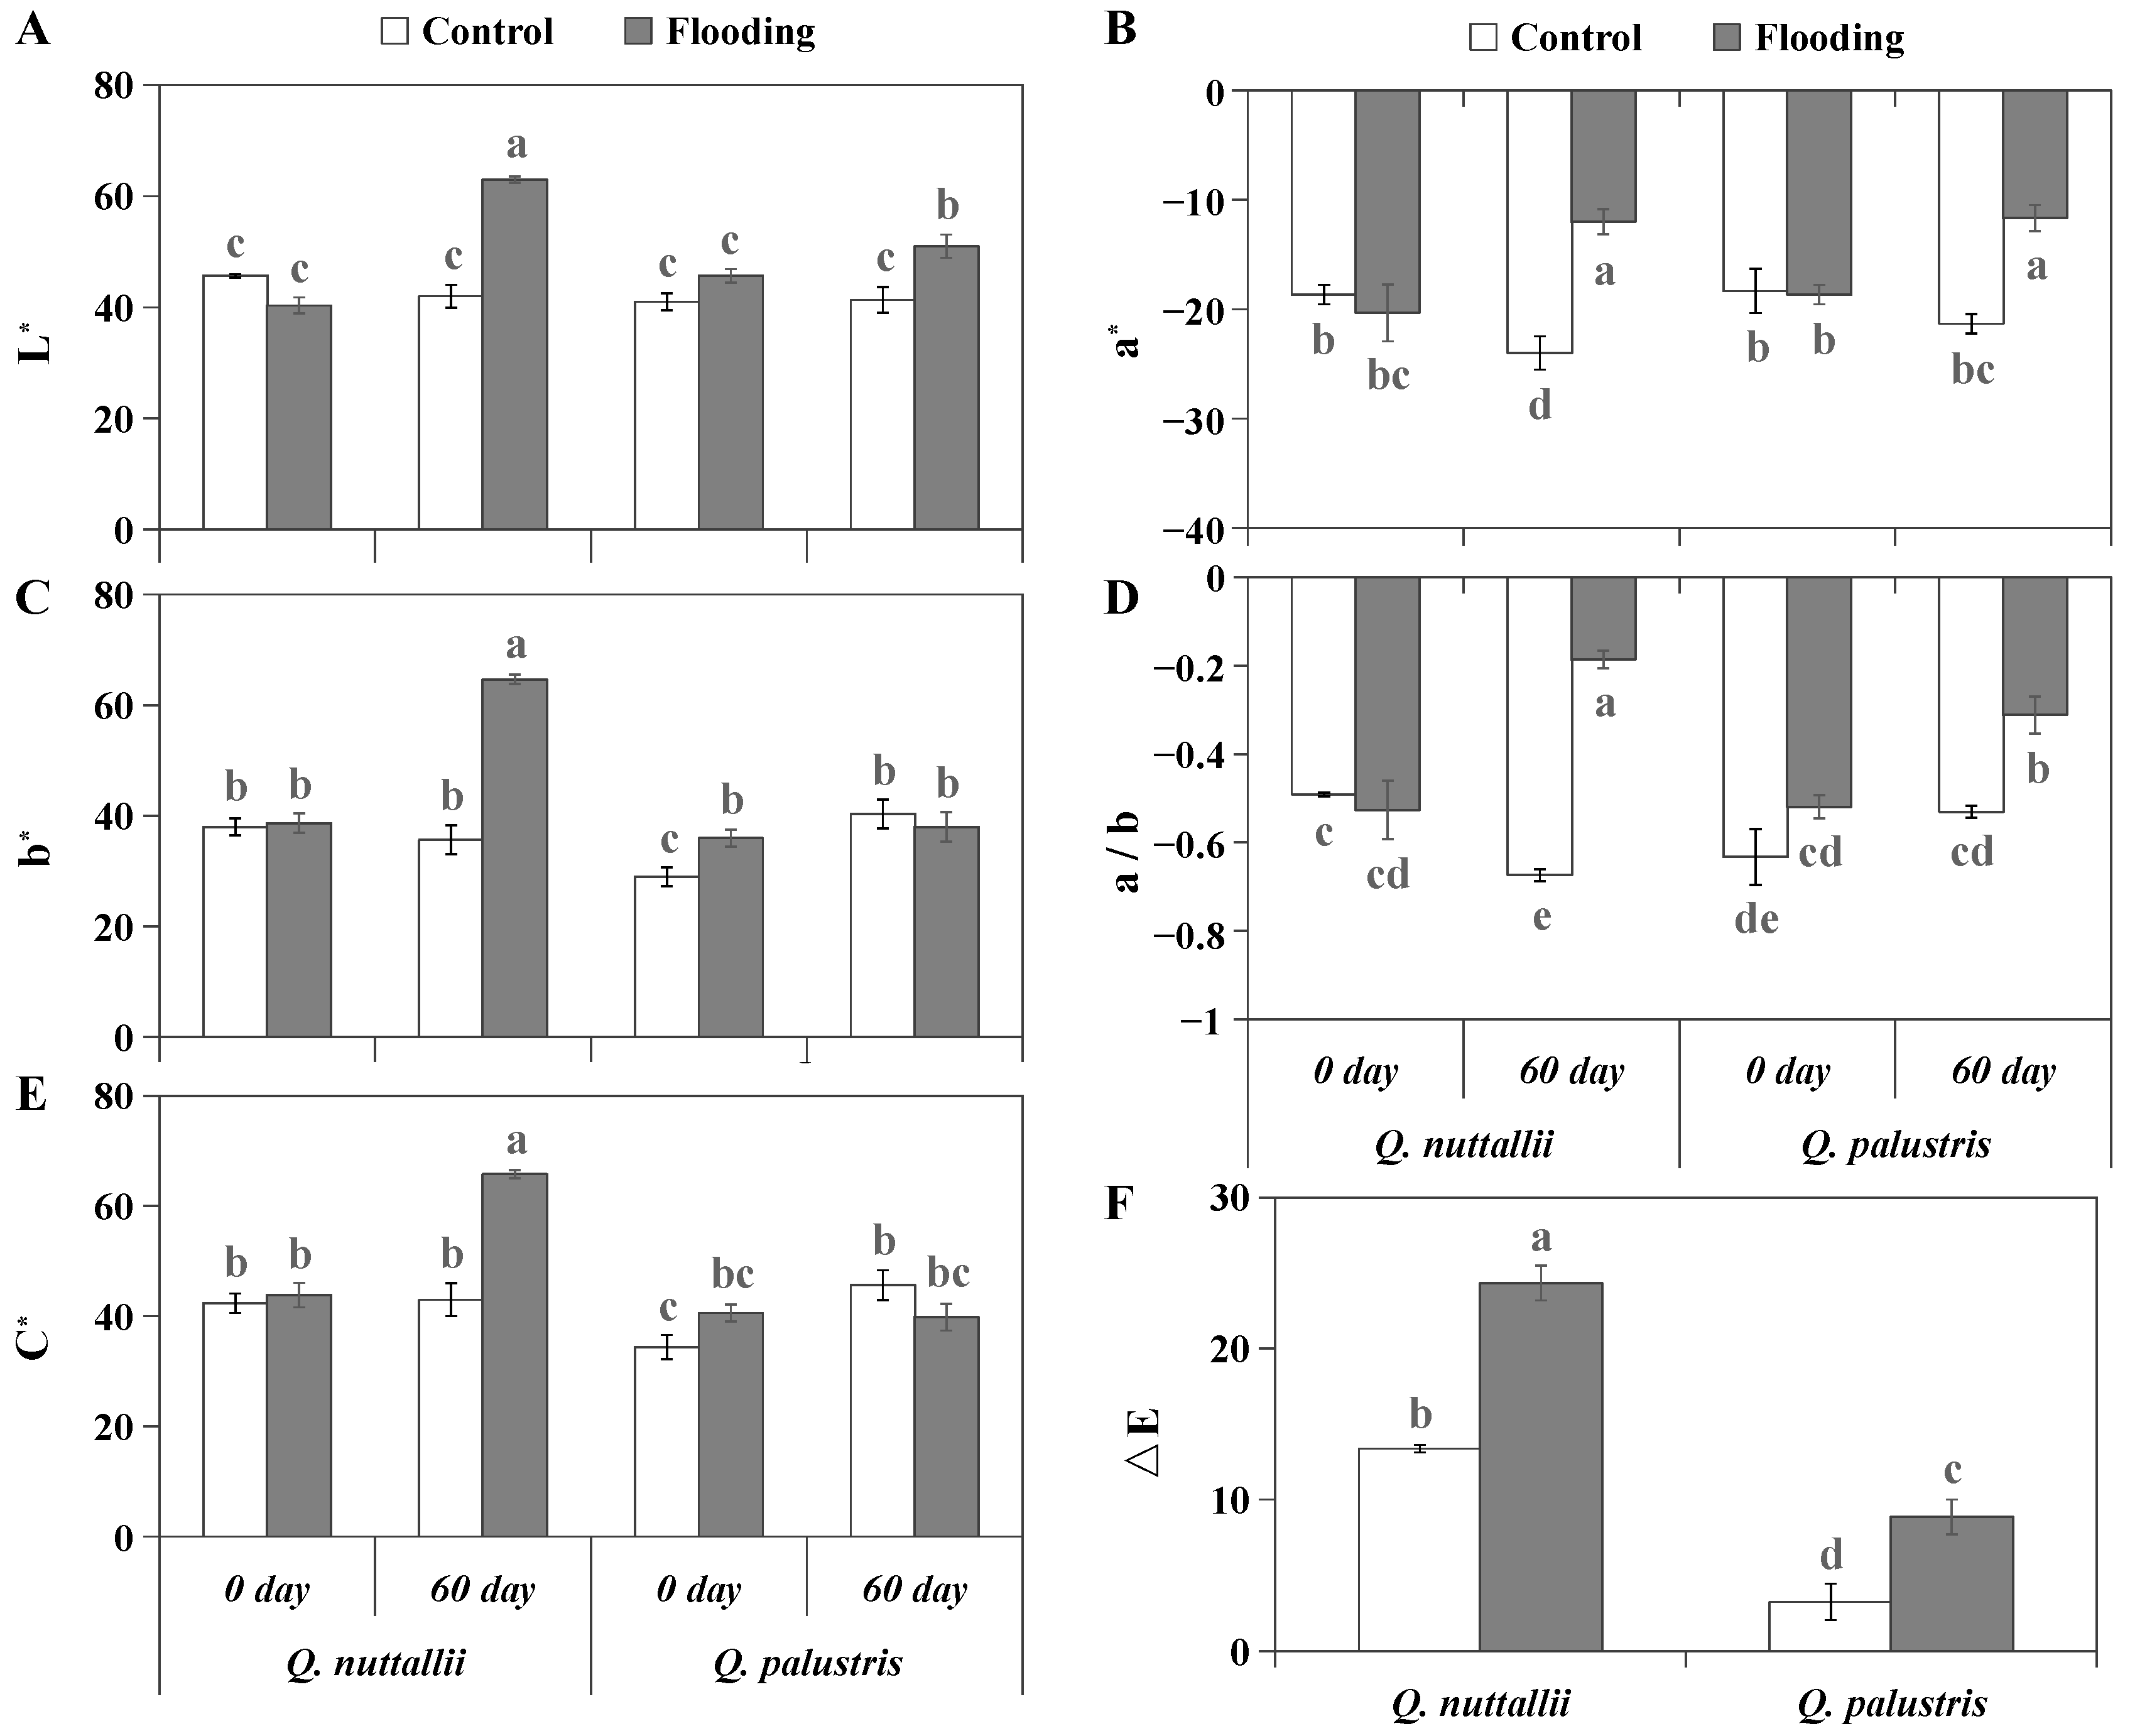
2.1. The Impact of Flooding on Plant Growth and Leaf Color

Q. nuttallii had faster growth rates than Q. palustris under control conditions (Figure 1 and Table 1). Under flooding conditions, Q. nuttallii exhibited greater seedling growth inhibition than Q. palustris. Compared with the control, both species showed significantly inhibited seedling growth rates regarding height and diameter after being exposed to flooding stress for 60 days (Figure 1 and Table 1). These results suggest that Q. nuttallii exhibited greater growth under control conditions, while Q. palustris showed lower growth inhibition under flooding conditions.
For Q. nuttallii, all tested color parameters were increased by flooding, while for Q. palustris, no differences in b* and C* values were observed between flooding and control conditions or between days 0 and 60 (Figure 2). The ΔE value of Q. palustris was smaller than that of Q. nattallii under both control and flooding conditions (Figure 2E), suggesting that Q. palustris has less color variation and higher color stability.

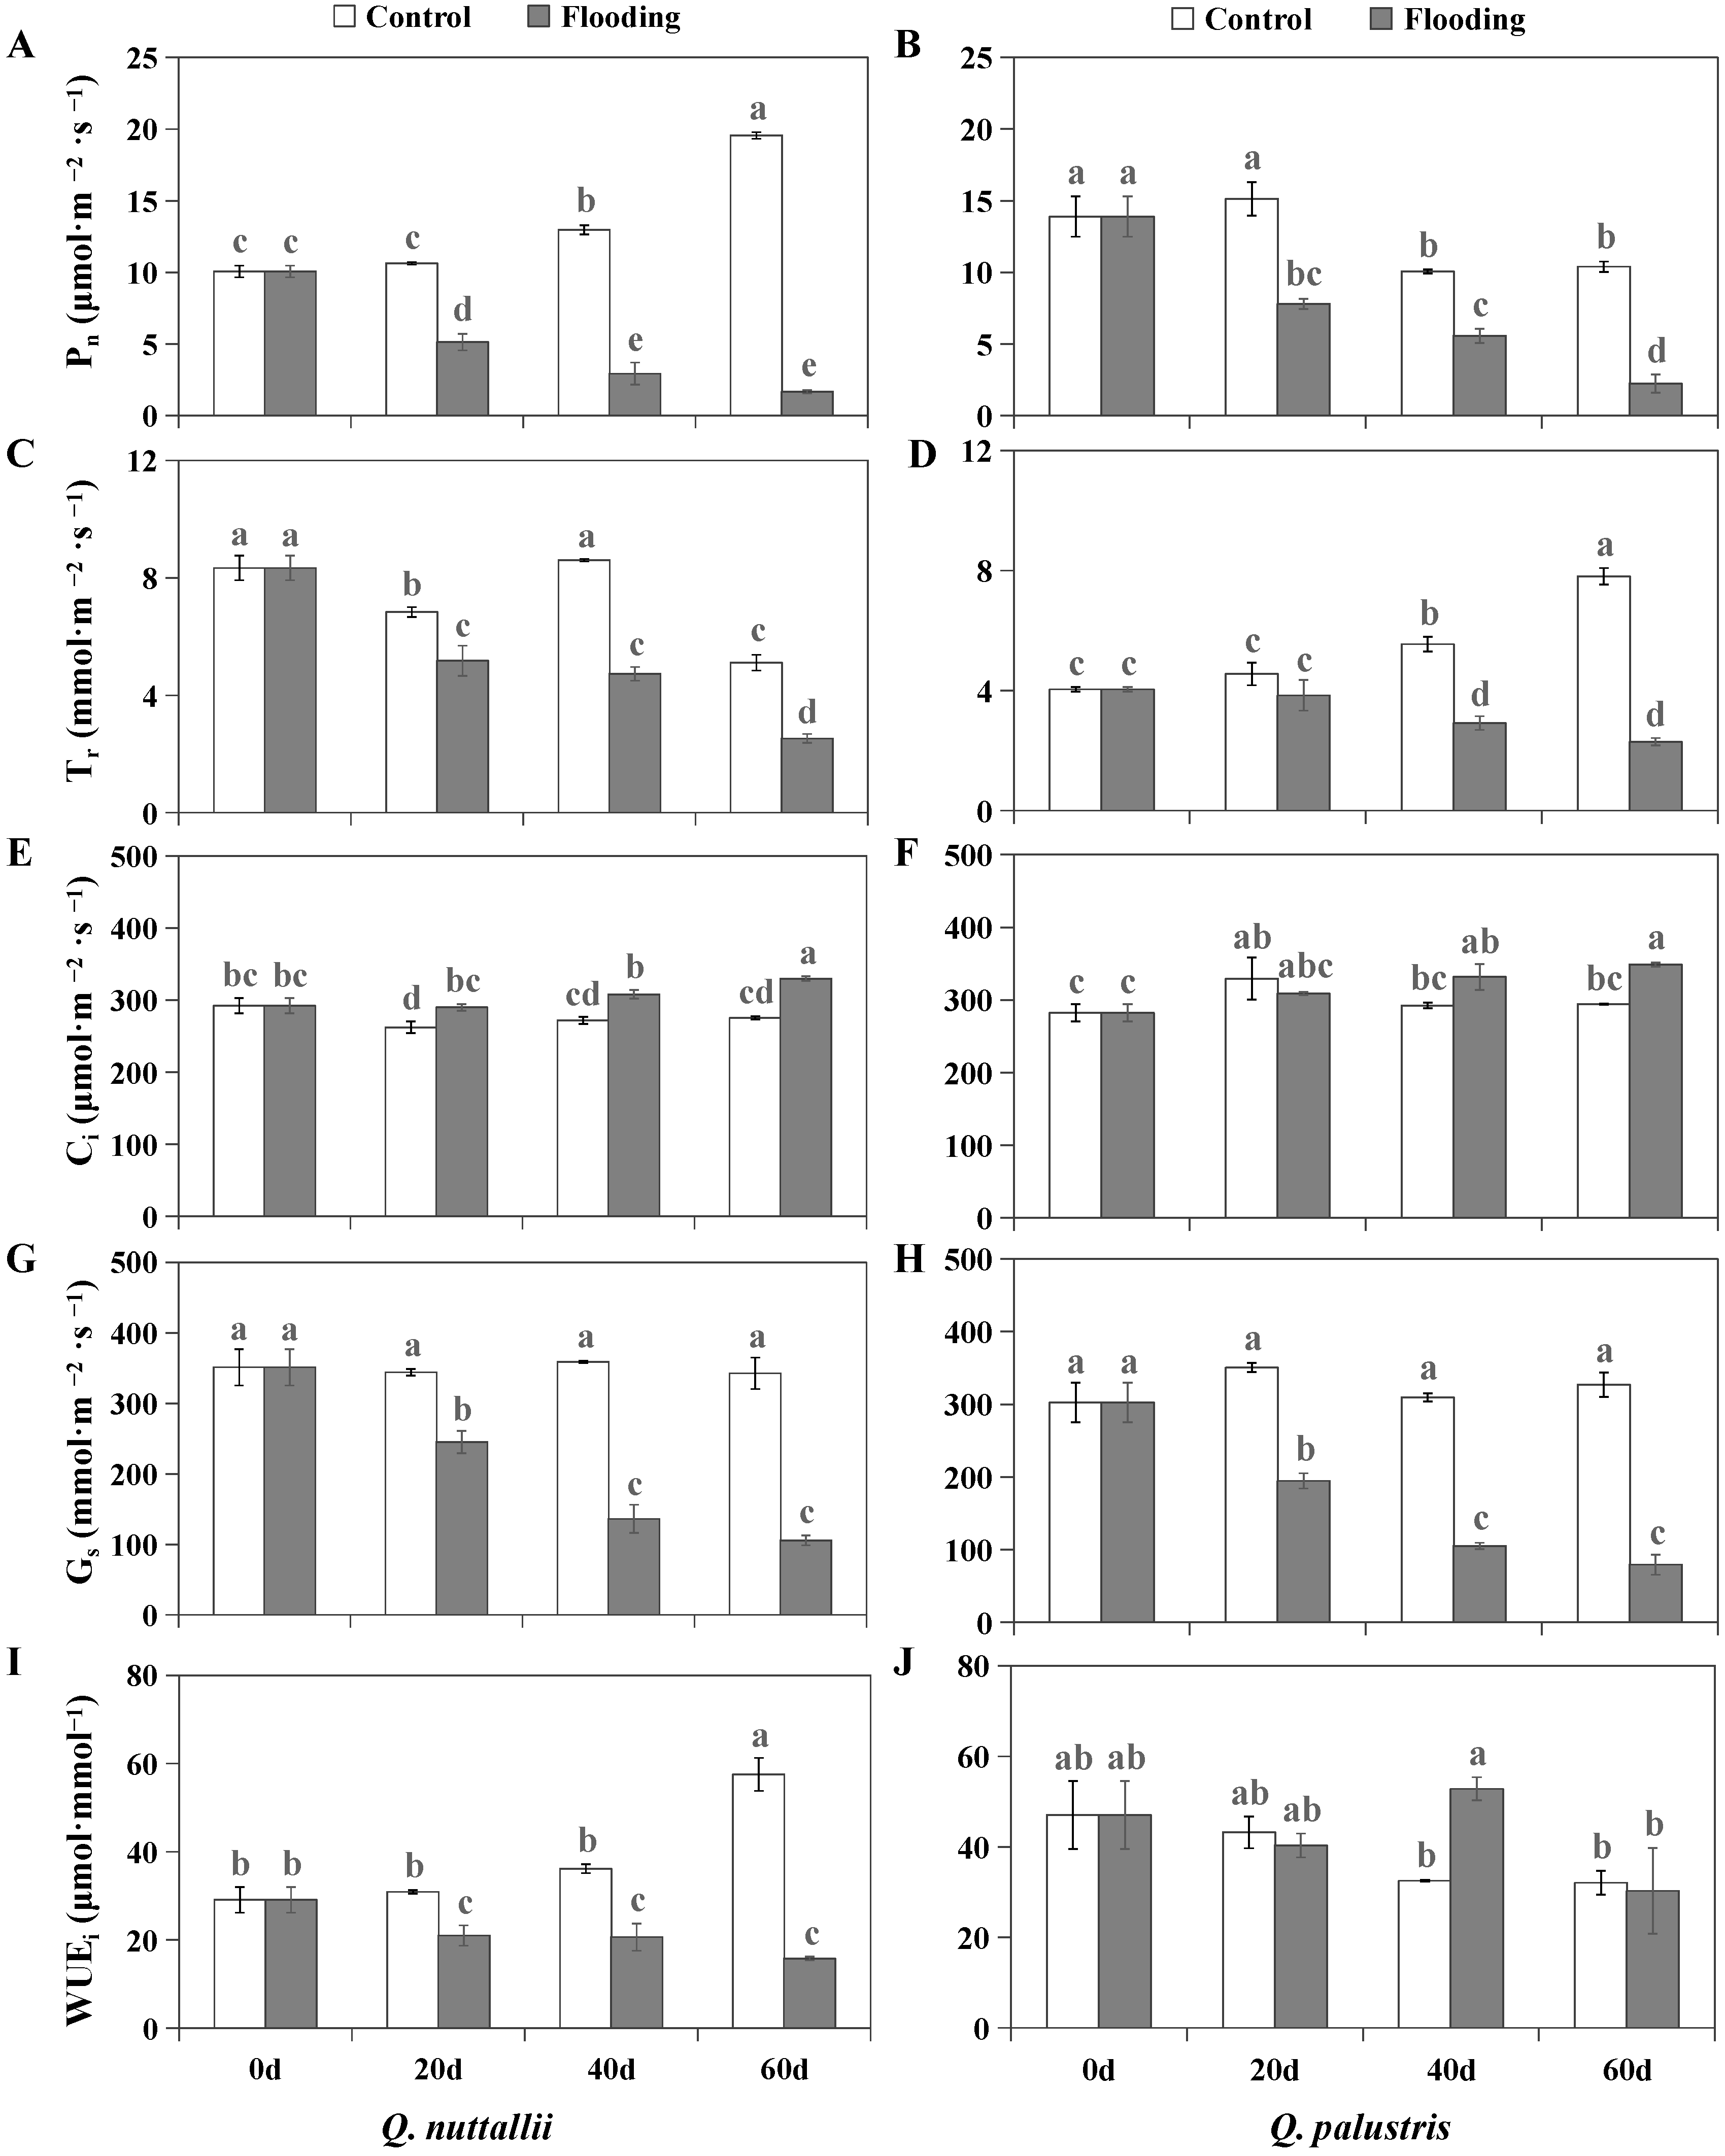
2.2. The Impact of Flooding on Gas Exchange and Chlorophyll Fluorescence Parameters

Flooding treatment significantly increased Ci and decreased Pn, Tr, and Gs in both Q. nuttallii and Q. palustris (Figure 3A–H). In addition, the gas exchange parameters were significantly affected by species, treatment, and days. However, there was no significant effect of species × treatment × time on Gs and Ci (Table 2). Under control conditions, Q. nuttallii had higher values of Pn and WUEi (Figure 3A,B,I,J). Compared with their controls, greater decreases in Pn and WUEi were found for Q. nuttallii than for Q. palustris under flooding conditions (Table 3). In other words, flooding caused greater inhibition of Pn and WUEi in Q. nuttallii than in Q. palustris.
Chlorophyll fluorescence parameters including Fv/Fm, ABS/CSm, TR0/CSm, ET0/CSm, and RE0/CSm in both Q. nuttallii and Q. palustris were significantly decreased after the flooding treatment (Figure 4A,B,D–F). TR0/CSm, ET0/CSm, and RE0/CSm were not significantly affected in terms of species. All tested chlorophyll fluorescence parameters were significantly affected by the water treatments and treatment days, while RE0/CSm was not significantly affected by the interaction of species × treatment × time (Table 2). Under control conditions, Q. nuttallii had a lower ABS/CSm value than Q. palustris, whereas Q. palustris had lower DI0/CSm, TR0/CSm, ET0/CSm, and RE0/CSm values (Figure 4B–F). Compared with the controls, Q. nuttallii exhibited greater decreases in Fv/Fm, TR0/CSm, ET0/CSm, and RE0/CSm than Q. palustris under flooding conditions. These results indicate that photosynthetic performance was more impaired in Q. nuttallii than in Q. palustris.

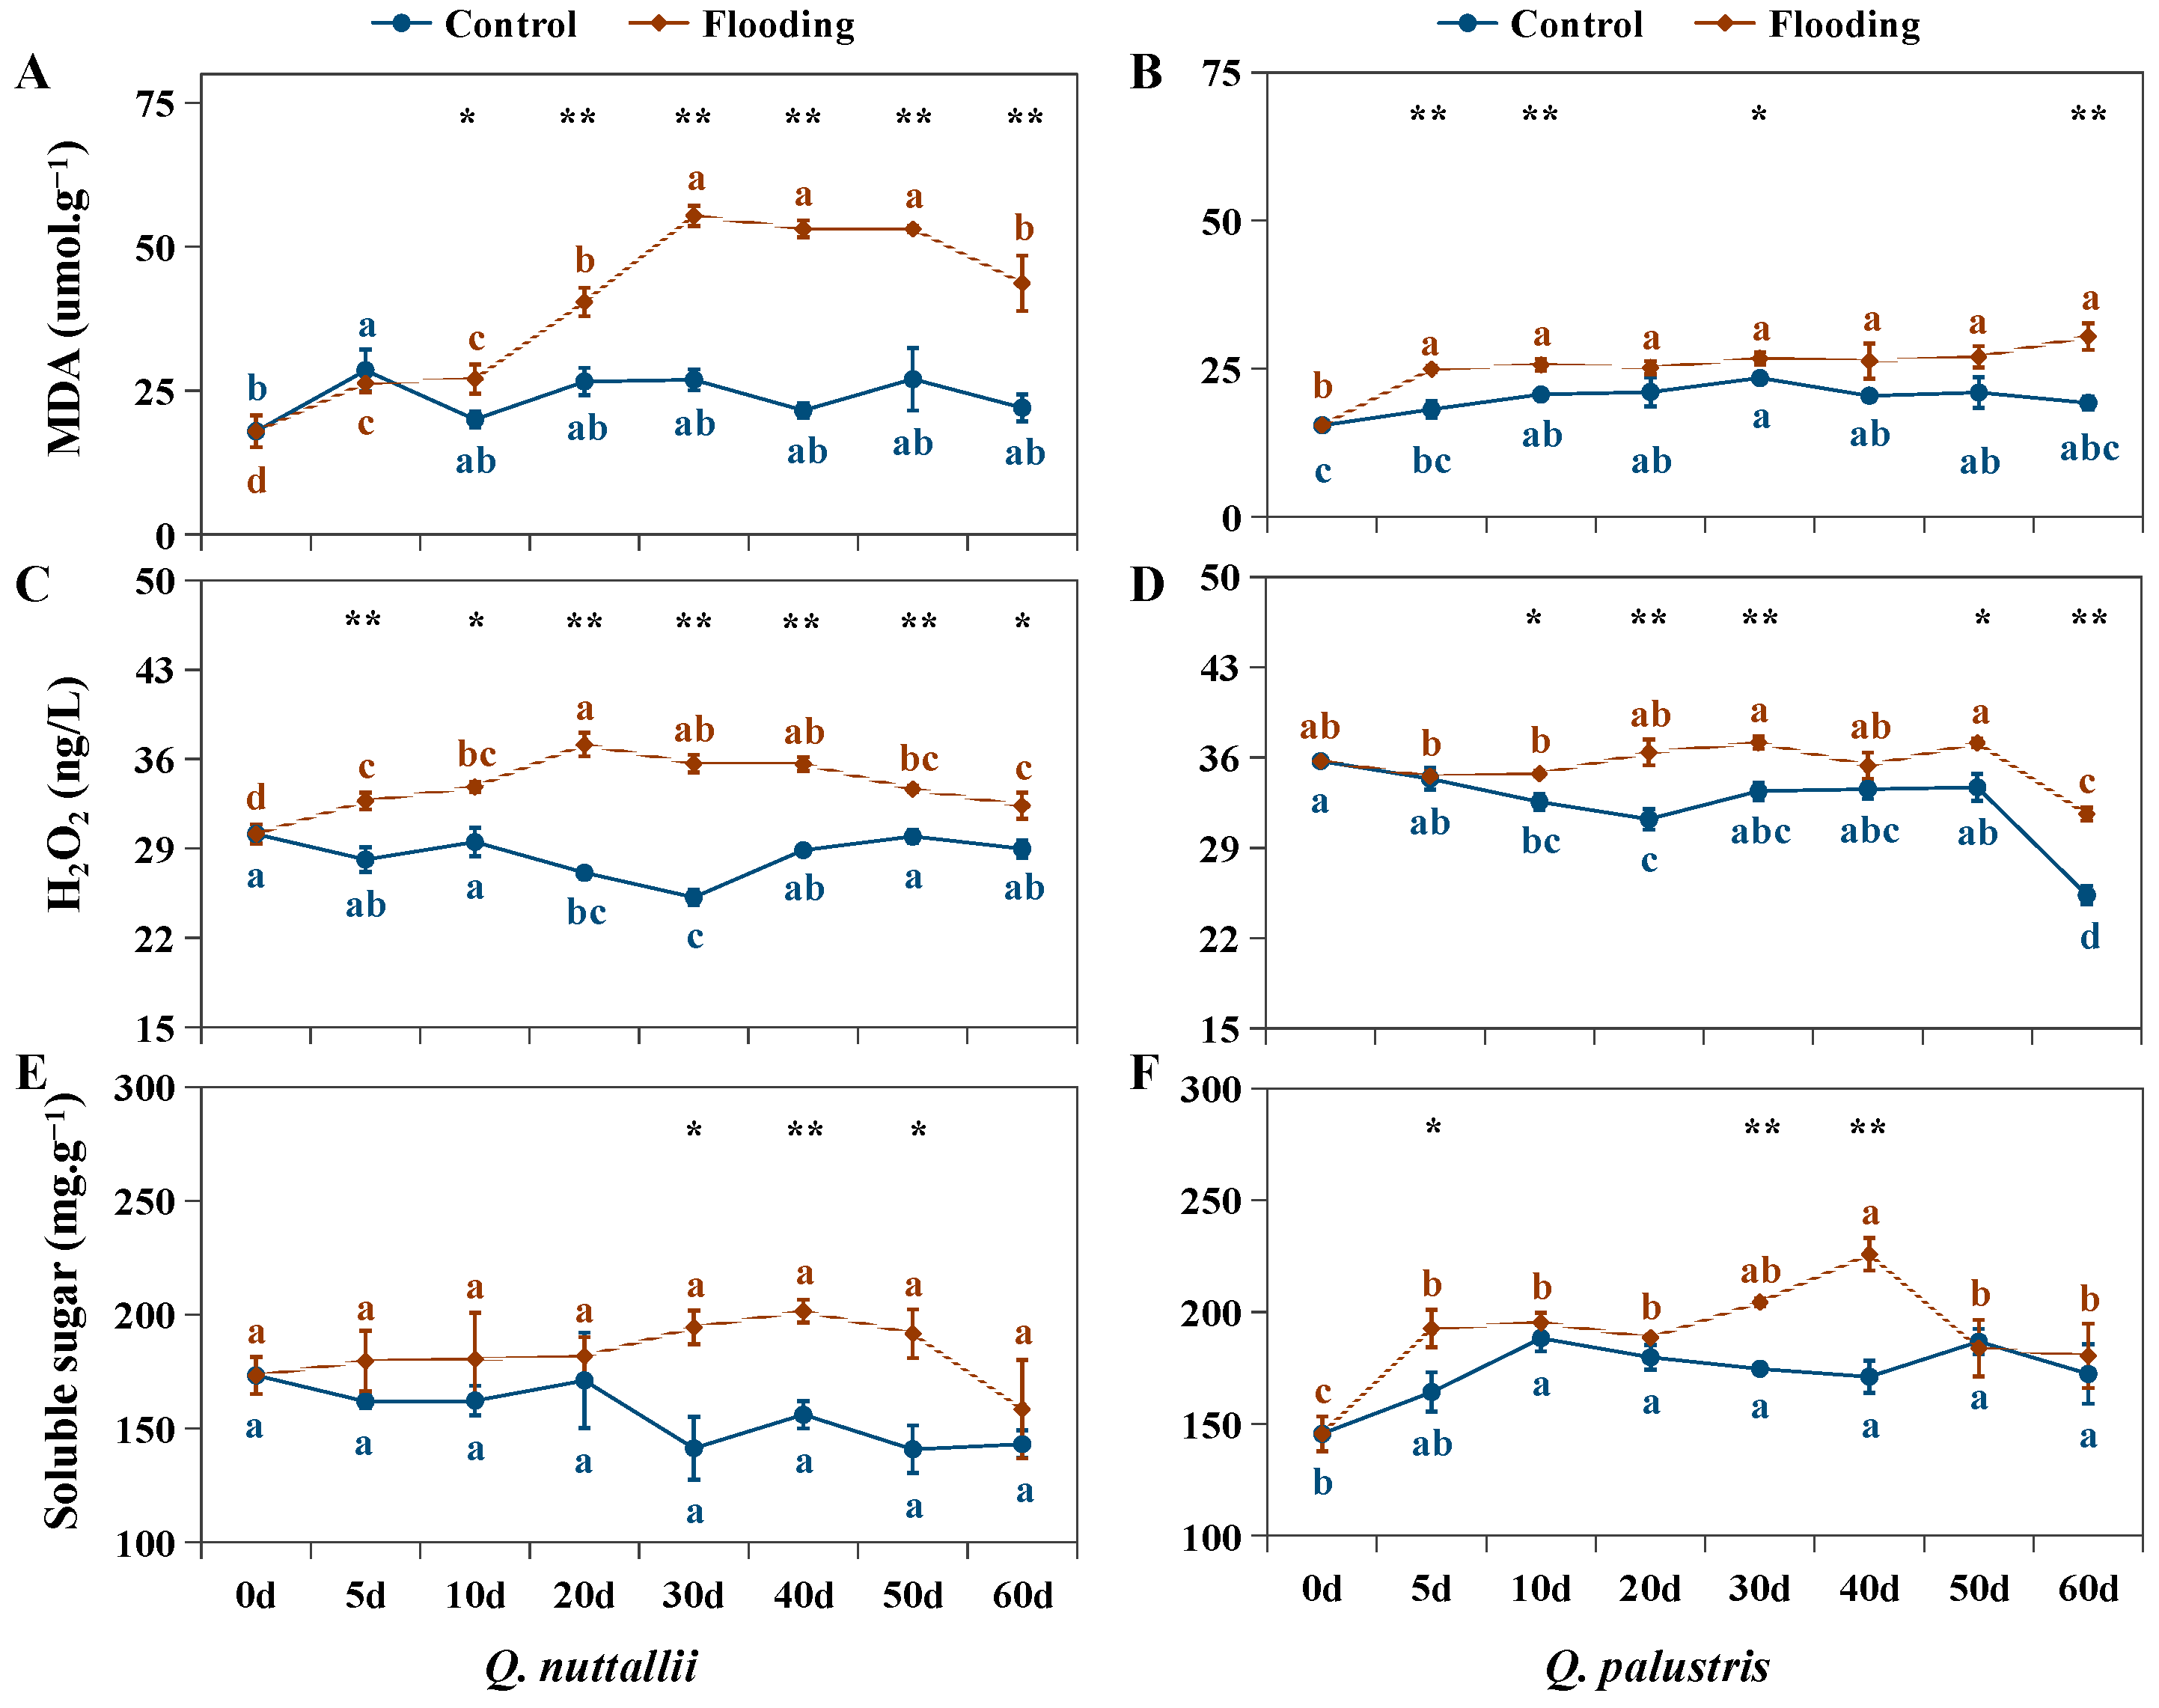
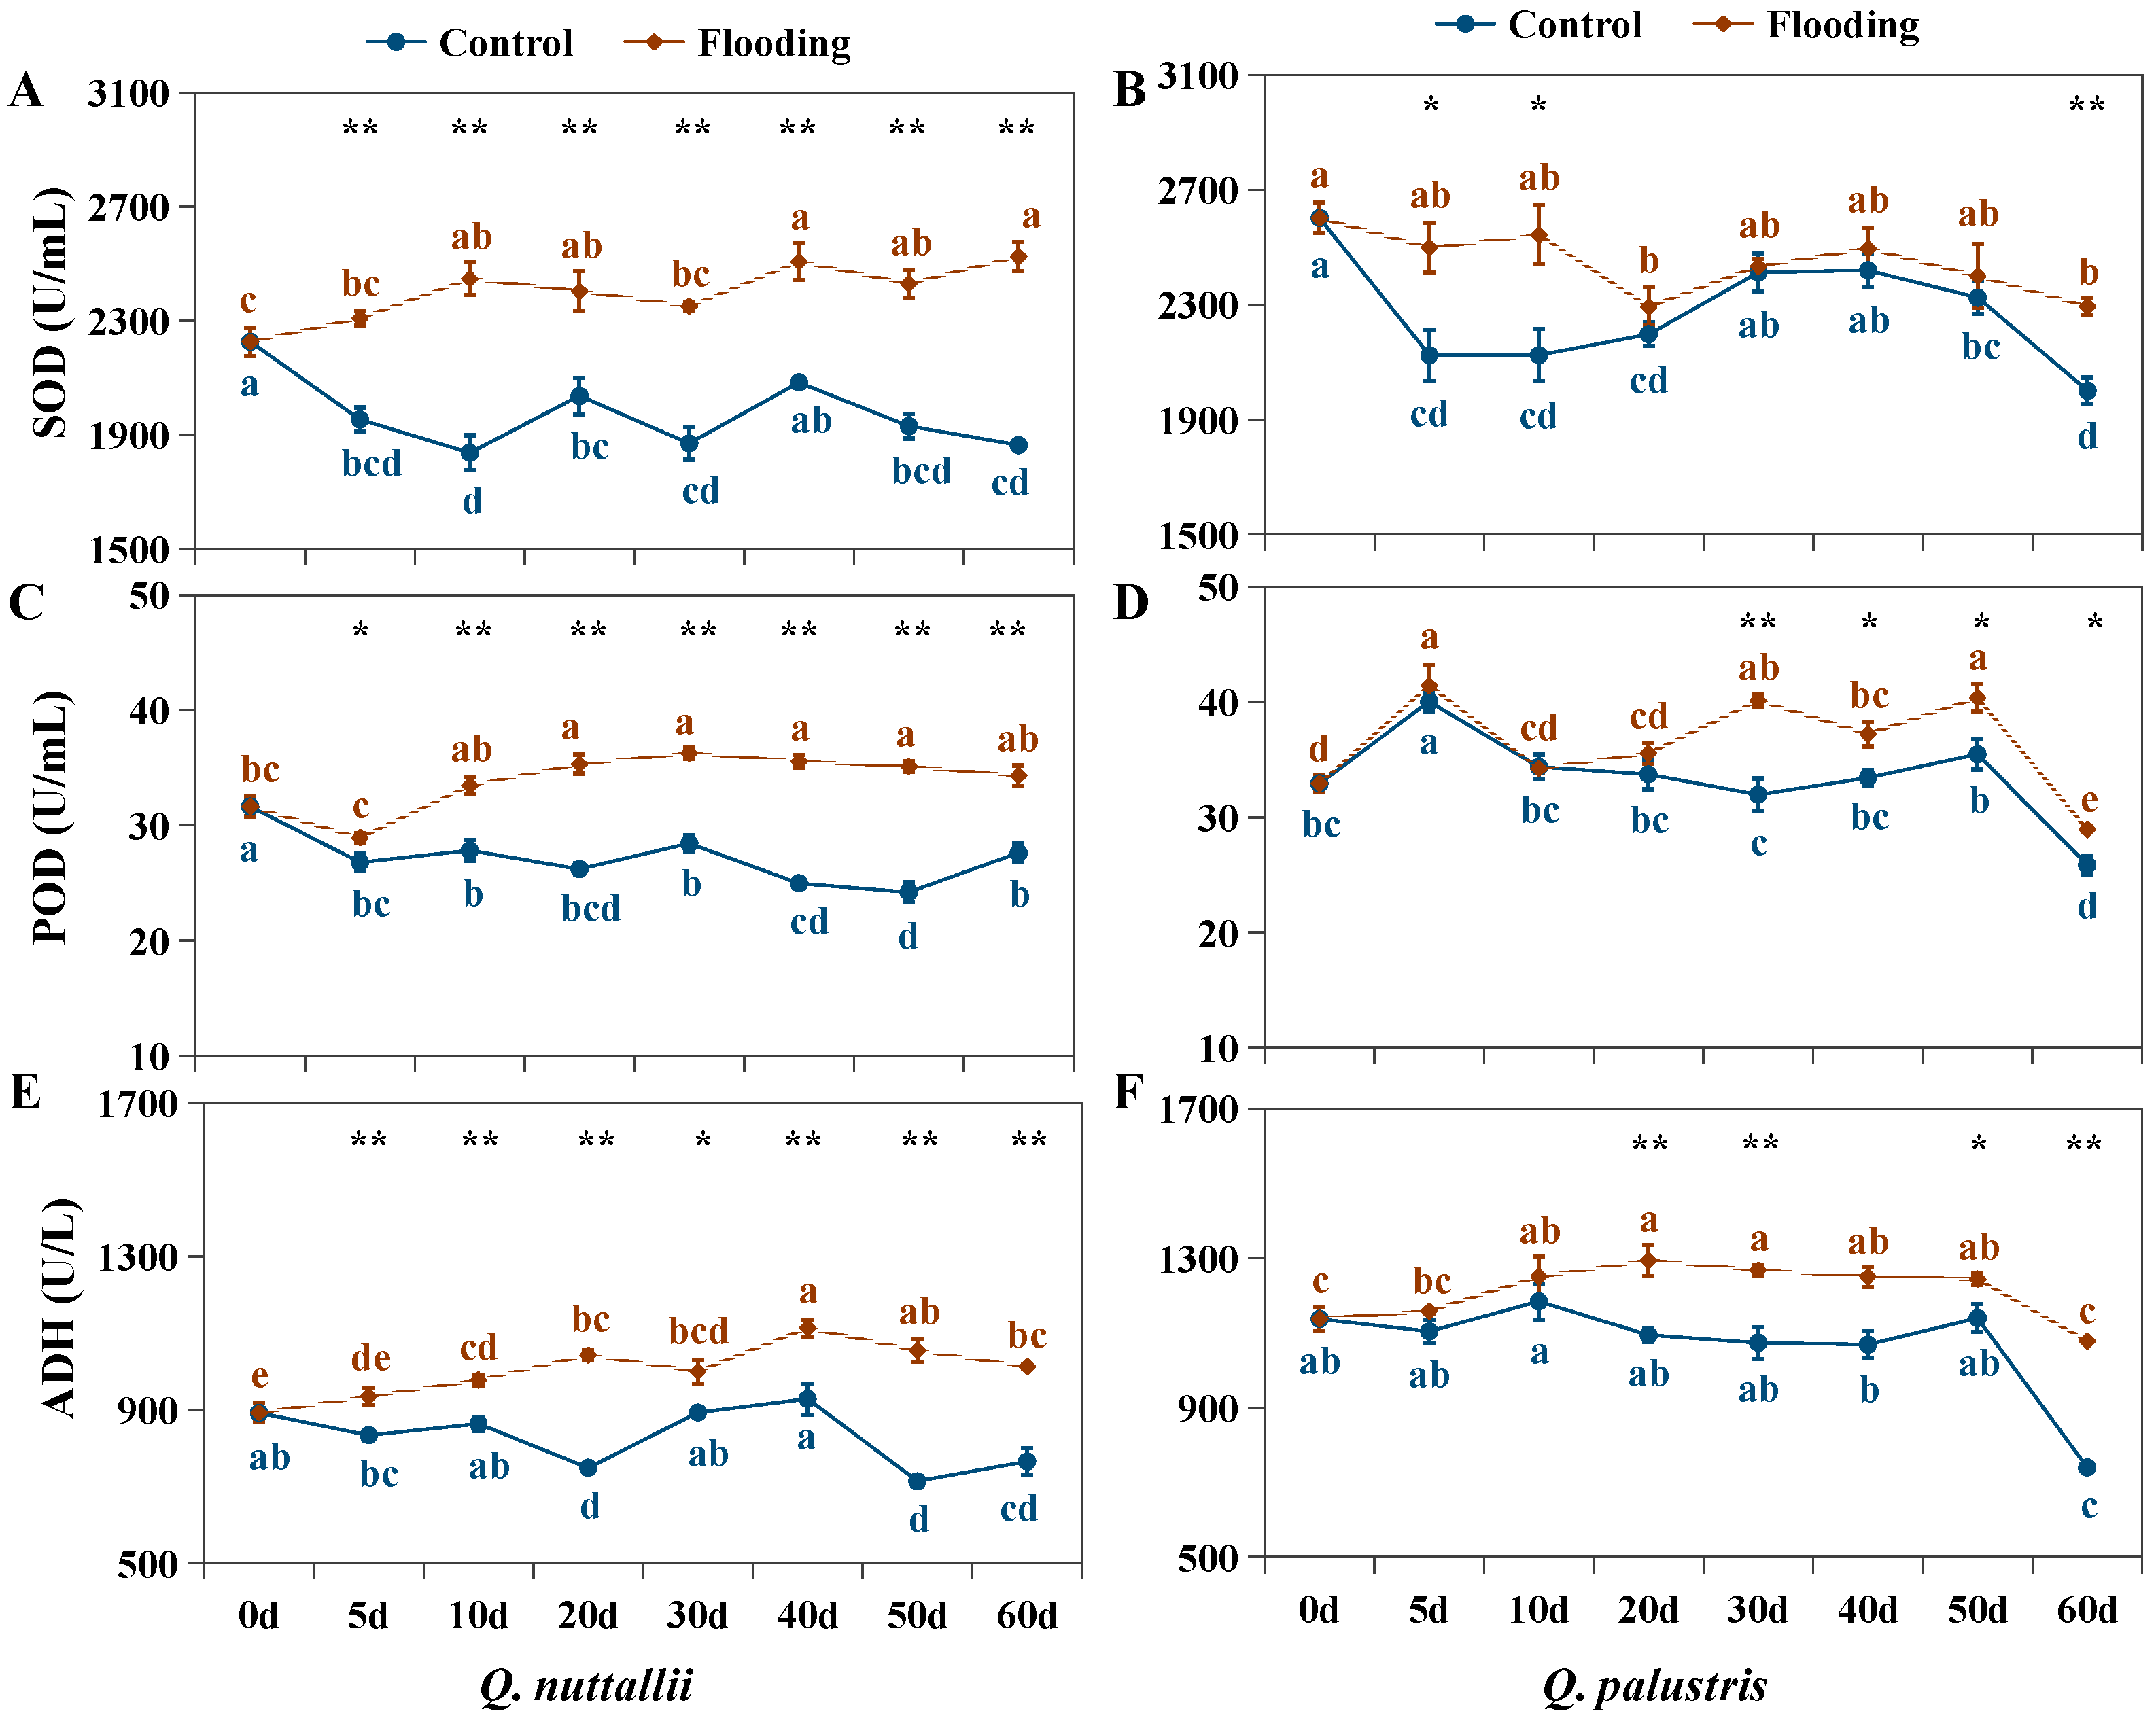
2.3. The Impact of Flooding on Biochemical Parameters in Both Oak Species

Flooding treatment caused significant increases in MDA, H2O2, SOD, POD, and ADH in both Q. nuttallii and Q. palustris (Figure 5 and Figure 6), and the parameters were significantly affected by the interaction of species × treatment × time (Table 2). POD was activated from day 30 and ADH was activated from day 20 in Q. palustris, i.e., later than in Q. nuttallii (Figure 6C–F). Unlike in Q. nuttallii, the physiological parameters of Q. palustris in the middle of the stress phase (days 20 to 50) were not higher than those of the control group throughout the entire stage, as in Q. nuttallii (Figure 5B,D,F and Figure 6B,D,F). These results indicate that the activation of the antioxidant defense system occurred earlier in Q. nuttallii than in Q. palustris.
Although the defense response was activated in both Q. nuttallii and Q. palustris, the increase in MDA and H2O2 content was higher under flooding conditions than under control conditions. However, the fewest changes in antioxidant enzymes and osmotic substances were observed in Q. palustris between the flooding and control treatments in the middle of the flooding period (Figure 5A–D, Table 4 and Table 5). Compared with their controls, the MDA content was higher in Q. nuttallii than in Q. palustris on these treatment days. The soluble sugar content was also higher in Q. nuttallii than in Q. palustris in the middle of the flooding period (Table 4 and Table 5). The H2O2 and ADH proportions in Q. nuttallii were higher at the beginning and middle of the flooding period and lower at the end (days 50 to 60) than in Q. palustris. The H2O2, SOD, POD, and ADH content in the leaves decreased in Q. palustris at the end of the treatment period (days 50 to 60) under both control and flooding conditions (Figure 5D and Figure 6B,D,F). This was not observed in Q. nuttallii. During the treatment periods, the SOD and POD proportions in the leaves were higher in Q. nuttallii than in Q. palustris (Figure 6A–D). However, the MDA and H2O2 proportions were also higher in Q. nuttallii, suggesting that Q. nuttallii was more sensitive to flooding stress.

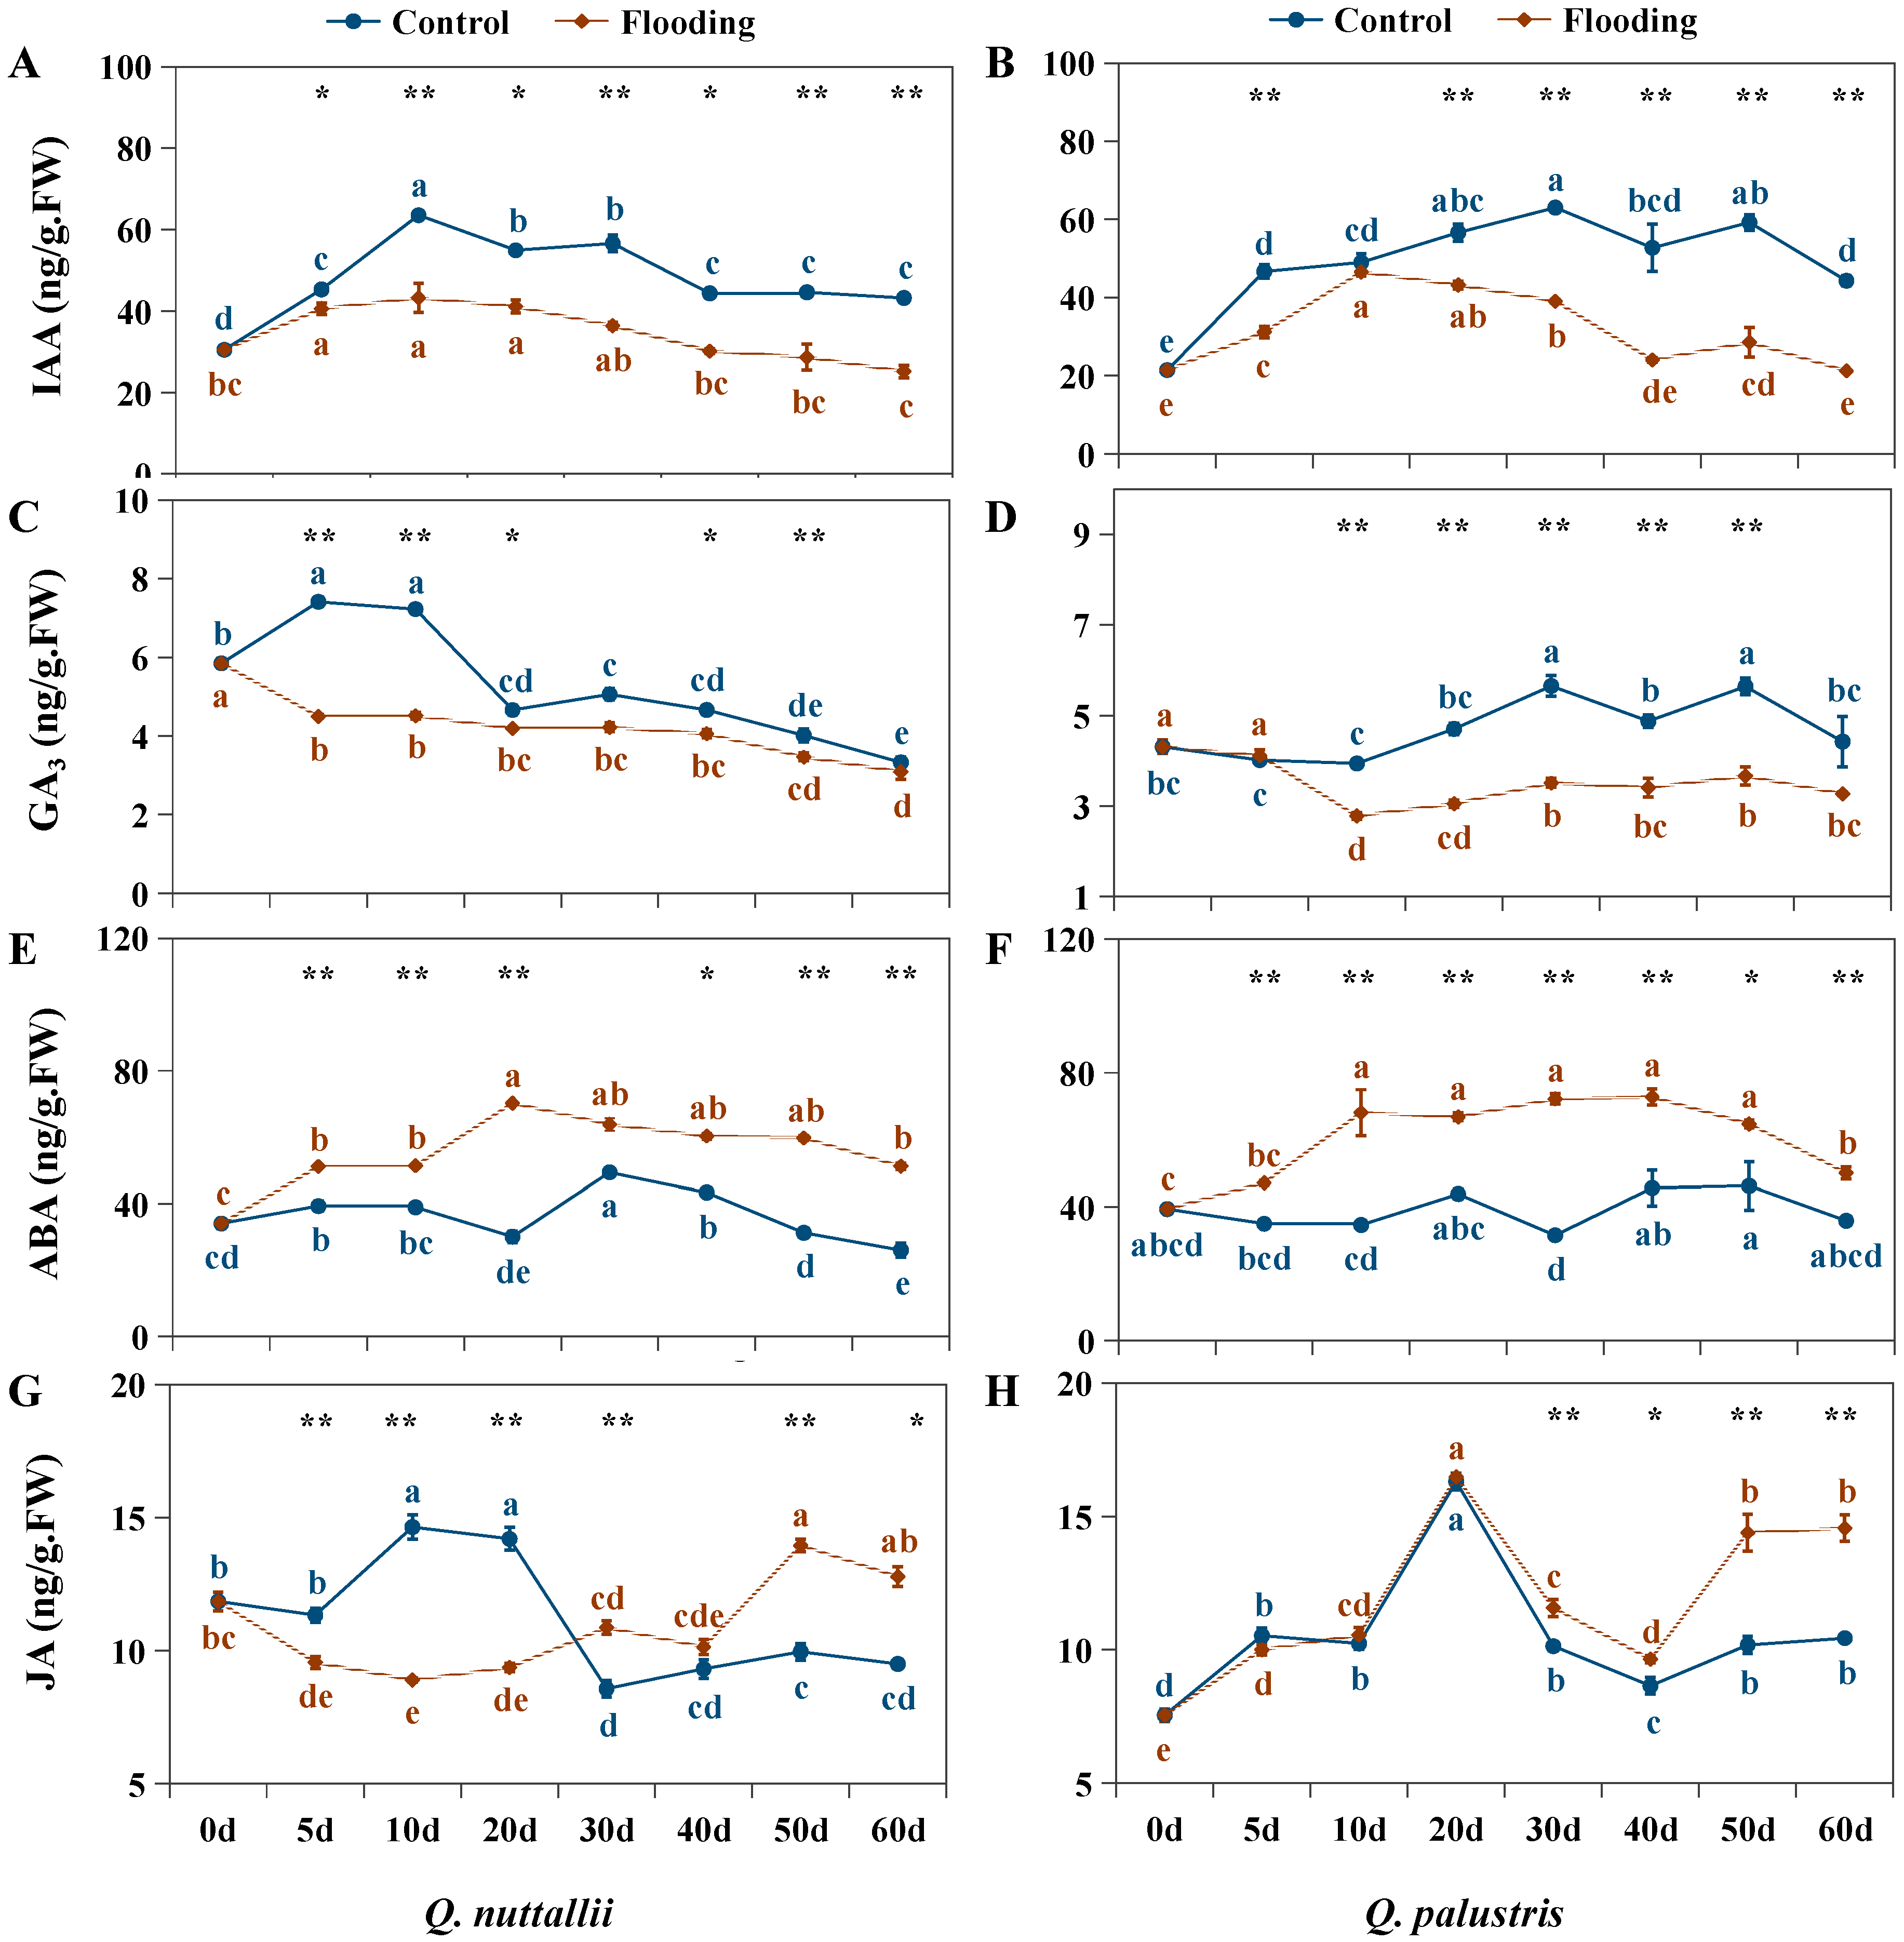
2.4. The Impact of Flooding on Endogenous Hormone Levels

Flooding treatment significantly decreased IAA levels and increased ABA and JA levels in both Q. nuttallii and Q. palustris. GA3 levels were decreased on day 50, and there was no difference between flooding and control conditions on day 60 (Figure 7). The four hormones were significantly affected by the interaction of species × treatment × time (Table 2). IAA levels increased and peaked on day 10 in both Q. nuttallii and Q. palustris (Figure 7A,C), while they were lower in the middle and at the end of the flooding treatment. In Q. palustris, the GA3 level decreased and reached the valley value on day 10 (Table 4 and Table 5). Both ABA and JA levels were higher in Q. palustris than in Q. nuttallii in the early period of the flooding treatments (Figure 7E–H, Table 4 and Table 5). The JA content was also higher in Q. palustris in the middle and late periods (Table 5). In Q. nuttallii, the pattern of the ABA content was like that in Q. palustris (Figure 7E,F). Compared with the control conditions, the JA content decreased and then increased under flooding conditions (Figure 7G).

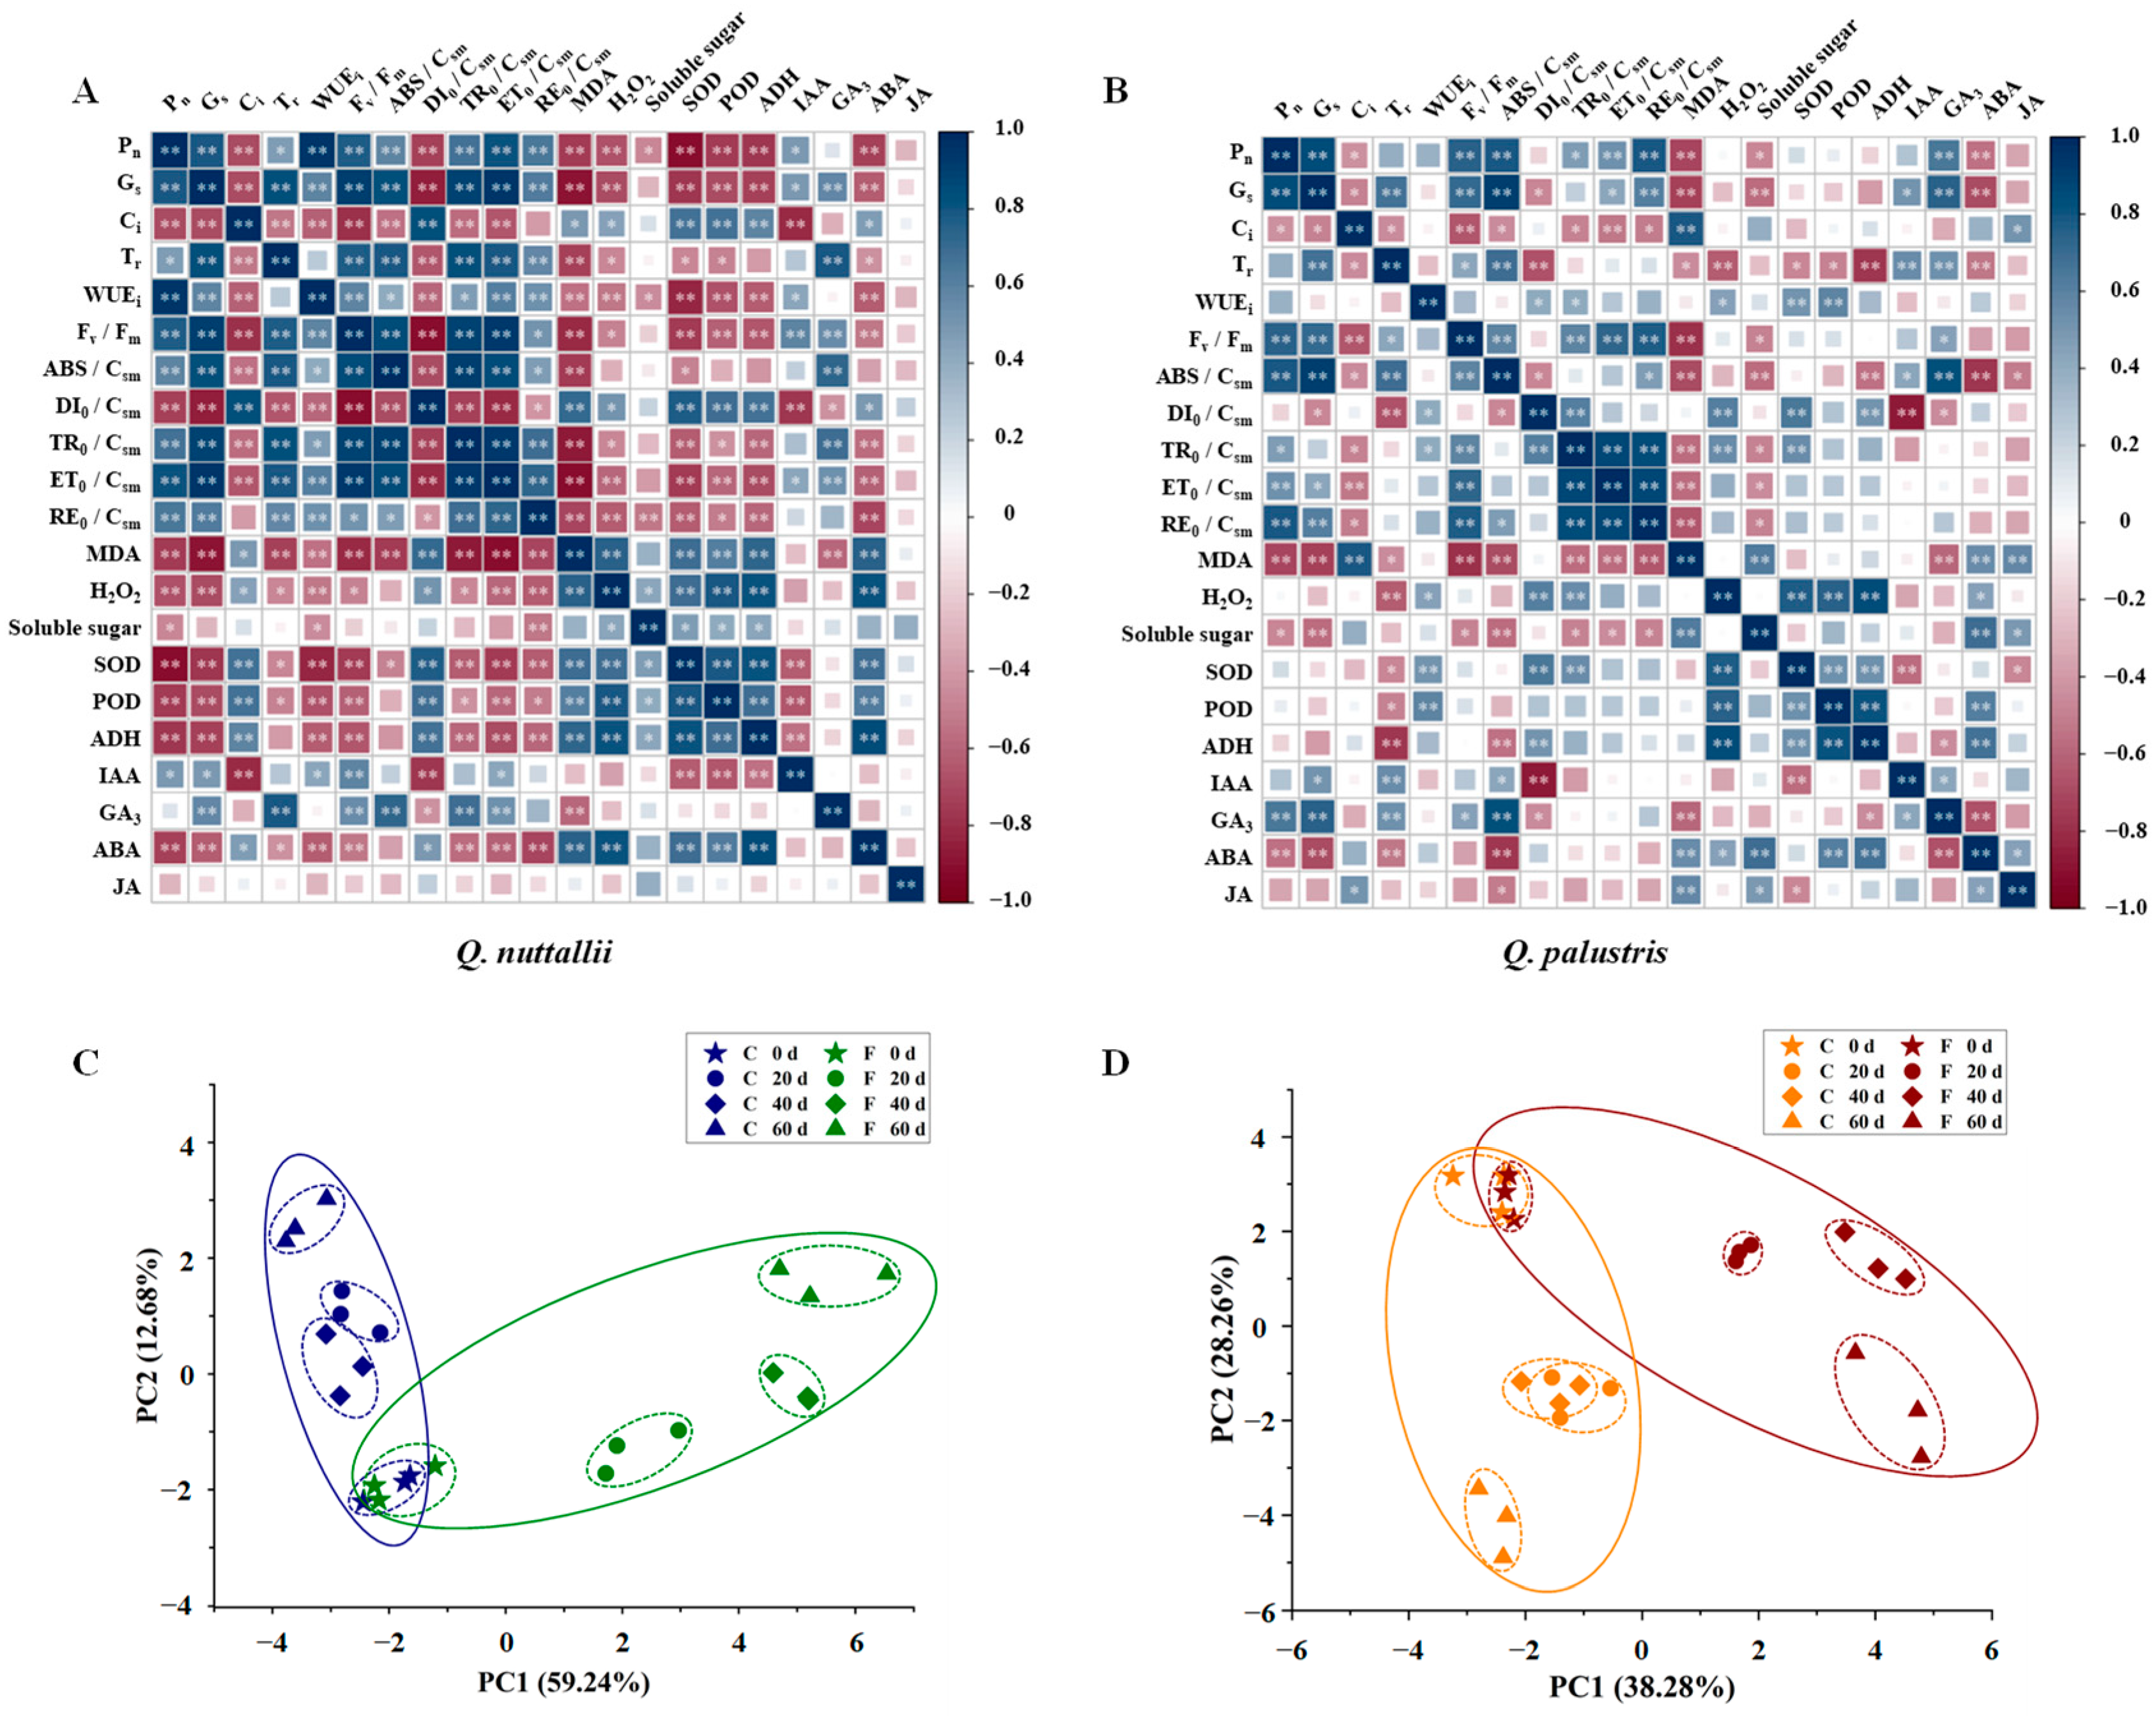
2.5. Pearson Correlation Coefficients (PCCs) and Principal Component Analysis (PCA) of Physiological Parameters under Flooding Stress
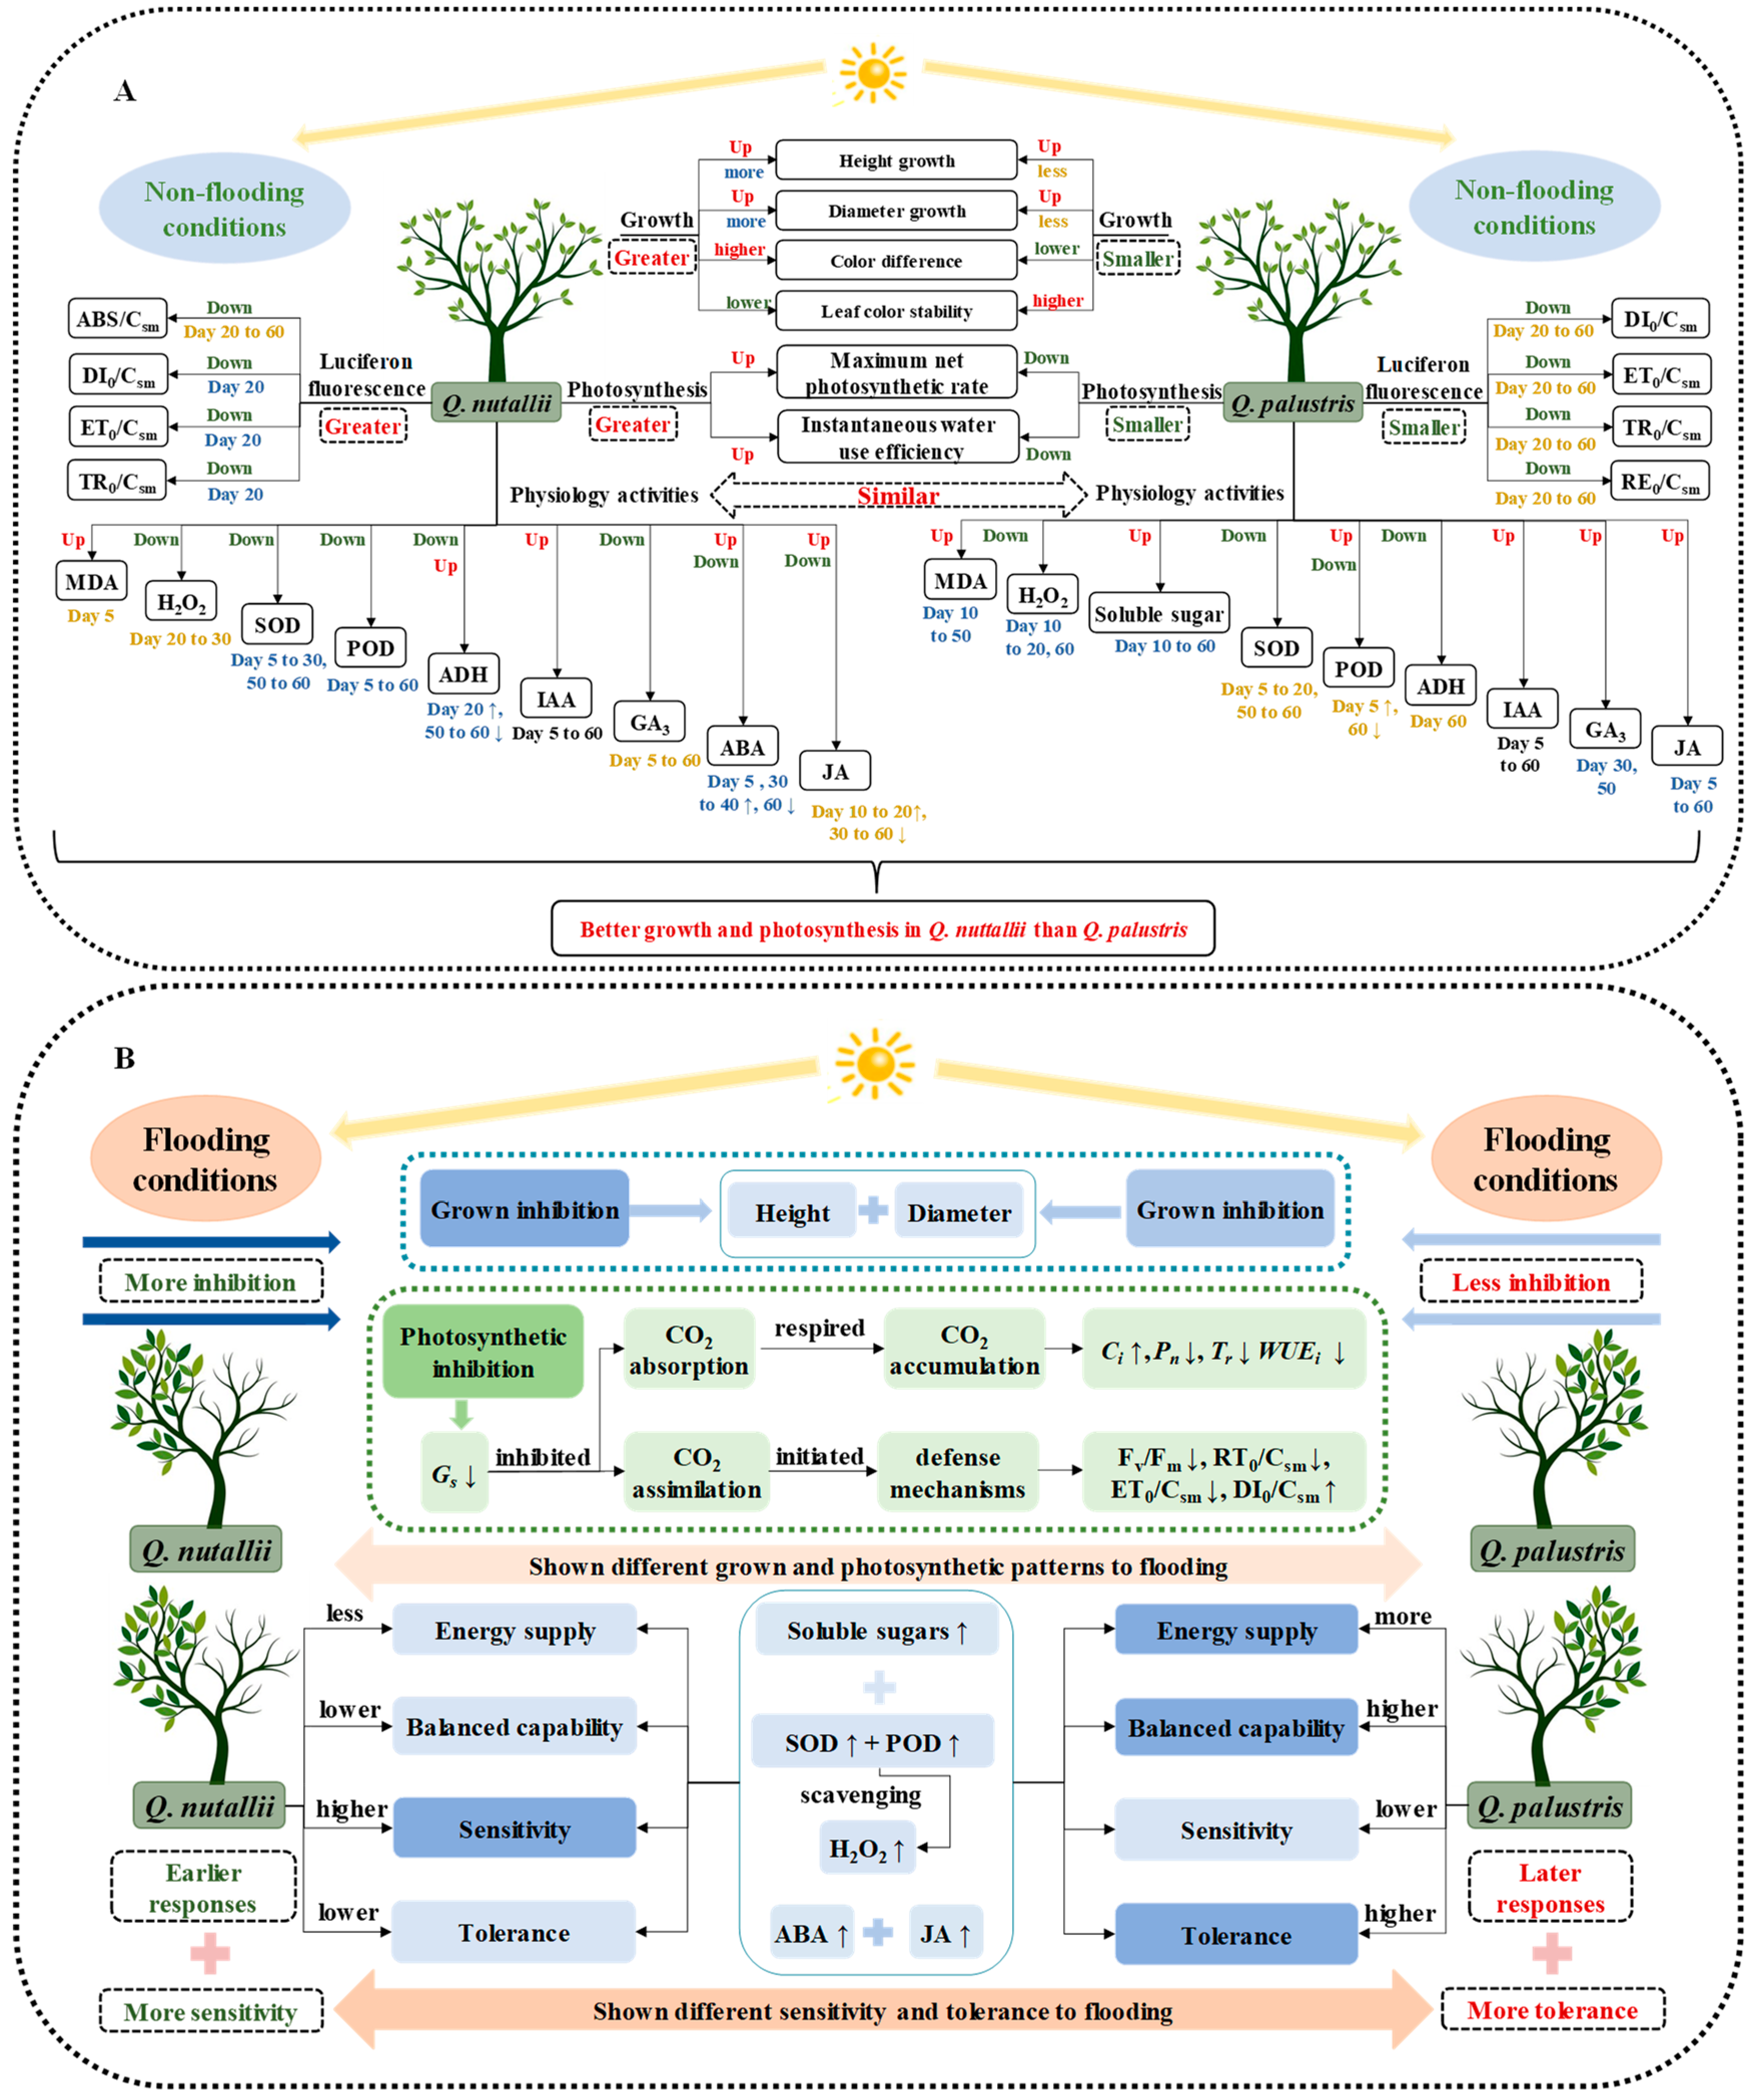
PCCs and PCA were derived and performed, respectively, based on gas exchange parameters, chlorophyll fluorescence parameters, biochemical parameters, and endogenous hormones to test whether the composition of the physiological parameters of Q. nuttallii and Q. palustris leaves differed between the flooding treatments and different days (Figure 8). The heat maps of the PCCs show significant correlations for 21 parameters in both Q. nuttallii (Figure 8A) and Q. palustris (Figure 8B).
In Q. nuttallii, WUEi was correlated with Pn (PCC = 0.95), and Gs was correlated with Pn (PCC = 0.80), Fv/Fm (PCC = 0.91), ABS/CSm (PCC = 0.84), TR0/CSm (PCC = 0.89), and ET0/CSm (PCC = 0.95). ADH was correlated with H2O2 (PCC = 0.80), SOD (PCC = 0.82), and ABA (PCC = 0.85) (Figure 8A and Table S1). PC1 and PC2 accounted for 59.24% and 12.68% of the total variation in Q.nuttallii, respectively (Figure 8C). The samples under two water conditions were almost divided into two clusters by PC1 (Figure 8C); they were affected by Pn, Gs, Fv/Fm, TR0/CSm, ET0/CSm, MDA, SOD, and ADH. PC2 was influenced by Tr, GA3, and ABS/CSm (Table S3).
In Q. palustris, Gs was correlated with Pn (PCC = 0.84) and ABS/CSm (PCC = 0.91). ADH was correlated with H2O2 (PCC = 0.84) and POD (PCC = 0.80) (Figure 8B and Table S2). PC1 and PC2 accounted for 38.28% and 28.26% of the total variation in Q. palustris, respectively (Figure 8D). Of all the parameters tested, Pn, Gs, Fv/Fm, ABS/CSm, RE0/CSm, and MDA contributed the most to PC1 when clustering two different water conditions (Table S4). PC2 was influenced by DI0/CSm, TR0/CSm, H2O2, and ADH (Table S4).

3. Discussion

3.1. The Two Species Had Contrasting Growth Responses

In general, flooding tolerance is evaluated in terms of the growth response of trees, the level of injury sustained, and survival with respect to flooding level (depth) and duration [25,26,27]. The present study detected different adaptive capabilities between Q. nuttallii and Q. palustris under flooding conditions. All treated plants could survive after 60 days of flooding treatment leading to water up to 5 cm above the soil surface, indicating that these two oak species possessed some tolerance to flooding.
Although Q. nuttallii exhibited greater growth under control conditions, flooding inhibited seedling growth more in Q. nuttallii than in Q. palustris (Figure 1C,D). This result agrees with results from previous studies and suggests that morphology can be altered to adapt to flooding [28,29]. The two analyzed species developed morphological plasticity to tolerate flooding conditions. Q. nuttallii was more responsive to flooding stress. In addition, stem hypertrophy was an adaptive response to flooding, a primary pathway for atmospheric air transmission to the roots for aeration [30,31]. Changes in stem diameter are closely correlated with plants’ flooding tolerance [31,32]. The relationship between stem development and flooding tolerance could be useful in selecting flood-tolerant Quercus species, which can be based on morphological adaptations to different conditions [31].
Flooding reduced the gas exchange parameters (Pn, Tr, and Gs) but increased Ci in both Quercus species (Q. nuttallii and Q. palustris) (Figure 3 and Table 3). These results indicate that the reduction in Gs affected the absorption of CO2, allowing the CO2 produced via respiration to accumulate in the leaves. Stomatal opening decreased sharply to reduce water loss in response to flooding stress, while Pn and Tr were inhibited by stomatal closure [33,34]. This was because the root system was first affected by flooding, leading to changes in secondary metabolism and limited water uptake and transport, and then photosynthesis was suppressed [35]. In this study, Gs was correlated with Pn in both Q. nuttallii (PCC = 0.80) and Q. palustris (PCC = 0.80). In addition, Pn, Tr, and Gs showed consistent trends, and the ABA concentration was elevated to regulate stomatal closure under flooding stress in the two species. These results suggest that the decreases in Pn and Tr were largely due to stomatal limitations. This could be due to the accumulation of non-structural carbohydrates in the leaves causing feedback inhibition of photosynthesis [29,36]. Greater reductions in the WUEi were found in Q. nuttallii than in Q. palustris in response to flooding stress. This suggests that in contrast to Q. nuttallii, Q. palustris has more efficient endogenous defensive mechanisms for alleviating photosynthetic damages in response to flooding stress.
In this study, Fv/Fm was lower in both Quercus species under flooding conditions on day 60 than in the control (Figure 4A and Table 3), suggesting that photosynthetic metabolism was impaired and reaction centers were damaged by flooding. The findings of this study support our first hypothesis that flooding stress would inhibit plant growth and leaf photosynthesis and decrease stomatal conductance and Fv/Fm. In addition, the main chlorophyll fluorescence parameters including phenomenological fluxes (ABS/CSm, TR0/CSm, ET0/CSm, and RE0/CSm) were limited by flooding [37,38]. Stomatal closure resulted in the limitation of carbon dioxide (CO2) diffusion to the chloroplasts in addition to net CO2 assimilation [39,40]. The alternative energy dissipation mechanisms, including heat exchange and photorespiration, were triggered by the limited utilization of the decreasing energy during CO2 reduction [33,40]. These results indicate that photoinhibition caused by flooding stress occurred in both Q. nuttallii and Q. palustris, and the defense mechanisms were initiated in both species to dissipate the excess excitation energy. It has been reported that another reason for a reduction in ET0/CSm is blocked electron transport, which could be due to the inhibition of the oxygen release cycle (OEC) and energy absorption of the antenna pigments [38,41,42]. The greater decrease in ABS/CSm in Q. palustris indicates a limitation of light absorption (Figure 4B), which could be a defense response of Q. palustris under flooding conditions [43,44]. These results show that Q. nuttallii and Q. palustris exhibited different photosynthetic patterns under flooding and control conditions, respectively. Q. nuttallii exhibited a higher photosynthetic capacity under control conditions, while Q. palustris demonstrated less photosynthetic inhibition under flooding stress.

3.2. Higher Tolerance and Lower Sensitivity Were Observed in Q. palustris

Q. nuttallii and Q. palustris showed similar response patterns in antioxidant defense and osmotic adjustment to flooding stress, while their tolerance and sensitivity to flooding were different. PC1 and PC2 of Q. nuttallii and Q. palustris were affected by Pn, Gs, Fv/Fm, ABS/CSm, MDA, and ADH, indicating the similarities between both species in their adaptive changes under flooding treatments. Most terrestrial plants cannot tolerate prolonged waterlogging stress. Plants may be killed by toxic accumulation, C deficiency, cytoplasmic acidification, or disease under continuous or repeated flooding conditions. The earlier the flood, the more sensitive the species [45]. Wetland species, including oaks, can minimize or postpone physiological stress to undergo adaptive changes during flooding [40]. The significant changes in Pn, Tr, Gs, WUEi, Fv/Fm, TR0/CSm, and ET0/CSm indicate that Q. nuttallii is more sensitive to flooding stress than Q. palustris in terms of photosynthesis and chlorophyll fluorescence. Q. nuttallii was also more responsive and showed greater negative phenotypic effects when grown under flooding conditions.
The root hypoxia induced by the flooding stress caused photo-oxidative damage to the leaves by increasing the production of ROS [26,46]. As important signaling molecules that can directly attack membrane lipids, ROS lead to lipid peroxidation and the oxidation of proteins and nucleic acids [27,47]. The degree of lipid peroxidation in the membranes was reflected in the MDA content, one of the most commonly used indicators of lipid peroxidation [27,46]. Although the activation of the antioxidant defense system occurred earlier in Q. nuttallii than in Q. palustris (Figure 6, Table 3 and Table 4), the MDA and H2O2 levels were higher in Q. nuttallii than in Q. palustris in the middle and end of the flooding period (Figure 5, Table 3 and Table 4), indicating that Q. nuttallii plants were exposed to more severe oxidative damage during the growth period, while Q. palustris reduced and delayed the stress via adaptative changes compared with Q. nuttallii.
Plants have a set of scavenging enzymes that help them cope with ROS, such as SOD and POD [27,47]. SOD catalyzes O2 to H2O2 and gaseous oxygen, and POD and other antioxidant enzymes decompose H2O2 [47]. In this study, both Q. nuttallii and Q. palustris exhibited higher SOD and POD activities in response to flooding stress compared with the individual controls. This suggests that these species are equipped with efficient antioxidant systems that protect them from oxidative damage caused by flooding [48,49,50]. In addition, the lower MDA, H2O2, and POD levels in Q. palustris in response to flooding stress suggests that Q. palustris possesses a better ability to maintain the balance between the formation and detoxification of activated oxygen species and possesses better capacities to protect itself from severe oxidative damage [51,52].
Both Q. nuttallii and Q. palustris can maintain higher levels of soluble sugars during the middle period of flooding. It has been reported that plants can keep greater levels of soluble sugars under stress, and the observed increase in soluble sugars indicates that osmotic regulation is likely a strategy for plants to cope with stress [29,53]. However, the accumulation of soluble sugars was observed earlier in Q. palustris than in Q. nuttallii, suggesting Q. palustris contains a greater metabolic energy supply to respond to flooding stress. There is clear experimental evidence that more tolerant species maintain carbohydrate concentrations at a high level [10,54,55,56,57]. In this study, Q. palustris exhibited higher soluble sugar content than Q. nuttallii under flooding and control conditions. Additionally, both ABA and JA levels were higher in Q. palustris than in Q. nuttallii in the early period of the flooding treatments (Figure 7E–H, Table 4 and Table 5). It is widely reported that ABA, SA, and JA participate in the antioxidant defense against abiotic and biotic stresses, playing critical roles in stress tolerance by regulating the antioxidant defense system, reducing ROS levels, and alleviating the degradation of internal cell organelles [58,59,60,61]. Therefore, increased levels of ABA and JA may benefit flooding tolerance in the early period with respect to both enzymatic (SOD) and non-enzymatic (soluble sugars) facets in Q. palustris [58,59]. Further analyses at the physiological and molecular level are needed to clarify the mechanisms of phytohormone regulation [62,63].
Q. nuttallii responded earlier to flooding stress than Q. palustris by regulating stomata and antioxidant defenses, which was attributed to the increase in the ABA levels of antioxidant enzymes. The lower degree of photosynthetic inhibition in Q. palustris could be related to the plants’ lower sensitivity. The degree of inhibition via flooding was lower in Q. palustris than in Q. nuttallii for all measured parameters. Q. nuttallii was confirmed to be more sensitive to stress. The regulating effect of Q. palustris materialized in the later stages of flooding stress.
This study only studied the flood response for two oak species. Therefore, the possibility of generalizing these results to other species or environmental conditions may be limited. Additionally, we only examined short-term responses to flooding. If the experiment lasted much longer, the trait responses could be more significant. The seedlings were potentially more susceptible to flooding stress than the adult trees. Therefore, the results may differ from those regarding adult trees in the field, and the characteristic responses in adult trees may be less intense. Despite these limitations, this short-term study showed that seedlings of Q. nuttallii and Q. palustris respond differently to different flooding periods, which may improve the physiological understanding of the ability of seedlings to cope with flooding stress. With more frequent flooding, plant resistance and resilience to flooding in agricultural and forestry environments should be further explored, as our study was conducted from the perspective of a holobiont [40].

4. Materials and Methods

4.1. Study Area

This experiment was conducted at an experimental site of the National Repository of Crabapple Germplasm in Yangzhou City, China (32°42′ N, 119°55′ E). This area has a northern subtropical monsoon climate, with an average annual temperature of 14.9 °C and a precipitation amount of 1000 mm. It has 320 frost-free days, a flat terrain, and sandy loam, which is deep and fertile, alongside favorable irrigation and drainage conditions.

4.2. Plant Material and Experimental Design

A pot experiment with a factorial design with respect to flooding treatment and species was carried out during the growing season. Two oak species, Quercus nuttallii and Quercus palustris, were used. In fall 2017, acorns of Q. nuttallii and Q. palustris were collected from the parent trees at the National Repository of Crabapple Germplasm (32°42′ N, 119°55′ E) and overwintered at 4 °C. In spring 2018, the acorns were sown in a plastic case (2 m long × 1.4 m wide × 0.45 m deep) and grown in a growth chamber (average temperature: 25 °C; relative humidity: 60–70%; light: 16 h per day). In January 2019, the seedlings were transplanted into the pots and grown on the trial site. The pots were non-woven fabric bags with a diameter of 25 cm and a height of 30 cm, filled with matrix, vermiculite, and perlite (matrix–vermiculite–perlite 2:1:1, v/v). In each pot, 2 seedlings were cultivated for 6 months under normal irrigation and outdoor conditions until they had reached a stable state. In July 2019, the seedlings of Q. nuttallii and Q. palustris with uniform size were selected, and the height of the seedlings was approximately 40 cm.
For the experimental design, two species (Q. nuttallii and Q. palustris) were combined with two treatments (flooding and control), resulting in a combination of 4 treatments in this study. Of the total of 96 seedlings obtained after adaptive cultivation, 48 seedlings of Q. nuttallii or Q. Palustris were selected and divided into two groups: the control group (approximately 75% of field water capacity) and the flooding treatment group (wherein the soil water content was supersaturated, and flooding exceeded the soil surface by 5 cm). Each combination contained 24 seedlings, which were harvested 8 times (on days 0, 5, 10, 20, 30, 40, 50, and 60, respectively), with 3 seedlings harvested each time. The flooding treatment was performed on the 180th day after transplanting and lasted for 60 days. The seedlings were transferred with the pots into the tank (height 5 cm) to simulate artificial flooding and maintain long-term flooding conditions. The water tank contained both seedlings and pots, in which the seedlings remained in the pots. Flooding occurred in the tank, the surface of which remained 5 cm above the soil (in the pots) and was replaced when necessary. The soil in the tank was sandy loam, and the seedlings were not shaded by the walls. The planting area of each treatment unit was 8 m2 (8 m long and 1 m wide), and the soil thickness was 30 cm.

4.3. Measurement of Gas Exchange and Chlorophyll Fluorescence Parameters

Gas exchange was monitored using the portable photosynthetic device CIRAS-2 (PP Systems, London, UK) on the mornings of days 0, 20, 40, and 60 (8:00−11:00) during the flooding treatment. The light intensity was set to 1000 μmol·m−2·s−1, the CO2 concentration in the reference chamber was 380 μmol·mol−1, and the leaf temperature was 25 °C. The fully functional leaves were measured at the 3rd–5th nodes of the upper part of the plantlet, obtaining the average growth level for three replicated seedlings in each treatment. The net photosynthetic rate (Pn), stomatal conductance (Gs), intercellular CO2 concentration (Ci), and transpiration rate (Tr) of the leaves were recorded. The instantaneous water use efficiency (WUEi) was calculated according to the ratio of Pn to Gs.
The chlorophyll fluorescence parameters were measured using a Handy PEA continuous fluorometer (Hansatech, London, UK) at 8:00−10:00 a.m. on days 0, 20, 40, and 60 after flooding. The 10 functional leaves from the 4th to 7th position of the upper part of the plantlets were selected and adjusted to darkness for 30 min. The time difference of leaf adaptation was 2 min. After a certain time, the basic fluorescence parameters were determined with a light intensity of 3000 μmol·m−2·s−1. The OJIP kinetics were measured in the first fully expanded youngest leaf approximately 1 h after the chamber was switched off. Chlorophyll fluorescence was measured in approximately one-third of the leaf tip, avoiding the leaf veins. For each measurement, a detachable leaf clip was placed on a leaf, and the fluorescence probe was positioned perpendicular to the surface of the leaf clip. The fluorescence signal was displayed with a temporal resolution of 10 μs. At the beginning of the measurement, weak light of 2–3 μmol quantum m−2 s−1 was irradiated onto the upper epidermis. A saturated light pulse of 3500 μmol quantum m−2 s−1 was emitted with a peak wavelength of 627 nm for 1 s [64].
The measured parameters included the absorption flux per unit area (ABS/CSm), the energy per unit area used for heat dissipation (DI0/CSm), the trapped energy flux per unit area (TR0/CSm), the energy per unit area used for electron transport (ET0/CSm), the number of reaction centers per unit area (RE0/CSm), and the maximum efficiency of PSII (Fv/Fm).

4.4. Measurements of Seedling Growth Traits and Leaf Color

Seedling growth characteristics, including plant height and diameter, were determined on days 0 and 60, respectively. The height from the soil surface to the apical bud was measured on the main stem. The diameter was determined 10 cm above the soil surface using a micrometer caliper. The leaves of Q. nuttallii and Q. palustris of both the control and treatment groups were collected and photographed. The leaves and the x-rite 24-color calibration card were tiled on the same white plate and photographed with the same camera (Canon EOS5DSR, Tokyo, Japan) under the same conditions. The aperture value was f/16, the exposure time was 1/160 s, and the flash was forced. The colorfulness of the leaves was recorded in CIELAB parameters, including the lightness value (L*), the red–green value (a*), the yellow–blue value (b*), the chroma value (C*), the total color difference (ΔE), and the a*/b* value [65,66].

4.5. Harvest and Measurements of MDA, H2O2, and Soluble Sugar

The leaves of Q. nuttallii and Q. palustris were harvested at 10:00 a.m. on days 0, 5, 10, 20, 30, 40, 50, and 60 in the control and treatment groups. The harvested leaves were wrapped in aluminum foil and immediately frozen in liquid nitrogen for 1 h. The frozen samples were then ground into fine powder in liquid nitrogen and stored at −80 °C for later determination.
The malondialdehyde (MDA) concentration was determined using 0.3 g of fresh leaf samples extracted at 4 °C with 5 mL of 0.05 M PBS (pH 7.8). Then, the extracts were mixed with 2.5 mL of thiobarbituric acid and heated at 100 °C for 15 min. After cooling in the ice, the samples were centrifuged at 1800 r/min for 10 min and spectrophotometrically measured at wavelengths of 450 nm, 532 nm, and 600 nm [67]. The hydrogen peroxide (H2O2) concentration was spectrophotometrically determined at 505 nm using the 4-aminoantipyrine method, as previously described by Alvarez et al. (2009) [68]. The soluble sugar content was measured using the Anthrone method described by Shi et al. (2017) [69].

4.6. Analysis of Enzyme Activities and Endogenous Hormone Levels

The antioxidant enzymes analyzed included superoxide dismutase (SOD; EC 1.15.1.1) and peroxidase (POD; EC 1.11.1.7), measured in the leaves using a method detailed in previous reports [62]. One unit of SOD was defined as the amount of enzyme causing half the maximum inhibition of NBT reduction [70,71,72]. One unit of POD was defined as the amount of enzyme that oxidized 1 mmol of guaiacol min−1 mg−1 protein and was determined spectrophotometrically at a wavelength of 290 nm. The alcohol dehydrogenase (ADH) activity was determined according to the method described by Yin et al. (2009) [47]. One unit of ADH was defined as the amount of enzyme that reduced the substrate per minute and was determined spectrophotometrically at a wavelength of 340 nm.
The endogenous hormones analyzed included indole-3-acetic acid (IAA), gibberellic acid (GA3), jasmonic acid (JA), and abscisic acid (ABA). Over 0.5 g of each sample was collected and analyzed using the enzyme-linked immunosorbent assay (ELISA) method. The College of Agronomy and Biotechnology, China Agricultural University, provided the kit used for endogenous hormone determination.

4.7. Statistical Analysis

Statistical analysis was performed using SAS 8.4 software, and the normality of all data was tested using the UNIVARIATE program in SAS (SAS Institute, Cary, NC, USA; 1996). To detect the differences and interactions of species, treatment, and time for experimental variables, three-way ANOVA and multiple mean comparisons (Duncan’s test) were applied. A one-way ANOVA was used to compare the differences in photosynthetic and physiological parameters between the control and flooding conditions for both Q. nuttallii and Q. palustris. A t-test was used to compare the differences between the control and flooding conditions on the same treatment days for Q. nuttallii and Q. palustris, respectively. Differences were considered significant when p ≤ 0.05. After the data were standardized, principal component analysis (PCA) and correlation analysis were performed using R-3.6.2 software (http://www.rproject.org/, accessed on 1 October 2023) and plotted using Origin 2021 software (Origin Lab Corporation, Northampton, MA, USA).

5. Conclusions

A schematic model of the morphological, photosynthetic, and physiological responses of seedlings of Q. nuttallii and Q. palustris seedlings under non-flooding and flooding conditions is presented (Figure 9). The growth and photosynthetic responses of Q. nuttallii and Q. palustris under flooding and natural conditions differed, respectively. Q. nuttallii grew more vigorously and had a higher photosynthetic capacity under control conditions, while Q. palustris was less inhibited under flooding stress. The decreases in Pn and Tr were largely due to stomatal limitations. The greater decrease in ABS/CSm in Q. palustris indicates the limitation of light absorption, which could be a defense response of Q. palustris under flooding conditions. The species exhibited similar response patterns in their antioxidant defenses to flooding stress, whereas their tolerance and sensitivity to flooding differed. The higher tolerance and lower sensitivity of Q. palustris to flooding were associated with an enhanced ability to maintain photosynthesis (WUEi) and antioxidant defense systems, combined with fewer morphological (growth traits) and physiological (light absorption, photoinhibition, and phytohormone homeostasis) restrictions. The lower tolerance of Q. nuttallii to flooding was associated with greater accumulations of MDA, H2O2, and soluble sugars. Q. nuttallii plants underwent more severe oxidative damage during the growing season, while Q. palustris reduced and delayed stress via adaptative changes more than Q. nuttallii.

Supplementary Materials

The following supporting information can be downloaded at https://www.mdpi.com/article/10.3390/plants13121658/s1. Supplemental Table S1: Pearson correlation coefficients of photosynthetic and physiological parameters in Q. nuttallii. Supplemental Table S2: Pearson correlation coefficients of photosynthetic and physiological parameters in Q. palustris. Supplemental Table S3: Variable loading scores of physiological parameters and the proportion of variation in each principal component in Q. nutallii in response to flooding stress in different periods. Supplemental Table S4: Variable loading scores of physiological parameters and the proportion of variation in each principal component in Q. palustris in response to flooding stress in different periods.

Author Contributions

Conceptualization, T.S. and M.W.; data curation, T.S. and X.L.; formal analysis, T.S.; funding acquisition, W.Z.; investigation, T.S., M.W. and X.L.; methodology, T.S.; project administration, W.Z.; supervision, Y.C. and W.Z.; validation, T.S.; writing—original draft, T.S.; writing—review and editing, T.S. All authors have read and agreed to the published version of the manuscript.

Funding

This project was financially supported by The National Forestry and Grassland Science and Technology Achievement Promotion Project (2023133114).

Data Availability Statement

All data used in this study are available within the paper and its Supplementary Materials published online.

Acknowledgments

We thank the arboretum of the National Repository of Malus spp. Germplasm for its support.

Conflicts of Interest

The authors declare no conflicts of interest.

Abbreviations

L*, lightness. a*, red–green value. b*, yellow–blue value. a/b, the ratio of red–green value to yellow–blue value. C*, chroma value. ΔE, the overall color difference. Pn, maximum net photosynthetic rate. Tr, transpiration rate. Ci, intercellular CO2 concentration. Gs, stomatal conductance. WUEi, instantaneous water use efficiency. Fv/Fm, the maximum efficiency of PSII. ABS/CSm, the absorption flux per unit area. DI0/CSm, the energy per unit area used for heat dissipation. TR0/CSm, the trapped energy flux per unit area. ET0/CSm, the energy per unit area used for electron transport. RE0/CSm, the number of reaction centers per unit area. MDA, malondialdehyde. H2O2, hydrogen peroxide. Ss, soluble sugar. SOD, superoxide dismutase. POD, peroxidase. ADH, alcohol dehydrogenase. IAA, included indole-3-acetic acid. GA3, gibberellic acid. ABA, abscisic acid. JA, jasmonic acid.

References

  1. Luo, F.-L.; Matsubara, S.; Chen, Y.; Wei, G.-W.; Dong, B.-C.; Zhang, M.-X.; Yu, F.-H. Consecutive Submergence and De-Submergence Both Impede Growth of a Riparian Plant during Water Level Fluctuations with Different Frequencies. Environ. Exp. Bot. 2018, 155, 641–649. [Google Scholar] [CrossRef]
  2. Shen, C.; Yuan, J.; Qiao, H.; Wang, Z.; Liu, Y.; Ren, X.; Wang, F.; Liu, X.; Zhang, Y.; Chen, X.; et al. Transcriptomic and Anatomic Profiling Reveal the Germination Process of Different Wheat Varieties in Response to Waterlogging Stress. BMC Genet. 2020, 21, 93. [Google Scholar] [CrossRef] [PubMed]
  3. Zhang, M.; Zhang, D.; Qi, Q.; Tong, S.; Wang, X.; An, Y.; Lu, X. Flooding Effects on Population and Growth Characteristics of Bolboschoenus planiculmis in Momoge Wetland, Northeast China. Ecol. Indic. 2022, 137, 108730. [Google Scholar] [CrossRef]
  4. Perata, P.; Armstrong, W.; Voesenek, L.A.C.J. Plants and Flooding Stress. New Phytol. 2011, 190, 269–273. [Google Scholar] [CrossRef]
  5. Striker, G.G. Flooding Stress on Plants: Anatomical, Morphological and Physiological Responses. In Botany; Books on Demand GmbH: Norderstedt, Germany, 2012; Volume 1, pp. 3–28. [Google Scholar] [CrossRef]
  6. Wegner, L.H. Oxygen Transport in Waterlogged Plants. In Waterlogging Signalling and Tolerance in Plants; Mancuso, S., Shabala, S., Eds.; Springer: Berlin/Heidelberg, Germany, 2010; pp. 3–22. ISBN 978-3-642-10304-9. [Google Scholar]
  7. Colmer, T.D.; Voesenek, L.A.C.J. Flooding Tolerance: Suites of Plant Traits in Variable Environments. Funct. Plant Biol. 2009, 36, 665. [Google Scholar] [CrossRef]
  8. Iqbal, Z.; Sarkhosh, A.; Balal, R.M.; Gómez, C.; Zubair, M.; Ilyas, N.; Khan, N.; Shahid, M.A. Silicon Alleviate Hypoxia Stress by Improving Enzymatic and Non-Enzymatic Antioxidants and Regulating Nutrient Uptake in Muscadine Grape (Muscadinia rotundifolia Michx.). Front. Plant Sci. 2021, 11, 618873. [Google Scholar] [CrossRef]
  9. Su, Q.; Sun, Z.; Liu, Y.; Lei, J.; Zhu, W.; Nanyan, L. Physiological and Comparative Transcriptome Analysis of the Response and Adaptation Mechanism of the Photosynthetic Function of Mulberry (Morus alba L.) Leaves to Flooding Stress. Plant Signal. Behav. 2022, 17, 2094619. [Google Scholar] [CrossRef]
  10. Ferner, E.; Rennenberg, H.; Kreuzwieser, J. Effect of Flooding on C Metabolism of Flood-Tolerant (Quercus robur) and Non-Tolerant (Fagus sylvatica) Tree Species. Tree Physiol. 2012, 32, 135–145. [Google Scholar] [CrossRef]
  11. Maric, A.; Hartman, S. The Leaf Sheath Promotes Prolonged Flooding Protection by Giving Rise to Specialized Adventitious Roots. New Phytol. 2023, 238, 1337–1339. [Google Scholar] [CrossRef]
  12. Bailey-Serres, J.; Voesenek, L.A.C.J. Flooding Stress: Acclimations and Genetic Diversity. Annu. Rev. Plant Biol. 2008, 59, 313–339. [Google Scholar] [CrossRef]
  13. Hartman, S.; Sasidharan, R.; Voesenek, L.A.C.J. The Role of Ethylene in Metabolic Acclimations to Low Oxygen. New Phytol. 2021, 229, 64–70. [Google Scholar] [CrossRef] [PubMed]
  14. Sun, S.; Zhang, Y.; Huang, D.; Wang, H.; Cao, Q.; Fan, P.; Yang, N.; Zheng, P.; Wang, R. The Effect of Climate Change on the Richness Distribution Pattern of Oaks (Quercus L.) in China. Sci. Total Environ. 2020, 744, 140786. [Google Scholar] [CrossRef]
  15. Zhang, M.; Zhou, Z.; Chen, W.; Cannon, C.H.; Raes, N.; Slik, J.W.F. Major Declines of Woody Plant Species Ranges under Climate Change in Y Unnan, C Hina. Divers. Distrib. 2014, 20, 405–415. [Google Scholar] [CrossRef]
  16. Sloan, J.L.; Islam, M.A.; Jacobs, D.F. Reduced Translocation of Current Photosynthate Precedes Changes in Gas Exchange for Quercus Rubra Seedlings under Flooding Stress. Tree Physiol. 2016, 36, 54–62. [Google Scholar] [CrossRef] [PubMed]
  17. Ni, M.; Gao, Z.; Chen, H.; Chen, C.; Yu, F. Exponential Fertilization Regimes Improved Growth and Nutrient Status of Quercus Nuttallii Container Seedlings. Agronomy 2022, 12, 669. [Google Scholar] [CrossRef]
  18. Holladay, C.-A.; Kwit, C.; Collins, B. Woody Regeneration in and around Aging Southern Bottomland Hardwood Forest Gaps: Effects of Herbivory and Gap Size. For. Ecol. Manag. 2006, 223, 218–225. [Google Scholar] [CrossRef]
  19. Hayford, I.; Knapp, B.O.; Kabrick, J.M. Responses of Natural and Artificial Pin Oak (Quercus palustris) Reproduction to a Sequence of Silvicultural Release Treatments in Bottomland Hardwood Forests in Southern Missouri. For. Ecol. Manag. 2023, 529, 120699. [Google Scholar] [CrossRef]
  20. Gravatt, D.A.; Kirby, C.J. Patterns of Photosynthesis and Starch Allocation in Seedlings of Four Bottomland Hardwood Tree Species Subjected to Flooding. Tree Physiol. 1998, 18, 411–417. [Google Scholar] [CrossRef]
  21. Folzer, H.; Dat, J.F.; Capelli, N.; Rieffel, D.; Badot, P.-M. Response of Sessile Oak Seedlings (Quercus petraea) to Flooding: An Integrated Study. Tree Physiol. 2006, 26, 759–766. [Google Scholar] [CrossRef]
  22. Black, R.A. Water Relations of Quercus Palustris: Field Measurements on an Experimentally Flooded Stand. Oecologia 1984, 64, 14–20. [Google Scholar] [CrossRef] [PubMed]
  23. Sample, R.D.; Cook, J.; Babst, B.A. Resiliency of Nuttall Oak but Not Shumard Oak to Winter and Spring Flood: Dormancy Alone Does Not Confer Flood Tolerance. Trees 2023, 37, 1121–1136. [Google Scholar] [CrossRef]
  24. Jacques, R.; Stovall, J.; Comer, C.; Williams, H.; Symmank, M. Herbivory and Flooding Impacts on Planted Bottomland Hardwood Seedlings. For. Int. J. For. Res. 2022, 95, 215–228. [Google Scholar] [CrossRef]
  25. Glenz, C.; Schlaepfer, R.; Iorgulescu, I.; Kienast, F. Flooding Tolerance of Central European Tree and Shrub Species. For. Ecol. Manag. 2006, 235, 1–13. [Google Scholar] [CrossRef]
  26. Kozlowski, T.T. Responses of Woody Plants to Flooding and Salinity. Tree Physiol. 1997, 17, 490. [Google Scholar] [CrossRef]
  27. Yang, F.; Wang, Y.; Wang, J.; Deng, W.; Liao, L.; Li, M. Different Eco-Physiological Responses between Male and Female Populus Deltoides Clones to Waterlogging Stress. For. Ecol. Manag. 2011, 262, 1963–1971. [Google Scholar] [CrossRef]
  28. Wang, X.; Zhu, W.; Hashiguchi, A.; Nishimura, M.; Tian, J.; Komatsu, S. Metabolic Profiles of Flooding-Tolerant Mechanism in Early-Stage Soybean Responding to Initial Stress. Plant Mol. Biol. 2017, 94, 669–685. [Google Scholar] [CrossRef]
  29. Zhao, Y.; Wang, D.; Duan, H. Effects of Drought and Flooding on Growth and Physiology of Cinnamomum Camphora Seedlings. Forests 2023, 14, 1343. [Google Scholar] [CrossRef]
  30. Shimamura, S.; Mochizuki, T.; Nada, Y.; Fukuyama, M. Formation and Function of Secondary Aerenchyma in Hypocotyl, Roots and Nodules of Soybean (Glycine max) under Flooded Conditions. Plant Soil 2003, 251, 351–359. [Google Scholar] [CrossRef]
  31. Henshaw, T.L.; Gilbert, R.A.; Scholberg, J.M.S.; Sinclair, T.R. Soya Bean (Glycine Max L. Merr.) Genotype Response to Early-season Flooding: II. Aboveground Growth and Biomass. J. Agron. Crop Sci. 2007, 193, 189–197. [Google Scholar] [CrossRef]
  32. Pires, J.L.F.; Soprano, E.; Cassol, B. Adaptações morfofisiológicas da soja em solo inundado. Pesq. Agropec. Bras. 2002, 37, 41–50. [Google Scholar] [CrossRef]
  33. Else, M.A.; Janowiak, F.; Atkinson, C.J.; Jackson, M.B. Root Signals and Stomatal Closure in Relation to Photosynthesis, Chlorophyll a Fluorescence and Adventitious Rooting of Flooded Tomato Plants. Ann. Bot. 2009, 103, 313–323. [Google Scholar] [CrossRef] [PubMed]
  34. Tong, C.; Hill, C.B.; Zhou, G.; Zhang, X.-Q.; Jia, Y.; Li, C. Opportunities for Improving Waterlogging Tolerance in Cereal Crops—Physiological Traits and Genetic Mechanisms. Plants 2021, 10, 1560. [Google Scholar] [CrossRef]
  35. Gong, X.; Xu, Y.; Li, H.; Chen, X.; Song, Z. Antioxidant Activation, Cell Wall Reinforcement, and Reactive Oxygen Species Regulation Promote Resistance to Waterlogging Stress in Hot Pepper (Capsicum annuum L.). BMC Plant Biol. 2022, 22, 425. [Google Scholar] [CrossRef] [PubMed]
  36. Brodribb, T.J.; Cochard, H. Hydraulic Failure Defines the Recovery and Point of Death in Water-Stressed Conifers. Plant Physiol. 2009, 149, 575–584. [Google Scholar] [CrossRef] [PubMed]
  37. Juzoń, K.; Czyczyło-Mysza, I.; Ostrowska, A.; Marcińska, I.; Skrzypek, E. Chlorophyll Fluorescence for Prediction of Yellow Lupin (Lupinus luteus L.) and Pea (Pisum sativum L.) Susceptibility to Drought. Photosynthetica 2019, 57, 950–959. [Google Scholar] [CrossRef]
  38. Bhatt, U.; Sharma, S.; Soni, V. Differential Photosynthetic Responses in Riccia Gangetica under Heat, Cold, Salinity, Submergence, and UV-B Stresses. J. Photochem. Photobiol. 2022, 12, 100146. [Google Scholar] [CrossRef]
  39. Li, M.; López, R.; Venturas, M.; Pita, P.; Gordaliza, G.G.; Gil, L.; Rodríguez-Calcerrada, J. Greater Resistance to Flooding of Seedlings of Ulmus Laevis than Ulmus Minor Is Related to the Maintenance of a More Positive Carbon Balance. Trees 2015, 29, 835–848. [Google Scholar] [CrossRef]
  40. Martínez-Arias, C.; Witzell, J.; Solla, A.; Martin, J.A.; Rodríguez-Calcerrada, J. Beneficial and Pathogenic Plant-microbe Interactions during Flooding Stress. Plant Cell Environ. 2022, 45, 2875–2897. [Google Scholar] [CrossRef]
  41. Sinsawat, V.; Leipner, J.; Stamp, P.; Fracheboud, Y. Effect of Heat Stress on the Photosynthetic Apparatus in Maize (Zea mays L.) Grown at Control or High Temperature. Environ. Exp. Bot. 2004, 52, 123–129. [Google Scholar] [CrossRef]
  42. Mathur, S.; Jajoo, A. Investigating Deleterious Effects of Ultraviolet (UV) Radiations on Wheat by a Quick Method. Acta Physiol. Plant. 2015, 37, 121. [Google Scholar] [CrossRef]
  43. Hura, T.; Hura, K.; Ostrowska, A.; Dziurka, K. Rapid Plant Rehydration Initiates Permanent and Adverse Changes in the Photosynthetic Apparatus of Triticale. Plant Soil 2015, 397, 127–145. [Google Scholar] [CrossRef]
  44. Park, S.-U.; Lee, C.-J.; Kim, S.-E.; Lim, Y.-H.; Lee, H.-U.; Nam, S.-S.; Kim, H.S.; Kwak, S.-S. Selection of Flooding Stress Tolerant Sweetpotato Cultivars Based on Biochemical and Phenotypic Characterization. Plant Physiol. Biochem. 2020, 155, 243–251. [Google Scholar] [CrossRef] [PubMed]
  45. Limami, A.M. Adaptations of Nitrogen Metabolism to Oxygen Deprivation in Plants. In Low-Oxygen Stress in Plants: Oxygen Sensing and Adaptive Responses to Hypoxia; van Dongen, J.T., Licausi, F., Eds.; Springer: Vienna, Austria, 2014; pp. 209–221. ISBN 978-3-7091-1254-0. [Google Scholar]
  46. Miao, L.-F.; Yang, F.; Han, C.-Y.; Pu, Y.-J.; Ding, Y.; Zhang, L.-J. Sex-Specific Responses to Winter Flooding, Spring Waterlogging and Post-Flooding Recovery in Populus Deltoides. Sci. Rep. 2017, 7, 2534. [Google Scholar] [CrossRef]
  47. Yin, D.; Chen, S.; Chen, F.; Guan, Z.; Fang, W. Morphological and Physiological Responses of Two Chrysanthemum Cultivars Differing in Their Tolerance to Waterlogging. Environ. Exp. Bot. 2009, 67, 87–93. [Google Scholar] [CrossRef]
  48. Ahmed, S.; Nawata, E.; Hosokawa, M.; Domae, Y.; Sakuratani, T. Alterations in Photosynthesis and Some Antioxidant Enzymatic Activities of Mungbean Subjected to Waterlogging. Plant Sci. 2002, 163, 117–123. [Google Scholar] [CrossRef]
  49. Ye, Y.; Tam, N.F.Y.; Wong, Y.S.; Lu, C.Y. Growth and Physiological Responses of Two Mangrove Species (Bruguiera gymnorrhiza and Kandelia candel) to Waterlogging. Environ. Exp. Bot. 2003, 49, 209–221. [Google Scholar] [CrossRef]
  50. Yiu, J.-C.; Juang, L.-D.; Fang, D.Y.-T.; Liu, C.-W.; Wu, S.-J. Exogenous Putrescine Reduces Flooding-Induced Oxidative Damage by Increasing the Antioxidant Properties of Welsh Onion. Sci. Hortic. 2009, 120, 306–314. [Google Scholar] [CrossRef]
  51. Yang, F.; Wang, Y.; Miao, L.-F. Comparative Physiological and Proteomic Responses to Drought Stress in Two Poplar Species Originating from Different Altitudes. Physiol. Plant. 2010, 139, 388–400. [Google Scholar] [CrossRef]
  52. Zhang, S.; Lu, S.; Xu, X.; Korpelainen, H.; Li, C. Changes in Antioxidant Enzyme Activities and Isozyme Profiles in Leaves of Male and Female Populus cathayana Infected with Melampsora larici-populina. Tree Physiol. 2010, 30, 116–128. [Google Scholar] [CrossRef]
  53. Blumstein, M.; Gersony, J.; Martínez-Vilalta, J.; Sala, A. Global Variation in Nonstructural Carbohydrate Stores in Response to Climate. Glob. Chang. Biol. 2023, 29, 1854–1869. [Google Scholar] [CrossRef]
  54. Herschbach, C.; Mult, S.; Kreuzwieser, J.; Kopriva, S. Influence of Anoxia on Whole Plant Sulphur Nutrition of Flooding-tolerant Poplar (Populus Tremula × P. Alba). Plant Cell Environ. 2005, 28, 167–175. [Google Scholar] [CrossRef]
  55. Jaeger, C.; Gessler, A.; Biller, S.; Rennenberg, H.; Kreuzwieser, J. Differences in C Metabolism of Ash Species and Provenances as a Consequence of Root Oxygen Deprivation by Waterlogging. J. Exp. Bot. 2009, 60, 4335–4345. [Google Scholar] [CrossRef]
  56. Martínez-Alcántara, B.; Jover, S.; Quiñones, A.; Forner-Giner, M.Á.; Rodríguez-Gamir, J.; Legaz, F.; Primo-Millo, E.; Iglesias, D.J. Flooding Affects Uptake and Distribution of Carbon and Nitrogen in Citrus Seedlings. J. Plant Physiol. 2012, 169, 1150–1157. [Google Scholar] [CrossRef] [PubMed]
  57. Kreuzwieser, J.; Papadopoulou, E.; Rennenberg, H. Interaction of Flooding with Carbon Metabolism of Forest Trees. Plant Biol. 2004, 6, 299–306. [Google Scholar] [CrossRef]
  58. Zheng, H.; Zhang, X.; Ma, W.; Song, J.; Rahman, S.U.; Wang, J.; Zhang, Y. Morphological and Physiological Responses to Cyclic Drought in Two Contrasting Genotypes of Catalpa bungei. Environ. Exp. Bot. 2017, 138, 77–87. [Google Scholar] [CrossRef]
  59. Xue, B.; Zhang, A.; Jiang, M. Involvement of Polyamine Oxidase in Abscisic Acid-induced Cytosolic Antioxidant Defense in Leaves of Maize. J. Integr. Plant Biol. 2009, 51, 225–234. [Google Scholar] [CrossRef]
  60. Peleg, Z.; Blumwald, E. Hormone Balance and Abiotic Stress Tolerance in Crop Plants. Curr. Opin. Plant Biol. 2011, 14, 290–295. [Google Scholar] [CrossRef]
  61. Shi, W.; Li, H.; Liu, T.; Polle, A.; Peng, C.; Luo, Z. Exogenous Abscisic Acid Alleviates Zinc Uptake and Accumulation in P. Opulus × Canescens Exposed to Excess Zinc. Plant Cell Environ. 2015, 38, 207–223. [Google Scholar] [CrossRef]
  62. Zhang, S.; Yang, C.; Chen, M.; Chen, J.; Pan, Y.; Chen, Y.; Rahman, S.U.; Fan, J.; Zhang, Y. Influence of Nitrogen Availability on Cd Accumulation and Acclimation Strategy of Populus Leaves under Cd Exposure. Ecotoxicol. Environ. Saf. 2019, 180, 439–448. [Google Scholar] [CrossRef]
  63. Song, J.; Finnegan, P.M.; Liu, W.; Li, X.; Yong, J.W.H.; Xu, J.; Zhang, Q.; Wen, Y.; Qin, K.; Guo, J.; et al. Mechanisms Underlying Enhanced Cd Translocation and Tolerance in Roots of Populus Euramericana in Response to Nitrogen Fertilization. Plant Sci. 2019, 287, 110206. [Google Scholar] [CrossRef]
  64. Zhu, L.; Wen, W.; Thorpe, M.R.; Hocart, C.H.; Song, X. Combining Heat Stress with Pre-Existing Drought Exacerbated the Effects on Chlorophyll Fluorescence Rise Kinetics in Four Contrasting Plant Species. IJMS 2021, 22, 10682. [Google Scholar] [CrossRef]
  65. Carreño, J.; Martínez, A.; Almela, L.; Fernández-López, J.A. Proposal of an Index for the Objective Evaluation of the Colour of Red Table Grapes. Food Res. Int. 1995, 28, 373–377. [Google Scholar] [CrossRef]
  66. Zhang, C.C.; Wang, K.L.; Ren, H.D.; Chang, J.; Yao, X.H. Variation in Pigments in Pecan Testa during Kernel Development and Storage. Food Chem. 2024, 438, 137989. [Google Scholar] [CrossRef]
  67. He, K.; Yang, J.; Huang, L. Physiological Responses of Seedlings of Two Oak Species to Flooding Stress. For. Stud. China 2008, 10, 259–264. [Google Scholar] [CrossRef]
  68. Alvarez, M.; Huygens, D.; Fernandez, C.; Gacitua, Y.; Olivares, E.; Saavedra, I.; Alberdi, M.; Valenzuela, E. Effect of Ectomycorrhizal Colonization and Drought on Reactive Oxygen Species Metabolism of Nothofagus dombeyi Roots. Tree Physiol. 2009, 29, 1047–1057. [Google Scholar] [CrossRef]
  69. Shi, H.; Ma, W.; Song, J.; Lu, M.; Rahman, S.U.; Bui, T.T.X.; Vu, D.D.; Zheng, H.; Wang, J.; Zhang, Y. Physiological and Transcriptional Responses of Catalpa bungei to Drought Stress under Sufficient- and Deficient-Nitrogen Conditions. Tree Physiol. 2017, 37, 1457–1468. [Google Scholar] [CrossRef]
  70. Beauchamp, C.; Fridovich, I. Superoxide Dismutase: Improved Assays and an Assay Applicable to Acrylamide Gels. Anal. Biochem. 1971, 44, 276–287. [Google Scholar] [CrossRef]
  71. Misra, H.P.; Fridovich, I. The Role of Superoxide Anion in the Autoxidation of Epinephrine and a Simple Assay for Superoxide Dismutase. J. Biol. Chem. 1972, 247, 3170–3175. [Google Scholar] [CrossRef]
  72. Tyler, D.D. A Protective Function of Superoxide Dismutase during Respiratory Chain Activity. Biochim. Biophys. Acta (BBA)—Bioenerg. 1975, 396, 335–346. [Google Scholar] [CrossRef]
Figure 1. Leaf phenotype and seedling growth under flooding conditions for Q. nuttallii and Q. palustris. (A) Leaf phenotype of Q. nuttallii. (B) Leaf phenotype of Q. palustris. (C) Seedling height growth of Q. nuttallii and Q. palustris. (D) Diameter growth of Q. nuttallii and Q. palustris. The bars show the mean ± SE (n = 3). Mean values with different letters are statistically different at the 5% level.
Plants 13 01658 g001
Figure 2. Leaf color parameters in CIELAB space for Q. nuttallii and Q. palustris before and after flooding treatment. (A) L*, lightness—positive toward white and negative toward black. (B) a*, red–green value—positive toward red and negative toward green. (C) b*, yellow–blue value—positive toward yellow and negative toward blue. (D) a/b, the ratio of red–green value to yellow–blue value. (E) C*, chroma value. (F) ΔE, the overall color difference. Columns with different lowercase letters are statistically different (p < 0.05).
Plants 13 01658 g002
Figure 3. Gas exchange parameters, including Pn, Tr, Gs, Ci, and WUEi, of Q. nuttallii (A,C,E,G,I) and Q. palustris (B,D,F,H,J) seedlings in the treatment days under flooding stress. (A,B) Pn, maximum net photosynthetic rate. (C,D) Tr, transpiration rate. (E,F) Ci, intercellular CO2 concentration. (G,H) Gs, stomatal conductance. (I,J) WUEi, instantaneous water use efficiency. Data are given as means ± SE (n = 3). Columns with different lowercase letters are statistically different (p < 0.05).
Plants 13 01658 g003
Figure 4. Chlorophyll fluorescence parameters including Fv/Fm (A), ABS/CSm (B), DI0/CSm (C), TR0/CSm (D), ET0/CSm (E), and RE0/CSm (F) of Q. nuttallii (left figures) and Q. palustris (right figures) seedlings in the treatment days under flooding stress. Data are given as means ± SD (n = 3). Columns with different lowercase letters are statistically different (p < 0.05).
Plants 13 01658 g004
Figure 5. MDA (A,B), H2O2 (C,D), and soluble sugar (E,F) content in Q. nuttallii (A,C,E) and Q. palustris (B,D,F) seedlings in the treatment days under flooding stress. Data are given as means ± SD (n = 3). Polylines with different lowercase letters are statistically different (p < 0.05). The results of t-test that discerning difference between the two treatments was labelled by ‘*’ (p < 0.05) and ‘**’ (p < 0.01) above the letters.
Plants 13 01658 g005
Figure 6. Content of SOD (A,B), POD (C,D), and ADH (E,F) of Q. nuttallii (A,C,E) and Q. palustris (B,D,F) seedlings in the treatment days under flooding stress. Data are given as means ± SD (n = 3). Polylines with different lowercase letters are statistically different (p < 0.05). The results of t-test that discerning difference between the two treatments was labelled by ‘*’ (p < 0.05) and ‘**’ (p < 0.01) above the letters.
Plants 13 01658 g006
Figure 7. Content of IAA (A,B), GA3 (C,D), ABA (E,F), and JA (G,H) in Q. nuttallii (A,C,E,G) and Q. palustris (B,D,F,H) seedlings in the treatment days under flooding stress. Data are given as means ± SD (n = 3). Polylines with different lowercase letters are statistically different (p < 0.05). The results of t-test that discerning difference between the two treatments was labelled by ‘*’ (p < 0.05) and ‘**’ (p < 0.01) above the letters.
Plants 13 01658 g007
Figure 8. Pearson correlation analysis (A,B) and principal component analysis (C,D) of photosynthetic and physiological parameters of Q. nuttallii (A,C) and Q. palustris (B,D) seedlings in the treatment days under flooding stress on days 0, 20, 40, and 60. The results of the pearson correlation analysis that discerning the difference between the two parameters were labeled by ‘*’ (p < 0.05) and ‘**’ (p < 0.01) above the letters.
Plants 13 01658 g008
Figure 9. The schematic model of the physiological responses of Q. nuttallii and Q. palustris seedlings in different periods under control conditions and flooding stress. (A) The physiological schematic model of Q. nuttallii and Q. palustris under control conditions. (B) The physiological schematic model of Q. nuttallii and Q. palustris under flooding stress. ‘↑’, significantly increased. ‘↓’, significantly decreased. ‘ns’, not significant.
Plants 13 01658 g009
Table 1. The impact of flooding on plant growth and leaf color.
Phenotypic ParametersQ. nuttallii (Day 60)Q. palustris (Day 60)
Height (growth amount)0.32 ↓0.67 ↓
Diameter (growth amount)0.48 ↓0.63 ↓
ΔE1.82 ↑2.71 ↑
L*1.50 ↑1.23 ↑
a*2.00 ↑1.83 ↑
b*1.81 ↑0.94 ns
a/b3.62 ↑1.70 ↑
C*1.53 ↑0.87 ns
Note: ‘↑’, significantly increased. ‘↓’, significantly decreased. ‘ns’, not significant.
Table 2. Means and interaction effects of species and treatment times.
IndexesSpeciesTreatmentTimeSpecies × TreatmentSpecies × TimeTreatment × TimeSpecies × Treatment × Time
1Pn*************
2Gs******NsNs**Ns
3Ci*****Ns***Ns
4Tr******Ns******
5WUEi****Ns********
6Fv/Fm**************
7ABS/CSmNs************
8DI0/CSm*************
9TR0/CSm********Ns****
10ET0/CSm********Ns****
11RE0/CSm******Ns***Ns
12MDA**************
13H2O2**************
14Soluble sugar******Ns**Ns
15SOD*************
16POD*************
17ADH******Ns******
18IAANs***********
19GA3******Ns******
20ABA******Ns******
21JANs************
Note: ‘*’, significant difference (p < 0.05). ‘**’, significant difference (p < 0.01). ‘Ns’, not significant.
Table 3. The impact of flooding on gas exchange and chlorophyll fluorescence parameters.
Photosynthetic IndexesQ. nuttalliiQ. palustris
20 d40 d60 d20 d40 d60 d
Pn0.48 ↓0.23 ↓0.09 ↓0.52 ↓0.55 ↓0.21 ↓
Gs0.71 ↓0.38 ↓0.31 ↓0.56 ↓0.34 ↓0.24 ↓
Ci1.11 ↑1.13 ↑1.20 ↑0.94 ns1.13 ns1.18 ↑
Tr0.76 ↓0.55 ↓0.49 ↓0.84 ns0.53 ↓0.29 ↓
WUEi0.64 ↓0.40 ↓0.17 ↓0.62 ↓1.05 ns0.71 ns
Fv/Fm0.95 ↓0.73 ↓0.66 ↓1.00 ns0.94 ↓0.88 ↓
ABS/CSm1.07 ns0.80 ↓0.64 ↓0.66 ↓0.58 ↓0.59 ↓
DI0/CSm1.22 ↑1.47 ↑1.63 ↑1.20 ↑1.42 ↑1.38 ↑
TR0/CSm0.93 ns0.46 ↓0.44 ↓1.26 ↑1.09 ns0.93 ns
ET0/CSm0.87 ns0.31 ↓0.30 ↓1.39 ↑0.91 ns0.67 ↓
RE0/CSm0.71 ↓0.74 ↓0.73 ↓1.08 ns0.82 ns0.58 ↓
Note: 5 d, 10 d, 20 d, 30 d, 40 d, 50 d, and 60 d mean the ratio of flooding to control on days 0, 5, 10, 20, 30, 40, 50, and 60. ‘↑’, significantly increased. ‘↓’, significantly decreased. ‘ns’, not significant.
Table 4. The impact of flooding on physiological parameters in Q. nattallii.
Physiological Indexes5 d10 d20 d30 d40 d50 d60 d
MDA0.92 ns1.35 ↑1.52 ↑2.06 ↑2.47 ↑1.97 ↑1.99 ↑
H2O21.16 ↑1.15 ↑1.37 ↑1.42 ↑1.23 ↑1.12 ↑1.12 ↑
Soluble sugar1.11 ns1.11 ns1.06 ns1.38 ↑1.29 ↑1.36 ↑1.11 ns
SOD1.18 ↑1.33 ↑1.18 ↑1.26 ↑1.20 ↑1.26 ↑1.35 ↑
POD1.08 ↑1.20 ↑1.35 ↑1.28 ↑1.42 ↑1.45 ↑1.24 ↑
ADH1.12 ↑1.13 ↑1.39 ↑1.12 ↑1.20 ↑1.48 ↑1.32 ↑
IAA0.90 ↓0.68 ↓0.75 ↓0.64 ↓0.68 ↓0.64 ↓0.58 ↓
GA30.61 ↓0.62 ↓0.90 ↓0.83 ns0.87 ↓0.86 ↓0.93 ns
ABA1.30 ↑1.32 ↑2.34 ↑1.29 ns1.39 ↑1.91 ↑1.97 ↑
JA0.84 ↓0.61 ↓0.66 ↓1.27 ↑1.09 ns1.40 ↑1.35 ↑
Note: 5 d, 10 d, 20 d, 30 d, 40 d, 50 d, and 60 d mean the ratio of flooding to control on days 0, 5, 10, 20, 30, 40, 50, and 60. ‘↑’, significantly increased. ‘↓’, significantly decreased. ‘ns’, not significant.
Table 5. The impact of flooding on physiological parameters in Q. palustris.
Physiological Indexes5 d10 d20 d30 d40 d50 d60 d
MDA1.38 ↑1.24 ↑1.20 ns1.14 ↑1.29 ns1.29 ns1.58 ↑
H2O21.01 ns1.07 ↑1.17 ↑1.11 ↑1.05 ns1.10 ↑1.25 ↑
Soluble sugar1.17 ↑1.04 ns1.05 ns1.17 ↑1.32 ↑0.98 ns1.05 ns
SOD1.18 ↑1.20 ↑1.04 ns1.01 ns1.03 ns1.03 ns1.15 ↑
POD1.04 ns1.00 ns1.05 ns1.26 ↑1.11 ↑1.14 ↑1.12 ↑
ADH1.05 ns1.06 ns1.18 ↑1.18 ↑1.17 ns1.09 ↑1.46 ↑
IAA0.67 ↓0.95 ns0.76 ↓0.62 ↓0.46 ↓0.48 ↓0.48 ↓
GA31.03 ns0.71 ↓0.65 ↓0.62 ↓0.70 ↓0.65 ↓0.74 ns
ABA1.35 ↑1.97 ↑1.53 ↑2.29 ↑1.60 ↑1.40 ↑1.40 ↑
JA0.95 ns1.03 ns1.01 ns1.14 ns1.12 ↑1.41 ↑1.40 ↑
Note: 5 d, 10 d, 20 d, 30 d, 40 d, 50 d, and 60 d mean the ratio of flooding to control on days 0, 5, 10, 20, 30, 40, 50, and 60. ‘↑’, significantly increased. ‘↓’, significantly decreased. ‘ns’, not significant.
Disclaimer/Publisher’s Note: The statements, opinions and data contained in all publications are solely those of the individual author(s) and contributor(s) and not of MDPI and/or the editor(s). MDPI and/or the editor(s) disclaim responsibility for any injury to people or property resulting from any ideas, methods, instructions or products referred to in the content.

