Article

A Quantitative Trait Locus with a Major Effect on Root-Lesion Nematode Resistance in Barley

by
Diane Mather
1,*,
Elysia Vassos
1,
Jason Sheedy
2,
Wenbin Guo
3 and
Alan McKay
4
1
School of Agriculture, Food and Wine, Waite Research Institute, The University of Adelaide, Adelaide, SA 5005, Australia
2
Centre for Crop Health, University of Southern Queensland, Toowoomba, QLD 4350, Australia
3
Information and Computational Sciences, The James Hutton Institute, Dundee DD2 5DA, UK
4
South Australian Research and Development Institute, Adelaide, SA 5001, Australia
*
Author to whom correspondence should be addressed.
Plants 2024, 13(12), 1663; https://doi.org/10.3390/plants13121663
Submission received: 15 April 2024 / Revised: 11 June 2024 / Accepted: 13 June 2024 / Published: 15 June 2024
(This article belongs to the Special Issue Barley Genomics, Genetics, and Breeding)

Abstract

:
Although the root-lesion nematode Pratylenchus thornei is known to affect barley (Hordeum vulgare L.), there have been no reports on the genetic control of P. thornei resistance in barley. In this research, P. thornei resistance was assessed for a panel of 46 barley mapping parents and for two mapping populations (Arapiles/Franklin and Denar/Baudin). With both populations, a highly significant quantitative trait locus (QTL) was mapped at the same position on the long arm of chromosome 7H. Single-nucleotide polymorphisms (SNPs) in this region were anchored to an RGT Planet pan-genome assembly and assayed on the mapping parents and other barley varieties. The results indicate that Arapiles, Denar, RGT Planet and several other varieties likely have the same resistance gene on chromosome 7H. Marker assays reported here could be used to select for P. thornei resistance in barley breeding. Analysis of existing barley pan-genomic and pan-transcriptomic data provided a list of candidate genes along with information on the expression and differential expression of some of those genes in barley root tissue. Further research is required to identify a specific barley gene that affects root-lesion nematode resistance.

Graphical Abstract

1. Introduction

Root-lesion nematodes (Pratylenchus spp.) are polycyclic migratory endoparasites of plant roots. They enter roots from the soil and migrate through root tissues. They can exit from and re-enter roots and deposit eggs both within and outside of roots. They cause damage by feeding on plant cells, mostly within the root cortex. They have broad host ranges [1].
In Australia, Pratylenchus thornei causes serious damage to bread wheat (Triticum aestivum L.) [2] and chickpea (Cicer arietinum L.) [3], particularly in dry conditions and on poor soils [1]. The problem is exacerbated when susceptible host crops are grown consecutively because the number of P. thornei in the soil rise, increasing the inoculum load for the following season’s crop. Genetic variation for P. thornei resistance (ability to suppress nematode multiplication) has been reported for bread wheat [4,5,6,7] and some related species [8,9,10] and for chickpea [11] and some related species [12]. Quantitative trait loci (QTLs) for P. thornei resistance have been mapped in bread wheat [13,14,15,16,17,18] and in chickpea [19].
Pratylenchus thornei can also infect barley (Hordeum vulgare L.). Although barley is generally considered to have moderate resistance [20], grain yield is affected, with losses estimated to cost the Australian barley industry AUD 5 million per year [21]. Resistance ratings of current cultivars in Australia range from MS (moderately susceptible) to RMR (resistant—moderately resistant) [22]. Quantitative trait loci for resistance against some other root-lesion nematodes (P. neglectus and P. penetrans) have been mapped in barley [23,24], but there are no published reports on the genetic control of P. thornei resistance in barley.
The aim of this research was to investigate whether differences in P. thornei resistance in barley could be attributed to one or more QTLs and to develop molecular markers for use in barley breeding. The approach taken involved (1) evaluation of P. thornei resistance in a panel of barley mapping parents; (2) selection of mapping populations based on the panel results; (3) evaluation of P. thornei resistance in the selected mapping populations; (4) QTL analysis using existing linkage maps for the populations; (5) improvement of linkage maps of a chromosome on which a highly significant QTL was detected; (6) anchoring of a QTL region to a genome assembly; and (7) investigation of existing transcriptomic data for predicted genes within a candidate region for the QTL.

2. Results

2.1. Variation for Pratylenchus thornei Resistance in Barley

A panel of 46 barley lines was evaluated for P. thornei resistance using inoculated plants grown for eight weeks in a glasshouse in South Australia. The panel included 32 varieties (24 from Australia, 2 from Canada, 2 from Japan and 1 from each of Germany, the Czech Republic, France and Mexico), 12 breeding lines (4 from Australia, 4 from the USA and 1 from each of Brazil, Canada, Mexico and Uruguay), a selection from a North African landrace and an accession of wild barley (Hordeum vulgare ssp. spontaneum) (Table S1). These lines were chosen because each of them had previously been used as a parent to develop one or more populations for genetic mapping. Best linear unbiased estimates (BLUEs) for the final number of P. thornei nematodes per g of soil and roots (as estimated using a DNA-based method [25,26]) ranged from 4.0 to 13.0 (Table S1). A similar range was observed for eight previously well-characterized wheat (Triticum spp.) varieties that were included as controls (Table S1).

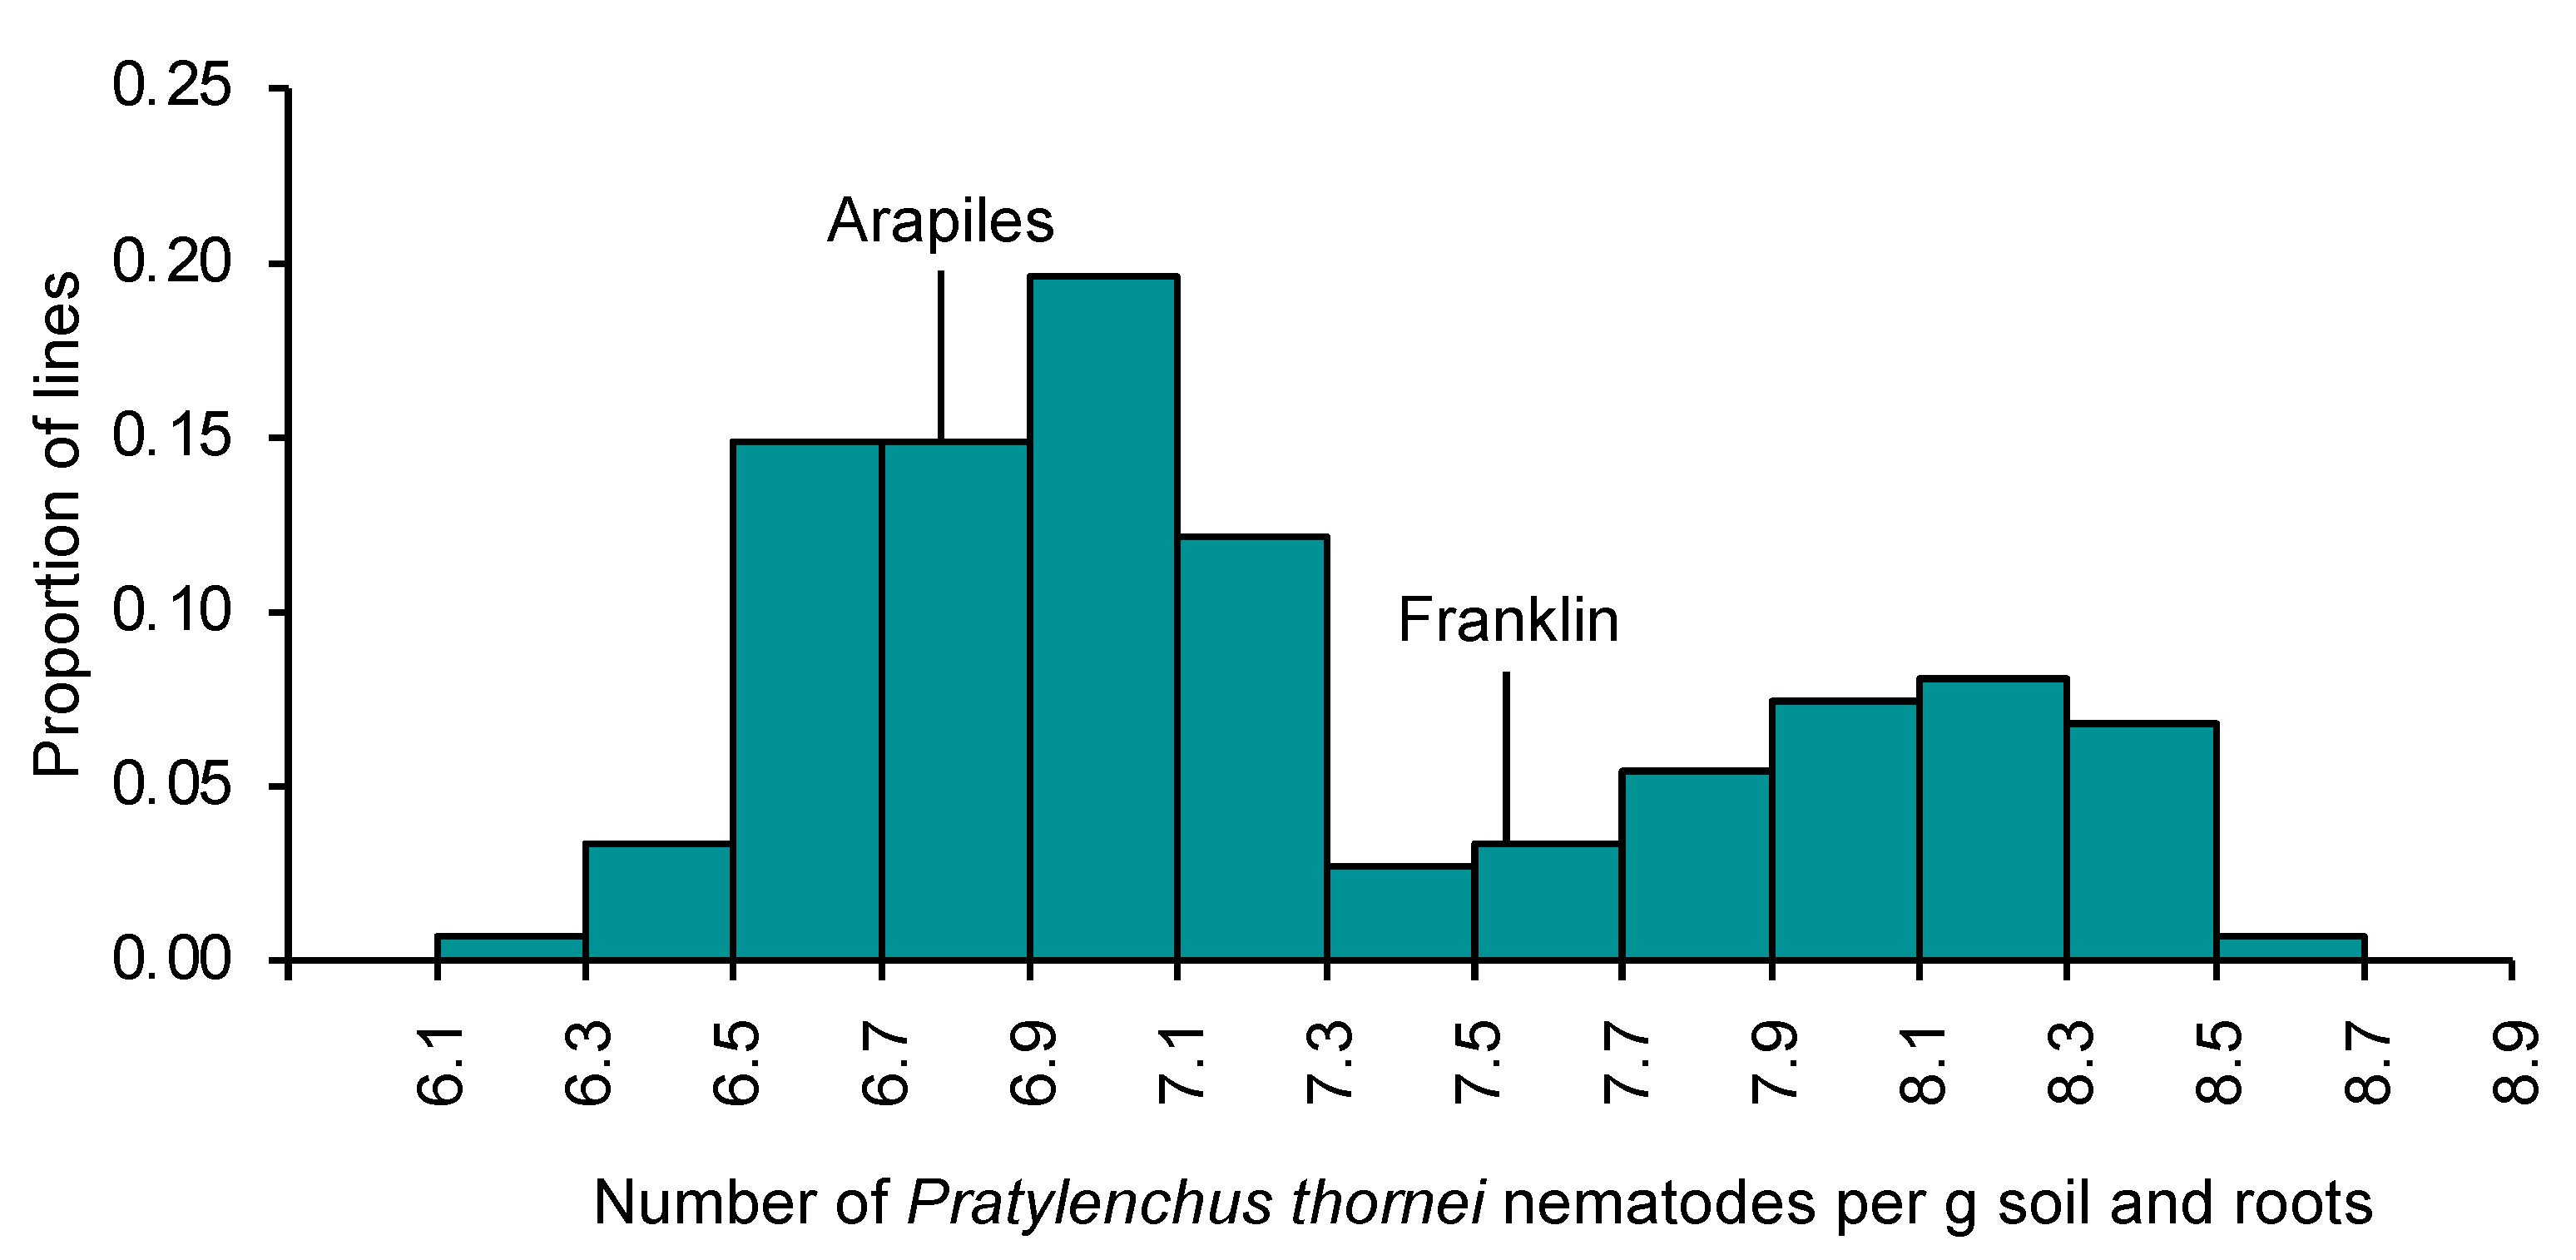
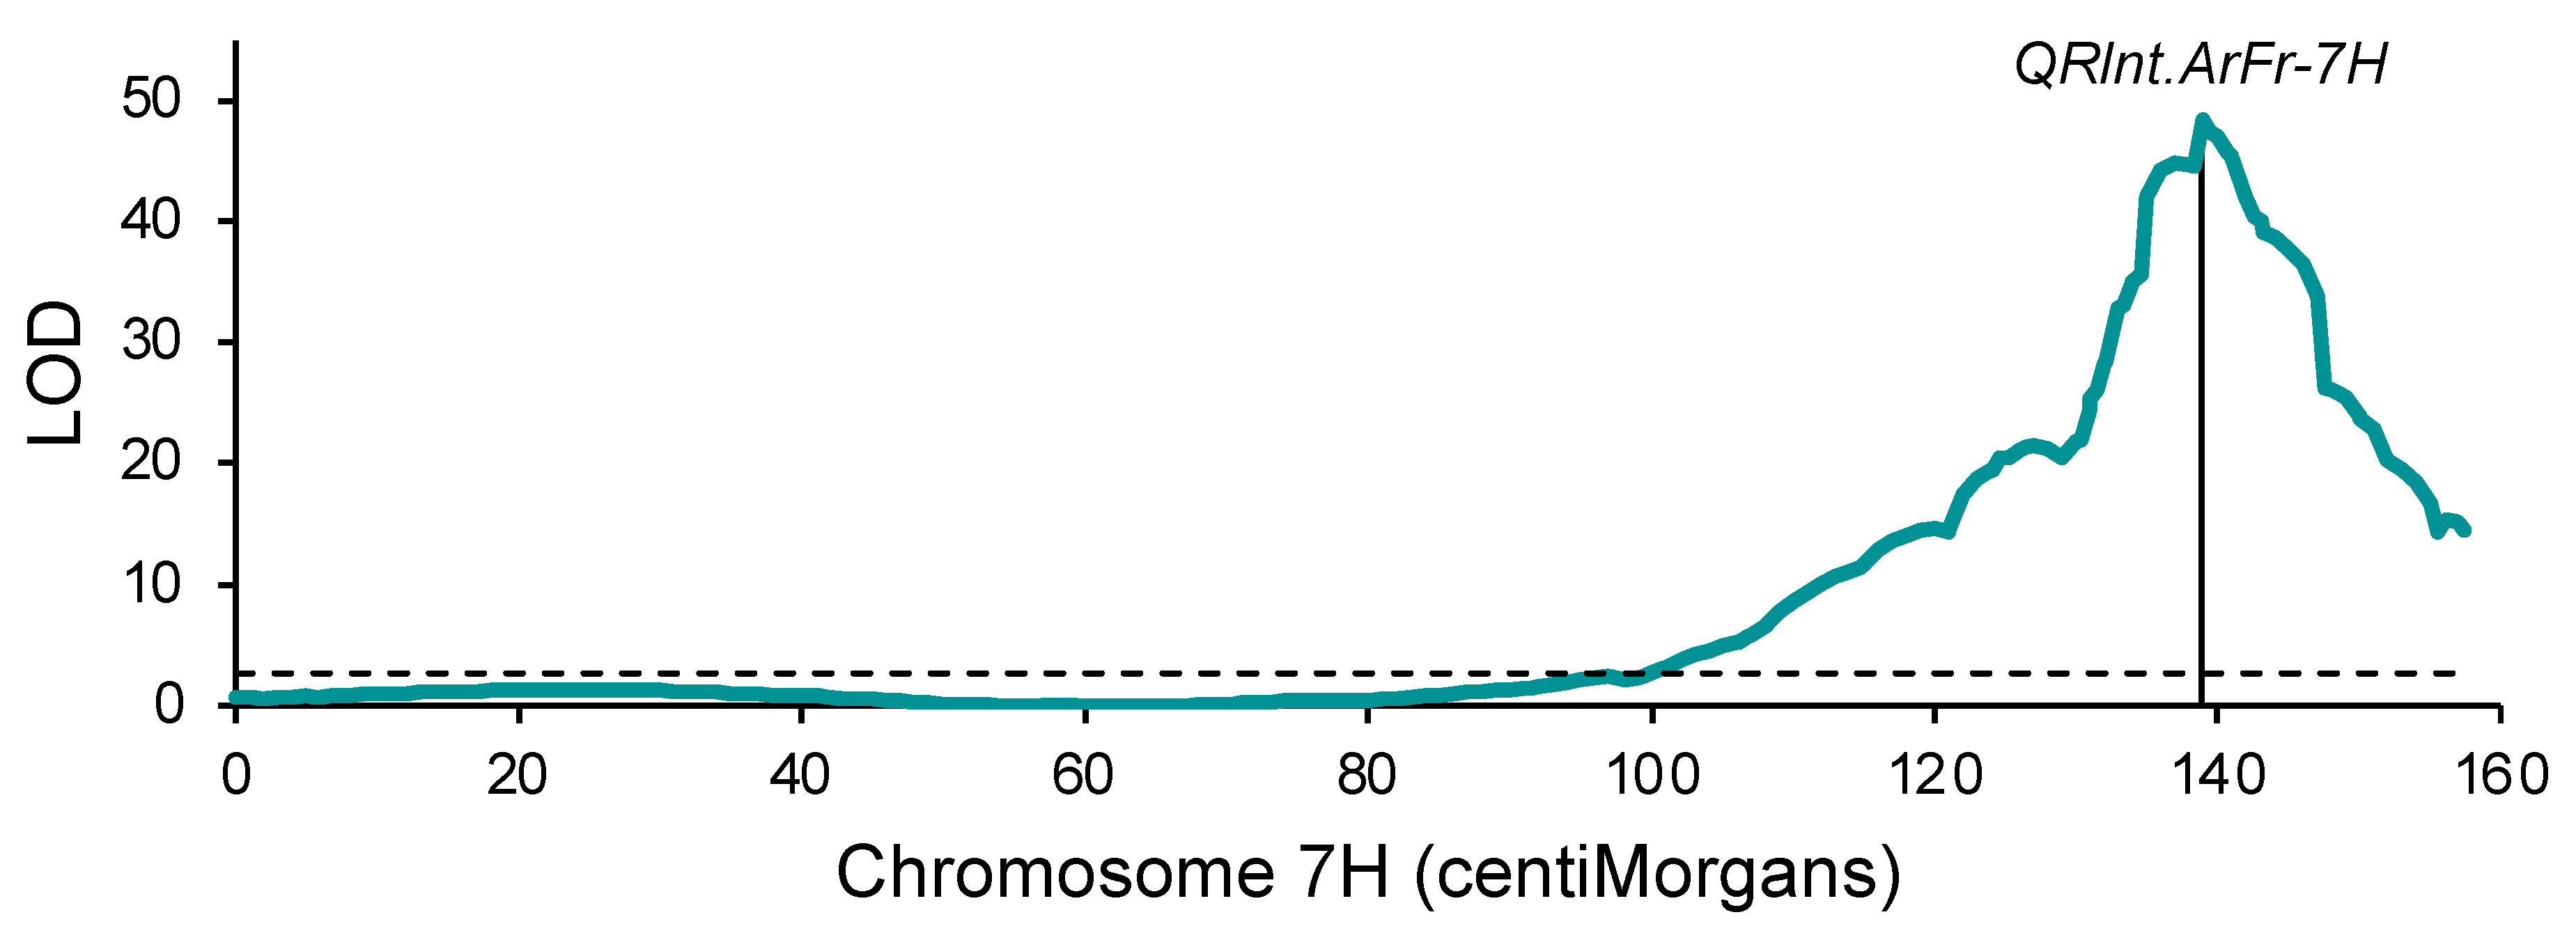
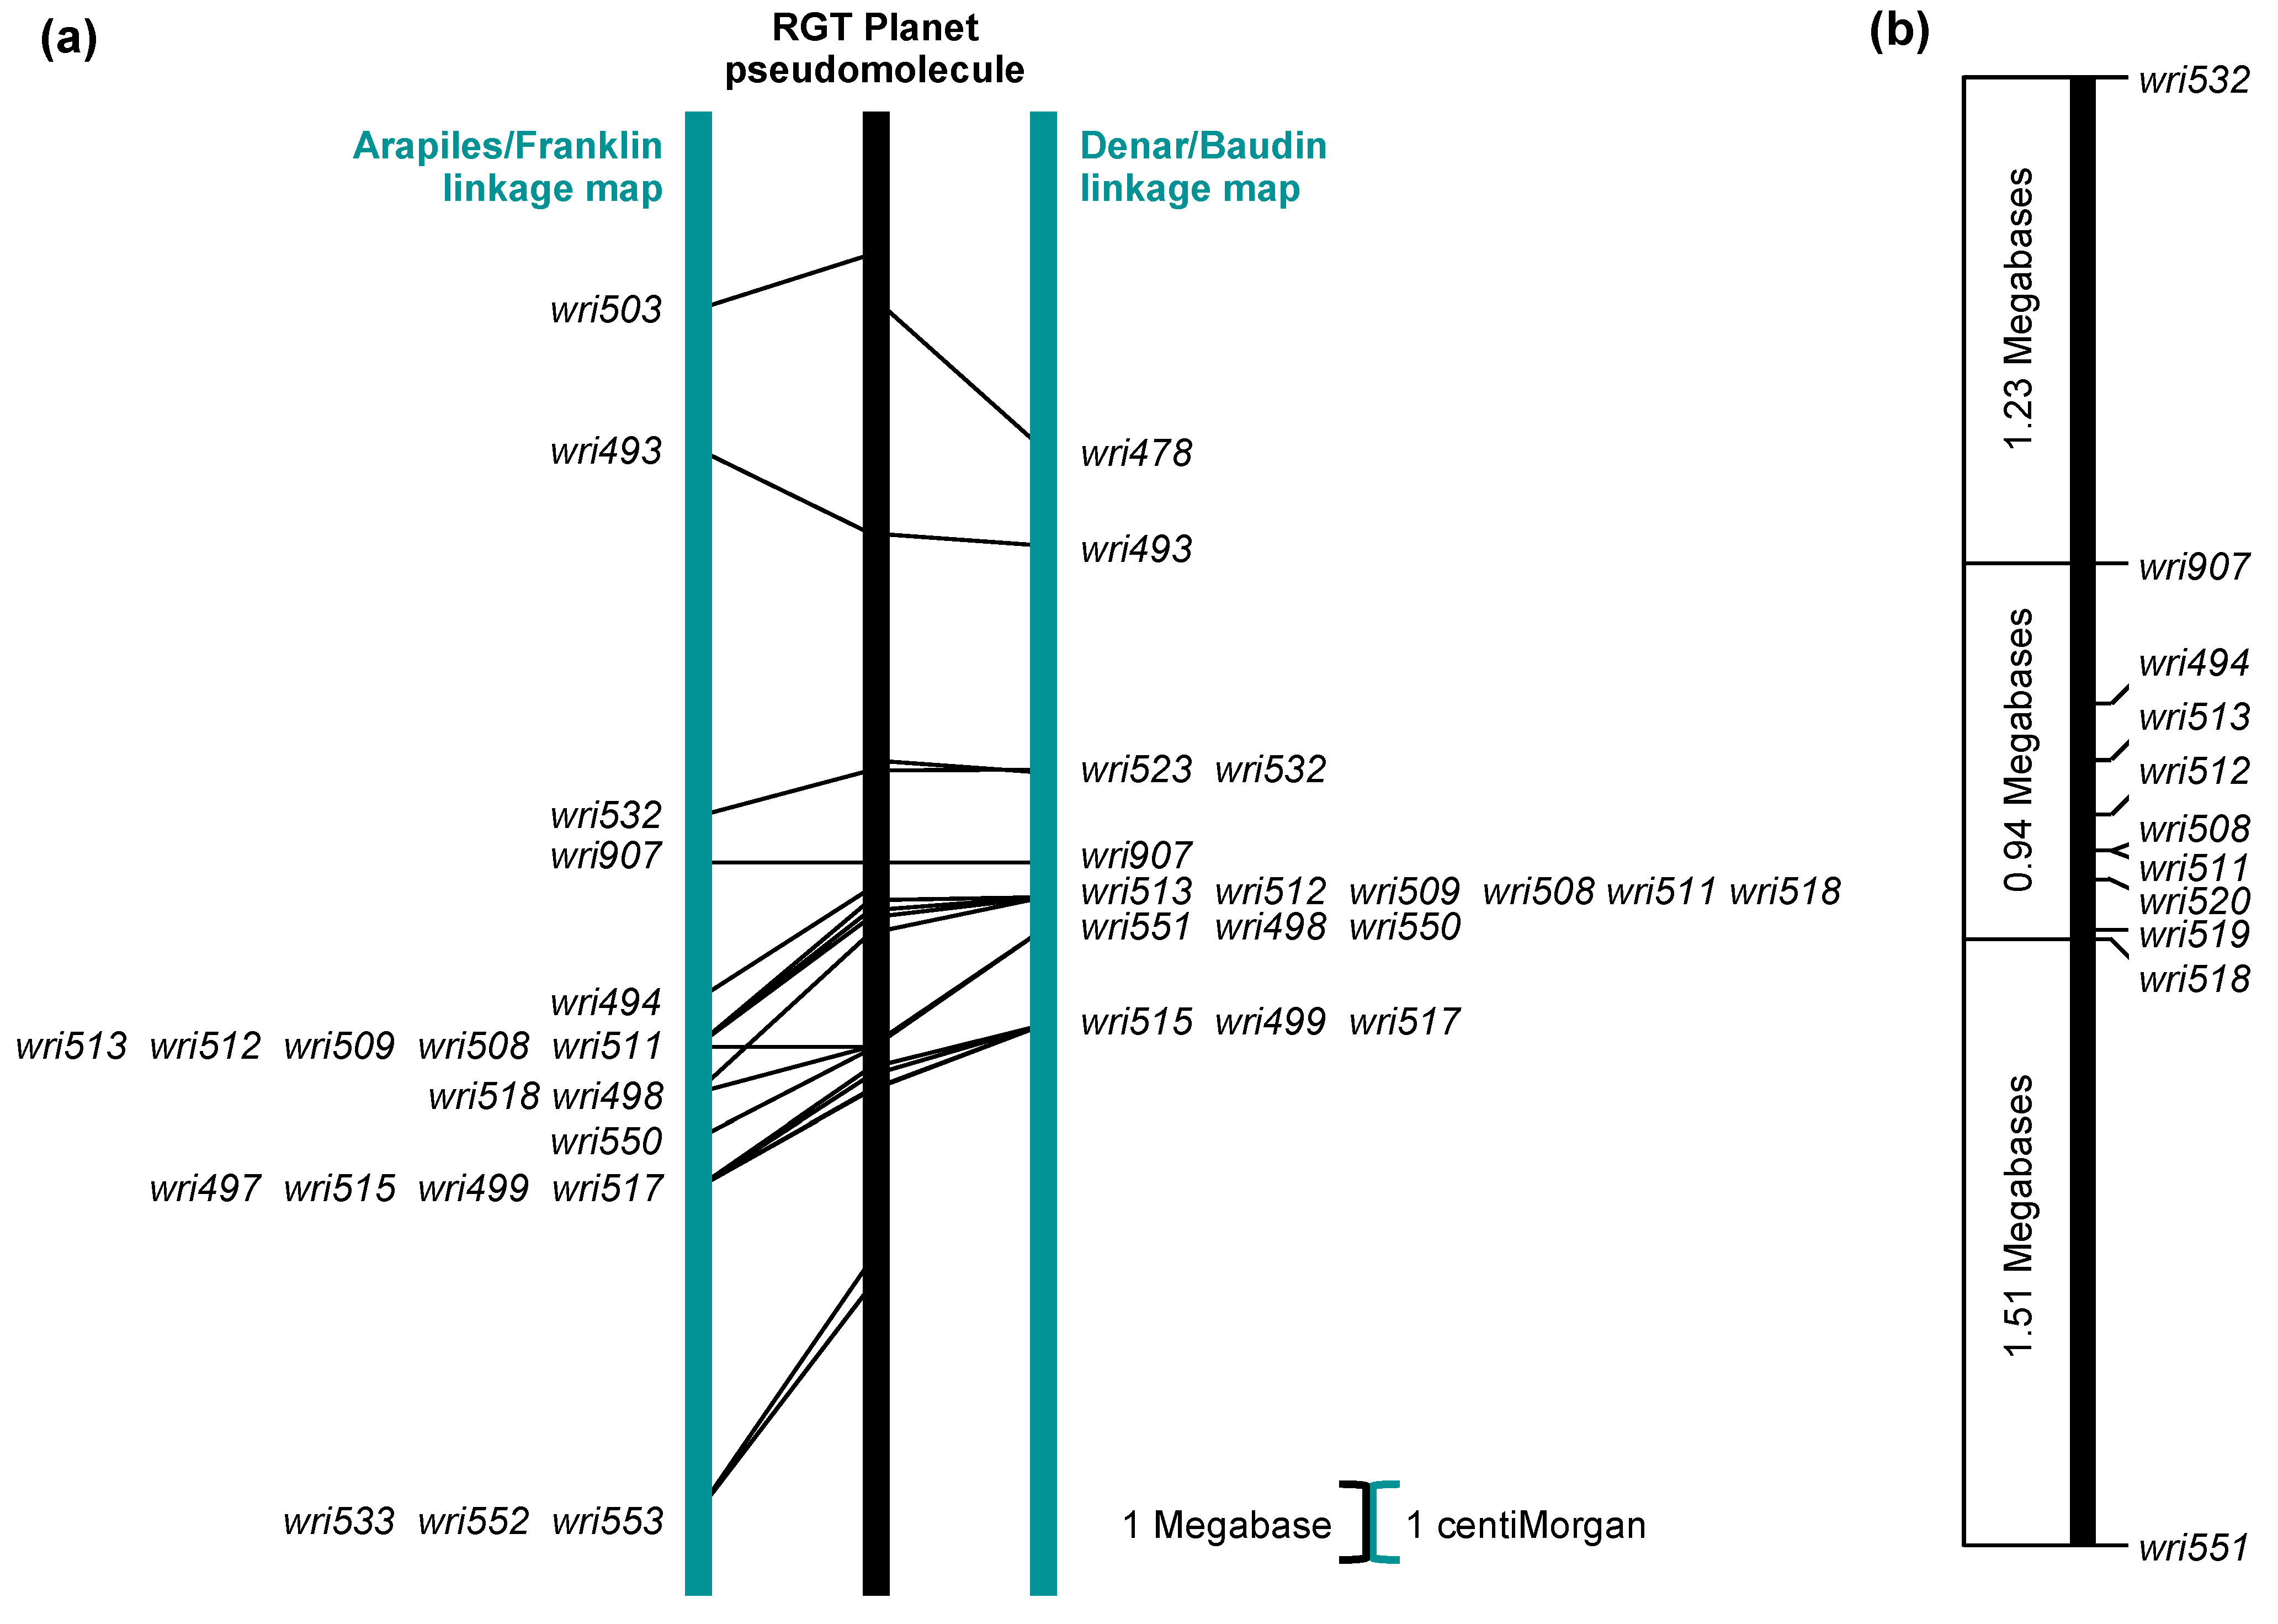
2.2. Genetic Mapping: Arapiles/Franklin

The Arapiles/Franklin population was chosen for further investigation because Arapiles (4.04 P. thornei per g of soil and roots) was more resistant than Franklin (10.50 P. thornei per g of soil and roots). Arapiles/Franklin doubled haploid lines were evaluated for P. thornei resistance using the same methods that had been used for the panel of mapping parents. The phenotypic frequency distribution deviated significantly from normality (Shapiro–Wilk W = 0.92, p < 0.0001) and was bimodal (Figure 1), which could indicate segregation of a major-effect locus.
With QTL analysis using an existing molecular marker map (Table S2) that had been developed to map QTLs for malting quality traits [27], a major QTL (LOD = 36.3) was mapped at 222.0 centiMorgans (cM) on chromosome 7H (Figure S1). At this QTL, the favorable effect (fewer P. thornei) was from Arapiles, the more resistant parent. To further investigate this QTL, single-nucleotide polymorphisms (SNPs) located on chromosome 7H were genotyped on the population using competitive allele-specific polymerase chain reaction (KASP) assays. After removal of data for six lines with numerous apparent recombination events on chromosome 7H (probably indicative of DNA or seed contamination), a new linkage map was constructed for chromosome 7H, with 96 SNP markers over 157.4 cM (Table S3). With QTL analysis using this map, the maximum LOD value (48.4) was at 138.9 cM (Figure 2), the same position as marker wri907. This QTL was designated QRlnt.ArFr-7H.

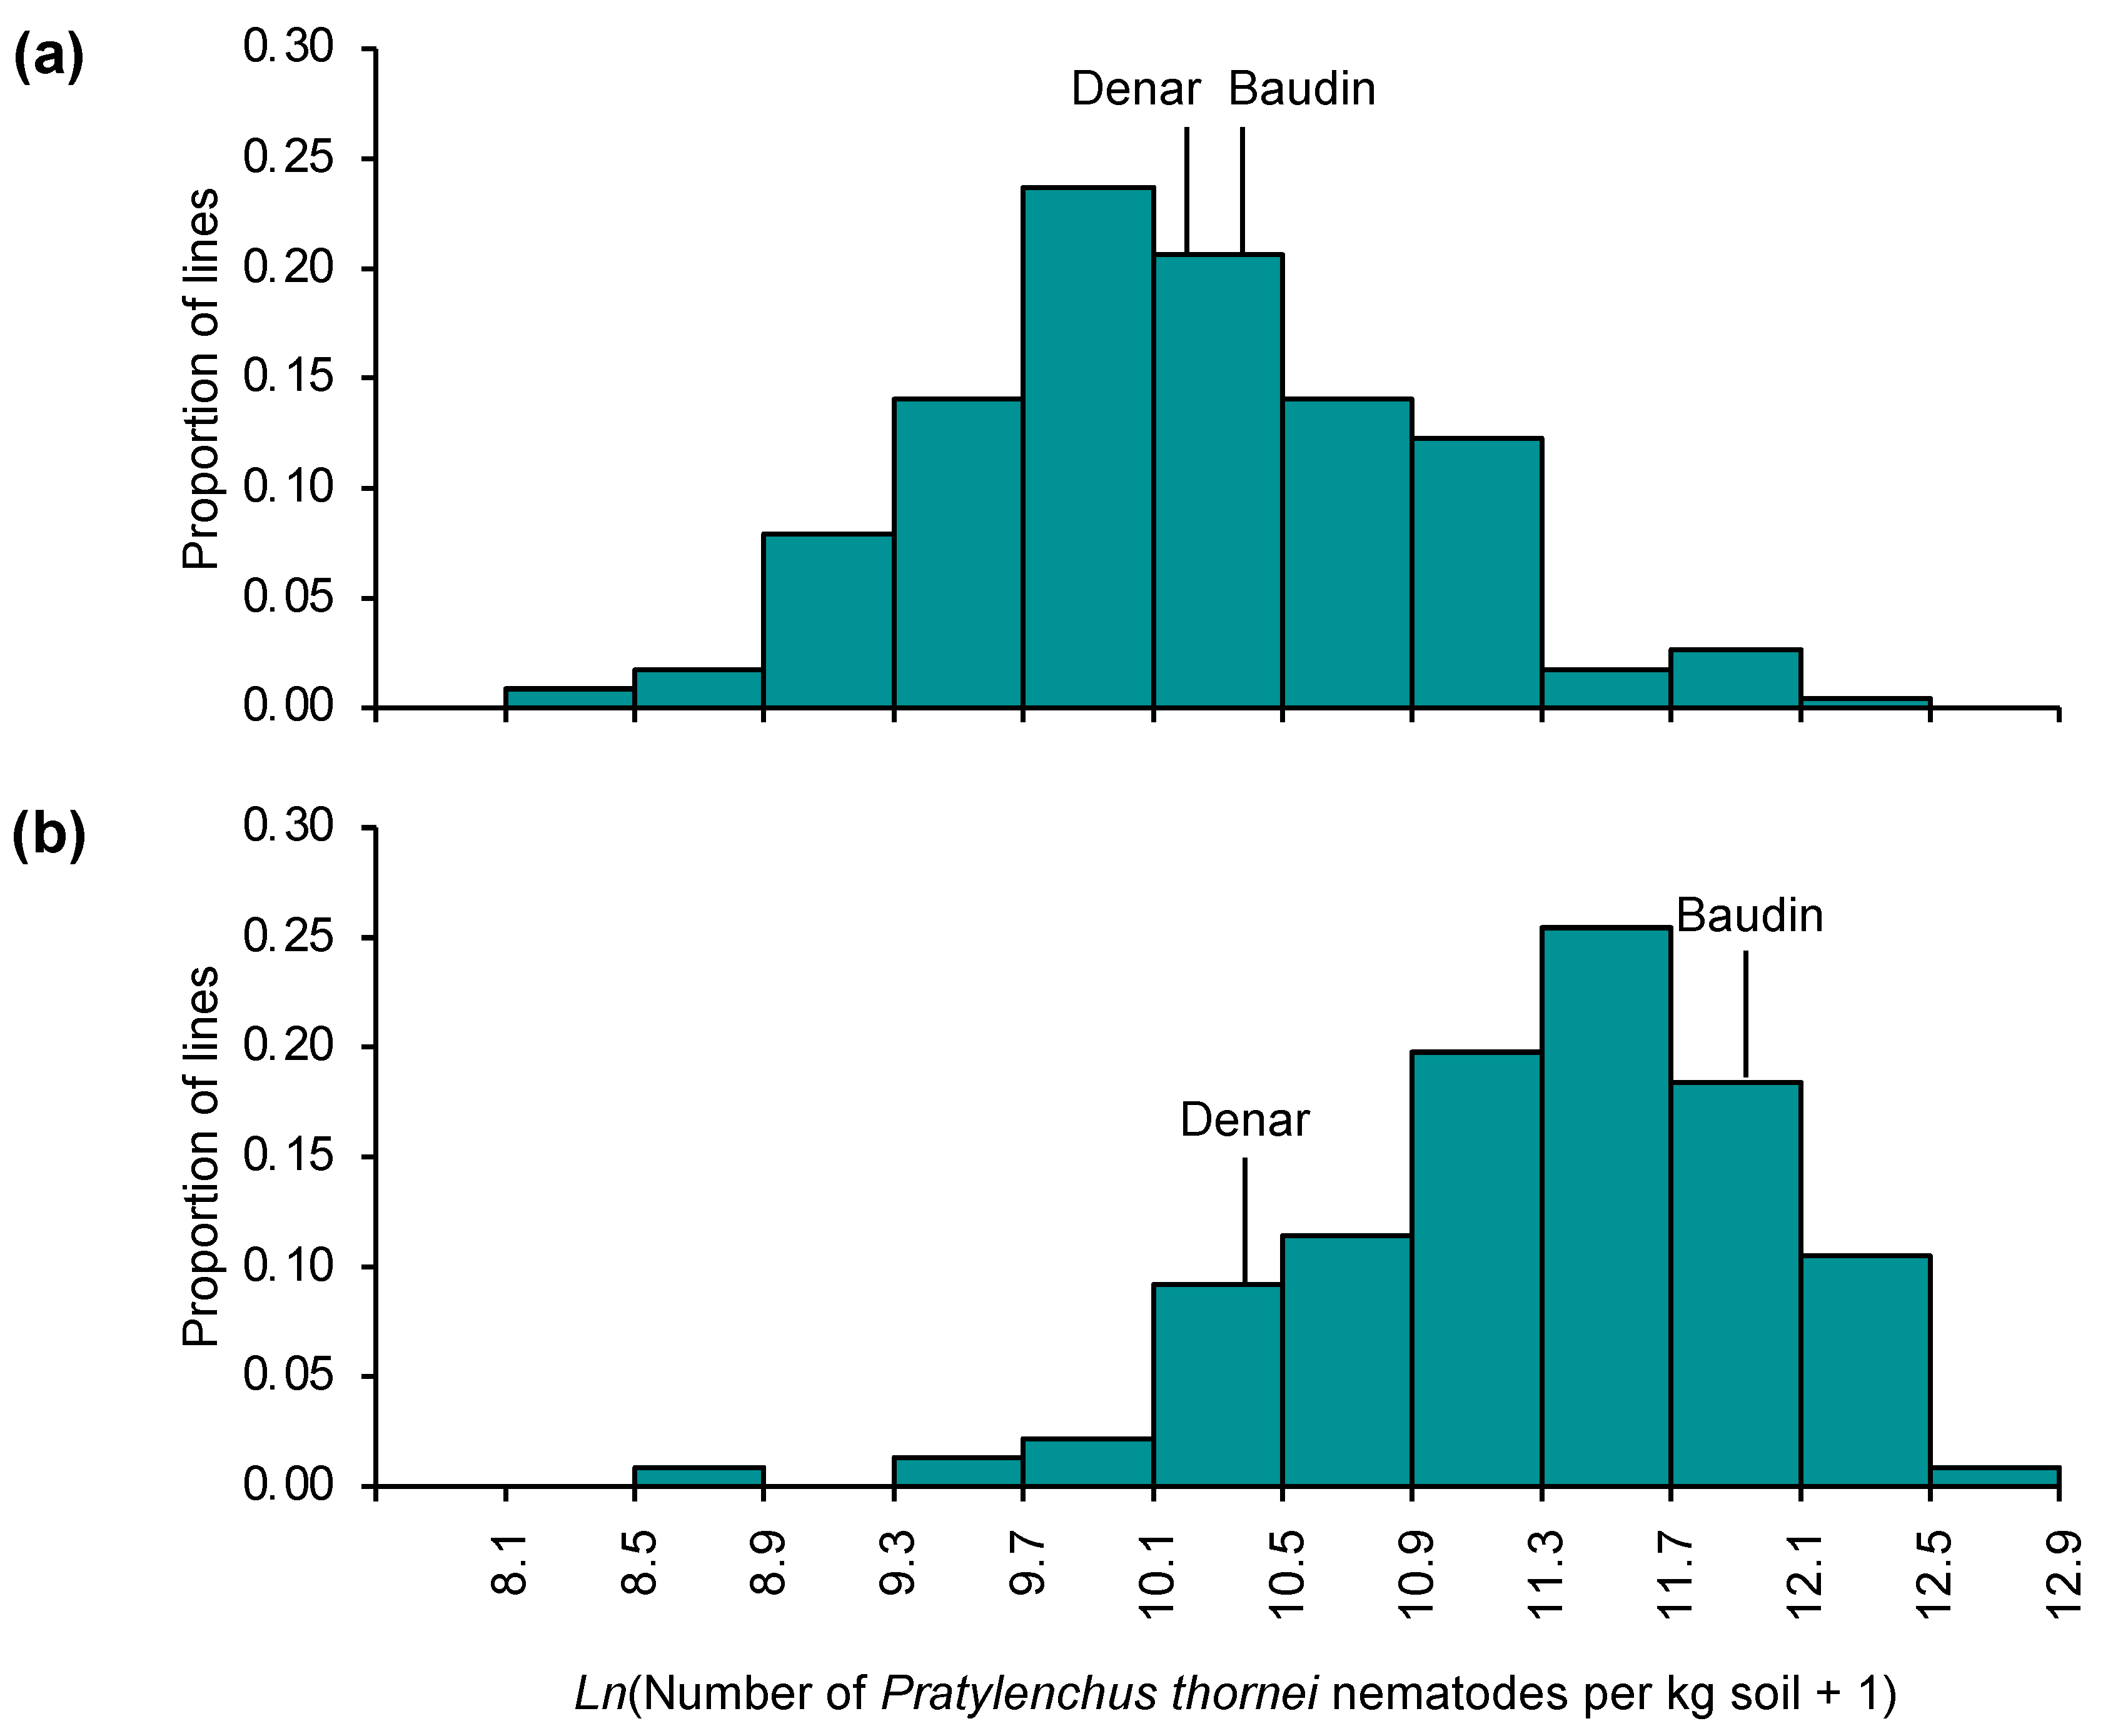
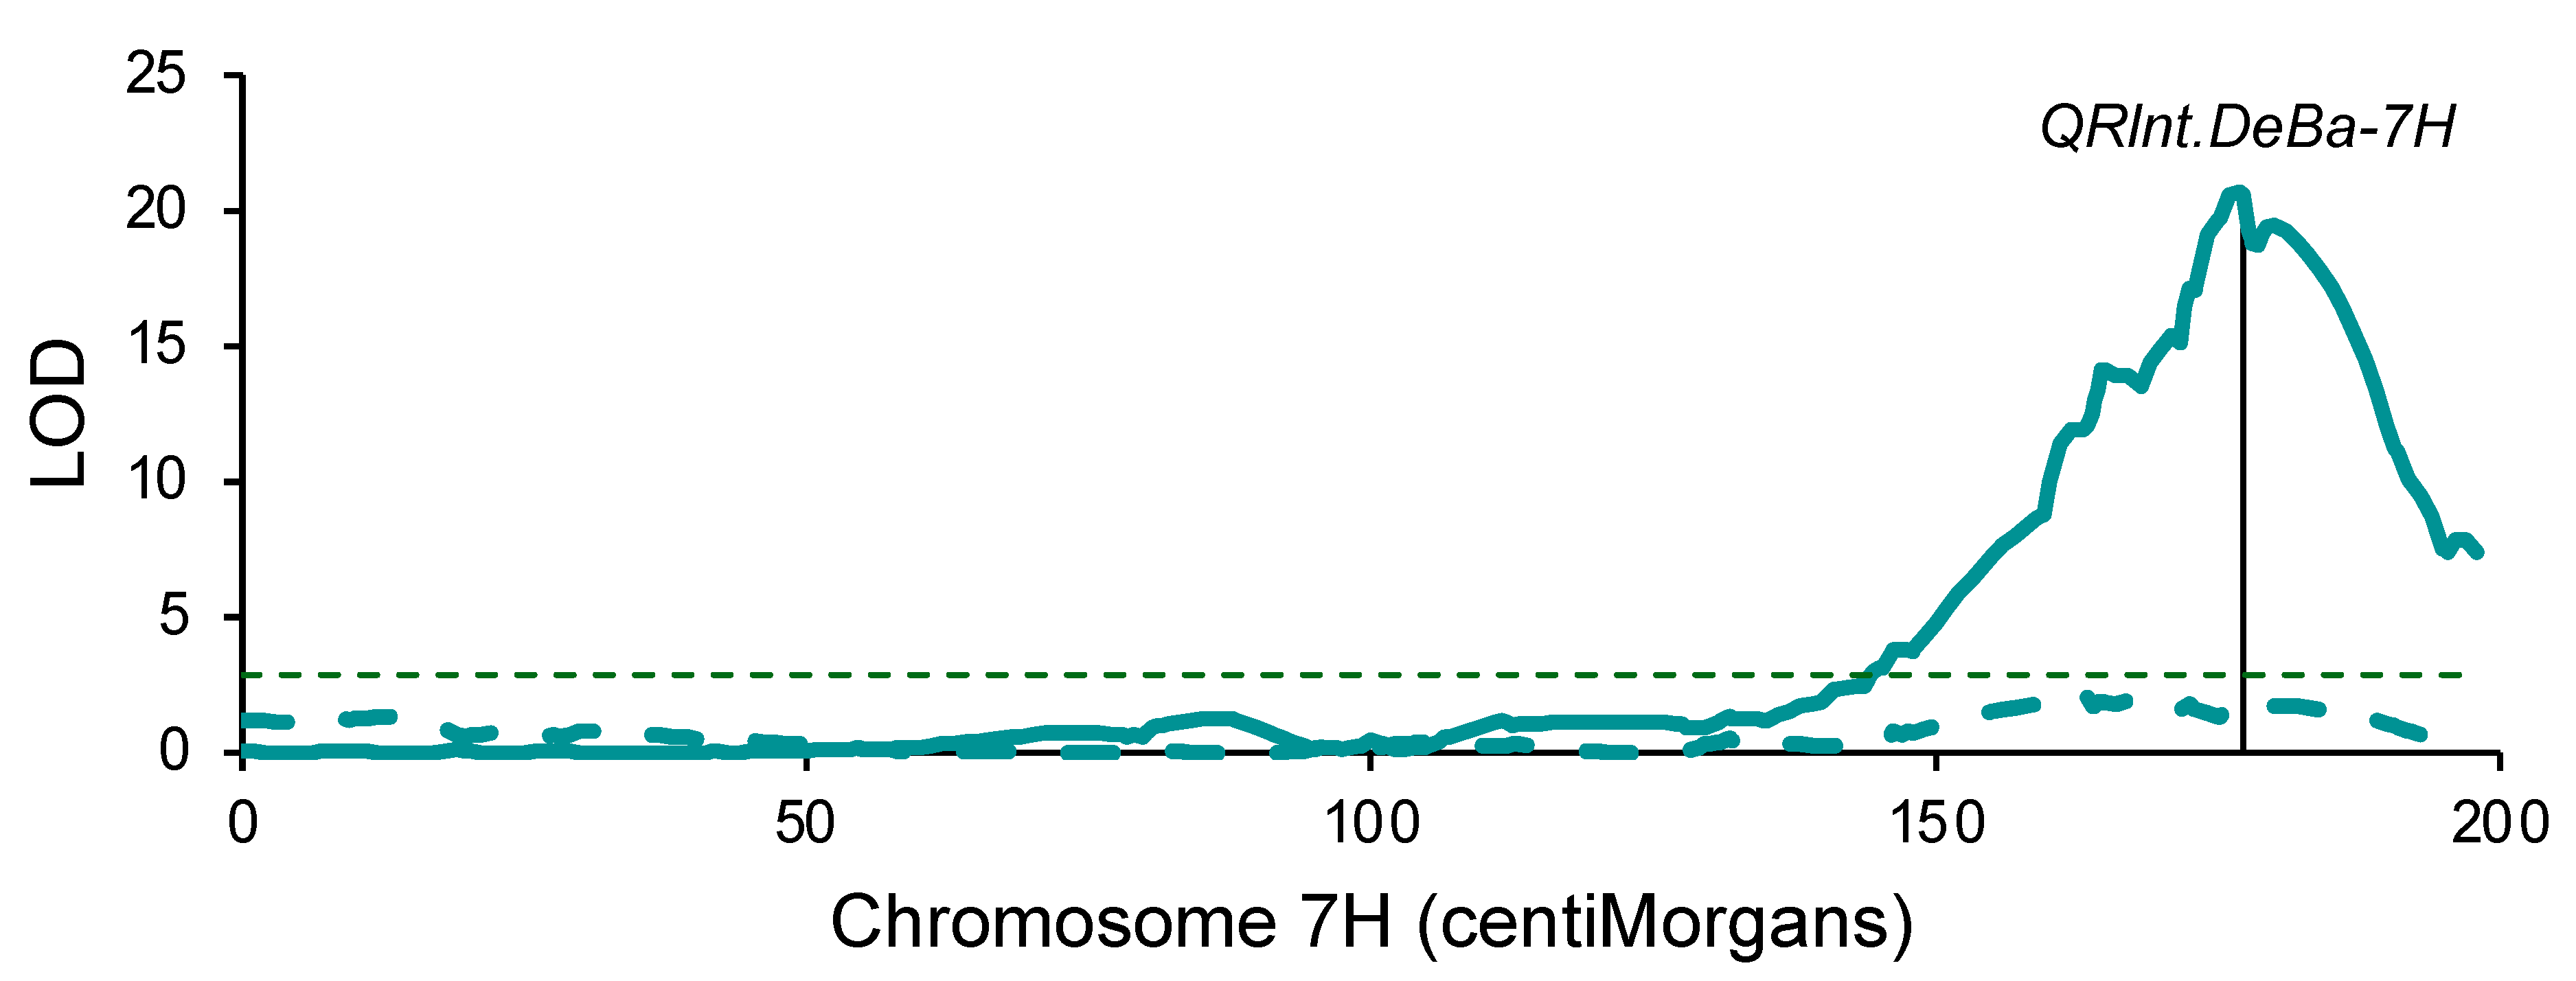
2.3. Genetic Mapping: Denar/Baudin

The Denar/Baudin population was then chosen for QTL mapping because Denar (5.46 P. thornei per g of soil and roots) was more resistant than Baudin (13.00 P. thornei per g of soil and roots). Denar/Baudin doubled haploid lines were evaluated for P. thornei resistance in two 16-week experiments, conducted in successive years in a glasshouse in Queensland. In those experiments, final nematode numbers were determined by counting. In the first experiment, the phenotypic frequency distribution did not deviate significantly from normality (Shapiro–Wilk W = 099, p = 0.5810) (Figure 3a). In the second experiment, nematode numbers were higher than in the first experiment, and their distribution deviated significantly from normality (Shapiro–Wilk W = 0.97, p = 0.0001) (Figure 3b).
With QTL analysis using an existing molecular marker map (Table S4) that had been developed to map QTLs for powdery mildew resistance [28] and phenotypic data from the first Denar/Baudin experiment, a major QTL (LOD = 20.6) was mapped at 166.0 cM on chromosome 7H (Figure S2). Two other QTLs were detected, one at 195.1 cM on chromosome 1H (LOD = 3.9) and one at 144.0 cM on chromosome 3H (LOD = 5.9), both with favorable effects from Baudin. Using phenotypic data from the second Denar/Baudin experiment, the only significant QTL was at 115.0 cM on chromosome 3H (LOD = 3.1): 29.0 cM from the QTL detected based on the first experiment. On chromosome 7H, the highest test statistic was at 166.1 cM, but this was not statistically significant (LOD = 1.9).
With KASP genotyping of SNPs and curation of the existing marker data, the Denar/Baudin map of chromosome 7H was revised to include a total of 120 markers over 197.9 cM (Table S5). Using the revised map, along with phenotypic data from the first Denar/Baudin experiment, a significant QTL (LOD = 20.7) was mapped at 177.0 cM, 0.2 cM proximal to marker wri907 (Figure 4). This QTL was designated QRlnt.DeBa-7H. Using phenotypic data from the second experiment, there was no significant QTL on chromosome 7H (Figure 4).

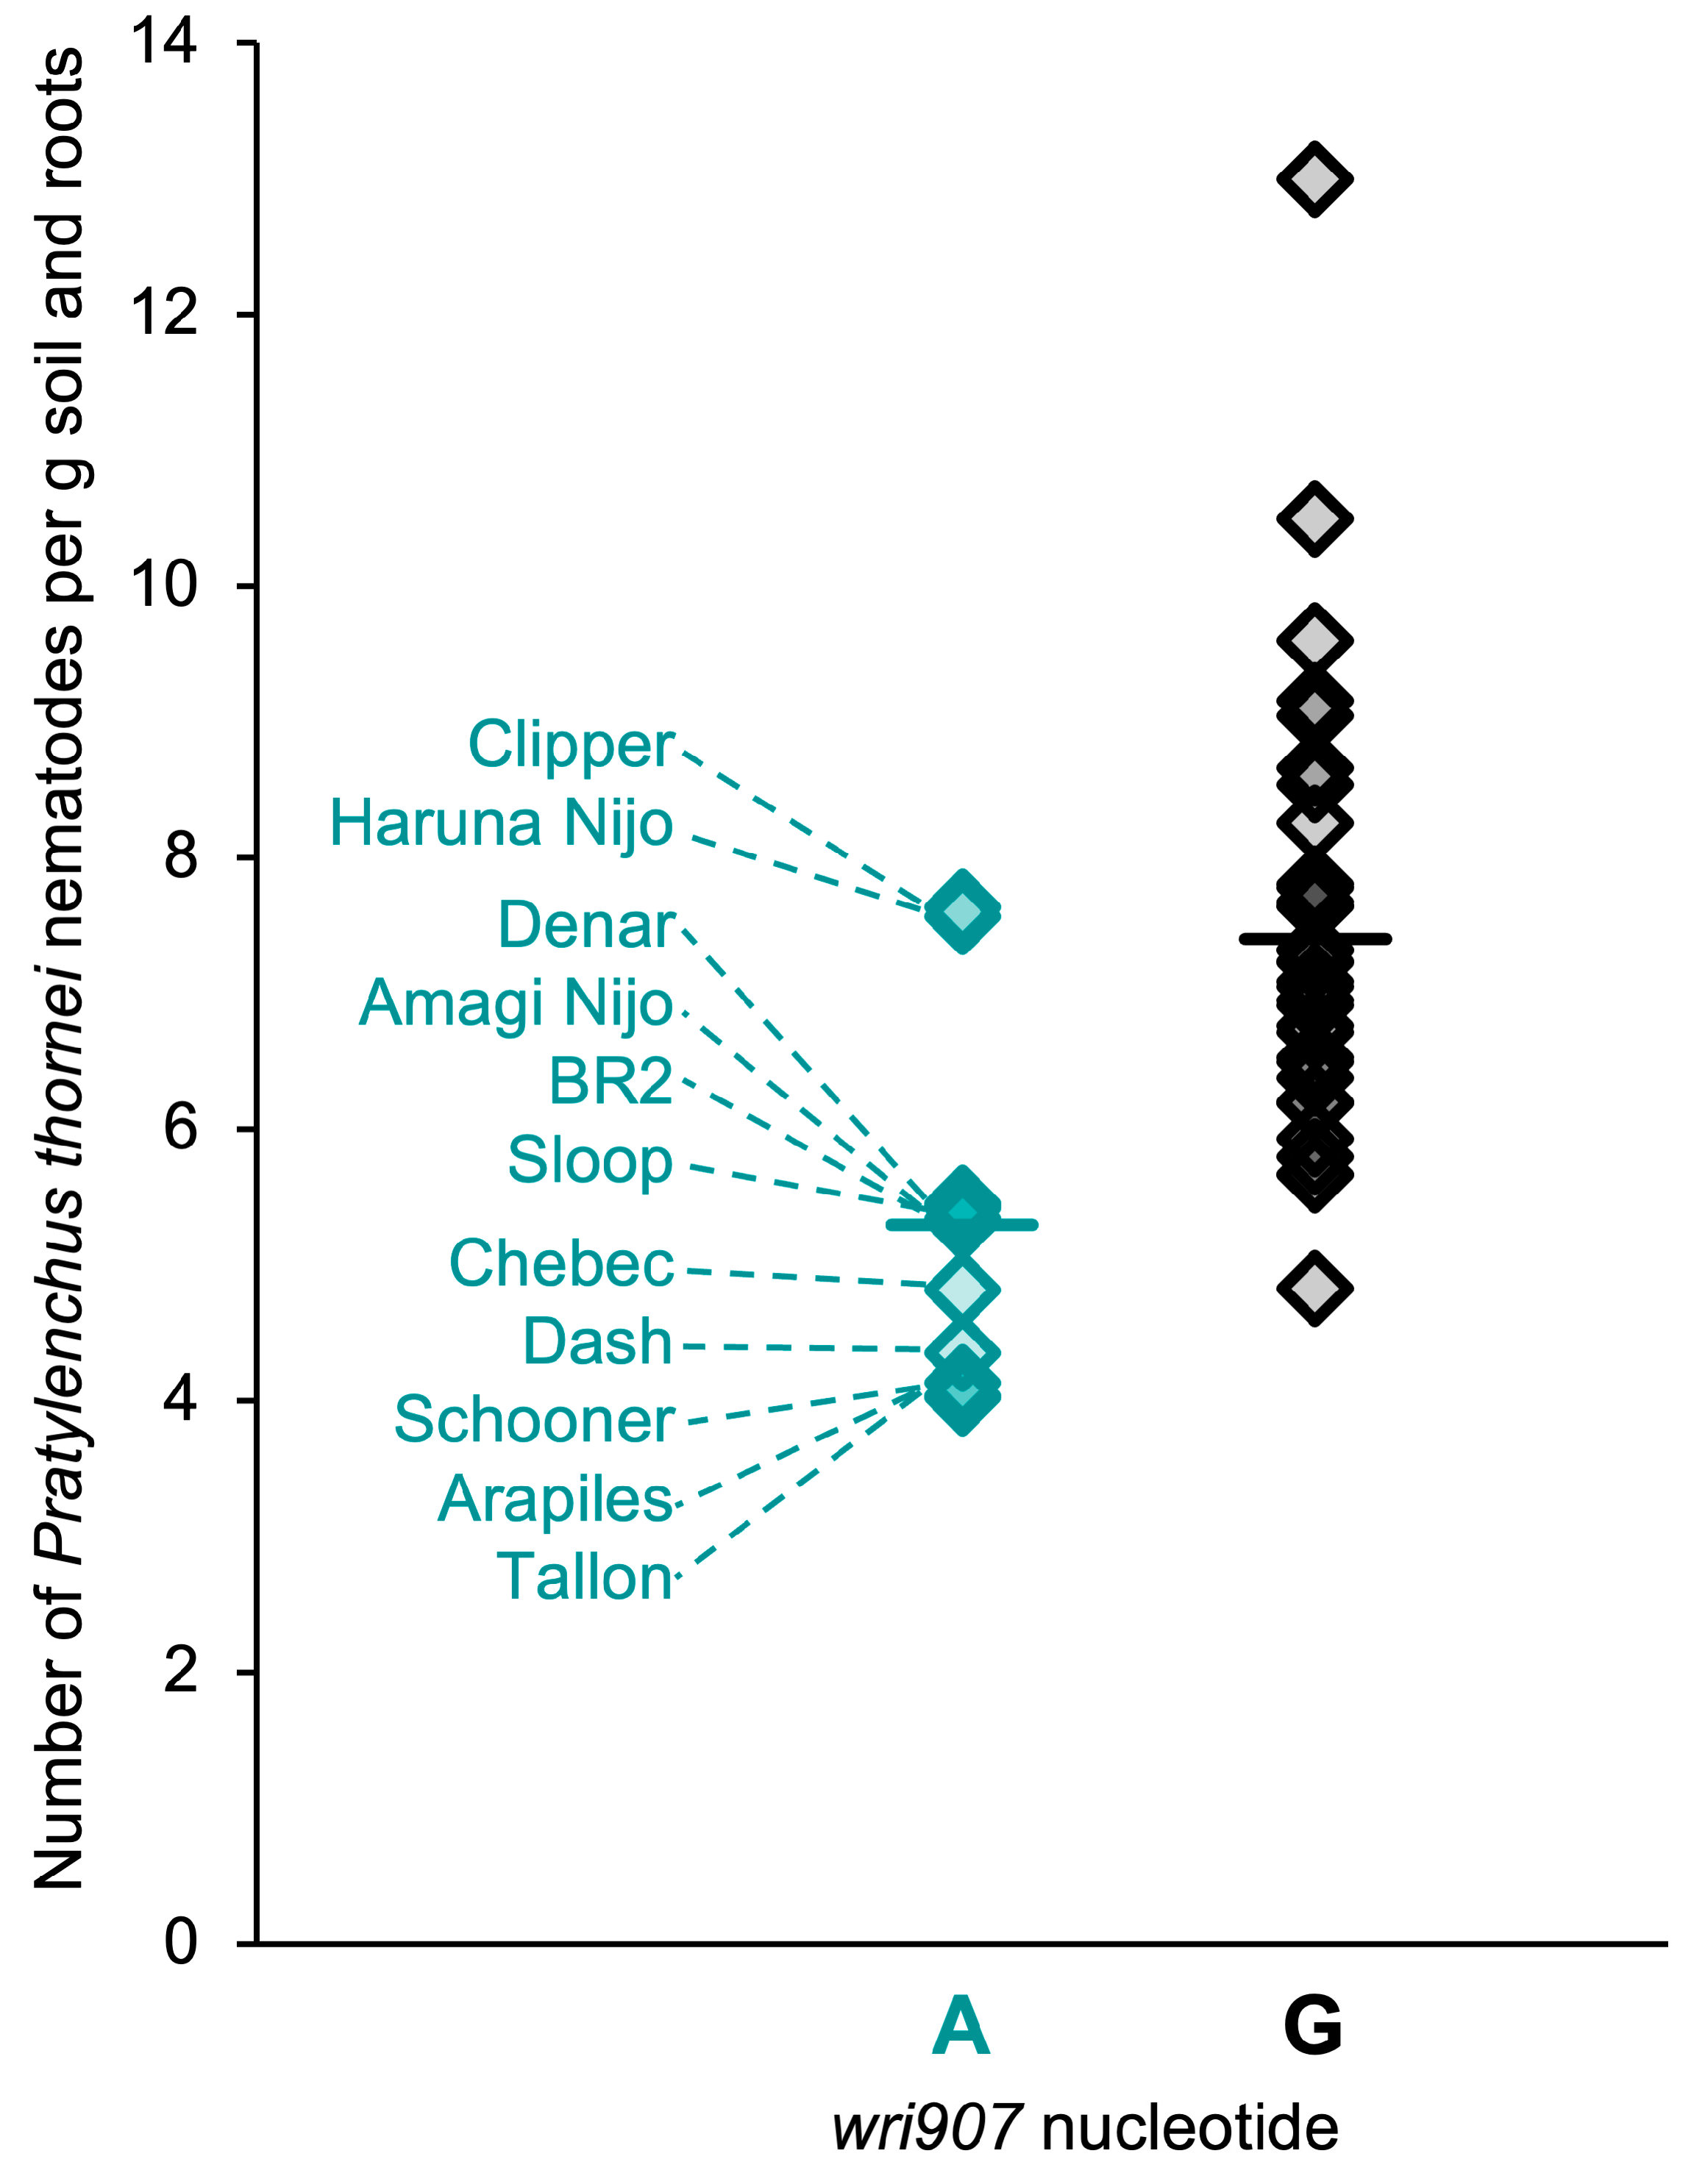
2.4. SNP Genotypes, Physical Positions and Haplotypes

Of the 46 mapping parents, 11 (Amagi Nijo, Arapiles, BR2, Chebec, Clipper, Dash, Denar, Schooner, Sloop and Tallon) were found to have the resistance-associated nucleotide (A) at wri907. The mean final number of P. thornei nematodes was significantly lower for these lines than for lines with the alternative nucleotide (G) (Figure 5).
Among 14 other varieties for which P. thornei resistance ratings are available from the Grains Research and Development Corporation [22], 4 (Alestar, Compass, Flinders and RGT Planet) have the resistance-associated nucleotide (A) at wri907. All of these have been rated as moderately resistant [22]. One of them (RGT Planet) has been sequenced in a barley pan-genome project [29]. On the RGT Planet 7H pseudomolecule, the wri907 SNP is at 615,167,850 bp, and 22 other SNPs that were genetically mapped in the QTL region are between 607,064,377 bp (wri503) and 620,825,840 bp (wri553). The genetic and physical orders of these SNPs are highly collinear (Figure 6a).
When 26 SNPs were assayed on the 46 mapping parents and 14 barley varieties, nine of the ten most resistant mapping parents and four of eight moderately resistant varieties were found to have identical genotypes for a series of nine SNPs from wri907 (615,167,850 bp) to wri518 (616,108,881 bp) (Figure 7 and Figure 8a). For those SNPs, the genotypes of 20 barley pan-genome lines were obtained from genome assemblies. Among these lines, only RGT Planet (moderately resistant to P. thornei) and Igri (unknown resistance status) have the resistance-associated haplotype across all nine SNPs (Figure 8b).
Though it seems likely that the causal gene for the QTL is in the 0.94 Mb region between wri907 and wri518, it is possible that it is proximal to wri907 or distal to wri518. To allow for these possibilities, a longer region, including the 0.94 Mb region and its two flanking intervals (Figure 6b), was chosen for further investigation. This region, which spans 3.68 Mb of the RGT Planet 7H pseudomolecule, contains 108 predicted genes (Table S6). Though over half of these have been annotated with descriptions based on sequence similarity, none have proven functions. Of the 108 predicted RGT Planet genes, 56 were matched to predicted genes in the PanBaRT20 linear pan-genome assembly [30]. Though most of these matches were unique, two RGT Planet genes (PLANET_7H01G663800 and PLANET_7H01G664600) were matched with PanBaRT20_7H78697, and two (PLANET_7H01G667900 and PLANET_7H01G668100) were matched with PanBaRT20_7H78730. All but one of the matched PanBaRT20 genes are within a 4.79 Mb region (672.11 to 676.90 Mb) of the PanBaRT20 assembly. The exception is PanBaRT20_7H77511 at 642.40 Mb, which was matched with PLANET_7H01G664900. Examination of barley pan-transcriptomic data [30] revealed that 34 of the 54 matched PanBaRT20 genes expressed at least one transcript per million (TPM) in RGT Planet root tissue (Table 1). For 15 of these genes, expression was significantly higher in RGT Planet than in at least 1 of the other 19 lines (Table 2). For 11 genes, expression was significantly lower in RGT Planet than in at least 1 of the other 19 lines (Table 3).

3. Discussion

3.1. Mapping of a Common Quantitative Trait Locus in Two Barley Populations

Given a lack of prior genetic information on P. thornei resistance in barley, this research started with phenotypic evaluation of a panel of barley lines. To make it possible to proceed to QTL mapping without having to develop new experimental material, the lines chosen for this panel had all previously been used as parents to develop mapping populations. Well-characterized wheat varieties were included as controls, making it possible to see that the range of P. thornei resistance in barley is similar to that in wheat. Based on the panel results, two cross combinations were chosen for further analysis: Arapiles/Franklin and Denar/Baudin. Populations derived from each of these had previously been genotyped for molecular markers, providing genetic linkage maps that have been used to map QTLs for other traits [27,28].

3.2. Mapping of a Common Quantitative Trait Locus in Two Barley Populations

For the Arapiles/Franklin population, genotyping had been performed with older marker types (amplified fragment length polymorphisms (AFLPs) and simple sequence repeats (SSRs)), and the linkage map was quite sparse. Nevertheless, a very significant QTL for P. thornei resistance was detected on chromosome 7H. Genotyping of chromosome 7H SNPs using KASP assays enabled the development of an improved linkage map of chromosome 7H. In contrast to the original map, which has 58 AFLP markers and two SSR markers over 245.1 cM and eight intervals longer than 10 cM, the SNP-based map has 166 markers over 154.7 cM and just two intervals longer than 10 cM. The peak QTL test statistic is higher on the new map (LOD = 48.4 compared to 36.3), perhaps because the SNP genotyping was more accurate and complete than the AFLP and SSR genotyping.
For the Denar/Baudin population, the genetic map of chromosome 7H provided good resolution (126 DArTseq markers over 189.8 cM) for QTL mapping. Revising this map to exclude redundant DArTseq markers and to include SNPs genotyped with KASP assays had little effect on QTL test statistic values but facilitated comparison with the revised Arapiles/Franklin map.
For both QRlnt.ArFr-7H and QRlnt.DeBa-7H (the P. thornei resistance QTLs mapped on the long arm of chromosome 7H in the Arapiles/Franklin and Denar/Baudin populations, respectively), wri907 is the closest marker to the estimated QTL positions. This collocation, in combination with Arapiles and Denar having identical genotypes at 21 consecutive SNP markers in the QTL region, indicates that the same resistance gene is segregating in the two populations. This was not expected, given that the Australian variety Arapiles (pedigree Noyep/Proctor//CI3576/Union/4/Kenia/3/Research/2/Noyep/Proctor/5/Domen) and the Czech variety Denar (pedigree Celechovicky Hanacky/Bavaria) are not known to be related.
The exact collocation of QRlnt.ArFr-7H and QRlnt.DeBa-7H occurred despite different methods having been used to phenotype the two populations. This similarity of results is consistent with a previous report that the standard methods used in southern and northern Australia provide highly correlated results [25,26]. Surprisingly, though, QRlnt.DeBa-7H was statistically significant in only the first of two Denar/Baudin experiments, despite the experiments having been conducted in the same manner. One possible explanation for this could be that environmental conditions in the second year were more favorable for P. thornei, allowing it to largely overcome the resistance conferred by QRlnt.DeBa-7H. Consistent with this interpretation, the final nematode numbers tended to be higher in the second experiment than in the first experiment.

3.3. A Candidate Region and Predicted Genes on a Barley Genome Assembly

RGT Planet, which has been rated as having moderate P. thornei resistance [18] and has a similar haplotype to Arapiles and Denar in the QTL region, may carry the same resistance gene as Arapiles and Denar. RGT Planet was among the materials used in a recent pan-genome sequencing effort [23] that provided genome assemblies for 20 barley lines. With anchoring of QTL-linked SNPs to the RGT Planet 7H pseudomolecule, a 3.68 Mb candidate region was defined for QRlnt.ArFr-7H and QRlnt.DeBa-7H. Within this region, the RGT Planet sequence and the Arapiles/Franklin and Denar/Baudin genetic maps are highly collinear.
Evaluation of the predicted genes within the candidate region provided a list of potential candidate genes. With none of those genes having proven functions, many of those genes not having been annotated with a description, no previously discovered genes for root-lesion nematode resistance in any host plant species and little known about P. thornei resistance mechanisms in barley, there is little basis on which to narrow the list based on gene function. Two genes in the region have descriptions that could indicate a role in plant defense (PLANET_7H1G01G662000 (receptor-like kinase) and PLANET_7H01G668300 (leucine-rich repeat receptor-like protein kinase family protein, putative). It is not known whether resistance against root-lesion nematodes operates in a similar manner to resistance against fungal and bacterial pathogens, but receptor-like kinases have previously been suggested as candidate genes for P. thornei resistance in wheat [18] and chickpea [31] and have been reported to be overexpressed in chickpea after infection by P. thornei [32]. In wheat, it has been shown that resistance acts after the nematodes penetrate roots, indicating that resistance could involve constitutively expressed water-soluble compounds that inhibit egg hatching and the development of juvenile nematodes [33]. Consistent with this, genes encoding enzymes in the biosynthesis of flavonoids and isoflavonoids (isoflavone reductase, flavonoid 3′-hydroxylase, chalcone synthase and phenylalanine ammonia-lyase) have been discussed as candidates for P. thornei resistance QTLs in wheat [18]. However, none of the predicted genes in the RGT Planet candidate region have been annotated as encoding such enzymes.
Mining of existing barley pan-transcriptomic data [30] provided some information on gene expression in root tissue of RGT Planet and 19 other barley lines. Unfortunately, interpretation of expression levels and differential expression is limited by several factors. Firstly, it cannot be assumed that the causal gene is highly expressed in root tissue or that it is differentially expressed between lines that differ in resistance. Secondly, the analysis approach used here could not provide expression data for RGT Planet genes that could not be matched with PanBaRT20 genes. If those genes are truly present in RGT Planet but not in many other barley lines, they could be good candidates for the resistance gene. Thirdly, interpretation of differential expression results is complicated by the fact that RGT Planet is the only one of the 20 pan-genome lines for which there is information on P. thornei resistance. Despite these limitations, genes for which expression in RGT Planet is higher or lower than other lines could be interesting candidates. One such gene is PLANET_7H01G661600, which was annotated as a putative kinase. For that gene, expression was significantly higher in RGT Planet than in 16 of the other 19 lines: all except Igri (which has the same nine-SNP haplotype as RGT Planet), OUN333 and the landrace HOR7552. Other potentially interesting genes in the same interval include PLANET_7H01G660900 and PLANET_7H01G661100 (both with significantly higher expression in RGT Planet than in 11 other lines) and PLANET_7H01G658200 (lysosomal Pro-X carboxypeptidase), for which expression in RGT Planet was significantly lower than that in nine other lines.
Based on the results reported here, it would be unrealistic to propose a short list of candidate genes, but the information presented in Table 1, Table 2, Table 3 and Table S6 could support the formulation of hypotheses for future experimentation. In future research, Igri and other pan-genome lines could be evaluated for resistance to P. thornei. In addition, transcriptomic analysis could be conducted for root tissue sampled from resistant and susceptible materials grown with and without P. thornei. It would be particularly interesting to know whether expression of the putative receptor-like kinase (PLANET_7H01G66200) or the putative leucine-rich repeat receptor-like protein kinase (PLANET_7H01G668300) is up-regulated in response to infection. Alternatively, or in parallel, attempts could be made to genetically narrow the candidate region. This would require generation of new progeny, which could be genotyped to identify new recombinants. Homozygous recombinants could then be phenotyped. Fine mapping of the resistance locus would be facilitated if the trait could be “Mendelised”, allowing for classification of progeny into two resistance categories. Considering the bimodal phenotypic distribution observed for the Arapiles/Franklin population, it might be possible to achieve this, perhaps by increasing replication in the phenotyping protocol.

3.4. Application in Barley Breeding

In breeding materials segregating for the QRlnt.ArFr-7H/QRlnt.DeBa-7H resistance locus, a marker assay such as wri907 could be used to select progeny with the resistance allele. In Australia, P. thornei resistance currently does not rank highly as a breeding objective for barley. Phenotyping for resistance is expensive, and new grain crop varieties are typically not evaluated for root-lesion nematode resistance until just before, or even after, they are released for production. Marker-assisted selection in early generations could provide a cost-effective way to improve or maintain P. thornei resistance in barley. This could help limit losses in barley crops. Further, by reducing P. thornei populations in the soil, the use of resistant barley varieties could benefit subsequent crops in agricultural rotations.

3.5. Alternative Sources of Resistance

Though the results presented here provide strong evidence that an Arapiles/Denar/RGT Planet haplotype in the QRlnt.ArFr-7H/QRlnt.DeBa-7H region is associated with P. thornei resistance, they also show that some moderately resistant barley varieties do not carry this haplotype. This seems to indicate that the QRlnt.ArFr-7H/QRlnt.DeBa-7H region is not the only one conferring P. thornei resistance in barley. Among the materials evaluated here, possible sources of resistance that cannot be attributed to the QRlnt.ArFr-7H/QRlnt.DeBa-7H QTL include the Australian varieties Fairview, Fathom, Rosalind and SakuraStar.

4. Materials and Methods

4.1. Plant Materials

The plant materials used in this research included the following:
(1)
A panel of 46 barley lines (Table S1), each of which had previously been used as a parent to develop one or more mapping populations;
(2)
Eight varieties of bread wheat: Catalina, Chara, EGA Gregory, Estoc, Mace, Machete, Estoc, Naparoo and Yandanooka (Table S1);
(3)
One variety of durum wheat (T. turgidum ssp. durum L.): Tamaroi (Table S1);
(4)
225 doubled haploid lines derived from the F1 generation of a cross between Arapiles and Franklin (Table S2);
(5)
235 doubled haploid lines derived from the F1 generation of a cross between Denar and Baudin (Table S4);
(6)
14 other barley varieties for which P. thornei resistance ratings are available from the Australian Grains Research and Development Corporation [22] (Figure 8).

4.2. Evaluation of Pratylenchus thornei Resistance in South Australia

The 46 barley mapping parents and nine wheat varieties (Table S1) and, subsequently, Arapiles, Franklin and 169 Arapiles/Franklin doubled haploid lines were evaluated for P. thornei resistance using methods similar to those that were previously described [25,26] as being used in South Australia, except that DNA was extracted from soil (including roots) rather than washing soil from the roots and extracting DNA from the roots. Square plastic pots (55 mm wide by 120 mm high) were filled with pasteurized sand. The pots were arranged in purpose-built galvanized steel square (5 × 5) mesh crates and placed in a greenhouse maintained at 20° ± 3 °C. One pre-germinated seed was sown per pot, with lines assigned to pots according to randomized complete block designs, with six complete blocks for the mapping parents and wheat varieties and four complete blocks for the Arapiles/Franklin population.
After seedlings emerged, inoculum was pipetted into two 5 cm deep holes on either side of each seedling, with approximately 1500 nematodes applied per plant. The isolate used (Pt9EP) was originally collected on the Eyre Peninsula, South Australia and had been maintained on carrot callus cultures [34]. One week after inoculation, slow-release fertilizer was added and covered with 1 cm of sand. Crates were placed in ebb-flow trays that were flooded for 4 min every 3 days to a depth of 10 cm using water from a reservoir below each tray.
At eight weeks after inoculation, shoots were removed, and soil (including roots) was removed from each pot and dried at 48 °C. Dried samples were provided to the South Australian Research and Development Institute Molecular Diagnostic Center (https://pir.sa.gov.au/research/services/molecular_diagnostics (accessed on 25 January 2024)) for DNA extraction and application of a Predicta assay [25] to quantify P. thornei DNA. For each of the mapping parents, the Predicta assay was applied to eight aliquots of DNA: two from each of two blocks and one from each of the other four blocks. For each doubled haploid line, the Predicta assay was applied to one DNA aliquot per pot. Measurements were converted to nematode equivalents (per g of soil and roots) using standard curves that had been developed using soil samples to which known numbers of nematodes had been added [25]. BLUEs were calculated for numbers of P. thornei nematodes per g of soil and roots.

4.3. Evaluation of Pratylenchus thornei Resistance in Queensland

Denar, Baudin and the Denar/Baudin doubled haploid lines were evaluated using methods that have previously been described [26] as being used in the Queensland. Two experiments were grown in successive years, each with entries arranged in three randomized complete blocks. Plants were grown in square pots (70 mm wide by 150 mm high), each containing 330 g (oven-dry equivalent) pasteurized vertosolic soil mixed with slow-release fertilizer. Pots containing 80% of the final amount of soil were arranged on greenhouse benches fitted with a bottom-watering system regulated by a float valve set to a water tension of 2 cm. Three seeds of the same line were placed onto the soil surface in each pot.
Inoculum containing approximately 3300 nematodes was pipetted around the seeds. The inoculum originated from 10 specimens collected near Jondaryn, Queensland. After inoculation, the remaining soil was placed over the seed. After emergence, plants were removed as needed to leave one plant per pot, by cutting below the seed (leaving the roots). Soil temperature was maintained at 22 °C by under-bench heating. Maximum air temperature was maintained between 20 and 25 °C by using shade cloth (as required) and evaporative coolers.
After 16 weeks of plant growth, the soil and roots from each pot were thoroughly mixed, and the roots cut into lengths of about 1 cm. Nematodes were extracted from a 150 g subsample at 22 °C for 48 h using the Whitehead tray method [35], and nematodes were collected on a 20 μm sieve. Samples were stored in 30 mL vials at 3 °C. Nematodes extracted from soil and roots were counted once using a 1 mL Hawksley-type nematode counting chamber (Chalex Corporation, Wallowa, OR, USA) under a compound microscope. BLUEs were calculated for ln(x + 1) transformations [36] of numbers of P. thornei nematodes per kg of soil.

4.4. Genetic Mapping, Marker Development and Genotyping

Initial QTL analysis was conducted using existing genotypic data and linkage maps. The Arapiles/Franklin linkage map (Table S2) consisted of SSR markers and AFLP markers [27]. The Denar/Baudin linkage map (Table S4) consisted of SNP and SilicoDArT markers [28].
Quantitative trait locus analysis was conducted by simple interval mapping using the R/qtl package [37] in the R Statistical Computing Environment [38]. Significance of LOD test statistic values was evaluated relative to thresholds obtained using 10,000 permutations and a genome-wide significance level of 0.05.
Following detection of a common QTL on chromosome 7H, SNPs from the QTL region were genotyped on one or both mapping populations, depending on whether they were polymorphic between the parents. In addition, SNPs from other regions of chromosome 7H were genotyped on the Arapiles/Franklin population. The SNPs were genotyped with KASP assays [39] using an automated SNPline system (LGC Biosearch Technologies, Teddington, UK) according to the manufacturer’s instructions. Primer sequences are given in Table S7.
For the Arapiles/Franklin population, a new linkage map was constructed for chromosome 7H using data for SNP markers that had been genotyped with KASP assays. For the Denar/Baudin population, the linkage map of chromosome 7H was revised, using data for SNP markers that had been genotyped with KASP assays in combination with data for DArTseq SNP markers (excluding any for which a KASP assay had been developed and applied) and for DArTseq SilicoDArT markers. Marker loci were ordered, and genetic distances calculated using the MSTmap algorithm [40] as implemented in the R/ASMap package [41]. The resulting maps were examined, and some markers were removed from the datasets. For the Denar/Baudin map, SilicoDArT markers were retained only if they mapped in regions with no SNP markers. For both maps, positions with more than one mapped marker were identified. If the position was in the QTL region, all markers were retained. Elsewhere on the chromosome, only the marker with the most complete data was retained. The remaining data were then re-analyzed to finalize marker orders and map positions.

4.5. Analysis of Pan-Genomic and Pan-Transcriptomic Data

To determine the physical positions of SNPs in a QTL region on the long arm of chromosome 7H, SNP-bearing sequences were BLASTed [42] against version 1 of the RGT Planet barley genome assembly [23] using SequenceServer [43] at GrainGenes [44]. Once a candidate region was defined on the RGT Planet 7H pseudomolecule, information on predicted genes in that region was downloaded from GrainGenes. The sequences of those genes were mapped to a PanBaRT20 linear pan-genome assembly [30] using Minimap2 software [45]. Each RGT Planet gene that overlapped with a PanBaRT20 gene was considered to match that PanBaRT20 gene if the overlap length exceeded 30% of the length of each gene. This filtering threshold corresponds with the 25th percentile of the overlap length distribution.
For each matched gene, gene expression data were extracted from a set of pan-transcriptomic data for RGT Planet and 19 other barley lines. Differential expression analysis was conducted using 3D RNA-seq software [46]. Nineteen contrasts were defined (e.g., Barke vs. RGT Planet, Morex vs. RGT Planet), enabling comparisons of expression in RGT Planet to expression in each of the other 19 lines. For each comparison, a gene was considered to be differentially expressed if its Benjamini–Hochberg-adjusted p value was below 0.05 and the absolute value of the log2 fold-change was greater than or equal to 1.

Supplementary Materials

The following supporting information can be downloaded at https://www.mdpi.com/article/10.3390/plants13121663/s1, Figure S1: Chromosome 7H LOD test statistic scan for Pratylenchus thornei resistance in an Arapiles/Franklin barley mapping population. Genetic positions shown on the horizontal axis are for a linkage map of amplified fragment length polymorphism and simple sequence repeat markers; Figure S2: LOD test statistic scans for barley chromosomes on which significant quantitative trait loci were detected for a Denar/Baudin barley mapping population based on phenotypic data from two experiments and using a previously published linkage map; Table S1: Barley mapping parents and wheat varieties evaluated for Pratylenchus thornei resistance; Table S2: Phenotypic data, genotypic data and a previously published genetic linkage map for an Arapiles/Franklin barley mapping population; Table S3: Phenotypic data for Pratylenchus thornei resistance, genotypic data for single-nucleotide polymorphisms (SNPs) and a genetic linkage map of SNPs on chromosome 7H for an Arapiles/Franklin barley mapping population; Table S4: Phenotypic data for Pratylenchus thornei resistance, genotypic data and a previously published genetic linkage map for a Denar/Baudin barley mapping population; Table S5: Phenotypic data for Pratylenchus thornei resistance, genotypic data and a genetic linkage map of chromosome 7H for a Denar/Baudin barley mapping population; Table S6: Predicted genes within a 3.68 Mb candidate region of the RGT Planet 7H pseudomolecule sequence, showing the PanBaRT20 genes with which they were matched and information on the expression of those PanBaRT20 genes in root tissue of RGT Planet and 19 other barley pan-genome lines; Table S7: Markers assayed using competitive allele-specific polymerase chain reaction (KASP) technology.

Author Contributions

Conceptualization, A.M. and D.M.; formal analysis, D.M., W.G., E.V. and J.S.; investigation, A.M., J.S. and E.V., writing—original draft preparation, D.M.; writing—review and editing, all authors. All authors have read and agreed to the published version of the manuscript.

Funding

This research was funded by the Grains Research and Development Corporation, grant numbers DAS00141, UA00143 and USQ00019 USQ1702-007RTSX.

Data Availability Statement

The original contributions presented in the study are included in the article/Supplementary Materials. Further inquiries can be directed to the corresponding author.

Acknowledgments

The authors thank Stewart Coventry for providing seed of the barley mapping parents, Sue Broughton and Phil Davies for production of doubled haploid lines, Danuta Pounsett, Allan Binney, Rebecca Fox and Jodie Kretschmer for technical assistance, Beverley Gogel for experimental design, Beverley Gogel and Julian Taylor for statistical analysis of phenotypic data, and Robbie Waugh for providing pre-publication access to pan-transcriptomic data.

Conflicts of Interest

The authors declare no conflicts of interest. The Grains Research and Development Corporation approved publication of the results but had no role in the design of the study; in the collection, analyses or interpretation of data; or in the writing of the manuscript.

References

  1. Jones, M.G.K.; Fosu-Nyarko, J. Molecular biology of root lesion nematodes (Pratylenchus spp.) and their interaction with host plants. Ann. Appl. Biol. 2014, 164, 164–181. [Google Scholar] [CrossRef]
  2. Thompson, J.P.; Owen, K.J.; Stirling, G.R.; Bell, M.J. Root-lesion nematodes (Pratylenchus thornei and P. neglectus); a review of recent progress in managing a significant pest of grain crops in northern Australia. Australas. Plant Pathol. 2008, 37, 235–242. [Google Scholar] [CrossRef]
  3. Zwart, R.S.; Thudi, M.; Channale, S.; Manchikatia, P.K.; Varshney, R.K.; Thompson, J.P. Resistance to plant parasitic nematodes in chickpea: Current status and future perspectives. Front. Plant Sci. 2019, 10, 966. [Google Scholar] [CrossRef]
  4. Thompson, J.P.; Brennan, P.S.; Clewett, T.G.; Sheedy, J.G.; Seymour, N.P. Progress in breeding wheat for tolerance and resistance to root-lesion nematode Pratylenchus thornei. Australas. Plant Pathol. 1999, 28, 45–52. [Google Scholar] [CrossRef]
  5. Thompson, J.P.; O’Reilly, M.M.; Clewett, T.G. Resistance to the root-lesion nematode Pratylenchus thornei in wheat landraces and cultivars from the West Asia and North Africa WANA region. Crop Pasture Sci. 2009, 60, 1209–1217. [Google Scholar] [CrossRef]
  6. Sheedy, J.G.; Thompson, J.P. Resistance to the root-lesion nematode Pratylenchus thornei of Iranian landrace wheat. Australas. Plant Pathol. 2009, 38, 478–489. [Google Scholar] [CrossRef]
  7. Thompson, J.P. Resistance to root-lesion nematodes Pratylenchus thornei and P. neglectus in synthetic hexaploid wheats and their durum and Aegilops tauschii parents. Aust. J. Agric. Res. 2008, 59, 432–446. [Google Scholar] [CrossRef]
  8. Thompson, J.P.; Haak, M.I. Resistance to root-lesion nematode Pratylenchus thornei in Aegilops tauschii Coss, the D-genome donor to wheat. Aust. J Agric. Res. 1997, 48, 553–559. [Google Scholar] [CrossRef]
  9. Sheedy, J.G.; Thompson, J.P.; Kelly, A. Diploid and tetraploid progenitors of wheat are valuable sources of resistance to the root-lesion nematode Pratylenchus thornei. Euphytica 2012, 186, 377–391. [Google Scholar] [CrossRef]
  10. Thompson, J.P.; Reen, R.A.; Clewett, T.G.; Sheedy, J.G.; Kelly, A.M.; Gogel, B.J.; Knights, E.J. 2011 Hybridisation of Australian chickpea cultivars with wild Cicer spp. increases resistance to root-lesion nematodes Pratylenchus thornei and P. neglectus. Australas. Plant Pathol. 2011, 40, 601–611. [Google Scholar] [CrossRef]
  11. Rodda, M.S.; Hobson, K.B.; Forknall, C.R.; Daniel, R.P.; Fanning, J.P.; Pounsett, D.D.; Simpfendorfer, S.; Moore, K.J.; Owen, K.J.; Sheedy, J.G.; et al. Highly heritable resistance to root-lesion nematode Pratylenchus thornei in Australian chickpea germplasm observed using an optimised glasshouse method and multi-environment trial analysis. Australas. Plant Pathol. 2016, 45, 309–319. [Google Scholar] [CrossRef]
  12. Reen, R.A.; Mumford, M.H.; Thompson, J.P. Novel sources of resistance to root-lesion nematode Pratylenchus thornei in a new collection of wild Cicer species C. reticulatum and C. echinospermum to improve resistance in cultivated chickpea C. arietinum. Phytopathology 2019, 109, 1270–1279. [Google Scholar] [CrossRef] [PubMed]
  13. Schmidt, A.L.; McIntyre, C.L.; Thompson, J.P.; Seymour, N.P.; Liu, C.J. Quantitative trait loci for root lesion nematode Pratylenchus thornei resistance in Middle-Eastern landraces and their potential for introgression into Australian bread wheat. Austr. J. Agric. Res. 2005, 56, 1059–1068. [Google Scholar] [CrossRef]
  14. Zwart, R.S.; Thompson, J.P.; Godwin, I.D. Identification of quantitative trait loci for resistance to two species of root-lesion nematode Pratylenchus thornei and P. neglectus in wheat. Aust. J. Agric. Res. 2005, 56, 345–352. [Google Scholar] [CrossRef]
  15. Zwart, R.S.; Thompson, J.P.; Milgate, A.W.; Bansal, P.M.; Raman, H.; Bariana, H.S. QTL mapping of multiple foliar disease and root-lesion nematode resistances in wheat. Mol. Breed. 2010, 26, 107–124. [Google Scholar] [CrossRef]
  16. Zwart, R.S.; Thompson, J.P.; Sheedy, J.G.; Nelson, J.C. Mapping quantitative trait loci for resistance to Pratylenchus thornei from synthetic hexaploid wheat in the International Triticeae Mapping Initiative ITMI population. Aust. J. Agric. Res. 2006, 57, 525–530. [Google Scholar] [CrossRef]
  17. Linsell, K.J.; Rahman, M.S.; Taylor, J.D.; Davey, R.S.; Gogel, B.J.; Wallwork, H.; Forrest, K.L.; Hayden, M.J.; Taylor, S.P.; Oldach, K.H. QTL for resistance to root-lesion nematode Pratylenchus thornei from a synthetic hexaploid wheat source. Theor. Appl. Genet. 2014, 127, 1409–1421. [Google Scholar] [CrossRef] [PubMed]
  18. Rahman, M.S.; Linsell, K.J.; Taylor, J.D.; Hayden, M.J.; Collins, N.C.; Oldach, K.H. Fine mapping of root-lesion nematode Pratylenchus thornei resistance loci on chromosomes 6D and 2B of wheat. Theor. Appl. Genet. 2019, 133, 635–652. [Google Scholar] [CrossRef]
  19. Khoo, K.H.P.; Sheedy, J.G.; Taylor, J.D.; Croser, J.S.; Hayes, J.E.; Sutton, T.; Thompson, J.P.; Mather, D.E. A QTL on the CA7 chromosome of chickpea affects resistance to the root-lesion nematode Pratylenchus thornei. Mol. Breed. 2021, 41, 78. [Google Scholar] [CrossRef]
  20. Vanstone, V.A.; Hollaway, G.J.; Stirling, G.R. Managing nematode posts in the southern and western regions of the Australian cereal industry: Continuing progress in a challenging environment. Australas. Plant Pathol. 2008, 37, 220–224. [Google Scholar] [CrossRef]
  21. Murray, G.M.; Brennan, J.P. Estimating disease losses to the Australian barley industry. Australas. Plant Pathol. 2010, 39, 85–96. [Google Scholar] [CrossRef]
  22. Grains Research and Development Corporation National Variety Trials Disease Ratings. Available online: https://nvt.grdc.com.au/nvt-disease-ratings (accessed on 16 January 2024).
  23. Sharma, S.; Sharma, S.; Kopisch-Obuch, F.J.; Keil, T.; Laubach, E.; Stein, N.; Graner, A.; Jung, C. QTL analysis of root-lesion nematode resistance in barley: 1. Pratylenchus neglectus. Theor. Appl. Genet. 2011, 122, 1321–1330. [Google Scholar] [CrossRef] [PubMed]
  24. Galal, A.; Sharma, S.; Abou-Elwafa, S.F.; Sharma, S.; Kopisch-Obuch, F.; Laubach, E.; Perovic, D.; Ordon, F.; Jung, C. Comparative QTL analysis of root lesion nematode resistance in barley. Theor. Appl. Genet. 2014, 127, 1399–1407. [Google Scholar] [CrossRef] [PubMed]
  25. Ophel-Keller, K.; McKay, A.; Hartley, D.; Herdina; Curran, J. Development of a routine DNA-based testing service for soilborne diseases in Australia. Australas. Plant Pathol. 2008, 37, 243–253. [Google Scholar] [CrossRef]
  26. Sheedy, J.G.; McKay, A.C.; Lewis, J.; Vanstone, V.A.; Fletcher, S.; Kelly, A.; Thompson, J. Cereal cultivars can be ranked consistently for resistance to root-lesion nematodes Pratylenchus thornei and P. neglectus using diverse procedures. Australas. Plant Pathol. 2014, 44, 175–182. [Google Scholar] [CrossRef]
  27. Panozzo, J.F.; Eckermann, P.J.; Mather, D.E.; Moody, D.B.; Black, C.K.; Collins, H.M.; Barr, A.R.; Lim, P.; Cullis, B.R. QTL analysis of malting quality traits in two barley populations. Crop Pasture Sci. 2007, 58, 858–866. [Google Scholar] [CrossRef]
  28. Gupta, S.; Vassos, E.; Sznajder, B.; Fox, R.; Khoo, K.H.P.; Loughman, R.; Chalmers, K.J.; Mather, D.E. A locus in barley chromosome 5H affects adult plant resistance to powdery mildew. Mol. Breed. 2018, 38, 103. [Google Scholar] [CrossRef] [PubMed]
  29. Jayakodi, M.; Padmarasu, S.; Haberer, G.; Bonthala, V.S.; Gundlach, H.; Monat, C.; Lux, T.; Kamal, N.; Lang, D.; Himmelbach, A.; et al. The barley pan-genome reveals the hidden legacy of mutation breeding. Nature 2020, 588, 284–289. [Google Scholar] [CrossRef]
  30. Waugh, R.; Guo, W.; Schreiber, M.; Marosi, V.; Bagnaresi, P.; Chalmers, K.; Chapman, B.; Dang, V.; Dockter, C.; Fiebig, A.; et al. A barley pan-transcriptome reveals layers of genotype-dependent transcriptional complexity. Res. Sq. 2024. [Google Scholar] [CrossRef]
  31. Channale, S.; Thompson, J.P.; Varshney, R.K.; Thudi, M.; Zwart, R.S. Multi-locus genome-wide association study of chickpea reference set identifies genetic determinants of Pratylenchus thornei resistance. Front. Plant. Sci. 2023, 14, 1139574. [Google Scholar] [CrossRef]
  32. Channale, S.; Kalavikatte, D.; Thompson, J.P.; Kudapa, H.; Bajaj, P.; Varshney, R.K. Transcriptome analysis reveals key genes associated with root-lesion nematode Pratylenchus thornei resistance in chickpea. Sci. Rep. 2021, 11, 17491. [Google Scholar] [CrossRef] [PubMed]
  33. Linsell, K.J.; Riley, I.T.; Davies, K.A.; Oldach, K.H. Characterization of resistance to Pratylenchus thornei Nematoda in wheat Triticum aestivum: Attraction, penetration, motility, and reproduction. Phytopathology 2014, 104, 174–187. [Google Scholar] [CrossRef] [PubMed]
  34. Moody, E.H.; Lownsbery, B.F.; Ahmed, J.M. Culture of the root-lesion nematode Pratylenchus vulnus on carrot disks. J. Nematol. 1973, 5, 225–226. [Google Scholar] [PubMed]
  35. Whitehead, A.G.; Hemming, J.R. A comparison of some quantitative methods of extracting small vermiform nematodes from soil. Ann. Appl. Biol. 1965, 55, 25–38. [Google Scholar] [CrossRef]
  36. Proctor, J.R.; Marks, C.F. The determination of normalizing transformations for nematode count data from soil samples and of efficient sampling schemes. Nematologica 1975, 20, 395–406. [Google Scholar]
  37. Broman, K.W.; Wu, H.; Sen, S.; Churchill, G.A. R/qtl: QTL mapping in experimental crosses. Bioinformatics 2003, 19, 889–890. [Google Scholar] [CrossRef] [PubMed]
  38. R Core Team. A Language and Environment for Statistical Computing; R Foundation for Statistical Computing: Vienna, Austria, 2023; Available online: https://www.R-project.org (accessed on 21 January 2024).
  39. He, C.; Holme, J.; Anthony, J. SNP genotyping: The KASP assay. In Crop Breeding. Methods in Molecular Biology; Fleury, D., Whitford, R., Eds.; Humana Press: New York, NY, USA, 2014; Volume 1145, pp. 75–86. [Google Scholar]
  40. Wu, Y.; Bhat, P.R.; Close, T.J.; Lonardi, S. Efficient and accurate construction of genetic linkage maps from the minimum spanning tree of a graph. PLoS Genet. 2008, 10, e1000212. [Google Scholar] [CrossRef] [PubMed]
  41. Taylor, J.; Butler, D. R Package ASMap: Efficient genetic linkage map construction and diagnosis. J. Stat. Softw. 2017, 79, 1–29. [Google Scholar] [CrossRef]
  42. Altschul, F.; Gish, W.; Miller, W.; Myers, E.W.; Lipman, D.J. Basic local alignment search tool. J. Mol. Biol. 1990, 215, 403–410. [Google Scholar] [CrossRef]
  43. Priyam, A.; Woodcroft, B.J.; Rai, V.; Moghul, I.; Munagala, A.; Ter, F.; Chowdhary, H.; Pieniak, I.; Maynard, L.J.; Gibbins, M.A.; et al. Sequenceserver: A modern graphical user interface for custom BLAST databases. Mol. Biol. Evol. 2019, 36, 2922–2924. [Google Scholar] [CrossRef]
  44. GrainGenes BLAST Service. Available online: https://wheat.pw.usda.gov/blast/ (accessed on 16 January 2024).
  45. Li, H. Minimap2: Pairwise alignment for nucleotide sequences. Bioinformatics 2018, 34, 3094–3100. [Google Scholar] [CrossRef] [PubMed]
  46. Guo, W.; Tzioutziou, N.A.; Stephen, G.; Milne, I.; Calixto, C.P.; Waugh, R.; Brown, J.W.S.; Zhang, R. 3D RNA-seq: A powerful and flexible tool for rapid and accurate differential expression and alternative splicing analysis of RNA-seq data for biologists. RNA Biol. 2021, 18, 1574–1587. [Google Scholar] [CrossRef] [PubMed]
Figure 1. Frequency distribution for estimated final numbers of Pratylenchus thornei nematodes at eight weeks after inoculation for an Arapiles/Franklin barley population.
Plants 13 01663 g001
Figure 2. Quantitative trait locus Rlnt.ArFr-7H for Pratylenchus thornei resistance mapped in an Arapiles/Franklin barley population using a linkage map of single-nucleotide polymorphisms on chromosome 7H. The vertical line shows the position of marker wri907. The horizontal dashed line shows the genome-wide significance threshold (LOD = 2.69).
Plants 13 01663 g002
Figure 3. Frequency distributions for estimated final numbers of Pratylenchus thornei nematodes at 16 weeks after inoculation for a Denar/Baudin barley population evaluated in two experiments (a,b).
Plants 13 01663 g003
Figure 4. Quantitative trait locus QRlntDeBa-7H for Pratylenchus thornei resistance in a Denar/Baudin barley population using a linkage map of single-nucleotide polymorphisms and SilicoDArT presence-absence markers on chromosome 7H and phenotypic data from two phenotyping experiments. The solid and dashed scans show LOD test statistic values from the first and second experiments, respectively. The vertical line shows the position of marker wri907. The horizontal dashed line shows the genome-wide significance threshold (LOD = 2.87).
Plants 13 01663 g004
Figure 5. Estimated final numbers of Pratylenchus thornei nematodes for 11 barley mapping parents with the resistance-associated nucleotide (A) at marker wri907 and 35 parents with the alternative nucleotide (G). Solid horizontal lines show the mean values for the two genotypic classes.
Plants 13 01663 g005
Figure 6. Positions of (a) 23 single-nucleotide polymorphisms on two genetic linkage maps and on the 7H pseudomolecule of the RGT Planet genome sequence assembly [23] and (b) 11 single-nucleotide polymorphisms in a candidate region of that pseudomolecule.
Plants 13 01663 g006
Figure 7. Haplotypes for 46 barley mapping parents across 26 single-nucleotide polymorphism markers. Physical positions are on the RGT Planet 7H pseudomolecule sequence. Parents are listed in order from lowest to highest best linear unbiased estimate (BLUE) of the final number of Pratylenchus thornei nematodes, i.e., from most resistant to most susceptible. Nucleotides that are the same as in RGT Planet are shown in white text on a dark background. - = missing genotypic data.
Plants 13 01663 g007
Figure 8. Haplotypes for (a) 14 barley varieties across 26 single-nucleotide polymorphism markers, showing the resistance status [22] of each variety as moderately resistant (MR), moderately resistant to moderately susceptible (MRMS) or moderately susceptible (MS) and (b) 20 barley pan-genome lines across nine of those markers. All markers are arranged according to their physical order in the RGT Planet 7H pseudomolecule sequence. Nucleotides that are the same as in RGT Planet are shown in white text on a dark background. The resistance status of the pan-genome lines is not known, except for RGT Planet, which is moderately resistant. - = missing genotypic data.
Plants 13 01663 g008
Table 1. Genes between 613,940,059 bp and 617,621,077 bp on the RGT Planet 7H pseudomolecule sequence [23] for which the corresponding gene in the PanBaRT20 barley pan-transcriptome assembly [24] expressed an average of at least 1 transcript per million (TPM) in RGT Planet root tissue.
RGT Planet GenePanBaRT20 Gene IDMean TPM
Gene IDDescription
PLANET_7H01G664900Carbonic anhydrasePanBaRT20_7H77511120.52
PLANET_7H01G657100WRKY transcription factorPanBaRT20_7H7860479.51
PLANET_7H01G657200WRKY transcription factorPanBaRT20_7H78606171.32
PLANET_7H01G657500 PanBaRT20_7H786096.04
PLANET_7H01G658100Aldehyde oxidase, putativePanBaRT20_7H786205.59
PLANET_7H01G658300Lysosomal Pro-X carboxypeptidasePanBaRT20_7H786242.79
PLANET_7H01G65860050S ribosomal protein L35PanBaRT20_7H786266.39
PLANET_7H01G65970050S ribosomal protein L35PanBaRT20_7H786464.49
PLANET_7H01G660900 PanBaRT20_7H7865232.41
PLANET_7H01G661100 PanBaRT20_7H7865860.94
PLANET_7H01G661600Kinase, putativePanBaRT20_7H786614.19
PLANET_7H01G661800Homeobox protein knotted-1, putativePanBaRT20_7H78662102.55
PLANET_7H01G661900Kinase family proteinPanBaRT20_7H7866316.81
PLANET_7H01G662100Indole-3-glycerol phosphate synthase-likePanBaRT20_7H7867072.89
PLANET_7H01G662400NHL domain-containing protein, putativePanBaRT20_7H78676332.46
PLANET_7H01G664400 PanBaRT20_7H786912.96
PLANET_7H01G664500 PanBaRT20_7H786958.51
PLANET_7H01G665100Methyltransferase-likePanBaRT20_7H787004.91
PLANET_7H01G665200Ribonuclease 3-like protein 3PanBaRT20_7H7870218.89
PLANET_7H01G666100Methyl-CpG-binding domain proteinPanBaRT20_7H7870522.02
PLANET_7H01G666300Transcription initiation factor TFIID subunit 1PanBaRT20_7H7870719.99
PLANET_7H01G666400XH/XS domain-containing family proteinPanBaRT20_7H7870928.05
PLANET_7H01G666500Transcription initiation factor TFIID subunit 1PanBaRT20_7H7871021.36
PLANET_7H01G666600Transmembrane proteinPanBaRT20_7H7871123.57
PLANET_7H01G666900 PanBaRT20_7H787141.82
PLANET_7H01G667300NF-X1-type zinc finger protein NFXL1PanBaRT20_7H787173.95
PLANET_7H01G667400Isoleucine–tRNA ligasePanBaRT20_7H7871970.82
PLANET_7H01G667500Mis12 proteinPanBaRT20_7H7872026.22
PLANET_7H01G667900, PLANET_7H01G668100 PanBaRT20_7H78730353.53
PLANET_7H01G668200 PanBaRT20_7H7873542.43
PLANET_7H01G668400Amino acid transporter-like proteinPanBaRT20_7H7874123.33
PLANET_7H01G668500WD40 repeat-like proteinPanBaRT20_7H7874231.70
PLANET_7H01G668800S-acyltransferasePanBaRT20_7H7874326.43
PLANET_7H01G668900Pyrophosphate-energized vacuolarPanBaRT20_7H78744183.49
Table 2. Genes between 613,940,059 bp and 617,621,077 bp on the RGT Planet 7H pseudomolecule sequence [23] for which the corresponding gene in the PanBaRT20 barley pan-transcriptome assembly [24] expressed at least 1 transcript per million in RGT Planet root tissue and had significantly higher expression in RGT Planet than in at least 1 of 19 other barley pan-transcriptome lines.
RGT Planet GenePanBaRT20 Gene IDNumber of Lines with Lower Expression than RGT Planet 1
Gene IDDescription
PLANET_7H01G664900Carbonic anhydrasePanBaRT20_7H775114
PLANET_7H01G657100WRKY transcription factorPanBaRT20_7H786049
PLANET_7H01G657200WRKY transcription factorPanBaRT20_7H786067
PLANET_7H01G659700Kinase family proteinPanBaRT20_7H786461
PLANET_7H01G660900 PanBaRT20_7H7865211
PLANET_7H01G661100 PanBaRT20_7H7865811
PLANET_7H01G661600Kinase, putativePanBaRT20_7H7866116
PLANET_7H01G661800Homeobox protein knotted-1, putativePanBaRT20_7H786621
PLANET_7H01G662100Indole-3-glycerol phosphate synthase-likePanBaRT20_7H786702
PLANET_7H01G662400NHL domain-containing protein, putativePanBaRT20_7H786767
PLANET_7H01G664400 PanBaRT20_7H786912
PLANET_7H01G664500 PanBaRT20_7H786957
PLANET_7H01G666600Transmembrane proteinPanBaRT20_7H787117
PLANET_7H01G667900
PLANET_7H01G668100
PanBaRT20_7H7873014
PLANET_7H01G668900Pyrophosphate-energized vacuolar membrane proton pumpPanBaRT20_7H787442
1 Lines for which the Benjamini–Hochberg-adjusted p value was below 0.05 and the absolute value of the log2 fold-change was greater than or equal to 1.
Table 3. Genes between 613,940,059 bp and 617,621,077 on the RGT Planet 7H pseudomolecule sequence [23] for which the corresponding gene in the PanBaRT20 barley pan-transcriptome assembly [24] had significantly lower expression in root tissue of RGT Planet than in root tissue of least 1 of 19 other barley pan-transcriptome lines.
RGT Planet GenePanBaRT20 Gene IDNumber of Lines with Higher Expression than RGT Planet 1Absolute Value of log2 Fold-Change
Gene IDDescriptionMaximumMedian 2
PLANET_7H01G664900Carbonic anhydrasePanBaRT20_7H7751111.561.56
PLANET_7H01G657100WRKY transcription factorPanBaRT20_7H7860421.231.21
PLANET_7H01G657500 PanBaRT20_7H7860941.161.04
PLANET_7H01G658100Aldehyde oxidase, putativePanBaRT20_7H7862082.901.67
PLANET_7H01G658200Lysosomal Pro-X carboxypeptidasePanBaRT20_7H7862293.661.93
PLANET_7H01G658300Lysosomal Pro-X carboxypeptidasePanBaRT20_7H7862411.341.34
PLANET_7H01G660900 PanBaRT20_7H7865211.251.25
PLANET_7H01G662100Indole-3-glycerol phosphate
synthase-like
PanBaRT20_7H7867021.371.24
PLANET_7H01G662400NHL domain-containing protein,
putative
PanBaRT20_7H7867611.201.20
PLANET_7H01G664400 PanBaRT20_7H7869111.071.07
PLANET_7H01G663800
PLANET_7H01G664600
GlycosyltransferasePanBaRT20_7H7869751.821.54
PLANET_7H01G666900 PanBaRT20_7H7871411.021.02
1 Lines for which the Benjamini–Hochberg-adjusted p value was below 0.05 and the absolute value of the log2 fold-change was greater than or equal to 1. 2 Median of values greater than or equal to 1.
Disclaimer/Publisher’s Note: The statements, opinions and data contained in all publications are solely those of the individual author(s) and contributor(s) and not of MDPI and/or the editor(s). MDPI and/or the editor(s) disclaim responsibility for any injury to people or property resulting from any ideas, methods, instructions or products referred to in the content.

