Abstract
Cyclin B (CYCB) is a regulatory subunit of cyclin-dependent kinase (CDK), the concentration of which fluctuates to regulate cell cycle progression. Extensive studies have been performed on cyclins in numerous species, yet the evolutionary relationships and biological functions of the CYCB family genes in Brassica napus remain unclear. In this study, we identified 299 CYCB genes in 11 B. napus accessions. Phylogenetic analysis suggests that CYCB genes could be divided into three subfamilies in angiosperms and that the CYCB3 subfamily members may be a newer group that evolved in eudicots. The expansion of BnaCYCB genes underwent segmental duplication and purifying selection in genomes, and a number of drought-responsive and light-responsive cis-elements were found in their promoter regions. Additionally, expression analysis revealed that BnaCYCBs were strongly expressed in the developing seed and silique pericarp, as confirmed by the obviously reduced seed size of the mutant cycb3;1 in Arabidopsis thaliana compared with Col-0. This study provides a comprehensive evolutionary analysis of CYCB genes as well as insight into the biological function of CYCB genes in B. napus.
1. Introduction
The eukaryotic cell division cycle, a highly regulated process involving gene transcription and protein translation and degradation, is driven by the activity of cyclin-dependent kinases (CDKs) and regulatory cyclins (CYCs), which function primarily during the S-phase and at the G1/S and G2/M transitions [1]. Cyclins were initially defined in marine invertebrates as proteins that were expressed at specific points and then subsequently degraded during the cell division cycle [2]. Plants possess more cyclins than yeasts and animals [3,4]. The number and classification of cyclins are different in plant genomes, which rely on the protein phases and the sequences of amino acid to activate CDK partners during cell cycles. In Arabidopsis thaliana, 49 cyclins were identified and classified into A, B, D, H, L, T, U, and SDS types [5]. However, 48 cyclin genes were identified and classified into A, B, D, F, SDS, H, L, T and P types in rice (Oryza sativa) [6]. At the G1/S transition, CDKA/CYCD complexes are phosphorylated by CDK-activating kinase (CAK) to inactivate retinoblastoma-related (RBR) that permits heterodimeric E2F/DP transcription factors to stimulate S-phase gene expression, resulting in cell proliferation [3,7]. Moreover, the products of cyclin A and cyclin B genes assemble with CDKB, and then are stimulated by CAK or inhibited by CKIs, to promote M-phase progression [8,9]. Previous studies have suggested that the rate of cell division, the number of dividing cells, and the duration of the cell proliferation phase control the cell number of organs and tissues, which further influence their sizes [10]. For example, different division patterns could alter the cell size of the outermost floral [11], and cell cycle regulation is essential for the seed size in Arabidopsis [12]. It was also reported that the endoreduplication cycle is a means to boost fruit size and control the plant growth rate [11].
Typical cyclin B contains four conserved-type domains: (1) cyclin-N, a necessary domain in CYCBs that contains the CDK-binding site; (2) cyclin-C, a less conserved domain; (3) D-box, a domain involved in protein proteolysis; (4) PEST, a marker for unstable proteins [5,12,13,14]. Previous studies have illustrated that the CYCB family genes function to regulate spindle and phragmoplast formation during the cell cycle [15], which can promote plant growth and seed development in A. thaliana [16,17]. In O. sativa, CYCB2;2 promotes cell division to accelerate root growth without increasing the cell size [18]. Mariana et al. [19] found that CYCB1;1, CYCB1;2, and CYCB1;3 are redundantly required for endosperm proliferation, with reduced growth and aborted seeds in A. thaliana. Manipulation of the cell cycle procession by regulating the expression of CYCB1;1 and CYCB2;2 may improve rice yield performance [20]. These data suggest that B-type cyclins play a predictable role in stimulating cell division and promoting tissue development.
The characterization and contribution of CYCB family genes have been well studied in A. thaliana, O. sativa, and Brassica rapa [5,6,21], whereas no research has focused on Brassica napus, one of the most important allopolyploid crops worldwide. Here, we identified CYCB genes across 11 B. napus accessions and 24 representative angiosperms. To better understand CYCB function in B. napus, we analyzed the characteristics, gene structure, collinearity, cis-acting elements, protein networks, and expression patterns in Darmor-bzh (Dar), as well as functional characterization in the homologous mutant A. thaliana. Our study provides a comprehensive evolutionary analysis of type-B cyclin genes and an understanding of CYCB functions in B. napus.
2. Results
2.1. Identification of CYCB Genes in B. napus
We identified 25 CYCB genes in the B. napus accession Dar (Table 1 and Table S1). Each AtCYCB corresponded to 2–4 BnaCYCB homologs. However, no homologs were found for AtCYCB1;4, AtCYCB1;5, or AtCYCB2;5 in B. napus. The number of amino acid residues in BnaCYCB proteins ranged from 204 (BnaCYCB3;1b) to 681 (BnaCYCB1;2b), and most of them contained about 410 aa (Table 1). The relative molecular weights (MWs) of BnaCYCB proteins ranged from 23,927.39 to 76,106.19 Da, with an average of 48,142 Da. The isoelectric points (pIs) of BnaCYCB proteins were predicted to range from 4.81 (BnaCYCB2;2a) to 9.86 (BnaCYCB3;1d), with 10 members possessing a pI greater more than seven and 15 members possessing a pI less than seven (Table 1). No transmembrane helixes or signal peptides were found in the BnaCYCB proteins, and all BnaCYCB members were predicted to localize in the nucleus (Table 1).

Table 1.
Physical and chemical properties of cyclin B proteins in Brassica napus.
To compare the copy-number variations in CYCB family genes in B. napus accessions, we further identified CYCB genes among 11 accessions in B. napus (see Methods). In total, we identified 299 CYCB family genes in the 11 B. napus accessions, most of which presented 20–30 CYCBs, but 50 CYCBs were identified in Ningyou (Table 2 and Table S2). Furthermore, CYCB1;1, CYCB1;2, CYCB2;2, and CYCB2;3 had more copies in Ningyou, suggesting an expansion of these genes in the Ningyou genome. Moreover, no homolog was found for AtCYCB2;5 in any accessions, and CYCB2;4 was identified only in Dar and CYCB3;1 was only identified in Dar and ZS11, suggesting the differences in copy-number variations among B. napus accessions. CYCB1;2, CYCB1;3, CYCB2;1, CYCB2;2, and CYCB2;3 members were identified in all B. napus accessions, illustrating their important roles in B. napus (Table 2).

Table 2.
Copy-number variations in CYCB members in 11 Brassica napus accessions.
2.2. Phylogenetic Analysis of CYCB Proteins
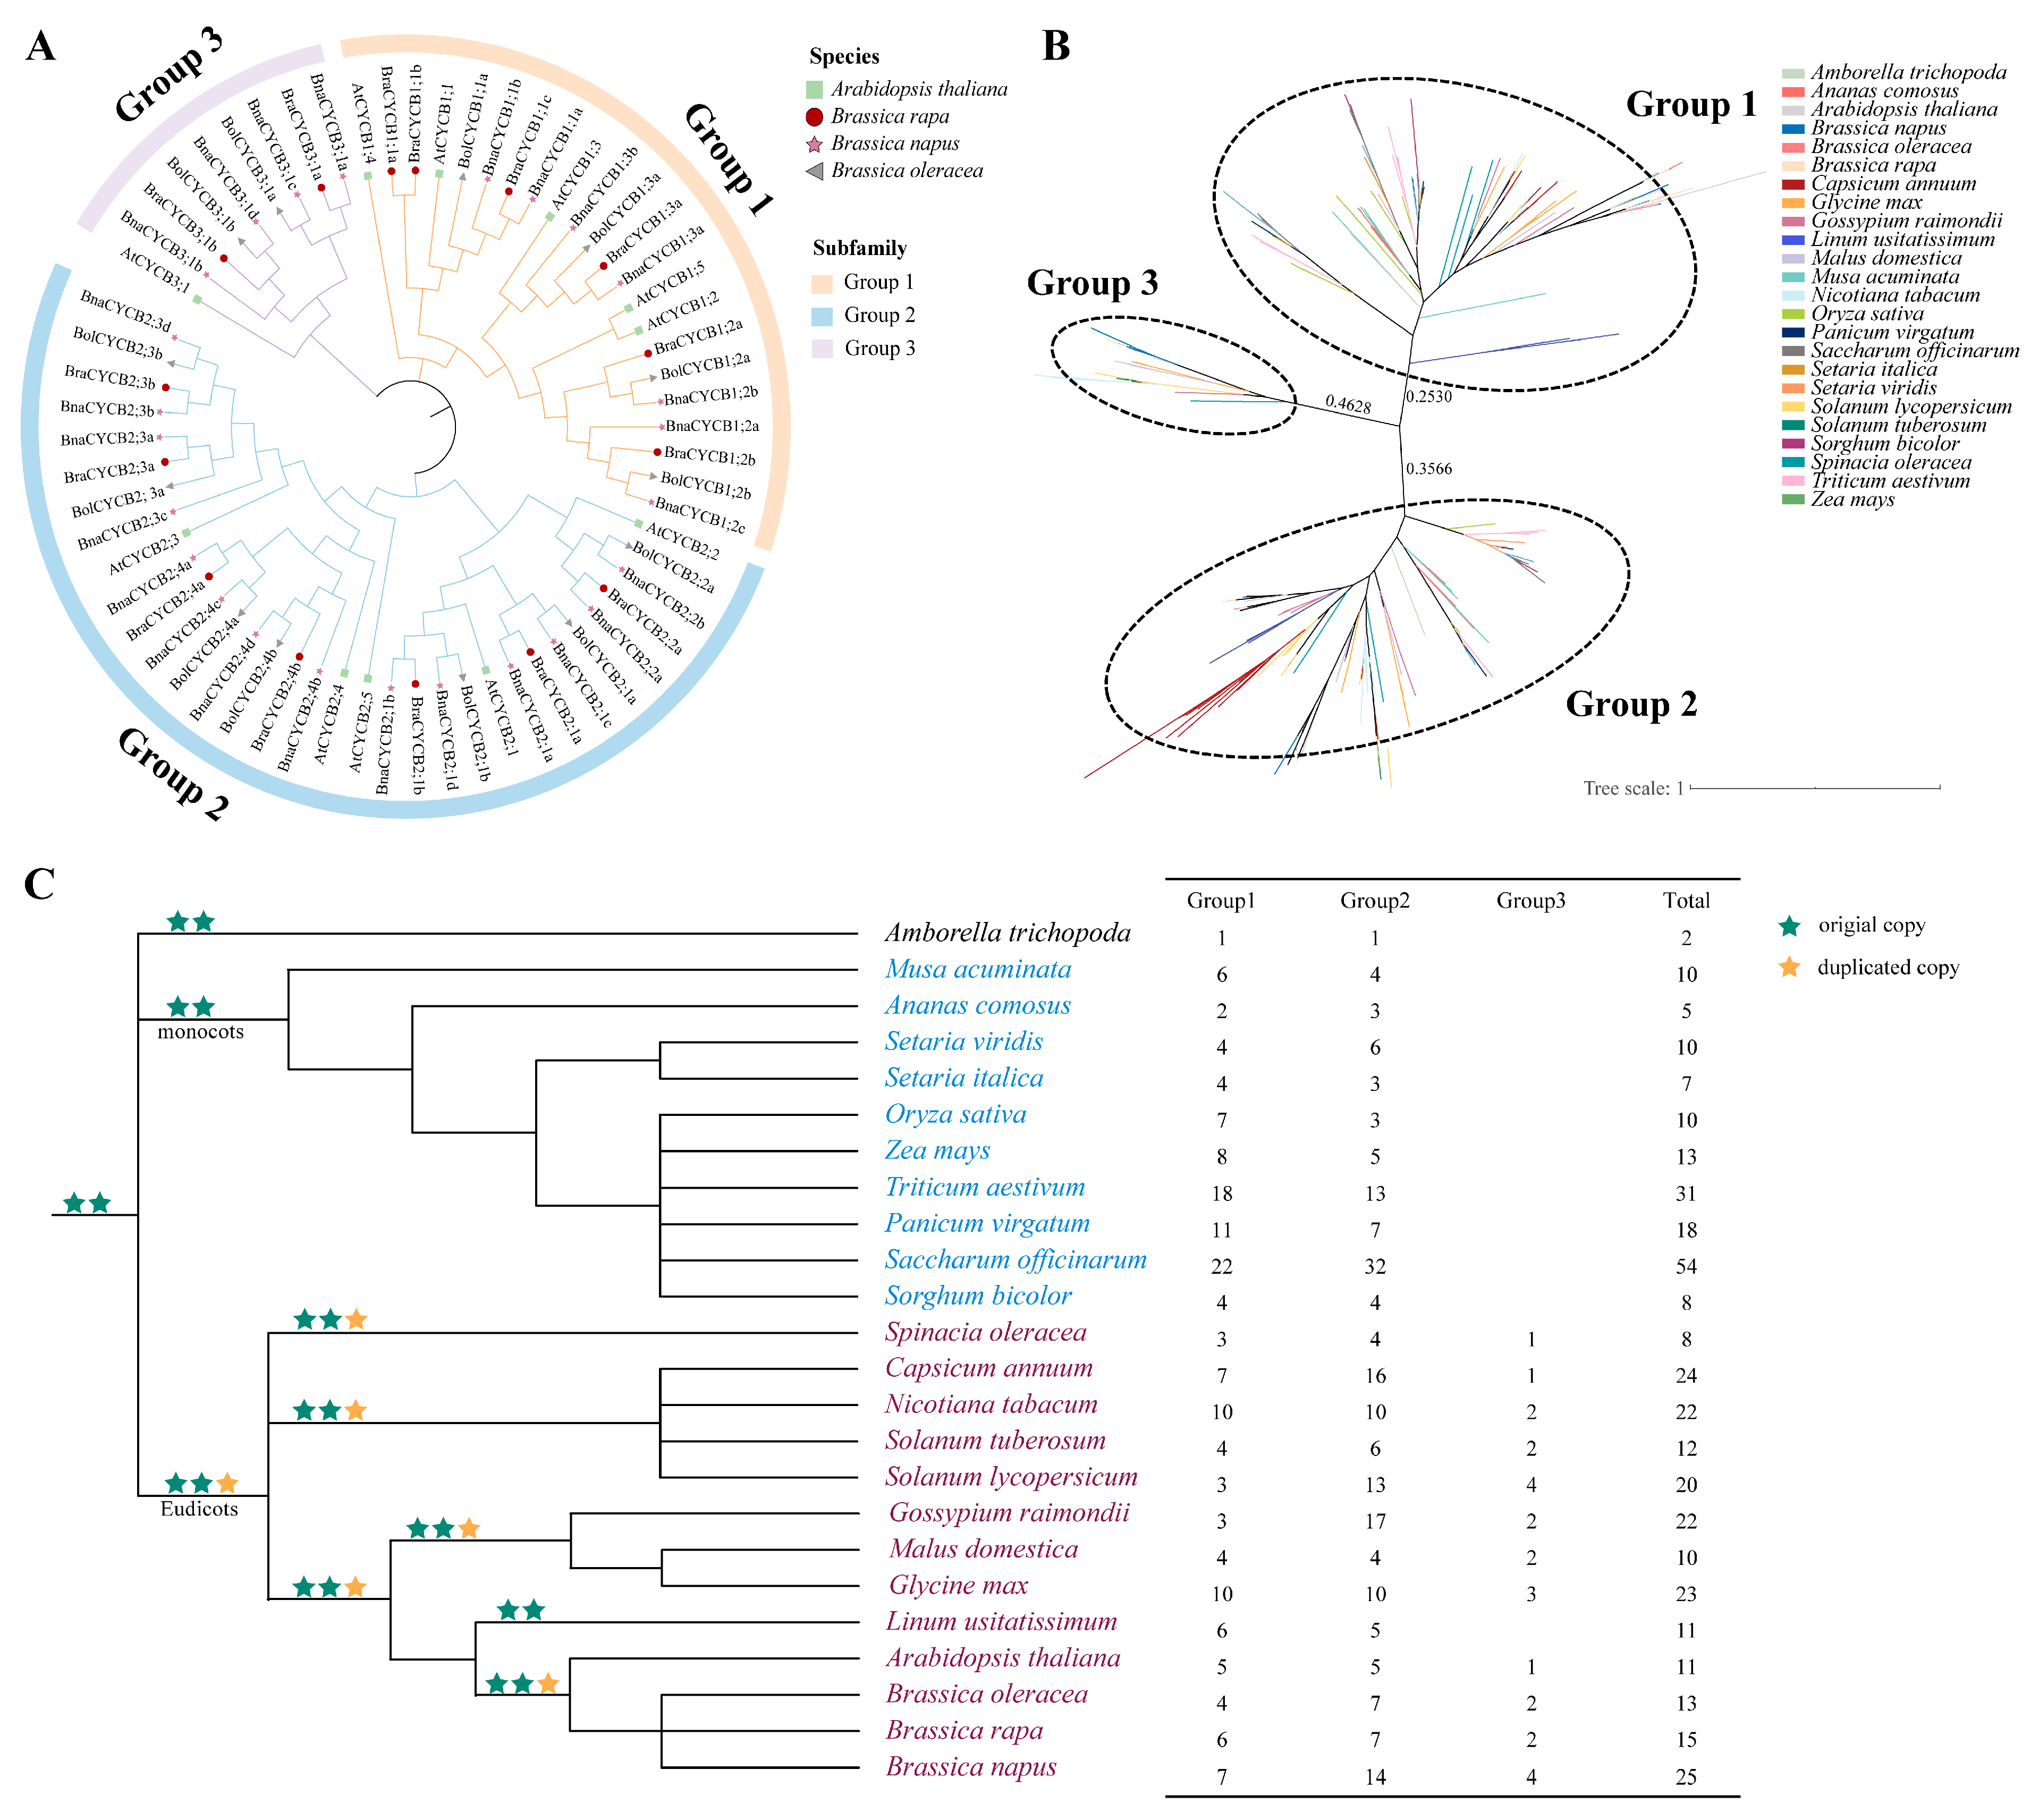
To reveal the evolutionary relationships among CYCB family genes in A. thaliana, B. napus, B. rapa, and Brassica oleracea, we constructed a neighbor-joining (NJ) tree using their protein sequences. The results showed that these CYCB proteins could be divided into three groups: Group 1 (CYCB1), Group 2 (CYCB2), and Group 3 (CYCB3). Group 2 was the largest, containing 33 Brassicaceae members, followed by Group 1 (22) and Group 3 (9) (Figure 1A, Table S1). The phylogenetic relationships among the homologous genes from these species were completely consistent with the relationships among the species. The CYCBs from B. rapa and B. oleracea first clustered with those from B. napus to form a small branch and then joined with CYCBs from A. thaliana to form a larger clade (Figure 1A).
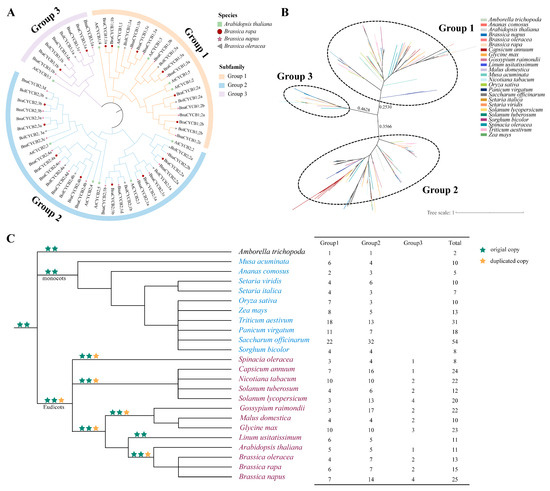
Figure 1.
(A) Phylogenetic relationships among CYCB proteins in four Brassicaceae species; (B) phylogenetic relationships among CYCB proteins in 24 species; (C) number of CYCB genes in each group among 24 plant species. Phylogenetic relationships among these species refer to APG IV [22].
To further investigate the phylogenetic relationships of CYCB proteins in angiosperms, we also analyzed the phylogenetic relationships of CYCB family members in 24 species (see Methods). In total, 384 CYCB proteins were found in these examined plants (Table S2). The phylogenetic analysis suggested that these CYCB members could also be classified into three distinct groups (Figure 1B), corresponding to the above-mentioned Brassicaceae analyses. Specifically, Group 1 contained 159 CYCB members, Group 2 had 199 CYCB members, and Group 3 possessed 26 CYCB members. The copy-number of the CYCB members varied among these species from 2 (Amborella trichopoda) to 54 (Saccharum officinarum), with obvious expansion in Groups 1 and 2 but relative conservation in Group 3. Members of Groups 1 and 2 were examined in all monocot and eudicot plants, with one CYCB member in A. trichopoda (Figure 1C). Noticeably, CYCB members in Group 3 were detected only in eudicots (Figure 1C), suggesting that Group 3 may be a newer group in eudicot plants and may evolve from Group 1 or 2. However, we found that Linum usitatissimum did not contain CYCB3 members, suggesting that this copy may be lost in L. usitatissimum. In addition, the relationship among the CYCB members was in accordance with the evolutionary relationship of species. In each subfamily, CYCB members from Brassicaceae first clustered together to form a small clade with Solanaceae and then formed a larger eudicot cluster. Similarly, Poaceae plants clustered in a clade with Musa acuminata and Ananas comosus to form a monocot cluster and then clustered with eudicot cluster (Figure 1B).
2.3. Gene Structure and Protein Motif Analyses
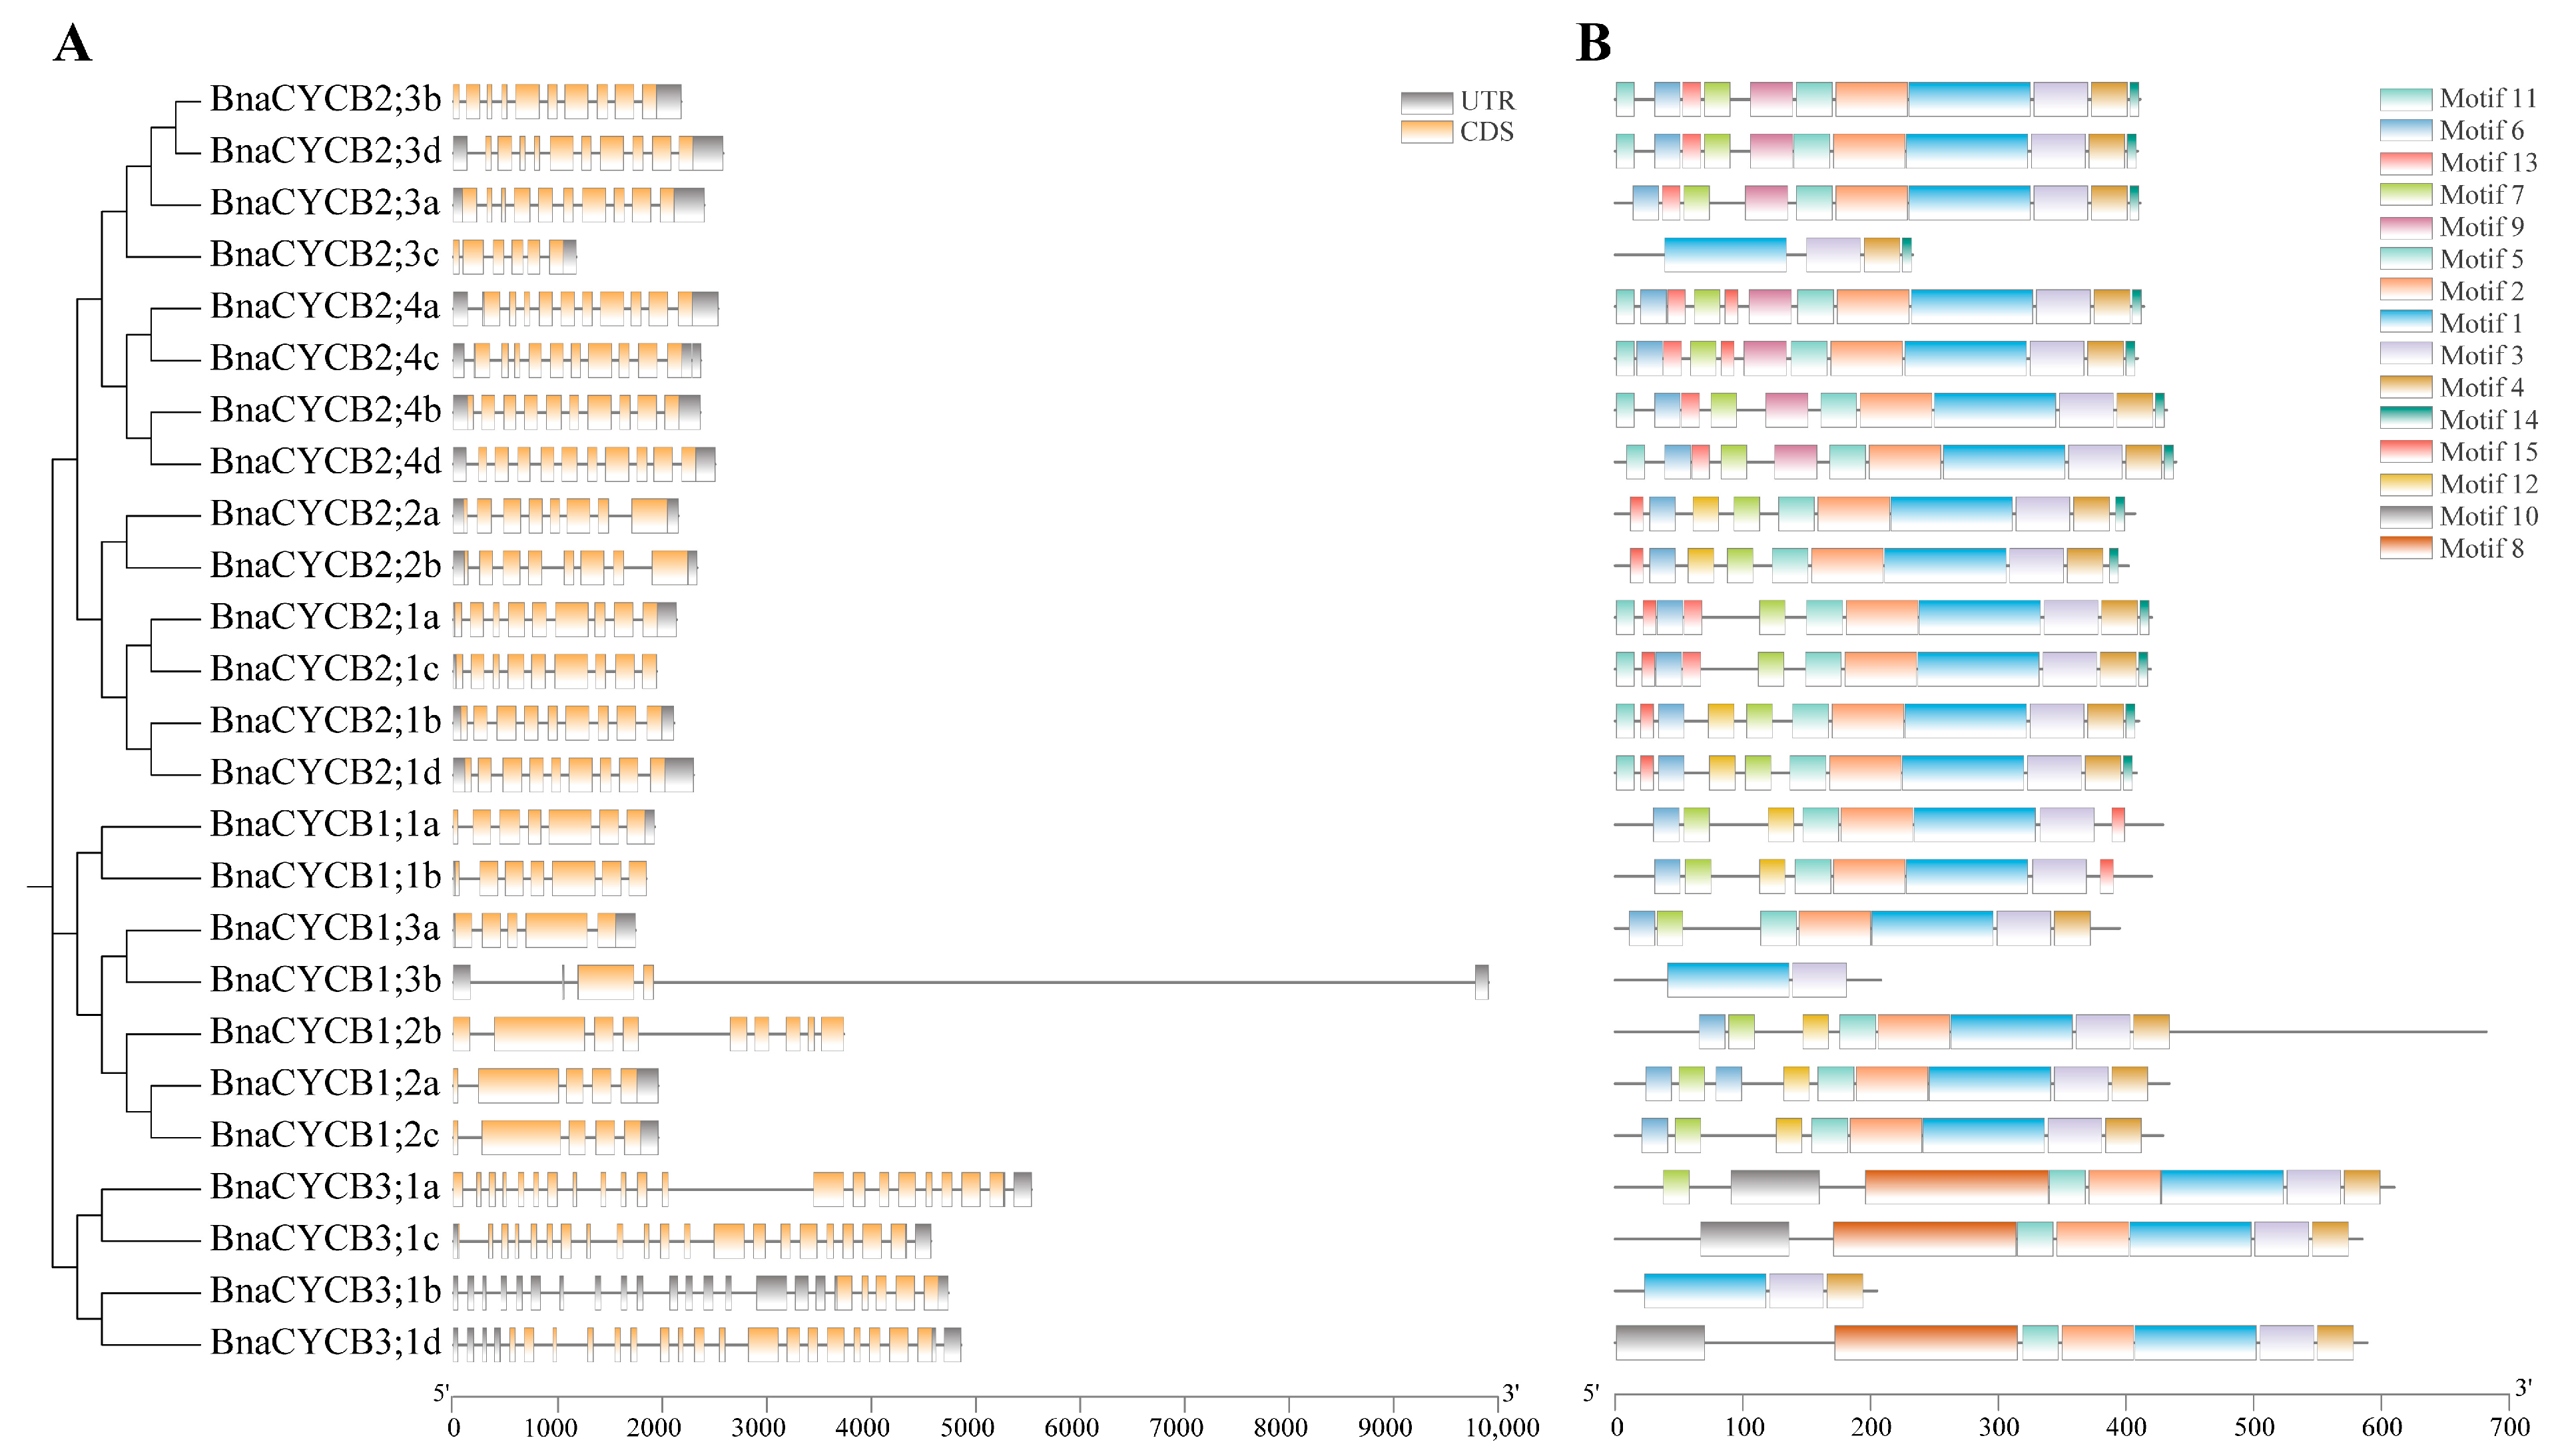
To compare the gene structures of BnaCYCB, we aligned the coding sequences with their corresponding genomic sequences. The BnaCYCB2 subfamily genes presented similar gene structures, with 8–10 introns (Figure 2A). Most genes in Group 3 were composed of 19–20 introns and 21–23 exons. Most Group 1 members contained 5–7 introns, with the exception of BnaCYCB3;1b, which had five exons, and BnaCYCB1;3b, which had two exons and the longest introns. Additionally, all BnaCYCB members contained at least one UTR structure except for BnaCYCB1;2b (Figure 2A).
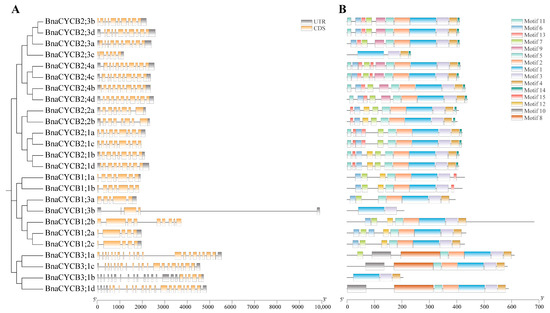
Figure 2.
(A) Gene structures of CYCB genes and (B) conserved motifs.
Fifteen conserved motifs were identified in the full-length BnaCYCB proteins. Motifs 1 and 3 were observed in all 25 BnaCYCB proteins (Figure 2B), and most proteins contained motifs 2, 5, and 4. Motifs 2 and 5 were not found in BnaCYCB2;3c, BnaCYCB1;3b, or BnaCYCB3;1b, and motif 4 was not found in three Group 1 members (BnaCYCB1;1a, BnaCYCB1;1b, BnaCYCB1;3b) (Figure 2B). Motifs 9, 11, 13, and 14 were observed only in Group 2, and motifs 8 and 10 were observed only in Group 3. The BnaCYCB2 subfamily contained the most motifs, in contrast to the BnaCYCB3 subfamily with the least motifs, indicating a functional divergence in BnaCYCB subfamilies.
2.4. Chromosomal Locations and Collinearity Analysis
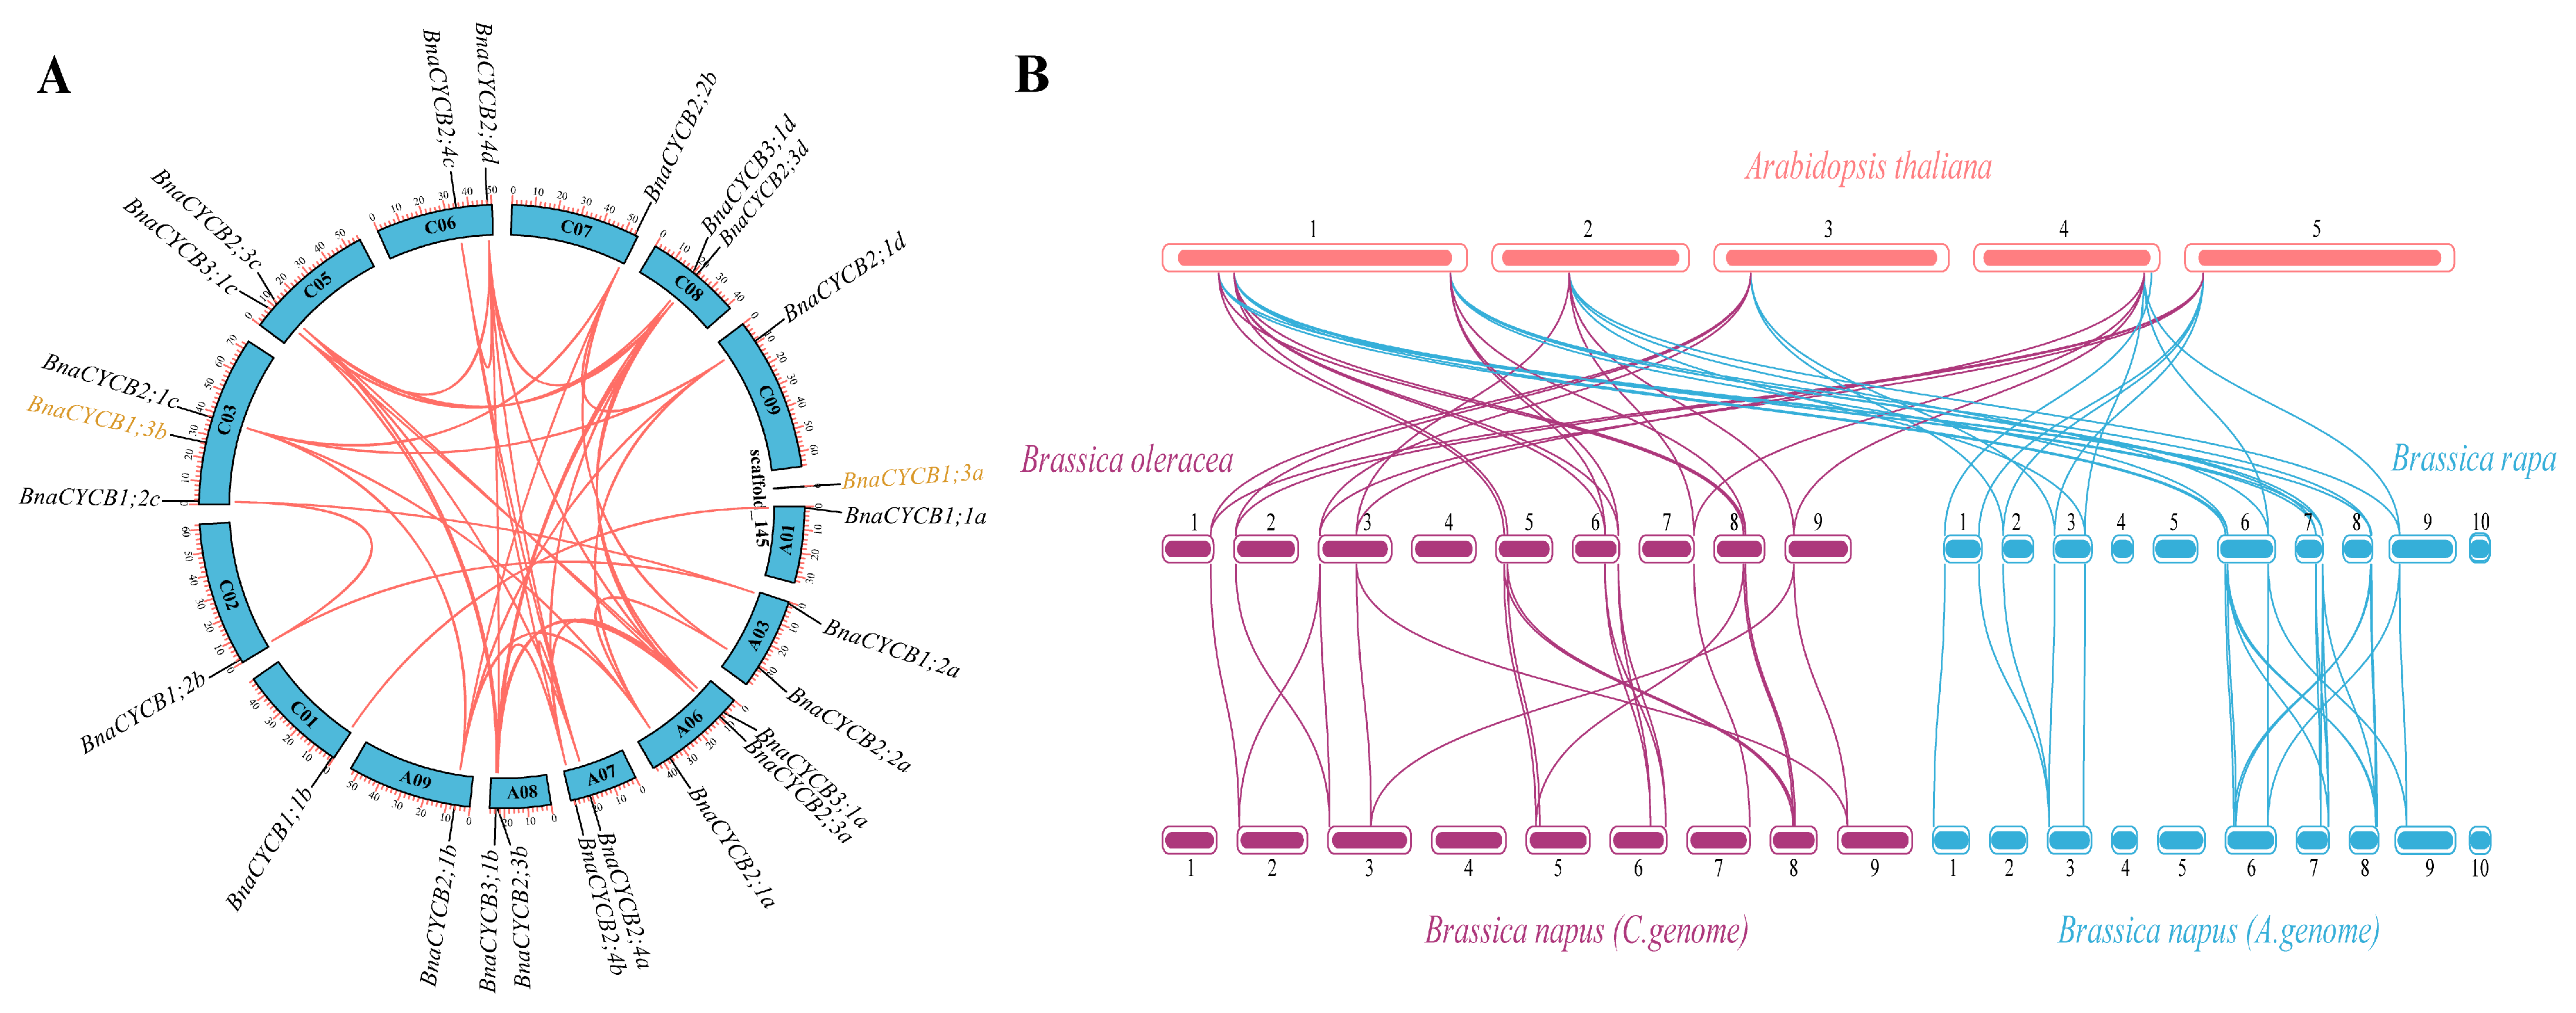
The 24 BnaCYCB genes were located on 14 chromosomes, and BnaCYCB1;3a was located on a scaffold, with 11 genes in the A subgenome and 13 in the C subgenome (Figure 3A). No BnaCYCB genes were found on chromosomes A02, A04, A05, A10, or C04. All chromosomes with BnaCYCB contained one or two genes, except A06 and C03 with three gene locations (Figure 3A). In B. napus, 40 pairs composed of 23 CYCB genes were predicted to share syntenic relationships, with tandem duplications found in BnaCYCB2;4a, BnaCYCB2;4b, BnaCYCB2;4c, and BnaCYCB2;4d (Figure 3A).
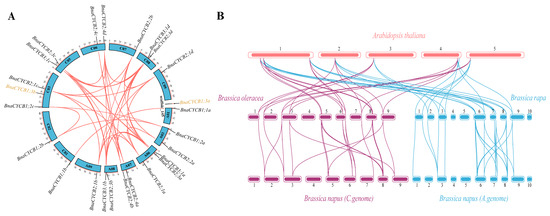
Figure 3.
(A) Chromosomal locations and collinearity analysis of CYCB genes in Brassica napus. The black gene labels represent genes in the collinearity region, and the yellow gene labels represent genes without a collinearity relationship with BnaCYCB. (B) Syntenic relationships of CYCB genes in Arabidopsis thaliana, Brassica oleracea, Brassica rapa, and Brassica napus.
Furthermore, the collinearity map among Brassicaceae species showed a great number of homologous CYCB genes in A. thaliana, B. oleracea, B. rapa, and B. napus. Seven and eight AtCYCBs shared syntenic relationships with 12 BolCYCBs and 13 BraCYCBs, respectively, including six to seven multi-copy genes and one single-copy gene (AtCYCB1;1) (Figure 3B). No homolog for AtCYCB2;3, AtCYCB1;5, or AtCYCB1;4 was found in either B. oleracea or B. rapa, indicating that genes losses occurred in B. oleracea and B. rapa during evolution. The CYCB members from diploids B. oleracea and B. rapa mostly overlapped with those from the C and A subgenomes of B. napus. Twelve of 13 BolCYCB genes and 13 of 15 BraCYCB genes were in collinear regions. The results showed that segmental duplication was the main contributor in the evolution of CYCB members.
To explore the selective pressures on CYCB genes, we determined the Ka/Ks ratio in Brassica. The results showed that the Ka/Ks ratio of all genes were subject to purifying selection. A comparison of the Ka/Ks ratios showed that the average Ka/Ks ratio of B. rapa (0.2064) was higher than that in B. napus (0.1664) and B. oleracea (0.1667), suggesting that CYCB genes in B. rapa experienced higher selection pressure during evolution (Table 3).

Table 3.
Nucleotide substitution rates of Brassica napus, Brassica rapa, and Brassica oleracea.
2.5. Analysis of Promoter Cis-Acting Elements and Protein Interaction Networks
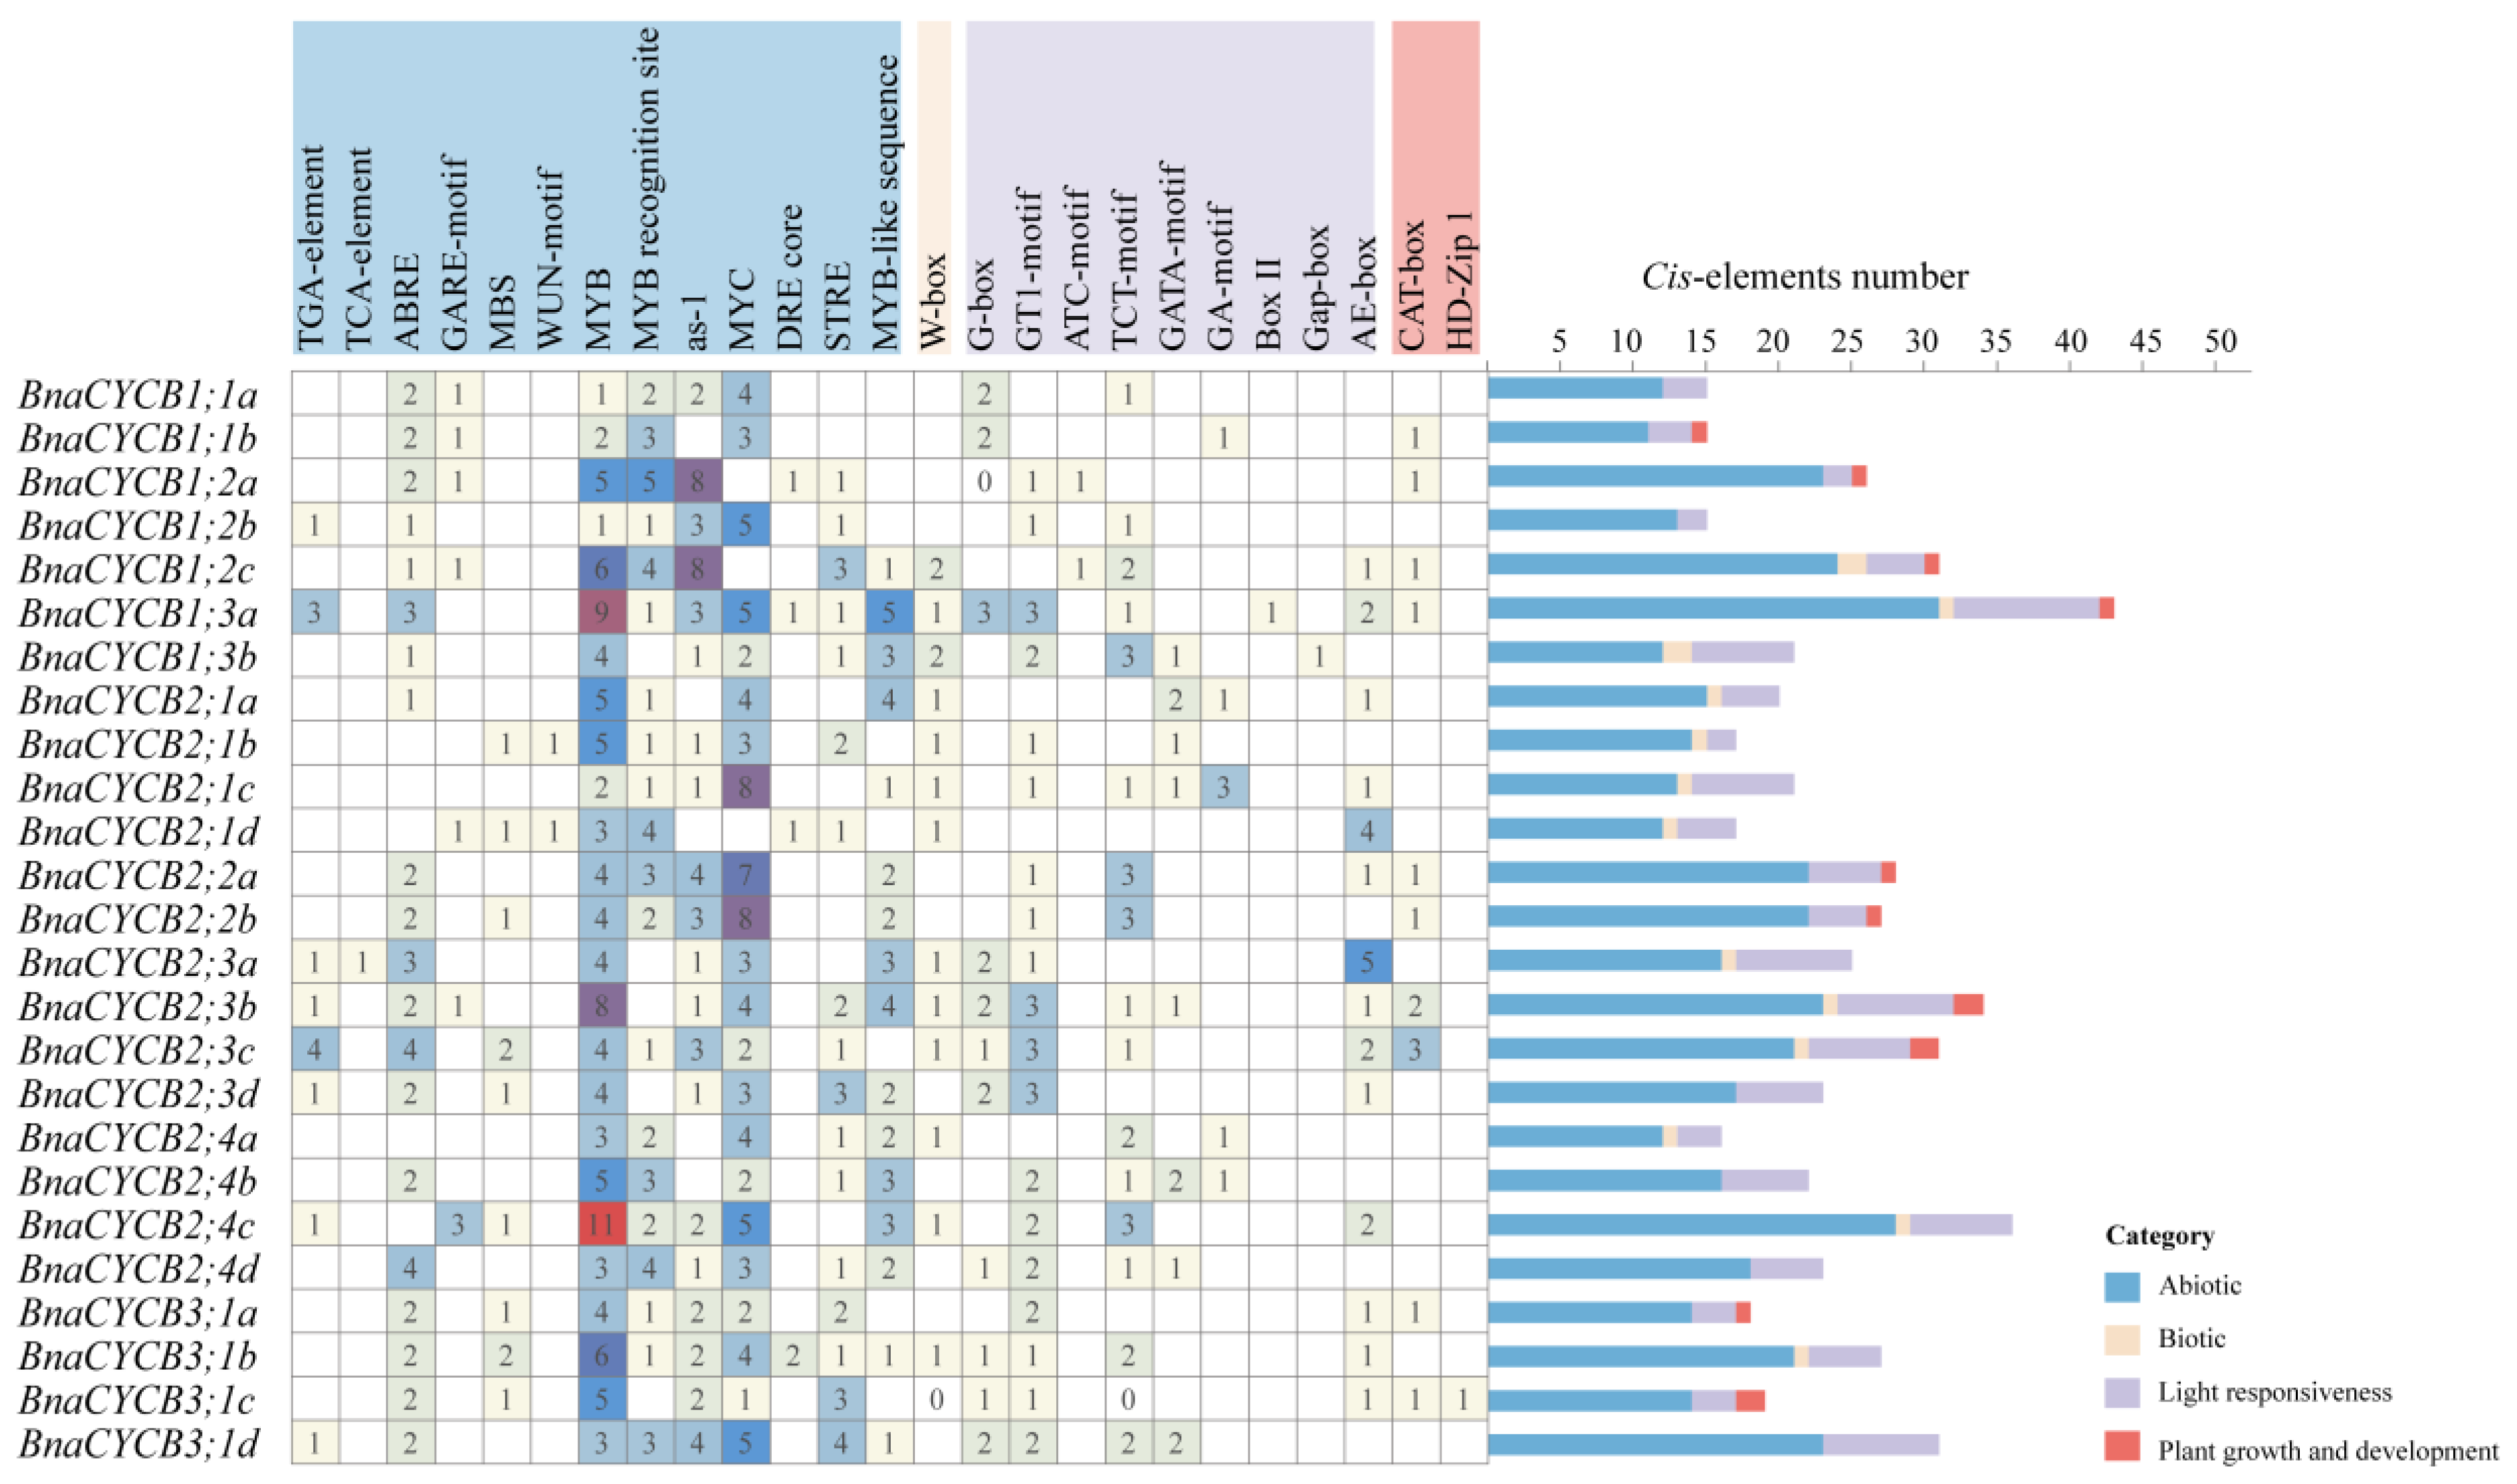
Cis-acting elements affected gene transcription and expression. The analysis showed that the promoter regions of CYCB genes contained a lot of cis-acting elements involving various biological processes. We excluded the components with general transcriptional regulatory elements (TATA-box, CAAT-box, AT~TATA-box), non-Brassicaceae elements, and uncertain function elements and then divided the remained elements into four categories: abiotic, biotic, light response, and growth and development elements. The abiotic response category was the largest, in which drought stress-responsive elements (MBS, MYB, MYC, MYB recognition site, MYB recognition site) were major and were found in most genes, revealing that BnaCYCB genes may be extremely sensitive to drought (Figure 4). Most BnaCYCB genes’ promoter regions contained hormone response elements, including abscisic acid (20), auxin (7), gibberellin A3 (7), and ethylene response elements (2). In addition, there was a major proportion of light response elements in BnaCYCB gene promoter regions (G-box, GT1-motif, ATC-motif, TCT-motif, GATA-motif, GA-motif, Box-II, Gap-box, AE-box) (Figure 4), suggesting the important role of BnaCYCB genes in B. napus growth.
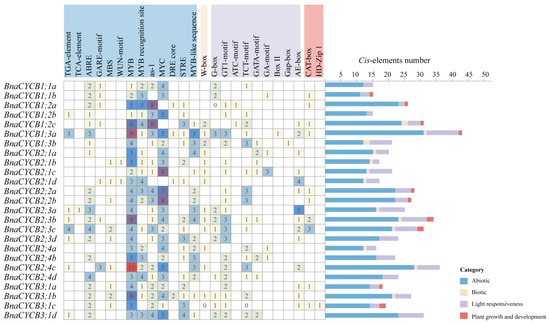
Figure 4.
Summary of cis-acting elements in the BnaCYCB promoter regions.
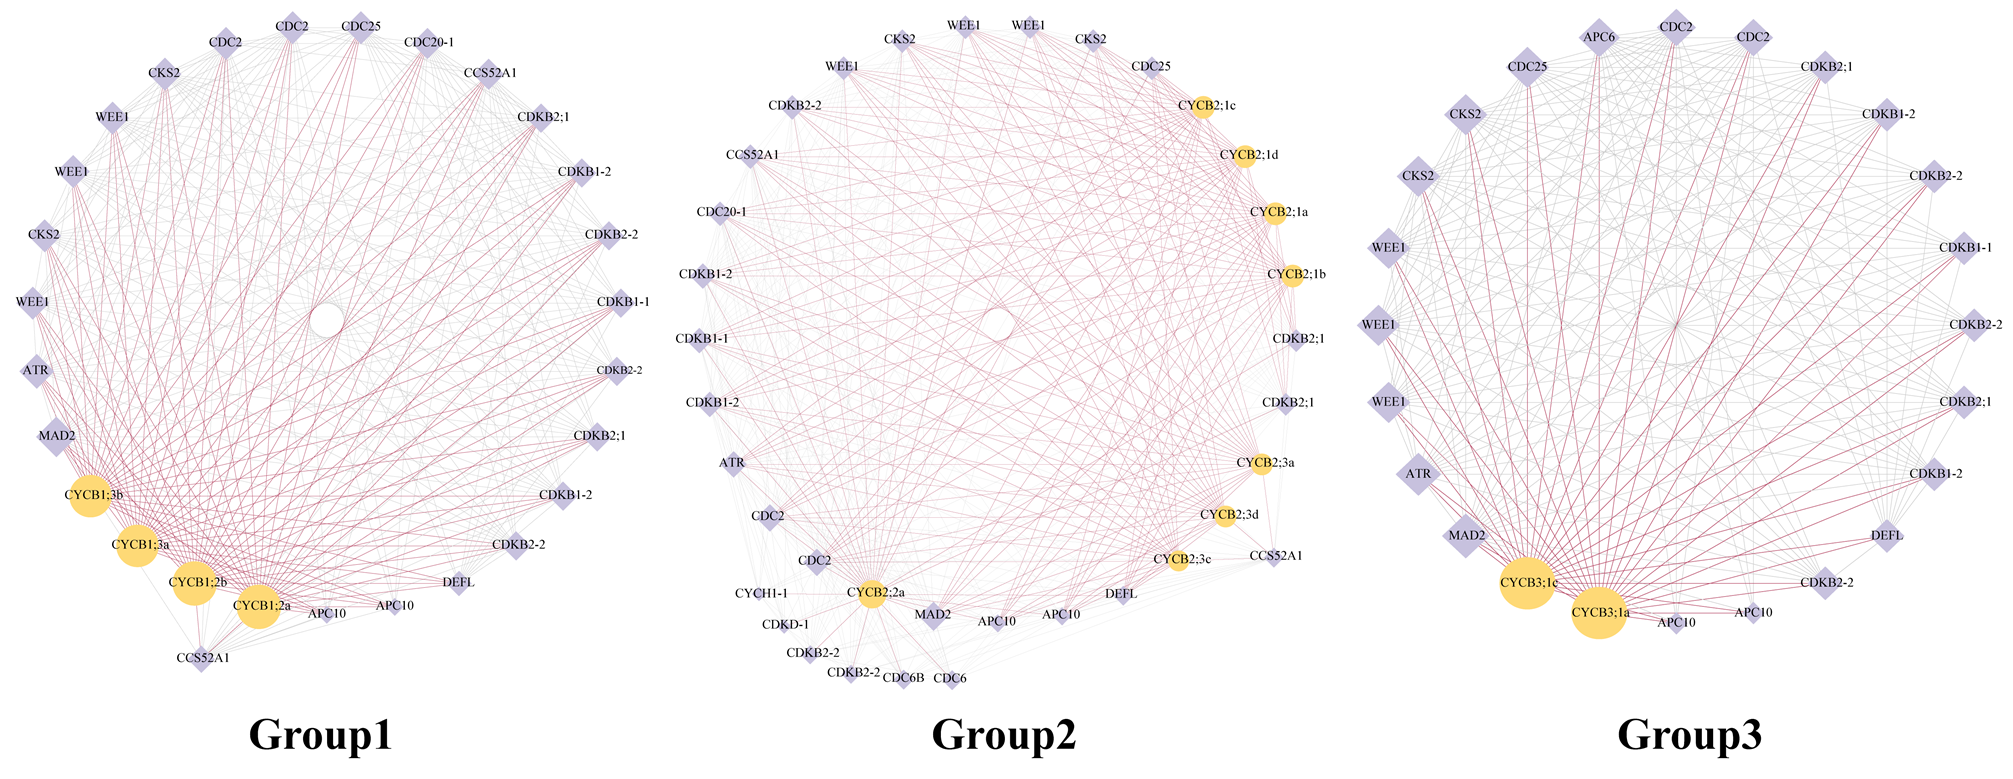
The protein networks displayed that 14 BnaCYCBs potentially interacted with 29 protein candidates (Figure 5), which were mainly associated with cell cycle regulation. The CYCB members from Groups 1, 2, and 3 appeared to display similar networks, showing high connectivity with the hub gene mitotic arrest deficient 2 (MAD2) to regulate the spindle assembly checkpoint, which corresponds with their roles in regulating spindle formation (Figure 5). The CYCB proteins were predicted to interact with several types of CDK proteins and some regulatory subunits of CDK (CKS2, WEE1) that may mediate the interactions between CDK and CYCB proteins.
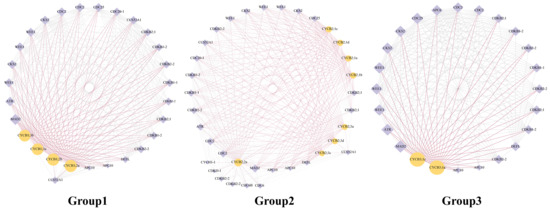
Figure 5.
Protein networks for BnaCYCB in Groups 1, 2, and 3. Yellow circles indicate CYCB members, and purple diamonds indicate candidate proteins. The size of the icons represents the degree of the network. Purple lines represent the adjacent edges of CYCB members.
2.6. Expression Patterns of BnaCYCB
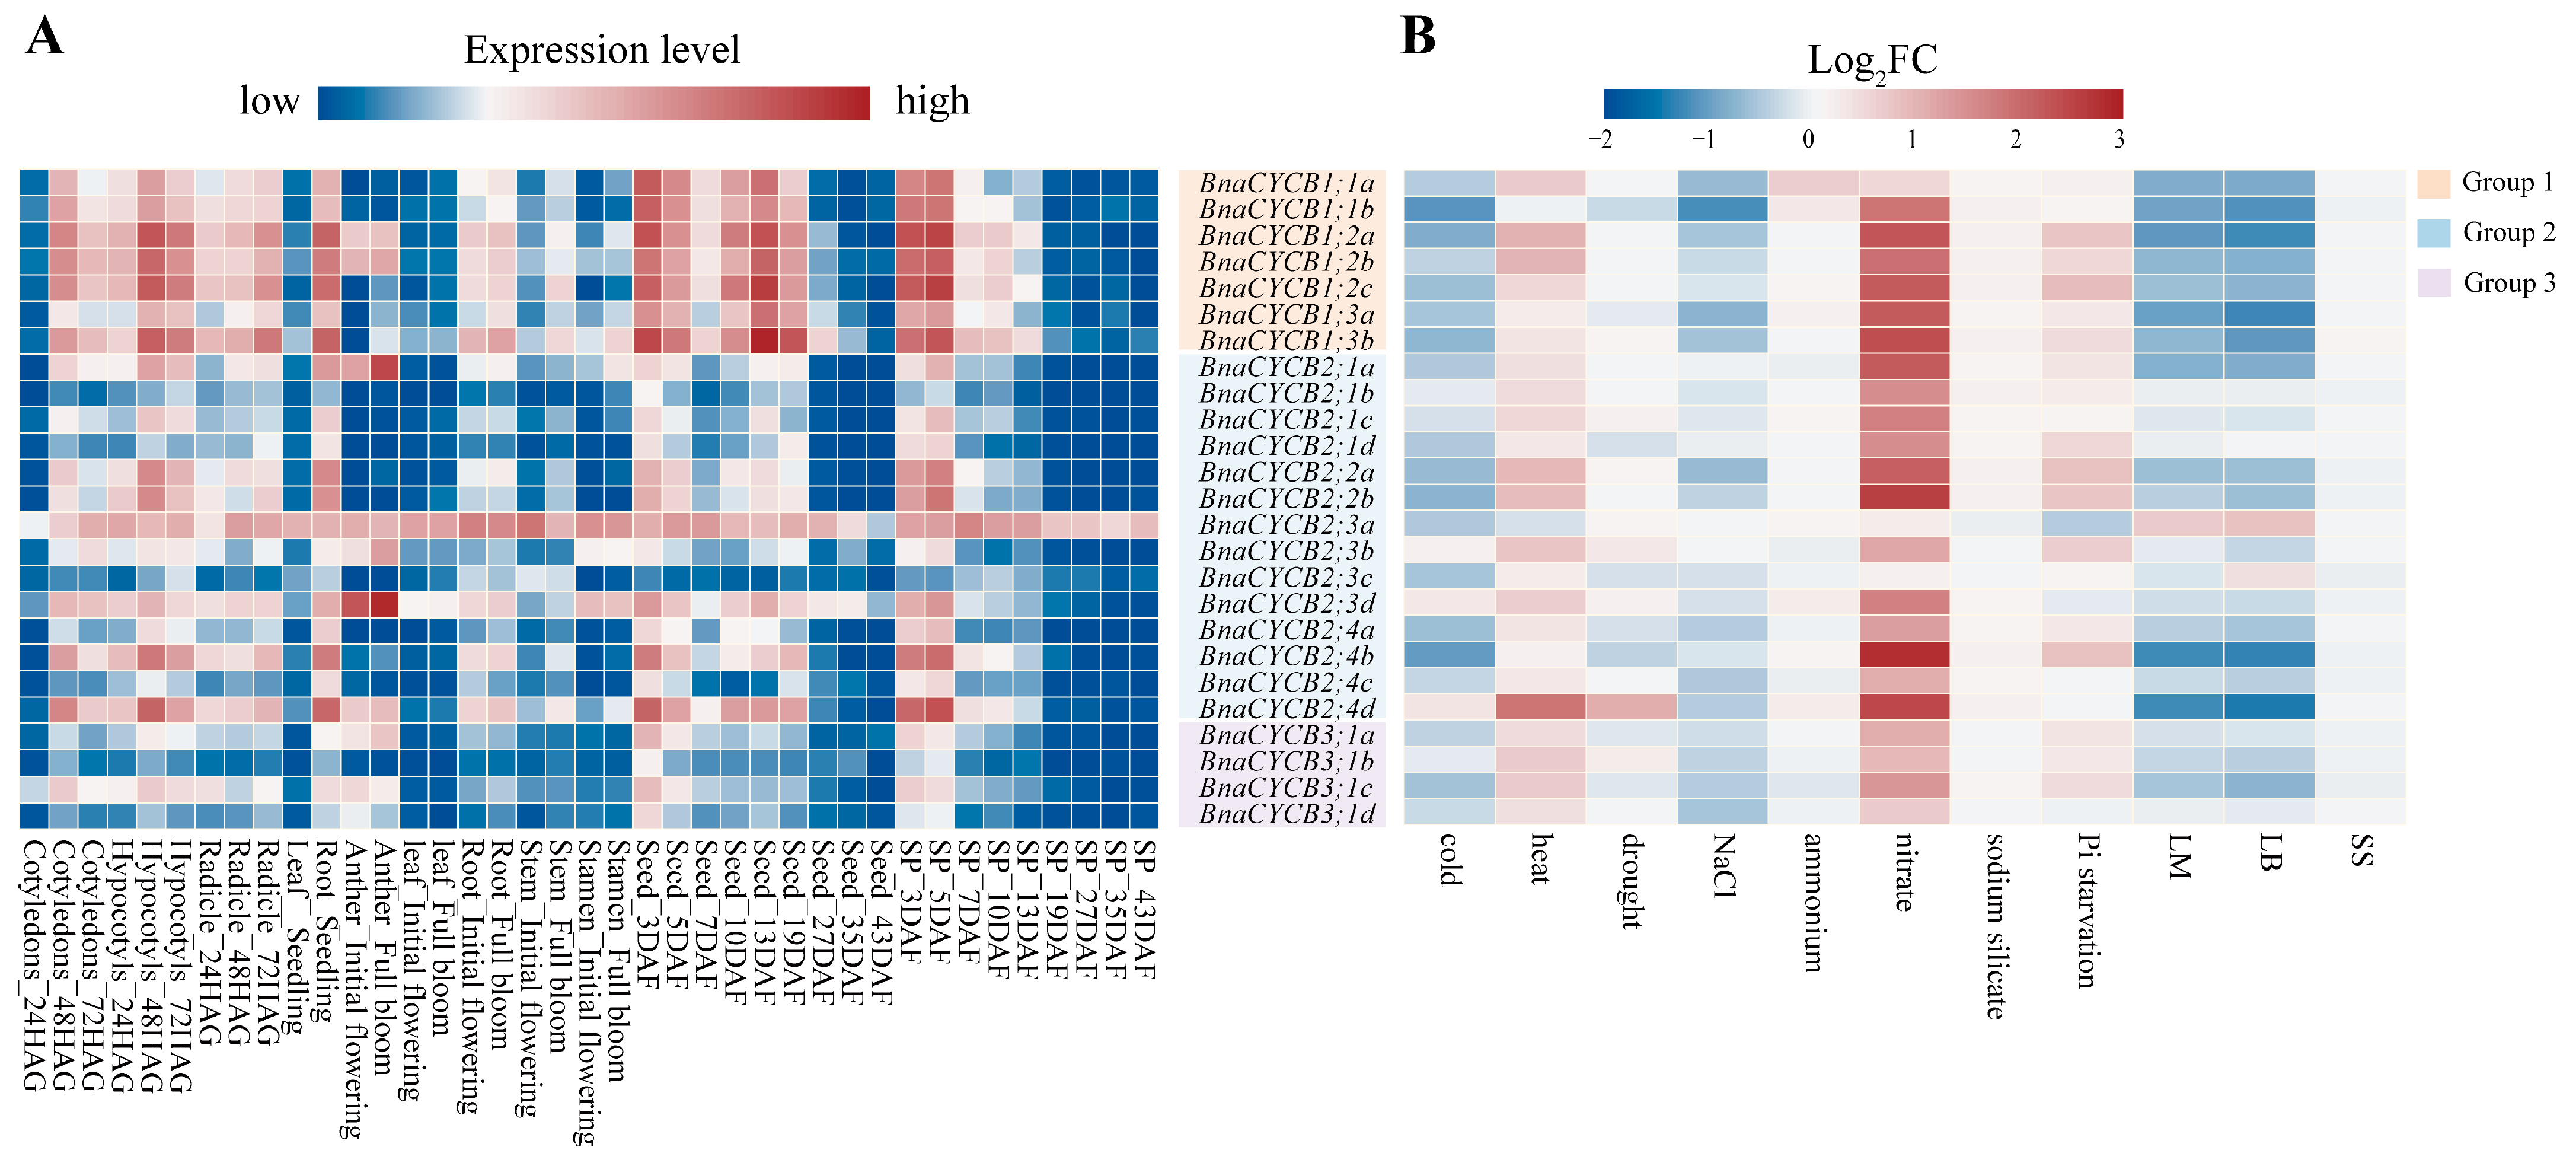
To investigate the tissue-specific expression profiles of BnaCYCB genes, we analyzed 10 types of organs at different developmental stages. The results showed that BnaCYCB genes tended to show similar expression patterns, with a few exceptions. In the germination stage, most CYCB genes were highly expressed in cotyledons, hypocotyls, radicles, and roots, but most CYCB members were expressed strongly in the developing seed and silique pericarp in the maturity period (Figure 6A, Table S3). Interestingly, members in Group 1 were more highly expressed compared with Groups 2 and 3, and BnaCYCB2;3a was highly expressed in all examined tissues (Figure 6A). Furthermore, we analyzed the expression profiles of BnaCYCBs in response to abiotic and biotic stress. The results showed that most genes were sensitive to biotic stress, and their expressions were repressed under cold, drought, NaCl, and ammonium stress (Figure 6B, Table S4), which corresponds with the cis-acting element analysis.
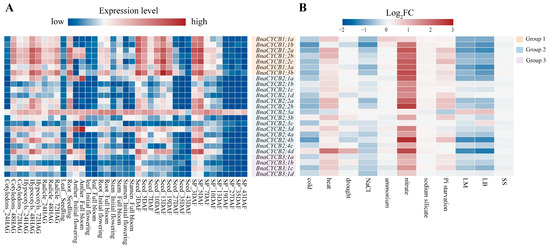
Figure 6.
(A) Expression patterns of BnaCYCB in different organs and development stages. The gene expression level is shown on a graded color scale according to Log2 (FPKM+1) values. HAG, hours after germination; DAF, days after flowering; SP, silique pericarp. (B) Expression profiles of BnaCYCB in response to abiotic and biotic stress. Gene expression is represented by the Log2 fold change (log2 FC) of the mean (FPKM+1) between the treatment and control. LM, Leptosphaeria maculans; LB, Leptosphaeria biglobosa; SS, Sclerotinia sclerotiorum. The red bar represents high expression, while blue represents little or no expression.
2.7. Functional Characterization of CYCB3;1 in Mutant A. thaliana
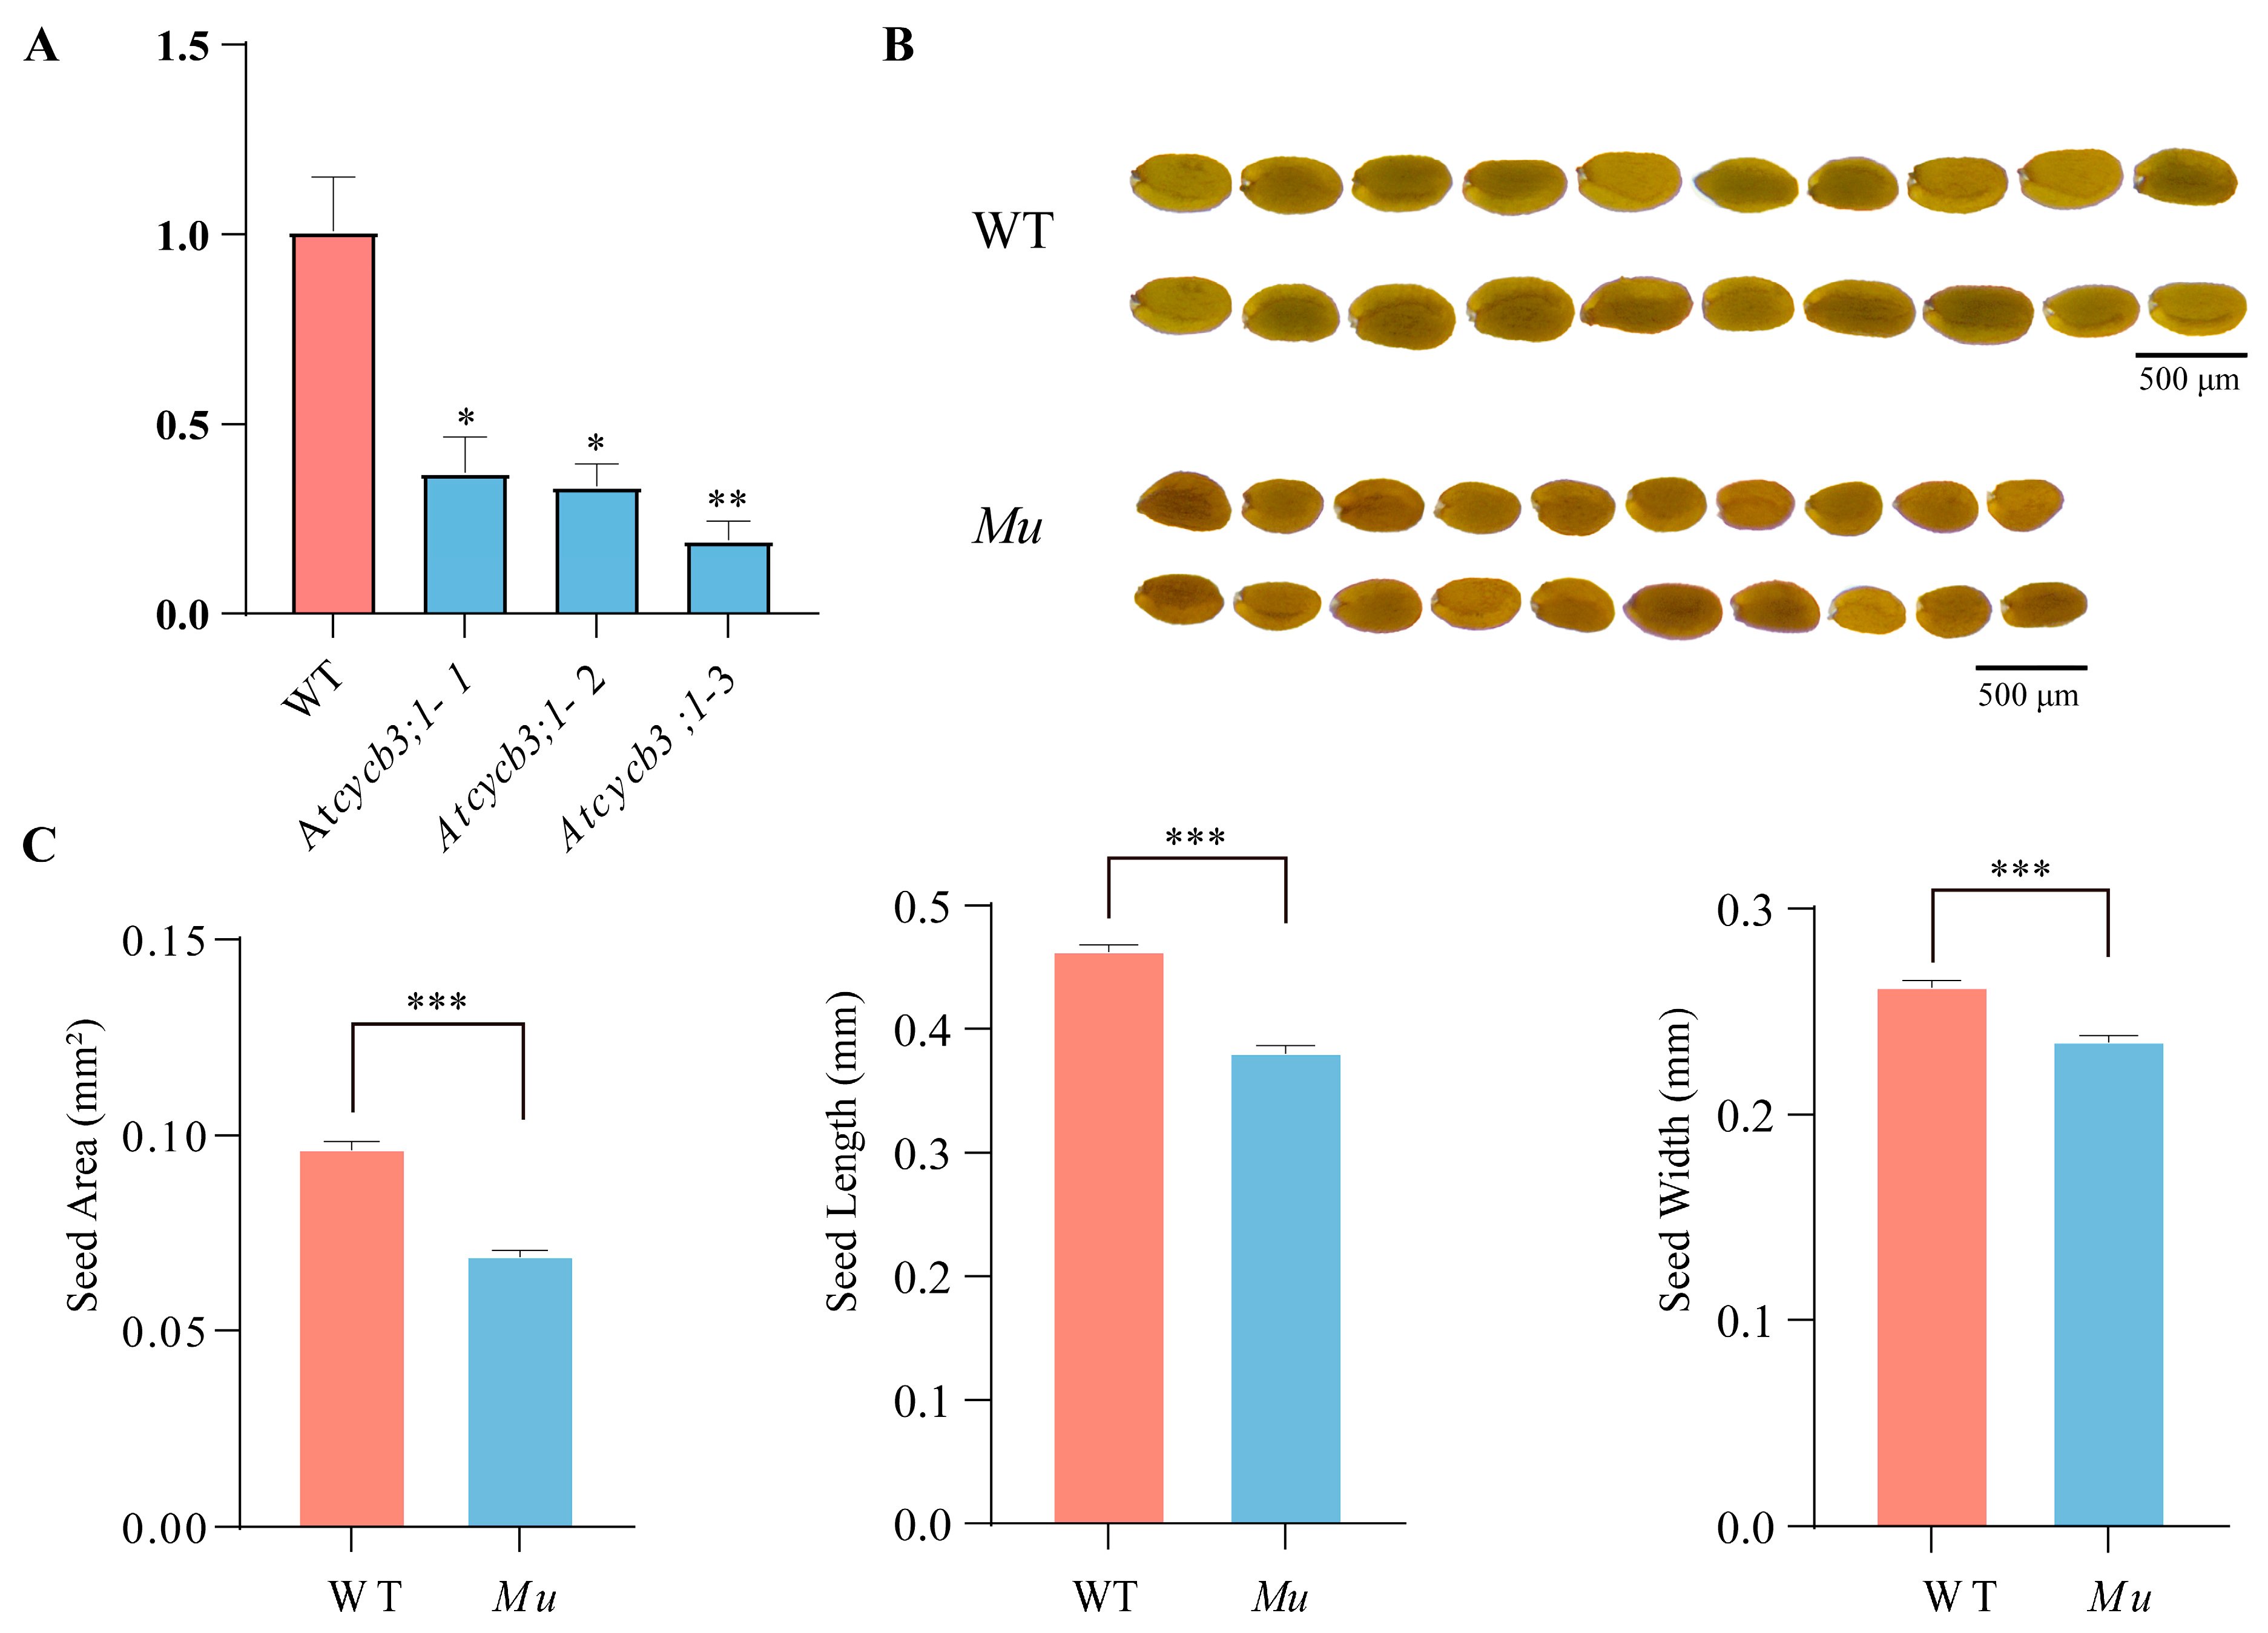
To understand the function of CYCB3;1, we examined the phenotypes of T-DNA mutant (Atcycb3;1-Mu) in A. thaliana. Compared with the wild type (Col-0), Atcycb3;1-Mu showed the lower expression level (Figure 7A) and reduced seed size (Figure 7B). Specifically, the seed area, seed length and seed width were significantly lower than those of Col-0 plants (p < 0.001) (Figure 7C, Table S5). Moreover, Atcycb3;1-Mu did not exhibit obvious growth defects compared to Col-0 plants (Figure S1). These results suggested that CYCB3;1 is a positive regulator for seed growth.
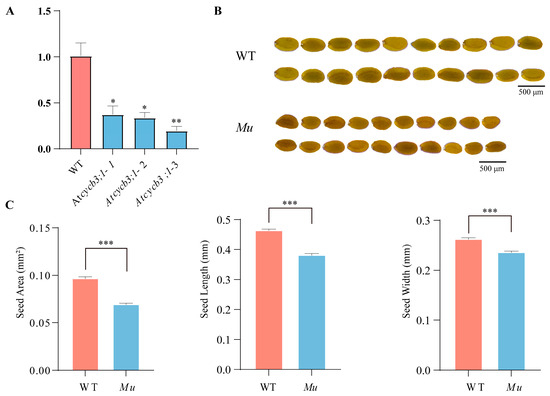
Figure 7.
Phenotypes of Col-0 and Atcycb3;1-Mu mutant Arabidopsis plants. (A) Relative normalized expression of Atcycb3;1-Mu mutants, * represents significant difference at the 0.05 probability level, ** represents significant difference at the 0.01 probability level; (B) comparison of seed size between Col-0 and Atcycb3;1-Mu; (C) statistical analysis of seed area, seed length, and seed width, *** represents significant difference at the 0.001 probability level. WT refers to wild-type Col-0 plants; Mu refers to Arabidopsis thaliana mutant Atcycb3;1-Mu.
3. Discussion
3.1. Characterization of the CYCB Gene Family
We identified 658 CYCB genes in 24 angiosperms. Consistent with previous studies [6,23,24], the plant CYCB genes could be separated into three groups, with all species having the fewest members in Group 3. We observed that the expansion and shrinkage of CYCB members occurred in terms of copy-number within B. napus accessions and among angiosperm species, corresponding with previous studies [24,25,26]. Some CYCB genes have been described previously in maize, soybean, and rice [6,24,27], but several new CYCB genes were identified in this study, possibly due to the different identification methods and accession genome sequences used. With a few exceptions, the orthologous genes within each subfamily shared similar gene structures and conserved protein motifs, but great differences were observed among subfamilies, implying functional conservation among homologous genes, as described in other species [24,25,26]. Although plants encode more CDKs and cyclins to interact together to form a potentially great number of combinations [1], the CYCB1 group forms the most active complexes with CDKB2;2 [19]. Group 3 actively binds with CDKB1;1, and Group 2 binds with CDKB1;2 [9], possibly due to the diversity in protein structures among subfamilies. Several studies have confirmed that MSA cis-acting elements regulate G2/M transcription in plants [21,28,29]. However, we did not predict MSA elements in this study, possibly because of the strict standards regarding the deletion of MSA elements from non-Brassicaceae species.
3.2. Evolutionary Relationships of CYCB Proteins
The CYCB1 and CYCB2 groups were presented before the split of monocots and eudicots and existed before the origin of seed plants [5]. This corresponds with our study, which showed that the CYCB1 and CYCB2 groups have representatives in both monocot and eudicot species. Interestingly, we found that Group 3 members only exist in eudicots, and there were only two ancient copies of CYCB (in Groups 1 and 2) presented in A. trichopoda−−the common ancestor of both monocots and eudicots. We speculate that an additional CYCB copy evolved in eudicots from Group 1, and two ancient CYCB copies were retained and evolved through gene duplication, resulting in the three extant groups in the examined eudicot plants (Figure 1C). A previous study reported that CYCB3;1 is the only B-type cyclin expressed in meiosis, and its proteins interacted together with SDS to control cell wall metabolism in pollen mother cells [30]. Similar to seed development processes in which Arabidopsis expresses more genes than barley [31], eudicots may express a more complex regulatory network relating to the evolution of CYCB3;1 in order to adapt to complex machinery. For example, pollen mother cells are nearly round and are large in volume in monocot plants but polygonal and more complex in eudicot plants [32,33]. In general, the three Brassica species showed a strong collinear relationship, because Brassica species had undergone whole-genome triplication (WGT), and B. napus was generated by the progenitor species of B. rapa and B. oleracea [34]. We think that WGT and duplications, along with the gene loss that occurred in some copies, may play an important role in CYCB evolution from two ancient copies in A. trichopoda to 25 copies in B. napus.
3.3. Expression Profile of CYCB Genes
The spatiotemporal expression pattern of genes can provide insight into potential functions. In this study, CYCB exhibited tissue- and stage-specific expression, which is in accordance with other studies [24,30]. The CYCB genes showed higher expression in the seedling period and rapidly proliferating organs (e.g., developing seed and silique pericarp), agreeing with their essential roles in mitotic cell cycle and/or mitotic growth [35]. Unlike in animals, plant organ size is largely influenced by cell number and depends on the rate of cell division, the number of dividing cells, and the duration of the division phase [16,36]. Different cell cycle types influence organ development and size. The link between cell size and cell cycle progression has been demonstrated in Arabidopsis and yeast [37,38,39]. Endoreduplication can enlarge plant cells up to hundreds or even thousands of times compared with the original size [10,11], while asymmetric cell divisions generate different cell fates [40]. Consistent with a previous study, the cycb3;1 mutants did not show defects during developing periods [30], but did exhibit significantly reduced seed sizes (p < 0.001), suggesting potential vales in increasing seed size. The knockdown of CYCB1;1 in rice likely results in the production of abnormal seeds containing only an enlarged embryo at maturity [41]. However, Group 3 members were downregulated compared with the other groups in this study, despite a report that Group 3 members are relatively conserved and play an important role in animals [42], possibly because they are more important for regulating meiosis than mitosis [43,44,45].
Salinity, moisture, and temperature are well-known factors influencing crops growth and crop yield as a result of cell proliferation and cell expansion. It has been proved that salt, drought, and cold stress severely decrease the expression of cyclins [46,47,48], which confirmed our results of the declined expression of BnaCYCB under stress and a great proportion of abiotic elements in their promoter regions. Moreover, a previous study suggested that plants could simultaneously suppress the expression of regulatory genes in the cell cycle under stress conditions [47]. The expression level of CYCB1;2 promoter activity is transiently decreased under 0.5% NaCl treatment in A. thaliana [49]. In rice, cold treatment suppresses the expression of OsCycB1;1, OsCycB2;1, and OsCycB2;2, but overexpressing OsCycB1;1 plants enhance resistance to cold stress [50]. Additionally, B-type cyclins show downregulation when being treated with SMP values of −309.9 kPa in rice [47]. We believe that plants have evolved a self-protecting mechanism though suppressing the expression level of cyclins under abiotic stress.
4. Materials and Methods
4.1. Data Resources
Genomic, coding, and proteomic sequences of A. thaliana and all B. napus accessions (including Dar, Express617, Gangan, Ningyou, NO.2127, Quinta, Shengli, Tapidor, Westar, Zheyou, and ZS11) were obtained from the Arabidopsis Information Resource (TAIR, http://www.arabidopsis.org, accessed on 23 November 2023) and the Brassica napus multi-omics information resource (BnIR, http://yanglab.hzau.edu.cn/BnIR, accessed on 23 November 2023), respectively. The sequences from B. rapa and B. oleracea were downloaded from the Brassicaceae Database (BRAD, http://brassicadb.org/brad, accessed on 28 November 2023). Those from Solanum lycopersicum, A. trichopoda, Gossypium raimondii, Glycine max, O. sativa, Zea mays, Sorghum bicolor, Setaria italica, Solanum tuberosum, Malus domestica, L. usitatissimum, Spinacia oleracea, Triticum aestivum, Saccharum officinarum, M. acuminata, A. comosus, Setaria viridis, and Panicum virgatum were retrieved from Phytozome 13.0 (https://phytozome-next.jgi.doe.gov, accessed on 19 February 2024), and those from Nicotiana tabacum and Capsicum annuum were retrieved from the Solanaceae Genomics Network (https://solgenomics.net/, accessed on 19 February 2024).
4.2. Identification of CYCB Genes
The CYCB genes in species were first retrieved using a reciprocal Basic Local Alignment Search Tool Protein (BLASTP) [51,52] at a threshold E-value of 1 × 10⁻⁵ and a minimum alignment coverage of 50% using 11 Arabidopsis CYCB proteins as query sequences [5]. Then, all filtered candidate proteins were used as queries using BLASTP analysis to search against the A. thaliana proteome database to investigate their corresponding orthologs at the threshold and minimum alignment coverage parameters described above. To accurately identify genes, all protein sequences were further analyzed in PfamScan (http://www.ebi.ac.uk/Tools/pfa/pfamscan/, accessed on 23 November 2023) to confirm the presence of cyclin-N domains. We named them according to homologous genes in A. thaliana.
4.3. Protein Sequence Analysis
The amino acids, protein molecular weight, theoretical isoelectric point, and average of hydropathicity were predicted using the ProtParam tool in ExPASy (http://web.expasy.org/protparam/, accessed on 1 December 2023) [53]. The TMHMM-2.0 tool (https://services.healthtech.dtu.dk/services/TMHMM-2.0/, accessed on 1 December 2023) [54] was used to predict the transmembrane transport peptides, and SignalP5.0 (http://www.cbs.dtu.dk/services/SignalP/, accessed on 1 December 2023) [55] was used to identify signal peptides, with default parameters. The subcellular locations of each protein were predicted with Plant-mPLoc (http://www.csbio.sjtu.edu.cn/bioinf/plant-multi/, accessed on 1 December 2023) [56] using default parameters.
4.4. Phylogenetic and Evolutionary Analysis
Multiple sequence alignment of CYCB protein sequences was conducted using Molecular Evolutionary Genetics Analysis (MUSCLE, University of Michigan, Ann Arbor, MI, USA) with default parameters [57]. Then, neighbor-joining (NJ) trees were constructed using Molecular Evolutionary Genetics Analysis11 (MEGA11, Tokyo Metropolitan University, Tokyo, Japan) [58], with the following parameters: p-distance + G substitution model and 1000 bootstrap replications.
To further understand the evolutionary relationships of the gene families, the collinearity information among A. thaliana and Brassicaceae species was obtained using the Multiple Collinearity Scan toolkit (MCScanX) [59] using the following parameters: match_score: MATCH_SIZE: 5, gap_penalty: −1, overlap_window: 5, E_value: 1 × 10⁻⁵, max_gaps: 25. Then, the CDS and protein sequences were used to calculate the synonymous mutation rate (Ks), non-synonymous mutation rate (Ka), and evolutionary constraint (Ka/Ks) in TBtools v2.082 (South China Agricultural University, Guangzhou, China) [60], where Ka/Ks < 1 indicates purifying selection, Ka/Ks = 1 indicates neutral selection, and Ka/Ks > 1 indicates positive selection.
4.5. Gene Structure, Protein Motif Identification, and Chromosomal Location Analysis
The Gene Structure Display Server (GSDS 2.0: https://gsds.gao-lab.org/, accessed on 1 December 2023) [61] was used to determine the exon/intron structures of the CYCB genes. The Multiple Expectation Maximization for Motif Elicitation program (MEME 4.12.0, https://meme-suite.org/meme/doc/download.html, accessed on 1 December 2023) [62] was used to identify conserved motifs in CYCB proteins from B. napus with the following parameter settings: the minimal and maximal motif widths were set to 6 and 200 amino acids, respectively, and the number of motifs was 15. Only motifs with an e-value of <1 × 10⁻¹⁰ were kept for further motif analysis (other parameters were set to default). Finally, the results of gene structure, protein motif, and chromosomal location were visualized using TBtools v2.082 [60].
4.6. Analysis of Promoter Cis-Acting Elements and Protein Interaction Networks
The 2000 bp upstream sequences of CYCB genes initiation codon were obtained with TBtools software v2.082 [60] and used for the prediction of cis-acting elements using the online tool PlantCARE (https://bioinformatics.psb.ugent.be/webtools/plantcare/html/, accessed on 12 January 2024) [63]. The STRING 12.0 database (http://www.string-db.org, accessed on 31 March 2024) [64] was used to investigate the interaction networks of 14 CYCB proteins, with a minimum required interaction score of 0.7, and the network was ranked using the cytoHubba plugin [65] and visualized by Cytoscape 3.7.0 (Institute for Systems Biology, Seattle, WA, USA) [66].
4.7. Expression Patterns in Tissues and Under Stress
The expression data of 10 tissue samples and under 11 biotic and abiotic stress were obtained from the BrassicaEDB database (https://biodb.swu.edu.cn/brassica/, accessed on 12 January 2024) [67] to explore the expression patterns of the CYCB genes. The tissues included the cotyledons, hypocotyls, and germinating radicle after 24, 48, and 72 h; the leaf and root in the seedling stage, initial flowering, and full bloom stage; the anther, stem, and stamen in the initial flowering stage and full bloom stage; and the seeds, silique pericarp, and flowers after 3, 5, 7, 10, 13, 19, 27, 35, and 43 days. The stresses included cold, heat, drought, NaCl, ammonium, nitrate, sodium silicate, Pi starvation, Leptosphaeria maculans, Leptosphaeria biglobosa, and Sclerotinia sclerotiorum. The tissue expression levels of the CYCBs were normalized by Log2 (FPKM+1), and stress expression was normalized using the Log2 fold change (the mean (FPKM+1) between the treatment and control), and heatmaps were visualized using Rstudio.
4.8. Plant Material and Culture Conditions
Seeds of A. thaliana ecotype Col-0 and AtCYCB3;1 T-DNA insertion mutant (Atcycb3;1-Mu) were obtained from AraShare (https://www.arashare.cn, accessed on 21 November 2023) and were cultivated in Southwest University, Chongqing, China (29°49′18″ N, 10°25′45″ E). All Arabidopsis seeds were firstly sown on half-strength Murashige and Skoog (MS) medium and then transplanted to a growth chamber using a peat-based soil mixture, Pindstrup 2 (Pindstrup, Ryomgaard, Denmark) when the fourth leaf emerged, where it was environmentally controlled with a light period from 8:00 a.m. to 10:00 p.m. at 22 °C, a dark period from 10:00 p.m. to 8:00 a.m. at 18 °C, 60% relative humidity, and 1.1 × 10⁻⁶ μmol m−2 s−1 light intensity.
4.9. DNA and RNA Extraction and Phenotypic Observation
The 21-day-old leaves of Atcycb3;1-Mu plants were collected for DNA extraction using the CTAB method [68], and then homozygous AtCYCB3;1-Mu mutants were screened and identified using the primers CYCB3;1 LP/LBb1.3 and LBb1.3/CYCB3;1 RP (Table S6). Total RNA was extracted from the leaves of 30-day-old seedlings of Arabidopsis Col-0 wildtype and Atcycb3;1-Mu, and first-strand cDNA was synthesized using a HiScript III RT SuperMix for qPCR kit (Vazyme, Nanjing, China) according to the manufacturer’s instructions. Quantitative real-time (qRT)-PCR reactions were performed as described in the MIQE guidelines [69] (Table S6), with three technical replicates for each sample. Relative expression levels were calculated using the 2∆∆Ct method, with Actin7 as the internal reference gene. The seed area, seed length and seed width were measured using ImageJ v1.53t software (National Institutes of Health, Bethesda, MD, USA).
4.10. Statistical Analysis
Values were expressed as means ± standard error, and statistically significant differences were determined using Student’s t-test: *, p < 0.05; **, p < 0.01; ***, p < 0.001. The results were displayed using GraphPad Prism 9.5 software (GraphPad Software, San Diego, CA, USA).
5. Conclusions
In this study, we identified and characterized CYCB family members in B. napus and evaluated the phylogenetic relationship of CYCB genes from 24 angiosperm species. Collinearity analysis suggested that BnaCYCB exhibited segmental duplication. The BnaCYCB genes tended to show higher expression levels in proliferating organs and were downregulated under abiotic stress. The A. thaliana mutant Atcycb3;1-Mu indicated a positive role of CYCB in seed growth.
Supplementary Materials
The following supporting information can be downloaded at: https://www.mdpi.com/article/10.3390/plants13121709/s1, Figure S1: Phenotypic observation of Arabidopsis thaliana mutant cycb3;1; Table S1: CYCB protein information in Brassicaceae; Table S2: CYCB protein information in 20 angiosperms; Table S3: FPKM values of BnaCYCB genes in 10 types of organs; Table S4: FC values (the mean (FPKM+1) between the treatment and control) of BnaCYCB genes under abiotic and biotic stress; Table S5: Figures for seed area, seed length, and seed width; Table S6: Primers used in this study.
Author Contributions
Conceptualization, Y.F.; methodology, Y.F.; formal analysis, M.L.; visualization, M.L.; writing—original draft, M.L.; writing—review and editing, Y.F.; validation, M.Z., B.M., and L.M. All authors have read and agreed to the published version of the manuscript.
Funding
This research was funded by Chongqing Municipal Training Program of Innovation and Entrepreneurship for Undergraduates (S202310635320).
Data Availability Statement
All data are contained within the article and its Supplementary Materials.
Conflicts of Interest
The authors declare that they have no conflicts of interest.
References
- Van Leene, J.; Boruc, J.; De Jaeger, G.; Russinova, E.; De Veylder, L. A kaleidoscopic view of the Arabidopsis core cell cycle interactome. Trends Plant Sci. 2011, 16, 141–150. [Google Scholar] [CrossRef] [PubMed]
- Evans, T.; Rosenthal, E.T.; Youngblom, J.; Distel, D.; Hunt, T. Cyclin: A protein specified by maternal mRNA in sea urchin eggs that is destroyed at each cleavage division. Cell 1983, 33, 389–396. [Google Scholar] [CrossRef] [PubMed]
- Inzé, D.; De Veylder, L. Cell cycle regulation in plant development. Annu. Rev. Genet. 2006, 40, 77–105. [Google Scholar] [CrossRef] [PubMed]
- Inagaki, S.; Umeda, M. Cell-cycle control and plant development. Int. Rev. Cell Mol. Biol. 2011, 291, 227–261. [Google Scholar] [CrossRef] [PubMed]
- Wang, G.; Kong, H.; Sun, Y.; Zhang, X.; Zhang, W.; Altman, N.; dePamphilis, C.W.; Ma, H. Genome-Wide Analysis of the Cyclin Family in Arabidopsis and Comparative Phylogenetic Analysis of Plant Cyclin-like Proteins. Plant Physiol. 2004, 135, 1084–1099. [Google Scholar] [CrossRef] [PubMed]
- La, H.; Li, J.; Ji, Z.; Cheng, Y.; Li, X.; Jiang, S.; Venkatesh, P.N.; Ramachandran, S. Genome-wide analysis of cyclin family in rice (Oryza sativa L.). Mol. Genet. Genom. 2006, 275, 374–386. [Google Scholar] [CrossRef] [PubMed]
- Sabelli, P.A.; Dante, R.A.; Leiva-Neto, J.T.; Jung, R.; Gordon-Kamm, W.J.; Larkins, B.A. RBR3, a member of the retinoblastoma-related family from maize, is regulated by. Proc. Natl. Acad. Sci. USA 2005, 102, 13005–13012. [Google Scholar] [CrossRef] [PubMed]
- Sabelli, P.A.; Larkins, B.A. Regulation and function of retinoblastoma-related plant genes. Plant Sci. 2009, 177, 540–548. [Google Scholar] [CrossRef]
- Komaki, S.; Sugimoto, K. Control of the plant cell cycle by developmental and environmental cues. Plant Cell Physiol. 2012, 53, 953–964. [Google Scholar] [CrossRef]
- Sugimoto-Shirasu, K.; Roberts, K. “Big it up”: Endoreduplication and cell-size control in plants. Curr. Opin. Plant Biol. 2003, 6, 544–553. [Google Scholar] [CrossRef]
- Tourdot, E.; Mauxion, J.P.; Gonzalez, N.; Chevalier, C. Endoreduplication in plant organogenesis: A means to boost fruit growth. J. Exp. Bot. 2023, 74, 6269–6284. [Google Scholar] [CrossRef]
- Nugent, J.H.A.; Alfa, C.E.; Young, T.; Hyams, J.S. Conserved structural motifs in cyclins identified by sequence-analysis. J. Cell Sci. 1991, 99, 669–674. [Google Scholar] [CrossRef]
- Rogers, S.; Wells, R.; Rechsteiner, M. Amino-acid-sequences common to rapidly degraded proteins—The pest hypothesis. Science 1986, 234, 364–368. [Google Scholar] [CrossRef]
- Glotzer, M.; Murray, A.W.; Kirschner, M.W. Cyclin is degraded by the ubiquitin pathway. Nature 1991, 349, 132–138. [Google Scholar] [CrossRef]
- Motta, M.R.; Schnittger, A. A microtubule perspective on plant cell division. Curr. Biol. 2021, 31, R547–R552. [Google Scholar] [CrossRef]
- Dante, R.A.; Larkins, B.A.; Sabelli, P.A. Cell cycle control and seed development. Front. Plant Sci. 2014, 5, 77144. [Google Scholar] [CrossRef]
- Shimotohno, A.; Aki, S.S.; Takahashi, N.; Umeda, M. Regulation of the Plant Cell Cycle in Response to Hormones and the Environment. Annu. Rev. Plant Biol. 2021, 72, 273–296. [Google Scholar] [CrossRef]
- Lee, J.; Das, A.; Yamaguchi, M.; Hashimoto, J.; Tsutsumi, N.; Uchimiya, H.; Umeda, M. Cell cycle function of a rice B2-type cyclin interacting with a B-type cyclin-dependent kinase. Plant J. 2003, 34, 417–425. [Google Scholar] [CrossRef]
- Romeiro Motta, M.; Zhao, X.A.; Pastuglia, M.; Belcram, K.; Roodbarkelari, F.; Komaki, M.; Harashima, H.; Komaki, S.; Kumar, M.; Bulankova, P.; et al. B1-type cyclins control microtubule organization during cell division in Arabidopsis. EMBO Rep. 2021, 23, e53995. [Google Scholar] [CrossRef] [PubMed]
- Sahu, G.; Panda, B.B.; Dash, S.K.; Chandra, T.; Shaw, B.P. Cell cycle events and expression of cell cycle regulators are determining factors in differential grain filling in rice spikelets based on their spatial location on compact panicles. Funct. Plant Biol. 2021, 48, 268–285. [Google Scholar] [CrossRef] [PubMed]
- Wang, L.X.; Zhang, S.; Zhang, Y.; Li, J.J.; Zhang, Y.H.; Zhou, D.D.; Li, C.; He, L.L.; Li, H.Y.; Wang, F.D.; et al. Integrative analysis of physiology, biochemistry and transcriptome reveals the mechanism of leaf size formation in Chinese cabbage (Brassica rapa L. ssp. pekinensis). Front. Plant Sci. 2023, 14, 1183398. [Google Scholar] [CrossRef] [PubMed]
- Group, T.A.P.; Chase, M.W.; Christenhusz, M.J.M.; Fay, M.F.; Byng, J.W.; Judd, W.S.; Soltis, D.E.; Mabberley, D.J.; Sennikov, A.N.; Soltis, P.S.; et al. An update of the Angiosperm Phylogeny Group classification for the orders and families of flowering plants: APG IV. Bot. J. Linn. Soc. 2016, 181, 1–20. [Google Scholar] [CrossRef]
- Jia, R.D.; Guo, C.C.; Xu, G.X.; Shan, H.Y.; Kong, H.Z. Evolution of the cyclin gene family in plants. J. Syst. Evol. 2014, 52, 651–659. [Google Scholar] [CrossRef]
- Meng, J.; Peng, M.; Yang, J.; Zhao, Y.; Hu, J.; Zhu, Y.; He, H. Genome-Wide Analysis of the Cyclin Gene Family and Their Expression Profile in Medicago truncatula. Int. J. Mol. Sci. 2020, 21, 9430. [Google Scholar] [CrossRef] [PubMed]
- Zhang, T.; Wang, X.; Lu, Y.; Cai, X.; Ye, Z.; Zhang, J. Genome-Wide Analysis of the Cyclin Gene Family in Tomato. Int. J. Mol. Sci. 2013, 15, 120–140. [Google Scholar] [CrossRef]
- Zulfiqar, S.; Zhao, T.; Liu, Y.; Wei, L.; Farooq, M.A.; Tabusam, J.; Zhao, J.; Chen, X.; Wang, Y.; Xuan, S.; et al. Genome-Wide Identification, Characterization, and Transcriptomic Analysis of the Cyclin Gene Family in Brassica rapa. Int. J. Mol. Sci. 2022, 23, 4017. [Google Scholar] [CrossRef]
- Hu, X.; Cheng, X.; Jiang, H.; Zhu, S.; Cheng, B.; Xiang, Y. Genome-wide analysis of cyclins in maize (Zea mays). Genet. Mol. Res. 2010, 9, 1490–1503. [Google Scholar] [CrossRef] [PubMed]
- Ito, M. Factors controlling cyclin B expression. Plant Mol. Biol. 2000, 43, 677–690. [Google Scholar] [CrossRef]
- Sumiya, N. Cis-acting elements involved in the G2/M-phase-specific transcription of the cyclin B gene in the unicellular alga Cyanidioschyzon merolae. J. Plant Res. 2021, 134, 1301–1310. [Google Scholar] [CrossRef]
- Bulankova, P.; Akimcheva, S.; Fellner, N.; Riha, K. Identification of Arabidopsis meiotic cyclins reveals functional diversification among plant cyclin genes. PLoS Genet. 2013, 9, e1003508. [Google Scholar] [CrossRef]
- Sreenivasulu, N.; Wobus, U. Seed-development programs: A systems biology-based comparison between dicots and monocots. Annu. Rev. Plant Biol. 2013, 64, 189–217. [Google Scholar] [CrossRef] [PubMed]
- Khan, K.A.; Ghramh, H.A. Pollen source preferences and pollination efficacy of honey bee, Apis mellifera (Apidae: Hymenoptera) on Brassica napus crop. J. King Saud. Univ. Sci. 2021, 33, 101487. [Google Scholar] [CrossRef]
- She, W.J.; Baroux, C. Chromatin dynamics in pollen mother cells underpin a common scenario at the somatic-to-reproductive fate transition of both the male and female lineages in Arabidopsis. Front. Plant Sci. 2015, 6, 139417. [Google Scholar] [CrossRef] [PubMed]
- Chalhoub, B.; Denoeud, F.; Liu, S.; Parkin, I.A.; Tang, H.; Wang, X.; Chiquet, J.; Belcram, H.; Tong, C.; Samans, B.; et al. Plant genetics. Early allopolyploid evolution in the post-Neolithic Brassica napus oilseed genome. Science 2014, 345, 950–953. [Google Scholar] [CrossRef] [PubMed]
- Hégarat, N.; Crncec, A.; Rodriguez, M.; Iturra, F.E.; Gu, Y.; Busby, O.; Lang, P.F.; Barr, A.R.; Bakal, C.; Kanemaki, M.T.; et al. Cyclin A triggers Mitosis either via the Greatwall kinase pathway or Cyclin B. Embo J. 2020, 39, e104419. [Google Scholar] [CrossRef] [PubMed]
- Mizukami, Y. A matter of size: Developmental control of organ size in plants. Curr. Opin. Plant Biol. 2001, 4, 533–539. [Google Scholar] [CrossRef] [PubMed]
- Nurse, P. Genetic control of cell size at cell division in yeast. Nature 1975, 256, 547–551. [Google Scholar] [CrossRef] [PubMed]
- Wood, E.; Nurse, P. Sizing up to divide: Mitotic cell-size control in fission yeast. Annu. Rev. Cell Dev. Biol. 2015, 31, 11–29. [Google Scholar] [CrossRef]
- D’Ario, M.; Sablowski, R. Cell Size Control in Plants. Annu. Rev. Genet. 2019, 53, 45–65. [Google Scholar] [CrossRef]
- Weimer, A.K.; Nowack, M.K.; Bouyer, D.; Zhao, X.; Harashima, H.; Naseer, S.; De Winter, F.; Dissmeyer, N.; Geldner, N.; Schnittger, A. Retinoblastoma related1 regulates asymmetric cell divisions in Arabidopsis. Plant Cell 2012, 24, 4083–4095. [Google Scholar] [CrossRef]
- Guo, J.; Wang, F.; Song, J.; Sun, W.; Zhang, X.S. The expression of Orysa;CycB1;1 is essential for endosperm formation and causes embryo enlargement in rice. Planta 2010, 231, 293–303. [Google Scholar] [CrossRef] [PubMed]
- Qiong, Y.; Hong, Y.U.; Qi, L.I. Genome-Wide Analysis of the Cyclin-Dependent Kinases(CDK) and Cyclin Family in Molluscs. J. Ocean. Univ. China 2021, 20, 1469–1482. [Google Scholar]
- Nguyen, T.B.; Manova, K.; Capodieci, P.; Lindon, C.; Bottega, S.; Wang, X.Y.; Refik-Rogers, J.; Pines, J.; Wolgemuth, D.J.; Koff, A. Characterization and expression of mammalian cyclin b3, a prepachytene meiotic cyclin. J. Biol. Chem. 2002, 277, 41960–41969. [Google Scholar] [CrossRef] [PubMed]
- van der Voet, M.; Lorson, M.A.; Srinivasan, D.G.; Bennett, K.L.; van den Heuvel, S.C. elegans mitotic cyclins have distinct as well as overlapping functions in chromosome segregation. Cell Cycle 2009, 8, 4091–4102. [Google Scholar] [CrossRef] [PubMed]
- Miles, D.C.; van den Bergen, J.A.; Sinclair, A.H.; Western, P.S. Regulation of the female mouse germ cell cycle during entry into meiosis. Cell Cycle 2010, 9, 408–418. [Google Scholar] [CrossRef] [PubMed]
- Qi, F.F.; Zhang, F.X. Cell Cycle Regulation in the Plant Response to Stress. Front. Plant Sci. 2020, 10, 498388. [Google Scholar] [CrossRef] [PubMed]
- Todaka, D.; Zhao, Y.; Yoshida, T.; Kudo, M.; Kidokoro, S.; Mizoi, J.; Kodaira, K.S.; Takebayashi, Y.; Kojima, M.; Sakakibara, H.; et al. Temporal and spatial changes in gene expression, metabolite accumulation and phytohormone content in rice seedlings grown under drought stress conditions. Plant J. 2017, 90, 61–78. [Google Scholar] [CrossRef] [PubMed]
- Zhao, X.; Zheng, Z.; Shang, Z.; Wang, J.; Cheng, R.; Qian, J. Climatic information recorded in stable carbon isotopes in tree rings of Cryptomeria fortunei, Tianmu Mountain, China. Dendrochronologia 2014, 32, 256–265. [Google Scholar] [CrossRef]
- West, G.; Inzé, D.; Beemster, G.T.S. Cell Cycle Modulation in the Response of the Primary Root of Arabidopsis to Salt Stress. Plant Physiol. 2004, 135, 1050–1058. [Google Scholar] [CrossRef]
- Ma, Q.; Dai, X.; Xu, Y.; Guo, J.; Liu, Y.; Chen, N.; Xiao, J.; Zhang, D.; Xu, Z.; Zhang, X.; et al. Enhanced Tolerance to Chilling Stress in OsMYB3R-2 Transgenic Rice Is Mediated by Alteration in Cell Cycle and Ectopic Expression of Stress Genes. Plant Physiol. 2009, 150, 244–256. [Google Scholar] [CrossRef]
- Altschul, S.F.; Gish, W.; Miller, W.; Myers, E.W.; Lipman, D.J. Basic local alignment search tool. J. Mol. Biol. 1990, 215, 403–410. [Google Scholar] [CrossRef] [PubMed]
- Altschul, S.F.; Madden, T.L.; Schäffer, A.A.; Zhang, J.; Zhang, Z.; Miller, W.; Lipman, D.J. Gapped BLAST and PSI-BLAST: A new generation of protein database search programs. Nucleic Acids Res. 1997, 25, 3389–3402. [Google Scholar] [CrossRef] [PubMed]
- Gasteiger, E.; Gattiker, A.; Hoogland, C.; Ivanyi, I.; Appel, R.D.; Bairoch, A. ExPASy: The proteomics server for in-depth protein knowledge and analysis. Nucleic Acids Res. 2003, 31, 3784–3788. [Google Scholar] [CrossRef] [PubMed]
- Krogh, A.; Larsson, B.; von Heijne, G.; Sonnhammer, E.L. Predicting transmembrane protein topology with a hidden Markov model: Application to complete genomes. J. Mol. Biol. 2001, 305, 567–580. [Google Scholar] [CrossRef] [PubMed]
- Almagro Armenteros, J.J.; Tsirigos, K.D.; Sønderby, C.K.; Petersen, T.N.; Winther, O.; Brunak, S.; von Heijne, G.; Nielsen, H. SignalP 5.0 improves signal peptide predictions using deep neural networks. Nat. Biotechnol. 2019, 37, 420–423. [Google Scholar] [CrossRef] [PubMed]
- Chou, K.C.; Shen, H.B. Plant-mPLoc: A top-down strategy to augment the power for predicting plant protein subcellular localization. PLoS ONE 2010, 5, e11335. [Google Scholar] [CrossRef] [PubMed]
- Edgar, R.C. MUSCLE: Multiple sequence alignment with high accuracy and high throughput. Nucleic Acids Res. 2004, 32, 1792–1797. [Google Scholar] [CrossRef] [PubMed]
- Tamura, K.; Stecher, G.; Kumar, S. MEGA11: Molecular Evolutionary Genetics Analysis Version 11. Mol. Biol. Evol. 2021, 38, 3022–3027. [Google Scholar] [CrossRef] [PubMed]
- Wang, Y.; Tang, H.; Debarry, J.D.; Tan, X.; Li, J.; Wang, X.; Lee, T.H.; Jin, H.; Marler, B.; Guo, H.; et al. MCScanX: A toolkit for detection and evolutionary analysis of gene synteny and collinearity. Nucleic Acids Res. 2012, 40, e49. [Google Scholar] [CrossRef]
- Chen, C.; Chen, H.; Zhang, Y.; Thomas, H.R.; Frank, M.H.; He, Y.; Xia, R. TBtools: An Integrative Toolkit Developed for Interactive Analyses of Big Biological Data. Mol. Plant 2020, 13, 1194–1202. [Google Scholar] [CrossRef]
- Hu, B.; Jin, J.; Guo, A.Y.; Zhang, H.; Luo, J.; Gao, G. GSDS 2.0: An upgraded gene feature visualization server. Bioinformatics 2015, 31, 1296–1297. [Google Scholar] [CrossRef] [PubMed]
- Bailey, T.L.; Williams, N.; Misleh, C.; Li, W.W. MEME: Discovering and analyzing DNA and protein sequence motifs. Nucleic Acids Res. 2006, 34, W369–W373. [Google Scholar] [CrossRef] [PubMed]
- Lescot, M.; Déhais, P.; Thijs, G.; Marchal, K.; Moreau, Y.; Van de Peer, Y.; Rouzé, P.; Rombauts, S. PlantCARE, a database of plant cis-acting regulatory elements and a portal to tools for in silico analysis of promoter sequences. Nucleic Acids Res. 2002, 30, 325–327. [Google Scholar] [CrossRef] [PubMed]
- Szklarczyk, D.; Kirsch, R.; Koutrouli, M.; Nastou, K.; Mehryary, F.; Hachilif, R.; Gable, A.L.; Fang, T.; Doncheva, N.T.; Pyysalo, S.; et al. The STRING database in 2023: Protein-protein association networks and functional enrichment analyses for any sequenced genome of interest. Nucleic Acids Res. 2023, 51, D638–D646. [Google Scholar] [CrossRef] [PubMed]
- Chin, C.H.; Chen, S.H.; Wu, H.H.; Ho, C.W.; Ko, M.T.; Lin, C.Y. cytoHubba: Identifying hub objects and sub-networks from complex interactome. BMC Syst. Biol. 2014, 8 (Suppl. 4), S11. [Google Scholar] [CrossRef] [PubMed]
- Shannon, P.; Markiel, A.; Ozier, O.; Baliga, N.S.; Wang, J.T.; Ramage, D.; Amin, N.; Schwikowski, B.; Ideker, T. Cytoscape: A software environment for integrated models of biomolecular interaction networks. Genome Res. 2003, 13, 2498–2504. [Google Scholar] [CrossRef] [PubMed]
- Chao, H.; Li, T.; Luo, C.; Huang, H.; Ruan, Y.; Li, X.; Niu, Y.; Fan, Y.; Sun, W.; Zhang, K.; et al. BrassicaEDB: A Gene Expression Database for Brassica Crops. Int. J. Mol. Sci. 2020, 21, 5831. [Google Scholar] [CrossRef] [PubMed]
- Porebski, S.; Bailey, L.G.; Baum, B.R. Modification of a CTAB DNA extraction protocol for plants containing high polysaccharide and polyphenol components. Plant Mol. Biol. Rep. 1997, 15, 8–15. [Google Scholar] [CrossRef]
- Bustin, S.A.; Benes, V.; Garson, J.A.; Hellemans, J.; Huggett, J.; Kubista, M.; Mueller, R.; Nolan, T.; Pfaffl, M.W.; Shipley, G.L.; et al. The MIQE guidelines: Minimum information for publication of quantitative. Clin. Chem. 2009, 55, 611–622. [Google Scholar] [CrossRef]
Disclaimer/Publisher’s Note: The statements, opinions and data contained in all publications are solely those of the individual author(s) and contributor(s) and not of MDPI and/or the editor(s). MDPI and/or the editor(s) disclaim responsibility for any injury to people or property resulting from any ideas, methods, instructions or products referred to in the content. |
© 2024 by the authors. Licensee MDPI, Basel, Switzerland. This article is an open access article distributed under the terms and conditions of the Creative Commons Attribution (CC BY) license (https://creativecommons.org/licenses/by/4.0/).

