
Effects of High Salinity and Water Stress on Wetland Grasses from the Spanish Mediterranean Coast

 ,
,  , ,
, ,  and
and
Abstract
:1. Introduction
2. Results
2.1. Effect of High Salinity and Water Stress Treatments on Plant Biomass
2.2. Photosynthetic Pigments
2.3. Ion Contents
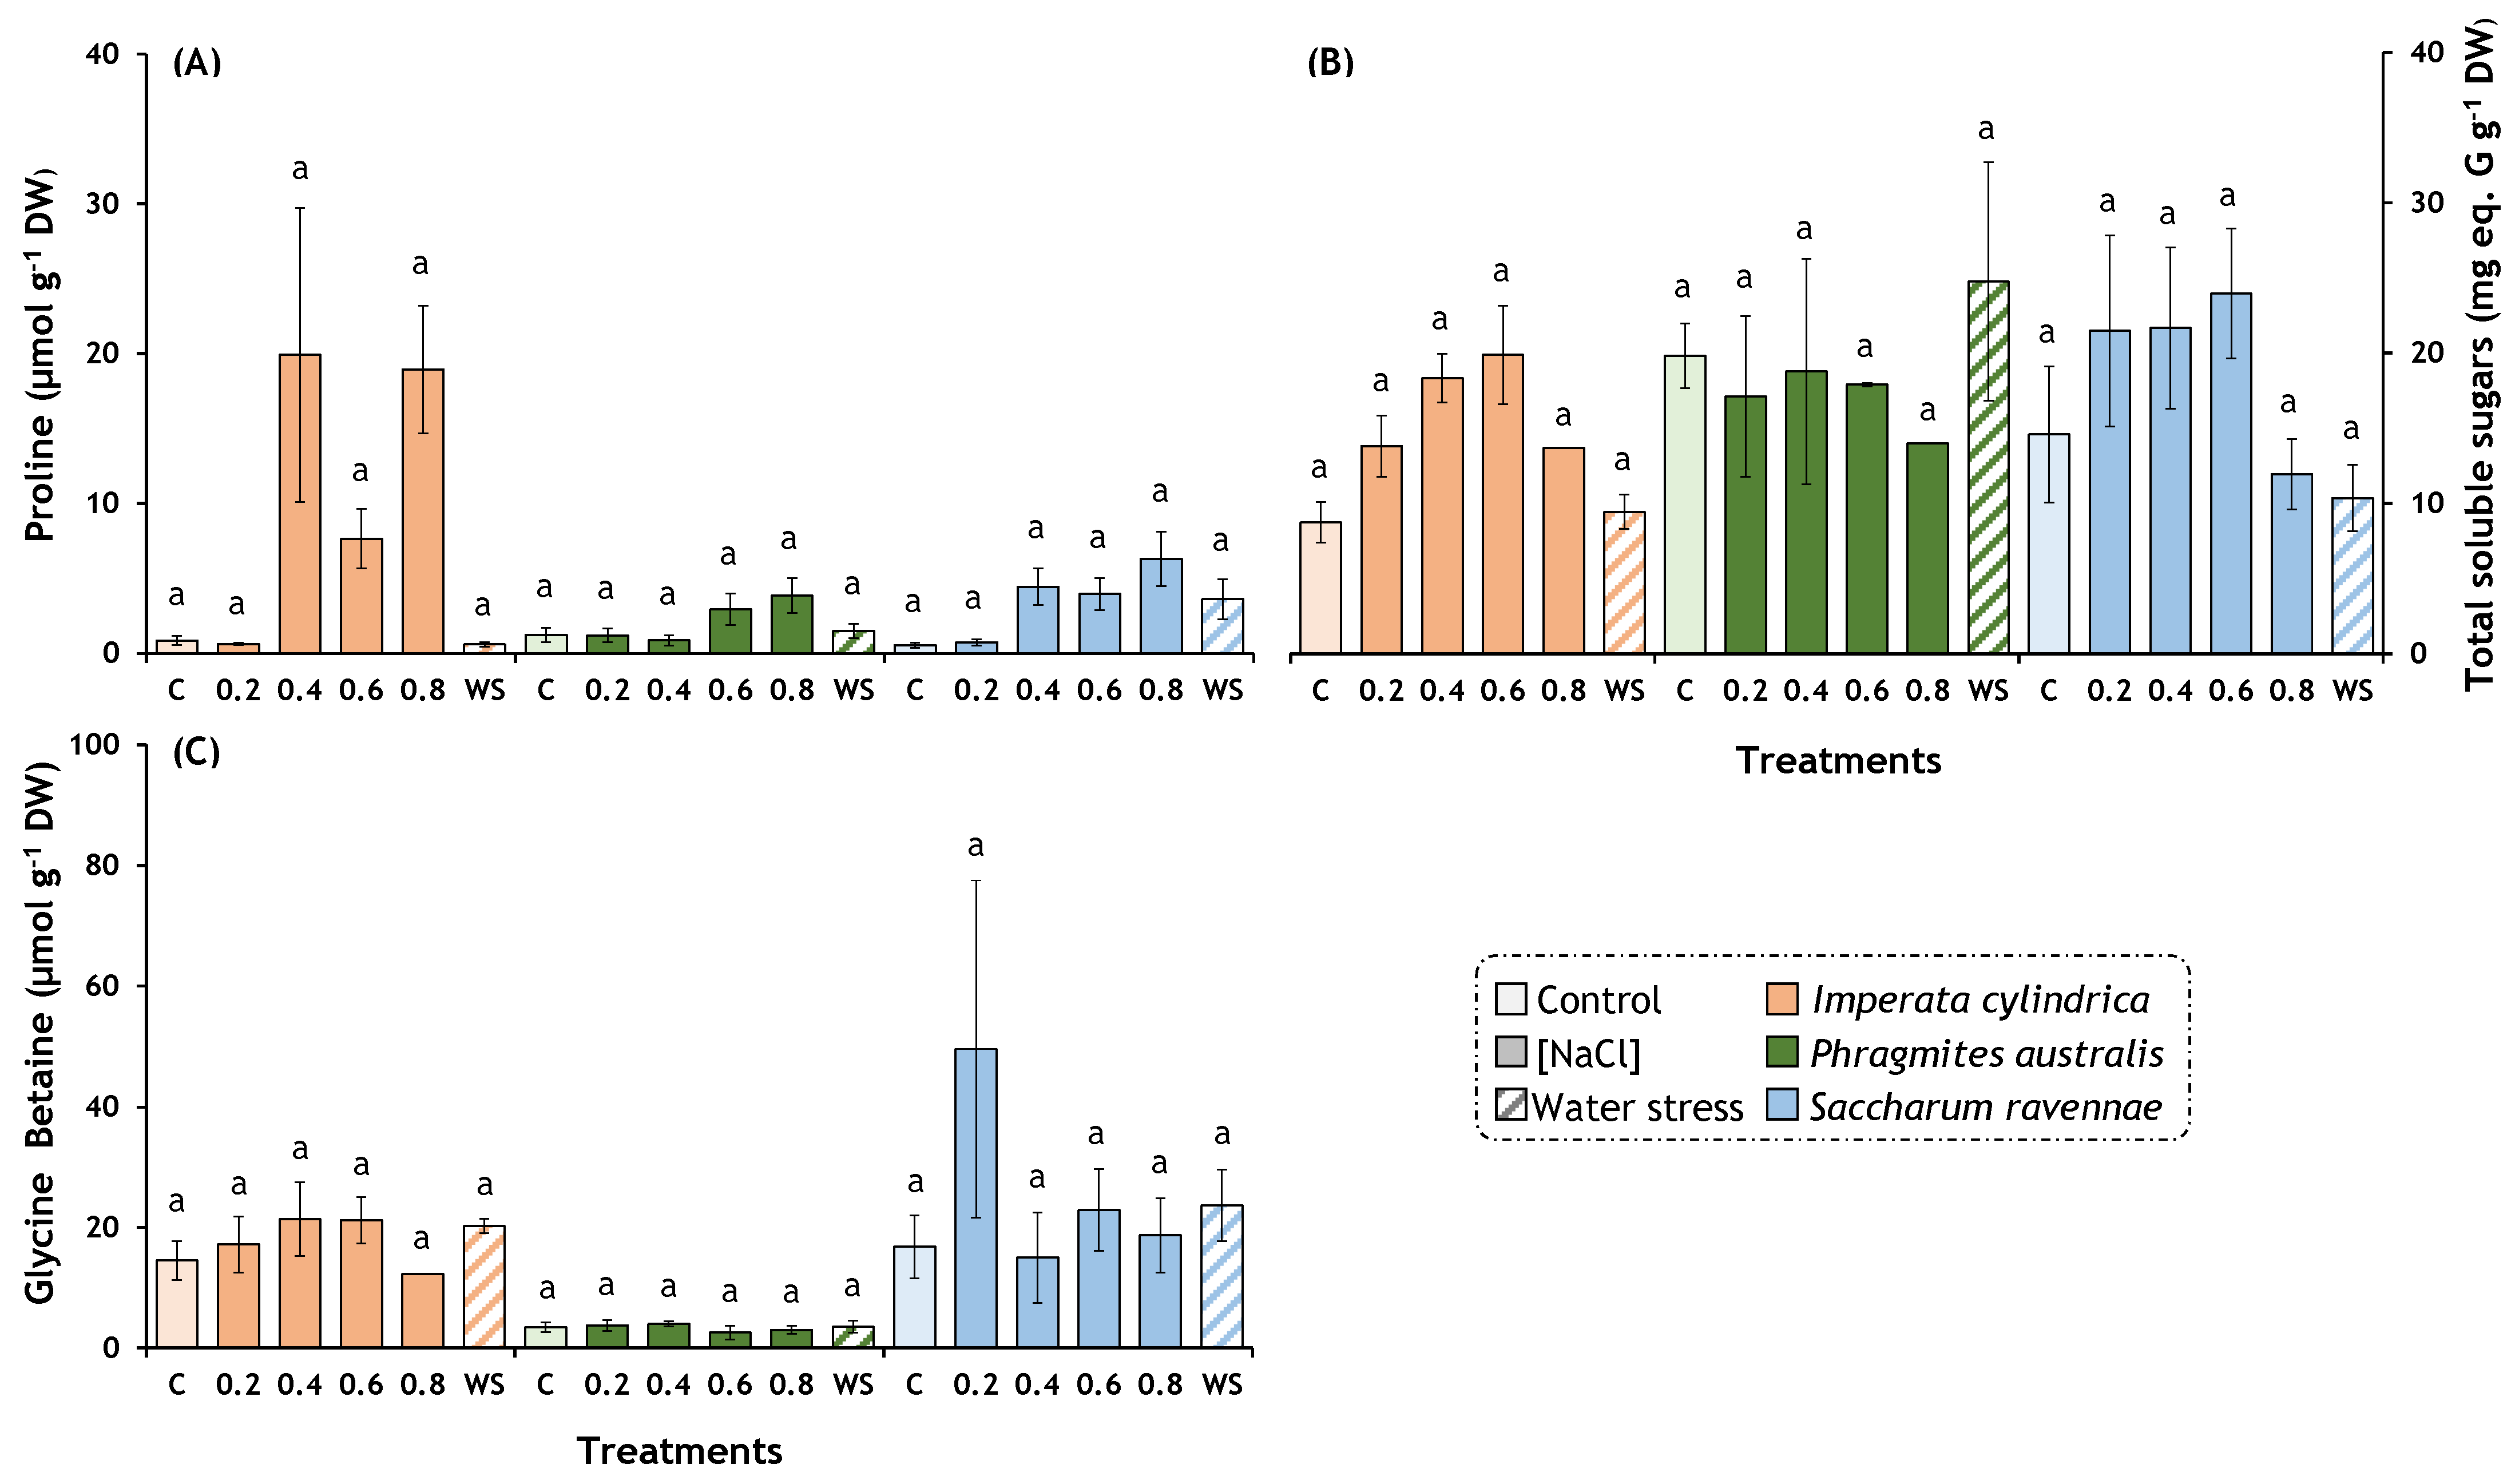
2.4. Osmolytes
2.5. Oxidative Stress Biomarkers and Antioxidant Compounds
2.6. Quantification of Mycorrhiza
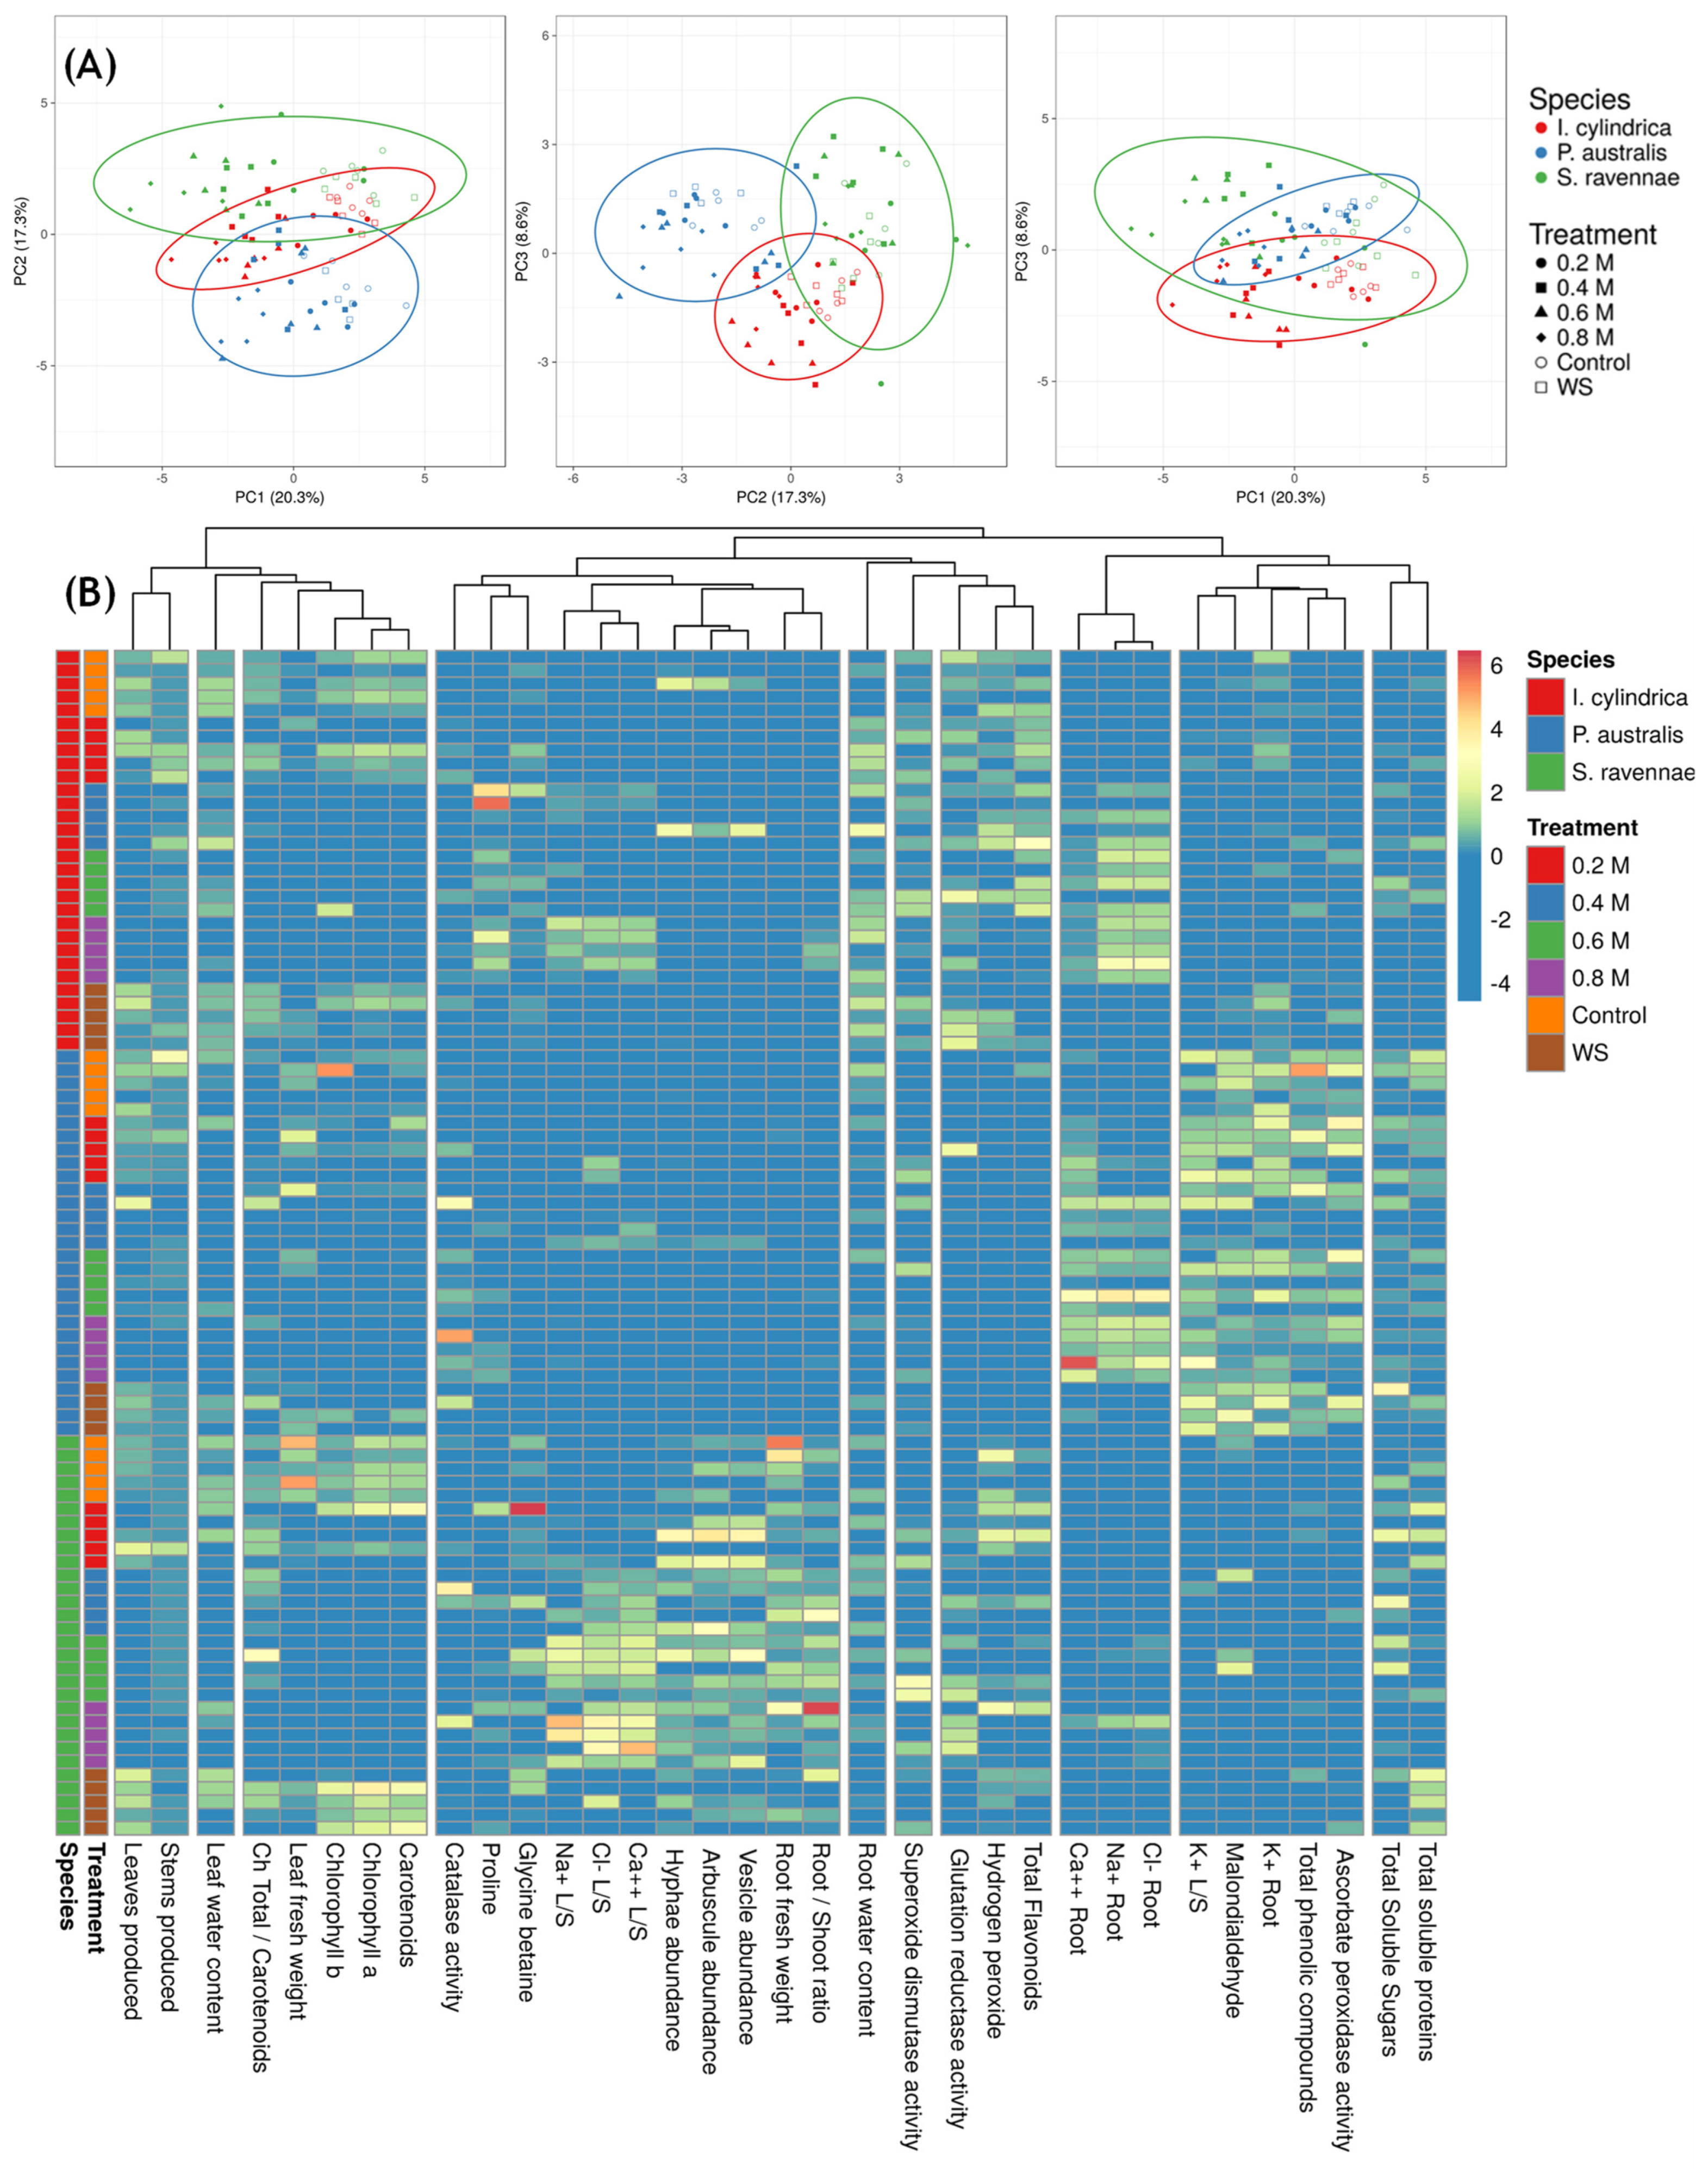
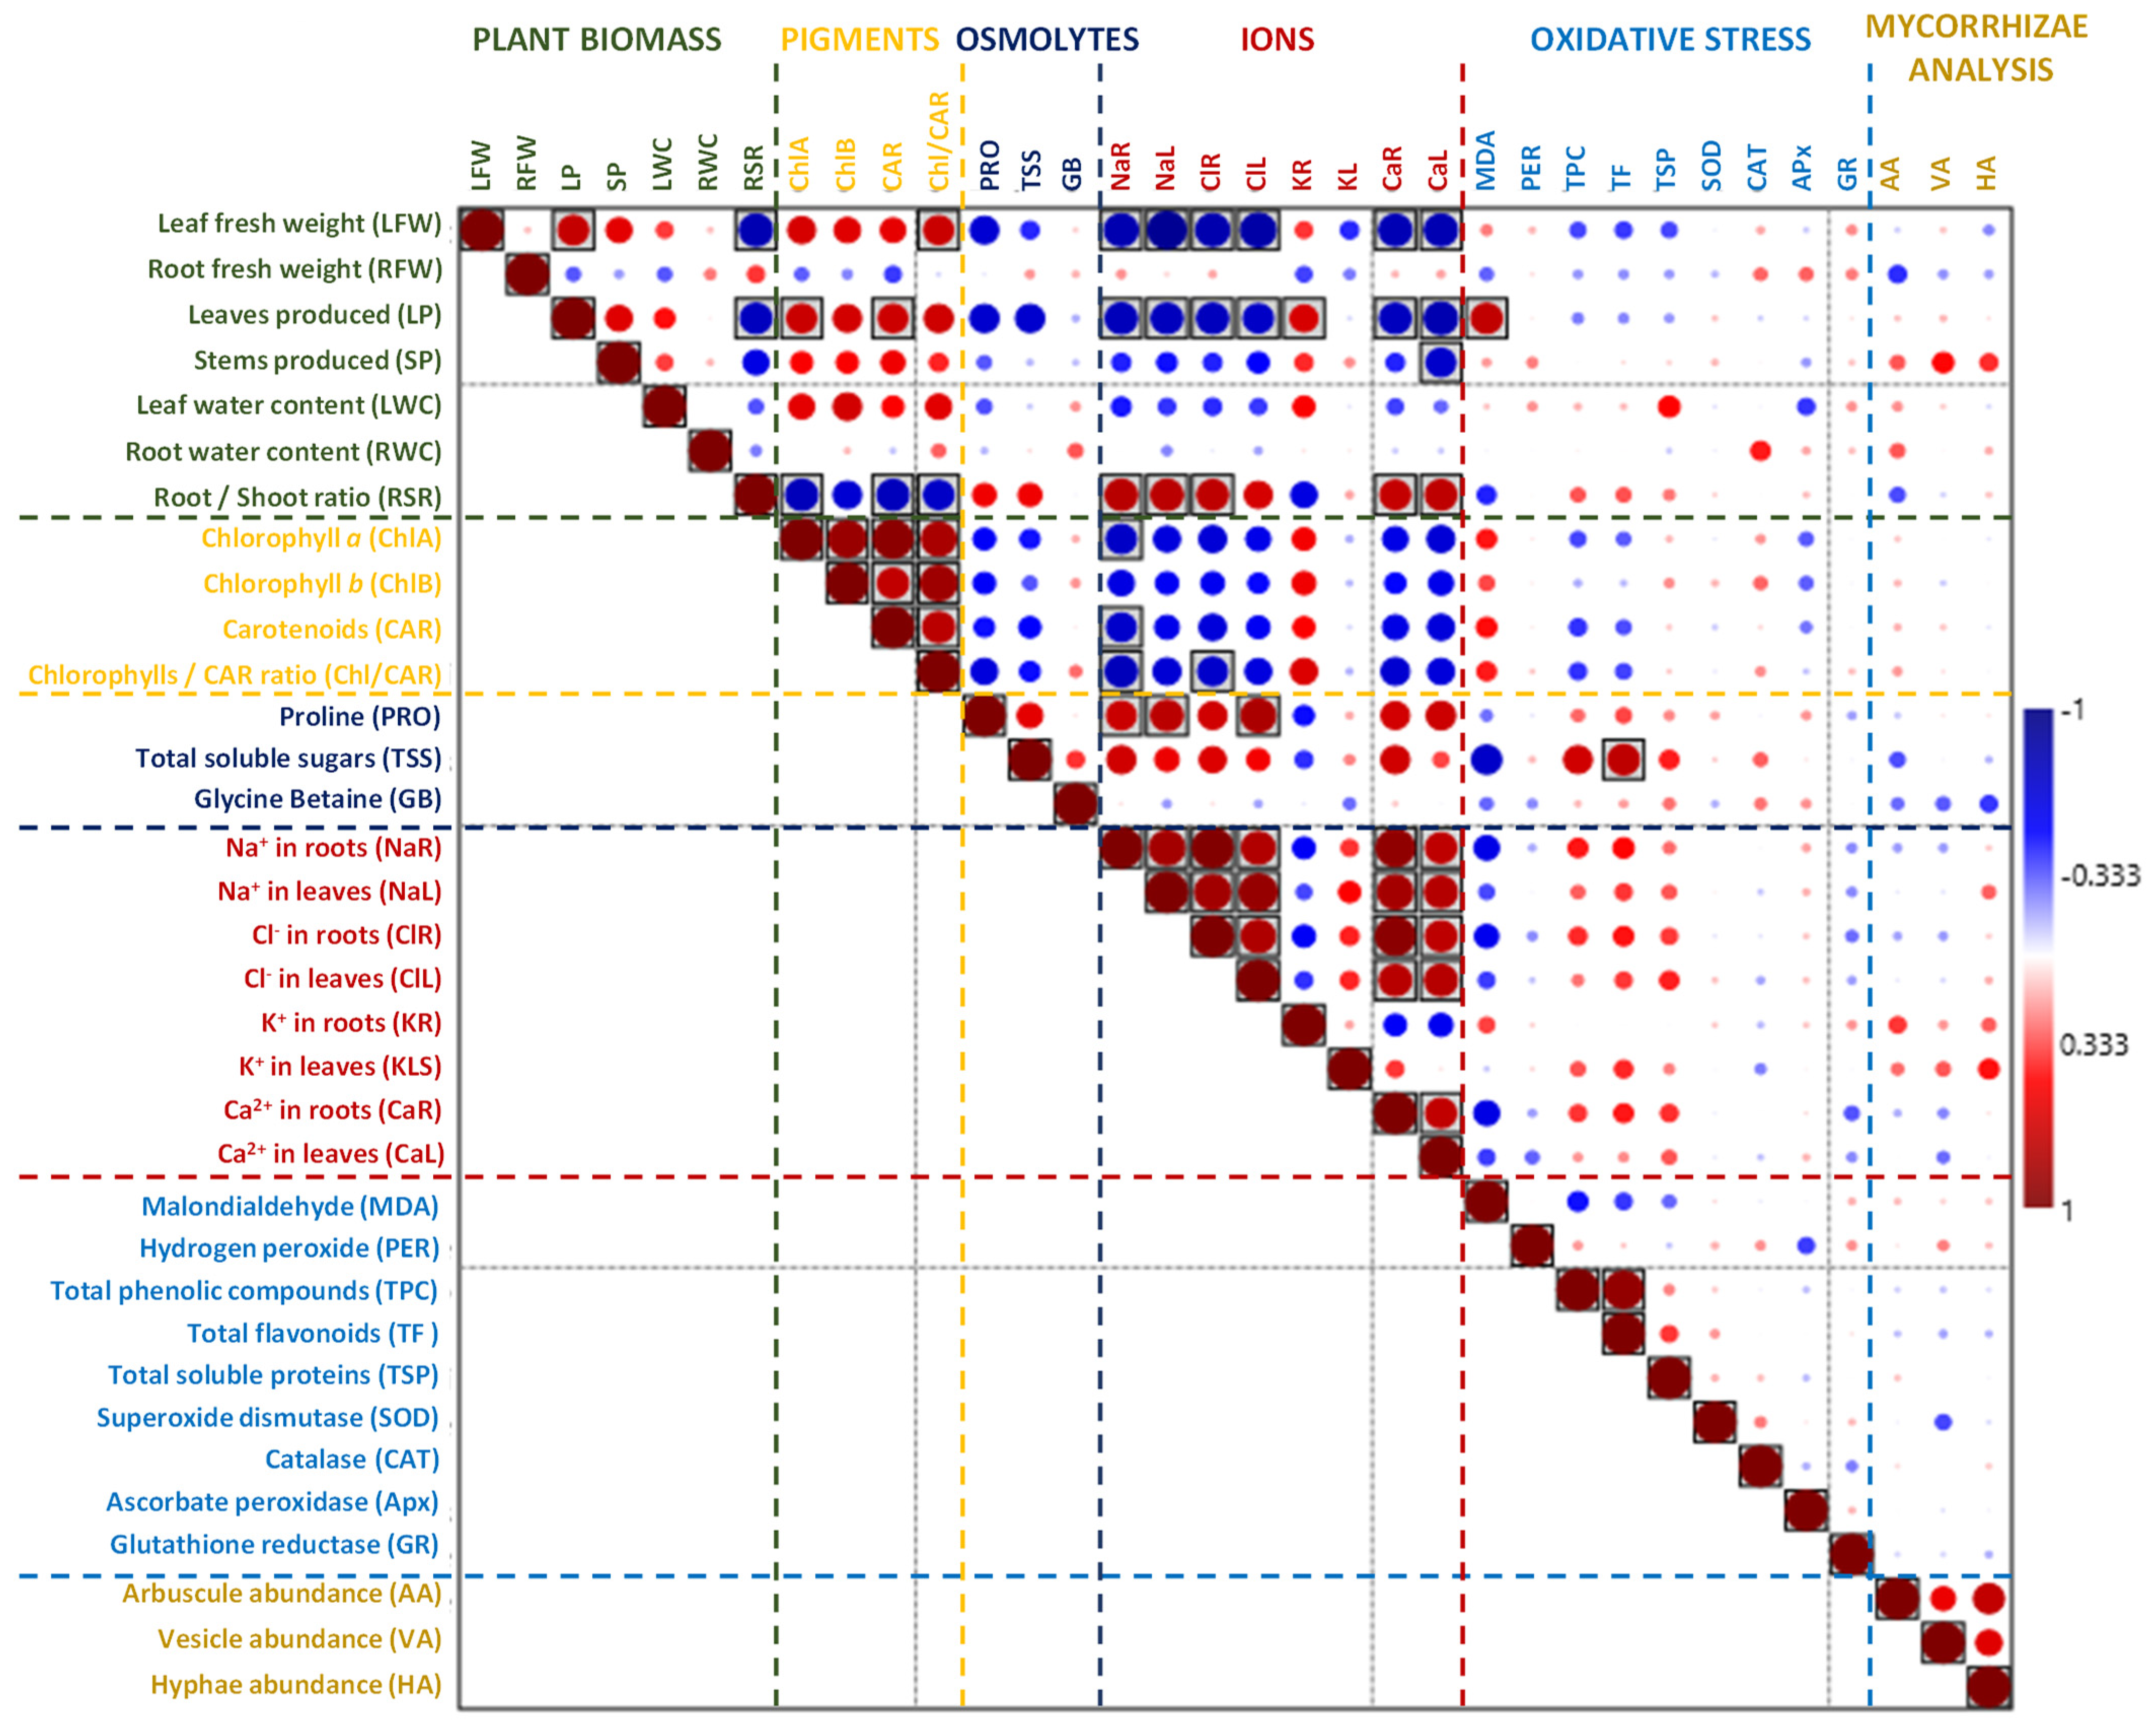
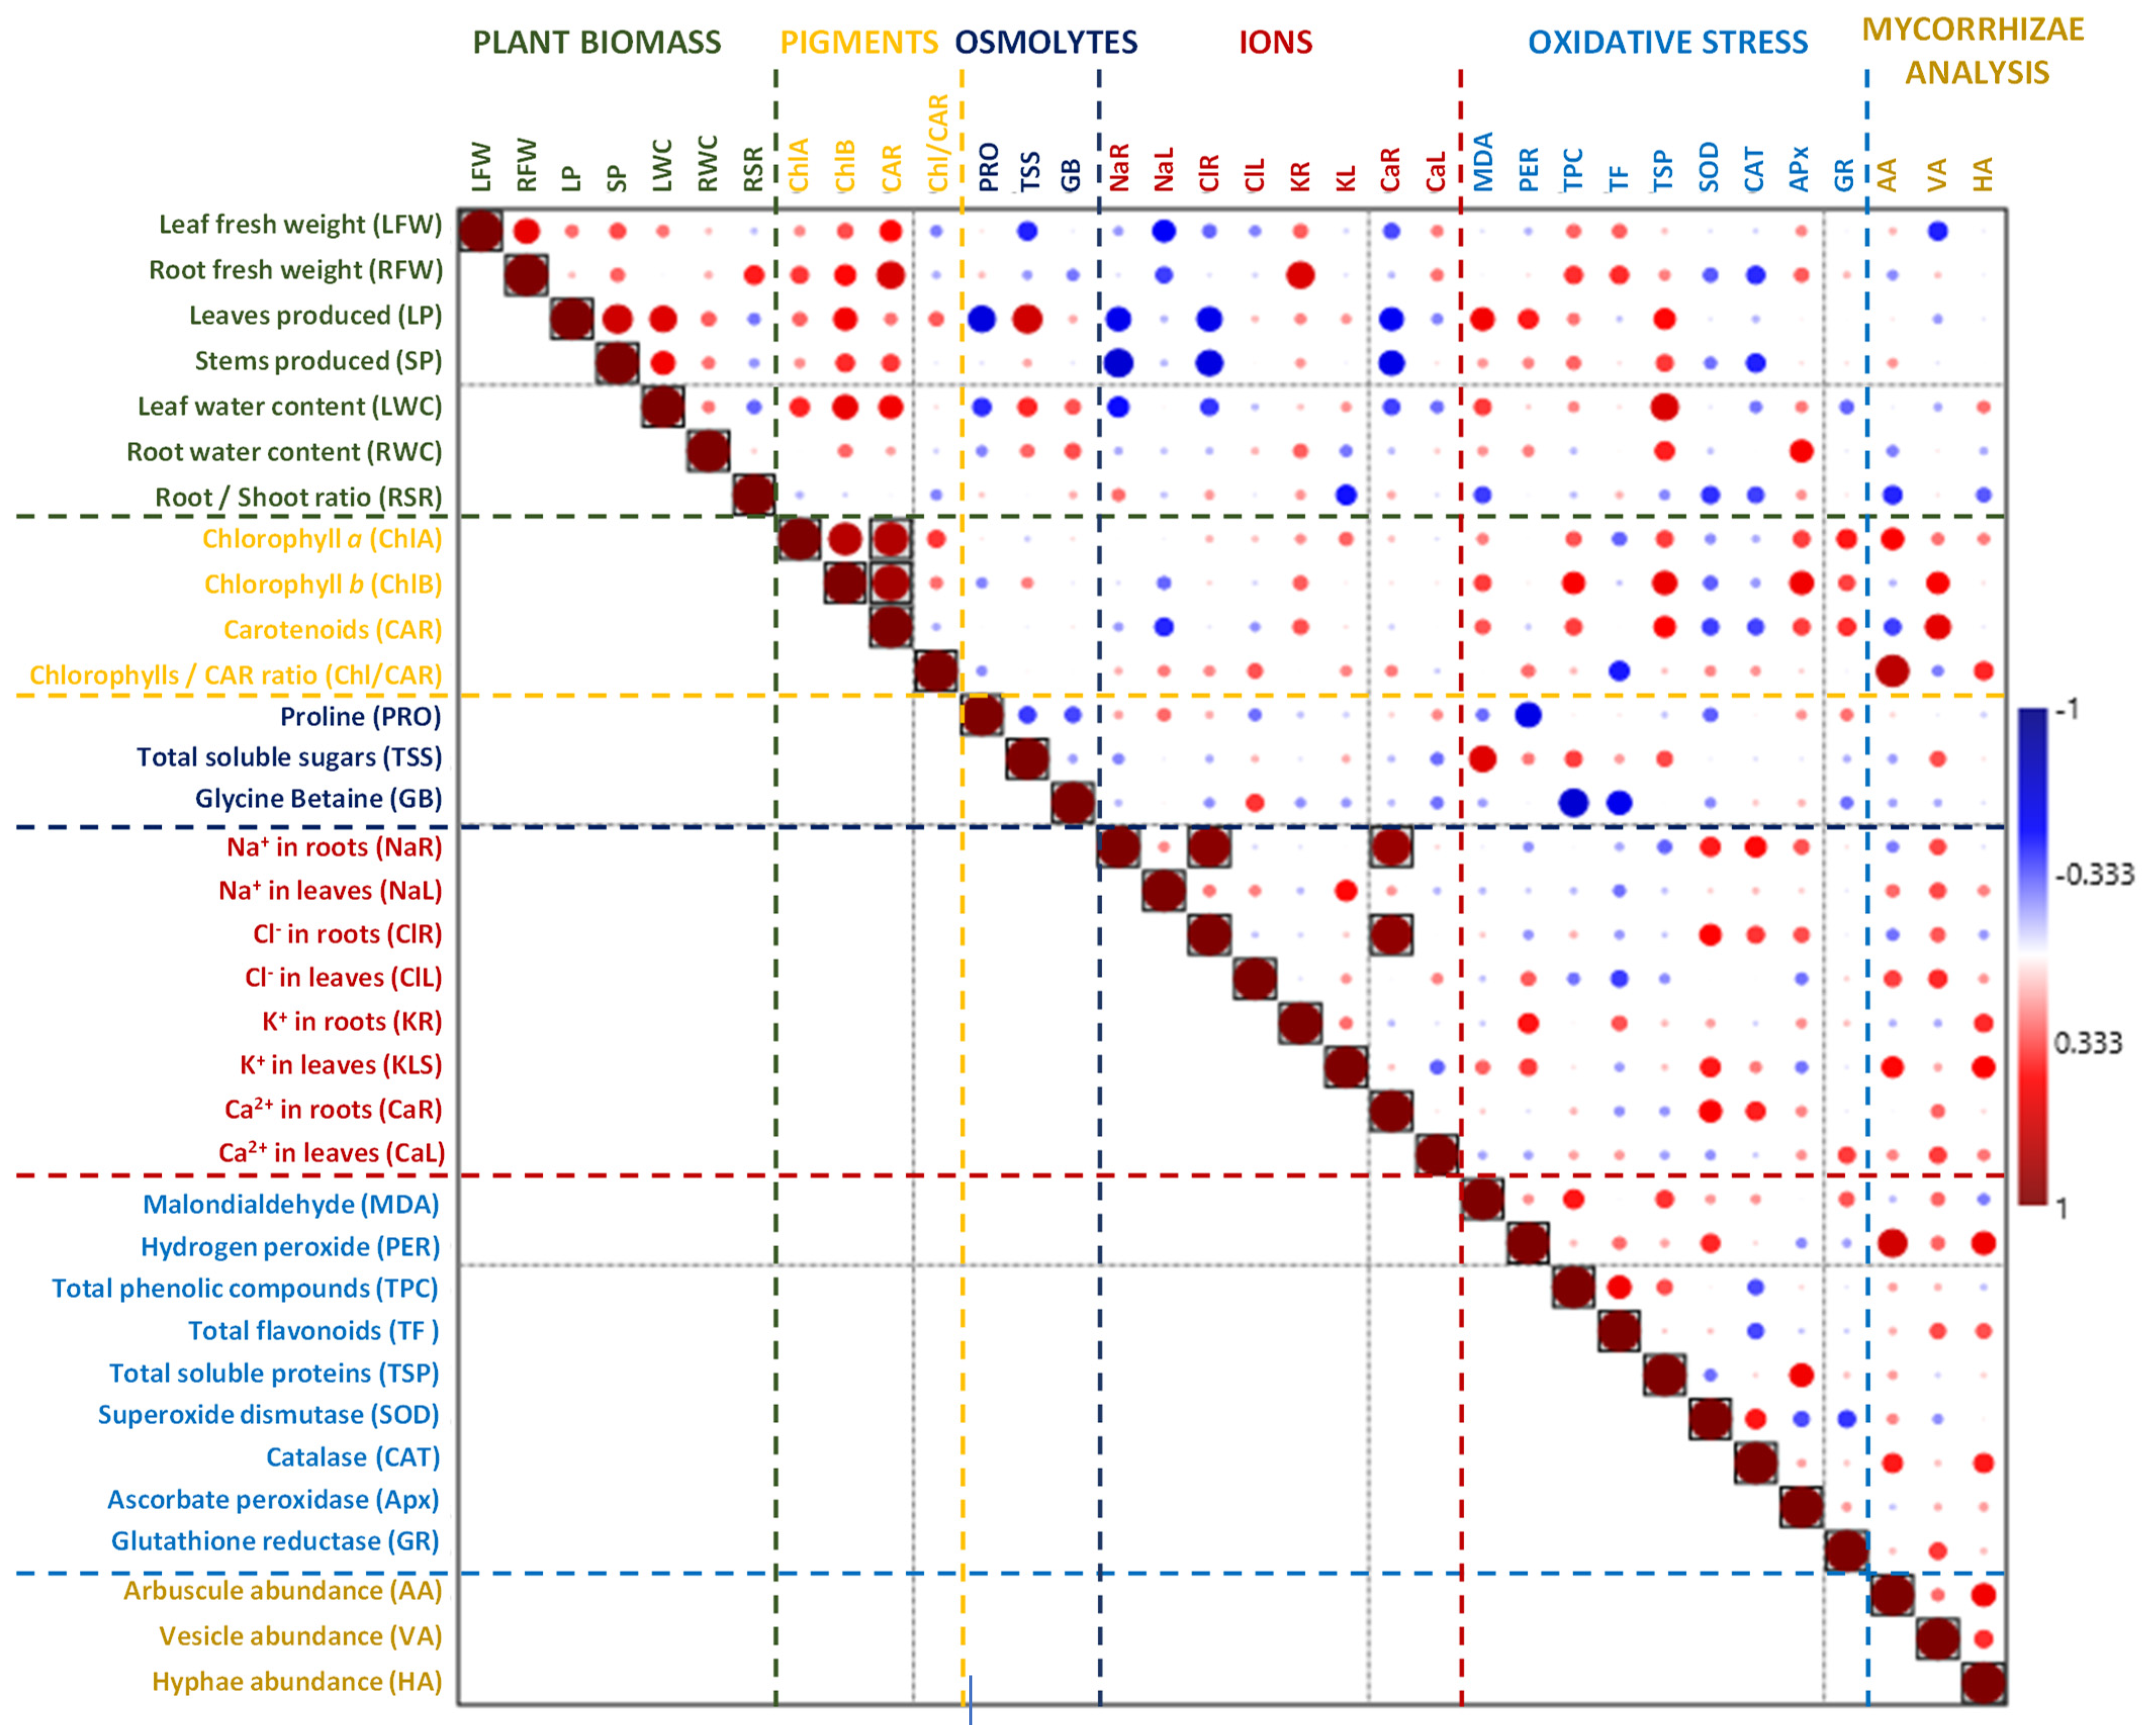
2.7. Principal Component and Correlation Analyses
3. Discussion
4. Materials and Methods
4.1. Plant Material, Location, and Cultivation
4.2. Growth Parameters
4.3. Biochemical Analysis of Stress Markers
4.4. Photosynthetic Pigments
4.5. Ion Contents
4.6. Osmolytes
4.7. Oxidative Stress Biomarkers and Antioxidant Compounds
4.8. Antioxidant Enzyme Activities
4.9. Root Staining and Quantification of Mycorrhiza
4.10. Statistical Analysis
5. Conclusions
Author Contributions
Funding
Data Availability Statement
Acknowledgments
Conflicts of Interest
References
- Herbert, E.R.; Boon, P.; Burgin, A.J.; Neubauer, S.C.; Franklin, R.B.; Ardón, M.; Hopfensperger, K.N.; Lamers, L.P.M.; Gell, P. A global perspective on wetland salinization: Ecological consequences of a growing threat to freshwater wetlands. Ecosphere 2015, 6, 1–43. [Google Scholar] [CrossRef]
- White, E.; Kaplan, D. Restore or Retreat? Saltwater Intrusion and Water Management in Coastal Wetlands. Ecosyst. Health Sustain. 2017, 3, e01258. [Google Scholar] [CrossRef]
- Perry, J.E.; Hershner, C.H. Temporal Changes in the Vegetation Pattern in a Tidal Freshwater Marsh. Wetlands 1999, 19, 90–99. [Google Scholar] [CrossRef]
- Costanza, R.; d’Arge, R.; De Groot, R.; Farber, S.; Grasso, M.; Hannon, B.; Limburg, K.; Naeem, S.; O’Neill, R.V.; Paruelo, J.; et al. The Value of the World’s Ecosystem Services and Natural Capital. Nature 1997, 387, 253–260. [Google Scholar] [CrossRef]
- Barbier, E.B.; Hacker, S.D.; Kennedy, C.; Koch, E.W.; Stier, A.C.; Silliman, B.R. The Value of Estuarine and Coastal Ecosystem Services. Ecol. Monogr. 2011, 81, 169–193. [Google Scholar] [CrossRef]
- Rawat, U.S.; Agarwal, N.K. Biodiversity: Concept, Threats and Conservation. Environ. Conserv. J. 2015, 16, 19–28. [Google Scholar] [CrossRef]
- Barker, J.R.; Tingey, D.T. Air Pollution Effects on Biodiversity, 3rd ed.; Springer Science & Business Media: New York, NY, USA, 1992; pp. 154–196. [Google Scholar] [CrossRef]
- Li, C.; Wang, H.; Liao, X.; Xiao, R.; Liu, K.; Bai, J.; Li, B.; He, Q. Heavy Metal Pollution in Coastal Wetlands: A Systematic Review of Studies Globally Over the Past Three Decades. J. Hazard. Mater. 2022, 424, 127312. [Google Scholar] [CrossRef]
- Charles, H.; Dukes, J.S. Impacts of invasive species on ecosystem services. In Biological Invasions; Nentwig, W., Ed.; Springer: Berlin/Heidelberg, Germany, 2007; pp. 217–237. [Google Scholar] [CrossRef]
- Koh, L.P.; Kettle, C.J.; Sheil, D.; Lee, T.M.; Giam, X.; Gibson, L.G.; Clement, G.R. Biodiversity state and trends in Southeast Asia. In Encyclopedia of Biodiversity, 2nd ed.; Levin, S., Ed.; Academic Press: Amsterdam, The Netherlands, 2013; pp. 509–527. [Google Scholar] [CrossRef]
- Gedan, K.B.; Silliman, B.R.; Bertness, M.D. Centuries of Human-Driven Change in Salt Marsh Ecosystems. Annu. Rev. Mar. Sci. 2009, 1, 117–141. [Google Scholar] [CrossRef]
- Harley, C.D.G.; Hughes, A.R.; Hultgren, K.M.; Miner, B.G.; Sorte, C.J.B.; Thornber, C.S.; Rodriguez, L.F.; Tomanek, L.; Williams, S.L. The Impacts of Climate Change in Coastal Marine Systems. Ecol. Lett. 2006, 9, 228–241. [Google Scholar] [CrossRef]
- He, Q.; Silliman, B.R. Climate change, human impacts, and coastal ecosystems in the Anthropocene. Curr. Biol. 2019, 29, R1021–R1035. [Google Scholar] [CrossRef]
- Boyer, J.S. Plant Productivity and Environment. Science 1982, 218, 443–448. [Google Scholar] [CrossRef]
- Davis, S.D.; Heywood, V. Centres of Plant Diversity: A Guide and Strategy for Their Conservation, 3rd ed.; IUCN: Cambridge, UK, 1994. [Google Scholar]
- Aedo, C.; Medina, L.; Fernández-Albert, M. Species Richness and Endemicity in the Spanish Vascular Flora. Nord. J. Bot. 2013, 31, 478–488. [Google Scholar] [CrossRef]
- Sutter, L.A.; Chambers, R.M.; Perry III, J.E. Seawater Intrusion Mediates Species Transition in Low Salinity, Tidal Marsh Vegetation. Aquat. Bot. 2015, 122, 32–39. [Google Scholar] [CrossRef]
- Adams, D.A. Factors Influencing Vascular Plant Zonation in North Carolina Salt Marshes. Ecology 1963, 44, 445–456. [Google Scholar] [CrossRef]
- Watt, S.C.L.; García-Berthou, E.; Vilar, L. The Influence of Water Level and Salinity on Plant Assemblages of a Seasonally Flooded Mediterranean Wetland. Plant Ecol. 2007, 189, 71–85. [Google Scholar] [CrossRef]
- Rogel, J.A.; Ariza, F.A.; Silla, R.O. Soil Salinity and Moisture Gradients and Plant Zonation in Mediterranean Salt Marshes of Southeast Spain. Wetlands 2000, 20, 357–372. [Google Scholar] [CrossRef]
- Mateo, G.; Vizcaíno, A. Flora y Vegetación del Parque Natural de l’Albufera, 1st ed.; Monografías de Botánica Ibérica: Jaca, Spain, 2023; ISBN 9788412665666. [Google Scholar]
- Smith, S.E.; Read, D.J. Mycorrhizal Symbiosis, 3rd ed.; Academic Press: London, UK, 2008; ISBN 9780080559346. [Google Scholar]
- Berg, G.; Alavi, M.; Schmidt, C.S.; Zachow, C.; Egamberdieva, D.; Kamilova, F.; Lugtenberg, B.J. Biocontrol and Osmoprotection for Plants under Salinated Conditions. Mol. Microb. Ecol. Rhizosphere 2013, 1, 587–592. [Google Scholar] [CrossRef]
- Egamberdieva, D.; Kucharova, Z.; Davranov, K.; Berg, G.; Makarova, N.; Azarova, T.; Chebotar, V.; Tikhonovich, I.; Kamilova, F.; Validov, S.Z.; et al. Bacteria Able to Control Foot and Root Rot and to Promote Growth of Cucumber in Salinated Soils. Biol. Fertil. Soils 2011, 47, 197–205. [Google Scholar] [CrossRef]
- Egamberdieva, D.; Berg, G.; Lindström, K.; Räsänen, L.A. Alleviation of Salt Stress of Symbiotic Galega officinalis L. (Goat’s Rue) by Co-inoculation of Rhizobium with Root-Colonizing Pseudomonas. Plant Soil 2013, 369, 453–465. [Google Scholar] [CrossRef]
- Hameed, A.; Dilfuza, E.; Abd-Allah, E.F.; Hashem, A.; Kumar, A.; Ahmad, P. Salinity stress and arbuscular mycorrhizal symbiosis in plants. In Use of Microbes for the Alleviation of Soil Stresses; Miransari, M., Ed.; Springer: New York, NY, USA, 2014; Volume 3, pp. 139–159. ISBN 978-1-4614-9466-9. [Google Scholar]
- Gorai, M.; Ennajeh, M.; Khemira, H.; Neffati, M. Combined effect of NaCl-salinity and hypoxia on growth, photosynthesis, water relations and solute accumulation in Phragmites australis plants. Flora 2010, 205, 462–470. [Google Scholar] [CrossRef]
- Pagter, M.; Bragato, C.; Malagoli, M.; Brix, H. Osmotic and Ionic Effects of NaCl and Na2SO4 Salinity on Phragmites australis. Aquat. Bot. 2009, 90, 43–51. [Google Scholar] [CrossRef]
- Cope, T.A. Flora of Pakistan, No. 143: Poaceae. In Flora of Pakistan, 2nd ed.; Nasir, E., Ali, S.I., Eds.; Pakistan Agricultural Research Council and University of Karachi: Karachi, Pakistan, 1982; Volume 3, pp. 154–196. [Google Scholar]
- Global Invasive Species Database. Available online: http://www.iucngisd.org/gisd/species.php?sc=16 (accessed on 28 February 2024).
- MacDonald, G.E. Cogongrass (Imperata cylindrica)-Biology, Ecology, and Management. Crit. Rev. Plant Sci. 2004, 23, 367–380. [Google Scholar] [CrossRef]
- Santoso, D.; Adiningsih, S.; Mutert, E.; Fairhurst, T.; Van Noordwijk, M. Soil Fertility Management for Reclamation of Imperata grasslands by Smallholder Agroforestry. Agrofor. Syst. 1996, 36, 181–202. [Google Scholar] [CrossRef]
- Trautwig, A.N.; Eckhardt, L.G.; Loewenstein, N.J.; Hoeksema, J.D.; Carter, E.A.; Nadel, R.L. Cogongrass (Imperata cylindrica) Affects Above and Belowground Processes in Commercial Loblolly Pine (Pinus taeda) Stands. For. Sci. 2017, 63, 10–16. [Google Scholar] [CrossRef]
- Bryson, C.T.; Carter, R. Cogongrass, Imperata cylindrica, in the United States. Weed Technol. 1993, 7, 1005–1009. [Google Scholar] [CrossRef]
- Kuusipalo, J.; Ådjers, G.; Jafarsidik, Y.; Otsamo, A.; Tuomela, K.; Vuokko, R. Restoration of Natural Vegetation in Degraded Imperata cylindrica Grassland: Understorey Development in Forest Plantations. J. Veg. Sci. 1995, 6, 205–210. [Google Scholar] [CrossRef]
- Dozier, H.; Gaffney, J.F.; McDonald, S.K.; Johnson, E.R.; Shilling, D.G. Cogongrass in the United States: History, Ecology, Impacts, and Management. Weed Technol. 1998, 12, 737–743. [Google Scholar] [CrossRef]
- Brewer, S. Declines in Plant Species Richness and Endemic Plant Species in Longleaf Pine Savannas Invaded by Imperata cylindrica. Biol. Invasions 2008, 10, 1257–1264. [Google Scholar] [CrossRef]
- Lissner, J.; Schierup, H.H.; Comín, F.A.; Astorga, V. Effect of Climate on the Salt Tolerance of Two Phragmites australis Populations: I. Growth, Inorganic Solutes, Nitrogen Relations and Osmoregulation. Aquat. Bot. 1999, 64, 317–333. [Google Scholar] [CrossRef]
- Lessmann, J.M.; Brix, H.; Bauer, V.; Clevering, O.A.; Comín, F.A. Effect of Climatic Gradients on the Photosynthetic Responses of Four Phragmites australis Populations. Aquat. Bot. 2001, 69, 109–126. [Google Scholar] [CrossRef]
- Pagter, M.; Bragato, C.; Brix, H. Tolerance and Physiological Responses of Phragmites australis to Water Deficit. Aquat. Bot. 2005, 81, 285–299. [Google Scholar] [CrossRef]
- Vasquez, E.A.; Glenn, E.P.; Guntenspergen, G.R.; Brown, J.J.; Nelson, S.G. Salt Tolerance and Osmotic Adjustment of Spartina alterniflora (Poaceae) and the Invasive M Haplotype of Phragmites australis (Poaceae) along a Salinity Gradient. Am. J. Bot. 2006, 93, 1784–1790. [Google Scholar] [CrossRef]
- Kiviat, E. Ecosystem services of Phragmites in North America with emphasis on habitat functions. AoB Plants 2013, 5, plt008. [Google Scholar] [CrossRef]
- Meadows, R.E.; Saltonstall, K. Distribution of Native and Introduced Phragmites australis in Freshwater and Oligohaline Tidal Marshes of the Delmarva Peninsula and Southern New Jersey. J. Torrey Bot. Soc. 2007, 134, 99–107. [Google Scholar] [CrossRef]
- Saltonstall, K. Cryptic Invasion by a Non-Native Genotype of the Common Reed, Phragmites australis, into North America. Proc. Natl. Acad. Sci. USA 2002, 99, 2445–2449. [Google Scholar] [CrossRef]
- Flora of China. Saccharum in Flora of China @ efloras.org. Available online: http://www.efloras.org/florataxon.aspx?flora_id=2&taxon_id=128968 (accessed on 20 February 2024).
- CABI. Laodelphax Striatellus (Small Brown Planthopper). 2021. Available online: https://doi.org/10.1079/cabicompendium.10935 (accessed on 22 February 2024).
- Steury, B.W. District of Columbia and Maryland. Castanea 2004, 69, 154–157. [Google Scholar] [CrossRef]
- Janaki-Ammal, E.K. Intergeneric Hybrids of Saccharum; John Innes Horticultural Institution: Merton, UK, 1941. [Google Scholar]
- Hattori, T.; Shiotsu, F.; Doi, T.; Morita, S. Suppression of Tillering in Erianthus ravennae (L.) Beauv. due to Drought Stress at Establishment. Plant Prod. Sci. 2010, 13, 252–255. [Google Scholar] [CrossRef]
- Pandey, V.C.; Singh, A.K. Saccharum spp. Potential Role in Ecorestoration and Biomass Production. In Phytoremediation Potential of Perennial Grasses, 1st ed.; Elsevier: Amsterdam, The Netherlands, 2020; pp. 211–226. ISBN 9780128177334. [Google Scholar]
- IPCC. Impacts, Adaptation and Vulnerability. Contribution of Working Group II to the Sixth Assessment Report of the Intergovernmental Panel on Climate Change; Pörtner, H.-O., Roberts, D.C., Tignor, M., Poloczanska, E.S., Mintenbeck, K., Alegría, A., Craig, M., Langsdorf, S., Löschke, S., Möller, V., et al., Eds.; Cambridge University Press: Cambridge, UK; Cambridge University Press: New York, NY, USA, 2022; p. 3056. [Google Scholar] [CrossRef]
- Munns, R.; Tester, M. Mechanisms of Salinity Tolerance. Annu. Rev. Plant Biol. 2008, 59, 651–681. [Google Scholar] [CrossRef]
- Savchenko, T.; Tikhonov, K. Oxidative Stress-Induced Alteration of Plant Central Metabolism. Life 2021, 11, 304. [Google Scholar] [CrossRef]
- Singh, P.; Choudhary, K.K.; Chaudhary, N.; Gupta, S.; Sahu, M.; Tejaswini, B.; Sarkar, S. Salt Stress Resilience in Plants Mediated through Osmolyte Accumulation and Its Crosstalk Mechanism with Phytohormones. Front. Plant Sci. 2022, 13, 1006617. [Google Scholar] [CrossRef]
- Flowers, T.J.; Munns, R.; Colmer, T.D. Sodium Chloride Toxicity and the Cellular Basis of Salt Tolerance in Halophytes. Ann. Bot. 2015, 115, 419–431. [Google Scholar] [CrossRef] [PubMed]
- Al Hassan, M.; del Pilar López-Gresa, M.; Boscaiu, M.; Vicente, O. Stress Tolerance Mechanisms in Juncus: Responses to Salinity and Drought in Three Juncus Species Adapted to Different Natural Environments. Funct. Plant Biol. 2016, 43, 949–960. [Google Scholar] [CrossRef] [PubMed]
- Al Hassan, M.; Chaura, J.; Donat-Torres, M.P.; Boscaiu, M.; Vicente, O. Antioxidant Responses under Salinity and Drought in Three Closely Related Wild Monocots with Different Ecological Optima. AoB Plants 2017, 9, plx009. [Google Scholar] [CrossRef] [PubMed]
- Albertos, B.; San Miguel, E.; Draper, I.; Garilleti, R.; Lara, F.; Varela, J.M. Estado de Conservación de la Vegetación Dunar en las Costas de la Comunidad Valenciana. Rev. Digit. Cedex 2010, 158, 121–134. Available online: https://ingenieriacivil.cedex.es/index.php/ingenieria-civil/article/view/160 (accessed on 10 November 2023).
- Carex Vivers. Available online: http://www.carex.cat/es/vivers-carex/catalogo/saccharum-ravennae-.aspx (accessed on 31 May 2024).
- Huang, G.M.; Srivastava, A.K.; Zou, Y.N.; Wu, Q.S.; Kuča, K. Exploring arbuscular mycorrhizal symbiosis in wetland plants with a focus on human impacts. Symbiosis 2021, 84, 311–320. [Google Scholar] [CrossRef]
- Zhu, J.K. Plant Salt Tolerance. Trends Plant Sci. 2001, 6, 66–71. [Google Scholar] [CrossRef] [PubMed]
- Ashraf, M. Relationships between Leaf Gas Exchange Characteristics and Growth of Differently Adapted Populations of Blue Panicgrass (Panicum antidotale Retz.) under Salinity or Waterlogging. Plant Sci. 2003, 165, 69–75. [Google Scholar] [CrossRef]
- Wang, H.L.; Hao, L.M.; Wen, J.Q.; Zhang, C.L.; Liang, H.G. Differential expression of photosynthesis-related genes of reed ecotypes in response to drought and saline habitats. Photosynthetica 1998, 35, 61–69. [Google Scholar] [CrossRef]
- Hameed, M.; Ashraf, M.; Naz, N.; Nawaz, T.; Batool, R.; Fatima, S.; Ahmad, F. Physiological Adaptative Characteristics of Imperata cylindrica for Salinity Tolerance. Biologia 2014, 69, 1148–1156. [Google Scholar] [CrossRef]
- Hameed, M.; Ashraf, M.; Naz, N. Anatomical and Physiological Characteristics Relating to Ionic Relations in Some Salt Tolerant Grasses from the Salt Range, Pakistan. Acta Physiol. Plant. 2011, 33, 1399–1409. [Google Scholar] [CrossRef]
- Ashraf, M.; Harris, P.J. Photosynthesis under Stressful Environments: An Overview. Photosynthetica 2013, 51, 163–190. [Google Scholar] [CrossRef]
- Cazzonelli, C.I. Carotenoids in Nature: Insights from Plants and Beyond. Funct. Plant Biol. 2011, 38, 833–847. [Google Scholar] [CrossRef] [PubMed]
- Greenway, H.; Munns, R. Mechanisms of Salt Tolerance in Non-halophytes. Annu. Rev. Plant Physiol. 1980, 31, 149–190. [Google Scholar] [CrossRef]
- Tester, M.; Davenport, R. Na+ Tolerance and Na+ Transport in Higher Plants. Ann. Bot. 2003, 91, 503–527. [Google Scholar] [CrossRef] [PubMed]
- Flowers, T.J.; Hajibagheri, M.A.; Clipson, N.J.W. Halophytes. Q. Rev. Biol. 1986, 61, 313–337. [Google Scholar] [CrossRef]
- Almeida, D.M.; Oliveira, M.M.; Saibo, N.J. Regulation of Na+ and K+ Homeostasis in Plants: Towards Improved Salt Stress Tolerance in Crop Plants. Genet. Mol. Biol. 2017, 40, 326–345. [Google Scholar] [CrossRef] [PubMed]
- Volkov, V.; Wang, B.; Dominy, P.J.; Fricke, W.; Amtmann, A. Thellungiella halophila, a Salt-Tolerant Relative of Arabidopsis thaliana, Possesses Effective Mechanisms to Discriminate between Potassium and Sodium. Plant Cell Environ. 2004, 27, 342–353. [Google Scholar] [CrossRef]
- Ashraf, M.; Harris, P.J.C. Potential Biochemical Indicators of Salinity Tolerance in Plants. Plant Sci. 2004, 166, 3–16. [Google Scholar] [CrossRef]
- Slama, I.; Abdelly, C.; Bouchereau, A.; Flowers, T.; Savouré, A. Diversity, Distribution and Roles of Osmoprotective Compounds Accumulated in Halophytes under Abiotic Stress. Ann. Bot. 2015, 115, 433–447. [Google Scholar] [CrossRef]
- Szabados, L.; Savouré, A. Proline: A Multifunctional Amino Acid. Trends Plant Sci. 2010, 15, 89–97. [Google Scholar] [CrossRef]
- Ashraf, M.; Foolad, M.R. Roles of Glycine Betaine and Proline in Improving Plant Abiotic Stress Resistance. Environ. Exp. Bot. 2007, 59, 206–216. [Google Scholar] [CrossRef]
- Verbruggen, N.; Hermans, C. Proline Accumulation in Plants: A Review. Amino Acids 2008, 35, 753–759. [Google Scholar] [CrossRef]
- Bautista, I.; Boscaiu, M.; Lidón, A.; Llinares, J.V.; Lull, C.; Donat, M.P.; Vicente, O. Environmentally Induced Changes in Antioxidant Phenolic Compounds Levels in Wild Plants. Acta Physiol. Plant. 2016, 38, 9. [Google Scholar] [CrossRef]
- Yan, K.; Zhao, S.; Bian, L.; Chen, X. Saline Stress Enhanced Accumulation of Leaf Phenolics in Honeysuckle (Lonicera japonica Thunb.) without Induction of Oxidative Stress. Plant Physiol. Biochem. 2017, 112, 326–334. [Google Scholar] [CrossRef]
- Fini, A.; Brunetti, C.; Di Ferdinando, M.; Ferrini, F.; Tattini, M. Stress-induced Flavonoid Biosynthesis and the Antioxidant Machinery of Plants. Plant Signal. Behav. 2011, 6, 709–711. [Google Scholar] [CrossRef]
- Pollastri, S.; Tattini, M. Flavonols: Old Compounds for Old Roles. Ann. Bot. 2011, 108, 1225–1233. [Google Scholar] [CrossRef]
- Treutter, D. Significance of Flavonoids in Plant Resistance and Enhancement of Their Biosynthesis. Plant Biol. 2005, 7, 581–591. [Google Scholar] [CrossRef]
- Winkel-Shirley, B. Biosynthesis of Flavonoids and Effects of Stress. Curr. Opin. Plant Biol. 2002, 5, 218–223. [Google Scholar] [CrossRef]
- Saed-Moucheshi, A.; Shekoofa, A.; Pessarakli, M. Reactive Oxygen Species (ROS) Generation and Detoxifying in Plants. J. Plant Nutr. 2014, 37, 1573–1585. [Google Scholar] [CrossRef]
- Ahmad, P.; Hashem, A.; Abd-Allah, E.F.; Alqarawi, A.A.; John, R.; Egamberdieva, D.; Gucel, S. Role of Trichoderma harzianum in Mitigating NaCl Stress in Indian Mustard (Brassica juncea L) through Antioxidative Defense System. Front. Plant Sci. 2015, 6, 868. [Google Scholar] [CrossRef] [PubMed]
- Wu, Q.S.; Zou, Y.N.; Abd-Allah, E.F. Mycorrhizal Association and ROS in Plants. In Oxidative Damage to Plants, 1st ed.; Ahmad, P., Ed.; Academic Press: New York, NY, USA, 2014; pp. 453–475. ISBN 9780128004609. [Google Scholar]
- Ef, A.A.; Abeer, H.; Alqarawi, A.A.; Hend, A.A. Alleviation of Adverse Impact of Cadmium Stress in Sunflower (Helianthus annuus L.) by Arbuscular Mycorrhizal Fungi. Pak. J. Bot. 2015, 47, 785–795. [Google Scholar]
- Navarro, J.M.; Pérez-Tornero, O.; Morte, A. Alleviation of Salt Stress in Citrus Seedlings Inoculated with Arbuscular Mycorrhizal Fungi Depends on the Rootstock Salt Tolerance. J. Plant Physiol. 2014, 171, 76–85. [Google Scholar] [CrossRef]
- Maun, M.A. The Biology of Coastal Sand Dunes; Oxford University Press: New York, NY, USA, 2009; ISBN 978-0198570363. [Google Scholar]
- Martin, R.M. Effects of Warming on Invasive Phragmites australis and Native Spartina patens Seed Germination Rates and Implications for Response to Climate Change. Northeast. Nat. 2017, 24, 235–238. [Google Scholar] [CrossRef]
- Lichtenthaler, H.K.; Wellburn, A.R. Determinations of Total Carotenoids and Chlorophylls a and b of Leaf Extracts in Different Solvents. Biochem. Soc. Trans. 1983, 11, 591–592. [Google Scholar] [CrossRef]
- Weimberg, R. Solute Adjustments in Leaves of Two Species of Wheat at Two Different Stages of Growth in Response to Salinity. Physiol. Plant. 1987, 70, 381–388. [Google Scholar] [CrossRef]
- Bates, L.S.; Waldren, R.A.; Teare, I.D. Rapid Determination of Free Proline for Water-Stress Studies. Plant Soil 1973, 39, 205–207. [Google Scholar] [CrossRef]
- Vicente, O.; Boscaiu, M.; Naranjo, M.Á.; Estrelles, E.; Bellés, J.M.; Soriano, P. Responses to Salt Stress in the Halophyte Plantago crassifolia (Plantaginaceae). J. Arid Environ. 2004, 58, 463–481. [Google Scholar] [CrossRef]
- Dubois, M.; Gilles, K.A.; Hamilton, J.K.; Rebers, P.T.; Smith, F. Colorimetric Method for Determination of Sugars and Related Substances. Anal. Chem. 1956, 28, 350–356. [Google Scholar] [CrossRef]
- Grieve, C.M.; Grattan, S.R. Rapid Assay for Determination of Water Soluble Quaternary Ammonium Compounds. Plant Soil 1983, 70, 303–307. [Google Scholar] [CrossRef]
- Hodges, D.M.; DeLong, J.M.; Forney, C.F.; Prange, R.K. Improving the Thiobarbituric Acid-Reactive-Substances Assay for Estimating Lipid Peroxidation in Plant Tissues Containing Anthocyanin and Other Interfering Compounds. Planta 1999, 207, 604–611. [Google Scholar] [CrossRef]
- Taulavuori, E.; Hellström, E.K.; Taulavuori, K.; Laine, K. Comparison of Two Methods Used to Analyse Lipid Peroxidation from Vaccinium myrtillus (L.) during Snow Removal, Reacclimation and Cold Acclimation. J. Exp. Bot. 2001, 52, 2375–2380. [Google Scholar] [CrossRef]
- Alexieva, V.; Sergiev, I.; Mapelli, S.; Karanov, E. The Effect of Drought and Ultraviolet Radiation on Growth and Stress Markers in Pea and Wheat. Plant Cell Environ. 2001, 24, 1337–1344. [Google Scholar] [CrossRef]
- Blainski, A.; Lopes, G.C.; De Mello, J.C.P. Application and Analysis of the Folin Ciocalteu Method for the Determination of the Total Phenolic Content from Limonium brasiliense L. Molecules 2013, 18, 6852–6865. [Google Scholar] [CrossRef]
- Zhishen, J.; Mengcheng, T.; Jianming, W. The Determination of Flavonoid Contents in Mulberry and Their Scavenging Effects on Superoxide Radicals. Food Chem. 1999, 64, 555–559. [Google Scholar] [CrossRef]
- Gil, R.; Bautista, I.; Boscaiu, M.; Lidón, A.; Wankhade, S.; Sánchez, H.; Llinares, J.; Vicente, O. Responses of Five Mediterranean Halophytes to Seasonal Changes in Environmental Conditions. AoB Plants 2014, 6, plu049. [Google Scholar] [CrossRef]
- Bradford, M.M. A Rapid and Sensitive Method for the Quantitation of Microgram Quantities of Protein Utilizing the Principle of Protein-Dye Binding. Anal. Biochem. 1976, 72, 248–254. [Google Scholar] [CrossRef]
- Beyer, W.F., Jr.; Fridovich, I. Assaying for Superoxide Dismutase Activity: Some Large Consequences of Minor Changes in Conditions. Anal. Biochem. 1987, 161, 559–566. [Google Scholar] [CrossRef]
- Aebi, H. Catalase in Vitro. In Methods in Enzymology; Academic Press: London, UK, 1984; Volume 105, pp. 121–126. [Google Scholar] [CrossRef]
- Nakano, Y.; Asada, K. Hydrogen Peroxide Is Scavenged by Ascorbate-Specific Peroxidase in Spinach Chloroplasts. Plant Cell Physiol. 1981, 22, 867–880. [Google Scholar] [CrossRef]
- Connell, J.P.; Mullet, J.E. Pea Chloroplast Glutathione Reductase: Purification and Characterization. Plant Physiol. 1986, 82, 351–356. [Google Scholar] [CrossRef]
- Kowal, J.; Arrigoni, E.; Lane, S. Acidified Blue Ink-Staining Procedure for the Observation of Fungal Structures Inside Roots of Two Disparate Plant Lineages. Bio-protocol 2020, 10, e3786. [Google Scholar] [CrossRef]
- Trouvelot, A. Measure du taux de mycorrhization d’un système radiculaire. Recherche de méthodes d’estimation ayant une signification fonctionnelle. In Physiological and Genetic Aspects of Mycorrhizae; Gianinazzi-Pearson, V., Gianinazzi, S., Eds.; INRA: Paris, France, 1986; pp. 217–221. ISBN 2-85340-774-8. [Google Scholar]
- Metsalu, T.; Vilo, J. ClustVis: A web tool for visualizing clustering of multivariate data using Principal Component Analysis and heatmap. Nucleic Acids Res. 2015, 43, W566–W570. [Google Scholar] [CrossRef] [PubMed]
- Hammer, Ø.; Harper, A.A.T.; Ryan, P.D. Past: Paleontological statistics software package for education and data analysis. Palaeontol. Electron. 2001, 4, 1–9. Available online: http://palaeo-electronica.org/2001_1/past/issue1_01.htm (accessed on 12 October 2023).


| Species | I. cylindrica | P. australis | S. ravennae | |||||
|---|---|---|---|---|---|---|---|---|
| Day | 0 | 7 | 14 | 0 | 7 | 11 | 0 | 7 |
| Treatment | ||||||||
| Control | 2.0 ± 0.2 A | 1.3 ± 0.2 bA | 1.8 ± 0.4 bcA | 2.0 ± 0.1 abB | 1.1 ± 0.1 abA | 1.3 ± 0.1 bcA | 1.5 ± 0.2 bA | 1.1 ± 0.1 cB |
| 0.2 M NaCl | 1.8 ± 0.1 B | 2.7 ± 0.1 abB | 7.0 ± 0.3 abcA | 2.0 ± 0.1 abA | 3.5 ± 0.6 abA | 5.3 ± 1.4 abcA | 1.4 ± 0.2 bB | 3.8 ± 0.3 abcA |
| 0.4 M NaCl | 1.8 ± 0.1 B | 3.8 ± 0.5 abB | 30.3 ± 5.2 abA | 2.3 ± 0.1 aB | 5.4 ± 0.8 abAB | 9.9 ± 2.4 abcA | 2.3 ± 0.2 abB | 9.1 ± 1.2 abcA |
| 0.6 M NaCl | 2.3 ± 0.1 B | 4.1 ± 3.0 abB | 40.2 ± 14.8 abA | 2.4 ± 0.1 aB | 7.7 ± 2.6 aAB | 42.4 ± 16.2 abA | 2.3 ± 0.1 abB | 18.7 ± 4.5 abA |
| 0.8 M NaCl | 2.2 ± 0.1 B | 8.8 ± 1.4 aB | 53.8 ± 0.0 aA | 2.2 ± 0.1 abB | 20.8 ± 14.3 aAB | 46.7 ± 0.0 aA | 2 ± 0.1 abB | 46.9 ± 6.9 aA |
| Species | I. cylindrica | P. australis | S. ravennae | ||||||
|---|---|---|---|---|---|---|---|---|---|
| Variable | N | χ2 | p-Value | N | χ2 | p-Value | N | χ2 | p-Value |
| BIOMASS | |||||||||
| Leaf fresh weight | 30 | 21.263 | 0.001 | 26 | 4.055 | 0.542 | 28 | 21.012 | 0.001 |
| Root fresh weight | 30 | 11.147 | 0.049 | 27 | 8.230 | 0.144 | 30 | 8.055 | 0.153 |
| Leaves produced | 30 | 23.810 | <0.001 | 25 | 15.749 | 0.008 | 30 | 23.882 | <0.001 |
| Stems produced | 30 | 13.340 | 0.020 | 29 | 16.393 | 0.006 | 30 | 12.425 | 0.029 |
| Leaf water content | 26 | 8.809 | 0.117 | 27 | 9.756 | 0.082 | 29 | 16.531 | 0.005 |
| Root water content | 30 | 8.310 | 0.140 | 27 | 6.140 | 0.293 | 29 | 7.853 | 0.165 |
| Root/shoot ratio | 26 | 19.464 | 0.002 | 26 | 7.007 | 0.220 | 26 | 11.073 | 0.050 |
| PIGMENTS | |||||||||
| Chlorophyll a | 26 | 15.166 | 0.010 | 19 | 4.947 | 0.422 | 26 | 14.850 | 0.011 |
| Chlorophyll b | 26 | 11.669 | 0.040 | 19 | 4.211 | 0.519 | 26 | 14.786 | 0.011 |
| Carotenoids | 26 | 15.329 | 0.009 | 18 | 6.763 | 0.239 | 27 | 10.552 | 0.061 |
| Chlorophylls/carotenoids | 25 | 14.720 | 0.012 | 18 | 2.986 | 0.702 | 27 | 6.943 | 0.225 |
| IONS | |||||||||
| Na+ in roots | 30 | 25.377 | <0.001 | 27 | 19.976 | 0.001 | 29 | 24.061 | <0.001 |
| Na+ in leaves | 28 | 22.154 | <0.001 | 25 | 3.574 | 0.612 | 23 | 8.441 | 0.134 |
| Cl− in roots | 30 | 25.036 | <0.001 | 27 | 19.084 | 0.002 | 30 | 20.102 | 0.001 |
| Cl− in leaves | 28 | 19.482 | 0.002 | 27 | 12.680 | 0.027 | 24 | 17.460 | 0.004 |
| K+ in roots | 30 | 11.921 | 0.036 | 26 | 7.805 | 0.167 | 29 | 12.723 | 0.026 |
| K+ in leaves | 29 | 8.685 | 0.122 | 27 | 4.814 | 0.439 | 24 | 7.098 | 0.213 |
| Ca2+ in roots | 30 | 24.272 | <0.001 | 27 | 17.121 | 0.004 | 30 | 20.055 | 0.001 |
| Ca2+ in leaves | 29 | 23.600 | <0.001 | 27 | 7.042 | 0.218 | 24 | 18.885 | 0.002 |
| OSMOLYTES | |||||||||
| Proline | 26 | 15.440 | 0.009 | 20 | 6.972 | 0.223 | 25 | 12.883 | 0.024 |
| Total soluble sugars | 24 | 14.186 | 0.014 | 17 | 1.686 | 0.891 | 25 | 7.751 | 0.170 |
| Glycine betaine | 24 | 3.477 | 0.627 | 21 | 2.288 | 0.808 | 27 | 5.362 | 0.373 |
| OXIDATIVE STRESS MARKERS | |||||||||
| Malondialdehyde | 23 | 11.982 | 0.035 | 19 | 2.411 | 0.790 | 26 | 9.390 | 0.094 |
| Hydrogen peroxide | 24 | 3.802 | 0.578 | 18 | 3.973 | 0.553 | 27 | 7.410 | 0.192 |
| NON-ENZYMATIC ANTIOXIDANTS | |||||||||
| Total phenolic compounds | 25 | 11.346 | 0.045 | 19 | 0.180 | 0.999 | 26 | 7.716 | 0.173 |
| Total flavonoids | 25 | 11.527 | 0.042 | 19 | 0.816 | 0.976 | 25 | 6.295 | 0.279 |
| TOTAL SOLUBLE PROTEINS | |||||||||
| Total soluble proteins | 23 | 4.145 | 0.529 | 19 | 4.589 | 0.468 | 28 | 18.015 | 0.003 |
| ANTIOXIDANT ENZYMES | |||||||||
| Superoxide dismutase | 22 | 4.040 | 0.544 | 19 | 4.054 | 0.542 | 24 | 8.798 | 0.117 |
| Catalase | 22 | 3.519 | 0.621 | 21 | 5.747 | 0.332 | 28 | 3.596 | 0.609 |
| Ascorbate peroxidase | 23 | 10.954 | 0.052 | 20 | 2.654 | 0.753 | 26 | 3.817 | 0.576 |
| Glutathione reductase | 23 | 5.892 | 0.317 | 21 | 2.152 | 0.828 | 27 | 11.836 | 0.037 |
| MYCORRHIZAE ANALYSIS | |||||||||
| Arbuscule abundance | 24 | 4.012 | 0.548 | 13 | 3.899 | 0.564 | 26 | 3.133 | 0.679 |
| Vesicle abundance | 23 | 4.769 | 0.445 | 13 | 8.189 | 0.146 | 26 | 4.637 | 0.462 |
| Hyphae abundance | 22 | 3.961 | 0.555 | 13 | 4.292 | 0.508 | 26 | 2.526 | 0.773 |
| Parameter | Treatment | N | I. cylindrica | N | P. australis | N | S. ravennae |
|---|---|---|---|---|---|---|---|
| Malondialdehyde (nmol g−1 DW) | Control | 5 | 17.6 ± 9.0 a | 4 | 96.2 ± 12.3 a | 4 | 31.9 ± 11.8 a |
| 200 mM | 5 | 17.4 ± 9.8 a | 5 | 78.7 ± 18.5 a | 4 | 0.0 ± 0.0 a | |
| 400 mM | 5 | 0.0 ± 0.0 a | 3 | 78.3 ± 23.1 a | 5 | 35.9 ± 21.0 a | |
| 600 mM | 3 | 0.0 ± 0.0 a | 2 | 94.8 ± 13.8 a | 5 | 41.5 ± 27.1 a | |
| 800 mM | 1 | 6.3 ± 0.0 a | 2 | 65.3 ± 5.5 a | 4 | 0.7 ± 0.7 a | |
| WS | 4 | 31.7 ± 11.0 a | 3 | 95.5 ± 30.2 a | 4 | 0.0 ± 0.0 a | |
| Hydrogen peroxide (µmol H2O2 g−1 DW) | Control | 5 | 4.6 ± 0.5 a | 3 | 0.6 ± 0.1 a | 5 | 5.0 ± 1.4 a |
| 200 mM | 5 | 3.8 ± 0.5 a | 5 | 0.7 ± 0.1 a | 4 | 6.0 ± 1.4 a | |
| 400 mM | 5 | 5.4 ± 0.8 a | 2 | 0.3 ± 0.2 a | 5 | 2.2 ± 0.7 a | |
| 600 mM | 4 | 3.7 ± 1.0 a | 2 | 0.4 ± 0.4 a | 5 | 2.9 ± 0.5 a | |
| 800 mM | 1 | 3.3 ± 0.0 a | 2 | 0.2 ± 0.2 a | 4 | 4.0 ± 2.1 a | |
| WS | 4 | 4.7 ± 0.5 a | 4 | 0.4 ± 0.2 a | 4 | 4.2 ± 0.5 a | |
| Total phenolic compounds (mg eq. GA g−1 DW) | Control | 5 | 2.2 ± 0.3 a | 4 | 6.6 ± 2.3 a | 4 | 2.2 ± 0.1 a |
| 200 mM | 5 | 2.1 ± 0.2 a | 5 | 4.5 ± 1.3 a | 4 | 2.8 ± 0.5 a | |
| 400 mM | 5 | 2.7 ± 0.4 a | 2 | 5.8 ± 2.7 a | 5 | 1.3 ± 0.4 a | |
| 600 mM | 4 | 3.2 ± 0.3 a | 2 | 4.5 ± 0.4 a | 5 | 2.0 ± 0.3 a | |
| 800 mM | 1 | 1.3 ± 0.0 a | 2 | 4.3 ± 0.1 a | 4 | 1.5 ± 0.6 a | |
| WS | 5 | 1.7 ± 0.1 a | 4 | 4.4 ± 0.3 a | 4 | 1.6 ± 0.3 a | |
| Total flavonoids (mg eq. C g−1 DW) | Control | 5 | 4.3 ± 0.6 ab | 4 | 2.4 ± 0.8 a | 4 | 3.3 ± 0.3 a |
| 200 mM | 5 | 4.9 ± 0.7 ab | 4 | 1.7 ± 0.7 a | 4 | 5.4 ± 1.1 a | |
| 400 mM | 5 | 5.9 ± 1.1 ab | 3 | 1.5 ± 0.5 a | 5 | 2.3 ± 0.8 a | |
| 600 mM | 4 | 6.5 ± 0.5a | 2 | 1.6 ± 0.3 a | 5 | 3.7 ± 0.4 a | |
| 800 mM | 1 | 2.8 ± 0.0 ab | 2 | 1.5 ± 0.1 a | 3 | 3.0 ± 2.0 a | |
| WS | 5 | 3.4 ± 0.3 b | 4 | 1.7 ± 0.3 a | 4 | 2.6 ± 0.8 a | |
| Total soluble proteins (mg protein g−1 DW) | Control | 5 | 2.2 ± 0.3 a | 4 | 3.71 ± 0.4 a | 5 | 2.5 ± 0.6 a b |
| 200 mM | 5 | 2.1 ± 0.4 a | 4 | 3.03 ± 0.3 a | 4 | 4.1 ± 0.5 a b | |
| 400 mM | 4 | 2.7 ± 0.4 a | 3 | 2.8 ± 0.2 a | 5 | 1.4 ± 0.4 b | |
| 600 mM | 4 | 2.7 ± 0.4 a | 2 | 3.1 ± 0.4 a | 5 | 2.5 ± 0.3 b | |
| 800 mM | 1 | 2.0 ± 0.0 a | 2 | 2.7 ± 0.3 a | 4 | 1.3 ± 0.4 a b | |
| WS | 4 | 1.9 ± 0.3 a | 4 | 2.9 ± 0.3 a | 5 | 4.2 ± 0.4a | |
| SOD activity (U g−1 protein) | Control | 5 | 388.7 ± 27.1 a | 4 | 137.2 ± 49.8 a | 4 | 145.2 ± 46.4 a |
| 200 mM | 5 | 429.1 ± 51.1 a | 5 | 287.3 ± 105.2 a | 4 | 433.1 ± 79.0 a | |
| 400 mM | 4 | 415.0 ± 53.2 a | 3 | 280.7 ± 151.6 a | 4 | 185.0 ± 44.6 a | |
| 600 mM | 4 | 484.2 ± 80.2 a | 2 | 421.3 ± 213.5 a | 5 | 544.4 ± 153.4 a | |
| 800 mM | 1 | 198.7 ± 0.0 a | 2 | 365.4 ± 4.6 a | 3 | 241.1 ± 166.1 a | |
| WS | 3 | 447.1 ± 57.7 a | 3 | 330.0 ± 54.0 a | 4 | 275.5 ± 103.0 a | |
| CAT activity (U g−1 protein) | Control | 4 | 3.5 ± 1.3 a | 5 | 6.0 ± 4.0 a | 5 | 6.06 ± 4.4 a |
| 200 mM | 5 | 17.6 ± 6.7 a | 5 | 13.6 ± 7.1 a | 4 | 12.32 ± 5.5 a | |
| 400 mM | 4 | 10.2 ± 2.4 a | 3 | 35.0 ± 33.0 a | 5 | 35.1 ± 23.4 a | |
| 600 mM | 4 | 13.0 ± 7.0 a | 2 | 28.1 ± 8.5 a | 5 | 4.5 ± 2.7 a | |
| 800 mM | 1 | 3.9 ± 0.0 a | 2 | 90.2 ± 72.4 a | 4 | 25.2 ± 18.2 a | |
| WS | 4 | 12.4 ± 6.3 a | 4 | 22.8 ± 14.3 a | 5 | 5.6 ± 3.8 a | |
| APX activity (U g−1 protein) | Control | 5 | 293.5 ± 47.9 a | 4 | 1287.7 ± 264.8 a | 5 | 322.0 ± 112.9 a |
| 200 mM | 5 | 454.7 ± 68.4 a | 5 | 1436.4 ± 398.4 a | 4 | 526.5 ± 76.6 a | |
| 400 mM | 4 | 391.4 ± 107.7 a | 3 | 1000.3 ± 214.9 a | 5 | 531.9 ± 167.4 a | |
| 600 mM | 4 | 665.2 ± 142.2 a | 2 | 1660.6 ± 667.6 a | 4 | 536.6 ± 28.7 a | |
| 800 mM | 1 | 413.6 ± 0.0 a | 2 | 1413.5 ± 112.0 a | 3 | 283.9 ± 174. 2 a | |
| WS | 4 | 706.4 ± 144.8 a | 4 | 1040.7 ± 369.6 a | 5 | 637.5 ± 132.9 a | |
| GR activity (U g−1 protein) | Control | 5 | 27.3 ± 5.3 a | 5 | 1.2 ± 1.1 a | 4 | 13.2 ± 6.9 a |
| 200 mM | 5 | 22.6 ± 6.3 a | 5 | 0.2 ± 0.2 a | 4 | 15. 0 ± 6.5 a | |
| 400 mM | 4 | 12.6 ± 7.7 a | 3 | 21.6 ± 21.1 a | 5 | 28.1 ± 9.9 a | |
| 600 mM | 4 | 27.8 ± 13.6 a | 2 | 5.4 ± 5.4 a | 5 | 17.9 ± 9.3 a | |
| 800 mM | 1 | 35.5 ± 0.0 a | 2 | 0.0 ± 0.0 a | 4 | 21.5 ± 5.7 a | |
| WS | 4 | 41.7 ± 7.8 a | 4 | 0.3 ± 0.3 a | 5 | 4.3 ± 3.5 a |
Disclaimer/Publisher’s Note: The statements, opinions and data contained in all publications are solely those of the individual author(s) and contributor(s) and not of MDPI and/or the editor(s). MDPI and/or the editor(s) disclaim responsibility for any injury to people or property resulting from any ideas, methods, instructions or products referred to in the content. |
© 2024 by the authors. Licensee MDPI, Basel, Switzerland. This article is an open access article distributed under the terms and conditions of the Creative Commons Attribution (CC BY) license (https://creativecommons.org/licenses/by/4.0/).
Share and Cite
Sapiña-Solano, A.; Boscaiu, M.; Collado, F.; Vicente, O.; Ruiz-González, M.X. Effects of High Salinity and Water Stress on Wetland Grasses from the Spanish Mediterranean Coast. Plants 2024, 13, 1939. https://doi.org/10.3390/plants13141939
Sapiña-Solano A, Boscaiu M, Collado F, Vicente O, Ruiz-González MX. Effects of High Salinity and Water Stress on Wetland Grasses from the Spanish Mediterranean Coast. Plants. 2024; 13(14):1939. https://doi.org/10.3390/plants13141939
Chicago/Turabian StyleSapiña-Solano, Adrián, Monica Boscaiu, Francisco Collado, Oscar Vicente, and Mario X. Ruiz-González. 2024. "Effects of High Salinity and Water Stress on Wetland Grasses from the Spanish Mediterranean Coast" Plants 13, no. 14: 1939. https://doi.org/10.3390/plants13141939
APA StyleSapiña-Solano, A., Boscaiu, M., Collado, F., Vicente, O., & Ruiz-González, M. X. (2024). Effects of High Salinity and Water Stress on Wetland Grasses from the Spanish Mediterranean Coast. Plants, 13(14), 1939. https://doi.org/10.3390/plants13141939