
Enriching NPK Mineral Fertilizer with Plant-Stimulating Peptides Increases Soilless Tomato Production, Grower Profit, and Environmental Sustainability


 ,
,  ,
,  and
and 
Abstract
1. Introduction
2. Results
2.1. Agronomic Results
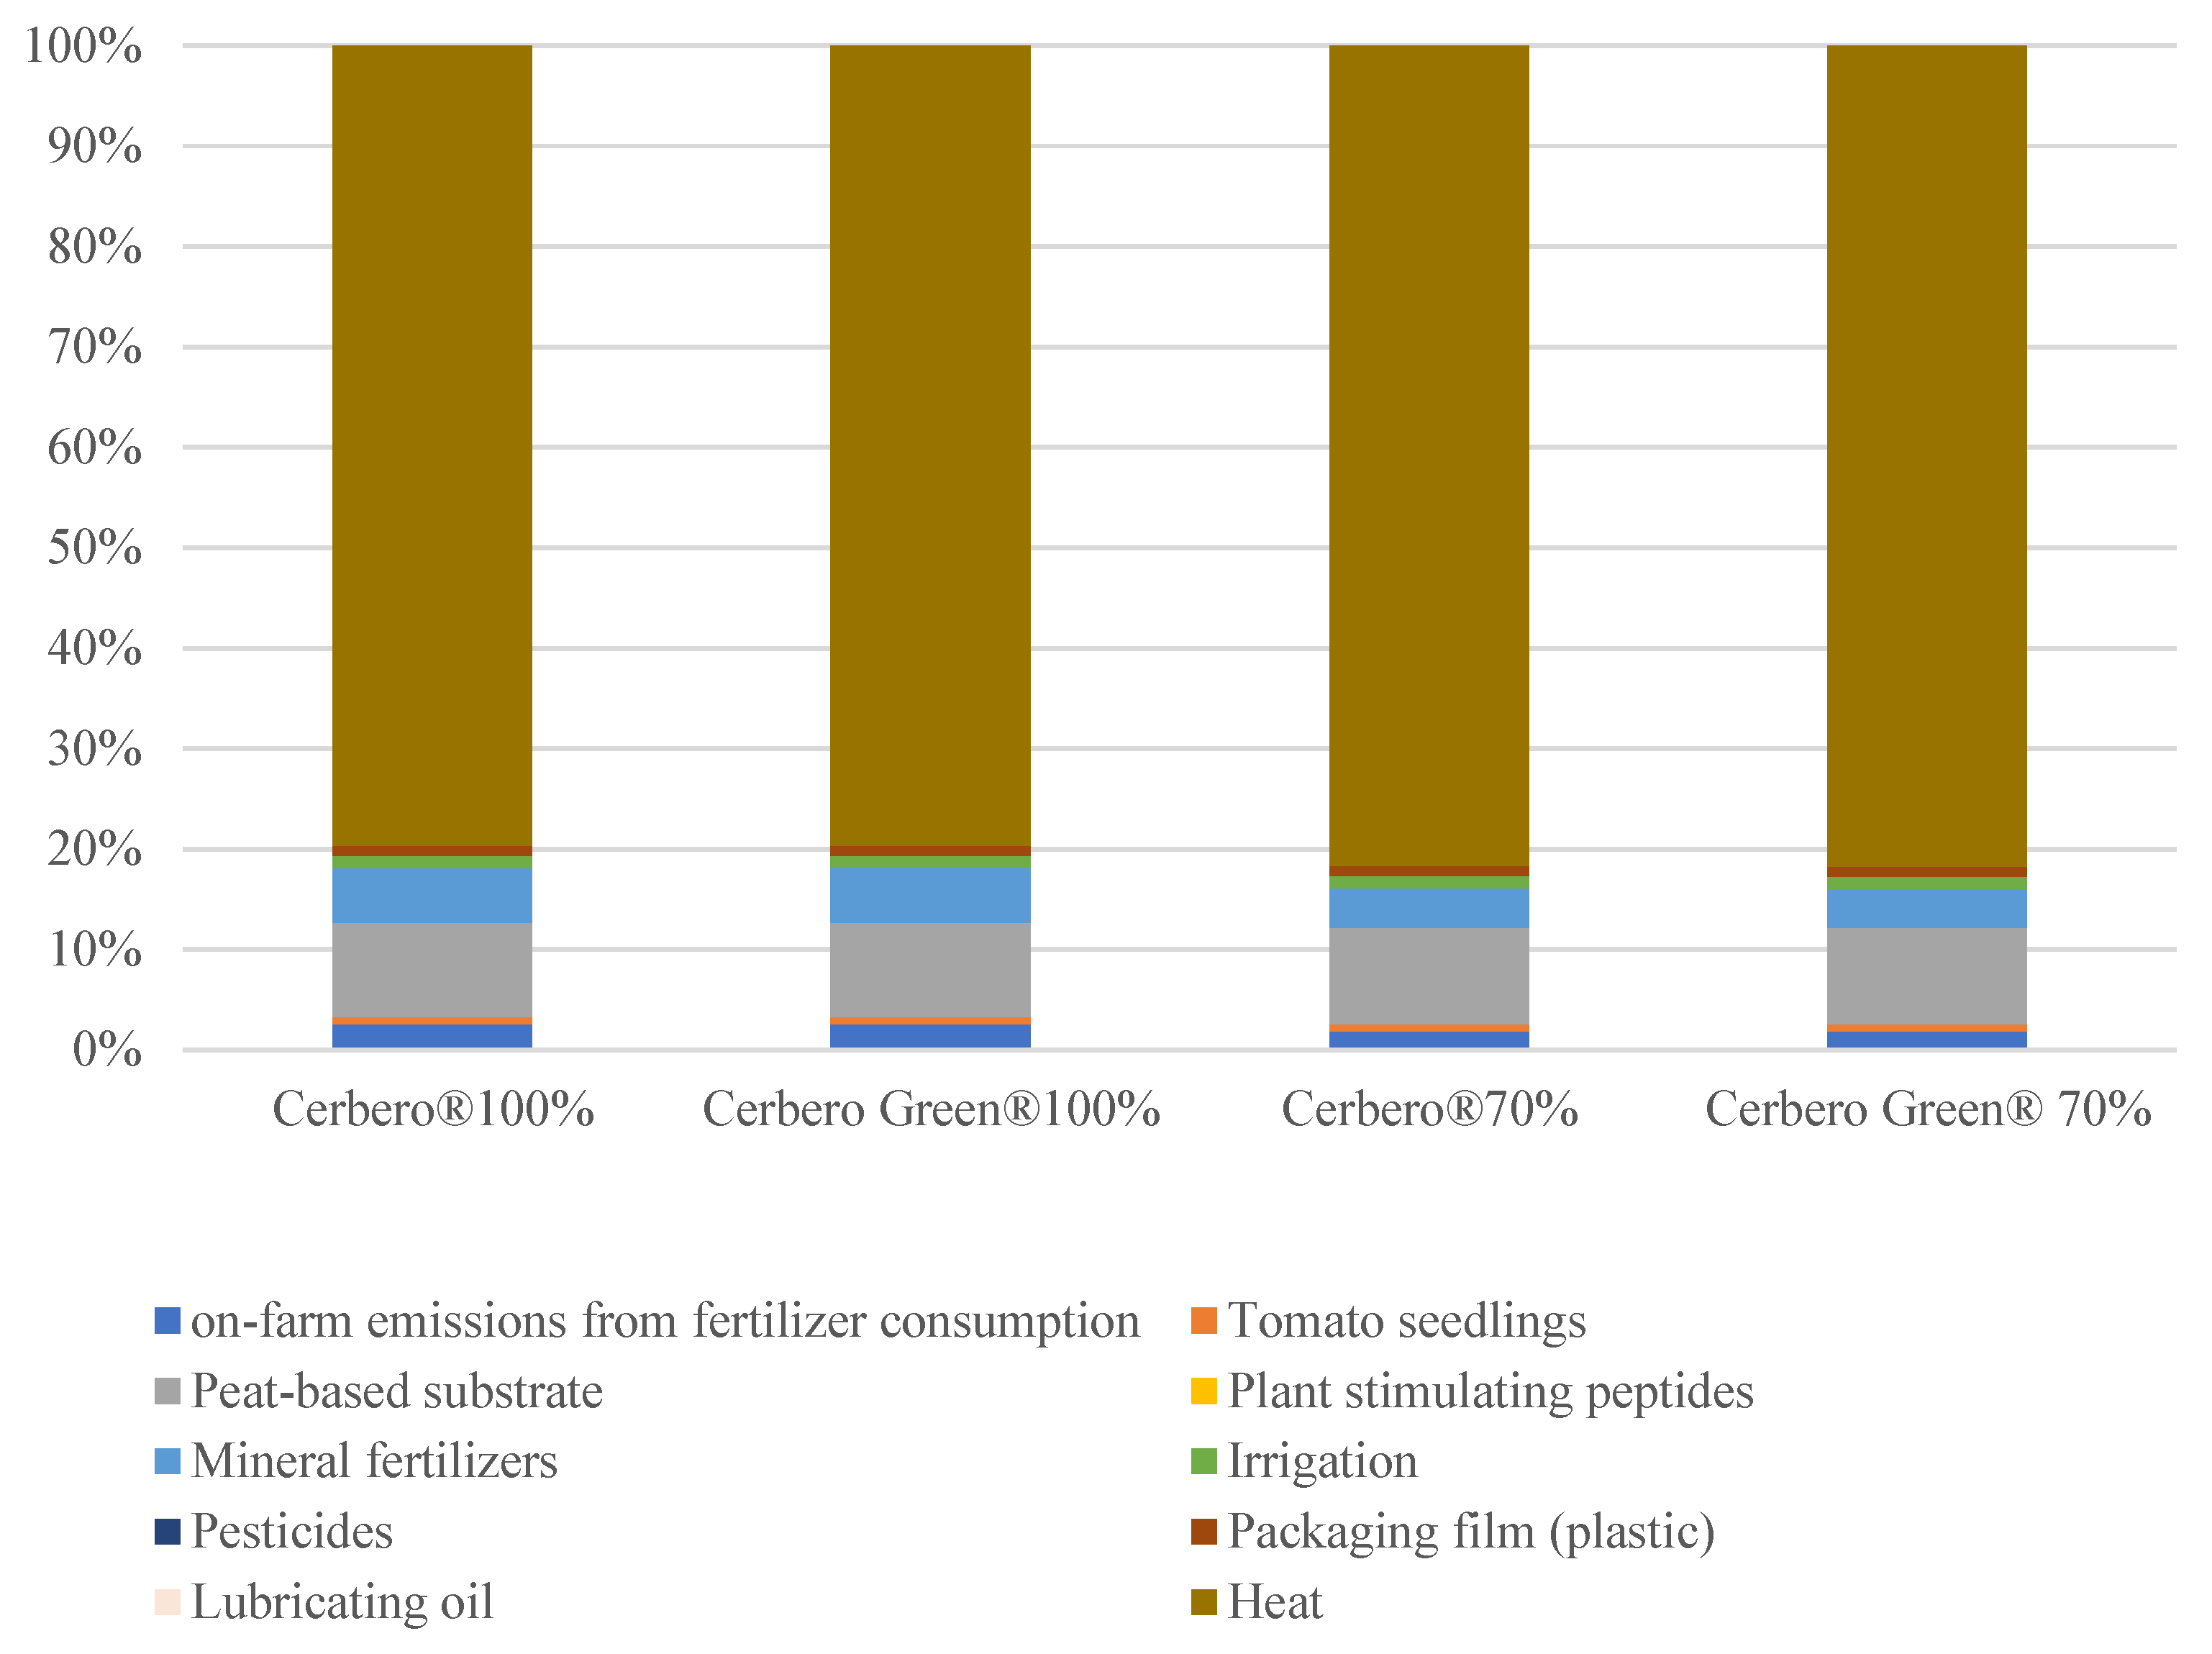
2.2. LCA Results
2.3. Economic Results
3. Discussion
4. Materials and Methods
4.1. Plant Material, Treatments, and Experimental Designs
4.2. Inventory Data Collection
4.3. Life Cycle Assessment and Carbon Footprint
4.4. Partial Budget Analysis
4.5. Statistical Analysis
5. Conclusions
Author Contributions
Funding
Data Availability Statement
Acknowledgments
Conflicts of Interest
Appendix A

| Name | Formula | Hierarchist (100 Years) |
|---|---|---|
| Carbon dioxide | CO2 | 1 |
| Methane | CH4 | 34 |
| Fossil methane | CH4 | 36 |
| Nitrous oxide | N2O | 298 |
| Chlorofluorocarbons | ||
| CFC-11 | CCl3F | 5352 |
| CFC-12 | CCl2F2 | 11,547 |
| CFC-13 | CClF3 | 15,451 |
| CFC-113 | CCl2FCClF2 | 6586 |
| CFC-114 | CClF2CClF2 | 9615 |
| CFC-115 | CClF2CF3 | 8516 |
| Hydrochlorofluoro-carbons | ||
| HCFC-21 | CHCl2F | 179 |
| HCFC-22 | CHClF2 | 2106 |
| HCFC-122 | CHCl2CF2Cl | 72 |
| HCFC-122a | CHFClCFCl2 | 312 |
| HCFC-123 | CHCl2CF3 | 96 |
| HCFC-123a | CHClFCF2Cl | 447 |
| HCFC-124 | CHClFCF3 | 635 |
| HCFC-132c | CH2FCFCl2 | 409 |
| HCFC-141b | CH3CCl2F | 938 |
| HCFC-142b | CH3CClF2 | 2345 |
| HCFC-225ca | CHCl2CF2CF3 | 155 |
| HCFC-225cb | CHClFCF2CClF2 | 633 |
| (E)-1-Chloro-3,3,3- trifluoroprop-1-ene | trans- CF3CH=CHC1 | 2 |
| Hydrofluorocarbons | ||
| HFC-23 | CHF3 | 13,856 |
| HFC-32 | CH2F2 | 817 |
| HFC-41 | CH3F | 141 |
| HFC-125 | CHF2CF3 | 3691 |
| HFC-134 | CHF2CHF2 | 1337 |
| HFC-134a | CH2FCF3 | 1549 |
| HFC-143 | CH2FCHF2 | 397 |
| HFC-143a | CH3CF3 | 5508 |
| HFC-152 | CH2FCH2F | 20 |
| HFC-152a | CH3CHF2 | 167 |
| HFC-161 | CH3CH2F | 4 |
| HFC-227ca | CF3CF2CHF2 | 3077 |
| HFC-227ea | CF3CHFCF3 | 3860 |
| HFC-236cb | CH2FCF2CF3 | 1438 |
| HFC-236ea | CHF2CHFCF3 | 1596 |
| HFC-236fa | CF3CH2CF3 | 8998 |
| HFC-245ca | CH2FCF2CHF2 | 863 |
| HFC-245cb | CF3CF2CH3 | 5298 |
| HFC-245ea | CHF2CHFCHF2 | 285 |
| HFC-245eb | CH2FCHFCF3 | 352 |
| HFC-245fa | CHF2CH2CF3 | 1032 |
| HFC-263fb | CH3CH2CF3 | 92 |
| HFC-272ca | CH3CF2CH3 | 175 |
| HFC-329p | CHF2CF2CF2CF3 | 2742 |
| HFC-365mfc | CH3CF2CH2CF3 | 966 |
| HFC-43-10mee | CF3CHFCHFCF2C F3 | 1952 |
| HFC-1132a | CH2=CF2 | 0 |
| HFC-1141 | CH2=CHF | 0 |
| (Z)-HFC-1225ye | CF3CF=CHF(Z) | 0 |
| (E)-HFC-1225ye | CF3CF=CHF(E) | 0 |
| (Z)-HFC-1234ze | CF3CH=CHF(Z) | 0 |
| HFC-1234yf | CF3CF=CH2 | 0 |
| (E)-HFC-1234ze | trans- CF3CH=CHF | 1 |
| (Z)-HFC-1336 | CF3CH=CHCF3(Z) | 2 |
| HFC-1243zf | CF3CH=CH2 | 0 |
| HFC-1345zfc | C2F5CH=CH2 | 0 |
| 3,3,4,4,5,5,6,6,6- | C4F9CH=CH2 | 0 |
| Nonafluorohex-1-ene | ||
| 3,3,4,4,5,5,6,6,7,7,8,8,8 | C6F13CH=CH2 | 0 |
| -Tridecafluorooct-1-ene | ||
| 3,3,4,4,5,5,6,6,7,7,8,8,9 | C8F17CH=CH2 | 0 |
| ,9,10,10,10- | ||
| Heptadecafluorodecene | ||
| Chlorocarbons and hydrochlorocarbons | ||
| Methyl chloroform | CH3CCl3 | 193 |
| Carbon tetrachloride | CCl4 | 2019 |
| Methyl chloride | CH3Cl | 15 |
| Methylene chloride | CH2Cl2 | 11 |
| Chloroform | CHCl3 | 20 |
| 1,2-Dichloroethane | CH2ClCH2Cl | 1 |
| Bromocarbons, hyrdobromocarbons and Halons | ||
| Methyl bromide | CH3Br | 3 |
| Methylene bromide | CH2Br2 | 1 |
| Halon-1201 | CHBrF2 | 454 |
| Halon-1202 | CBr2F2 | 280 |
| Halon-1211 | CBrClF2 | 2070 |
| Halon-1301 | CBrF3 | 7154 |
| Halon-2301 | CH2BrCF3 | 210 |
| Halon-2311/Halothane | CHBrClCF3 | 50 |
| Halon-2401 | CHFBrCF3 | 223 |
| Halon-2402 | CBrF2CBrF2 | 1734 |
| Fully Fluorinated Species | ||
| Nitrogen trifluoride | NF3 | 17,885 |
| Sulphur hexafluoride | SF6 | 26,087 |
| (Trifluoromethyl) sulfur | SF5CF3 | 19,396 |
| pentafluoride | ||
| Sulfuryl fluoride | SO2F2 | 4732 |
| PFC-14 | CF4 | 7349 |
| PFC-116 | C2F6 | 12,340 |
| PFC-c216 | c-C3F6 | 10,208 |
| PFC-218 | C3F8 | 9878 |
| PFC-318 | c-C4F8 | 10,592 |
| PFC-31-10 | C4F10 | 10,213 |
| Perfluorocyclopentene | c-C5F8 | 2 |
| PFC-41-12 | n-C5F12 | 9484 |
| PFC-51-14 | n-C6F14 | 8780 |
| PFC-61-16 | n-C7F16 | 8681 |
| PFC-71-18 | C8F18 | 8456 |
| PFC-91-18 | C10F18 | 7977 |
| Perfluorodecalin(cis) | Z-C10F18 | 8033 |
| Perfluorodecalin(trans) | E-C10F18 | 6980 |
| PFC-1114 | CF2=CF2 | 0 |
| PFC-1216 | CF3CF=CF2 | 0 |
| Perfluorobuta-1,3-diene | CF2=CFCF=CF2 | 0 |
| Perfluorobut-1-ene | CF3CF2CF=CF2 | 0 |
| Perfluorobut-2-ene | CF3CF=CFCF3 | 2 |
| Halogenated alcohols and ethers | ||
| HFE-125 | CHF2OCF3 | 13,951 |
| HFE-134 (HG-00) | CHF2OCHF2 | 6512 |
| HFE-143a | CH3OCF3 | 632 |
| HFE-227ea | CF3CHFOCF3 | 7377 |
| HCFE-235ca2(enflurane) | CHF2OCF2CHFCl | 705 |
| HCFE-235da2(isoflurane) | CHF2OCHClCF3 | 595 |
| HFE-236ca | CHF2OCF2CHF2 | 4990 |
| HFE-236ea2(desflurane) | CHF2OCHFCF3 | 2143 |
| HFE-236fa | CF3CH2OCF3 | 1177 |
| HFE-245cb2 | CF3CF2OCH3 | 790 |
| HFE-245fa1 | CHF2CH2OCF3 | 997 |
| HFE-245fa2 | CHF2OCH2CF3 | 981 |
| 2,2,3,3,3- | CF3CF2CH2OH | 23 |
| Pentafluoropropane-1-ol | ||
| HFE-254cb1 | CH3OCF2CHF2 | 365 |
| HFE-263fb2 | CF3CH2OCH3 | 2 |
| HFE-263m1 | CF3OCH2CH3 | 26 |
| 3,3,3-Trifluoropropan-1- ol | CF3CH2CH2OH | 0 |
| HFE-329mcc2 | CHF2CF2OCF2CF 3 | 3598 |
| HFE-338mmz1 | (CF3)2CHOCHF2 | 3081 |
| HFE-338mcf2 | CF3CH2OCF2CF3 | 1118 |
| Sevoflurane (HFE- | (CF3)2CHOCH2F | 262 |
| 347mmz1) | ||
| HFE-347mcc3 (HFE- | CH3OCF2CF2CF3 | 641 |
| 7000) | ||
| HFE-347mcf2 | CHF2CH2OCF2CF3 | 1028 |
| HFE-347pcf2 | CHF2CF2OCH2CF3 | 1072 |
| HFE-347mmy1 | (CF3)2CFOCH3 | 440 |
| HFE-356mec3 | CH3OCF2CHFCF3 | 468 |
| HFE-356mff2 | CF3CH2OCH2CF3 | 20 |
| HFE-356pcf2 | CHF2CH2OCF2C HF2 | 867 |
| HFE-356pcf3 | CHF2OCH2CF2C | 540 |
| HFE-356pcc3 | CH3OCF2CF2CHF2 | 500 |
| HFE-356mmz1 | (CF3)2CHOCH3 | 17 |
| HFE-365mcf3 | CF3CF2CH2OCH3 | 1 |
| HFE-365mcf2 | CF3CF2OCH2CH3 | 71 |
| HFE-374pc2 | CHF2CF2OCH2CH3 | 758 |
| 4,4,4-Trifluorobutan-1-ol | CF3(CH2)2CH2OH | 0 |
| 2,2,3,3,4,4,5,5- | (CF2)4CH(OH) | 16 |
| Octafluorocyclopentanol | ||
| HFE-43-10pccc124(H- | CHF2OCF2OC2F4 | 3353 |
| Galden 1040x,HG-11) | OCHF2 | |
| HFE-449s1 (HFE-7100) | C4F9OCH3 | 509 |
| n-HFE-7100 | n-C4F9OCH3 | 587 |
| i-HFE-7100 | i-C4F9OCH3 | 492 |
| HFE-569sf2 (HFE-7200) | C4F9OC2H5 | 69 |
| n-HFE-7200 | n-C4F9OC2H5 | 79 |
| i-HFE-7200 | i-C4F9OC2H5 | 54 |
| HFE-236ca12 (HG-10) | CHF2OCF2OCHF2 | 6260 |
| HFE-338pcc13 (HG-01) | CHF2OCF2CF2OCHF2 | 3466 |
| 1,1,1,3,3,3- | (CF3)2CHOH | 221 |
| Hexafluoropropane-2-ol | ||
| HG-02 | HF2C–(OCF2CF2)2– OCF2H | 3250 |
| HG-03 | HF2C–(OCF2CF2)3– OCF2H | 3400 |
| HG-20 | HF2C–(OCF2)2– OCF2H | 6201 |
| HG-21 | HF2C– OCF2CF2OCF2OC F2O–CF2H | 4628 |
| HG-30 | HF2C–(OCF2)3– OCF2H | 8575 |
| 1-Ethoxy-1,1,2,2,3,3,3- | CF3CF2CF2OCH2 CH3 | 74 |
| heptafluoropropane | ||
| Fluoroxene | CF3CH2OCH=CH2 | 0 |
| 1,1,2,2-Tetrafluoro-1- | CH2FOCF2CF2H | 1051 |
| (fluoromethoxy)ethane | ||
| 2-Ethoxy-3,3,4,4,5- | C12H5F19O2 | 68 |
| pentafluorotetrahydro- | ||
| 2,5-bis[1,2,2,2- | ||
| tetrafluoro-1- | ||
| (trifluoromethyl)ethyl]- | ||
| furan | ||
| Fluoro(methoxy)methane | CH3OCH2F | 15 |
| Difluoro(methoxy)methane | CH3OCHF2 | 175 |
| Fluoro(fluoromethoxy)- | CH2FOCH2F | 159 |
| methane | ||
| Difluoro(fluoromethoxy)- | CH2FOCHF2 | 748 |
| methane | ||
| Trifluoro(fluoromethoxy)- | CH2FOCF3 | 909 |
| methane | ||
| HG'-01 | CH3OCF2CF2OC H3 | 269 |
| HG'-02 | CH3O(CF2CF2O) 2CH3 | 287 |
| HG'-03 | CH3O(CF2CF2O) 3CH3 | 268 |
| HFE-329me3 | CF3CFHCF2OCF3 | 5241 |
| 3,3,4,4,5,5,6,6,7,7,7- | CF3(CF2)4CH2C H2OH | 1 |
| Undecafluoroheptan-1-ol | ||
| 3,3,4,4,5,5,6,6,7,7,8,8,9 | CF3(CF2)6CH2C H2OH | 0 |
| ,9,9- Pentadecafluorononan-1-ol | ||
| 3,3,4,4,5,5,6,6,7,7,8,8,9 | CF3(CF2)8CH2C H2OH | 0 |
| ,9,10,10,11,11,11- | ||
| Nonadecafluoroundecan-1-ol | ||
| 2-Chloro-1,1,2-trifluoro- | CH3OCF2CHFCl | 149 |
| 1-methoxyethane | ||
| PFPMIE(perfluoropoly- methylisopropyl ether) | CF3OCF(CF3)CF2 OCF2OCF3 | 10,789 |
| HFE-216 | CF3OCF=CF2 | 0 |
| Trifluoromethylformate | HCOOCF3 | 712 |
| Perfluoroethylformate | HCOOCF2CF3 | 703 |
| Perfluoropropylformate | HCOOCF2CF2CF3 | 456 |
| Perfluorobutylformate | HCOOCF2CF2CF2 CF3 | 475 |
| 2,2,2- Trifluoroethylformate | HCOOCH2CH2CF3 | 41 |
| 3,3,3- Trifluoropropylformate | HCOOCHFCF3 | 21 |
| 1,2,2,2- Tetrafluoroethylformate | HCOOCHFCF3 | 569 |
| 1,1,1,3,3,3- Hexafluoropropan-2- ylformate | HCOOCH(CF3)2 | 403 |
| Perfluoropropylacetate | CH3COOCF2CF2 CF2CF3 | 2 |
| Perfluoroethylacetate | CH3COOCF2CF2 CF3 | 2 |
| Perfluorobutylacetate | CH3COOCF2CF3 | 3 |
| Trifluoromethylacetate | CH3COOCF3 | 3 |
| Methylcarbonofluoridate | FCOOCH3 | 116 |
| 1,1- Difluoroethylcarbonofluoridate | FCOOCF2CH3 | 33 |
| 1,1-Difluoroethyl2,2,2- trifluoroacetate | CF3COOCH2CF3 | 38 |
| Ethyl 2,2,2- trifluoroacetate | CF3COOCH2CH3 | 2 |
| 2,2,2-Trifluoroethyl2,2,2-trifluoroacetate | CF3COOCH2CF3 | 8 |
| Methyl 2,2,2- trifluoroacetate | CF3COOCH3 | 64 |
| Methyl 2,2-difluoroacetate | HCF2COOCH3 | 4 |
| Difluoromethyl 2,2,2- | CF3COOCHF2 | 33 |
| trifluoroacetate 2,2,3,3,4,4,4- Heptafluorobutan-1-ol | C3F7CH2OH | 41 |
| 1,1,2-Trifluoro-2- (trifluoromethoxy)- ethane | CHF2CHFOCF3 | 1489 |
| 1-Ethoxy-1,1,2,3,3,3- | CF3CHFCF2OCH2 CH3 | 28 |
| hexafluoropropane | ||
| 1,1,1,2,2,3,3- Heptafluoro-3-(1,2,2,2- tetrafluoroethoxy)- propane | CF3CF2CF2OCHF CF3 | 7371 |
| 2,2,3,3-Tetrafluoro- 1- propanol | CHF2CF2CH2OH | 16 |
| 2,2,3,4,4,4-Hexafluoro- 1-butanol | CF3CHFCF2CH2OH | 21 |
| 2,2,3,3,4,4,4- Heptafluoro-1-butanol | CF3CF2CF2CH2OH | 20 |
| 1,1,2,2-Tetrafluoro-3- methoxy-propane | CHF2CF2CH2OC H3 | 1 |
| perfluoro-2-methyl-3- pentanone | CF3CF2C(O)CF(C F3)2 | 0 |
| 3,3,3-Trifluoropropanal | CF3CH2CHO | 0 |
| 2-Fluoroethanol | CH2FCH2OH | 1 |
| 2,2-Difluoroethanol | CHF2CH2OH | 4 |
| 2,2,2-Trifluoroethanol | CF3CH2OH | 24 |
| 1,1’-Oxybis[2- (difluoromethoxy)- 1,1,2,2-tetrafluoroethane | HCF2O(CF2CF2O)2CF2H | 5741 |
| 1,1,3,3,4,4,6,6,7,7,9,9,10,10,12,12- hexadecafluoro-2,5,8,11- Tetraoxadodecane | HCF2O(CF2CF2O)3CF2H | 5245 |
| 1,1,3,3,4,4,6,6,7,7,9,9,10,10,12,12,13,13,15,15- eicosafluoro-2,5,8,11,14-Pentaoxapentadecane | HCF2O(CF2CF2O)4CF2H | 4240 |
References
- Szparaga, A.; Kuboń, M.; Kocira, S.; Czerwińska, E.; Pawłowska, A.; Hara, P.; Kobus, Z.; Kwaśniewski, D. Towards sustainable agriculture—Agronomic and economic effects of biostimulant use in common bean cultivation. Sustainability 2019, 11, 4575. [Google Scholar] [CrossRef]
- Fan, S.; Pandya-Lorch, R.; Yosef, S. Resilience for Food and Nutrition Security; IFPRI: Washington, DC, USA, 2014. [Google Scholar]
- Food and Agriculture Organization of the United Nations. Towards the Future We Want: End Hunger and Make the Transition to Sustainable Agricultural and Food Systems; FAO: Rome, Italy, 2012. [Google Scholar]
- Shahzad, A.; Ullah, S.; Dar, A.A.; Sardar, M.F.; Mehmood, T.; Tufail, M.A.; Shakoor, A.; Haris, M. Nexus on climate change: Agriculture and possible solution to cope future climate change stresses. Environ. Sci. Pollut. Res. 2021, 28, 14211–14232. [Google Scholar] [CrossRef] [PubMed]
- Aznar-Sánchez, J.A.; Velasco-Muñoz, J.F.; López-Felices, B.; Román-Sánchez, I.M. An analysis of global research trends on greenhouse technology: Towards a sustainable agriculture. Int. J. Environ. Res. Public Health 2020, 17, 664. [Google Scholar] [CrossRef] [PubMed]
- Nieves-Cordones, M.; Rubio, F.; Santa-María, G.E. Nutrient use-efficiency in plants: An integrative approach. Front. Plant Sci. 2020, 11, 623976. [Google Scholar] [CrossRef] [PubMed]
- Hong, C.; Burney, J.A.; Pongratz, J.; Nabel, J.E.; Mueller, N.D.; Jackson, R.B.; Davis, S.J. Global and regional drivers of land-use emissions in 1961–2017. Nature 2021, 589, 554–561. [Google Scholar] [CrossRef] [PubMed]
- Viana, C.M.; Freire, D.; Abrantes, P.; Rocha, J.; Pereira, P. Agricultural land systems importance for supporting food security and sustainable development goals: A systematic review. Sci. Total Environ. 2022, 806, 150718. [Google Scholar] [CrossRef] [PubMed]
- Baum, R.; Bieńkowski, J. Eco-efficiency in measuring the sustainable production of agricultural crops. Sustainability 2020, 12, 1418. [Google Scholar] [CrossRef]
- Martínez-Dalmau, J.; Berbel, J.; Ordóñez-Fernández, R. Nitrogen fertilization. A review of the risks associated with the inefficiency of its use and policy responses. Sustainability 2021, 13, 5625. [Google Scholar] [CrossRef]
- Mathur, M.; Goel, A. Quantitative attributes of nutrient uptake and use efficiency. In Essential Plant Nutrients; Springer: Cham, Switzerland, 2017; pp. 81–117. [Google Scholar]
- Reich, M.; Aghajanzadeh, T.; De Kok, L.J. Physiological basis of plant nutrient use efficiency–concepts, opportunities and challenges for its improvement. In Nutrient Use Efficiency in Plants; Springer: Cham, Switzerland, 2014; pp. 1–27. [Google Scholar]
- Khan, N.; Ray, R.L.; Sargani, G.R.; Ihtisham, M.; Khayyam, M.; Ismail, S. Current progress and future prospects of agriculture technology: Gateway to sustainable agriculture. Sustainability 2021, 13, 4883. [Google Scholar] [CrossRef]
- Ruzzante, S.; Labarta, R.; Bilton, A. Adoption of agricultural technology in the developing world: A meta-analysis of the empirical literature. World Dev. 2021, 146, 105599. [Google Scholar] [CrossRef]
- Calvo, P.; Nelson, L.; Kloepper, J.W. Agricultural uses of plant biostimulants. Plant Soil 2014, 383, 3–41. [Google Scholar] [CrossRef]
- Xu, L.; Geelen, D. Developing biostimulants from agro-food and industrial by-products. Front. Plant Sci. 2018, 9, 1567. [Google Scholar] [CrossRef] [PubMed]
- Meddich, A. Biostimulants for resilient agriculture—Improving plant tolerance to abiotic stress: A concise review. Gesunde Pflanz. 2023, 75, 709–727. [Google Scholar] [CrossRef]
- Baltazar, M.; Correia, S.; Guinan, K.J.; Sujeeth, N.; Bragança, R.; Gonçalves, B. Recent advances in the molecular effects of biostimulants in plants: An overview. Biomolecules 2021, 11, 1096. [Google Scholar] [CrossRef] [PubMed]
- Sestili, F.; Rouphael, Y.; Cardarelli, M.; Pucci, A.; Bonini, P.; Canaguier, R.; Colla, G. Protein hydrolysate stimulates growth in tomato coupled with N-dependent gene expression involved in N assimilation. Front. Plant Sci. 2018, 9, 1233. [Google Scholar] [CrossRef] [PubMed]
- Carillo, P.; Colla, G.; Fusco, G.M.; Dell’Aversana, E.; El-Nakhel, C.; Giordano, M.; Pannico, A.; Cozzolino, E.; Mori, M.; Reynaud, H.; et al. Morphological and Physiological Responses Induced by Protein Hydrolysate-Based Biostimulant and Nitrogen Rates in Greenhouse Spinach. Agronomy 2019, 9, 450. [Google Scholar] [CrossRef]
- Malécange, M.; Sergheraert, R.; Teulat, B.; Mounier, E.; Lothier, J.; Sakr, S. Biostimulant Properties of Protein Hydrolysates: Recent Advances and Future Challenges. Int. J. Mol. Sci. 2023, 24, 9714. [Google Scholar] [CrossRef] [PubMed]
- Rajabi Hamedani, S.; Rouphael, Y.; Colla, G.; Colantoni, A.; Cardarelli, M. Biostimulants as a tool for improving environmental sustainability of greenhouse vegetable crops. Sustainability 2020, 12, 5101. [Google Scholar] [CrossRef]
- Colla, G.; Cardarelli, M.; Bonini, P.; Rouphael, Y. Foliar applications of protein hydrolysate, plant and seaweed extracts increase yield but differentially modulate fruit quality of greenhouse tomato. Hortscience 2017, 52, 1214–1220. [Google Scholar] [CrossRef]
- Franzoni, G.; Bulgari, R.; Florio, F.E.; Gozio, E.; Villa, D.; Cocetta, G.; Ferrante, A. Effect of biostimulant raw materials on soybean (Glycine max) crop, when applied alone or in combination with herbicides. Front. Agron. 2023, 5, 1238273. [Google Scholar] [CrossRef]
- Gómez, E.; Alonso, A.; Sánchez, J.; Muñoz, P.; Marín, J.; Mostaza-Colado, D.; Mauri, P.V. Application of Biostimulant in Seeds and Soil on Three Chickpea Varieties: Impacts on Germination, Vegetative Development, and Bacterial Facilitation of Nitrogen and Phosphorus. Life 2024, 14, 148. [Google Scholar] [CrossRef] [PubMed]
- Yakhin, O.I.; Lubyanov, A.A.; Yakhin, I.A.; Brown, P.H. Biostimulants in plant science: A global perspective. Front. Plant Sci. 2017, 7, 2049. [Google Scholar] [CrossRef] [PubMed]
- Rouphael, Y.; Colla, G.; Giordano, M.; El-Nakhel, C.; Kyriacou, M.C.; De Pascale, S. Foliar applications of a legume-derived protein hydrolysate elicit dose-dependent increases of growth, leaf mineral composition, yield and fruit quality in two greenhouse tomato cultivars. Sci. Hortic. 2017, 226, 353–360. [Google Scholar] [CrossRef]
- Parađiković, N.; Teklić, T.; Zeljković, S.; Lisjak, M.; Špoljarević, M. Biostimulants research in some horticultural plant species—A review. Food Energy Secur. 2019, 8, e00162. [Google Scholar] [CrossRef]
- Ceccarelli, A.V.; Miras-Moreno, B.; Buffagni, V.; Senizza, B.; Pii, Y.; Cardarelli, M.; Rouphael, Y.; Colla, G.; Lucini, L. Foliar application of different vegetal-derived protein hydrolysates distinctively modulates tomato root development and metabolism. Plants 2021, 10, 326. [Google Scholar] [CrossRef] [PubMed]
- Santi, C.; Zamboni, A.; Varanini, Z.; Pandolfini, T. Growth stimulatory effects and genome-wide transcriptional changes produced by protein hydrolysates in maize seedlings. Front. Plant Sci. 2017, 8, 433. [Google Scholar] [CrossRef] [PubMed]
- Halpern, M.; Bar-Tal, A.; Ofek, M.; Minz, D.; Muller, T.; Yermiyahu, U. The use of biostimulants for enhancing nutrient uptake. Adv. Agron. 2015, 130, 141–174. [Google Scholar]
- Rouphael, Y.; Colla, G. Toward a sustainable agriculture through plant biostimulants: From experimental data to practical applications. Agronomy 2020, 10, 1461. [Google Scholar] [CrossRef]
- Bathaei, A.; Štreimikienė, D. A Systematic Review of Agricultural Sustainability Indicators. Agriculture 2023, 13, 241. [Google Scholar] [CrossRef]
- Lankoski, J.; Lankoski, L. Environmental sustainability in agriculture: Identification of bottlenecks. Ecol. Econ. 2023, 204, 107656. [Google Scholar] [CrossRef]
- Achakzai, A.G.; Gul, S.; Buriro, A.H.; Khan, H.; Mushtaq, A.; Bano, A.; Agha, S.; Kamran, K.; Ponya, Z.; Ismail, T. Biochar-fertilizer mixture: Does plant life history trait determine fertilizer application rate? Environ. Pollut. Bioavailab. 2023, 35, 2170282. [Google Scholar] [CrossRef]
- Penuelas, J.; Coello, F.; Sardans, J. A better use of fertilizers is needed for global food security and environmental sustainability. Agric. Food Secur. 2023, 12, 5. [Google Scholar] [CrossRef]
- Lakhdar, A.; Trigui, M.; Montemurro, F. An Overview of Biostimulants’ Effects in Saline Soils. Agronomy 2023, 13, 2092. [Google Scholar] [CrossRef]
- Sarwar, B.; Sher, A.; Ijaz, M.; Irfan, M.; Ul-Allah, S. Exogenous Application of Biostimulants and Commercial Utilization. In Climate-Resilient Agriculture, Vol 2: Agro-Biotechnological Advancement for Crop Production; Springer: Berlin/Heidelberg, Germany, 2023; pp. 281–294. [Google Scholar]
- Sun, W.; Shahrajabian, M.H. The application of arbuscular mycorrhizal fungi as microbial biostimulant, sustainable approaches in modern agriculture. Plants 2023, 12, 3101. [Google Scholar] [CrossRef] [PubMed]
- Huijbregts, M.A.; Steinmann, Z.J.; Elshout, P.M.; Stam, G.; Verones, F.; Vieira, M.; Zijp, M.; Hollander, A.; Van Zelm, R. ReCiPe2016: A harmonised life cycle impact assessment method at midpoint and endpoint level. Int. J. Life Cycle Assess. 2017, 22, 138–147. [Google Scholar] [CrossRef]
- Sanjuan-Delmás, D.; Llorach-Massana, P.; Nadal, A.; Ercilla-Montserrat, M.; Muñoz, P.; Montero, J.I.; Josa, A.; Gabarrell, X.; Rieradevall, J. Environmental assessment of an integrated rooftop greenhouse for food production in cities. J. Clean. Prod. 2018, 177, 326–337. [Google Scholar] [CrossRef]
- Romero-Gámez, M.; Antón, A.; Leyva, R.; Suárez-Rey, E.M. Inclusion of uncertainty in the LCA comparison of different cherry tomato production scenarios. Int. J. Life Cycle Assess. 2017, 22, 798–811. [Google Scholar] [CrossRef]
- Maham, S.G.; Rahimi, A.; Subramanian, S.; Smith, D.L. The environmental impacts of organic greenhouse tomato production based on the nitrogen-fixing plant (Azolla). J. Clean. Prod. 2020, 245, 118679. [Google Scholar] [CrossRef]
- Bosona, T.; Gebresenbet, G. Life cycle analysis of organic tomato production and supply in Sweden. J. Clean. Prod. 2018, 196, 635–643. [Google Scholar] [CrossRef]
- IPPC. 2006 Guidelines for National Greenhouse Gas Inventories; Institute for Global Environmental Strategies: Atsugi, Japan, 2006. [Google Scholar]
- Djidonou, D.; Gao, Z.; Zhao, X. Economic analysis of grafted tomato production in sandy soils in northern Florida. HortTechnology 2013, 23, 613–621. [Google Scholar] [CrossRef]
| Treatment | Fruit Yield (t/ha) | Fruit Number (n/m2) | Fruit Mean Weight (g/fruit) |
|---|---|---|---|
| Cerbero® 100% | 53.9 ± 0.3 c | 39.1 ± 0.1 b | 138.5 ± 1.5 ab |
| Cerbero Green® 100% | 56.6 ± 0.2 b | 42.1 ± 0.1 a | 134.2 ± 0.1 b |
| Cerbero® 70% | 55.5 ± 0.6 bc | 40.0 ± 1.3 ab | 138.7 ± 1.7 ab |
| Cerbero Green® 70% | 60.8 ± 0.6 a | 42.4 ± 0.2 a | 143.5 ± 1.8 a |
| Significance | *** | ** | * |
| Impact Category | Unit | Cerbero® 100% | Cerbero Green® 100% | Cerbero® 70% | Cerbero Green® 70% |
|---|---|---|---|---|---|
| Global warming | kg CO2 eq | 2029.51 | 1932.96 | 1923.08 | 1753.95 |
| Ozone formation, Human health | kg NOx eq | 1.28 | 1.22 | 1.18 | 1.08 |
| Ozone formation, Terrestrial ecosystems | kg NOx eq | 1.33 | 1.27 | 1.23 | 1.12 |
| Freshwater eutrophication | kg P eq | 0.05 | 0.05 | 0.04 | 0.04 |
| Terrestrial ecotoxicity | kg 1,4-DCB | 472.65 | 450.37 | 371.72 | 353.31 |
| Freshwater ecotoxicity | kg 1,4-DCB | 4.68 | 4.46 | 3.89 | 3.65 |
| Marine ecotoxicity | kg 1,4-DCB | 9.48 | 9.04 | 8.27 | 7.69 |
| Human carcinogenic toxicity | kg 1,4-DCB | 9.13 | 8.70 | 8.31 | 7.59 |
| Human non-carcinogenic toxicity | kg 1,4-DCB | 133.35 | 127.16 | 108.67 | 103.31 |
| Fossil resource scarcity | kg oil eq | 722.56 | 688.16 | 696.49 | 635.63 |
| Water consumption | m3 | 69.36 | 66.06 | 66.90 | 60.74 |
| Treatment | Additional Revenue ($/ha) | Additional Variable Cost ($/ha) | Net Change in Profit ($/ha) |
|---|---|---|---|
| Cerbero Green® 100% | 2970 | 605 | 2365 |
| Cerbero Green® 70% | 5830 | 1080 | 4750 |
| System Description | Impact Category | Quantity (kg CO2 per 1 Ton of Tomato) | Reference |
|---|---|---|---|
| Greenhouse tomato with biostimulant application heated by natural gas; scope of grate to gate | GWP | 1754–2029 | Current study |
| Unheated organic greenhouse tomato in Spain; scope of cradle to consumer gate | GWP | 580 | [41] |
| Unheated conventional greenhouse tomato in Spain; scope of cradle to farm gate | GWP | 617 | [42] |
| Organic greenhouse tomato heated by electric heater in Canada; scope of cradle to farm gate | GWP | 269 | [43] |
| Organic greenhouse tomato heated by woodchips in Sweden; scope of cradle to consumer gate | GWP | 547 | [44] |
| Fertilizer Type | Fertilizer Rate (g/L) | ||||||
|---|---|---|---|---|---|---|---|
| <2nd Cluster | 3rd Cluster | 4th Cluster | 5th Cluster | 6th Cluster | 7th Cluster | >8th Cluster | |
| Cerbero® or Cerbero Green® (13% N; 40% P2O5; 13% K2O; 2% MgO) | 0.50 | 0.80 | 0.00 | 0.00 | 0.00 | 0.00 | 0.00 |
| Cerbero® or Cerbero Green® (15% N; 5% P2O5; 30% K2O; 2% MgO) | 0.00 | 0.00 | 1.00 | 1.00 | 1.00 | 1.10 | 1.10 |
| Potassium nitrate (13.5% N; 46.2% K2O) | 0.00 | 0.00 | 0.50 | 0.50 | 0.30 | 0.30 | 0.30 |
| Magnesium nitrate (11% N; 16% MgO) | 0.25 | 0.25 | 0.25 | 0.25 | 0.50 | 0.50 | 0.50 |
| Calcium nitrate (15.5% N; 26.5% CaO) | 0.25 | 0.25 | 0.25 | 0.25 | 1.20 | 1.15 | 1.15 |
| Iron chelate (6% Fe-EDDHA) | 0.025 | 0.025 | 0.025 | 0.025 | 0.025 | 0.025 | 0.05 |
| Microelement complex (4%Fe; 4% Mn; 1% Zn; 0.5% Cu; 0.5% B; 0.2% Mo) | 0.025 | 0.025 | 0.025 | 0.025 | 0.025 | 0.025 | 0.025 |
| Characteristics | Coefficient | Emission Fate |
|---|---|---|
| Emissions from mineral fertilizers | [45] | |
| N in mineral fertilizer | 0.01 | N2O-N to air |
| Indirect N2O from atmospheric deposition of fertilizers | [45] | |
| N in mineral fertilizer | 0.01 × 0.1 | N2O-N to air |
| Items | Unit | Quantity (Unit ha−1) | |||
|---|---|---|---|---|---|
| Cerbero® 100% | Cerbero Green® 100% | Cerbero® 70% | Cerbero Green® 70% | ||
| Output to technosphere | |||||
| Fruit yield | t | 53.9 | 56.6 | 55.5 | 60.8 |
| Input from technosphere | |||||
| Seedlings | n | 20,000 | 20,000 | 20,000 | 20,000 |
| Peat-based substrate | m3 | 80 | 80 | 80 | 80 |
| Mineral fertilizers | kg | 1515 | 1515 | 1061 | 1061 |
| Vegetal-derived protein hydrolysate | kg | 0 | 8.60 | 0 | 8.60 |
| Irrigation | m3 | 3600 | 3600 | 3600 | 3600 |
| Deltamethrin | g | 75 | 75 | 75 | 75 |
| Abamectin | g | 40 | 40 | 40 | 40 |
| Copper oxychloride | kg | 3 | 3 | 3 | 3 |
| Plastic | kg | 360 | 360 | 360 | 360 |
| Lubricant | kg | 5 | 5 | 5 | 5 |
| Heating (natural gas) | GJ | 1259 | 1259 | 1259 | 1259 |
| Output to environment | |||||
| Emission to air | |||||
| N2O | kg | 8.63 | 8.63 | 6.03 | 6.03 |
| Indirect N2O | kg | 0.86 | 0.86 | 0.60 | 0.60 |
Disclaimer/Publisher’s Note: The statements, opinions and data contained in all publications are solely those of the individual author(s) and contributor(s) and not of MDPI and/or the editor(s). MDPI and/or the editor(s) disclaim responsibility for any injury to people or property resulting from any ideas, methods, instructions or products referred to in the content. |
© 2024 by the authors. Licensee MDPI, Basel, Switzerland. This article is an open access article distributed under the terms and conditions of the Creative Commons Attribution (CC BY) license (https://creativecommons.org/licenses/by/4.0/).
Share and Cite
Ciriello, M.; Rajabi Hamedani, S.; Rouphael, Y.; Colla, G.; Cardarelli, M. Enriching NPK Mineral Fertilizer with Plant-Stimulating Peptides Increases Soilless Tomato Production, Grower Profit, and Environmental Sustainability. Plants 2024, 13, 2004. https://doi.org/10.3390/plants13142004
Ciriello M, Rajabi Hamedani S, Rouphael Y, Colla G, Cardarelli M. Enriching NPK Mineral Fertilizer with Plant-Stimulating Peptides Increases Soilless Tomato Production, Grower Profit, and Environmental Sustainability. Plants. 2024; 13(14):2004. https://doi.org/10.3390/plants13142004
Chicago/Turabian StyleCiriello, Michele, Sara Rajabi Hamedani, Youssef Rouphael, Giuseppe Colla, and Mariateresa Cardarelli. 2024. "Enriching NPK Mineral Fertilizer with Plant-Stimulating Peptides Increases Soilless Tomato Production, Grower Profit, and Environmental Sustainability" Plants 13, no. 14: 2004. https://doi.org/10.3390/plants13142004
APA StyleCiriello, M., Rajabi Hamedani, S., Rouphael, Y., Colla, G., & Cardarelli, M. (2024). Enriching NPK Mineral Fertilizer with Plant-Stimulating Peptides Increases Soilless Tomato Production, Grower Profit, and Environmental Sustainability. Plants, 13(14), 2004. https://doi.org/10.3390/plants13142004