
A Comparative Study of Two Oroxylum indicum (L.) Kurz. Phenotypes Based on Phytochemicals and Antioxidant Effects, and the Anti-Inflammatory Activity of Leaf and Pod Extracts


Abstract
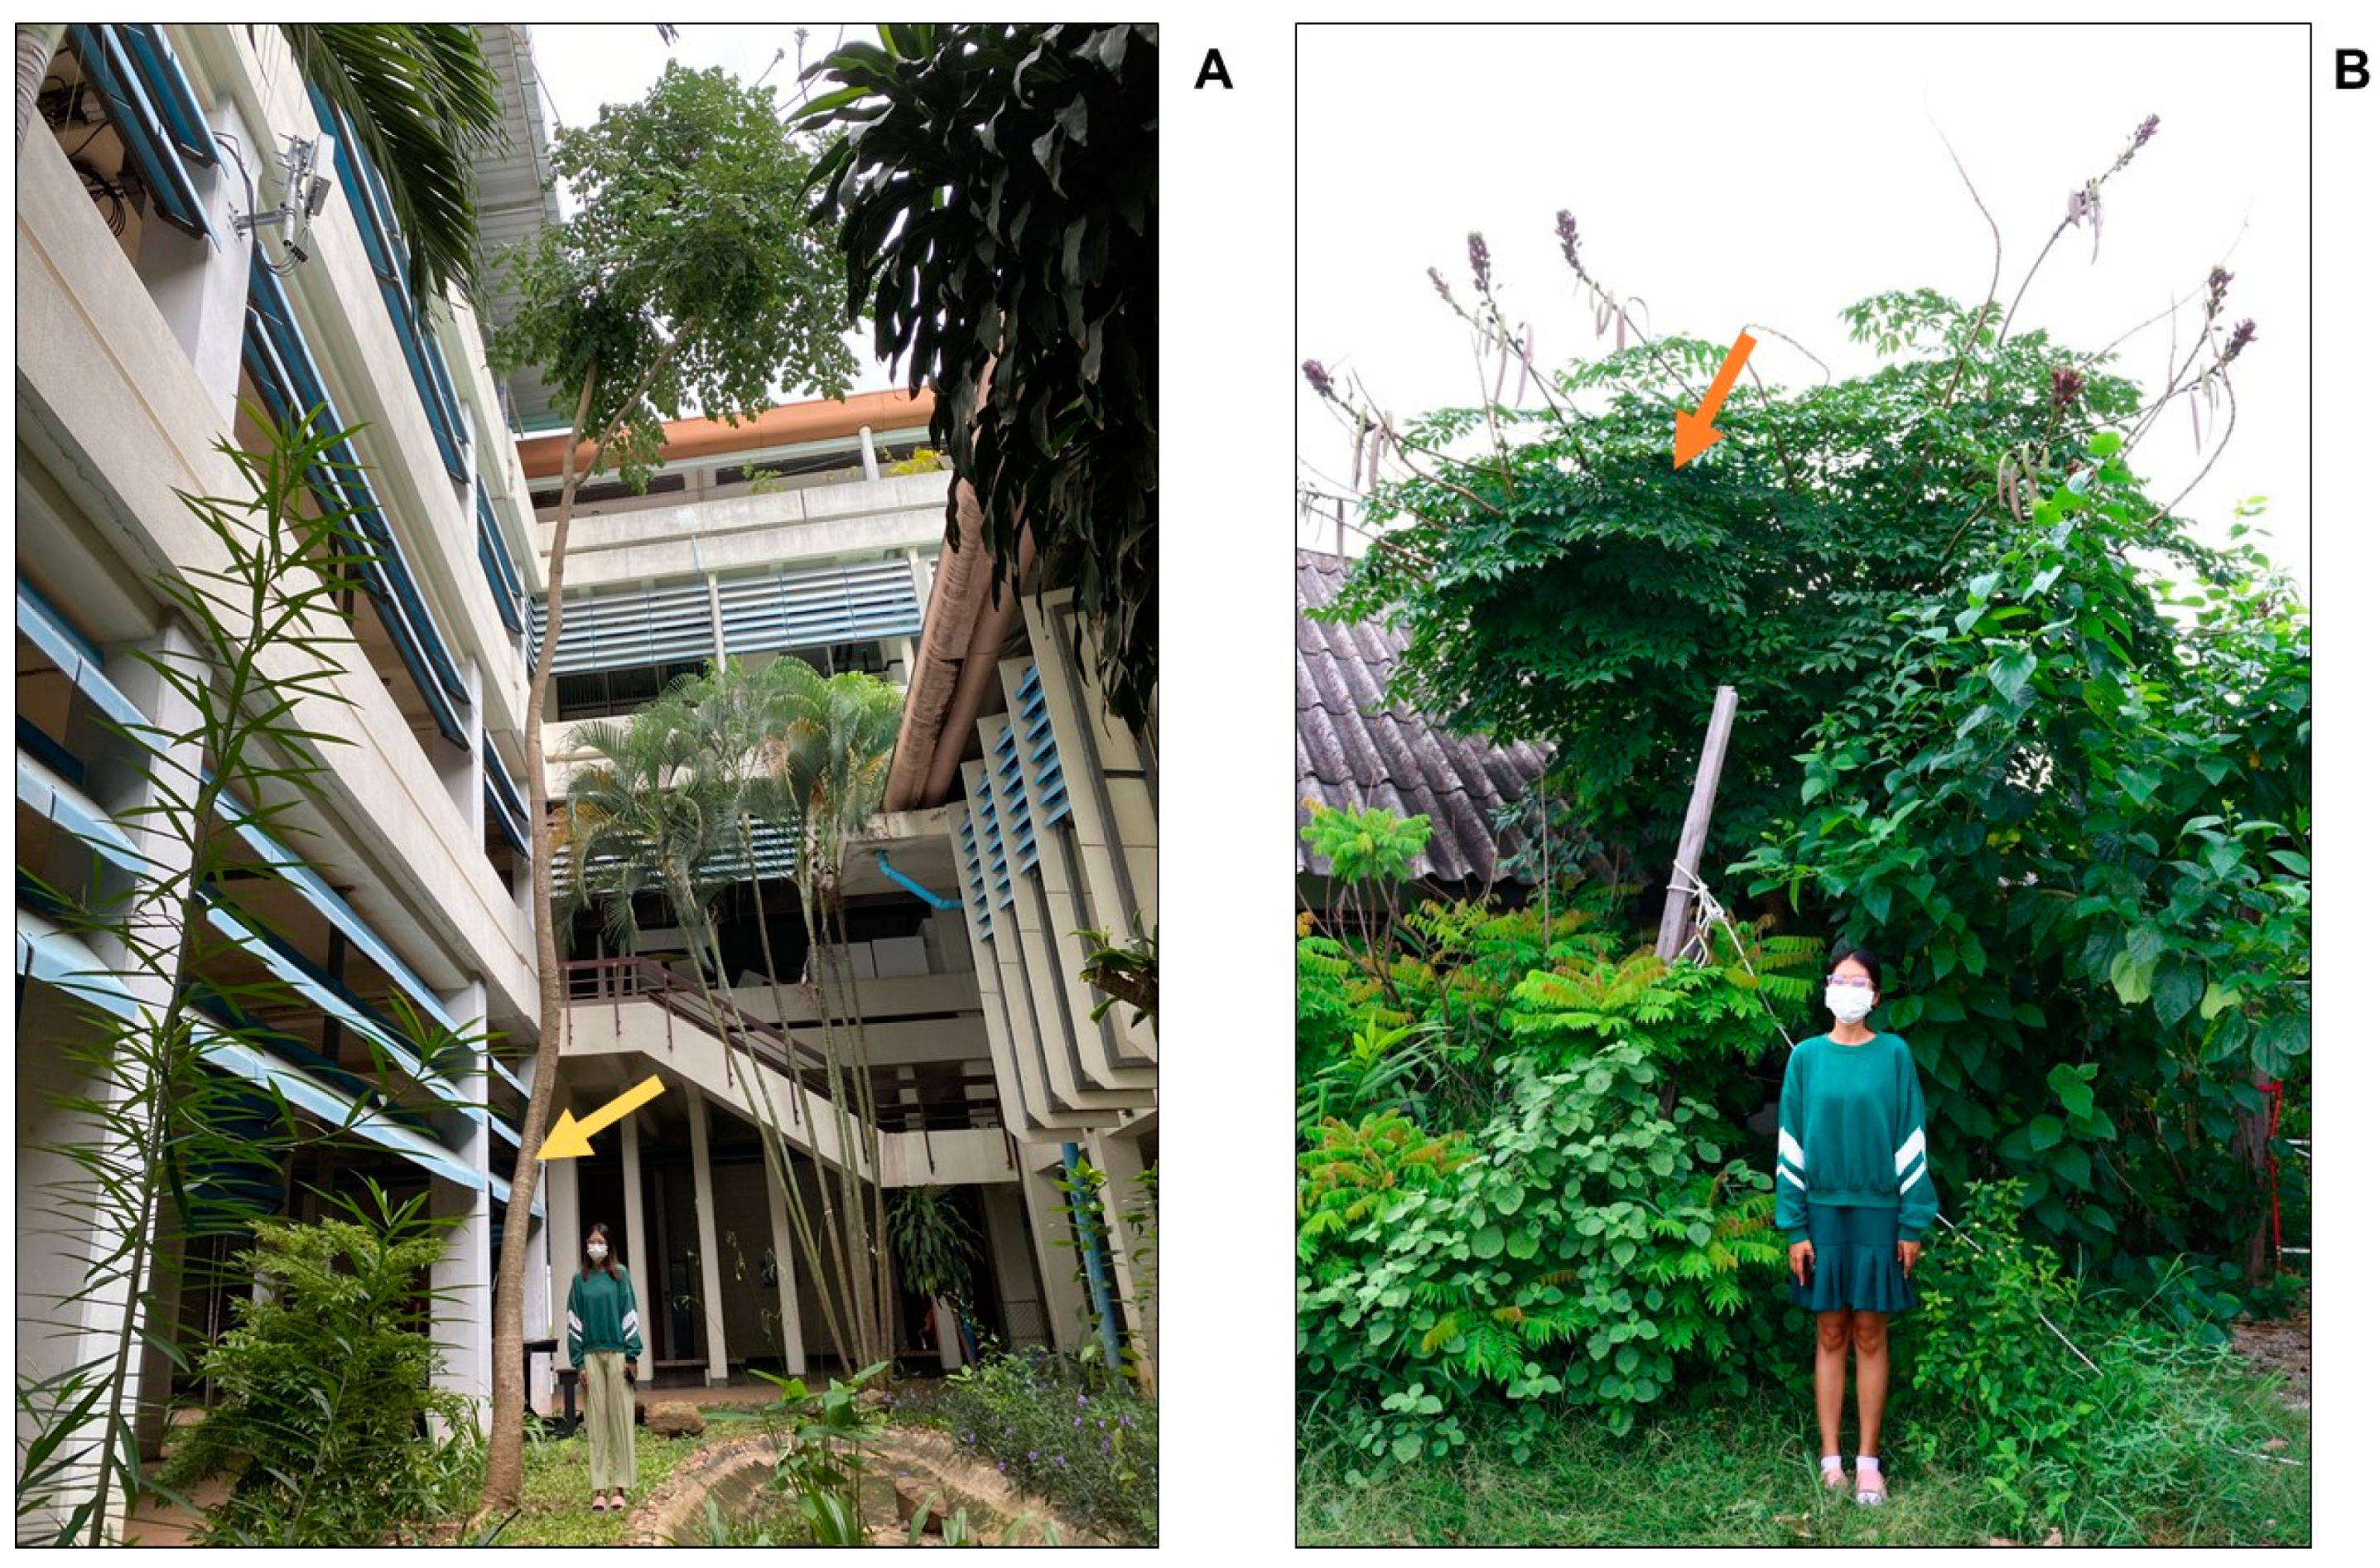
1. Introduction
2. Results
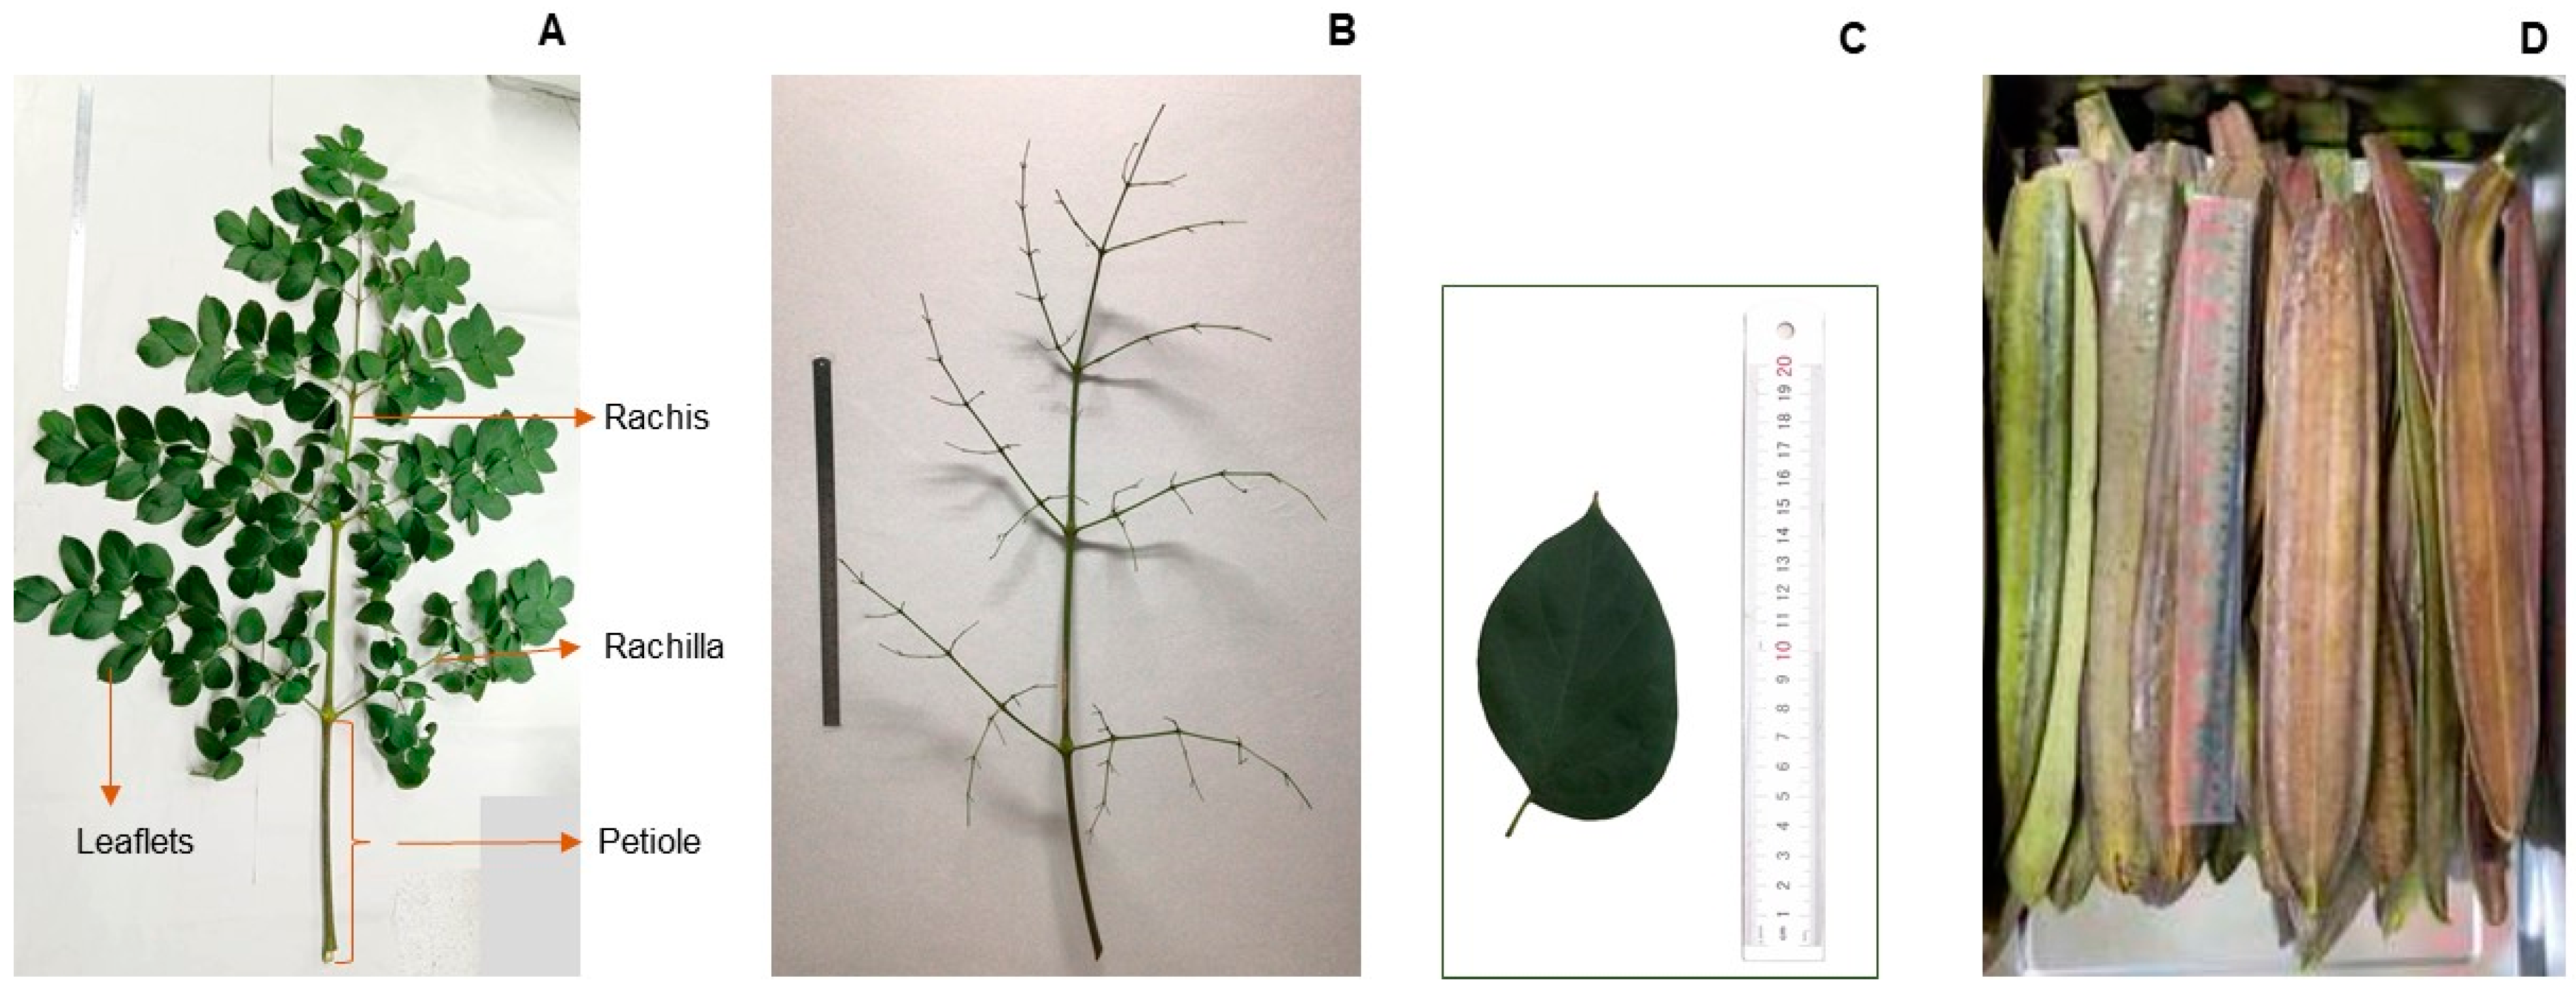
2.1. Extraction and Characterization of the Extracts
2.2. HPLC Profile of O. indicum Extracts
2.3. Quantitative Analysis of Biomarkers in O. indicum Extracts
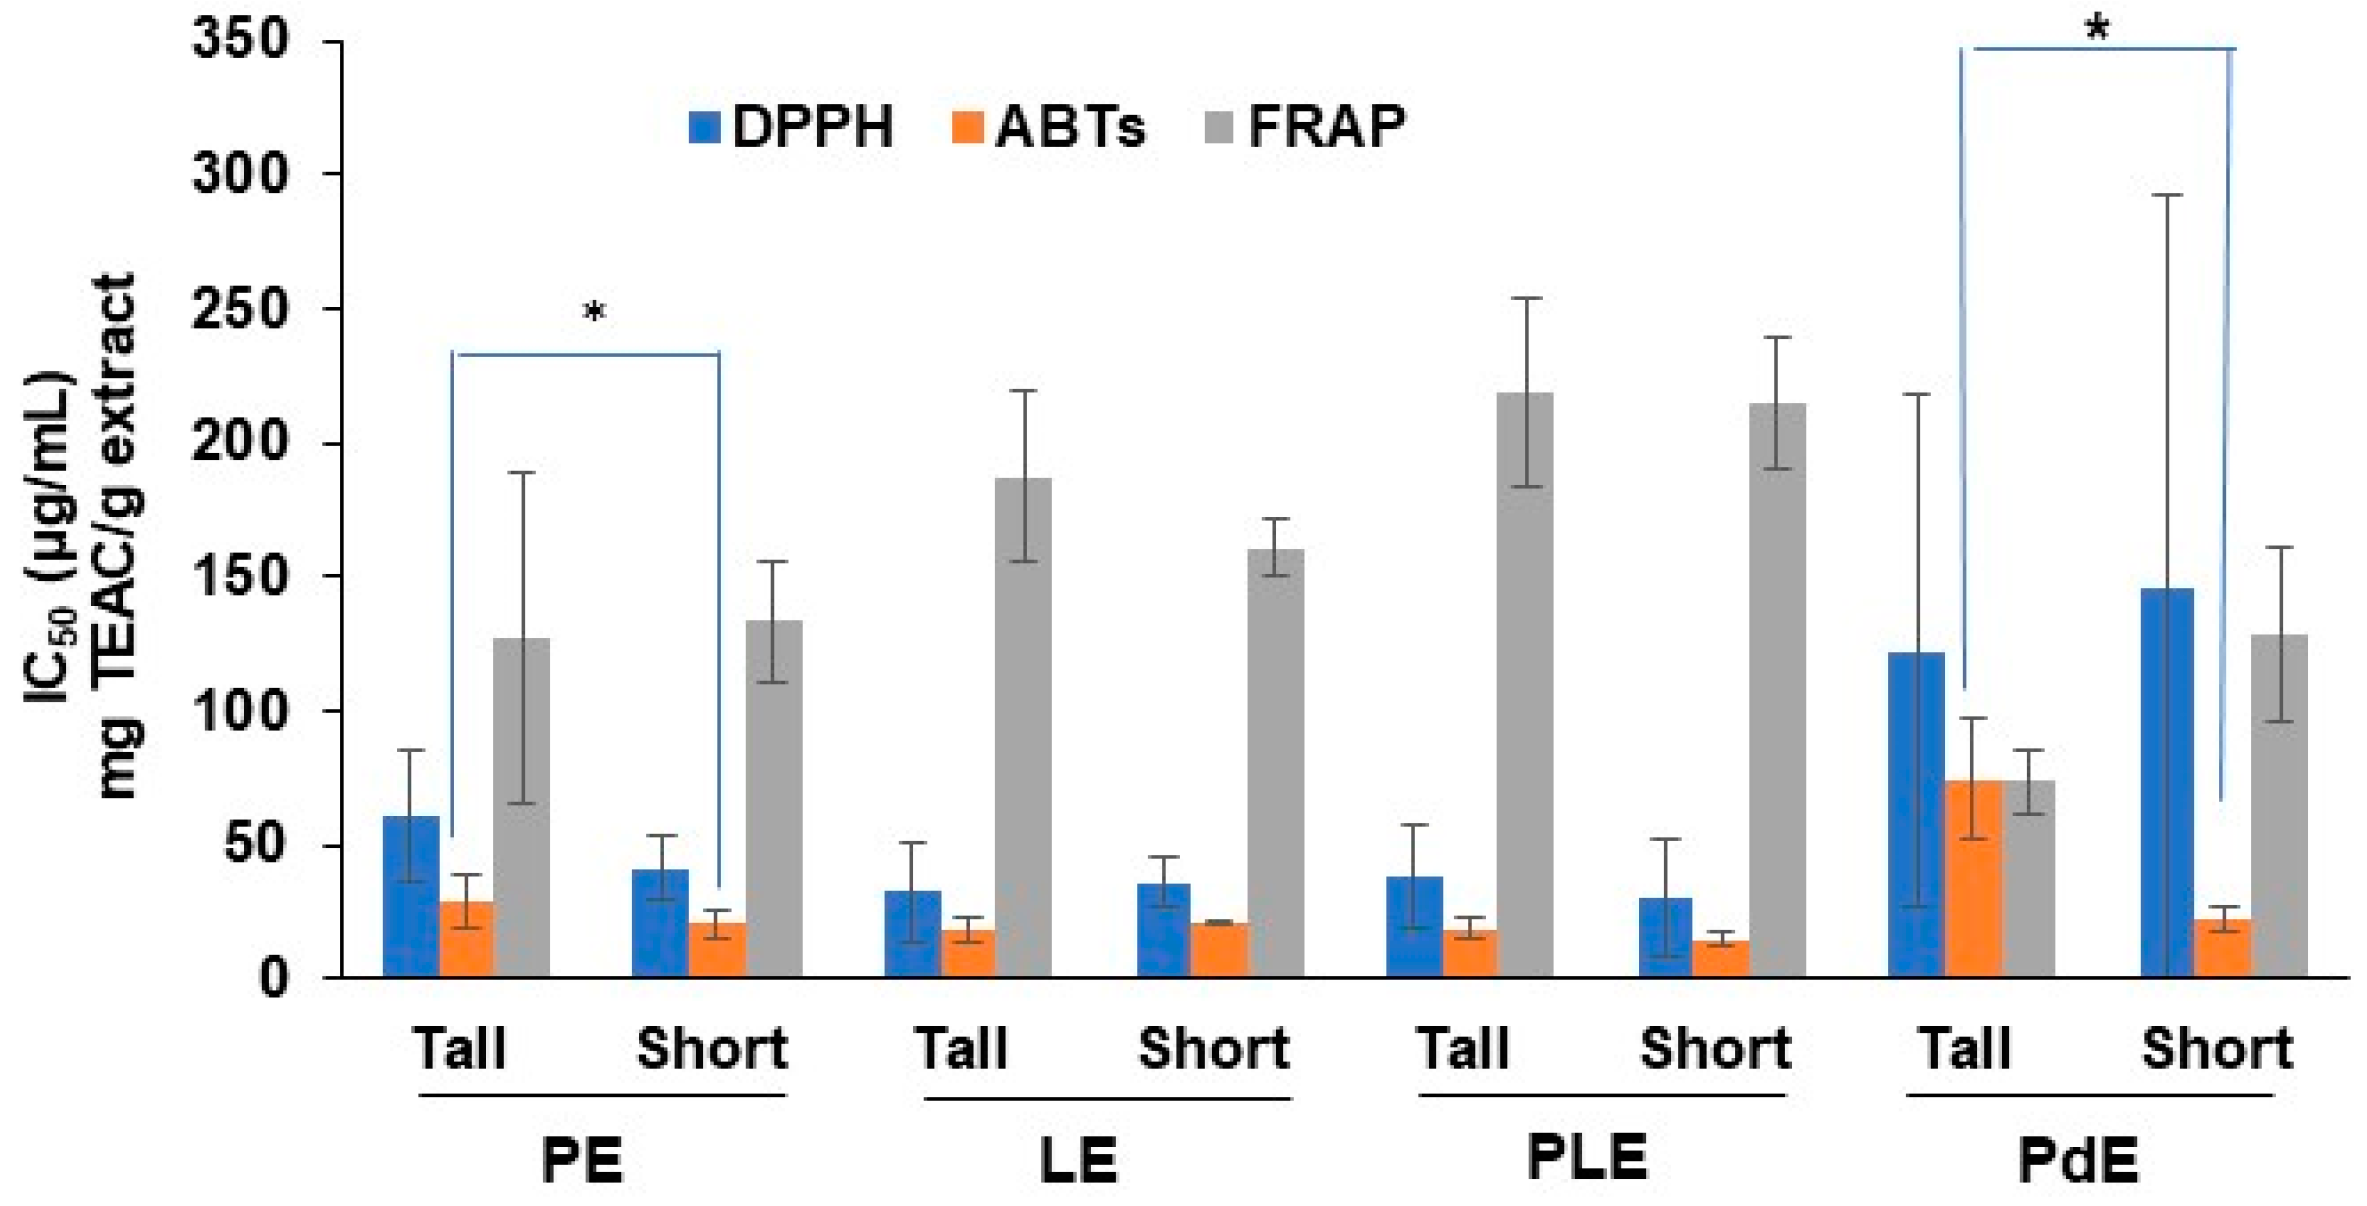
2.4. Antioxidant Activities of O. indicum Extracts
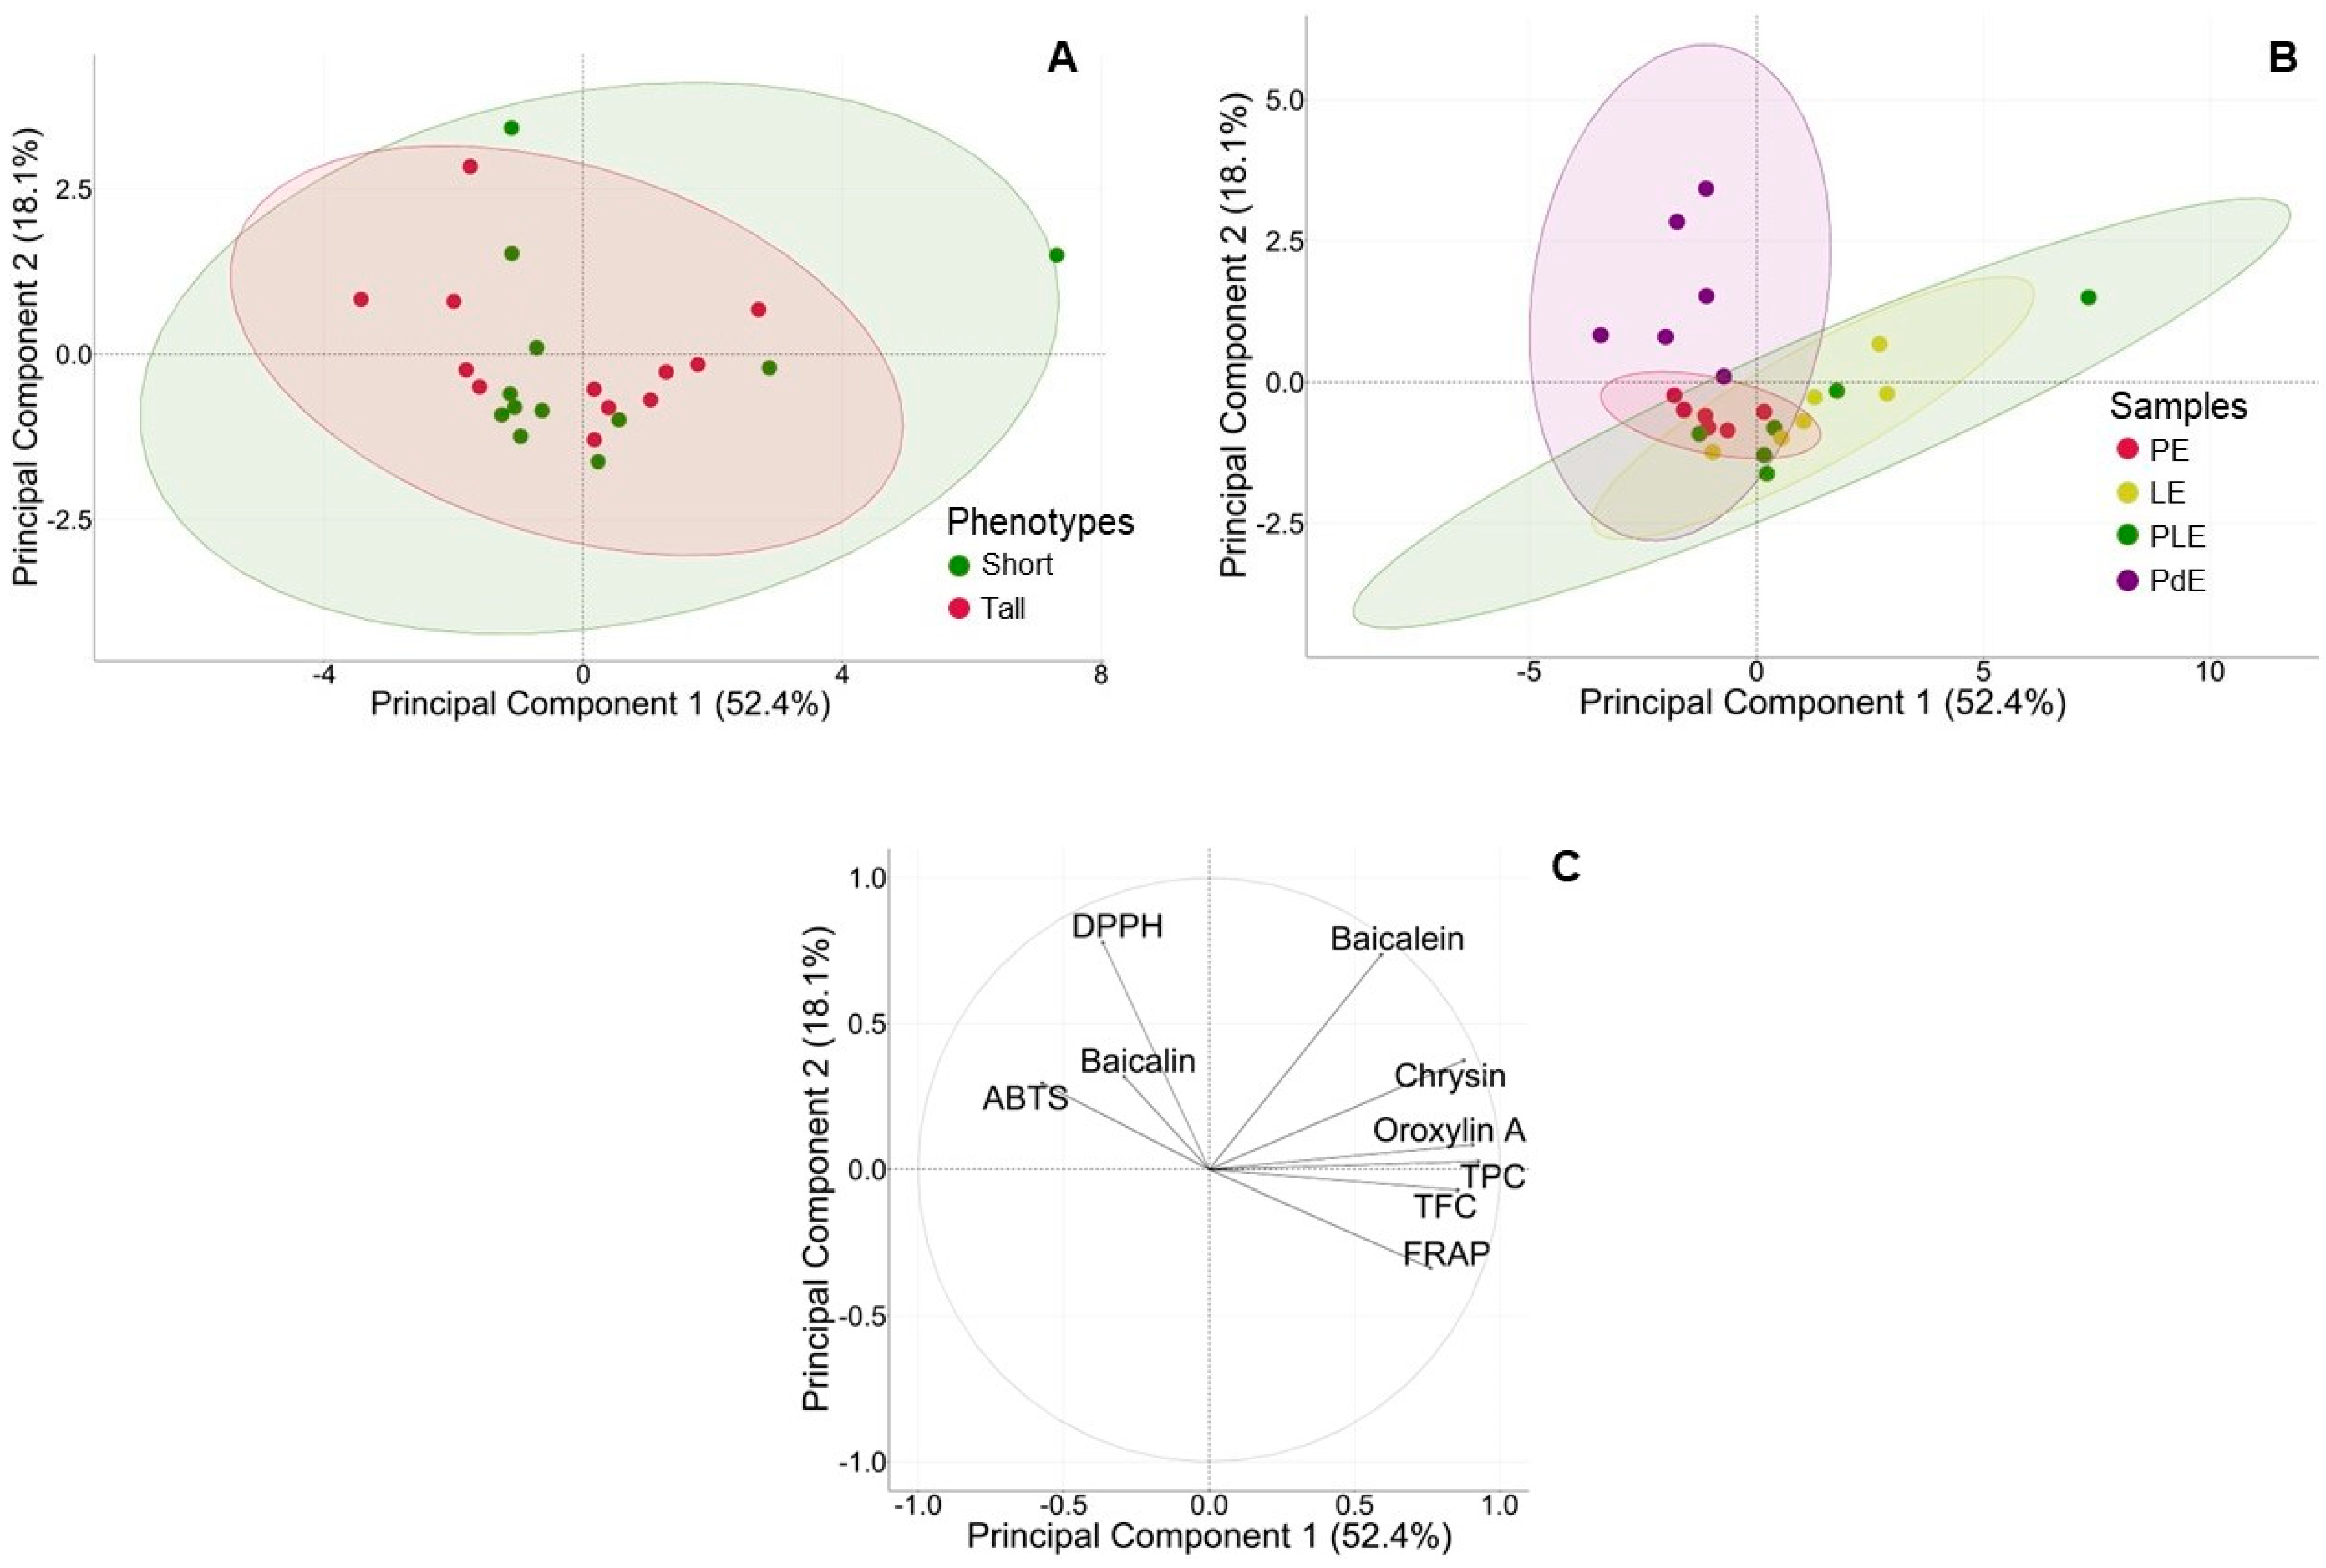
2.5. Principal Component Analysis (PCA) of Two Phenotypes
2.6. Anti-Inflammatory Activities of S-BK Extracts in LPS-Induced RAW 264.7 Macrophages
3. Discussion
3.1. Extraction Yield and the Chemical Constituents of the Extracts
3.2. The Relationship between Biomarker Contents and Antioxidant Activities
3.3. Anti-Inflammatory Properties of O. indicum S-BK Leaf and Pod Extracts
4. Materials and Methods
4.1. Chemicals
4.2. Plant Materials and Extraction
4.3. Validation of the HPLC Method and the Quantitative Analysis of Extracts
4.4. Total Phenolic and Total Flavonoid Contents
4.5. Antioxidant Assays
4.5.1. DPPH Radical Scavenging Assay
4.5.2. ABTS Assay
4.5.3. FRAP Assay
4.6. Inhibition of Nitric Oxide Production in LPS-Induced RAW264.7 Macrophages
4.7. Statistical Analysis
5. Conclusions
Supplementary Materials
Author Contributions
Funding
Data Availability Statement
Acknowledgments
Conflicts of Interest
References
- Kanase, V.G.; Pandagale, P.M.; Dani, S.M. Oroxylum indicum: An Overview. Int. J. Pharm. Sci. Res. 2022, 13, 2242–2250. [Google Scholar]
- Nualkaew, S. Applied Thai Traditional Pharmacy, 1st ed.; KKU Printing House: Khon Kaen, Thailand, 2020; pp. 211–212. ISBN 978-974-19-6056-9. [Google Scholar]
- National Essential Drug List Committee. National List of Essential Herbal Medicines; Royal Thai Gazette (Ratchakitchanubeksa): Bangkok, Thailand, 2023; Volume 140, pp. 45–69. (In Thai) [Google Scholar]
- Liao, H.; Ye, J.; Gao, L.; Liu, Y. The Main Bioactive Compounds of Scutellaria baicalensis Georgi. for Alleviation of Inflammatory Cytokines: A Comprehensive Review. Biomed. Pharmacother. 2021, 133, 110917. [Google Scholar] [CrossRef] [PubMed]
- Kumar, D.; Rawat, S.; Joshi, R. Predicting the Current and Future Suitable Habitat Distribution of the Medicinal Tree Oroxylum indicum (L.) Kurz in India. J. Appl. Res. Med. Aromat. Plants 2021, 23, 100309. [Google Scholar] [CrossRef]
- Li, L.; Deng, X.; Zhang, T.; Tian, Y.; Ma, X.; Wu, P. Propagation Methods Decide Root Architecture of Chinese Fir: Evidence from Tissue Culturing, Rooted Cutting and Seed Germination. Plants 2022, 11, 2472. [Google Scholar] [CrossRef]
- AOAC International. AOAC Official Methods of Analysis–Appendix K: Guidelines for Dietary Supplements and Botanicals; AOAC International: Rockville, MD, USA, 2019; pp. 1–32. [Google Scholar]
- Liao, Y.L.; Lin, W.S.; Chen, S.Y. ‘Taichung No. 5’: A Short Plant Height With High Grain Yield Job’s Tears Cultivar. HortScience 2019, 54, 761–762. [Google Scholar] [CrossRef]
- Yang, Q.; Lin, G.; Lv, H.; Wang, C.; Yang, Y.; Liao, H. Environmental and Genetic Regulation of Plant Height in Soybean. BMC Plant Biol. 2021, 21, 63. [Google Scholar] [CrossRef]
- Labarrere, B.; Prinzing, A.; Dorey, T.; Chesneau, E.; Hennion, F. Variations of Secondary Metabolites among Natural Populations of sub-Antarctic Ranunculus Species Suggest Functional Redundancy and Versatility. Plants 2019, 8, 234. [Google Scholar] [CrossRef] [PubMed]
- Phan, A.D.T.; Netzel, G.; Wang, D.; Flanagan, B.M.; D’Arcy, B.R.; Gidley, M.J. Binding of Dietary Polyphenols to Cellulose: Structural and Nutritional Aspects. Food Chem. 2015, 171, 388–396. [Google Scholar] [CrossRef] [PubMed]
- Rocchetti, G.; Gregorio, R.P.; Lorenzo, J.M.; Barba, F.J.; Oliveira, P.G.; Prieto, M.A.; Simal-Gandara, J.; Mosele, J.I.; Motilva, M.J.; Tomas, M.; et al. Functional Implications of Bound Phenolic Compounds and Phenolics–Food Interaction: A Review. Compr. Rev. Food Sci. Food Saf. 2022, 21, 811–842. [Google Scholar] [CrossRef]
- Bhat, R.; Shaharuddin, N.A.; Kuang, Y.T. A promising Approach Toward Exploring Nutritional and Functional Qualities of Beko (Oroxylum indicum L. Benth. ex Kurz) Pods for Potential Food Applications. J. Food Process. Preserv. 2015, 39, 47–55. [Google Scholar] [CrossRef]
- Rojsanga, P.; Schwaiger, S.; Stuppner, H.; Sithisarn, P. Determination of Phytochemical Contents in Extracts from Different Growth Stages of Oroxylum indicum Fruits Using HPLC-DAD and QAMS Methods. Molecules 2023, 28, 6837. [Google Scholar] [CrossRef]
- Sithisarn, P.; Rojsanga, P.; Sithisarn, P. Inhibitory Effects on Clinical Isolated Bacteria and Simultaneous HPLC Quantitative Analysis of Flavone Contents in Extracts from Oroxylum indicum. Molecules 2019, 24, 1937. [Google Scholar] [CrossRef] [PubMed]
- Gao, J.; Sanchez-Medina, A.; Pendry, B.A.; Hughes, M.J.; Webb, G.P.; Corcoran, O. Validation of a HPLC Method for Flavonoid Biomarkers in skullcap (Scutellaria) and Its Use to Illustrate Wide Variability in the Quality of Commercial Tinctures. J. Pharm. Pharm. Sci. 2008, 11, 77–87. [Google Scholar] [CrossRef]
- Gharari, Z.; Bagheri, K.; Danafar, H.; Sharafi, A. Simultaneous Determination of Baicalein, Chrysin and Wogonin in Four Iranian Scutellaria species by High Performance Liquid Chromatography. J. Appl. Res. Med. Aromat. Plants 2020, 16, 100232. [Google Scholar] [CrossRef]
- Yadav, A.K.; Manika, N.; Bagchi, G.D.; Gupta, M.M. Simultaneous Determination of Flavonoids in Oroxylum indicum by RP-HPLC. Med. Chem. Res. 2012, 22, 2222–2227. [Google Scholar] [CrossRef]
- Jayaram, K.; Prasad, M.N.V. Genetic Diversity in Oroxylum indicum (L.) Vent. (Bignoniaceae), a Vulnerable Medicinal Plant by Random Amplified Polymorphic DNA Marker. Afr. J. Biotechnol. 2008, 7, 254–262. [Google Scholar]
- Ghimire, B.K.; Kim, S.H.; Yu, C.Y.; Chung, I.M. Biochemical and Physiological Changes during Early Adventitious Root Formation in Chrysanthemum indicum Linné Cuttings. Plants 2022, 11, 1440. [Google Scholar] [CrossRef] [PubMed]
- Zhan, X.; Chen, Z.; Chen, R.; Shen, C. Environmental and Genetic Factors Involved in Plant Protection-Associated Secondary Metabolite Biosynthesis Pathways. Front. Plant Sci. 2022, 13, 877304. [Google Scholar] [CrossRef]
- Li, K.; Fan, H.; Yin, P.; Yang, L.; Xue, Q.; Li, X.; Sun, L.; Liu, Y. Structure-Activity Relationship of Eight High Content Flavonoids Analyzed with a Preliminary Assign-Score Method and their Contribution to Antioxidant Ability of Flavonoids-Rich Extract from Scutellaria baicalensis Shoots. Arab. J. Chem. 2018, 11, 159–170. [Google Scholar] [CrossRef]
- Liu, P.-F.; Han, F.-G.; Duan, B.-B.; Deng, T.-S.; Hou, X.-L.; Zhao, M.-Q. Purification and Antioxidant Activities of Baicalin Isolated from the Root of Huangqin (Scutellaria baicalensis gcorsi). J. Food Sci. Technol. 2013, 50, 615–619. [Google Scholar] [CrossRef]
- Rivero-Cruz, J.F.; Granados-Pineda, J.; Pedraza-Chaverri, J.; Pérez-Rojas, J.M.; Kumar-Passari, A.; Diaz-Ruiz, G.; Rivero-Cruz, B.E. Phytochemical constituents, Antioxidant, Cytotoxic, and Antimicrobial Activities of the Ethanolic Extract of Mexican Brown Propolis. Antioxidants 2020, 9, 70. [Google Scholar] [CrossRef]
- Amtmann, A.; Bennett, M.J.; Henry, A. Root Phenotypes for the Future. Plant Cell Environ. 2022, 45, 595–601. [Google Scholar] [CrossRef] [PubMed]
- Fraser, C.M.; Chapple, C. The Phenylpropanoid Pathway in Arabidopsis. Arab. Book 2011, 9, e0152. [Google Scholar] [CrossRef] [PubMed]
- Kim, D.S.; Na, H.; Kwack, Y.; Chun, C. Secondary Metabolite Profiling in Various Parts of Tomato Plants. Korean J. Hortic. Sci. Technol. 2014, 32, 252–260. [Google Scholar] [CrossRef]
- Kotuła, M.; Kapusta-Duch, J.; Smoleń, S.; Doskočil, I. Phytochemical Composition of the Fruits and Leaves of Raspberries (Rubus idaeus L.)—Conventional vs. Organic and Those Wild Grown. Appl. Sci. 2022, 12, 783. [Google Scholar] [CrossRef]
- Kuo, S.W.; Su, W.L.; Chou, T.C. Baicalin Improves the Survival in Endotoxic Mice and Inhibits the Inflammatory Responses in LPS-Treated RAW 264.7 Macrophages. Eur. J. Inflamm. 2020, 18, 2058739220967767. [Google Scholar] [CrossRef]
- Fan, G.W.; Zhang, Y.; Jiang, X.; Zhu, Y.; Wang, B.; Su, L.; Cao, W.; Zhang, H.; Gao, X. Anti-inflammatory Activity of Baicalein in LPS-Stimulated RAW264.7 Macrophages via Estrogen Receptor and NF-κB-Dependent Pathways. Inflammation 2013, 36, 1584–1591. [Google Scholar] [CrossRef] [PubMed]
- Madakkannu, B.; Ravichandran, R. Immunomodulatory Effect of Natural Flavonoid Chrysin (5,7-Dihydroxyflavone) on LPS Stimulated RAW 264.7 Macrophages via Inhibition of NF-κB Activation. Process Biochem. 2019, 84, 186–195. [Google Scholar] [CrossRef]
- Lee, J.Y.; Park, W. Anti-Inflammatory Effects of Oroxylin A on RAW 264.7 Mouse Macrophages Induced with Polyinosinic-Polycytidylic Acid. Exp. Ther. Med. 2016, 12, 151–156. [Google Scholar] [CrossRef]
- Ye, M.; Wang, Q.; Zhang, W.; Li, Z.; Wang, Y.; Hu, R. Oroxylin A Exerts Anti-Inflammatory Activity on Lipopolysaccharide-Induced Mouse Macrophage via Nrf2/ARE Activation. Biochem. Cell Biol. 2014, 92, 337–348. [Google Scholar] [CrossRef]
- Thrigulla, S.R.; Singh, G.; Soni, H.; Tandon, S.; Koulgi, S.; Uppuladinne, M.V.N.; Jani, V.; Sonavane, U.; Joshi, R.; Gandhi, Y.; et al. In-Silico Evaluation of Oroxylum indicum vent Compounds in the Plausible Treatment and Prevention of Nasopharyngeal Cancer. J. Ayurveda Integr. Med. 2024, 15, 100986. [Google Scholar] [CrossRef] [PubMed]
- Yuan, Y.; Hou, W.; Tang, M.; Luo, H.; Chen, L.J.; Guan, Y.H.; Sutherland, I.A. Separation of Flavonoids from the Leaves of Oroxylum indicum by HSCCC. Chromatographia 2008, 68, 885–892. [Google Scholar] [CrossRef]
- Park, M.Y.; Ha, S.E.; Kim, H.H.; Bhosale, P.B.; Abusaliya, A.; Jeong, S.H.; Park, J.-S.; Heo, J.D.; Kim, G.S. Scutellarein Inhibits LPS-Induced Inflammation through NF-κB/MAPKs Signaling Pathway in RAW264.7 Cells. Molecules 2022, 27, 3782. [Google Scholar] [CrossRef]
- Harminder; Singh, V.; Chaudhary, A.K. A Review on the Taxonomy, Ethnobotany, Chemistry and Pharmacology of Oroxylum indicum Vent. Indian J. Pharm. Sci. 2011, 73, 483–490. [Google Scholar] [PubMed]
- Kole, L.; Giri, B.; Manna, S.K.; Pal, B.; Ghosh, S. Biochanin-A, An Isoflavone, Showed Anti-Proliferative and Anti-Inflammatory Activities Through the Inhibition of iNOS Expression, p38-MAPK and ATF-2 Phosphorylation and Blocking NFκB Nuclear Translocation. Eur. J. Pharmacol. 2011, 653, 8–15. [Google Scholar] [CrossRef] [PubMed]
- Mosmann, T. Rapid Colorimetric Assay for Cellular Growth and Survival: Application to Proliferation and Cytotoxicity Assays. J. Immunol. Methods 1983, 65, 55–63. [Google Scholar] [CrossRef]


| Phenotype | Province | Code | Leaflet | Immature Pod |
|---|---|---|---|---|
| Tall stem | Buengkarn | T-BK | 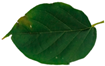 | 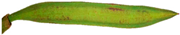 |
| Sukhothai | T-SK | 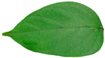 | 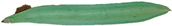 | |
| Roi-Et | T-RE | 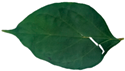 | 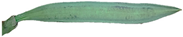 | |
| Short stem | Buengkarn | S-BK |  |  |
| Khon Kaen (Urban) | S-KK1 |  | 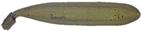 | |
| Khon Kaen (Rural) | S-KK2 | 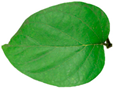 | 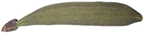 |
| Leaves | Immature Pods | |||||||
|---|---|---|---|---|---|---|---|---|
| PE | LE | PLE | PdE | |||||
| Tall | Short | Tall | Short | Tall | Short | Tall | Short | |
| % Yield | 8.99 ± 0.61 | 8.14 ± 0.90 | 15.56 ± 2.21 | 14.24 ± 2.68 | 14.53 ± 1.24 | 12.51 ± 2.13 | 30.75 ± 3.28 | 25.35 ± 4.35 |
| TPC (mg GAE/g extract) | 53.34 ± 5.37 | 69.68 ± 15.33 | 89.18 ± 5.14 | 82.18 ± 7.41 | 89.18 ± 5.14 | 82.18 ± 7.41 | 17.36 ± 2.17 | 21.03 ± 5.42 |
| TFC (mg QE/g extract) | 15.39 ± 1.39 | 20.18 ± 4.79 | 38.30 ± 2.58 | 45.87 ± 6.96 | 28.07 ± 3.76 | 43.94 ± 10.53 | 5.04 ± 0.65 | 3.39 ± 0.48 |
| Biomarkers | Leaves (% Extract w/w) | Immature Pods (% Extract w/w) | ||||||
|---|---|---|---|---|---|---|---|---|
| Petiole and Rachis Extracts (PEs) | Leaflet Extracts (LEs) | Whole-Leaf Extracts (PLEs) | Pod Extracts (PdEs) | |||||
| Tall | Short | Tall | Short | Tall | Short | Tall | Short | |
| Baicalin | 2.68 ± 0.57 | 2.72 ± 0.55 | 2.42 ± 0.54 | 1.50 ± 0.13 | 1.90 ± 0.28 | 1.94 ± 0.18 | 2.36 ± 0.39 | 2.37 ± 0.67 |
| Baicalein | 1.98 ± 0.35 | 2.18 ± 0.18 | 2.2 ± 0.21 | 1.08 ± 0.18 | 1.82 ± 0.25 | 2.75 ± 0.82 | 0.89 ± 0.15 | 2.57 ± 0.23 |
| Chrysin | ND | ND | 0.67 ± 0.11 | ND | ND | 0.52 ± 0.24 | ND | ND |
| Oroxylin A | 1.10 ± 0.20 | 1.01 ± 0.22 | 2.64 ± 0.56 | 1.63 ± 0.24 | 1.56 ± 0.42 | 2.41 ± 0.72 | ND | ND |
| Samples | IC50 (µg/mL) | Content * (% w/w Extract) | |||
|---|---|---|---|---|---|
| Baicalin | Baicalein | Chrysin | Oroxylin A | ||
| PE | 235.33 | 0.73 ± 0.00 | 2.03 ± 0.05 | 0.61 ± 0.02 | 1.86 ± 0.04 |
| LE | 57.61 | 2.67 ± 0.02 | 1.83 ± 0.01 | 0.55 ± 0.02 | 2.57 ± 0.05 |
| PLE | 77.58 | 5.30 ± 0.03 | 6.03 ± 0.12 | 1.50 ± 0.02 | 5.28 ± 0.05 |
| PdE | 303.01 | 0.70 ± 0.00 | 1.65 ± 0.00 | ND | ND |
| Baicalin | 5.86 | - | - | - | - |
| Baicalein | 7.31 | - | - | - | - |
| Chrysin | >400 | - | - | - | - |
| Oroxylin A | 10.46 | - | - | - | - |
Disclaimer/Publisher’s Note: The statements, opinions and data contained in all publications are solely those of the individual author(s) and contributor(s) and not of MDPI and/or the editor(s). MDPI and/or the editor(s) disclaim responsibility for any injury to people or property resulting from any ideas, methods, instructions or products referred to in the content. |
© 2024 by the authors. Licensee MDPI, Basel, Switzerland. This article is an open access article distributed under the terms and conditions of the Creative Commons Attribution (CC BY) license (https://creativecommons.org/licenses/by/4.0/).
Share and Cite
Panomai, P.; Thapphasaraphong, S.; Nualkaew, N. A Comparative Study of Two Oroxylum indicum (L.) Kurz. Phenotypes Based on Phytochemicals and Antioxidant Effects, and the Anti-Inflammatory Activity of Leaf and Pod Extracts. Plants 2024, 13, 2110. https://doi.org/10.3390/plants13152110
Panomai P, Thapphasaraphong S, Nualkaew N. A Comparative Study of Two Oroxylum indicum (L.) Kurz. Phenotypes Based on Phytochemicals and Antioxidant Effects, and the Anti-Inflammatory Activity of Leaf and Pod Extracts. Plants. 2024; 13(15):2110. https://doi.org/10.3390/plants13152110
Chicago/Turabian StylePanomai, Pattaraphorn, Suthasinee Thapphasaraphong, and Natsajee Nualkaew. 2024. "A Comparative Study of Two Oroxylum indicum (L.) Kurz. Phenotypes Based on Phytochemicals and Antioxidant Effects, and the Anti-Inflammatory Activity of Leaf and Pod Extracts" Plants 13, no. 15: 2110. https://doi.org/10.3390/plants13152110
APA StylePanomai, P., Thapphasaraphong, S., & Nualkaew, N. (2024). A Comparative Study of Two Oroxylum indicum (L.) Kurz. Phenotypes Based on Phytochemicals and Antioxidant Effects, and the Anti-Inflammatory Activity of Leaf and Pod Extracts. Plants, 13(15), 2110. https://doi.org/10.3390/plants13152110