Article

UV-B Stress-Triggered Amino Acid Reprogramming and ABA-Mediated Hormonal Crosstalk in Rhododendron chrysanthum Pall.

Jilin Provincial Key Laboratory of Plant Resource Science and Green Production, Jilin Normal University, Siping 136000, China
*
Authors to whom correspondence should be addressed.
Plants 2024, 13(16), 2232; https://doi.org/10.3390/plants13162232
Submission received: 1 July 2024 / Revised: 5 August 2024 / Accepted: 6 August 2024 / Published: 12 August 2024
(This article belongs to the Special Issue The Physiology of Abiotic Stress in Plants)

Abstract

:
Increased UV-B radiation due to ozone depletion adversely affects plants. This study focused on the metabolite dynamics of Rhododendron chrysanthum Pall. (R. chrysanthum) and the role of ABA in mitigating UV-B stress. Chlorophyll fluorescence metrics indicated that both JA and ABA increased UV-B resistance; however, the effect of JA was not as strong as that of ABA. Metabolomic analysis using UPLC−MS/MS (ultra-performance liquid chromatography and tandem mass spectrometry) revealed significant fluctuations in metabolites under UV-B and ABA application. UV-B decreased amino acids and increased phenolics, suggesting antioxidant defense activation. ABA treatment upregulated lipids and phenolic acids, highlighting its protective role. Multivariate analysis showed distinct metabolic clusters and pathways responding to UV-B and ABA, which impacted amino acid metabolism and hormone signal transduction. Exogenous ABA negatively regulated the JA signaling pathway in UV-B-exposed R. chrysanthum, as shown by KEGG enrichment. This study deepens understanding of plant stress-tolerance mechanisms and has implications for enhancing plant stress tolerance through metabolic and hormonal interventions.

1. Introduction

In recent years, due to the increase in greenhouse gas concentration, climate change has been further aggravated, and stratospheric ozone has been affected accordingly, leading to an increase in solar ultraviolet radiation (especially UV-B, 280–315 nm) on the Earth’s surface [1,2]. Despite being a non-biological stressor and only constituting a minor fraction of the overall ultraviolet radiation, UV-B has various negative effects on plants: plant growth rates are often decreased, photosynthesis is partially obstructed, and plant biochemistry is changed [3,4,5,6]. UV-B stress can disrupt proteins in plant photosystem II and damage electron donors, lowering plant photosynthetic rates [7,8]. Plants growing at high latitudes adapt to the effects of UV-B by altering the physiological shape of their leaves, for instance, by reducing their size and inducing them to thicken [9]. In addition, many studies have shown that UV-B leads to large fluctuations in the contents of metabolites in plants and that plants develop resistance in this way [10,11,12].
Changbai Mountain in Jilin Province of China is home to R. chrysanthum, which thrives at a modest height of 1300 to 2650 m [13]. The harsh climate and soil conditions at the summit of Changbai Mountain present a formidable obstacle to vegetation flourishing in this area. Consequently, the capacity of R. chrysanthum to withstand abiotic stress has been consistently improved throughout the extensive process of evolution [14,15,16].
Abscisic acid, an important phytohormone, plays an important role in seed rest, stomatal regulation, and gene expression [17,18]. It is also a key signaling molecule for plants against abiotic stress factors. Indeed, plant responses to abiotic stresses and the mobilization of their own defense mechanisms are largely affected by the broad and deep influence of ABA [19]. ABA can regulate plant growth, leaf color, and growth rate, thus mitigating the effects of abiotic stress on plants. Not only that, ABA can also regulate plant abiotic stress responses by regulating phytohormone levels, influencing enzyme activity and altering the way in which plant cell membranes are transported [20,21]. Following a thorough proteomic analysis, it was discovered that exogenous ABA might greatly increase rice’s tolerance to abiotic stressors, giving it a higher chance of surviving hardship [22]. Exogenous ABA also boosts a plant’s cold tolerance by increasing its soluble sugar and proline contents, enabling it to thrive in extremely cold temperatures [23,24]. An earlier study’s thorough analysis of phosphorylation transcriptomics revealed that exogenous ABA might activate R. chrysanthum’s downstream transcription factors. R. chrysanthum’s stomatal closure was brought on by this activation mechanism, which significantly increased the plant’s ability to withstand stress [25]. Nevertheless, there are not many studies on how exogenous abscisic acid increases R. chrysanthum’s UV-B resistance, such that it is worth delving further into its resistance mechanism.
Several studies have found that JA (jasmonic acid) is vital in plant responses to various stressors. When grapes are subjected to drought stress, JA improves their drought tolerance capability [26,27,28]. Furthermore, JA derivatives can actively help plants cope with a variety of harsh environmental situations [29]. Exogenous MeJA has been demonstrated to influence the flavonoid-related pathway in Begonia, allowing it to respond positively to ozone stress [30]. Nevertheless, plant hormones interact in intricate ways, and other hormones regulate JA [31,32]. The connection between the roles of ABA and JA in R. chrysanthum during UV-B stress has not yet been investigated. Given the critical functions of ABA and JA, this study combined chlorophyll fluorescence indexes and metabolomic data to investigate the intricate regulatory interactions among hormones in R. chrysanthum in response to UV-B.
Plants possess the capacity to maintain their regular development and procreation and can withstand diverse pressures as a result of the interplay of multiple metabolites generated within the plant. Metabolomics has become a reliable tool for investigating how plants can withstand different pressures at the metabolite level as its technology has advanced over time [33,34]. Plants can alter the effects of UV-B on themselves through their own internal metabolites and even other abiotic or biological interactions. Based on the qualitative and quantitative analysis of metabolites, metabolomics can be used to analyze metabolic pathways or metabolic networks and better reveal the unique coping mechanisms developed by plants in response to various adverse environmental factors. In this experiment, the metabolites of R. chrysanthum treated with UV-B as well as ABA were analyzed multivarially by ultra-performance liquid chromatography and tandem mass spectrometry (UPLC-MS/MS). These results will help to study the complex process of plant acclimatation to UV-B.
Therefore, based on the results obtained by previous authors that exogenous ABA can enhance the UV-B stress resistance of R. chrysanthum [35], the present experiment was conducted to further investigate the molecular mechanism of R. chrysanthum’s response to UV-B stress and the effects exerted by exogenous ABA through a metabolomic perspective. Furthermore, the regulatory roles of JA and ABA in R. chrysanthum following UV-B exposure were disclosed by integrating chlorophyll fluorescence characteristics with metabolomic data, elucidating the intricate molecular mechanisms of its numerous hormones in response to UV-B.

2. Result

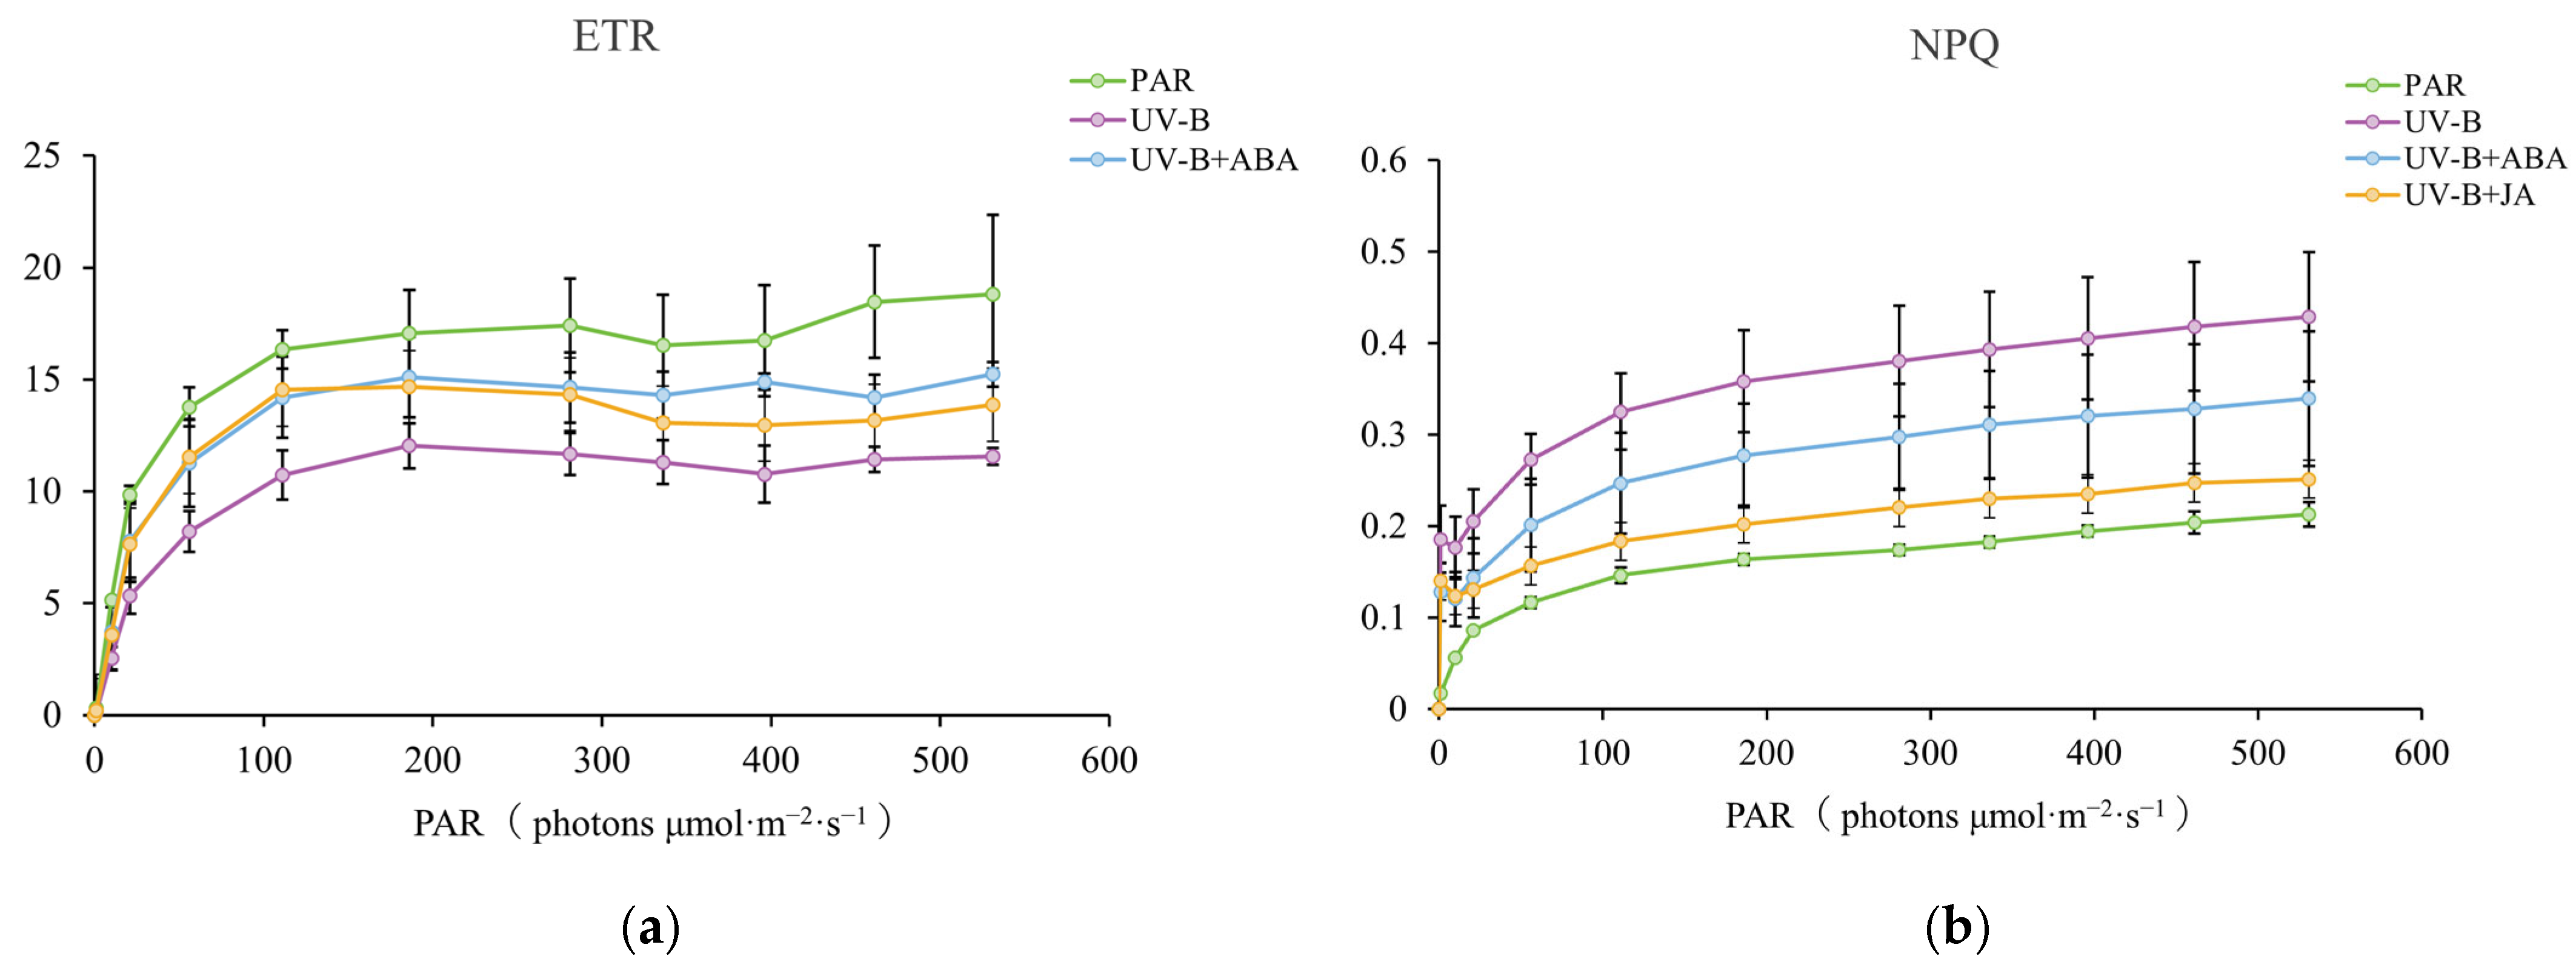
2.1. Exogenous Hormone Therapy Improves R. chrysanthum’s Ability to Withstand UV-B Damage

To investigate the damaging impact of UV-B radiation on R. chrysanthum and the role of exogenous hormone treatments in enhancing its resistance to UV-B, chlorophyll fluorescence characteristics were measured for the experimental materials following various experimental treatments.
The findings revealed that UV-B radiation significantly reduced R. chrysanthum’s ETR (actual electron transport rate), whereas exogenous hormone therapies (ABA and JA) significantly reversed this tendency and raised the ETR (Figure 1a). NPQ (non-photochemical quenching) is a photoprotective process in plants that dissipates excess light energy absorbed during photosynthesis as heat, protecting the photosynthetic machinery from photodamage. The results of this study showed a significant increase in NPQ after UVB radiation compared to PAR-treated controls. Following exogenous hormones, NPQ no longer increased, implying that both hormones helped R. chrysanthum disperse surplus excitation energy, allowing it to respond positively to UV-B light (Figure 1b).
Fv/Fm (maximal photochemical efficiency of PSII) and Y (II) (photochemical yield of PSII) reflect PS II’s maximal and actual photochemical efficiencies, respectively. Fo (minimal fluorescence) is the plant’s initial fluorescence, which typically increases when it is stressed. qL can indicate plant photosynthetic activity. Relative to the PAR-treated group, the UV-B radiation treatment caused a significant decrease in Fv/Fm, Y(II), and qL and a non-significant increase in Fo. In contrast, exogenous ABA treatment resulted in a significant increase in Fv/Fm, Y(II), and qL and a non-significant decrease in Fo compared to the UV-B radiation-treated group. Exogenous JA treatments acted similarly to ABA treatments, resulting in a significant increase in Fv/Fm, non-significant increases in Y(II) and qL, and a non-significant decrease in Fo, as compared to the UV-B radiation-treated group (Figure 1c).
Overall, the discoveries demonstrated that UV-B radiation destroyed the photosynthetic systems of the experimental materials, while exogenous hormone therapies protected them. This demonstrates that ABA and JA play significant parts in R. chrysanthum’s reactions to UV-B stress and that there may be a regulatory link between the two hormones under UV-B stress. According to the outcomes, while these two hormones showed some protective effects on R. chrysanthum, ABA was more effective in increasing R. chrysanthum’s resistance than JA.

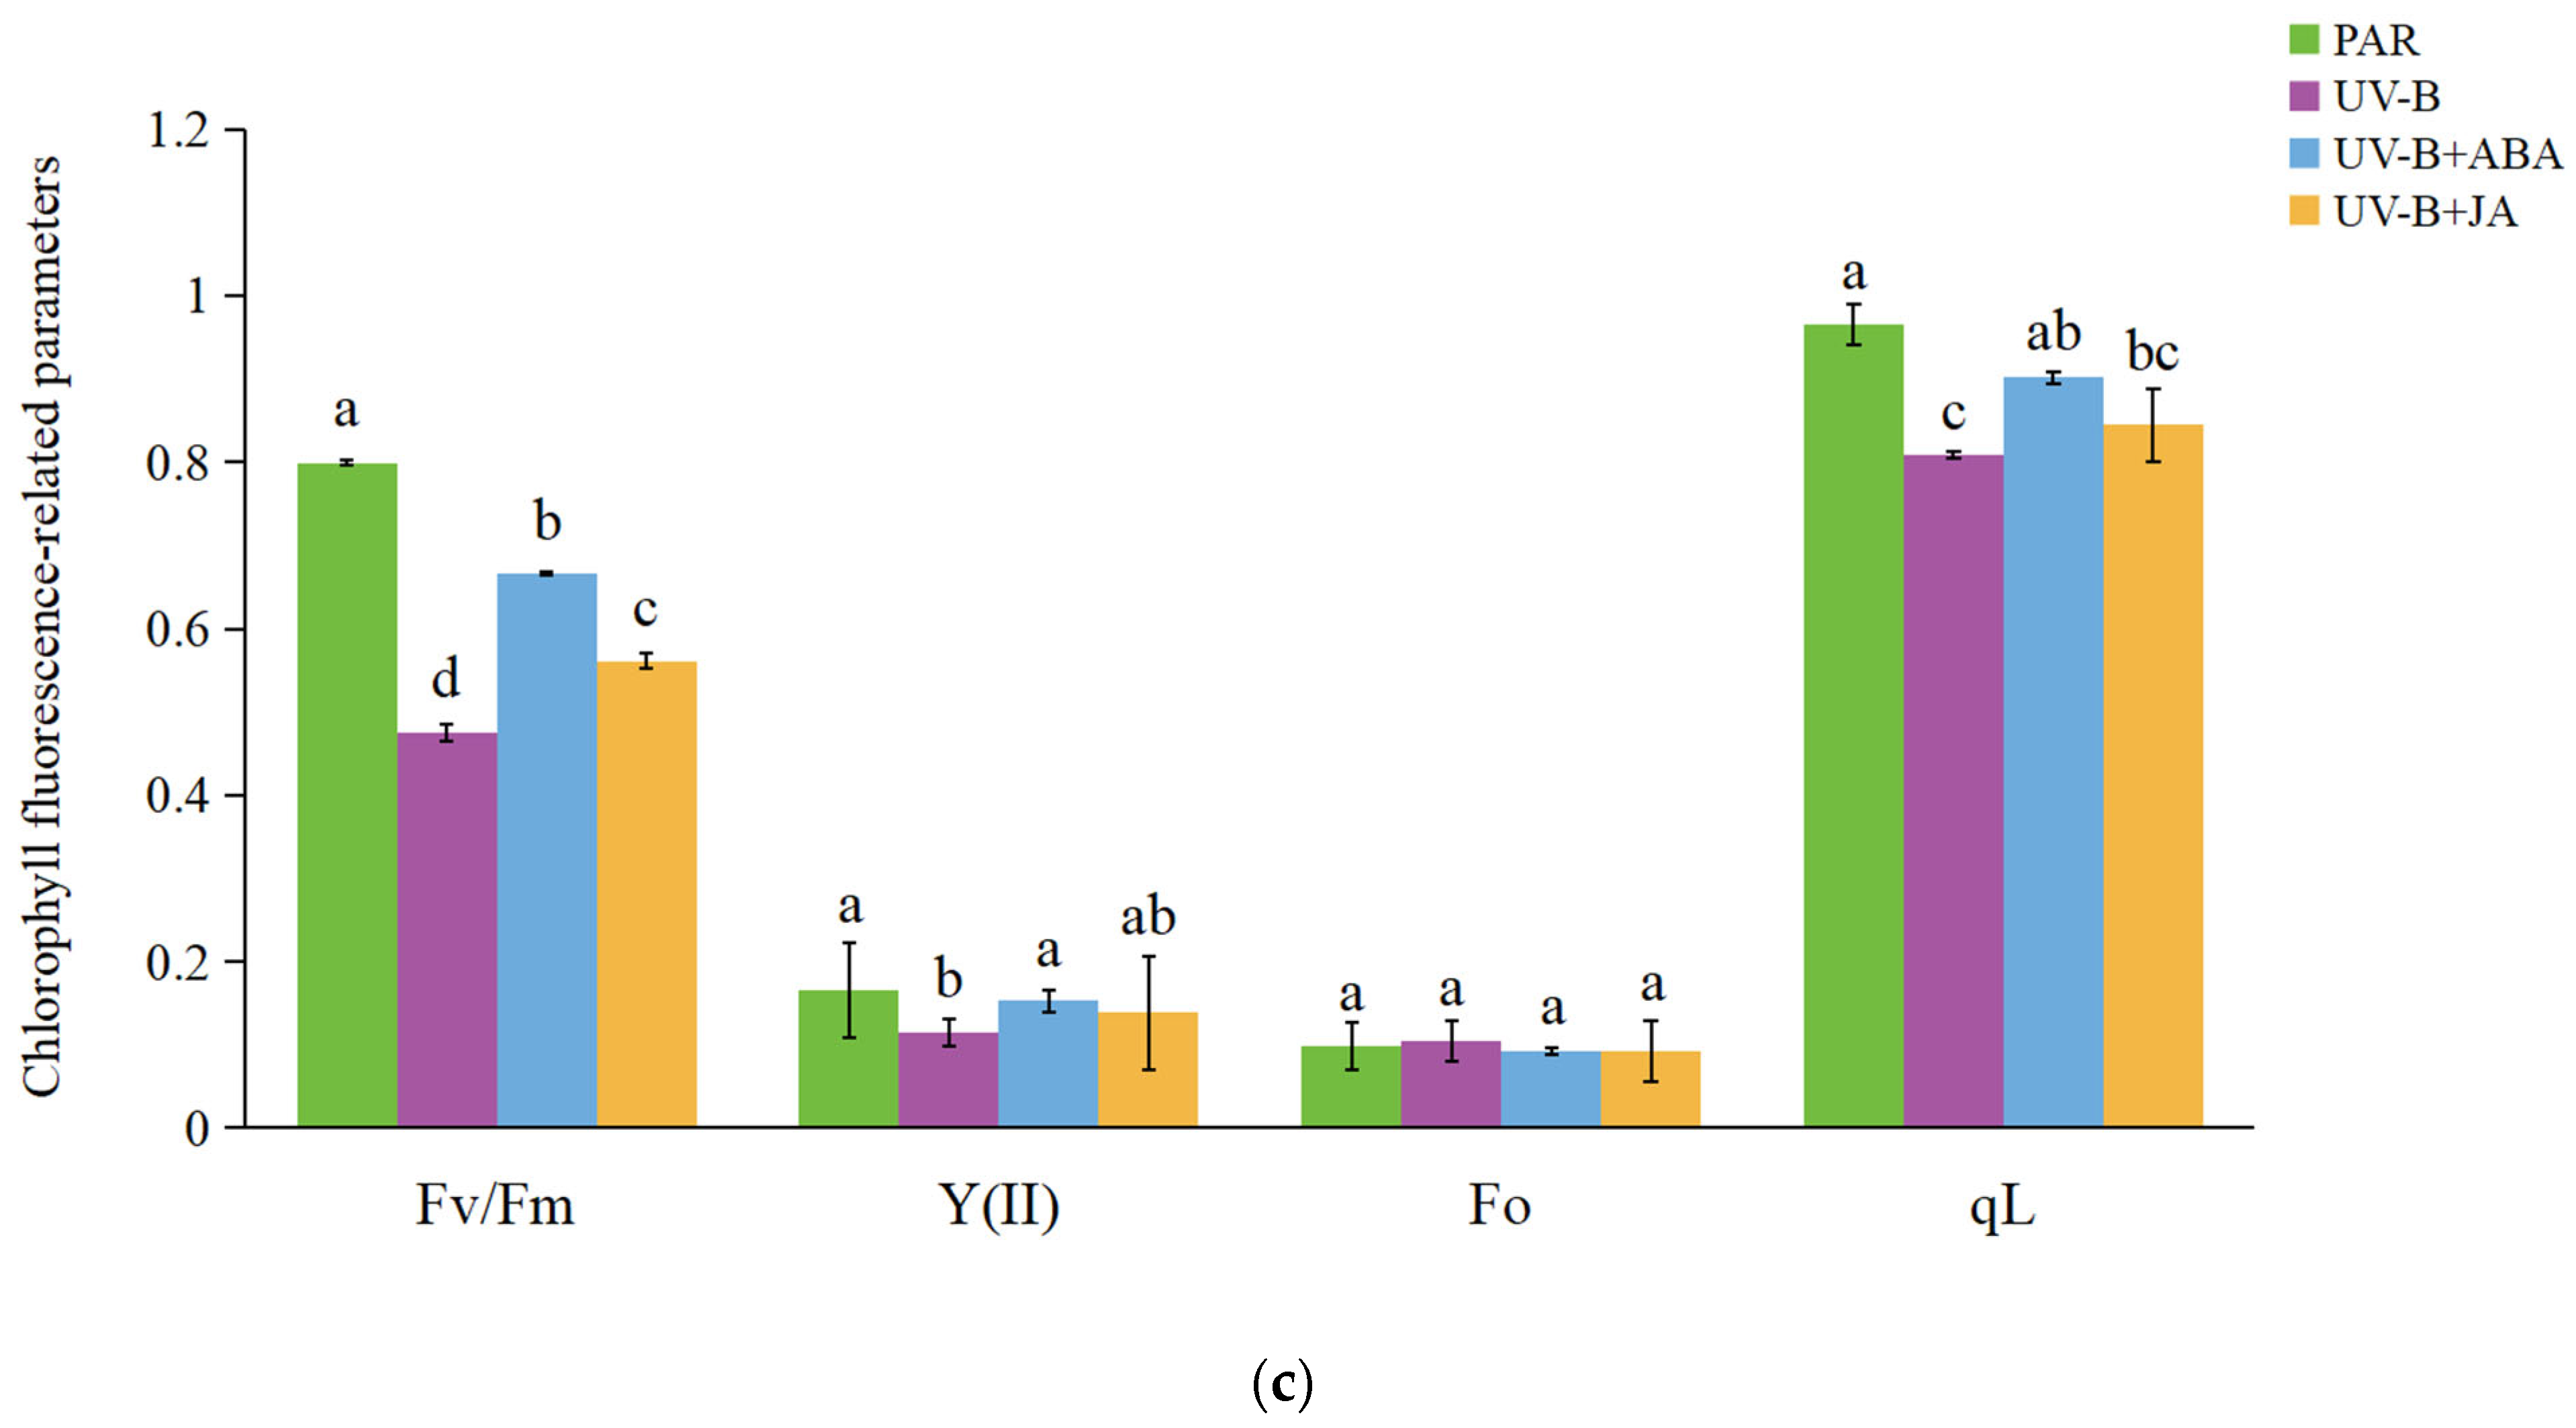
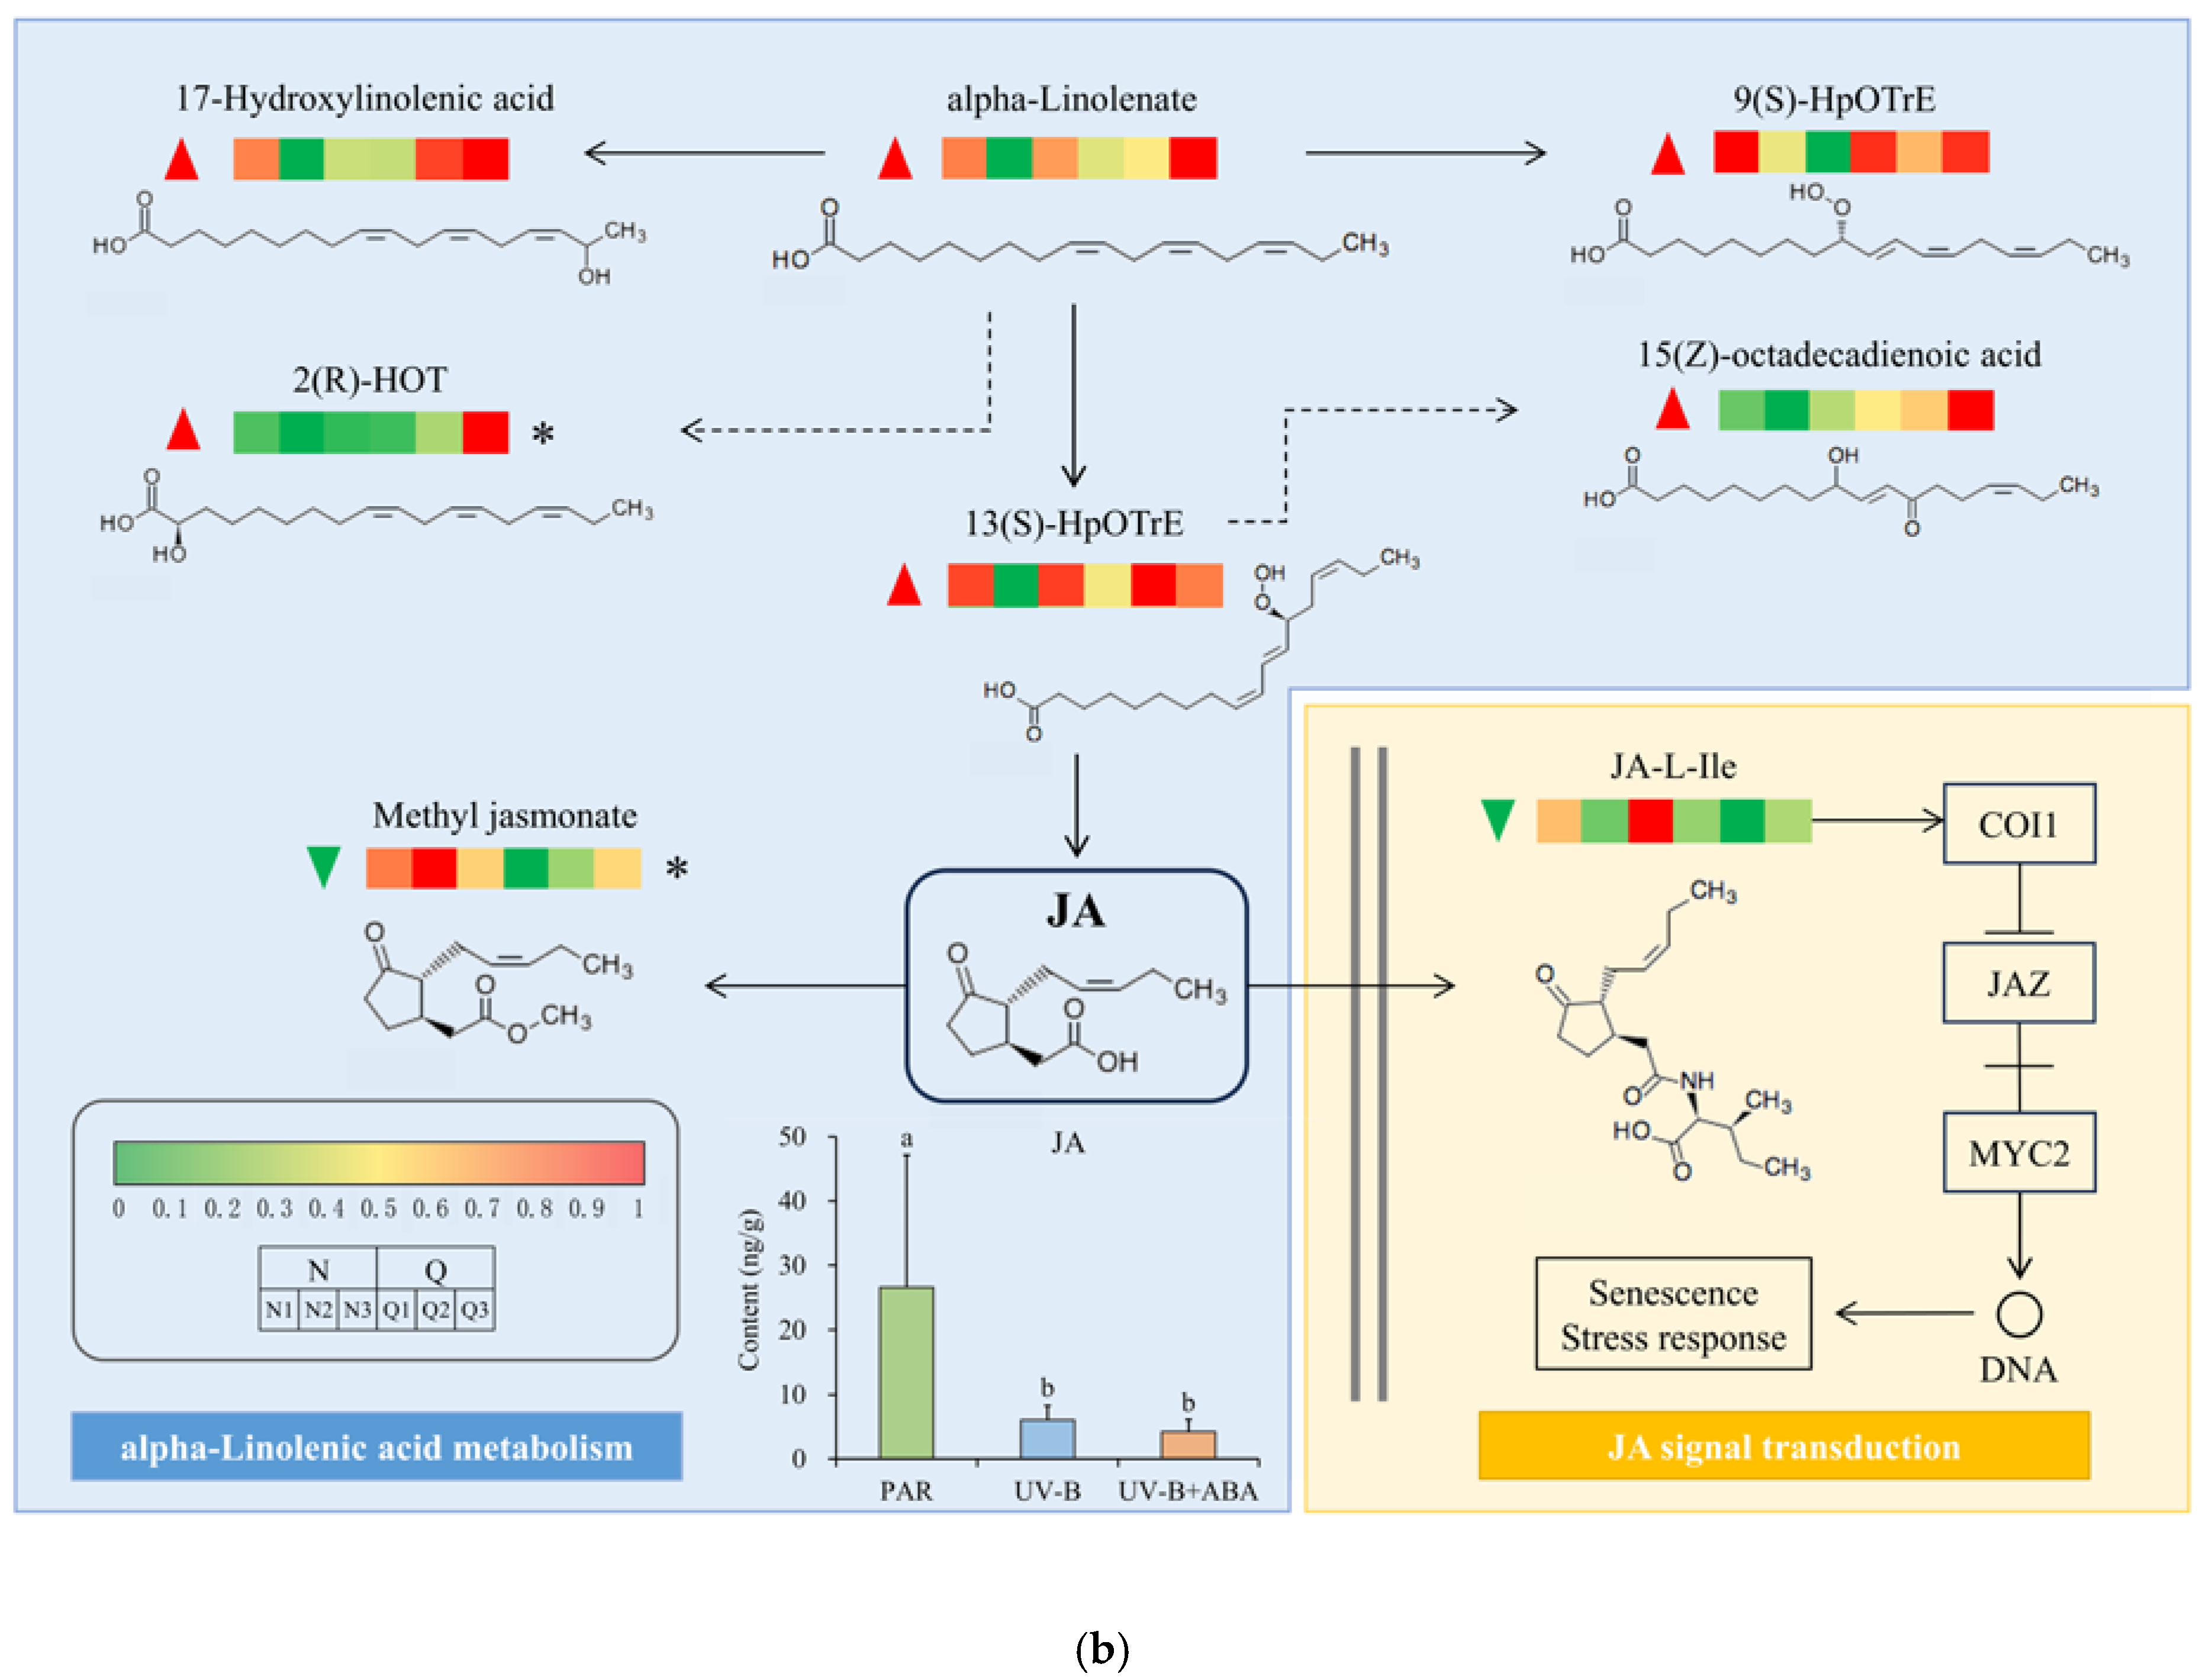
2.2. Negative Control of JA by ABA in R. chrysanthum during UV-B Stress

To investigate the interactions between R. chrysanthum’s two hormones (ABA and JA) under UV-B radiation, the contents of JA and its derivative JA-Val (Jasmonoyl-L-valine) were determined in this experiment utilizing widely targeted metabolomics after therapy with UV-B radiation and exogenous ABA.
The results showed that UV-B significantly reduced the contents of JA and JA-Val in R. chrysanthum compared to the control group treated with PAR. While exogenous ABA treatment did not significantly alter the JA and JA-Val contents of R. chrysanthum exposed to UV-B radiation compared to the UV-B treatment group, they were nonetheless reduced (Figure 2a,b). This shows that ABA may have an inhibitory effect on JA in R. chrysanthum when exposed to UV-B light. This is also consistent with the results for chlorophyll fluorescence parameters. Although exogenous JA treatment enhanced the radiation resistance of R. chrysanthum, the effect was not as obvious as that of exogenous ABA treatment, and it is possible that the exogenous JA was regulated by R. chrysanthum’s own ABA.

2.3. Metabolomic Analysis of R. chrysanthum

To determine the reaction of R. chrysanthum to UV-B stress and the function of exogenous ABA in this regard, a UPLC-MS platform was used to extensively target metabolomic technology to identify primary and secondary metabolites in the samples. A total of 2148 metabolites (623 primary metabolites and 1525 secondary metabolites) were detected, including 188 amino acids and derivatives, 75 nucleotides and derivatives, 134 lipids, 487 flavonoids, 49 lignans, 42 coumarins, 37 tannins, 117 alkaloids, 394 phenolic acids, 227 terpenoids, 108 organic acids, 2 steroids, 5 stilbenes, 17 ketone compounds, 11 chromones, 14 aldehyde compounds, 10 lactones, 10 alcohol components, 17 quinones, 79 saccharides, 29 vitamins, and 96 others (Figure 3a; Supplementary Table S1). Thus, amino acids and derivatives, organic acids, and lipids are the major primary metabolites of R. chrysanthum, while flavonoids, phenolic acids, and terpenoids are the major secondary metabolites of R. chrysanthum.
By conducting OPLS-DA (orthogonal partial least-squares discriminant analysis) on samples, differences between different groups can be observed. Therefore, in this experiment, three independent replicates of PAR-treated (M), UV-B radiation-treated (N), and exogenous ABA-treated (Q) samples of R. chrysanthum were further analyzed for metabolites using OPLS-DA (Figure 3b). The outcomes demonstrated that the first principal component could explain 22% of the features of the original dataset, while the second principal component could explain 24% of the features of the original dataset. This suggested that after exogenous ABA treatment and UV-B radiation treatment, there were notable metabolite alterations in the samples. At the same time, Pearson correlation analysis was conducted on the samples, including quality control samples (QCs), and the results showed a high positive correlation between each duplicate sample (Figure 3c). This indicates better biological replication for each of the three comparison groups (M, N, and Q). In summary, the relevant data from this experiment were reliable and suitable for subsequent analysis.

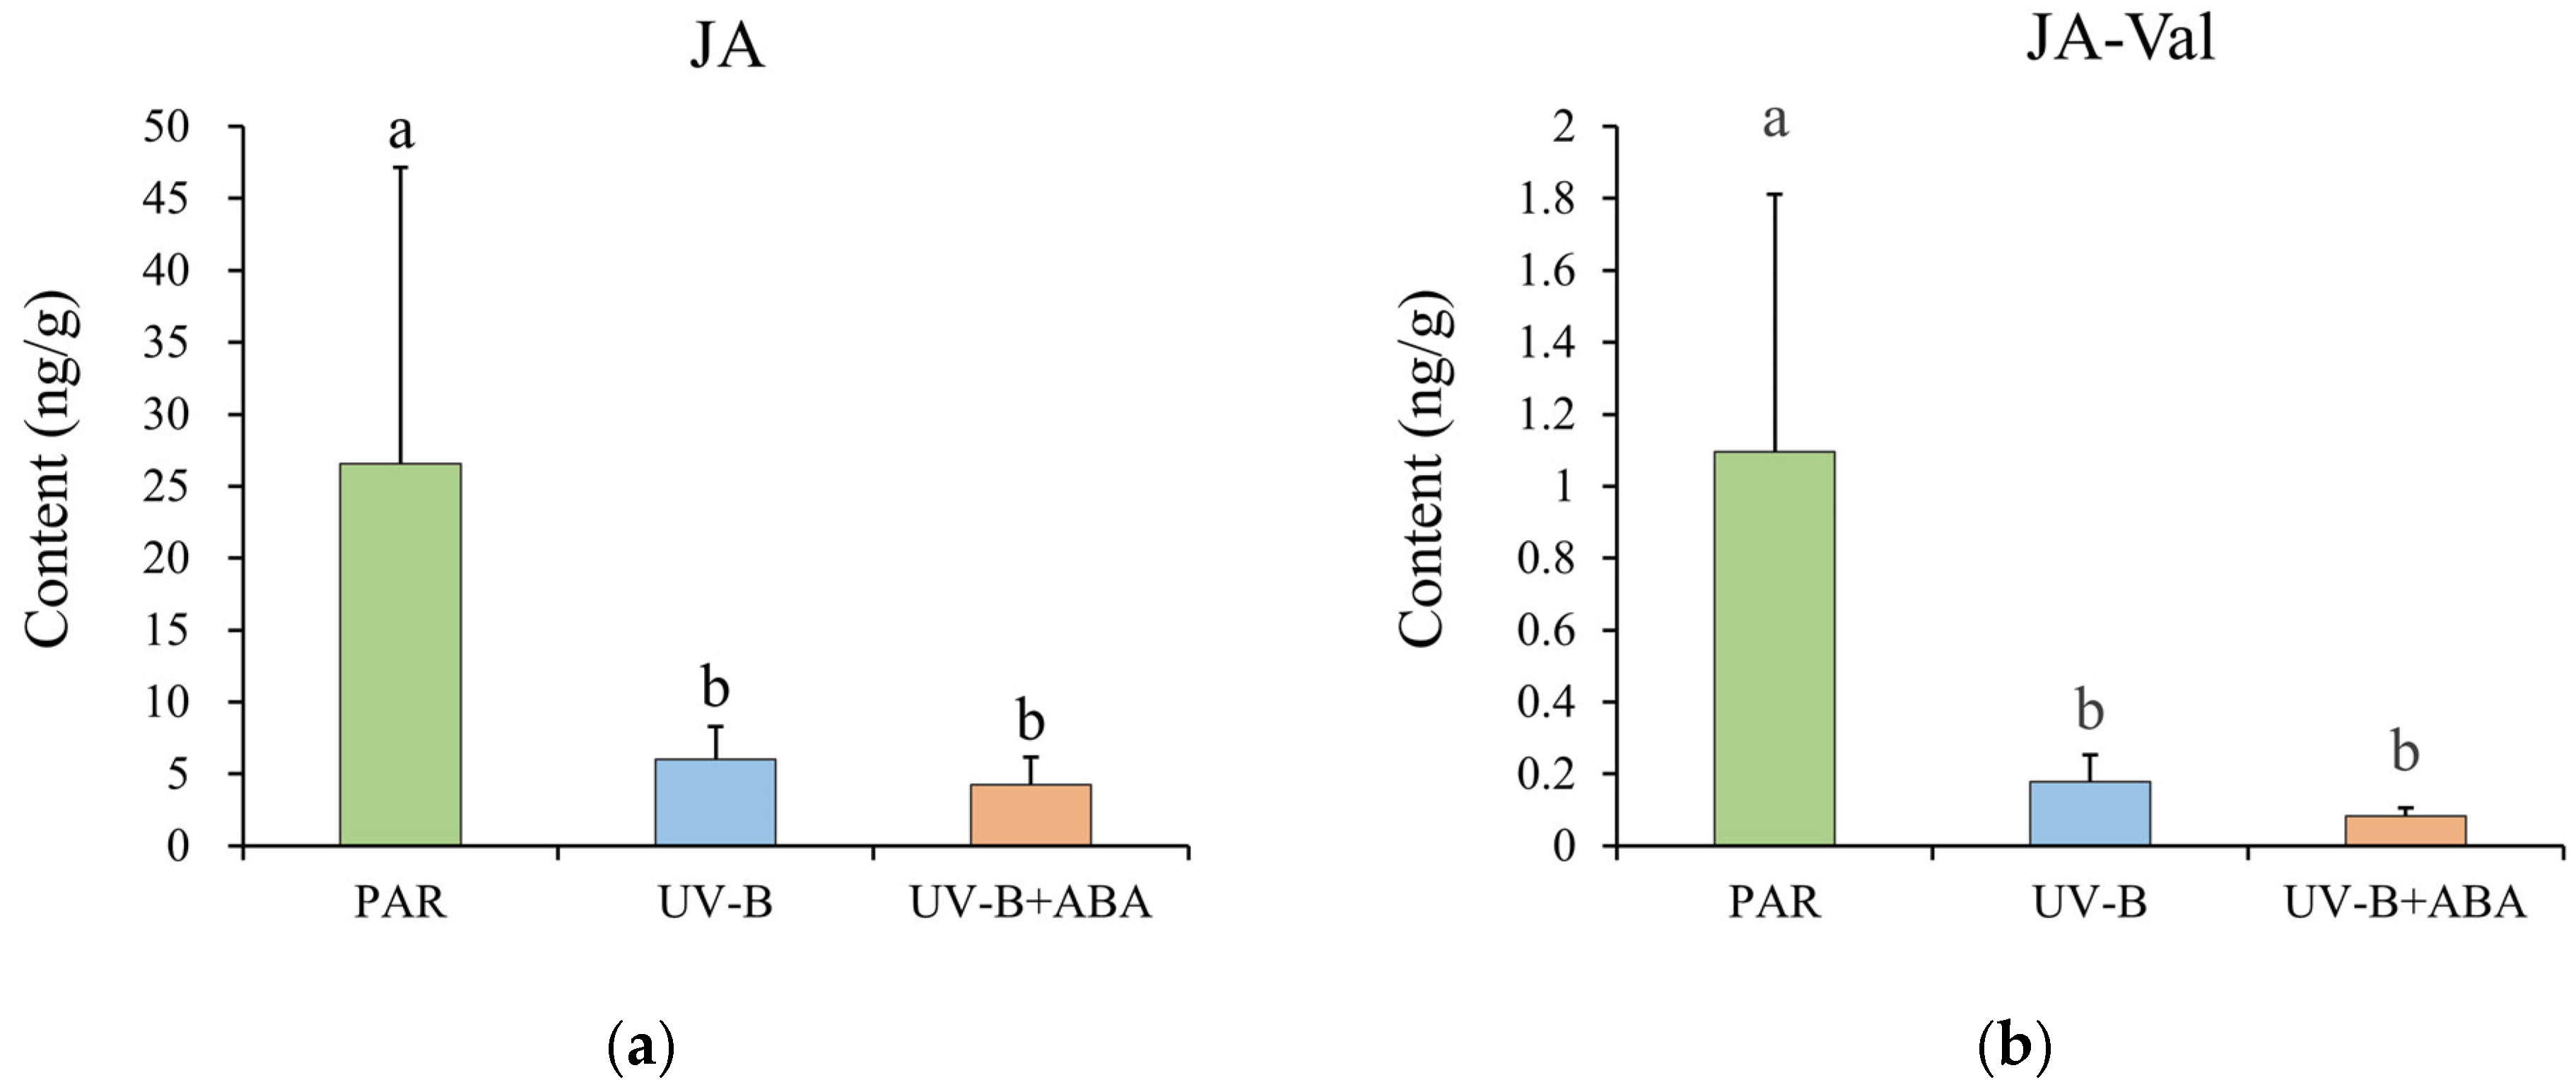
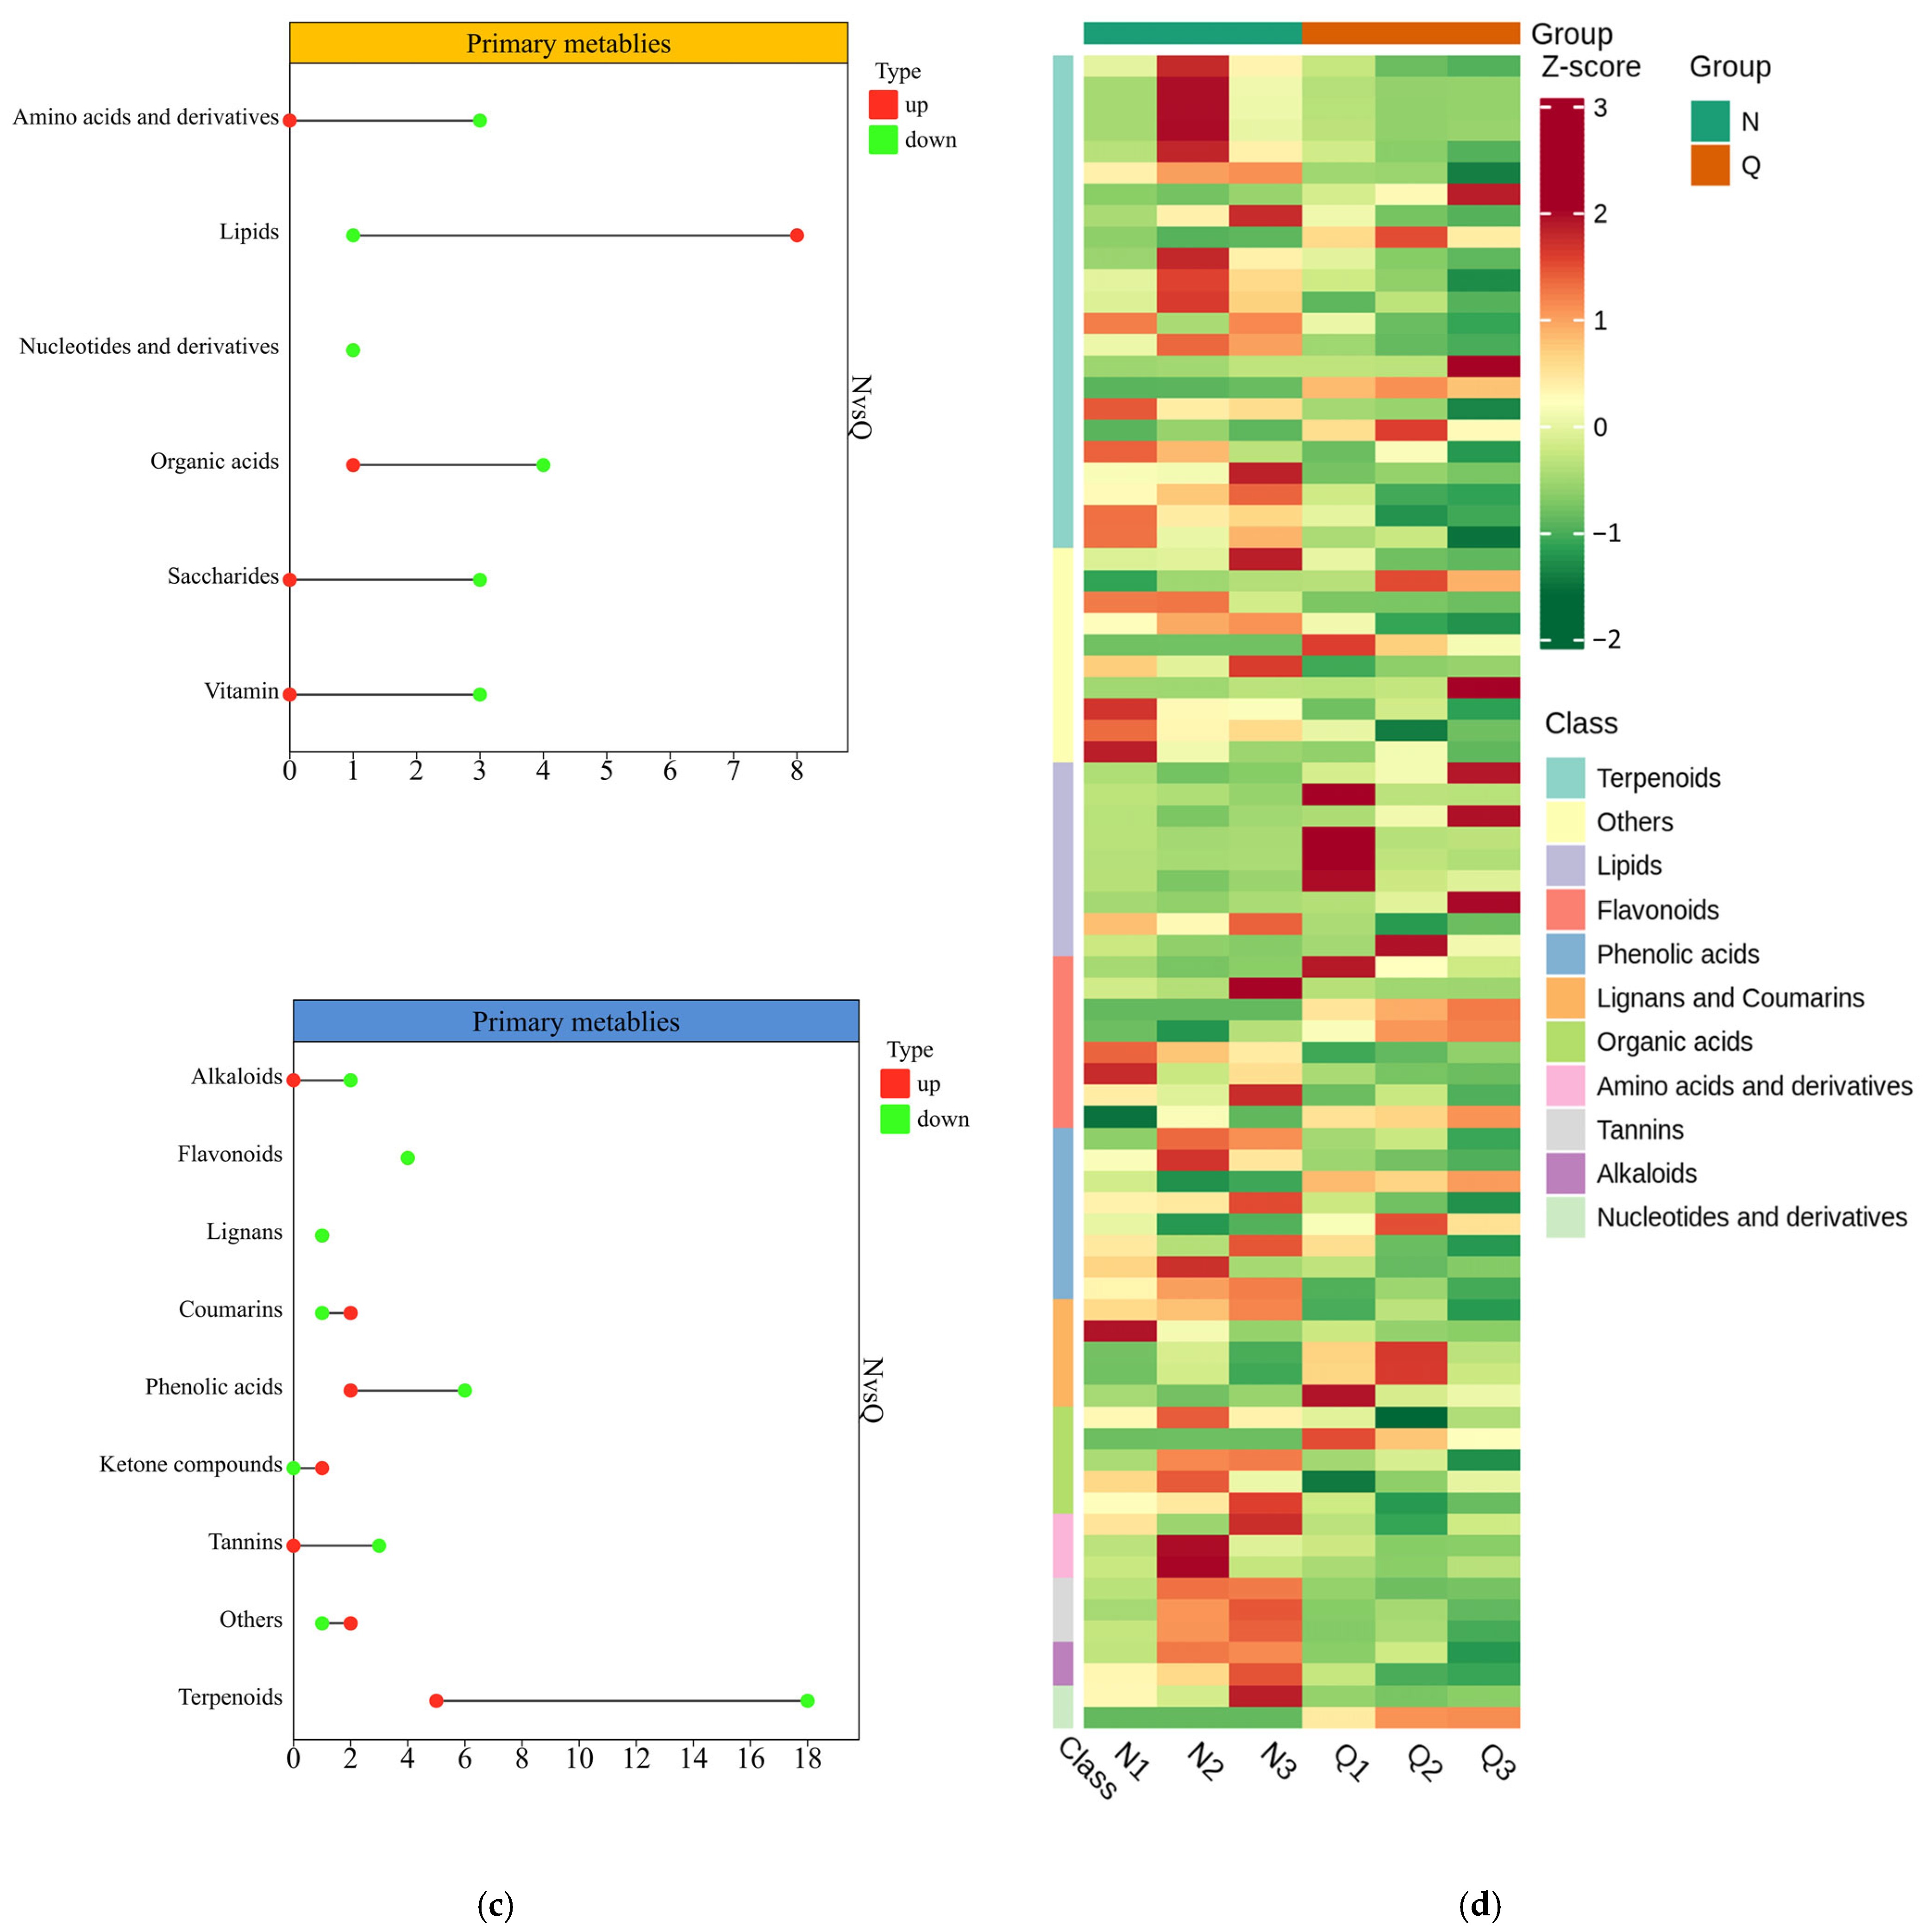
2.4. Response of Primary and Secondary Metabolites of R. chrysanthum to UV-B as Well as Exogenous Exogenous ABA

The DMs (differential metabolites) of R. chrysanthum treated with UV-B and exogenous ABA were visualized using heatmaps, and quantitative statistics on the upregulation and downregulation of related primary and secondary metabolites were visualized through dumbbell plots. The dumbbell plots showed that after UV-B radiation, a total of 70 primary DMs and 165 secondary DMs were generated (Figure 4a; Supplementary Table S2), while after exogenous ABA treatment, 25 primary DMs and 53 secondary DMs were generated (Figure 4c; Supplementary Table S3). The cluster heatmap showed that the contents of some primary and secondary metabolites in R. chrysanthum fluctuated after UV-B radiation treatment (Figure 4b). The primary metabolites that were mainly upregulated included lipids, nucleotides and their derivatives, and organic acids. The contents of flavonoids, terpenoids, and phenolic acids among secondary metabolites increased, while the content of saccharides decreased. It is noteworthy that UV-B radiation decreased the contents of most amino acids and derivatives in R. chrysanthum but stimulated an increase in phenolic contents. After the application of exogenous ABA, lipids dominated the upregulated primary metabolites, indicating their involvement in responding to ABA resistance to UV-B stress. However, the terpenoids in secondary metabolites decreased significantly (Figure 4d).

2.5. Primary and Secondary Main Contributing Metabolites

To further explore which primary and secondary metabolites respond to UV-B stress and exogenous ABA treatment, a radar map based on variable importance in projection (VIP) was used to compare and screen the primary and secondary metabolites under the two treatments (Figure 5a). The results showed that three metabolites—riboprine, N-(beta-D-glucosyl)nicotinate, and gallocatechin-(4α->8)-catechin-(4α->8)-catechin—were the major contributing metabolite groups, implying that they are functionally related to the UV-B radiation response. Among them, riboprine and gallocatechin-(4α->8)-catechin-(4α->8)-catechin showed similar trends after UV-B radiation as well as exogenous ABA treatment, with a significant decrease in the contents of both of them after UV-B radiation and an increase in the contents of both of them after the application of exogenous ABA. UV-B radiation increased the content of N-(beta-D-glucosyl)nicotinate, yet it was not further elevated by exogenous ABA (Figure 5b).

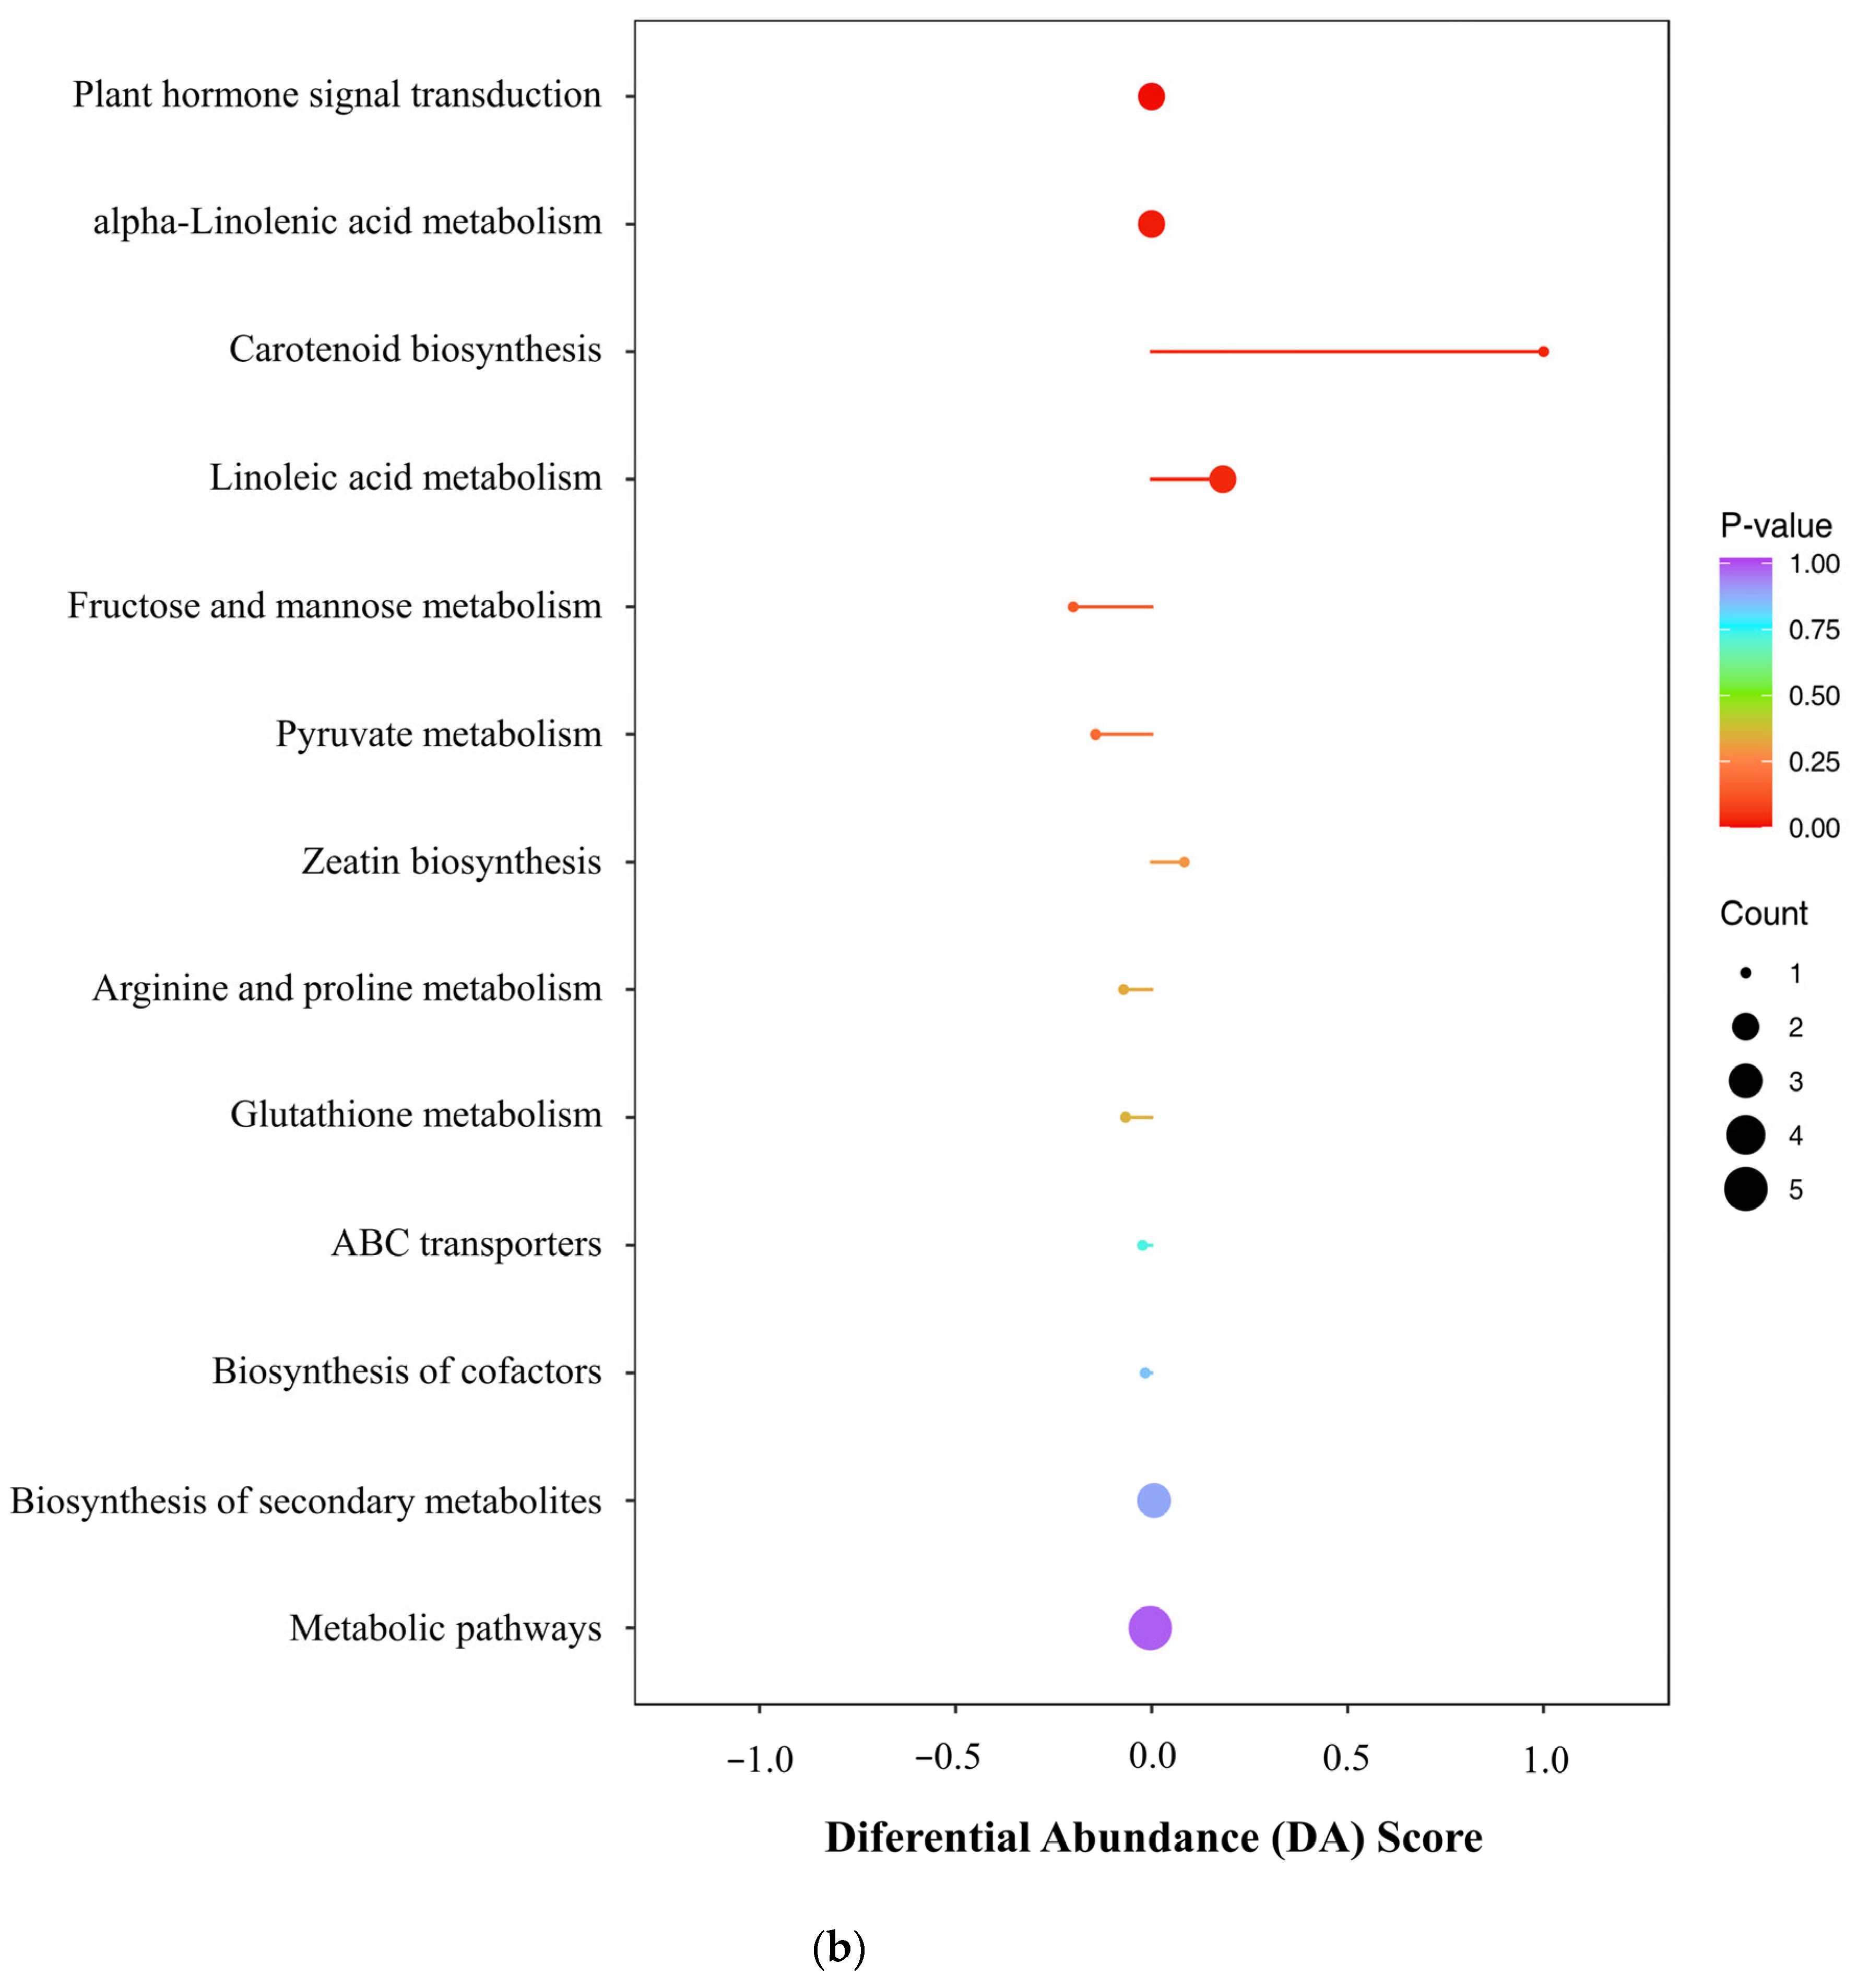
2.6. Effects of UV-B and Exogenous ABA Treatment on the Metabolic Pathway of R. chrysanthum

All DMs in the different comparison groups (MN and NQ) were matched to KEGG entries to obtain pathway information involving metabolites. Enrichment analysis of the annotated results was conducted to obtain pathways with more enriched DMs.
The DMs of Group M and Group N were mainly annotated and enriched in amino acid metabolism-related pathways. These results suggest that UV-B radiation caused significant changes in several amino acid-related metabolic pathways in R. chrysanthum. This indicates that R. chrysanthum likely primarily adapts to UV-B radiation by reprogramming pathways related to amino acid metabolism, e.g., lysine degradation, D-amino acid metabolism, arginine biosynthesis, lysine biosynthesis, and other pathways (Figure 6a).
The DMs of Group N and Group Q were mainly annotated and enriched in plant hormone signal transduction, alpha-linolenic acid metabolism, and linoleic acid metabolism. Alpha-linolenic acid metabolism is involved in JA synthesis, and plant hormone signal transduction is also related to JA signaling, indicating that ABA in R. chrysanthum following UV-B stress does indeed exert a regulatory effect on JA.
In these comparative groups (MN and NQ), some metabolic pathways overlapped, including carotenoid biosynthesis, ABC transporters, and biosynthesis of secondary metabolites. Exogenous ABA promoted linoleic acid metabolism, suggesting that ABA enables R. chrysanthum to produce more phytolipids with energy-accumulating effects to mitigate the damage caused by UV-B to R. chrysanthum. Notably, UV-B radiation severely inhibited carotenoid biosynthesis, and exogenous ABA treatment alleviated this inhibition, suggesting that ABA may help R. chrysanthum to repair its UVB-damaged phototropic capacity (Figure 6b). This discovery fits nicely with the photosynthesis index data, indicating that ABA protects R. chrysanthum’s photosynthetic system.

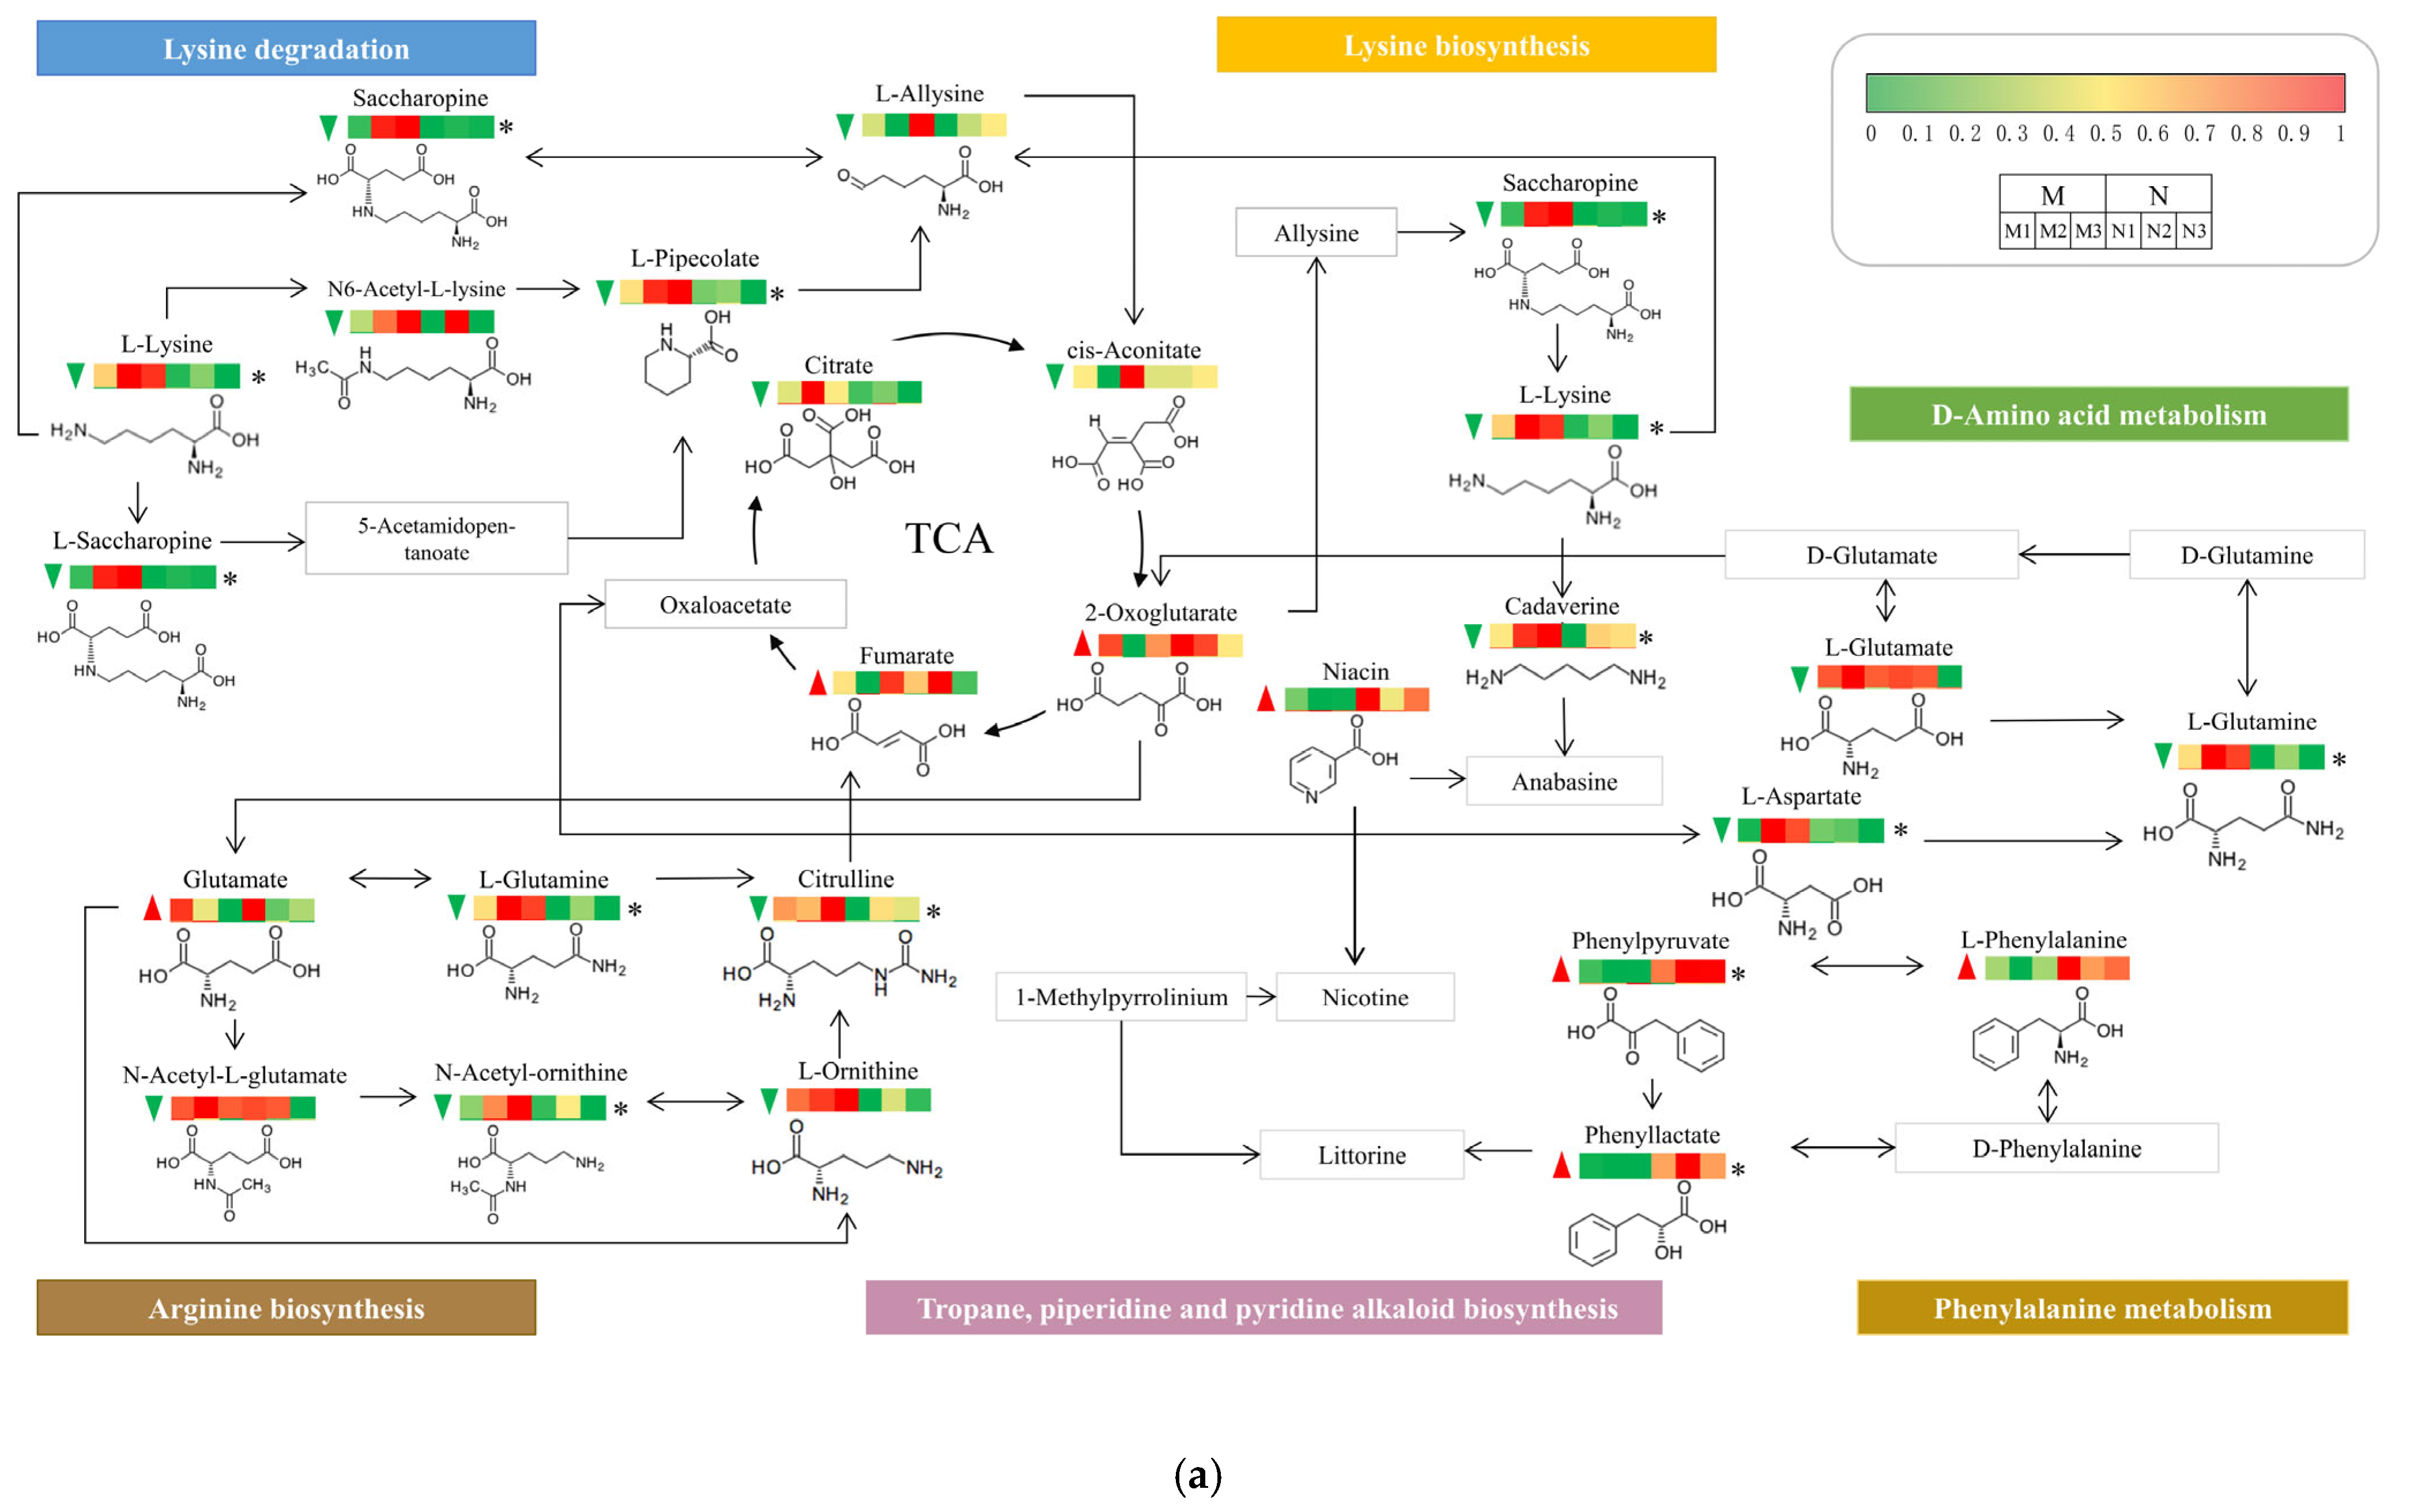
2.7. UV-B and Exogenous ABA Prompt Rearrangement of the Metabolic Pathway Network of R. chrysanthum

The above KEGG results showed that UV-B mainly induced significant changes in several amino acid-related metabolic pathways in R. chrysanthum, leading to reprogramming of these pathways. However, these pathways do not exist independently but are interconnected in a network of metabolic pathways. In order to better demonstrate the interrelationships among DMs in response to radiation stress, the present experiment constructed a comprehensive metabolic network of R. chrysanthum after UV-B radiation based on the KEGG. The results showed that UV-B caused significant changes in many pathways in R. chrysanthum, such as arginine biosynthesis, lysine degradation, and D-amino acid metabolism, reflecting the fact that R. chrysanthum defends itself from UV-B by reprogramming these metabolic pathways. It is noteworthy that the contents of most metabolites of R. chrysanthum decreased after radiation, while the citric acid cycle was activated, suggesting that R. chrysanthum may reduce the effects of UV-B on itself by providing energy to itself through the citric acid cycle (Figure 7a).
Exogenous ABA significantly affected the alpha-linolenic acid metabolism and plant hormone signal transduction pathways in R. chrysanthum. Both pathways are closely related to JA, and a simplified model of these two pathways was constructed to reveal the regulatory mechanism of exogenous ABA on JA in R. chrysanthum under UV-B stress. The outcomes revealed that exogenous ABA increased the expression of metabolites involved in JA biosynthesis while it decreased the expression of JA derivatives (methyl jasmonate and JA-L-Ile) in R. chrysanthum following UV-B stress. Among them, JA-L-Ile (jasmonoyl-L-isoleucine) is a key substance in the process of JA signaling, and exogenous ABA led to a decrease in its expression. This suggests that there is indeed an inhibitory effect of ABA pairs in R. chrysanthum under UV-B stress in terms of JA exerting its own function (Figure 7b).

3. Discussion

The Earth’s environment has been deteriorating in recent years, leading to a depletion of the stratospheric ozone layer and an influx of UV-B radiation that would have otherwise been blocked, resulting in an excessive amount of radiation reaching the Earth [36]. Conversely, UV-B hinders the regular functioning of plant photosystems, hampers their transpiration, and can cause chaos throughout their entire lifespan [37].
The impacts of adversity stress on the plant photosynthetic system can be accurately represented by several chlorophyll fluorescence metrics [38,39,40]. In this case, the chlorophyll fluorescence characteristics of R. chrysanthum were measured, and the outcomes revealed that UV-B had a variety of detrimental effects on the experimental materials’ photosynthetic systems. After administering exogenous hormones (ABA and JA), the test materials’ UV-B resistance increased, with ABA having a stronger effect than JA (Figure 1). Exogenous ABA treatment reduced the concentration of JA and its product JA-Val in the test sample following UV-B exposure (Figure 2). While JA and ABA equally improved the stress tolerance of the experimental materials, the findings suggest that ABA may have a negative regulatory effect on JA during UV-B exposure.
In the present study, the effect of UV-B on R. chrysanthum as determined from a metabolomic perspective revealed large fluctuations in the contents of amino acids and their derivatives, as well as saccharides, lipids, phenolic acids, flavonoids, and terpenoids. However, upon application of exogenous ABA, it was found that lipids and terpenoids synergized with ABA to counteract the damage produced by UV-B. In addition, riboprine, N-(beta-D-glucosyl)nicotinate, and gallocatechin-(4alpha->8)-catechin-(4alpha->8)-catechin were the major contributing metabolite groups with large macro-responses after UV-B and exogenous ABA.
R. chrysanthum undergoes a range of adaptive processes to mitigate the detrimental effects of radiation, with the accumulation of saccharides being a crucial factor [41,42]. Indeed, there is a strong correlation between UV-B radiation and the presence of saccharides in plants. Scientific evidence has demonstrated that the presence of UV-B leads to a reduction in the overall carbon sequestration within plants [43,44]. This would indirectly impact the transportation of saccharides and the accumulation of starch, as the regulation of this process could be influenced by the carbon fluxes generated during sucrose synthesis [45]. While sucrose assumes a vital function as a saccharide in plant leaves, it also engages in various metabolic processes within plants as a means of signaling [46]. And the strength of the plant’s ability to pit against adversity is also regulated by the amount of sucrose present in the vesicles. Furthermore, the decomposition of starch, a saccharide, bestows upon plants the capacity to sustain their natural carbohydrate levels irrespective of their surroundings [47]. The results of the present study showed that UV-B radiation was indeed able to induce a decrease in the saccharide contents of most species (Figure 4c). It is therefore likely that R. chrysanthum plants respond to the radiation they encounter by synthesizing and consuming starch in this manner—a result that is consistent with the findings of previous studies [47].
During the daytime, plants provide themselves with energy for growth and development through photosynthesis; however, in the absence of light, plants mobilize their own metabolites, such as carbohydrates and amino acids, to provide themselves with energy through the TCA cycle and associated amino acid metabolism [48,49]. Plants are subjected to abiotic stresses that severely interfere with plant photosynthesis and lead to associated signal transduction that promotes reprogramming of plant metabolic networks [50]. The results of KEGG enrichment analyses in this experiment showed that UV-B radiation caused significant changes in several amino acid-related metabolic pathways of R. chrysanthum, contributing to the reprogramming of amino acid metabolic pathways (Figure 6a). Among the amino acids that were detected, an increase was observed in the content of glutamate, which has a crucial role as a core amino acid in the amino acid metabolism of higher plants and is able to participate in the synthesis of chlorophyll [51]. This suggests that R. chrysanthum is likely able to restore damaged chlorophyll through elevated glutamate contents and thus actively resist UV-B stress (Figure 7a). UV-B radiation similarly elevated phenylalanine contents in R. chrysanthum. Phenylalanine plays an important role in the synthesis of many antioxidant secondary metabolites [52]. It is likely that R. chrysanthum initiates its own antioxidant defense mechanisms by increasing its own phenylalanine content—a phenomenon that is also consistent with the upregulation of phenols and flavonoids that was observed after exposure to UV-B radiation (Figure 4a,b). In addition, the content of niacin (nicotinic acid) in R. chrysanthum increased after UV-B radiation. Niacin has the effect of repairing DNA and promotes the synthesis of ATP [53]. The experimental results suggest that R. chrysanthum actively responds to the damage caused by UV-B by enhancing these specific amino acids that play a role in resisting abiotic stresses. A crucial modulator of the interactions between carbon and nitrogen is fumaric acid. Fumaric acid has been demonstrated to be likely to increase in the presence of UV-B radiation [54]. Notably, comparable outcomes were seen in the current study, where UV-B led to a reduction in the majority of the R. chrysanthum’s amino acid contents but an increase in fumaric acid, an intermediary in the tricarboxylic acid cycle. Therefore, it is possible that R. chrysanthum stimulates the regular course of the TCA cycle in order to provide itself with energy to fight the damage induced by UV-B.
Abscisic acid (ABA) is an important phytohormone which is involved in many physiological processes, such as growth, development, and stress resistance in higher plants, and the content and signaling of ABA in the plant body are of great significance in regulating the plant’s response to adversity as well as its growth and development [55,56]. The KEGG enrichment findings revealed that ABA treatment of UV-B-irradiated experimental materials dramatically altered alpha-linolenic acid metabolism and the plant hormone signal transduction pathway (Figure 6b). It has been shown that alpha-linoleic acid metabolism is closely related to plant responses to abiotic stresses, especially in relation to phytohormonal defense signaling pathways, such as the biosynthesis of jasmonic acid and its derivatives. Linoleic acid metabolism generates signaling molecules to initiate the expression of defense genes, influences membrane fluidity and stability to mitigate damage to cell membrane structure and function, participates in the formation of lipids, and produces derivatives with antioxidant properties in response to abiotic stresses [57,58,59,60,61]. This is congruent with the results revealed for chlorophyll fluorescence parameters, indicating that exogenous ABA enhanced the tolerance of the experimental materials’ photosynthetic system to UV-B radiation. Therefore, it is likely that ABA stimulates the production of R. chrysanthum lipids through linoleic acid metabolism, which in turn repairs the photosynthetic membrane system to restore the damage caused by UV-B.
Plant defense responses to various environmental stress factors are firstly controlled by relevant plant hormones. However, hormones do not regulate responses singly; different plant hormones interact with and influence each other to form a hormone regulatory network [62]. The complex regulatory network of phytohormones and their great influence on various physiological processes, such as controlling stomatal conductance, controlling chloroplastogenesis, and influencing seed dormancy, are the main reasons why phytohormones can be used as key endogenous factors to mediate plant stress responses [63,64,65]. However, few studies on the intrinsic linkages between the hormones of R. chrysanthum and the interactions between the hormones and metabolites are currently available. To gain a deeper understanding of defense response mechanisms, it is crucial to study the complex interactions between different phytohormones in R. chrysanthum, especially in response to damage caused by UV-B.
Exogenous ABA treatment had a substantial effect on JA production and JA signaling pathways in UV-B-treated experimental materials, according to the results of the KEGG enrichment analyses (Figure 6b). JA-L-Ile (jasmonoyl-L-isoleucine) is the active form of jasmonic acid, which is able to release transcription factors such as MYC2 by binding to the receptor protein COI1 in the plant, which in turn affects the degradation of the JAZ protein. These transcription factors further regulate the expression of downstream genes; thus, JA-Ile plays a crucial role in plant hormone signaling [66,67]. The addition of exogenous ABA reduced the expression of JA-Ile in the test materials exposed to UV-B radiation, indicating that ABA adversely controlled the JA signal transduction pathway (Figure 7b). This validates the phenomenon observed in the chlorophyll fluorescence correlation results, which show that exogenous JA is less efficient compared to ABA in enhancing R. chrysanthum’s UV-B resistance (Figure 1). The rationale is that, despite the fact that exogenous JA can protect R. chrysanthum from UV-B damage, it is also negatively regulated by its own internal ABA. Modifications in plant metabolites tend to be controlled by enzymes and genes [68,69]. It is worth noting that the expression of metabolites involved in JA biosynthesis increased despite the fact that UV-B radiation and exogenous ABA eventually resulted in a decrease in JA content. It is speculated that this happens due to genes generally responding faster to environmental stimuli than secondary metabolism, in which related enzymes and genes play a role in JA production; their method of action warrants additional exploration.
Riboprine is a nucleoside analogue in which adenosine has been modified by substitution at the 6-amino nitrogen by a delta (2)-isopentenyl group. As a plant primary metabolite, riboprine has a regulatory effect on plant growth and enables precise biological translation processes [70,71,72]. However, there are few studies related to N-(beta-D-glucosyl)nicotinate and gallocatechin-(4alpha->8)-catechin-(4alpha->8)-catechin, which are important contributors to R. chrysanthum’s defense against UV-B stress and are worthy of further study.

4. Materials and Methods

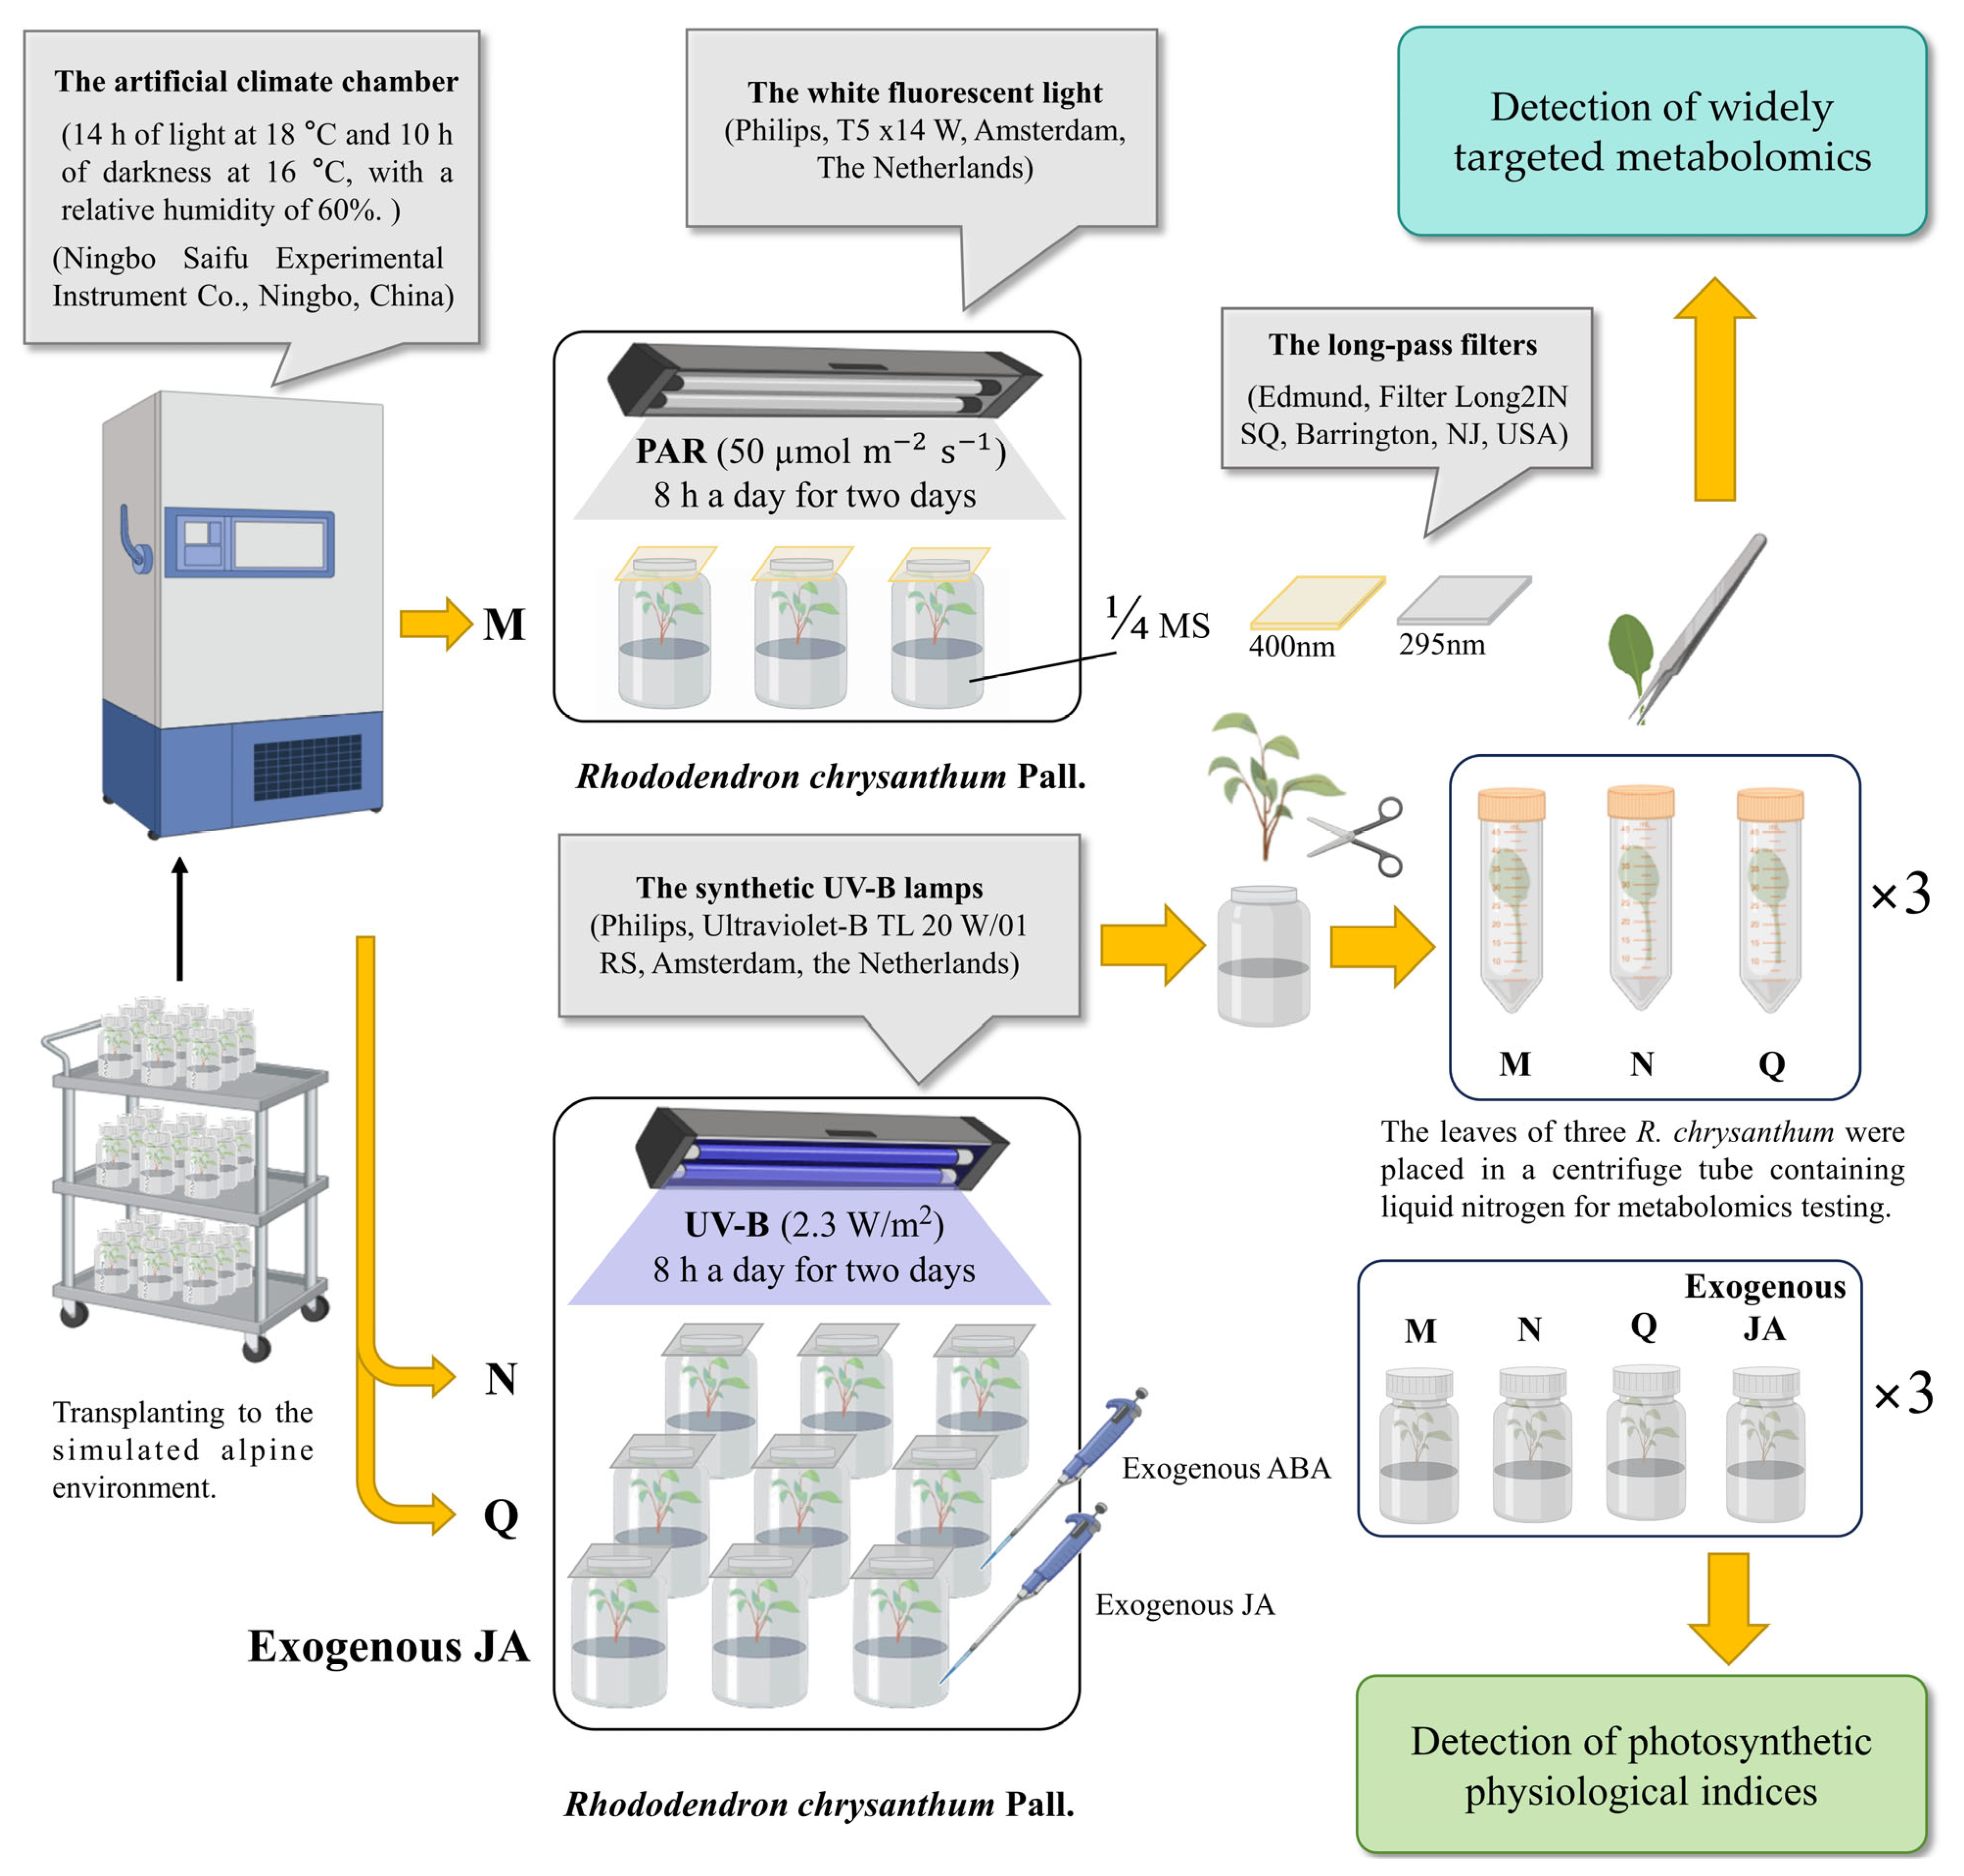
4.1. Material Preparation and Experimental Treatments

The approach involving UV-B radiation and exogenous plant hormones (ABA and JA) was based on previous research, with necessary modifications [73,74]. The experimental materials were obtained from their origins and transplanted to be cultivated in an intelligent artificial climate chamber capable of simulating an alpine ecology (simulated temperatures of 18 degrees Celsius during the day and 16 degrees Celsius at night).
The three comparison groups consisted of similar R. chrysanthum plants grown for eight months in a simulated environment with a luminous flux of 50 μmol/( m 2 ·s). Mixed sampling was utilized to avoid the effects of individual errors (each treatment involved three biological replicates; n = 3). Group M was designated the control group and was irradiated with PAR only, while groups N and Q were treated with UV-B (2.3 W/m2) and ABA, respectively. The duration of PAR and UV-B treatment was 16 h (the irradiation was carried out twice, each time with 8 h of radiation). The radiation source for the PAR treatment was a T5 × 14W fluorescent tube (Philips, T5 × 14 W, Amsterdam, The Netherlands). In order to produce UV-B radiation for the experiment, artificial UV-B lamps with wavelengths between 280 and 320 nm (Philips, Ultraviolet-B TL 20 W/01 RS; Amsterdam, The Netherlands) were used. The irradiance of the UV-B-treated samples was measured using a light meter (TES Elec-trical Electronic Corp., Tes-1339 Light Meter Pro.; Taipei, China) and a UV intensity meter (Sentry Optron-ICS Corp., ST-513, SHH; New Taipei City, China) in accordance with the transmission function of the long-pass filter.
The materials of group M and group N were cultured in 1/4 MS medium, and the materials of experimental group Q were cultured in 1/4 MS medium with ABA (100 μmol/L). The exogenous JA-treated group followed the experimental manipulations of the Q group. The materials of the three groups were cultured for a week in their respective media before the radiation treatment described above.
The R. chrysanthum plants exposed to UV-B radiation were covered with a 295 nm filter (Edmund, Filter Long 2IN SQ; Barrington, NJ, USA) to remove interference, and the R. chrysanthum plants that were not exposed to UV-B radiation were covered with a 400 nm filter (Edmund, Filter Long 2IN SQ; Barrington, NJ, USA) for radiation filtration. After the completion of each experimental treatment, subsequent multi-omics assays were performed and chlorophyll fluorescence parameters were determined (Figure 8).

4.2. Widely Targeted Metabolomics Testing

4.2.1. Dry-Sample Extraction Conditions

The experimental methodology and the conditions for the widely targeted metabolomics were identical to the descriptions of earlier investigations [75].
Employing lyophilization via vacuum freeze-drying, the biological specimens were subjected to dehydration in a freeze-dryer (Scientz-100F, Ningbo Scientz Biotechnology Co., Ltd., Ningbo, China). Subsequently, the dehydrated samples were finely ground into a powder using a Retsch MM 400 mill (Retsch, Haan, Germany) operated at a frequency of 30 Hz for a duration of 1.5 min. An analytical balance (MS105DΜ, Mettler-Toledo International Inc., Shanghai, China) was utilized to precisely measure out 50 milligrams of the powdered sample, which was then combined with 1200 µL of a precooled (−20 degrees Celsius) 70% methanolic aqueous solution containing an internal standard. This mixture was subjected to vortexing at thirty-minute intervals for thirty seconds, and the process was repeated six times to ensure thorough extraction. Following this, the mixture was centrifuged at 12,000× g revolutions per minute for a period of three minutes to facilitate phase separation. The supernatant, which then contained the extracted metabolites, was carefully removed using a pipette. The resulting liquid was then passed through a 0.22 µm pore-sized microporous filter to achieve clarity, and the filtrate was subsequently transferred to an injection vial in preparation for ultra-performance liquid chromatography–tandem mass spectrometry (UPLC-MS/MS) analysis.

4.2.2. UPLC Conditions

According to the previous standard procedure of Wuhan MetWare Biotechnology Co., Ltd. (Wuhan, China), a UPLC-ESI-MS/MS system (UPLC, gasket-packed UFLC CBM30A; MS, 6500 QTRAP) was used for the analysis of R. Cruysanthum leaf extracts [76,77]. The analysis was conducted under the following chromatographic conditions: Utilizing an UPLC system, separation was achieved using an Agilent SB-C18 column (1.8 µm, 2.1 mm × 100 mm). The mobile phase was composed of solvent A, which was pure water containing 0.1% formic acid, and solvent B, which was acetonitrile containing 0.1% formic acid. The sample analysis commenced with an initial gradient of 95% A and 5% B. Over the course of 9 min, the gradient was linearly adjusted to reach 5% A and 95% B, which was then maintained for an additional minute. Following this, the system was re-equilibrated to 95% A and 5.0% B within 1.1 min, and this composition was sustained for 2.9 min. The flow rate was maintained at 0.35 mL per minute, the column temperature was set at 40 °C, and the sample injection volume was 2 μL. The eluent was directed to an ESI-triple quadrupole-linear ion trap (QTRAP) mass spectrometer for detection.

4.2.3. ESI-Q TRAP-MS/MS

The ESI source operation parameters were as follows: the source temperature was 500 °C; the ion spray voltage (IS) was 5500 V (positive ion mode) or 4500 V (negative ion mode); the ion source gas I (GSI) and gas II (GSII) and the curtain gas (CUR) were set at 50, 60, and 25 psi, respectively; and the collision-activated dissociation (CAD) was high. QQQ scans were obtained through multiple reaction monitoring (MRM) experiments, with the collision gas (nitrogen) set to medium. The declustering potential (DP) and the collision energy (CE) for each individual MRM transition were subsequently optimized. A particular set of MRM transitions was monitored for each period, in accordance with the metabolites eluted within that period.

4.2.4. Qualitative and Quantitative Analysis of Metabolites

Based on the local metabolic database, the self-built MWDB (metware database; Wuhan MetWare Biotechnology Co., Ltd., Wuhan, China), and the mass spectrometry analysis, the metabolites of the samples were qualitatively and quantitatively analyzed. The characteristic ions of each substance were screened out by a triple quadrupole, the signal intensity (CPS) of the characteristic ions was obtained in the detector, and the mass spectrometry file of the sample downstream was opened by MultiQuant software to carry out chromatographic peak integration and correction, where the peak area (area) of each chromatographic peak represented the relative content of the corresponding substance [78].

4.2.5. Differential Metabolites (DMs) Selected

The measurement of plant hormones was accomplished using liquid chromatography–tandem mass spectrometry (LC-MS/MS), following the experimental procedures established by previous studies [35]. Detection of phytohormone expression data was performed by Hangzhou Jingjie Bio-technology Co.
For two-group analysis, DMs were determined by VIP (VIP > 1) and absolute Log2FC (|Log2FC| ≥ 1.0). VIP values were extracted from OPLS-DA results generated using R package MetaboAnalystR. The data were log-transformed (lo g 2 ) and mean-centered before OPLS-DA. In order to avoid overfitting, a permutation test (200 permutations) was performed.

4.2.6. OPLS-DA and Pearson Correlation Coefficients

The supervised OPLS-DA model was analyzed using the MetaboAnalystR package OPLSR and the Anal function in R (1.0.1) (www.r-project.org (accessed on 1 November 2023)). The Pearson correlation coefficients (PCCs) between the samples were then calculated using the cor function in R and presented as heatmaps. The PCC analysis was performed using the R package ComplexHeatmap (0.84).

4.3. Determination of Chlorophyll Fluorescence Parameters

The assay for the determination of chlorophyll fluorescence parameters was based on a previous experimental technique [79]. The PSII chlorophyll fluorescence parameters and related parameters in R. chrysanthum leaves were determined and calculated using the IMAGING-PAM chlorophyll fluorescence imaging system (Heinz Walz, Germany). The test materials were kept in darkness for 30 min, after which three observation points on leaves with similar growth were chosen, and the minimal fluorescence (Fo), maximum fluorescence (Fm), maximum fluorescence in the light (Fm’), and photochemical quenching (qL) were measured and the related parameters were calculated, as well as the fast light response curves of the non-photochemical quenching (NPQ) and the actual electron transport rate (ETR).

Supplementary Materials

The following supporting information can be downloaded at: https://www.mdpi.com/article/10.3390/plants13162232/s1, Table S1: The analysis of metabolite profiles of R. chrysanthum leaves; Table S2: Information on the differential metabolites of comparison groups M and N; Table S3: Information on the differential metabolites of comparison groups N and Q.

Author Contributions

Writing—original draft preparation, W.Y. and X.Z. (Xiangru Zhou); writing—review and editing, W.Y.; methodology, W.Y. and X.Z. (Xiangru Zhou); software, W.Y. and X.Z. (Xiangru Zhou); visualization, X.Z. (Xiangru Zhou); supervision, W.Y.; project administration, H.X. and X.Z. (Xiaofu Zhou). All authors have read and agreed to the published version of the manuscript.

Funding

This work was supported by the Jilin Province Science and Technology Development Plan Project (YDZJ202301ZYTS517).

Data Availability Statement

The data used in this study are available from the corresponding author on submission of a reasonable request. The data are not publicly available due to privacy.

Acknowledgments

We are grateful to Jingjie PTM Biolab (Hangzhou, China) Co., Ltd. for providing mass spectrometry support.

Conflicts of Interest

The authors declare no conflicts of interest.

Abbreviations

ABAAbscisic acid
ANOVAAnalysis of variance
DMsDifferential metabolites
ETRActual electron transport rate
FCFold change
FmMaximum fluorescence
Fm’Maximum fluorescence in the light
FoMinimal fluorescence
Fv/FmMaximal photochemical efficiency of PSII
JAJasmonic acid
JA-L-IleJasmonoyl-L-isoleucine
JA-ValJasmonoyl-L-valine
KEGGKyoto Encyclopedia of Genes and Genomes
MWDBMetware database
NPQNon-photochemical quenching
OPLS-DAOrthogonal partial least-squares discriminant analysis
PARPhotosynthetic active radiation
PCCsPearson’s correlation coefficients
PSIIPhotosystem II
QCsQuality control samples
R. chrysanthumRhododendron chrysanthum Pall.
SDStandard deviation
UPLC-MS/MSUltra-performance liquid chromatography–tandem mass spectrometry
UV-BUltraviolet radiation b
VIPVariable importance in projection
Y(II)Photochemical yield of PSII

References

  1. Bais, A.F.; Bernhard, G.; McKenzie, R.L.; Aucamp, P.J.; Young, P.J.; Ilyas, M.; Jockel, P.; Deushi, M. Ozone-climate interactions and effects on solar ultraviolet radiation. Photochem. Photobiol. Sci. 2019, 18, 602–640. [Google Scholar] [CrossRef] [PubMed]
  2. Bais, A.F.; McKenzie, R.L.; Bernhard, G.; Aucamp, P.J.; Ilyas, M.; Madronich, S.; Tourpali, K. Ozone depletion and climate change: Impacts on UV radiation. Photochem. Photobiol. Sci. 2015, 14, 19–52. [Google Scholar] [CrossRef] [PubMed]
  3. Albert, K.R.; Mikkelsen, T.N.; Ro-Poulsen, H.; Michelsen, A.; Arndal, M.F.; Bredahl, L.; Håkansson, K.B.; Boesgaard, K.; Schmidt, N.M. Improved UV-B screening capacity does not prevent negative effects of ambient UV irradiance on PSII performance in high arctic plants. Results from a six year UV exclusion study. J. Plant Physiol. 2010, 167, 1542–1549. [Google Scholar] [CrossRef] [PubMed]
  4. Hideg, E.; Jansen, M.A.; Strid, A. UV-B exposure, ROS, and stress: Inseparable companions or loosely linked associates? Trends Plant Sci. 2013, 18, 107–115. [Google Scholar] [CrossRef] [PubMed]
  5. Widel, M.; Krzywon, A.; Gajda, K.; Skonieczna, M.; Rzeszowska-Wolny, J. Induction of bystander effects by UVA, UVB, and UVC radiation in human fibroblasts and the implication of reactive oxygen species. Free Radic. Biol. Med. 2014, 68, 278–287. [Google Scholar] [CrossRef] [PubMed]
  6. Rastogi, R.P.; Richa, N.; Kumar, A.; Tyagi, M.B.; Sinha, R.P. Molecular mechanisms of ultraviolet radiation-induced DNA damage and repair. J. Nucleic Acids 2010, 2010, 592980. [Google Scholar] [CrossRef] [PubMed]
  7. Parihar, P.; Singh, S.; Singh, R.; Singh, V.P.; Prasad, S.M. Changing scenario in plant UV-B research:UV-B from a generic stressor to a specific regulator. J. Photochem. Photobiol. B 2015, 153, 334–343. [Google Scholar] [CrossRef] [PubMed]
  8. Falara, V.; Amarasinghe, R.; Poldy, J.; Pichersky, E.; Barrow, R.A.; Peakall, R. The production of a key floral volatile is dependent on UV light in a sexually deceptive orchid. Ann. Bot. 2013, 111, 21–30. [Google Scholar] [CrossRef] [PubMed]
  9. Turunen, M.; Latola, K. UV-B radiation and acclimation in timberline plants. Environ. Pollut. 2005, 137, 390–403. [Google Scholar] [CrossRef]
  10. Sun, Y.; Liu, Q.; Shang, S.; Chen, J.; Lu, P.; Zang, Y.; Tang, X. Physiological responses and metabonomics analysis of male and female Sargassum thunbergii macroalgae exposed to ultraviolet-B stress. Front. Plant Sci. 2022, 13, 778602. [Google Scholar] [CrossRef]
  11. Zhou, X.; Lyu, J.; Sun, L.; Dong, J.; Xu, H. Metabolic programming of Rhododendron chrysanthum leaves following exposure to UVB irradiation. Funct. Plant Biol. 2021, 48, 1175–1185. [Google Scholar] [CrossRef] [PubMed]
  12. Lin, N.; Liu, X.; Zhu, W.; Cheng, X.; Wang, X.; Wan, X.; Liu, L. Ambient ultraviolet B signal modulates tea flavor characteristics via shifting a metabolic flux in flavonoid biosynthesis. J. Agric. Food Chem. 2021, 69, 3401–3414. [Google Scholar] [CrossRef] [PubMed]
  13. Cao, K.; Zhang, Z.; Fan, H.; Tan, Y.; Xu, H.; Zhou, X. Comparative transcriptomic analysis reveals gene expression in response to cold stress in Rhododendron aureum Georgi. Theor. Exp. Plant Physiol. 2022, 34, 347–366. [Google Scholar] [CrossRef]
  14. Bornman, J.F.; Barnes, P.W.; Robinson, S.A.; Ballaré, C.L.; Flint, S.D.; Caldwell, M.M. Solar ultraviolet radiation and ozone depletion-driven climate change: Effects on terrestrial ecosystems. Photochem. Photobiol. Sci. 2015, 14, 88–107. [Google Scholar] [CrossRef] [PubMed]
  15. Kuttippurath, J.; Lefèvre, F.; Pommereau, J.P.; Roscoe, H.K.; Goutail, F.; Pazmiño, A.; Shanklin, J.D. Antarctic ozone loss in 1979–2010: First sign of ozone recovery. Atmos. Chem. Phys. 2013, 13, 1625–1635. [Google Scholar] [CrossRef]
  16. Wang, F.; Xu, Z.; Fan, X.; Zhou, Q.; Cao, J.; Ji, G.; Jing, S.; Feng, B.; Wang, T. Transcriptome analysis reveals complex molecular mechanisms underlying UV tolerance of Wheat (Triticum aestivum, L.). J. Agric. Food Chem. 2019, 67, 563–577. [Google Scholar] [CrossRef]
  17. Cutler, S.R.; Rodriguez, P.L.; Finkelstein, R.R.; Abrams, S.R. Abscisic acid: Emergence of a core signaling network. Annu. Rev. Plant Biol. 2010, 61, 651–679. [Google Scholar] [CrossRef] [PubMed]
  18. Vishwakarma, K.; Upadhyay, N.; Kumar, N.; Yadav, G.; Singh, J.; Mishra, R.K.; Kumar, V.; Verma, R.; Upadhyay, R.G.; Pandey, M.; et al. Abscisic acid signaling and abiotic stress tolerance in plants: A review on current knowledge and future prospects. Front. Plant Sci. 2017, 8, 161. [Google Scholar] [CrossRef] [PubMed]
  19. Swamy, P.M.; Smith, B.N. Role of abscisic acid in plant stress tolerance. Curr. Sci. 1999, 76, 1220–1227. [Google Scholar]
  20. Martínez-Mazón, P.; Bahamonde, C.; Herrera-Rodríguez, M.B.; Fernández-Ocaña, A.M.; Rexach, J.; González-Fontes, A.; Camacho-Cristóbal, J.J. Role of ABA in the adaptive response of arabidopsis plants to long-term boron toxicity treatment. Plant Physiol. Biochem. 2023, 202, 107965. [Google Scholar] [CrossRef]
  21. Segarra-Medina, C.; Alseekh, S.; Fernie, A.R.; Rambla, J.L.; Pérez-Clemente, R.M.; Gómez-Cádenas, A.; Zandalinas, S.I. Abscisic acid promotes plant acclimation to the combination of salinity and high light stress. Plant Physiol. Biochem. 2023, 203, 108008. [Google Scholar] [CrossRef] [PubMed]
  22. Habibpourmehraban, F.; Wu, Y.; Masoomi-Aladizgeh, F.; Amirkhani, A.; Atwell, B.J.; Haynes, P.A. Pre-Treatment of rice plants with aba makes them more tolerant to multiple abiotic stress. Int. J. Mol. Sci. 2023, 24, 9628. [Google Scholar] [CrossRef] [PubMed]
  23. Huang, X.; Chen, M.-H.; Yang, L.-T.; Li, Y.-R.; Wu, J.-M. Effects of exogenous abscisic acid on cell membrane and endogenous hormone contents in leaves of Sugarcane seedlings under cold stress. Sugar Tech. 2015, 17, 59–64. [Google Scholar] [CrossRef]
  24. Kim, Y.-H.; Choi, K.-I.; Khan, A.L.; Waqas, M.; Lee, I.-J. Exogenous application of abscisic acid regulates endogenous gibberellins homeostasis and enhances resistance of oriental melon (Cucumis melo var. L.) against low temperature. Sci. Hortic. 2016, 207, 41–47. [Google Scholar] [CrossRef]
  25. Sun, Q.; Zhou, X.; Yang, L.; Xu, H.; Zhou, X. Integration of phosphoproteomics and transcriptome studies reveals ABA signaling pathways regulate UV-B tolerance in Rhododendron chrysanthum leaves. Genes 2023, 14, 1153. [Google Scholar] [CrossRef] [PubMed]
  26. Hu, L.; Wu, Y.; Wu, D.; Rao, W.; Guo, J.; Ma, Y.; Wang, Z.; Shangguan, X.; Wang, H.; Xu, C.; et al. The coiled-coil and nucleotide binding domains of brown planthopper resistance14 function in signaling and resistance against planthopper in rice. Plant Cell 2017, 29, 3157–3185. [Google Scholar] [CrossRef]
  27. Wang, Y.; Liu, Q.; Du, L.; Hallerman, E.M.; Li, Y. Transcriptomic and metabolomic responses of rice plants to cnaphalocrocis medinalis caterpillar infestation. Insects 2020, 11, 705. [Google Scholar] [CrossRef] [PubMed]
  28. Zhang, C.; Lei, Y.; Lu, C.; Wang, L.; Wu, J. MYC2, MYC3, and MYC4 function additively in wounding-induced jasmonic acid biosynthesis and catabolism. J. Integr. Plant Biol. 2020, 62, 1159–1175. [Google Scholar] [CrossRef] [PubMed]
  29. Fang, L.; Su, L.; Sun, X.; Li, X.; Sun, M.; Karungo, S.K.; Fang, S.; Chu, J.; Li, S.; Xin, H. Expression of vitis amurensis NAC26 in arabidopsis enhances drought tolerance by modulating jasmonic acid synthesis. J. Exp. Bot. 2016, 67, 2829–2845. [Google Scholar] [CrossRef]
  30. Wu, S.; Wang, Y.; Zhang, J.; Wang, Y.; Yang, Y.; Chen, X.; Wang, Y. How does Malus crabapple resist ozone? Transcriptomics and metabolomics analyses. Ecotoxicol. Environ. Saf. 2020, 201, 110832. [Google Scholar] [CrossRef]
  31. Chapman, K.M.; Marchi-Werle, L.; Hunt, T.E.; Heng-Moss, T.M.; Louis, J. Abscisic and jasmonic acids contribute to soybean tolerance to the Soybean Aphid (Aphis glycines Matsumura). Sci. Rep. 2018, 8, 15148. [Google Scholar] [CrossRef] [PubMed]
  32. Meng, F.; Yang, C.; Cao, J.; Chen, H.; Pang, J.; Zhao, Q.; Wang, Z.; Qing Fu, Z.; Liu, J. A bHLH transcription activator regulates defense signaling by nucleo-cytosolic trafficking in rice. J. Integr. Plant Biol. 2020, 62, 1552–1573. [Google Scholar] [CrossRef] [PubMed]
  33. Shu, J.; Ma, X.; Ma, H.; Huang, Q.; Zhang, Y.; Guan, M.; Guan, C. Transcriptomic, proteomic, metabolomic, and functional genomic approaches of Brassica napus L. during salt stress. PLoS ONE 2022, 17, e0262587. [Google Scholar] [CrossRef] [PubMed]
  34. Tian, H.; Lam, S.M.; Shui, G. Metabolomics, a powerful tool for agricultural research. Int. J. Mol. Sci. 2016, 17, 1871. [Google Scholar] [CrossRef] [PubMed]
  35. Sun, Q.; Li, X.; Sun, L.; Sun, M.; Xu, H.; Zhou, X. Plant hormones and phenolic acids response to UV-B stress in Rhododendron chrysanthum pall. Biol. Direct 2024, 19, 40. [Google Scholar] [CrossRef] [PubMed]
  36. Kusano, M.; Tohge, T.; Fukushima, A.; Kobayashi, M.; Hayashi, N.; Otsuki, H.; Kondou, Y.; Goto, H.; Kawashima, M.; Matsuda, F.; et al. Metabolomics reveals comprehensive reprogramming involving two independent metabolic responses of arabidopsis to UV-B light. Plant J. 2011, 67, 354–369. [Google Scholar] [CrossRef] [PubMed]
  37. Maher, M.; Ahmad, H.; Nishawy, E.; Li, Y.; Luo, J. Novel transcriptome study and detection of metabolic variations in UV-B-treated Date Palm (Phoenix dactylifera cv. Khalas). Int. J. Mol. Sci. 2021, 22, 2564. [Google Scholar] [CrossRef] [PubMed]
  38. Appenroth, K.J.; Stöckel, J.; Srivastava, A.; Strasser, R.J. Multiple effects of chromate on the photosynthetic apparatus of Spirodela polyrhiza as probed by OJIP chlorophyll a fluorescence measurements. Environ. Pollut. 2001, 115, 49–64. [Google Scholar] [CrossRef] [PubMed]
  39. Jin, X.; Yang, G.; Tan, C.; Zhao, C. Effects of nitrogen stress on the photosynthetic CO2 assimilation, chlorophyll fluorescence, and sugar-nitrogen ratio in corn. Sci. Rep. 2015, 5, 9311. [Google Scholar] [CrossRef]
  40. Laible, P.D.; Zipfel, W.; Owens, T.G. Excited state dynamics in chlorophyll-based antennae: The role of transfer equilibrium. Biophys. J. 1994, 66, 844–860. [Google Scholar] [CrossRef]
  41. Hu, T.; Hu, L.; Zhang, X.; Zhang, P.; Zhao, Z.; Fu, J. Differential responses of CO2 assimilation, carbohydrate allocation and gene expression to NaCl stress in perennial ryegrass with different salt tolerance. PLoS ONE 2013, 8, e66090. [Google Scholar] [CrossRef]
  42. Yoon, J.; Cho, L.H.; Tun, W.; Jeon, J.S.; An, G. Sucrose signaling in higher plants. Plant Sci. 2021, 302, 110703. [Google Scholar] [CrossRef] [PubMed]
  43. Berli, F.J.; Alonso, R.; Bressan-Smith, R.; Bottini, R. UV-B impairs growth and gas exchange in grapevines grown in high altitude. Physiol. Plant 2013, 149, 127–140. [Google Scholar] [CrossRef] [PubMed]
  44. Martínez-Lüscher, J.; Morales, F.; Delrot, S.; Sánchez-Díaz, M.; Gomés, E.; Aguirreolea, J.; Pascual, I. Short- and long-term physiological responses of grapevine leaves to UV-B radiation. Plant Sci. 2013, 213, 114–122. [Google Scholar] [CrossRef] [PubMed]
  45. Dong, S.; Beckles, D.M. Dynamic changes in the starch-sugar interconversion within plant source and sink tissues promote a better abiotic stress response. J. Plant Physiol. 2019, 234–235, 80–93. [Google Scholar] [CrossRef] [PubMed]
  46. Ainsworth, E.A.; Bush, D.R. Carbohydrate export from the leaf: A highly regulated process and target to enhance photosynthesis and productivity. Plant Physiol. 2011, 155, 64–69. [Google Scholar] [CrossRef]
  47. MacNeill, G.J.; Mehrpouyan, S.; Minow, M.A.A.; Patterson, J.A.; Tetlow, I.J.; Emes, M.J. Starch as a source, starch as a sink: The bifunctional role of starch in carbon allocation. J. Exp. Bot. 2017, 68, 4433–4453. [Google Scholar] [CrossRef] [PubMed]
  48. Galili, G. The aspartate-family pathway of plants. Plant Signal. Behav. 2011, 6, 192–195. [Google Scholar] [CrossRef] [PubMed]
  49. Zhang, J.; Yang, D.; Li, M.; Shi, L. Metabolic profiles reveal changes in wild and cultivated Soybean seedling leaves under salt stress. PLoS ONE 2016, 11, e0159622. [Google Scholar] [CrossRef]
  50. Baena-González, E.; Sheen, J. Convergent energy and stress signaling. Trends Plant Sci. 2008, 13, 474–482. [Google Scholar] [CrossRef]
  51. Forde, B.G.; Lea, P.J. Glutamate in plants: Metabolism, regulation, and signalling. J. Exp. Bot. 2007, 58, 2339–2358. [Google Scholar] [CrossRef] [PubMed]
  52. Szewczyk, A.; Paździora, W.; Ekiert, H. The influence of exogenous phenylalanine on the accumulation of secondary metabolites in agitated shoot cultures of Ruta graveolens L. Molecules 2023, 28, 727. [Google Scholar] [CrossRef] [PubMed]
  53. Snaidr, V.A.; Damian, D.L.; Halliday, G.M. Nicotinamide for photoprotection and skin cancer chemoprevention: A review of efficacy and safety. Exp. Dermatol. 2019, 28 (Suppl. S1), 15–22. [Google Scholar] [CrossRef] [PubMed]
  54. Gibon, Y.; Pyl, E.T.; Sulpice, R.; Lunn, J.E.; Höhne, M.; Günther, M.; Stitt, M. Adjustment of growth, starch turnover, protein content and central metabolism to a decrease of the carbon supply when arabidopsis is grown in very short photoperiods. Plant Cell Environ. 2009, 32, 859–874. [Google Scholar] [CrossRef] [PubMed]
  55. Hsu, P.K.; Dubeaux, G.; Takahashi, Y.; Schroeder, J.I. Signaling mechanisms in abscisic acid-mediated stomatal closure. Plant J. 2021, 105, 307–321. [Google Scholar] [CrossRef] [PubMed]
  56. Zhang, J.; Jia, W.; Yang, J.; Ismail, A.M. Role of ABA in integrating plant responses to drought and salt stresses. Field Crops Res. 2006, 97, 111–119. [Google Scholar] [CrossRef]
  57. Weber, H. Fatty acid-derived signals in plants. Trends Plant Sci. 2002, 7, 217–224. [Google Scholar] [CrossRef] [PubMed]
  58. Upchurch, R.G. Fatty acid unsaturation, mobilization, and regulation in the response of plants to stress. Biotechnol. Lett. 2008, 30, 967–977. [Google Scholar] [CrossRef] [PubMed]
  59. Savchenko, T.; Walley, J.W.; Chehab, E.W.; Xiao, Y.; Kaspi, R.; Pye, M.F.; Mohamed, M.E.; Lazarus, C.M.; Bostock, R.M.; Dehesh, K. Arachidonic acid: An evolutionarily conserved signaling molecule modulates plant stress signaling networks. Plant Cell 2010, 22, 3193–3205. [Google Scholar] [CrossRef]
  60. Narayanan, S.; Tamura, P.J.; Roth, M.R.; Prasad, P.V.; Welti, R. Wheat leaf lipids during heat stress: I. High day and night temperatures result in major lipid alterations. Plant Cell Environ. 2016, 39, 787–803. [Google Scholar] [CrossRef]
  61. Kachroo, A.; Kachroo, P. Fatty acid-derived signals in plant defense. Annu. Rev. Phytopathol. 2009, 47, 153–176. [Google Scholar] [CrossRef]
  62. Kumar, P.P. Regulation of biotic and abiotic stress responses by plant hormones. Plant Cell Rep. 2013, 32, 943. [Google Scholar] [CrossRef]
  63. Bari, R.; Jones, J.D. Role of plant hormones in plant defence responses. Plant Mol. Biol. 2009, 69, 473–488. [Google Scholar] [CrossRef]
  64. Navarro, L.; Bari, R.; Achard, P.; Lisón, P.; Nemri, A.; Harberd, N.P.; Jones, J.D. Dellas control plant immune responses by modulating the balance of jasmonic acid and salicylic acid signaling. Curr. Biol. 2008, 18, 650–655. [Google Scholar] [CrossRef]
  65. Nishiyama, R.; Watanabe, Y.; Leyva-Gonzalez, M.A.; Ha, C.V.; Fujita, Y.; Tanaka, M.; Seki, M.; Yamaguchi-Shinozaki, K.; Shinozaki, K.; Herrera-Estrella, L.; et al. Arabidopsis AHP2, AHP3, and AHP5 histidine phosphotransfer proteins function as redundant negative regulators of drought stress response. Proc. Natl. Acad. Sci. USA 2013, 110, 4840–4845. [Google Scholar] [CrossRef]
  66. Katsir, L.; Chung, H.S.; Koo, A.J.; Howe, G.A. Jasmonate signaling: A conserved mechanism of hormone sensing. Curr. Opin. Plant Biol. 2008, 11, 428–435. [Google Scholar] [CrossRef]
  67. Pauwels, L.; Barbero, G.F.; Geerinck, J.; Tilleman, S.; Grunewald, W.; Pérez, A.C.; Chico, J.M.; Bossche, R.V.; Sewell, J.; Gil, E.; et al. NINJA connects the co-repressor topless to jasmonate signalling. Nature 2010, 464, 788–791. [Google Scholar] [CrossRef]
  68. Sabzehzari, M.; Naghavi, M.R. Phyto-miRNAs-based regulation of metabolites biosynthesis in medicinal plants. Gene 2019, 682, 13–24. [Google Scholar] [CrossRef]
  69. Jwa, N.S.; Agrawal, G.K.; Tamogami, S.; Yonekura, M.; Han, O.; Iwahashi, H.; Rakwal, R. Role of defense/stress-related marker genes, proteins and secondary metabolites in defining rice self-defense mechanisms. Plant Physiol. Biochem. 2006, 44, 261–273. [Google Scholar] [CrossRef]
  70. Cheng, H.P.; Yang, X.H.; Lan, L.; Xie, L.J.; Chen, C.; Liu, C.; Chu, J.; Li, Z.Y.; Liu, L.; Zhang, T.Q.; et al. Chemical deprenylation of N(6) -Isopentenyladenosine (i(6) A) RNA. Angew. Chem. Int. Ed. Engl. 2020, 59, 10645–10650. [Google Scholar] [CrossRef]
  71. Colombo, F.; Falvella, F.S.; De Cecco, L.; Tortoreto, M.; Pratesi, G.; Ciuffreda, P.; Ottria, R.; Santaniello, E.; Cicatiello, L.; Weisz, A.; et al. Pharmacogenomics and analogues of the antitumour agent N6-isopentenyladenosine. Int. J. Cancer 2009, 124, 2179–2185. [Google Scholar] [CrossRef]
  72. Ranieri, R.; Ciaglia, E.; Amodio, G.; Picardi, P.; Proto, M.C.; Gazzerro, P.; Laezza, C.; Remondelli, P.; Bifulco, M.; Pisanti, S. N6-isopentenyladenosine dual targeting of AMPK and Rab7 prenylation inhibits melanoma growth through the impairment of autophagic flux. Cell Death Differ. 2018, 25, 353–367. [Google Scholar] [CrossRef]
  73. Zhou, X.; Gong, F.; Dong, J.; Lin, X.; Cao, K.; Xu, H.; Zhou, X. Abscisic acid affects phenolic acid content to increase tolerance to UV-B stress in Rhododendron chrysanthum Pall. Int. J. Mol. Sci. 2024, 25, 1234. [Google Scholar] [CrossRef]
  74. Lyu, J.; Wang, C.; Liang, D.; Liu, L.; Pandey, L.; Xu, H.; Zhou, X. Sensitivity of wild and domesticated Rhododendron chrysanthum to different light regime (UVA, UVB, and PAR). Photosynthetica 2019, 57, 841–849. [Google Scholar] [CrossRef]
  75. Gong, F.; Yu, W.; Zeng, Q.; Dong, J.; Cao, K.; Xu, H.; Zhou, X. Rhododendron chrysanthum’s primary metabolites are converted to phenolics more quickly when exposed to UV-B radiation. Biomolecules 2023, 13, 1700. [Google Scholar] [CrossRef]
  76. Chen, W.; Gong, L.; Guo, Z.; Wang, W.; Zhang, H.; Liu, X.; Yu, S.; Xiong, L.; Luo, J. A novel integrated method for large-scale detection, identification, and quantification of widely targeted metabolites: Application in the study of rice metabolomics. Mol. Plant 2013, 6, 1769–1780. [Google Scholar] [CrossRef]
  77. Giovannoni, J. Tomato multiomics reveals consequences of crop domestication and improvement. Cell 2018, 172, 6–8. [Google Scholar] [CrossRef]
  78. Fraga, C.G.; Clowers, B.H.; Moore, R.J.; Zink, E.M. Signature-discovery approach for sample matching of a nerve-agent precursor using liquid chromatography−mass spectrometry, XCMS, and chemometrics. Anal. Chem. 2010, 82, 4165–4173. [Google Scholar] [CrossRef] [PubMed]
  79. Zeng, Q.; Dong, J.; Lin, X.; Zhou, X.; Xu, H. Isolation and identification of Acer truncatum Endophytic Fungus Talaromyces verruculosus and evaluation of its effects on insoluble phosphorus absorption capacity and growth of Cucumber seedlings. J. Fungi 2024, 10, 136. [Google Scholar] [CrossRef] [PubMed]
Figure 1. The chlorophyll fluorescence characteristics of the experimental materials altered in accordance with UV-B light and exogenous hormones (100 μmol/L). (a,b) ETR and NPQ foldplots of R. chrysanthum. The PAR (photosynthetic active radiation) treatment group was used as a negative control to show the status of chlorophyll fluorescence parameters of R. chrysanthum in the absence of UV-B radiation. Data were analyzed by Origin 2021. (c) Histogram of various photosynthetic parameters of R. chrysanthum. The heights of the bars depict the means of three biological duplicate experiments (n = 3), while the error bars depict the standard deviations of the samples. Different letter markers indicate significant differences across data groups (p < 0.05).
Plants 13 02232 g001aPlants 13 02232 g001b
Figure 2. Exogenous ABA altered the levels of JA and its products in UV-B-treated experimental materials. (a) Histogram of JA content. (b) Histogram of JA-Val content. The heights of the bars depict the means of three biological duplicate experiments (n = 3), while the error bars depict the standard deviations of the samples. Different letter marks indicate significant differences across data groups (p < 0.05).
Plants 13 02232 g002
Figure 3. Metabolomic analysis of R. chrysanthum under UV-B stress. (a) Statistics on the quantities of different types of primary and secondary metabolites. Data were analyzed by Origin 2021. (b) Orthogonal partial least-squares discriminant analysis (OPLS-DA) of each sample after UV-B radiation treatment. OPLS-DA was centered after log2 transformation of the raw data. Analyses were performed using the MetaboAnalystR package OPLSR and the Anal function in R software (1.0.1). (c) Pearson’s correlation coefficients (PCCs) between the quality control samples (QCs) and each sample. The Pearson’s correlation coefficients were calculated using the inbuilt cor function in R software.
Plants 13 02232 g003
Figure 4. Analysis of DMs in R. chrysanthum under UV-B radiation and exogenous ABA treatment. (a) Statistics on the upregulation and downregulation of primary and secondary differential metabolites produced by UV-B treatment. Plotted by chiplot (www.chiplot.online (accessed on 21 September 2023)), a free online data analysis website. (b) Heatmap of clustering composed of differential metabolites produced by UV-B treatment. The horizontal coordinate is the name of the sample, the vertical coordinate is the first-level classification of the differential metabolite, the different colors represent the different values obtained from the standardization of the different relative contents (red for high content, green for low content), “Group” refers to the grouping, and “Class” refers to the first-level classification of the substance. The clustered heatmaps applied UV (unit variance scaling) processing for the raw relative contents of the differential metabolites by rows, and these were graphically plotted via Metware Cloud (https://cloud.metware.cn (accessed on 23 October 2023)), a free online data analysis platform. (c) Statistics on the upregulation and downregulation of primary and secondary differential metabolites produced by exogenous ABA treatment. (d) Heatmap of clustering composed of differential metabolites produced by ABA treatment.
Plants 13 02232 g004aPlants 13 02232 g004b
Figure 5. Multivariate analysis of DMs in R. chrysanthum under UV-B stress and exogenous ABA. (a) The radar image shows the top 15 DMs screened based on VIP values under UV-B stress and exogenous ABA treatment. Data were analyzed by Origin 2021. (b) Primary and secondary main contributing metabolites. The horizontal lines at the top and bottom of the box plots represent the maximum and minimum values, respectively, and the horizontal lines inside the boxes represent the median. Graphing by Metware Cloud (https://cloud.metware.cn (accessed on 18 October 2023)), a free online data analysis platform.
Plants 13 02232 g005aPlants 13 02232 g005b
Figure 6. (a) Differential abundance (DA) of DMs treated by UV-B. (b) Differential abundance (DA) of DMs treated by ABA. The horizontal coordinates represent the differential abundance scores, which were calculated as the ratio of the difference between upregulated and downregulated metabolites involved in the pathway to the number of all metabolites involved in the pathway. The length of the line segments represents the absolute value of the DA score, the size of the dot at the end of the line segments represents the number of differential metabolites in the pathway, and the color of the line segments and dots reflects the p-value size (the closer it is to red, the smaller the p-value, and the closer it is to purple, the larger the p-value). Graphing by Metware Cloud (https://cloud.metware.cn (accessed on 6 May 2023)), a free online data analysis platform.
Plants 13 02232 g006aPlants 13 02232 g006b
Figure 7. UV-B-induced metabolic pathway rearrangement network in R. Chrysanthum. (a) Simplified modeling of amino acid-related metabolic pathways exposed to UV-B radiation. The contents of the involved metabolites are presented as heatmaps after data normalization, where the red and green arrows on the left side of the heatmaps positively represent increases and decreases in metabolite contents after UV-B radiation, respectively, and “*” indicates that the relevant metabolites changed significantly. The three adjacent squares in the left half of the heatmaps represent the expression of each metabolite from three replicate experiments (n = 3) in group M, and the three adjacent squares in the right half of the heatmaps represent the expression of each metabolite from three replicate experiments in group N. (b) Simplified modeling of JA production and signaling pathways following exogenous ABA treatment. The three adjacent squares in the left half of the heatmaps represent the expression of each metabolite from three replicate experiments (n = 3) in group N, and the three adjacent squares in the right half of the heatmaps represent the expression of each metabolite from three replicate experiments in group Q. The heights of the bars in the graph depict the means of the three biological duplicate experiments (n = 3), while the error bars depict the standard deviations of the samples. Different letter markers indicate significant differences across data groups (p < 0.05).
Plants 13 02232 g007aPlants 13 02232 g007b
Figure 8. Simplified model of the experimental treatment of R. chrysanthum.
Plants 13 02232 g008
Disclaimer/Publisher’s Note: The statements, opinions and data contained in all publications are solely those of the individual author(s) and contributor(s) and not of MDPI and/or the editor(s). MDPI and/or the editor(s) disclaim responsibility for any injury to people or property resulting from any ideas, methods, instructions or products referred to in the content.

