
Foliar Sprays of Multi-Nutrient Fertilizer Containing Selenium Produce Functional Tomato Fruits with Higher Shelf Life

 ,
,  , , and
Abstract
1. Introduction
2. Results
2.1. Leaf Analysis
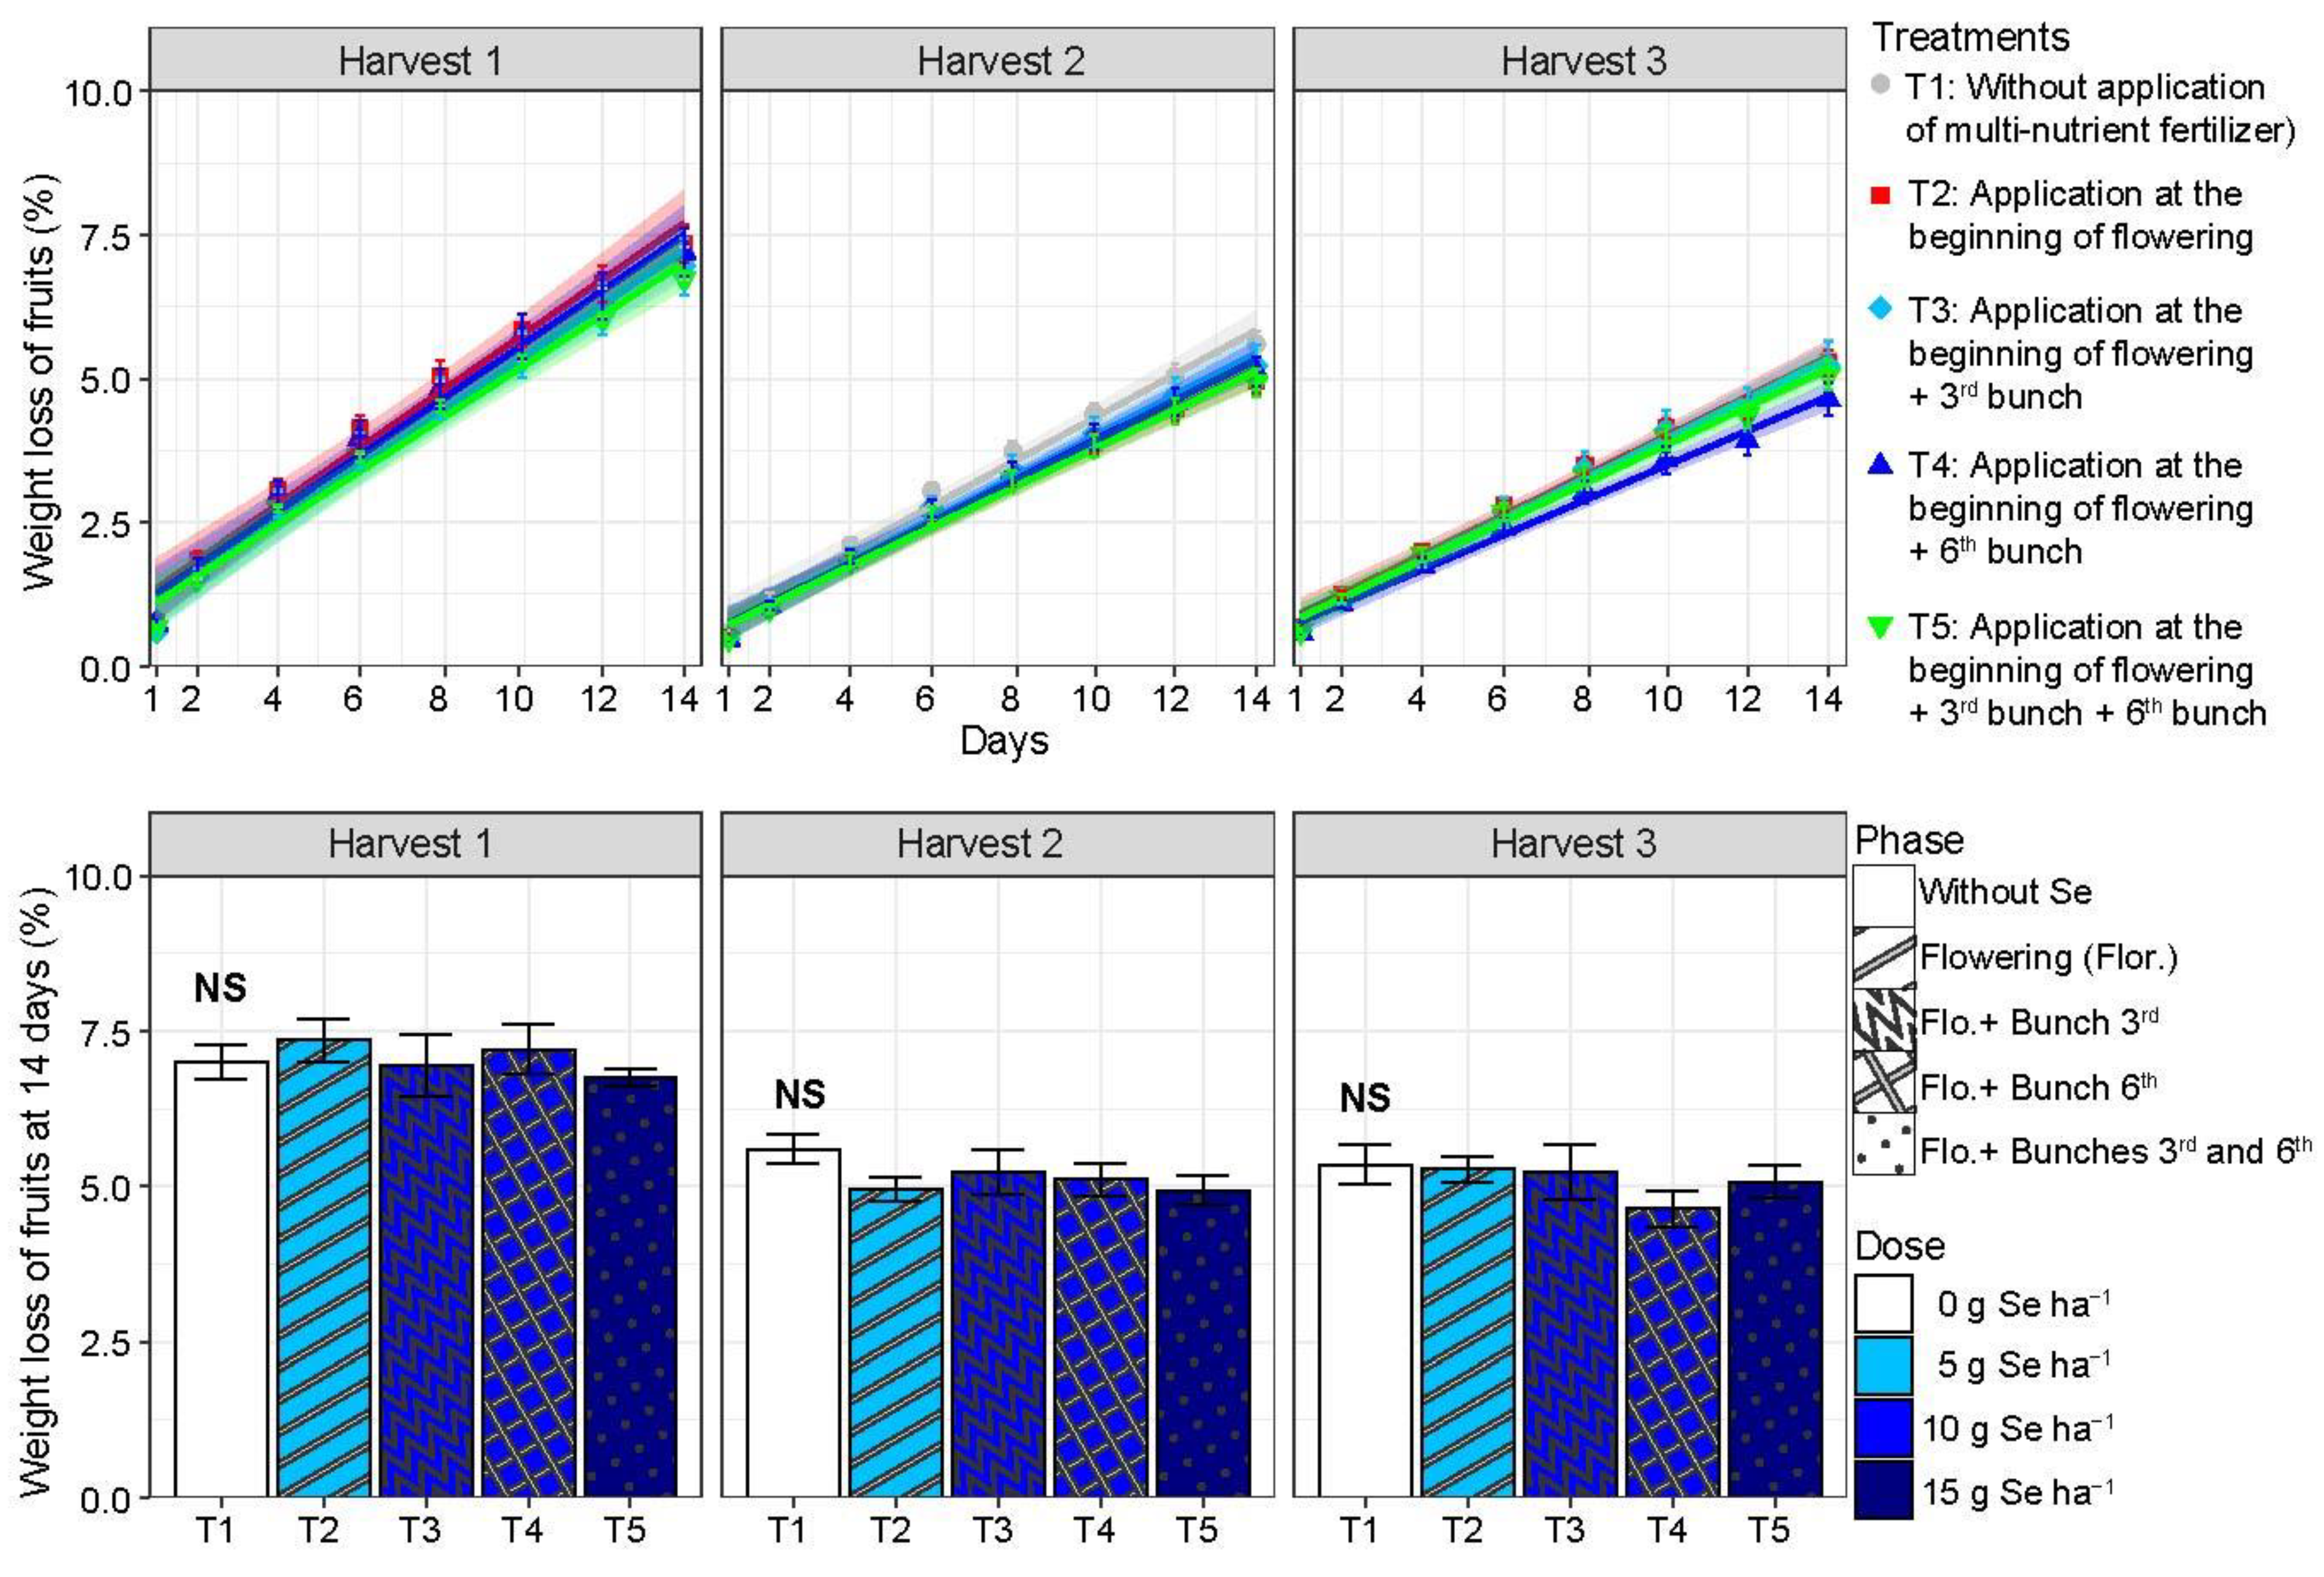
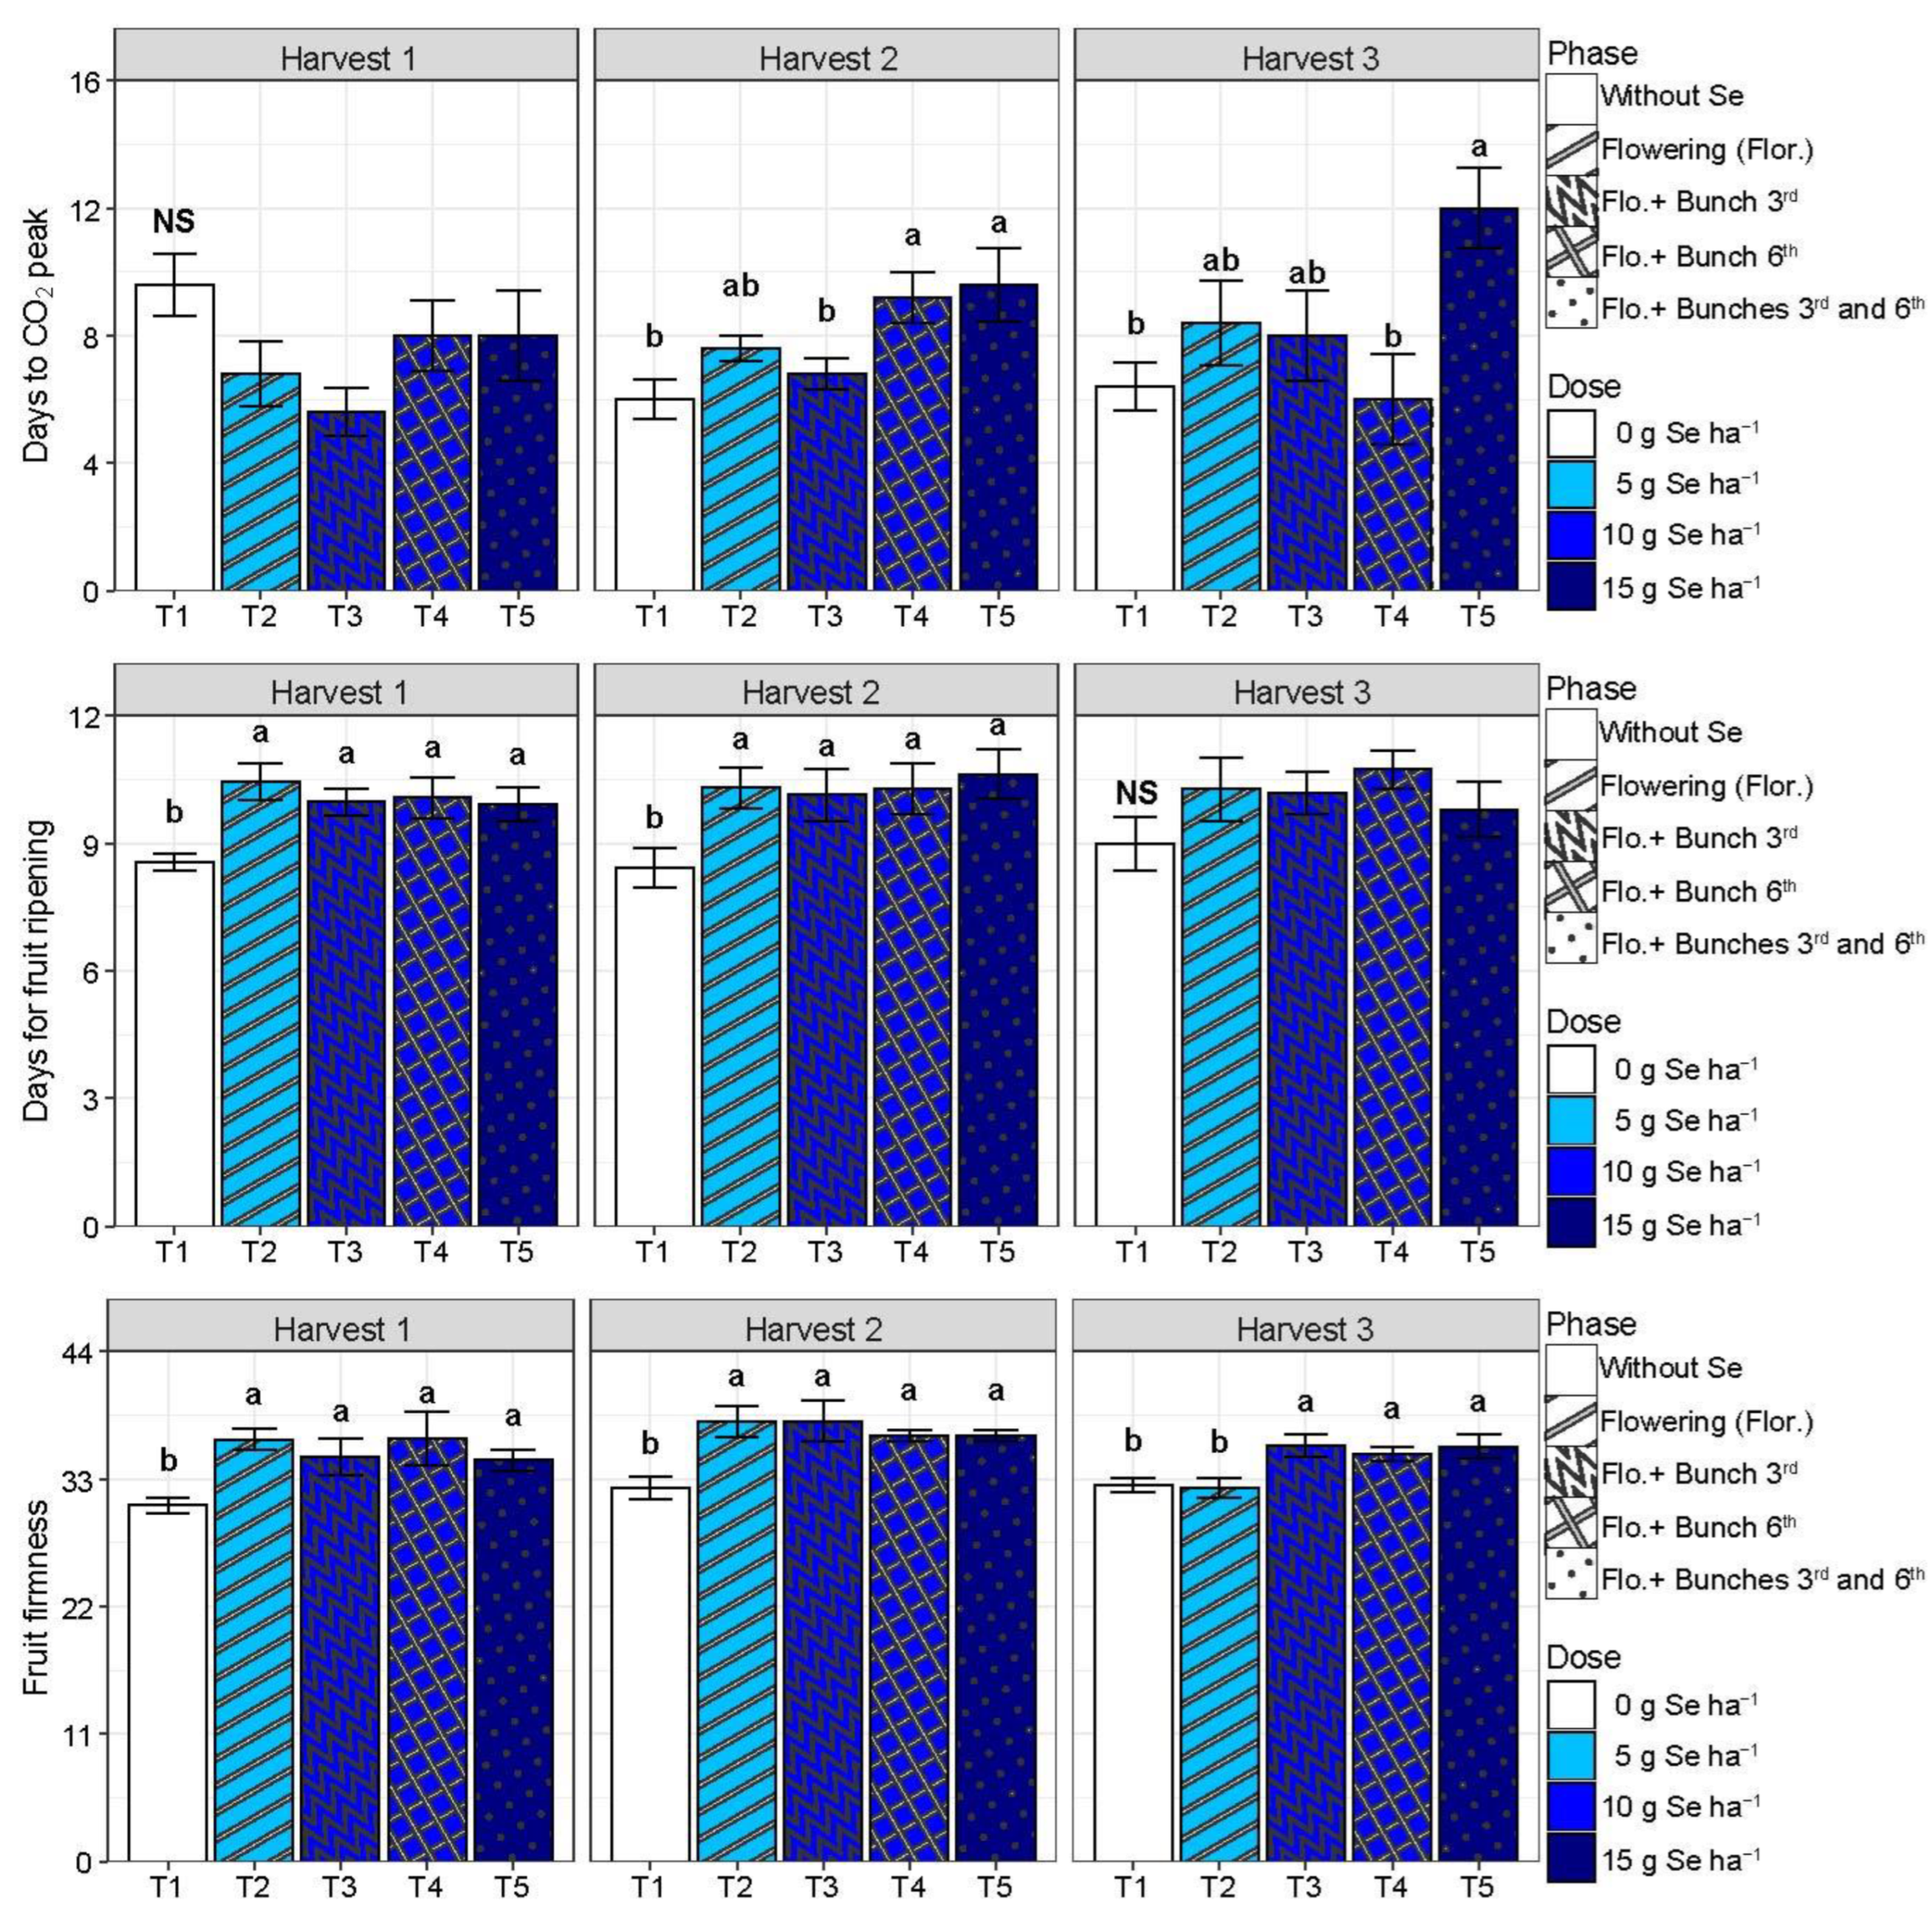
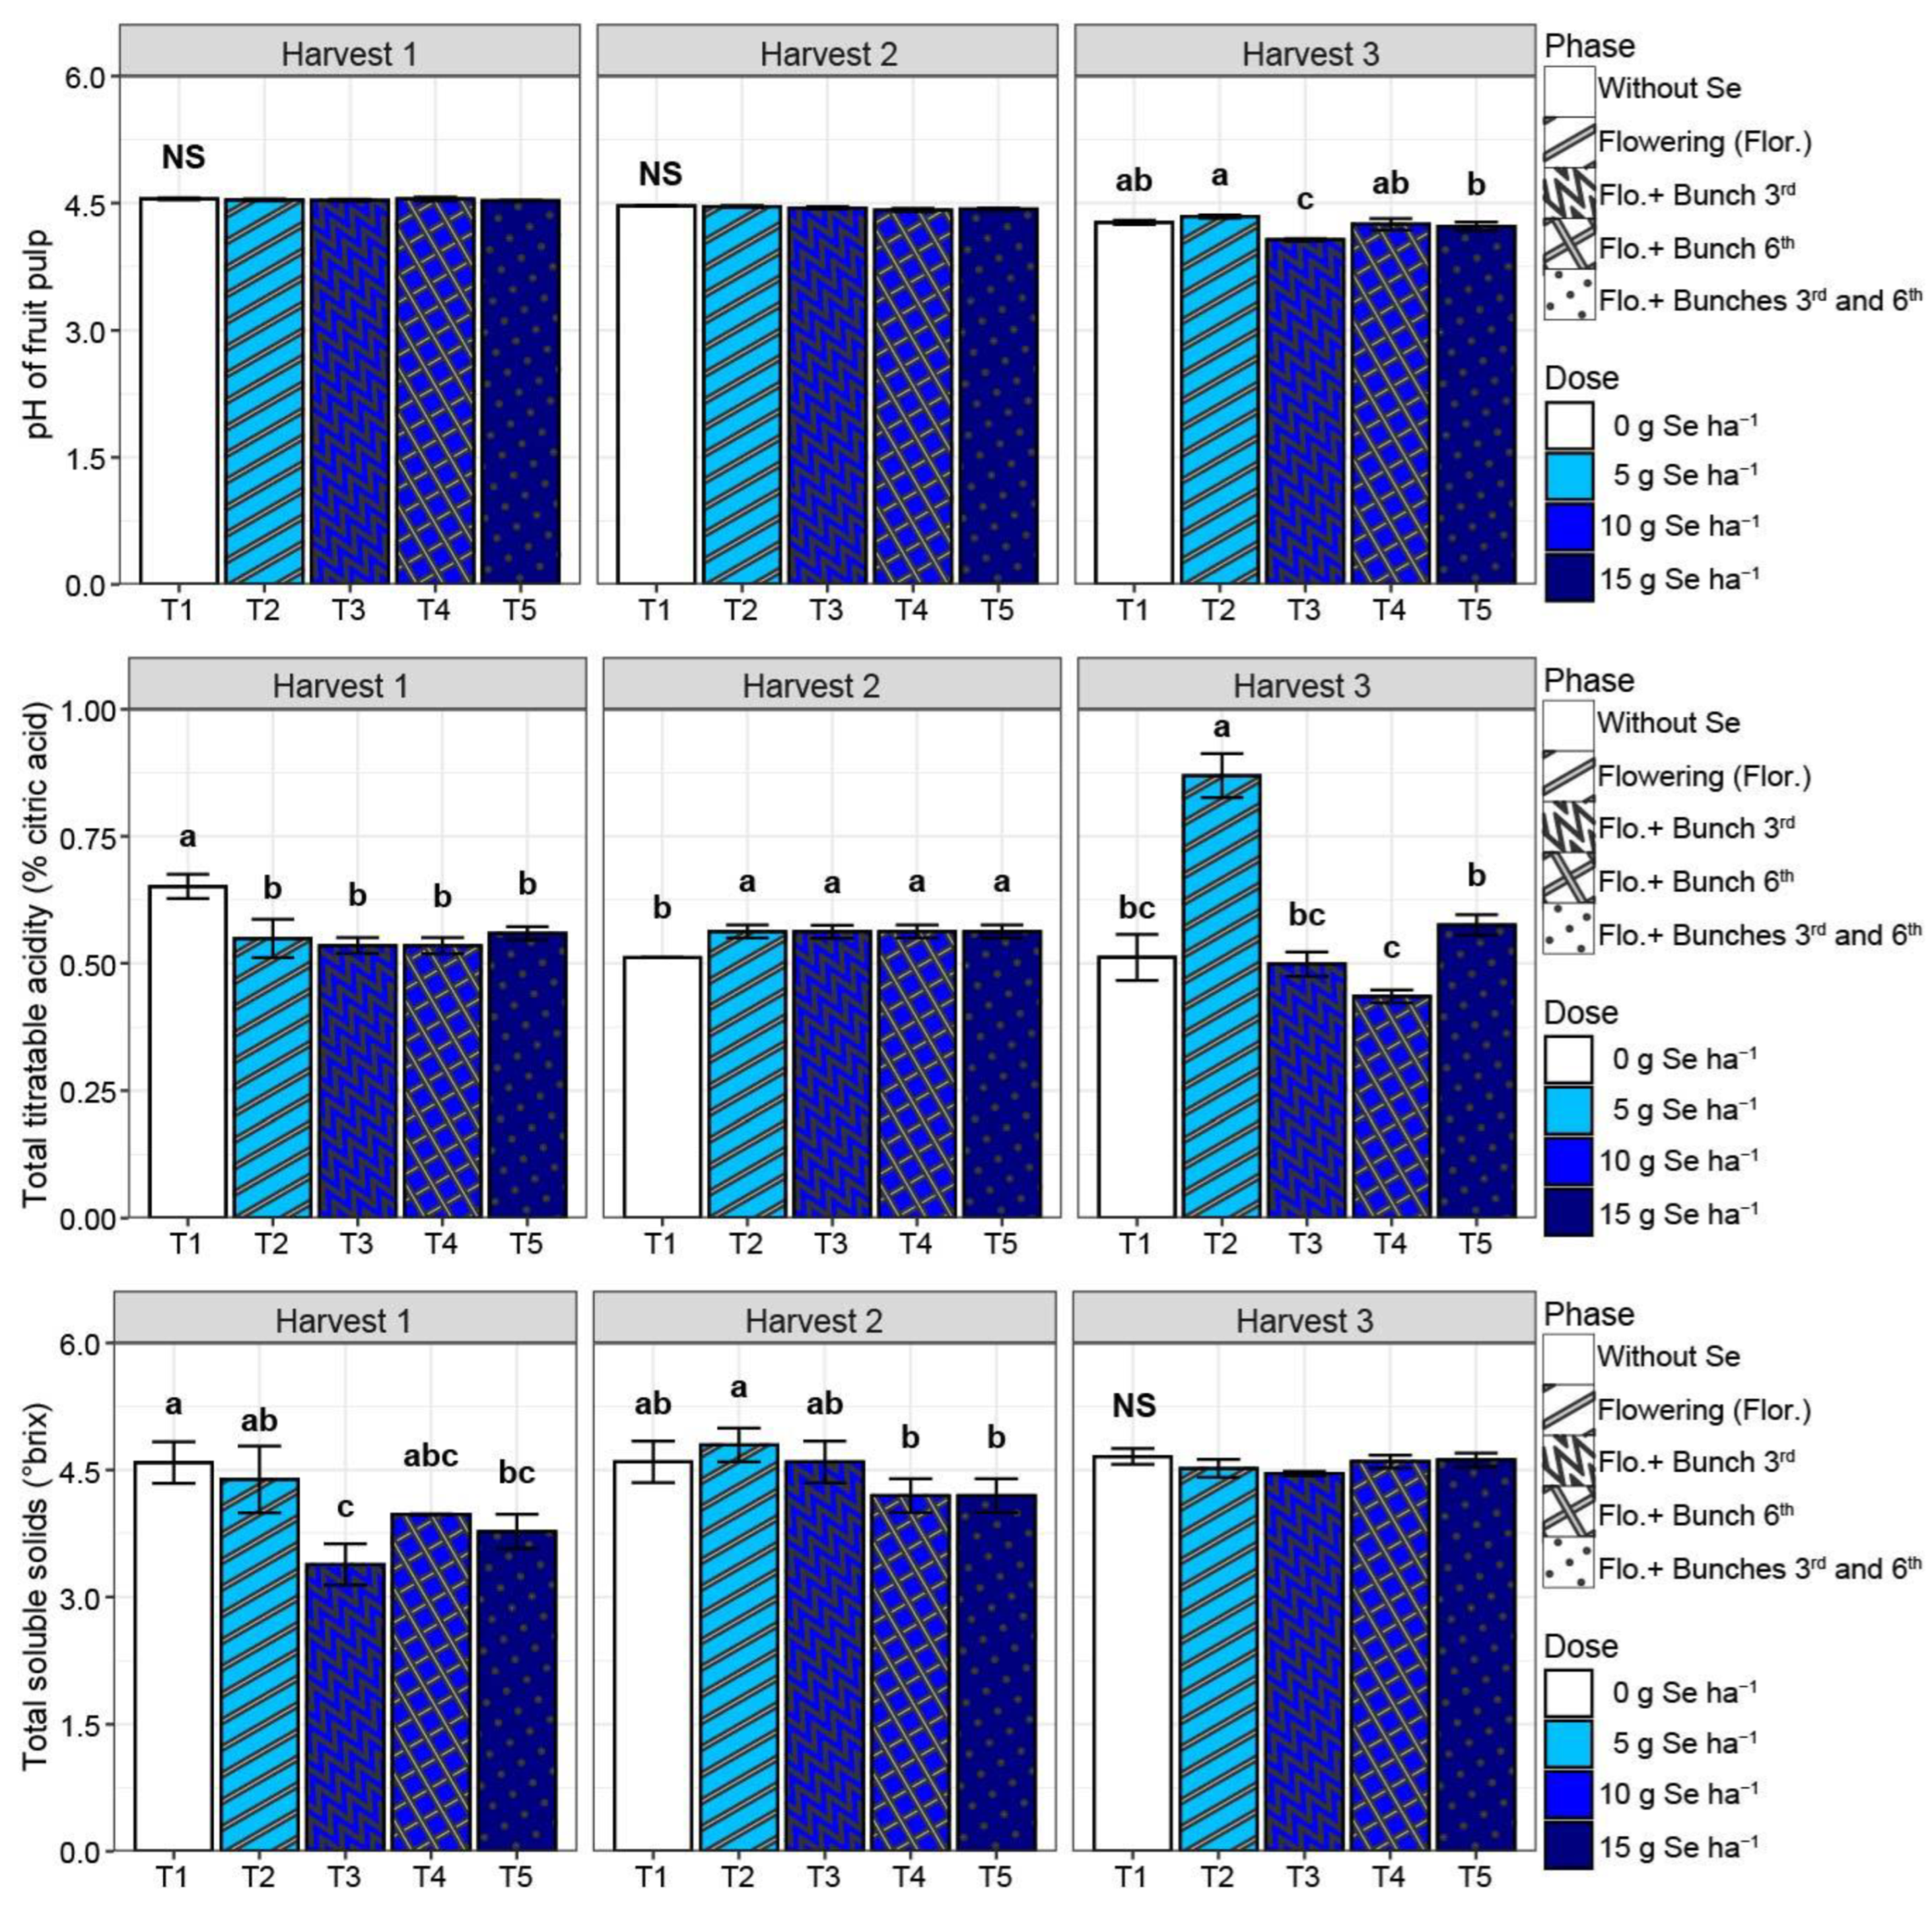
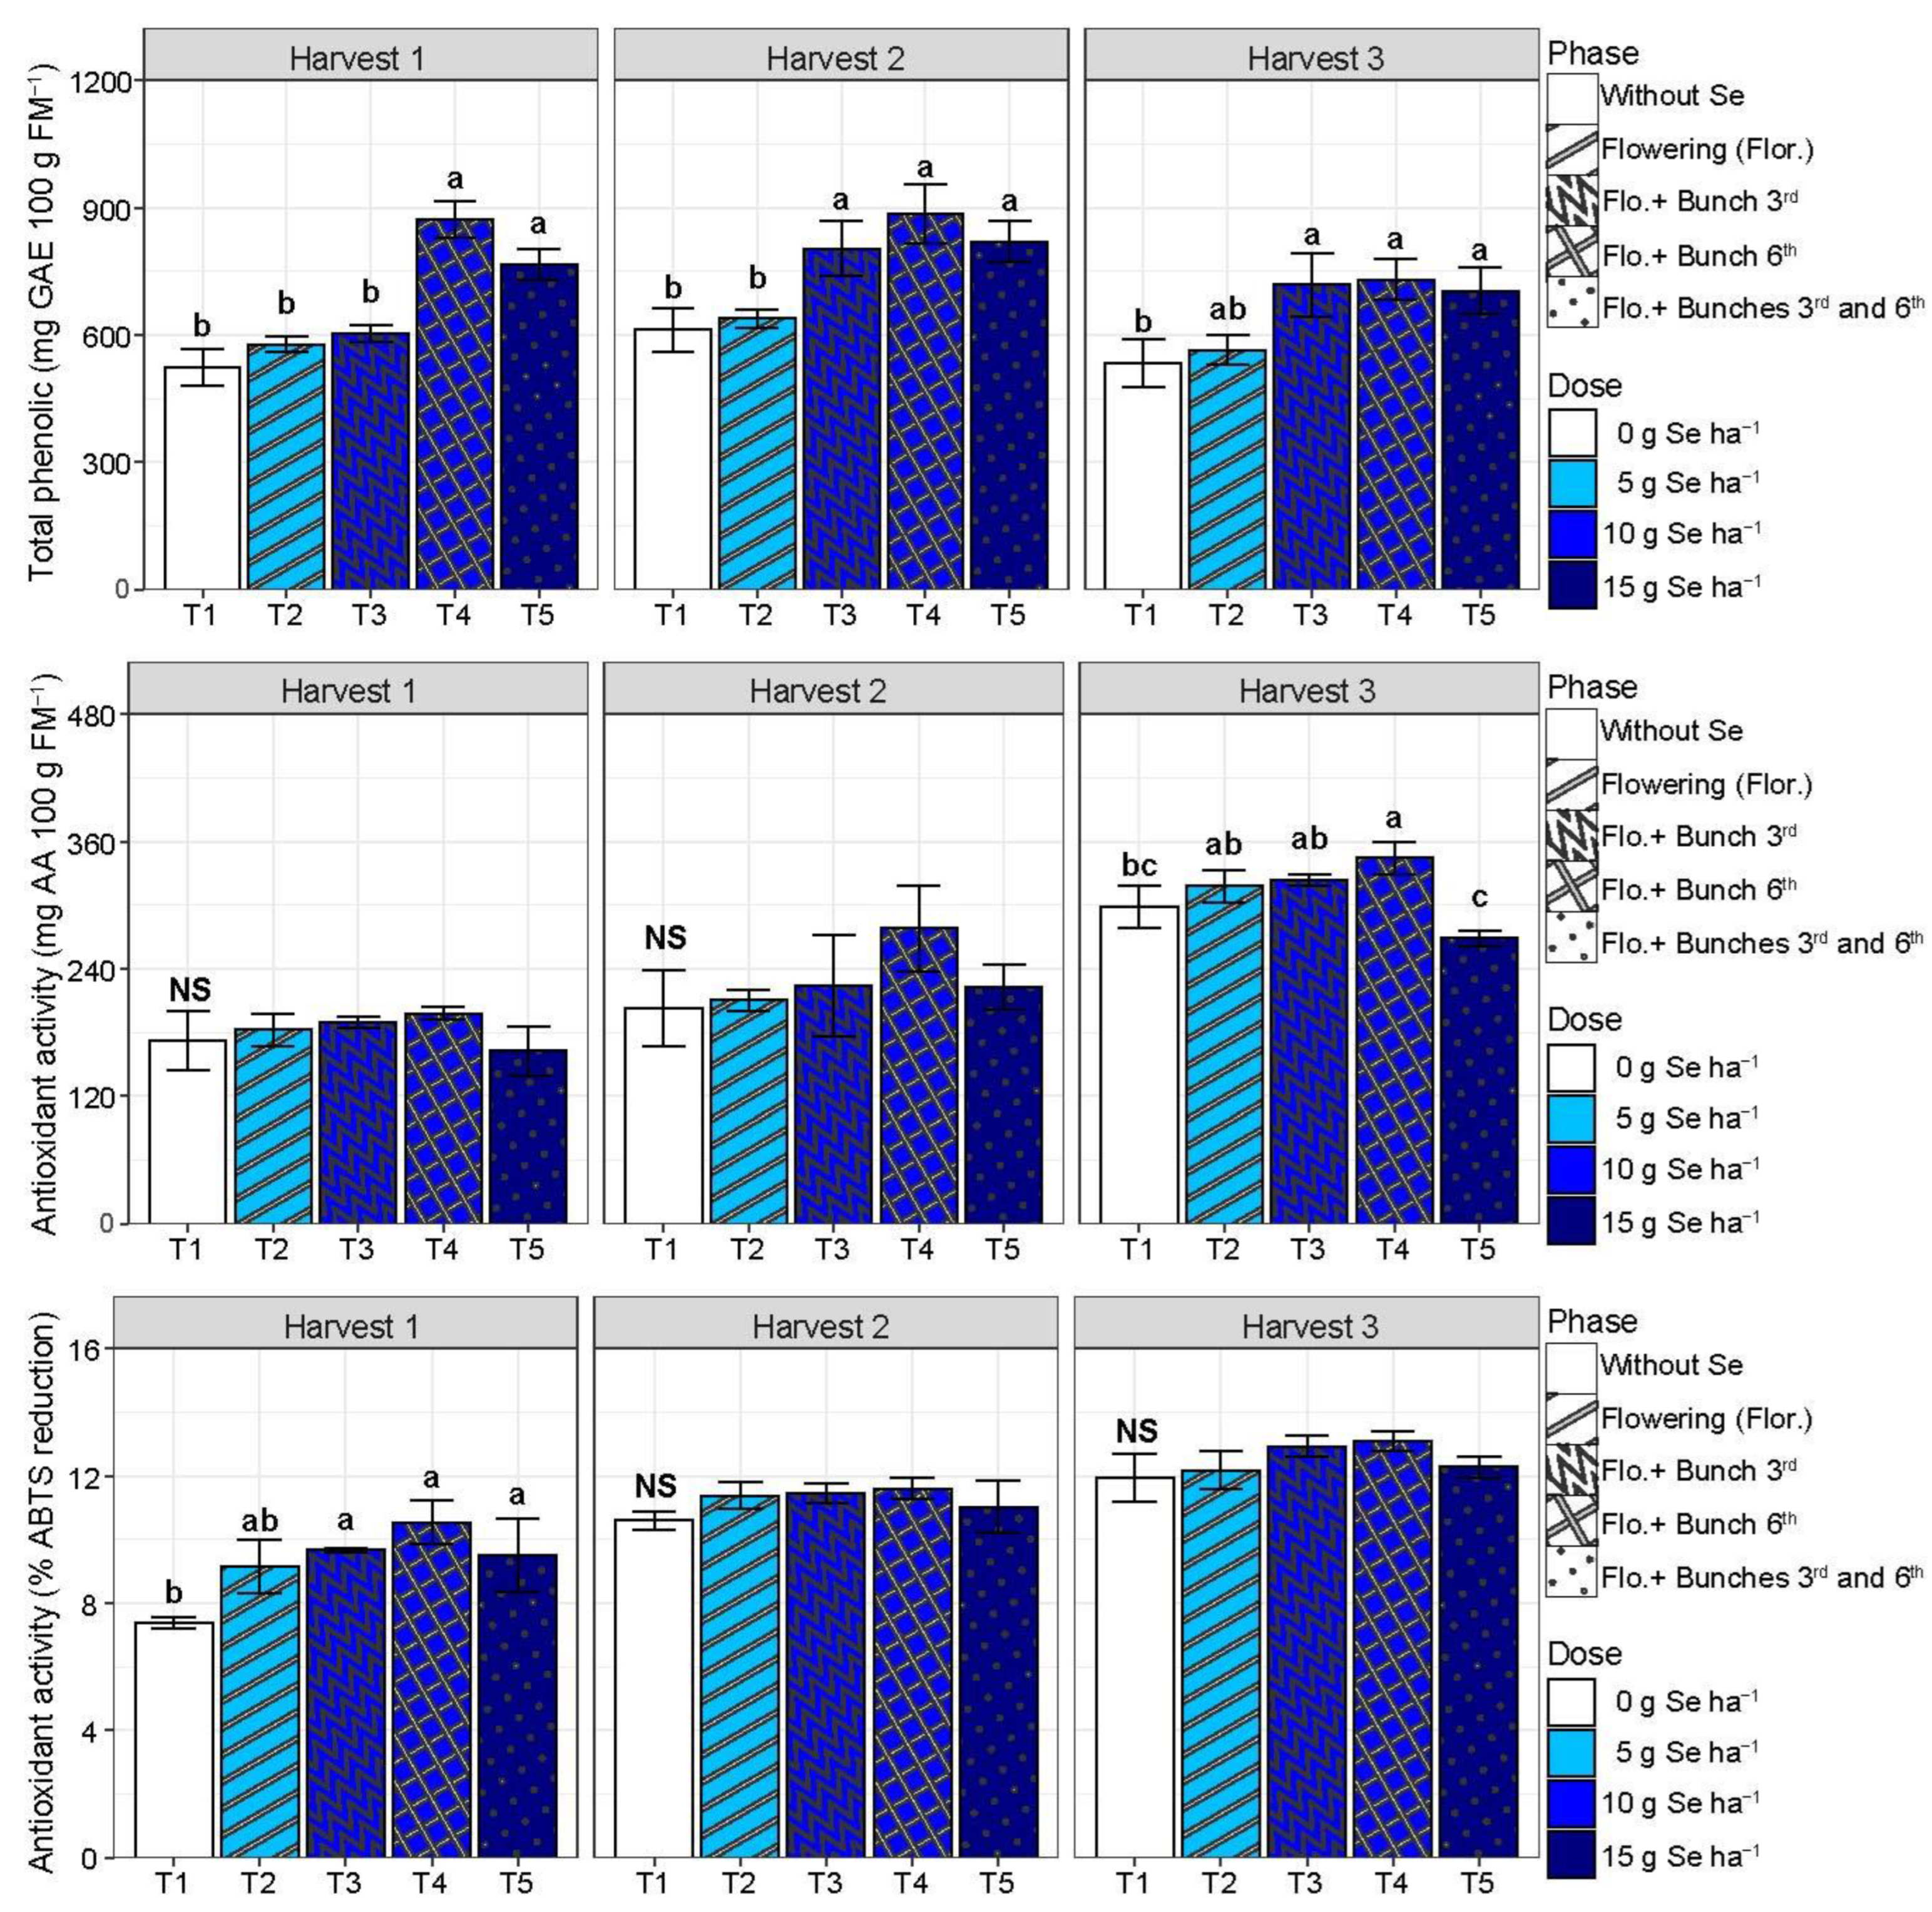
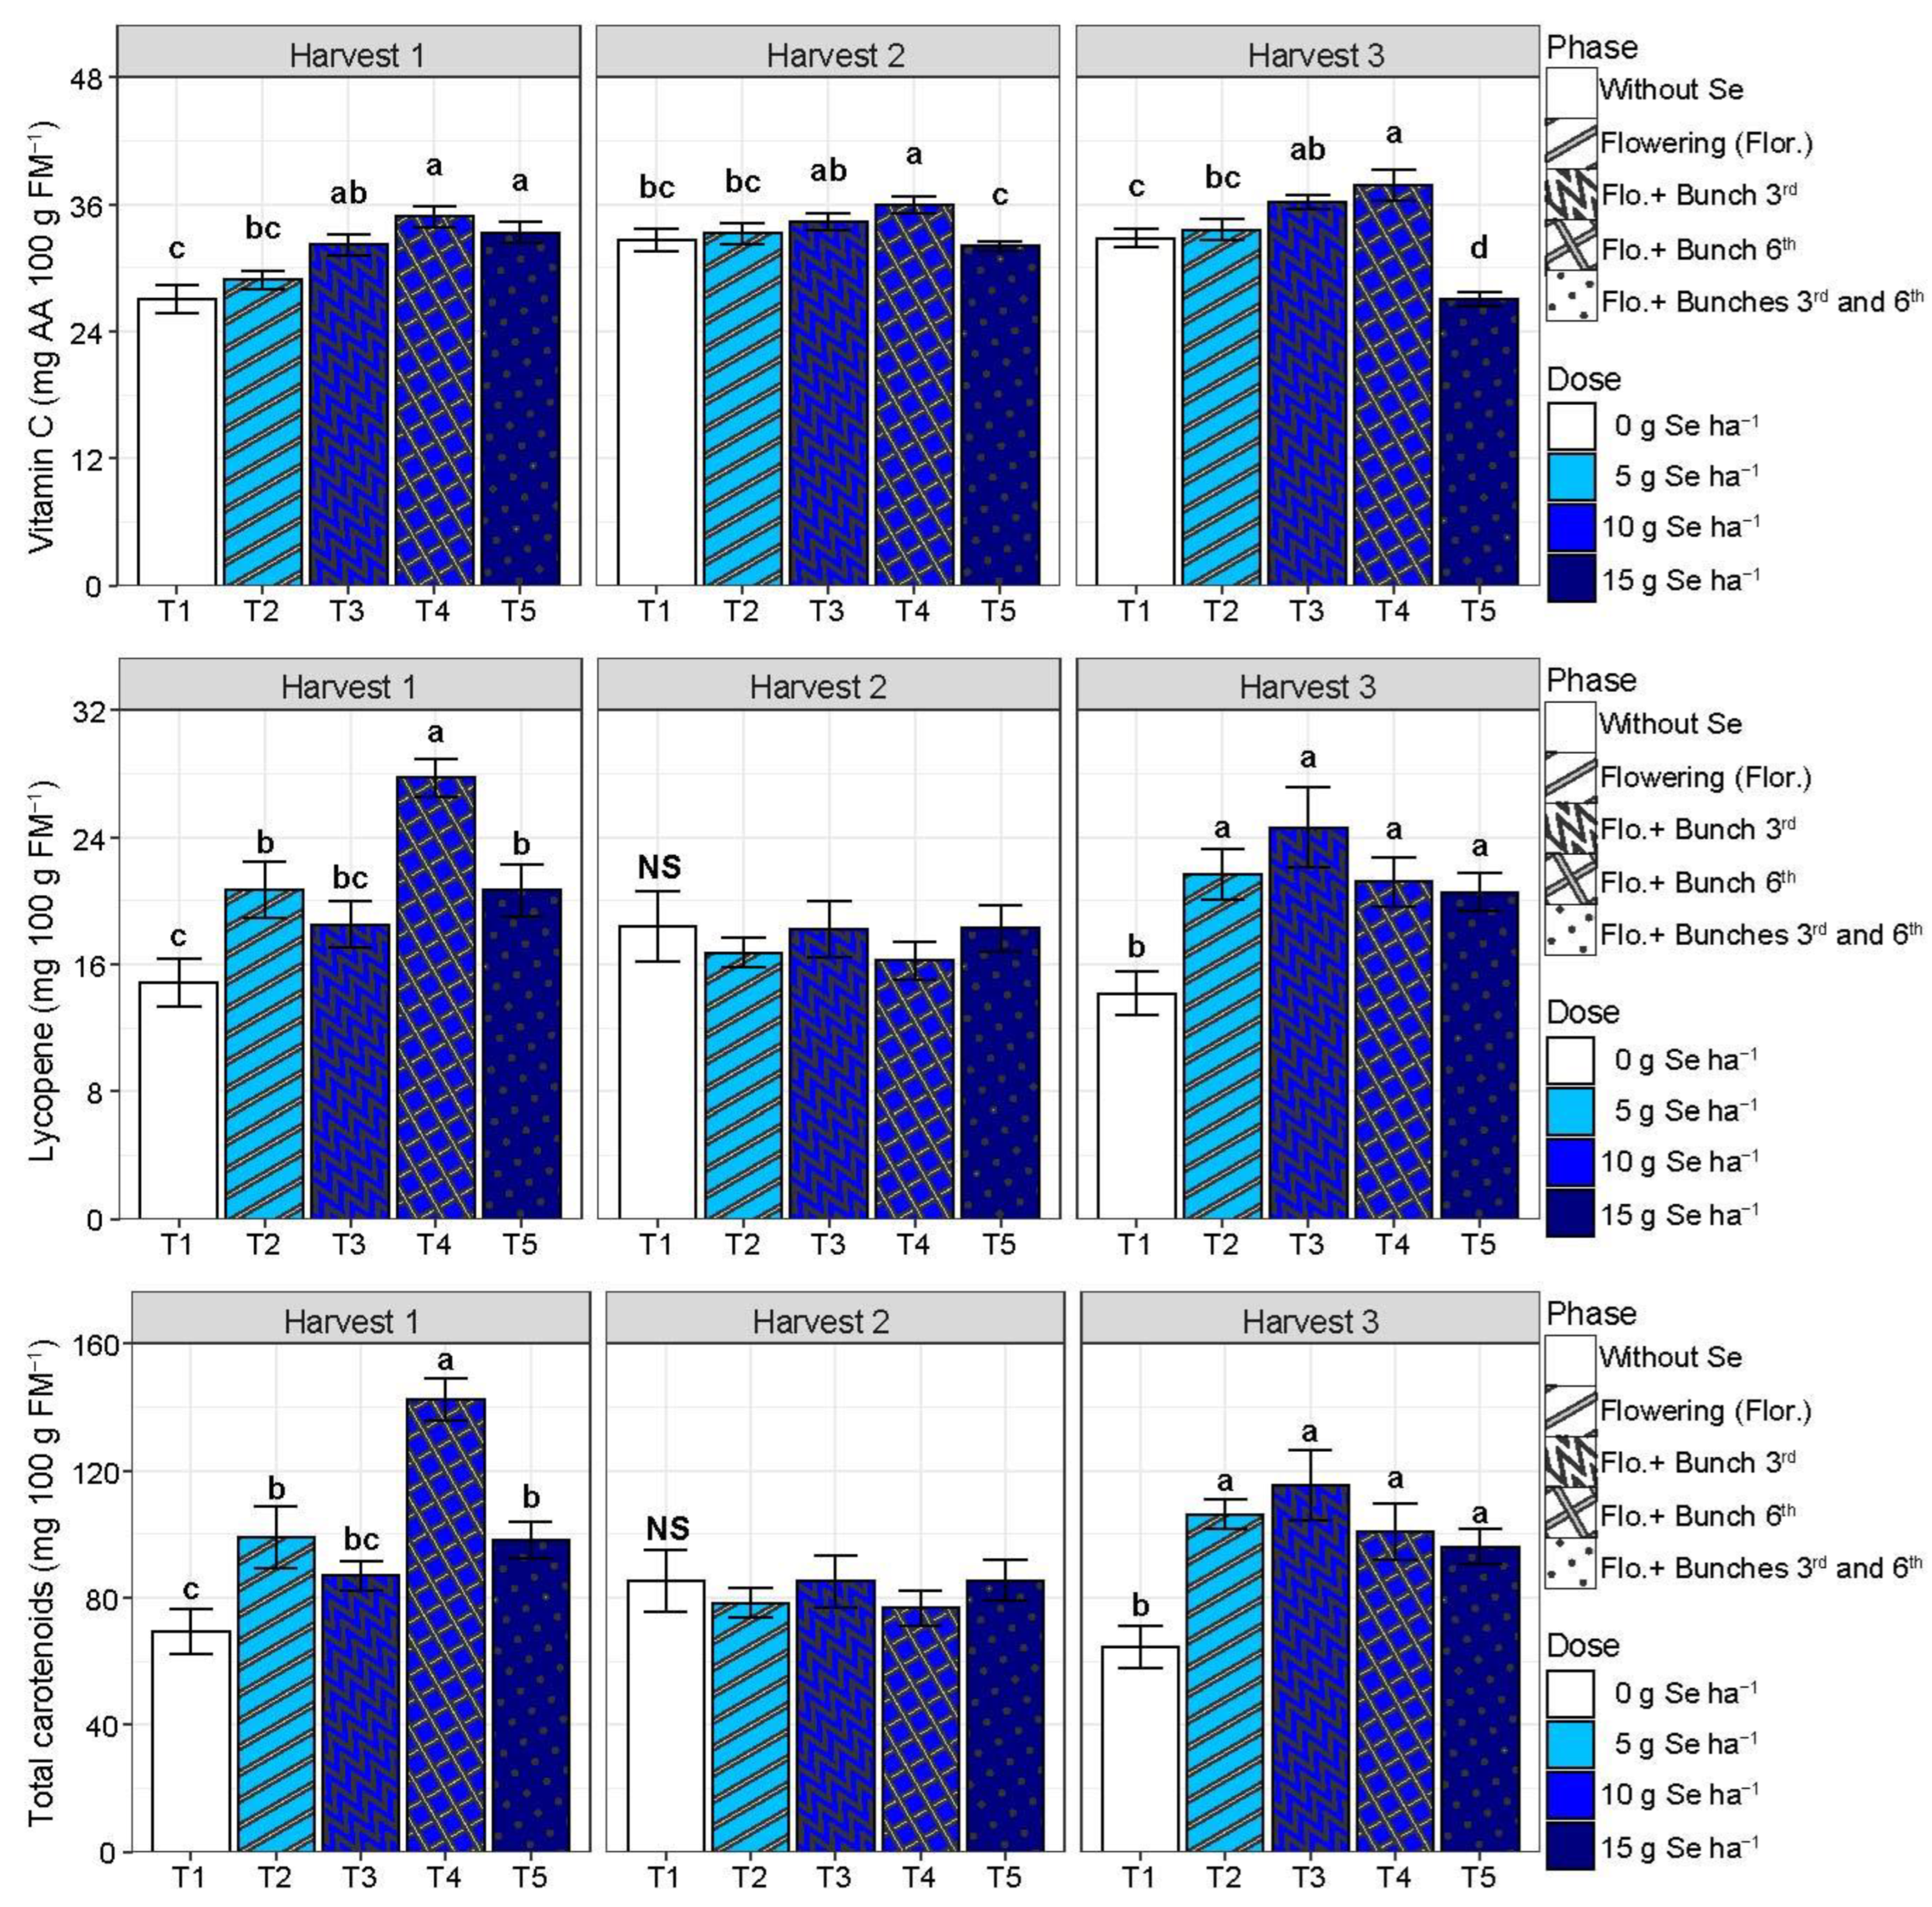
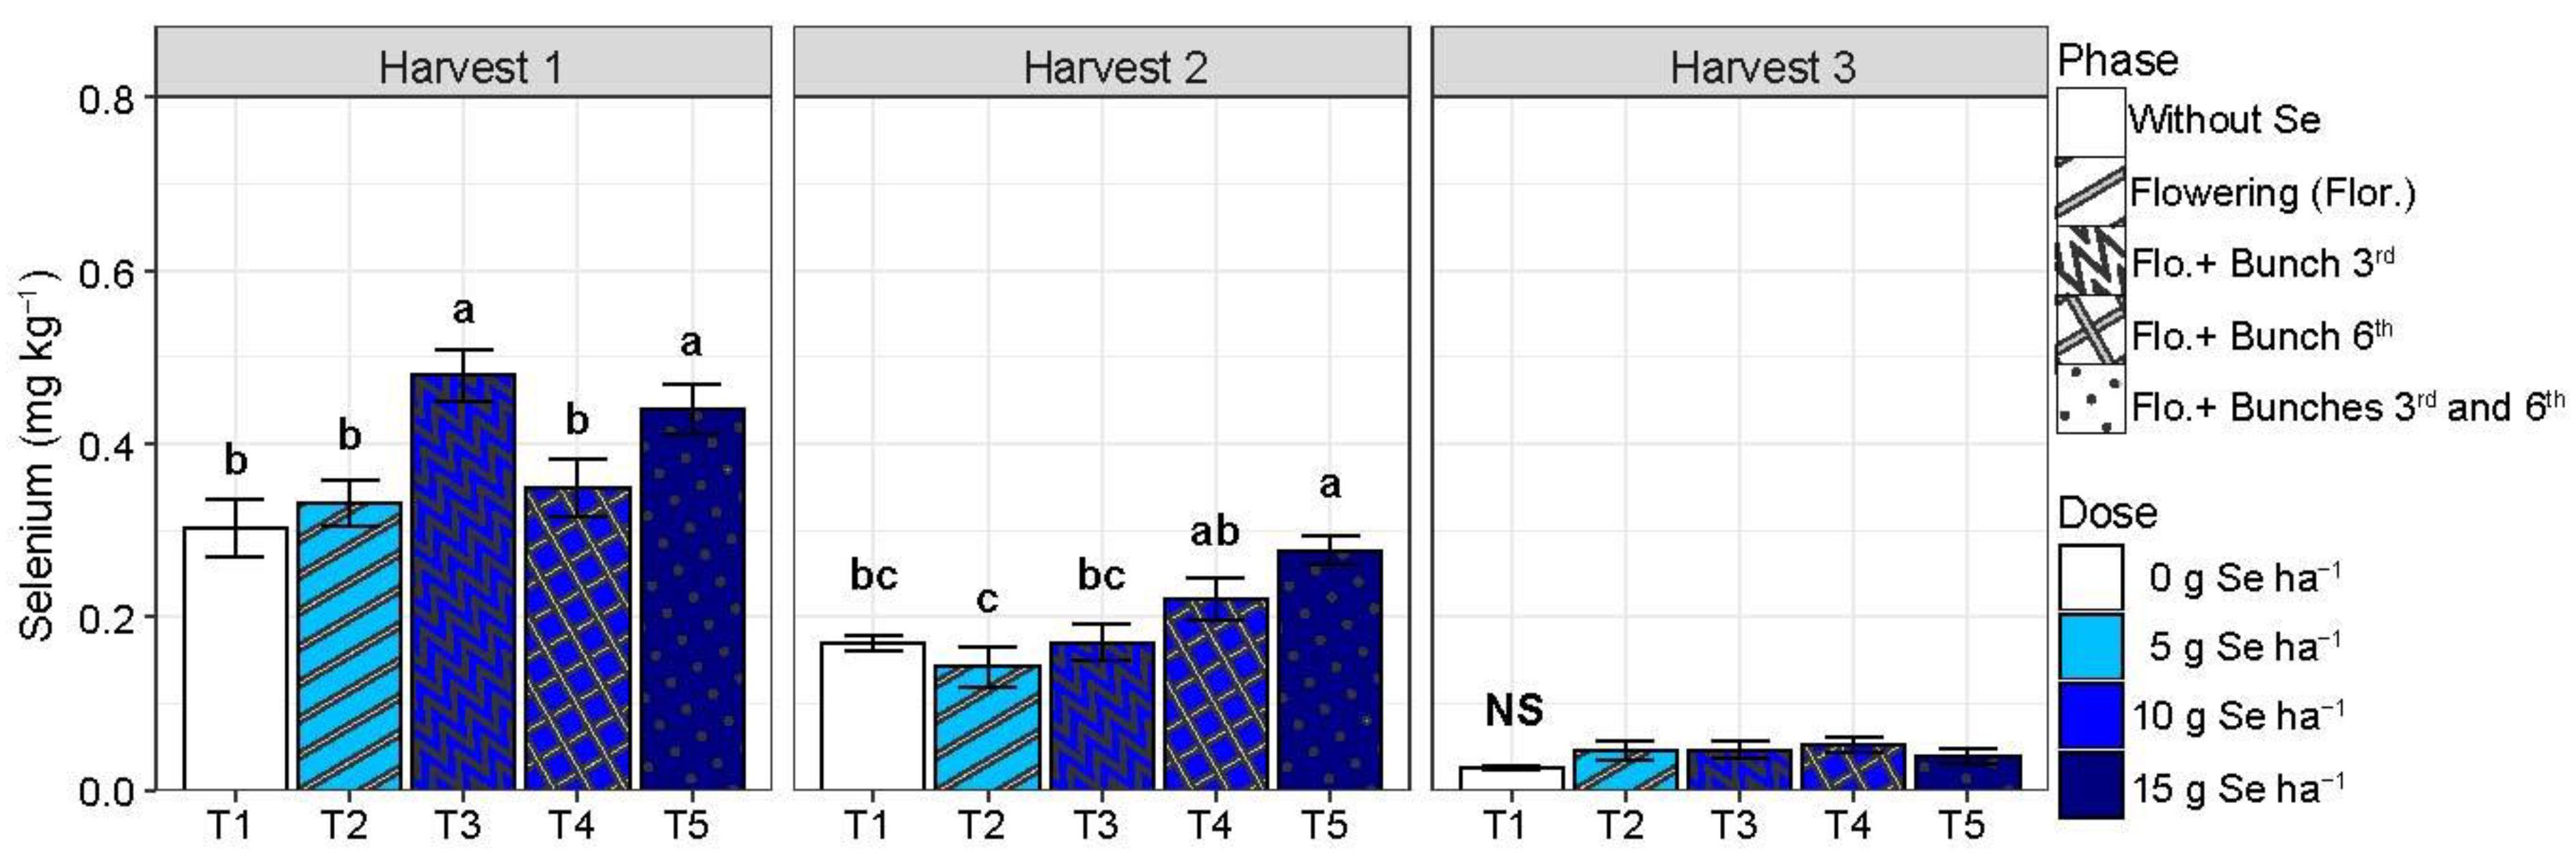
2.2. Tomato Fruits
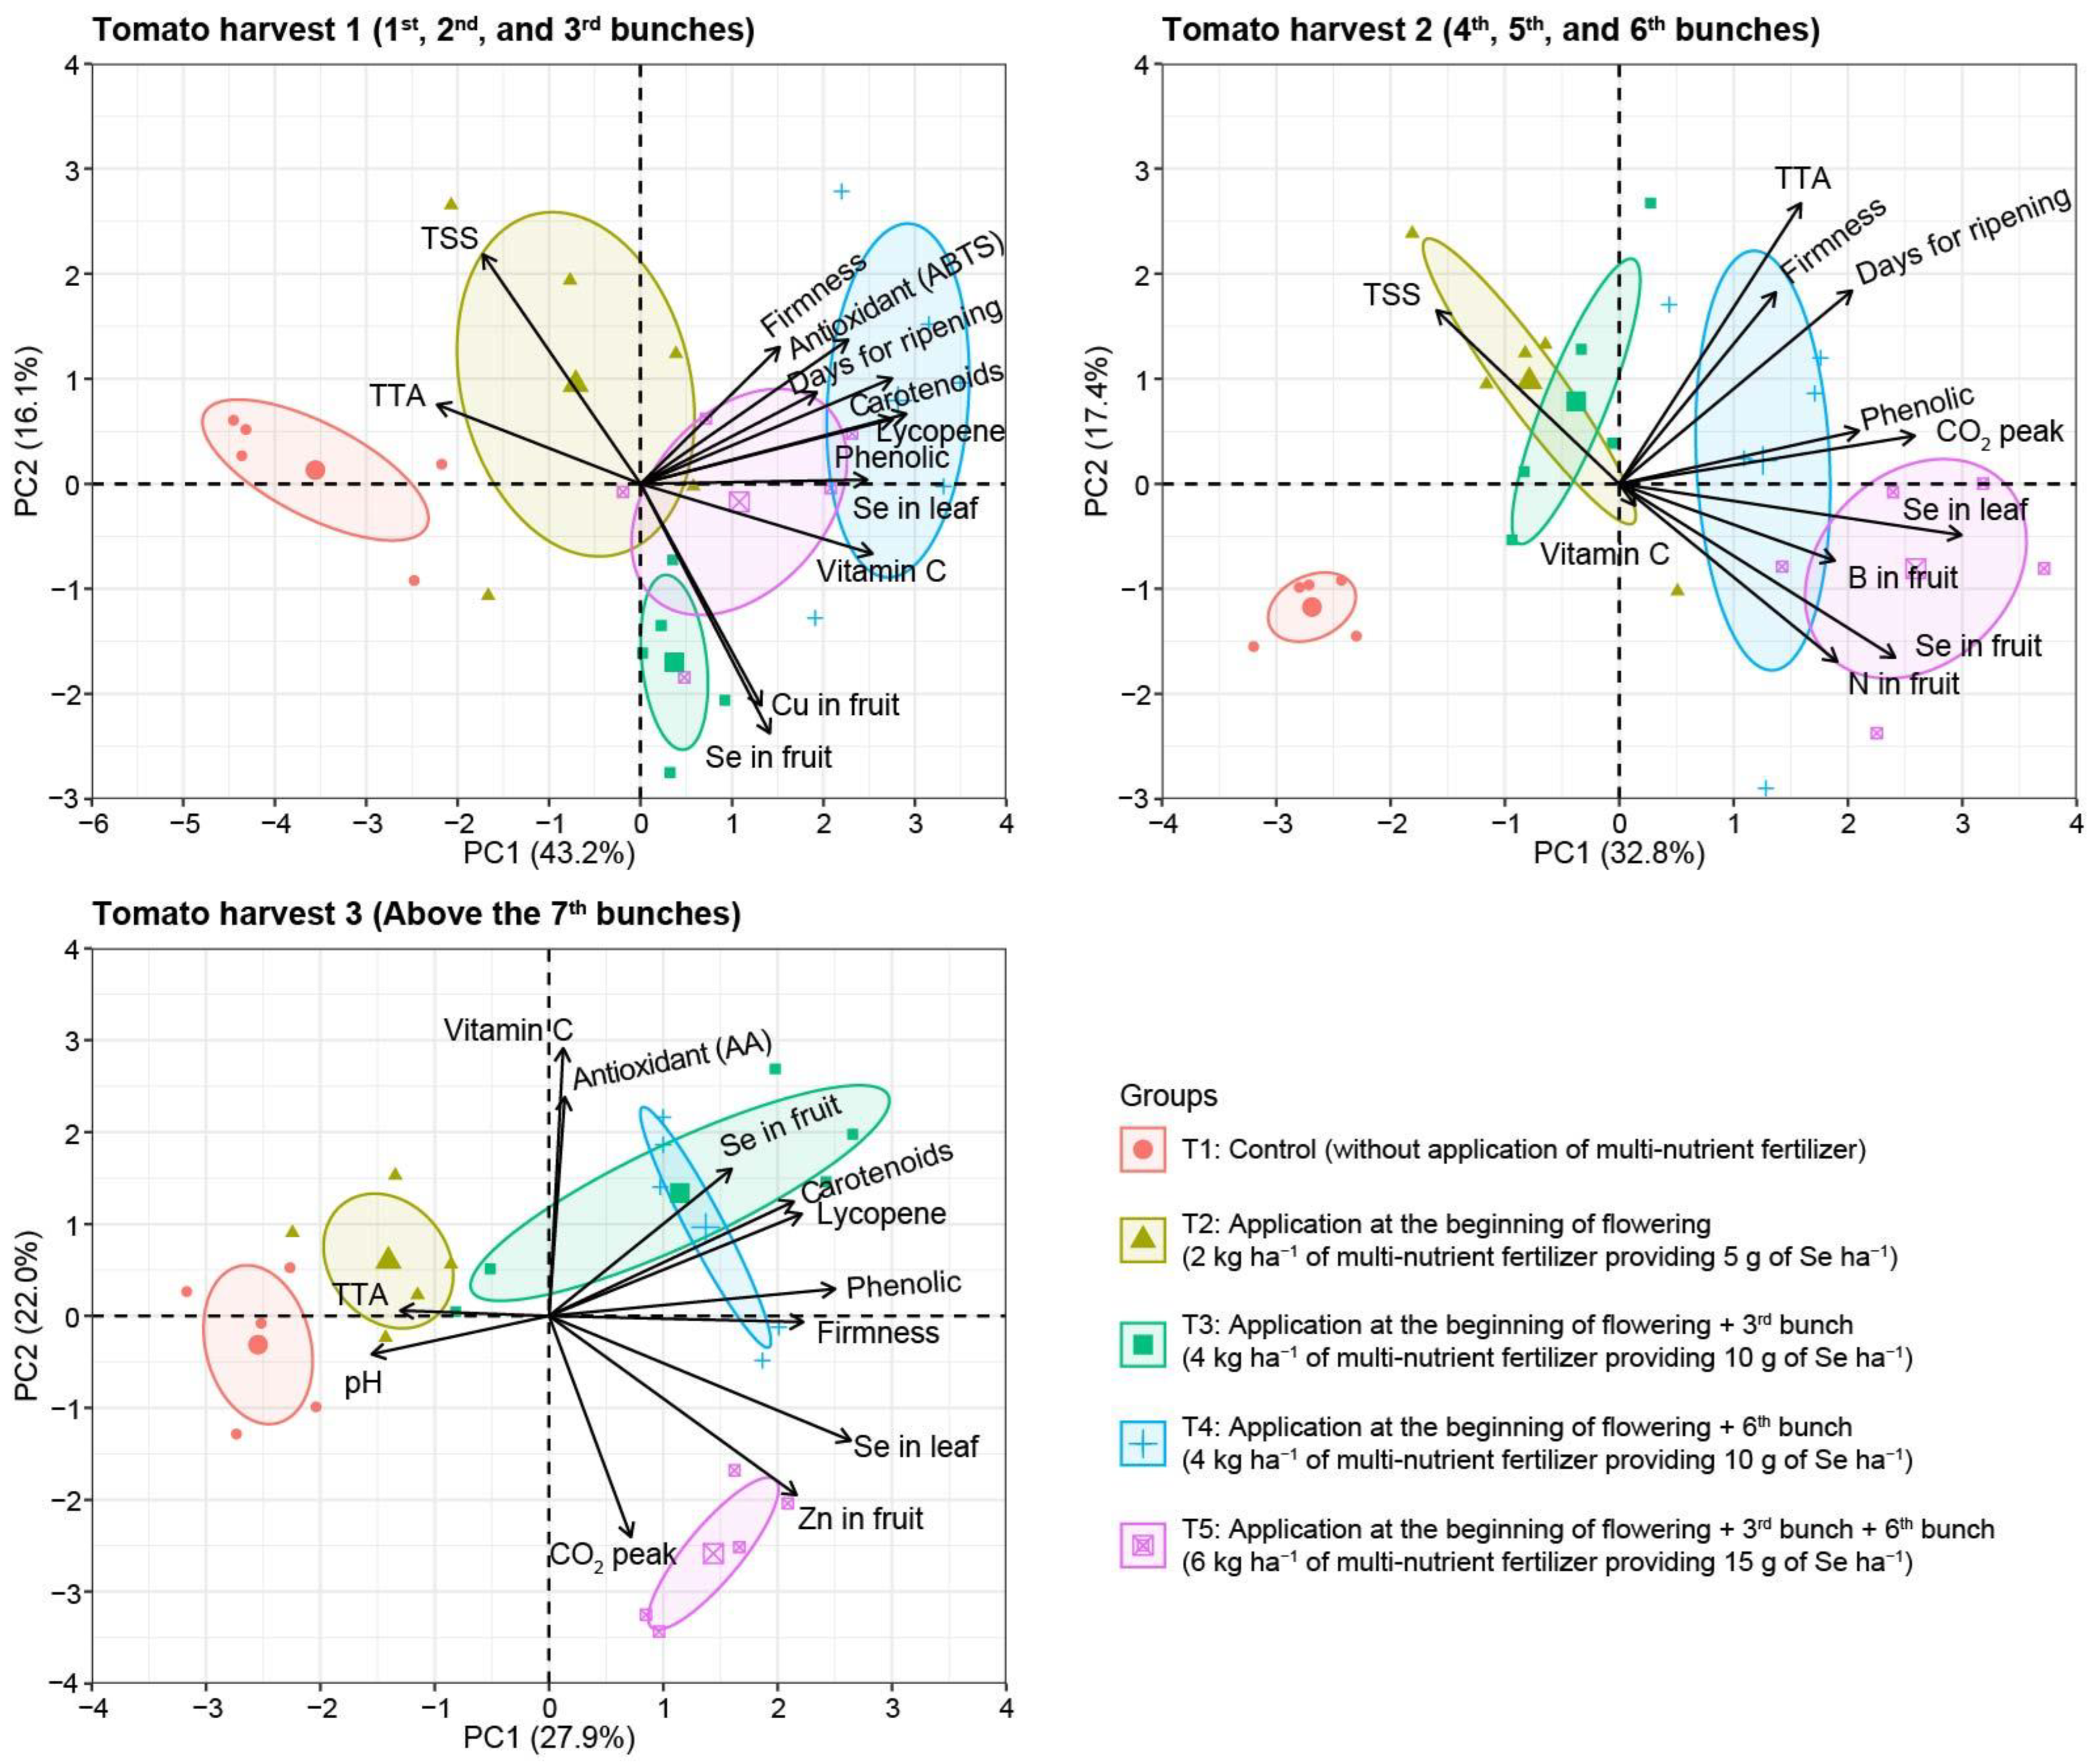
2.3. Principal Component Analysis
3. Discussion
4. Materials and Methods
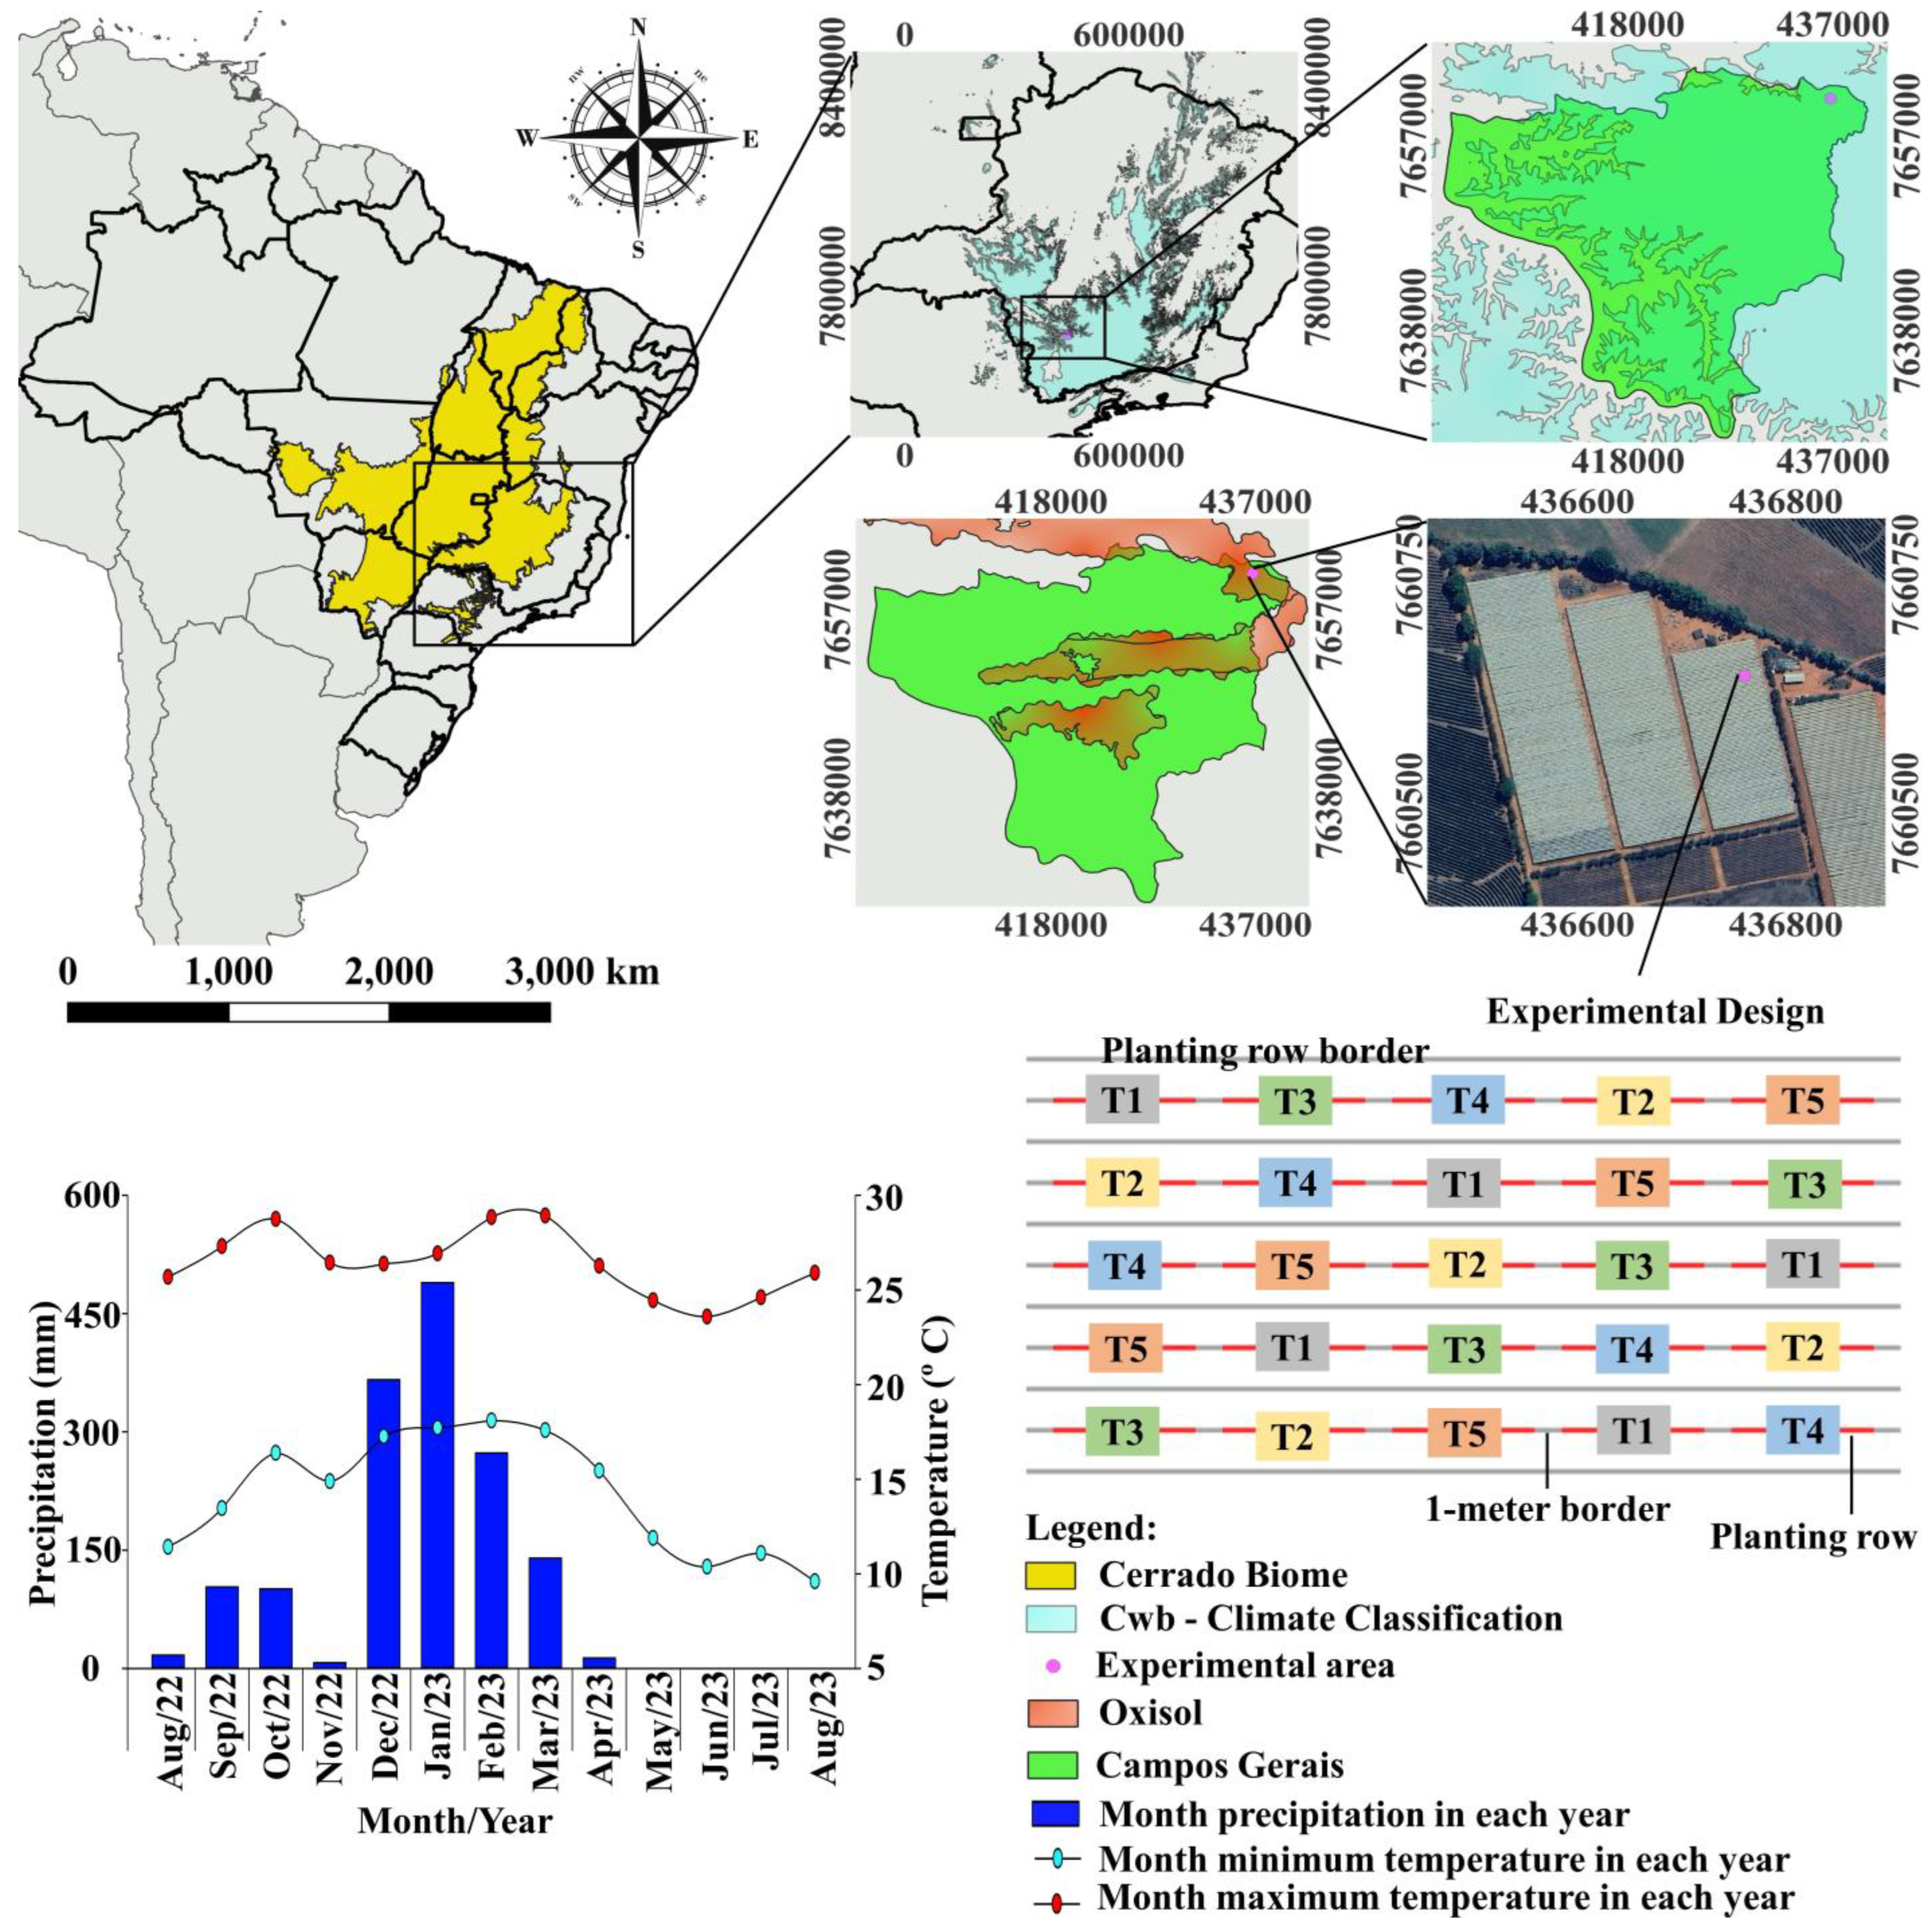
4.1. Treatments and Experimental Conditions
4.2. Biochemical Analysis in the Leaves
4.3. Post-Harvest Analysis in Tomato Fruits
4.4. Fruit Quality
4.5. Selenium and Nutrients Contents in Leave and Fruits
4.6. Statistical Analysis
5. Conclusions
Author Contributions
Funding
Data Availability Statement
Acknowledgments
Conflicts of Interest
Appendix A

| Treatment | N | P | K | Ca | Mg | S | Fe | Cu | Mn | Zn | B |
|---|---|---|---|---|---|---|---|---|---|---|---|
| ______________________________(g kg−1)________________________________ | _____________________________(mg kg−1)_____________________________ | ||||||||||
| T1 | 45.7 ± 0.9 | 3.5 ± 0.2 | 47.1 ± 0.9 | 32.5 ± 1.1 | 5.2 ± 0.2 | 17.8 ± 0.7 | 128.5 ± 5.8 | 56.2 ± 6.5 | 101.5 ± 4.7 | 118.3 ± 11.4 | 99.5 ± 1.8 |
| T2 | 47.8 ± 1.6 | 3.6 ± 0.3 | 44.9 ± 0.6 | 33.8 ± 1.3 | 4.9 ± 0.2 | 17.9 ± 0.4 | 134.7 ± 3.0 | 67.7 ± 6.2 | 118.5 ± 3.5 | 134.8 ± 10.1 | 108.7 ± 3.8 |
| T3 | 46.9 ± 0.7 | 3.4 ± 0.2 | 45.7 ± 1.1 | 32.0 ± 0.6 | 5.7 ± 0.2 | 17.5 ± 0.8 | 129.8 ± 3.6 | 58.5 ± 2.5 | 108.2 ± 6.4 | 123.0 ± 7.5 | 102.0 ± 3.9 |
| T4 | 48.1 ± 0.8 | 3.7 ± 0.2 | 44.4 ± 1.3 | 34.0 ± 0.5 | 5.2 ± 0.3 | 17.8 ± 1.1 | 133.4 ± 5.9 | 61.7 ± 6.6 | 111.0 ± 5.0 | 131.1 ± 8.8 | 105.9 ± 7.0 |
| T5 | 48.3 ± 0.8 | 3.7 ± 0.2 | 44.4 ± 1.0 | 34.1 ± 1.2 | 5.1 ± 0.2 | 17.2 ± 1.1 | 136.2 ± 3.1 | 60.7 ± 4.6 | 110.3 ± 9.6 | 125.1 ± 6.4 | 101.4 ± 4.4 |
| p-value | 0.479 NS | 0.648 NS | 0.210 NS | 0.461 NS | 0.111 NS | 0.962 NS | 0.656 NS | 0.313 NS | 0.443 NS | 0.550 NS | 0.654 NS |
| Tomato Harvest 1 (1st, 2nd, and 3rd bunches) | ||||
| Treatment | L | a | C | h° |
| T1 | 51.89 ± 0.37 | 15.39 ± 0.64 | 35.48 ± 0.85 | 64.40 ± 0.66 |
| T2 | 52.00 ± 0.63 | 16.11 ± 0.41 | 36.19 ± 0.68 | 63.55 ± 0.60 |
| T3 | 51.67 ± 0.57 | 15.92 ± 0.65 | 35.25 ± 0.20 | 63.16 ± 1.13 |
| T4 | 51.27 ± 0.37 | 15.86 ± 0.45 | 35.07 ± 0.54 | 63.52 ± 0.49 |
| T5 | 51.61 ± 0.72 | 16.75 ± 0.73 | 35.78 ± 0.77 | 62.18 ± 0.94 |
| p-value | 0.934 NS | 0.715 NS | 0.712 NS | 0.403 NS |
| Tomato Harvest 2 (4th, 5th, and 6th Bunches) | ||||
| Treatment | L | a | C | h° |
| T1 | 51.42 ± 0.74 | 14.56 ± 0.46 | 34.46 ± 0.63 | 65.03 ± 0.81 |
| T2 | 51.65 ± 0.37 | 15.92 ± 0.62 | 36.10 ± 0.30 | 64.05 ± 1.02 |
| T3 | 51.08 ± 0.31 | 16.49 ± 0.95 | 35.18 ± 0.58 | 62.17 ± 1.43 |
| T4 | 51.40 ± 0.34 | 15.53 ± 0.45 | 34.59 ± 0.55 | 63.79 ± 0.45 |
| T5 | 52.07 ± 0.49 | 15.93 ± 0.70 | 35.51 ± 0.94 | 63.35 ± 0.74 |
| p-value | 0.531 NS | 0.466 NS | 0.357 NS | 0.312 NS |
| Tomato Harvest 3 (above the 7th Bunches) | ||||
| Treatment | L | a | C | h° |
| T1 | 51.12 ± 0.29 | 16.02 ± 0.66 | 35.64 ± 0.35 | 63.32 ± 0.80 |
| T2 | 52.20 ± 0.57 | 17.15 ± 0.77 | 36.67 ± 0.79 | 62.37 ± 0.85 |
| T3 | 51.53 ± 0.49 | 16.13 ± 0.51 | 35.40 ± 0.47 | 63.21 ± 0.96 |
| T4 | 52.08 ± 0.37 | 15.87 ± 0.44 | 35.61 ± 0.70 | 63.60 ± 0.65 |
| T5 | 51.46 ± 0.45 | 16.68 ± 0.20 | 36.00 ± 0.39 | 62.36 ± 0.46 |
| p-value | 0.546 NS | 0.166 NS | 0.260 NS | 0.430 NS |
References
- Rayman, M.P. Selenium and Human Health. Lancet 2012, 379, 1256–1268. [Google Scholar] [CrossRef]
- Garousi, F. The Essentiality of Selenium for Humans, Animals, and Plants, and the Role of Selenium in Plant Metabolism and Physiology. Acta Univ. Sapientiae Aliment. 2017, 10, 75–90. [Google Scholar] [CrossRef]
- Galić, L.; Vinković, T.; Ravnjak, B.; Lončarić, Z. Agronomic Biofortification of Significant Cereal Crops with Selenium—A Review. Agronomy 2021, 11, 1015. [Google Scholar] [CrossRef]
- Kipp, A.P.; Strohm, D.; Brigelius-Flohé, R.; Schomburg, L.; Bechthold, A.; Leschik-Bonnet, E.; Heseker, H. Revised Reference Values for Selenium Intake. J. Trace Elem. Med. Biol. 2015, 32, 195–199. [Google Scholar] [CrossRef]
- Lopes, G.; Ávila, F.W.; Guilherme, L.R.G. Selenium Behavior in the Soil Environment and Its Implication for Human Health. Ciência E Agrotecnologia 2017, 41, 605–615. [Google Scholar] [CrossRef]
- Finley, J.W.; Davis, C.D.; Feng, Y. Selenium from High Selenium Broccoli Protects Rats from Colon Cancer. J. Nutr. 2000, 130, 2384–2389. [Google Scholar] [CrossRef] [PubMed]
- Silva, M.A.; Sousa, G.F.D.; Van Opbergen, G.A.Z.; Van Opbergen, G.G.A.Z.; Corguinha, A.P.B.; Bueno, J.M.M.; Brunetto, G.; Leite, J.M.; dos Santos, A.A.; Lopes, G.; et al. Foliar Application of Selenium Associated with a Multi-Nutrient Fertilizer in Soybean: Yield, Grain Quality, and Critical Se Threshold. Plants 2023, 12, 2028. [Google Scholar] [CrossRef] [PubMed]
- Ravello, R.A.V.; de Oliveira, C.; Lessa, J.; Boas, L.V.V.; de Castro, E.M.; Guilherme, L.R.G.; Lopes, G. Selenium Application Influenced Selenium Biofortification and Physiological Traits in Water-Deficit Common Bean Plants. Crop Pasture Sci. 2021, 73, 44–55. [Google Scholar] [CrossRef]
- de Lima Lessa, J.H.; Raymundo, J.F.; Branco Corguinha, A.P.; Dias Martins, F.A.; Araujo, A.M.; Melo Santiago, F.E.; Pereira de Carvalho, H.W.; Guimarães Guilherme, L.R.; Lopes, G. Strategies for Applying Selenium for Biofortification of Rice in Tropical Soils and Their Effect on Element Accumulation and Distribution in Grains. J. Cereal Sci. 2020, 96, 103125. [Google Scholar] [CrossRef]
- Quinet, M.; Angosto, T.; Yuste-Lisbona, F.J.; Blanchard-Gros, R.; Bigot, S.; Martinez, J.-P.; Lutts, S. Tomato Fruit Development and Metabolism. Front. Plant Sci. 2019, 10, 1554. [Google Scholar] [CrossRef]
- Fedeli, R.; Marotta, L.; Frattaruolo, L.; Panti, A.; Carullo, G.; Fusi, F.; Saponara, S.; Gemma, S.; Butini, S.; Cappello, A.R.; et al. Nutritionally Enriched Tomatoes (Solanum lycopersicum L.) Grown with Wood Distillate: Chemical and Biological Characterization for Quality Assessment. J. Food Sci. 2023, 88, 5324–5338. [Google Scholar] [CrossRef]
- Souza da Costa, B.; García, M.O.; Muro, G.S.; Motilva, M.-J. A Comparative Evaluation of the Phenol and Lycopene Content of Tomato By-Products Subjected to Different Drying Methods. LWT 2023, 179, 114644. [Google Scholar] [CrossRef]
- Hobson, G.; Grierson, D. Tomato. In Biochemistry of Fruit Ripening; Springer: Dordrecht, The Netherlands, 1993; pp. 405–442. [Google Scholar]
- Preciado-Rangel, P.; Hernández-Montiel, L.G.; Valdez-Cepeda, R.D.; De la Cruz-Lázaro, E.; Lara-Capistrán, L.; Morales-Morales, B.; Gaucin-Delgado, J.M. Biofortification with Selenium Increases Bioactive Compounds and Antioxidant Capacity in Tomato Fruits. Rev. Terra Latinoam. 2021, 39. [Google Scholar] [CrossRef]
- Zhu, Z.; Chen, Y.; Shi, G.; Zhang, X. Selenium Delays Tomato Fruit Ripening by Inhibiting Ethylene Biosynthesis and Enhancing the Antioxidant Defense System. Food Chem. 2017, 219, 179–184. [Google Scholar] [CrossRef] [PubMed]
- Xu, X.; Wang, J.; Wu, H.; Yuan, Q.; Wang, J.; Cui, J.; Lin, A. Effects of Selenium Fertilizer Application and Tomato Varieties on Tomato Fruit Quality: A Meta-Analysis. Sci. Hortic. 2022, 304, 111242. [Google Scholar] [CrossRef]
- Shiriaev, A.; Brizzolara, S.; Sorce, C.; Meoni, G.; Vergata, C.; Martinelli, F.; Maza, E.; Djari, A.; Pirrello, J.; Pezzarossa, B.; et al. Selenium Biofortification Impacts the Tomato Fruit Metabolome and Transcriptional Profile at Ripening. J. Agric. Food Chem. 2023, 71, 13554–13565. [Google Scholar] [CrossRef] [PubMed]
- Meucci, A.; Shiriaev, A.; Rosellini, I.; Malorgio, F.; Pezzarossa, B. Se-Enrichment Pattern, Composition, and Aroma Profile of Ripe Tomatoes after Sodium Selenate Foliar Spraying Performed at Different Plant Developmental Stages. Plants 2021, 10, 1050. [Google Scholar] [CrossRef] [PubMed]
- Lanza, M.G.D.B.; Reis, A.R. dos Roles of Selenium in Mineral Plant Nutrition: ROS Scavenging Responses against Abiotic Stresses. Plant Physiol. Biochem. 2021, 164, 27–43. [Google Scholar] [CrossRef]
- Sousa, G.F.D.; Silva, M.A.; de Carvalho, M.R.; Morais, E.G.D.; Benevenute, P.A.N.; Van Opbergen, G.A.Z.; Van Opbergen, G.G.A.Z.; Guilherme, L.R.G. Foliar Selenium Application to Reduce the Induced-Drought Stress Effects in Coffee Seedlings: Induced Priming or Alleviation Effect? Plants 2023, 12, 3026. [Google Scholar] [CrossRef]
- de Sousa, G.F.; Silva, M.A.; de Morais, E.G.; Van Opbergen, G.A.Z.; Van Opbergen, G.G.A.Z.; de Oliveira, R.R.; Amaral, D.; Brown, P.; Chalfun-Junior, A.; Guilherme, L.R.G. Selenium Enhances Chilling Stress Tolerance in Coffee Species by Modulating Nutrient, Carbohydrates, and Amino Acids Content. Front. Plant Sci. 2022, 13, 1000430. [Google Scholar] [CrossRef]
- Castro, T.A.; Leite, B.S.; Assunção, L.S.; de Jesus Freitas, T.; Colauto, N.B.; Linde, G.A.; Otero, D.M.; Machado, B.A.S.; Ferreira Ribeiro, C.D. Red Tomato Products as an Alternative to Reduce Synthetic Dyes in the Food Industry: A Review. Molecules 2021, 26, 7125. [Google Scholar] [CrossRef] [PubMed]
- Scherhaufer, S.; Moates, G.; Hartikainen, H.; Waldron, K.; Obersteiner, G. Environmental Impacts of Food Waste in Europe. Waste Manag. 2018, 77, 98–113. [Google Scholar] [CrossRef] [PubMed]
- Rengel, Z.; Cakmak, I.; White, P.J. Marschner’s Mineral Nutrition of Plants; Academic Press: Cambridge, MA, USA, 2023. [Google Scholar]
- Brown, P.H.; Zhao, F.-J.; Dobermann, A. What Is a Plant Nutrient? Changing Definitions to Advance Science and Innovation in Plant Nutrition. Plant Soil 2022, 476, 11–23. [Google Scholar] [CrossRef]
- Liu, H.; Xiao, C.; Qiu, T.; Deng, J.; Cheng, H.; Cong, X.; Cheng, S.; Rao, S.; Zhang, Y. Selenium Regulates Antioxidant, Photosynthesis, and Cell Permeability in Plants under Various Abiotic Stresses: A Review. Plants 2022, 12, 44. [Google Scholar] [CrossRef] [PubMed]
- Rady, M.M.; Belal, H.E.E.; Gadallah, F.M.; Semida, W.M. Selenium Application in Two Methods Promotes Drought Tolerance in Solanum lycopersicum Plant by Inducing the Antioxidant Defense System. Sci. Hortic. 2020, 266, 109290. [Google Scholar] [CrossRef]
- Babalar, M.; Mohebbi, S.; Zamani, Z.; Askari, M.A. Effect of Foliar Application with Sodium Selenate on Selenium Biofortification and Fruit Quality Maintenance of ‘Starking Delicious’ Apple during Storage. J. Sci. Food Agric. 2019, 99, 5149–5156. [Google Scholar] [CrossRef] [PubMed]
- Collins, E.J.; Bowyer, C.; Tsouza, A.; Chopra, M. Tomatoes: An Extensive Review of the Associated Health Impacts of Tomatoes and Factors That Can Affect Their Cultivation. Biology 2022, 11, 239. [Google Scholar] [CrossRef] [PubMed]
- IBGE Produção de Tomate. Available online: https://www.ibge.gov.br/explica/producao-agropecuaria/tomate/br (accessed on 20 February 2024).
- Guimarães, M.D.A.; Silva, D.J.H.; Fontes, P.C.R.; Mattedi, A.P. Produtividade e Sabor Dos Frutos de Tomate Do Grupo Salada Em Função de Podas. Biosci. J. 2008, 24, 32–38. [Google Scholar]
- Zhu, Z.; Chen, Y.; Zhang, X.; Li, M. Effect of Foliar Treatment of Sodium Selenate on Postharvest Decay and Quality of Tomato Fruits. Sci. Hortic. 2016, 198, 304–310. [Google Scholar] [CrossRef]
- Hu, Y.; Chai, X.; Men, J.; Rao, S.; Cong, X.; Cheng, S.; Qiao, Z. Does Methionine Status Influence the Outcome of Selenomethinione Supplementation? A Comparative Study of Metabolic and Selenium Levels in HepG2 Cells. Nutrients 2022, 14, 3705. [Google Scholar] [CrossRef] [PubMed]
- Zhu, L.; Chen, L.; Wu, C.; Shan, W.; Cai, D.; Lin, Z.; Wei, W.; Chen, J.; Lu, W.; Kuang, J. Methionine Oxidation and Reduction of the Ethylene Signaling Component MaEIL9 Are Involved in Banana Fruit Ripening. J. Integr. Plant Biol. 2023, 65, 150–166. [Google Scholar] [CrossRef]
- Pattyn, J.; Vaughan-Hirsch, J.; Van de Poel, B. The Regulation of Ethylene Biosynthesis: A Complex Multilevel Control Circuitry. New Phytol. 2021, 229, 770–782. [Google Scholar] [CrossRef]
- Wei, H.; Seidi, F.; Zhang, T.; Jin, Y.; Xiao, H. Ethylene Scavengers for the Preservation of Fruits and Vegetables: A Review. Food Chem. 2021, 337, 127750. [Google Scholar] [CrossRef]
- Tran, T.H.; Le, X.C.; Tran, T.N.M.; Nguyen, N.T.T.; Pham, B.N.; Vu, D. Nano Selenium—Alginate Edible Coating Extends Hydroponic Strawberry Shelf Life and Provides Selenium Fortification as a Micro-Nutrient. Food Biosci. 2023, 53, 102597. [Google Scholar] [CrossRef]
- Zhu, Z.; Zhang, Y.; Liu, J.; Chen, Y.; Zhang, X. Exploring the Effects of Selenium Treatment on the Nutritional Quality of Tomato Fruit. Food Chem. 2018, 252, 9–15. [Google Scholar] [CrossRef]
- Alcaíno, J.; Baeza, M.; Cifuentes, V. Carotenoids in Nature. In Subcellular Biochemistry; Stange, C., Ed.; Springer International Publishing: Cham, Switzerland, 2016; Volume 79, ISBN 978-3-319-39124-3. [Google Scholar]
- Oliveira, V.C.D.; Faquin, V.; Guimarães, K.C.; Andrade, F.R.; Pereira, J.; Guilherme, L.R.G. Agronomic Biofortification of Carrot with Selenium. Ciência E Agrotecnologia 2018, 42, 138–147. [Google Scholar] [CrossRef]
- Liu, K.; Gu, Z. Selenium Accumulation in Different Brown Rice Cultivars and Its Distribution in Fractions. J. Agric. Food Chem. 2009, 57, 695–700. [Google Scholar] [CrossRef] [PubMed]
- Andrejiová, A.; Hegedűsová, A.; Adamec, S.; Hegedűs, O.; Mezeyová, I. Increasing of Selenium Content and Qualitative Parameters in Tomato (Lycopersicon esculentum Mill.) after Its Foliar Application. Potravin. Slovak J. Food Sci. 2019, 13, 351–358. [Google Scholar] [CrossRef]
- Garming, H. Tomatoes Are the Superlative Vegetable: Global Per Capita Consumption Is 20 Kilograms per Year. Available online: http://www.agribenchmark.org/agri-benchmark/did-you-know/einzelansicht/artikel//tomatoes-are.html (accessed on 9 May 2024).
- USDA Food Data Central—Tomato. Available online: https://fdc.nal.usda.gov/fdc-app.html#/food-details/321360/nutrients (accessed on 21 March 2024).
- Koppen, W. Das Geographische System de Klimate. In Handbuch der Klimatologie; Gebrüder Borntraeger: Berlin, Gemany, 1936. [Google Scholar]
- Santos, H.G.; Jacomine, P.K.T.; Dos Anjos, L.H.C.; De Oliveira, V.A.; Lumbreras, J.F.; Coelho, M.R.; De Almeida, J.A.; de Araujo Filho, J.C.; de Oliveira, J.B.D.; Cunha, T.J.F. Sistema Brasileiro de Classificação de Solos; Embrapa: Brasília, Brazil, 2018. [Google Scholar]
- IIUSS Working Group WRB. World Reference Base for Soil Resources 2014, Update 2015 International Soil Classification System for Naming Soils and Creating Legends for Soil Maps; IIUSS Working Group WRB, Ed.; FAO: Rome, Italy, 2015. [Google Scholar]
- Soil Survey Staff. Keys to Soil Taxonomy, 13th ed.; Soil Survey Staff, Ed.; USDA Natural Resources Conservation Service: Washington, DC, USA, 2022. [Google Scholar]
- de Oliveira, L.B. Manual de Métodos de Análise de Solo, 3rd ed.; Teixeira, P.C., Donagemma, G.K., Fontana, A., Teixeira, W.G., Eds.; Embrapa: Brasília, Brazil, 2017; ISBN 978-85-7035-771-7. [Google Scholar]
- Alexieva, V.; Sergiev, I.; Mapelli, S.; Karanov, E. The Effect of Drought and Ultraviolet Radiation on Growth and Stress Markers in Pea and Wheat. Plant. Cell Environ. 2001, 24, 1337–1344. [Google Scholar] [CrossRef]
- Heath, R.L.; Packer, L. Photoperoxidation in Isolated Chloroplasts. Arch. Biochem. Biophys. 1968, 125, 189–198. [Google Scholar] [CrossRef]
- Beauchamp, C.; Fridovich, I. Superoxide Dismutase: Improved Assays and an Assay Applicable to Acrylamide Gels. Anal. Biochem. 1971, 44, 276–287. [Google Scholar] [CrossRef]
- Nakano, Y.; Asada, K. Hydrogen Peroxide Is Scavenged by Ascorbate-Specific Peroxidase in Spinach Chloroplasts. Plant Cell Physiol. 1981, 22, 867–880. [Google Scholar] [CrossRef]
- Chance, B.; Maehly, A. Assay of Catalases and Peroxidases. In Methods in Enzymology; Academic Press: Cambridge, MA, USA, 1955; pp. 764–775. [Google Scholar]
- Azevedo, R.A.; Alas, R.M.; Smith, R.J.; Lea, P.J. Response of Antioxidant Enzymes to Transfer from Elevated Carbon Dioxide to Air and Ozone Fumigation, in the Leaves and Roots of Wild-type and a Catalase-deficient Mutant of Barley. Physiol. Plant. 1998, 104, 280–292. [Google Scholar] [CrossRef]
- Rufino, M.D.S.M.; Alves, R.E.; de Brito, E.S.; Pérez-Jiménez, J.; Saura-Calixto, F.; Mancini-Filho, J. Bioactive Compounds and Antioxidant Capacities of 18 Non-Traditional Tropical Fruits from Brazil. Food Chem. 2010, 121, 996–1002. [Google Scholar] [CrossRef]
- Medina, M.B. Determination of the Total Phenolics in Juices and Superfruits by a Novel Chemical Method. J. Funct. Foods 2011, 3, 79–87. [Google Scholar] [CrossRef]
- Prieto, P.; Pineda, M.; Aguilar, M. Spectrophotometric Quantitation of Antioxidant Capacity through the Formation of a Phosphomolybdenum Complex: Specific Application to the Determination of Vitamin E. Anal. Biochem. 1999, 269, 337–341. [Google Scholar] [CrossRef] [PubMed]
- Auzanneau, N.; Weber, P.; Kosińska-Cagnazzo, A.; Andlauer, W. Bioactive Compounds and Antioxidant Capacity of Lonicera Caerulea Berries: Comparison of Seven Cultivars over Three Harvesting Years. J. Food Compos. Anal. 2018, 66, 81–89. [Google Scholar] [CrossRef]
- Strohecker, R.; Henning, H.M.; Libman, D.D. Vitamin Assay. Tested Methods; Strohecker, R., Henning, H.M., Libman, D.D., Eds.; Verlag Chemie: Weinheim, Germany, 1965. [Google Scholar]
- Rodriguez-Amaya, D.B. A Guide to Carotenoid Analysis in Foods; Rodriguez-Amaya, D.B., Ed.; ILSI PRESS: Washington, DC, USA, 2001; ISBN 1-57881-072-8. [Google Scholar]
- USEPA. Microwave Assisted Acid Digestion of Sediments, Sludges, and Oils; USEPA, Ed.; United States Environmental Protection Agency: Washington, DC, USA, 2007. [Google Scholar]
- Kalra, Y. Handbook of Reference Methods for Plant Analysis; Kalra, Y., Ed.; CRC Press: Boca Raton, FL, USA, 1997. [Google Scholar]
- R Core Team. R: A Language and Environment for Statistical Computing; R Core Team: Vienna, Austria, 2022. [Google Scholar]
- Wei, T.; Simko, V.R.; Levy, M.; Xie, Y.; Jin, Y.; Zemla, J. Package “Corrplot”: Visualization of a Correlation Matrix 2017; Version 0.84; R Core Team: Vienna, Austria, 2021. [Google Scholar]
- Arnhold, E. Easyanova: Analysis of Variance and Other Important Complementary Analyses; R Core Team: Vienna, Austria, 2019. [Google Scholar]
- Lê, S.; Josse, J.; Husson, F. FactoMineR: An R Package for Multivariate Analysis. J. Stat. Softw. 2008, 25, 1–8. [Google Scholar] [CrossRef]
- Mendiburu, F. Agricolae: Statistical Procedures for Agricultural Research; R Core Team: Vienna, Austria, 2020. [Google Scholar]
| Treatment | Se (mg kg−1) | MDA (nmol MDA g−1 of FM) | H2O2 (nmol H2O2 g−1 of FM) | SOD (U SOD min−1 g−1 of FM) | CAT (nmol H2O2 min−1 mg−1 of FM) | APX (nmol ASA g−1 of FM min−1) | POD (nmol Tetraguaiacol g of FM −1 min−1) |
|---|---|---|---|---|---|---|---|
| T1 | 2.4 ± 0.3 b | 17.5 ± 1.4 | 804 ± 100 a | 166 ± 2 | 909 ± 80 | 1014 ± 54 | 2090 ± 330 c |
| T2 | 2.9 ± 0.4 b | 13.4 ± 1.6 | 829 ± 121 a | 163 ± 1 | 905 ± 34 | 998 ± 92 | 3231 ± 352 b |
| T3 | 4.8 ± 0.5 b | 16.4 ± 1.8 | 558 ± 88 ab | 160 ± 2 | 864 ± 49 | 1173 ± 48 | 1939 ± 488 c |
| T4 | 10.2 ± 0.5 a | 18.2 ± 1.3 | 464 ± 106 b | 159 ± 2 | 812 ± 55 | 979 ± 20 | 1001 ± 377 d |
| T5 | 11.5 ± 0.5 a | 16.6 ± 1.8 | 343 ± 86 b | 159 ± 2 | 966 ± 60 | 1053 ± 36 | 3554 ± 287 a |
| p-value | 0.001 | 0.344 NS | 0.014 * | 0.140 NS | 0.152 NS | 0.553 NS | 0.003 NS |
| Tomato Harvest 1 (1st, 2nd, and 3rd Bunches) | ||||||||||
| Treatment | Yield (t ha−1) | Height (mm) | Diameter (mm) | FN | AFW (g fruit−1) | |||||
| Total | >60 mm | >50 and <60 mm | >40 and <50 mm | <40 mm | Non-Com. | |||||
| T1 | 26.8 ± 1.2 | 23.7 ± 1.7 | 2.7 ± 1.1 | 0.2 ± 0.1 | 0.1 ± 0.1 | 0.0 ± 0.0 | 65.9 ± 1.1 | 51.3 ± 0.9 | 21.6 ± 1.3 | 102.8 ± 3.7 |
| T2 | 26.1 ± 1.1 | 23.3 ± 1.6 | 2.2 ± 0.5 | 0.3 ± 0.1 | 0.1 ± 0.1 | 0.2 ± 0.1 | 66.2 ± 1.4 | 51.5 ± 0.7 | 20.6 ± 0.9 | 104.9 ± 4.9 |
| T3 | 26.3 ± 0.5 | 23.0 ± 0.5 | 2.8 ± 0.5 | 0.4 ± 0.1 | 0.0 ± 0.0 | 0.1 ± 0.1 | 66.3 ± 0.3 | 51.1 ± 0.6 | 21.5 ± 0.5 | 101.3 ± 2.1 |
| T4 | 26.5 ± 1.1 | 22.1 ± 1.4 | 3.6 ± 0.1 | 0.7 ± 0.2 | 0.1 ± 0.0 | 0.0 ± 0.0 | 63.5 ± 1.2 | 49.6 ± 0.7 | 23.3 ± 0.4 | 94.1 ± 3.9 |
| T5 | 26.3 ± 1.5 | 22.3 ± 1.9 | 3.3 ± 0.4 | 0.4 ± 0.1 | 0.1 ± 0.1 | 0.2 ± 0.1 | 65.1 ± 1.6 | 50.8 ± 0.9 | 22.1 ± 0.9 | 98.3 ± 4.8 |
| p-value | 0.997 NS | 0.954 NS | 0.435 NS | 0.217 NS | 0.366 NS | 0.564 NS | 0.553 NS | 0.640 NS | 0.572 NS | 0.598 NS |
| Treatment | Yield (t ha−1) | Height (mm) | Diameter (mm) | FN | AFM (g fruit−1) | |||||
| Total | >60 mm | >50 and <60 mm | >40 and <50 mm | <40 mm | Non-Com. | |||||
| T1 | 24.1 ± 1.6 | 20.9 ± 1.9 | 2.4 ± 0.4 | 0.6 ± 0.1 | 0.2 ± 0.1 | 0.1 ± 0.1 | 62.7 ± 1.3 | 52.1 ± 1.1 | 20.7 ± 0.8 | 95.8 ± 5.1 |
| T2 | 24.2 ± 0.9 | 19.8 ± 1.3 | 3.3 ± 0.4 | 0.5 ± 0.3 | 0.2 ± 0.1 | 0.4 ± 0.3 | 62.8 ± 0.8 | 51.3 ± 0.9 | 21.8 ± 0.8 | 91.7 ± 3.9 |
| T3 | 24.3 ± 0.9 | 21.0 ± 0.6 | 2.5 ± 0.4 | 0.5 ± 0.1 | 0.1 ± 0.1 | 0.3 ± 0.2 | 63.3 ± 1.0 | 52.0 ± 0.8 | 21.6 ± 1.0 | 93.1 ± 3.7 |
| T4 | 23.2 ± 0.9 | 18.5 ± 1.2 | 3.4 ± 0.5 | 0.9 ± 0.2 | 0.2 ± 0.1 | 0.2 ± 0.1 | 61.7 ± 0.6 | 50.2 ± 0.5 | 22.4 ± 0.4 | 85.5 ± 2.7 |
| T5 | 26.5 ± 1.1 | 22.9 ± 1.3 | 2.6 ± 0.5 | 0.6 ± 0.1 | 0.3 ± 0.1 | 0.2 ± 0.1 | 62.7 ± 0.8 | 51.3 ± 0.5 | 24.1 ± 0.9 | 91.0 ± 2.5 |
| p-value | 0.361 NS | 0.221 NS | 0.312 NS | 0.535 NS | 0.688 NS | 0.844 NS | 0.924 NS | 0.654 NS | 0.206 NS | 0.576 NS |
| Treatment | Yield (t ha−1) | Height (mm) | Diameter (mm) | FN | AFM (g fruit−1) | |||||
| Total | >60 mm | >50 and <60 mm | >40 and <50 mm | <40 mm | Non-Com. | |||||
| T1 | 29.9 ± 0.9 | 23 ± 1.8 | 5.1 ± 1.2 | 1.5 ± 0.7 | 0.3 ± 0.1 | 0.0 ± 0.0 | 60.3 ± 1.6 | 50.3 ± 1.3 | 26.3 ± 1.9 | 95.2 ± 6.5 |
| T2 | 32.7 ± 1.7 | 27.4 ± 2.2 | 4.2 ± 0.7 | 0.9 ± 0.3 | 0.2 ± 0.1 | 0.0 ± 0.0 | 61.3 ± 0.7 | 50.6 ± 0.5 | 28.3 ± 1.2 | 95.4 ± 2.2 |
| T3 | 30.3 ± 1.5 | 24.4 ± 0.7 | 4.3 ± 0.7 | 1.3 ± 0.6 | 0.2 ± 0.1 | 0.1 ± 0.1 | 60.7 ± 1.5 | 48.2 ± 0.7 | 28.1 ± 2.5 | 90.3 ± 3.4 |
| T4 | 31.3 ± 1.4 | 25.8 ± 1.2 | 4.8 ± 0.7 | 0.5 ± 0.2 | 0.2 ± 0.1 | 0.0 ± 0.0 | 61.7 ± 1.1 | 50.4 ± 1.1 | 26.8 ± 2.1 | 97.4 ± 4.5 |
| T5 | 30.9 ± 1.1 | 26.6 ± 1.2 | 3.6 ± 0.7 | 0.7 ± 0.2 | 0.1 ± 0.0 | 0.0 ± 0.0 | 61.6 ± 0.4 | 49.5 ± 0.6 | 26.5 ± 1.0 | 96.4 ± 2.3 |
| p-value | 0.776 NS | 0.400 NS | 0.654 NS | 0.700 NS | 0.721 NS | 0.587 NS | 0.885 NS | 0.369 NS | 0.944 NS | 0.785 NS |
| Tomato Harvest 1 (1st, 2nd, and 3rd Bunches) | |||||||||||
| Treatment | N | P | K | Ca | Mg | S | Fe | Cu | Mn | Zn | B |
| ______________________________(g kg−1)________________________________ | _____________________________(mg kg−1)_____________________________ | ||||||||||
| T1 | 34.2 ± 1.3 | 5.8 ± 0.4 | 33.4 ± 6.6 | 2.5 ± 0.3 | 2.5 ± 0.3 | 2.7 ± 0.3 | 92.5 ± 6.8 | 31.6 ± 1.1 b | 21.9 ± 0.9 | 36.5 ± 4.6 | 18.4 ± 3.2 |
| T2 | 33.0 ± 1.2 | 6.2 ± 0.8 | 58.1 ± 5.4 | 2.8 ± 0.3 | 2.5 ± 0.3 | 2.9 ± 0.4 | 77.2 ± 8.8 | 33.3 ± 4.6 b | 22.8 ± 2.0 | 37.3 ± 4.7 | 19.1 ± 2.4 |
| T3 | 34.1 ± 1.6 | 5.9 ± 0.4 | 42.5 ± 9.4 | 2.6 ± 0.1 | 2.6 ± 0.1 | 2.8 ± 0.1 | 103.1 ± 4.6 | 48.3 ± 2.2 a | 23.1 ± 1.3 | 44.0 ± 2.3 | 18.4 ± 0.7 |
| T4 | 34.0 ± 1.3 | 6.7 ± 0.5 | 38.6 ± 10.5 | 2.7 ± 0.4 | 2.7 ± 0.3 | 3.1 ± 0.3 | 83.1 ± 8.6 | 43.2 ± 5.0 a | 21.2 ± 1.3 | 42.6 ± 4.9 | 19.8 ± 2.3 |
| T5 | 32.2 ± 1.3 | 6.6 ± 0.3 | 42.6 ± 7.9 | 2.8 ± 0.4 | 2.6 ± 0.1 | 3.1 ± 0.2 | 97.3 ± 7.1 | 32.0 ± 2.0 b | 21.7 ± 0.7 | 39.4 ± 2.3 | 20.1 ± 1.2 |
| p-value | 0.530 NS | 0.647 NS | 0.367 NS | 0.966 NS | 0.923 NS | 0.900 NS | 0.160 NS | 0.001 * | 0.788 NS | 0.555 NS | 0.967 NS |
| Treatment | N | P | K | Ca | Mg | S | Fe | Cu | Mn | Zn | B |
| ______________________________(g kg−1)________________________________ | _____________________________(mg kg−1)_____________________________ | ||||||||||
| T1 | 21.7 ± 0.5 b | 3.5 ± 0.2 | 41.6 ± 1.6 | 1.7 ± 0.1 | 2.1 ± 0.1 | 2.1 ± 0.1 | 64.7 ± 2.4 | 16.0 ± 1.2 | 15.6 ± 0.5 | 23.3 ± 0.9 | 13.0 ± 0.7 b |
| T2 | 23.1 ± 1.8 b | 4.1 ± 0.2 | 47.7 ± 1.2 | 1.9 ± 0.1 | 2.5 ± 0.1 | 2.3 ± 0.1 | 63.9 ± 1.7 | 16.5 ± 2.7 | 19.4 ± 1.4 | 26.3 ± 1.8 | 16.6 ± 0.9 a |
| T3 | 22.8 ± 1.0 b | 3.4 ± 0.2 | 44.3 ± 1.3 | 1.7 ± 0.1 | 2.3 ± 0.1 | 2.2 ± 0.1 | 57.6 ± 2.2 | 12.7 ± 1.2 | 16.2 ± 0.5 | 22.7 ± 0.8 | 14.8 ± 0.3 ab |
| T4 | 21.8 ± 1.5 b | 3.8 ± 0.3 | 42.8 ± 2.8 | 1.8 ± 0.1 | 2.3 ± 0.3 | 2.3 ± 0.3 | 58.0 ± 4.1 | 13.1 ± 2.0 | 16.7 ± 1.3 | 24.6 ± 2.9 | 14.9 ± 1.3 ab |
| T5 | 28.7 ± 1.3 a | 4.2 ± 0.3 | 46.6 ± 2.8 | 2.1 ± 0.1 | 2.5 ± 0.2 | 2.5 ± 0.1 | 64.6 ± 1.2 | 13.9 ± 1.9 | 18.2 ± 0.9 | 26.7 ± 2.5 | 17.6 ± 1.0 a |
| p-value | 0.015 * | 0.125 NS | 0.260 NS | 0.073 NS | 0.257 NS | 0.488 NS | 0.154 NS | 0.430 NS | 0.062 | 0.563 NS | 0.018 * |
| Treatment | N | P | K | Ca | Mg | S | Fe | Cu | Mn | Zn | B |
| ______________________________(g kg−1)________________________________ | _____________________________(mg kg−1)_____________________________ | ||||||||||
| T1 | 24.2 ± 1.9 | 3.3 ± 0.3 | 38.1 ± 1.6 | 1.8 ± 0.2 | 2.4 ± 0.2 | 2.0 ± 0.2 | 73.9 ± 2.1 | 6.1 ± 0.8 | 17.0 ± 0.9 | 17.7 ± 1.5 b | 13.7 ± 0.6 |
| T2 | 24.6 ± 1.5 | 3.3 ± 0.1 | 35.9 ± 1.6 | 1.9 ± 0.1 | 2.4 ± 0.1 | 2.0 ± 0.1 | 74.1 ± 8.4 | 12.0 ± 2.3 | 17.4 ± 1.3 | 20.2 ± 1.0 b | 14.5 ± 0.6 |
| T3 | 25.2 ± 1.4 | 3.4 ± 0.3 | 38.5 ± 2.2 | 1.8 ± 0.2 | 2.5 ± 0.2 | 2.3 ± 0.2 | 73.0 ± 4.8 | 7.4 ± 1.0 | 16.4 ± 0.9 | 19.9 ± 1.3 b | 16.2 ± 0.7 |
| T4 | 26.9 ± 1.8 | 4.2 ± 0.4 | 43.1 ± 1.7 | 2.0 ± 0.2 | 2.7 ± 0.2 | 2.3 ± 0.2 | 86.4 ± 9.4 | 10.0 ± 1.6 | 18.9 ± 1.6 | 29.4 ± 2.8 a | 15.4 ± 1.9 |
| T5 | 24.5 ± 1.8 | 3.2 ± 0.3 | 37.9 ± 1.2 | 1.7 ± 0.2 | 2.4 ± 0.2 | 2.1 ± 0.1 | 77.7 ± 4.7 | 10.2 ± 2.5 | 16.2 ± 1.1 | 34.1 ± 3.1 a | 14.1 ± 0.6 |
| p-value | 0.772 NS | 0.149 NS | 0.102 NS | 0.885 NS | 0.592 NS | 0.495 NS | 0.638 NS | 0.119 NS | 0.592 NS | 0.001 * | 0.370 NS |
| Attributes | Values |
|---|---|
| pH in water | 4.8 |
| Soil organic matter (g kg−1) | 42.2 |
| Clay (g kg−1) | 570 |
| Silt (g kg−1) | 150 |
| Sand (g kg−1) | 280 |
| Available potassium (mg kg−1) | 767.31 |
| Available phosphorus (mg kg−1) | 3271.38 |
| Exchangeable calcium2+ (cmolc kg−1) | 7.73 |
| Exchangeable magnesium2+ (cmolc kg−1) | 1.25 |
| Available zinc (mg kg−1) | 30 |
| Available iron (mg kg−1) | 141.2 |
| Available manganese (mg kg−1) | 46.9 |
| Available copper (mg kg−1) | 4.37 |
| Available boron (mg kg−1) | 0.3 |
| Available sulfur (mg kg−1) | 261.7 |
| Treatment | Development Phase of Selenium Application and Rate (kg ha−1) |
|---|---|
| T1 | Control (without application of multi-nutrient fertilizer) |
| T2 | Beginning of flowering (2 kg ha−1 of multi-nutrient fertilizer providing 5 g of Se ha−1) |
| T3 | Beginning of flowering +3rd bunch (4 kg ha−1 of multi-nutrient fertilizer providing 10 g of Se ha−1) |
| T4 | Beginning of flowering +6th bunch (4 kg ha−1 of multi-nutrient fertilizer providing 10 g of Se ha−1) |
| T5 | Beginning of flowering +3rd bunch +6th bunch (6 kg ha−1 of multi-nutrient fertilizer providing 15 g of Se ha−1) |
Disclaimer/Publisher’s Note: The statements, opinions and data contained in all publications are solely those of the individual author(s) and contributor(s) and not of MDPI and/or the editor(s). MDPI and/or the editor(s) disclaim responsibility for any injury to people or property resulting from any ideas, methods, instructions or products referred to in the content. |
© 2024 by the authors. Licensee MDPI, Basel, Switzerland. This article is an open access article distributed under the terms and conditions of the Creative Commons Attribution (CC BY) license (https://creativecommons.org/licenses/by/4.0/).
Share and Cite
Morais, E.G.d.; Silva, M.A.; Quispe, A.P.V.; Machado, G.G.L.; Prado, D.T.; Benevenute, P.A.N.; Lima, J.d.S.; de Sousa, G.F.; de Barros Vilas Boas, E.V.; Guilherme, L.R.G. Foliar Sprays of Multi-Nutrient Fertilizer Containing Selenium Produce Functional Tomato Fruits with Higher Shelf Life. Plants 2024, 13, 2288. https://doi.org/10.3390/plants13162288
Morais EGd, Silva MA, Quispe APV, Machado GGL, Prado DT, Benevenute PAN, Lima JdS, de Sousa GF, de Barros Vilas Boas EV, Guilherme LRG. Foliar Sprays of Multi-Nutrient Fertilizer Containing Selenium Produce Functional Tomato Fruits with Higher Shelf Life. Plants. 2024; 13(16):2288. https://doi.org/10.3390/plants13162288
Chicago/Turabian StyleMorais, Everton Geraldo de, Maila Adriely Silva, Anyela Pierina Vega Quispe, Gilson Gustavo Lucinda Machado, Debora Teixeira Prado, Pedro Antônio Namorato Benevenute, Jucelino de Sousa Lima, Gustavo Ferreira de Sousa, Eduardo Valério de Barros Vilas Boas, and Luiz Roberto Guimarães Guilherme. 2024. "Foliar Sprays of Multi-Nutrient Fertilizer Containing Selenium Produce Functional Tomato Fruits with Higher Shelf Life" Plants 13, no. 16: 2288. https://doi.org/10.3390/plants13162288
APA StyleMorais, E. G. d., Silva, M. A., Quispe, A. P. V., Machado, G. G. L., Prado, D. T., Benevenute, P. A. N., Lima, J. d. S., de Sousa, G. F., de Barros Vilas Boas, E. V., & Guilherme, L. R. G. (2024). Foliar Sprays of Multi-Nutrient Fertilizer Containing Selenium Produce Functional Tomato Fruits with Higher Shelf Life. Plants, 13(16), 2288. https://doi.org/10.3390/plants13162288