
Validation of SNP Markers for Diversity Analysis, Quality Control, and Trait Selection in a Biofortified Cassava Population

 ,
,  , , , , and
Abstract
1. Introduction
2. Results
2.1. Phenotypic Data Analysis
2.2. Diversity Analyses Using DArTseq-Based SNP and Low-Density QC KASPTM Markers
2.2.1. Population Structure Analysis
2.2.2. Genetic Diversity
2.2.3. AMOVA and Population Differentiation
2.3. Evaluation of the Breeding Material Using Low-Density QC KASPTM Markers
2.4. Marker-Assisted Trait Selection
2.4.1. Marker Segregation and Marker Effects on the Traits
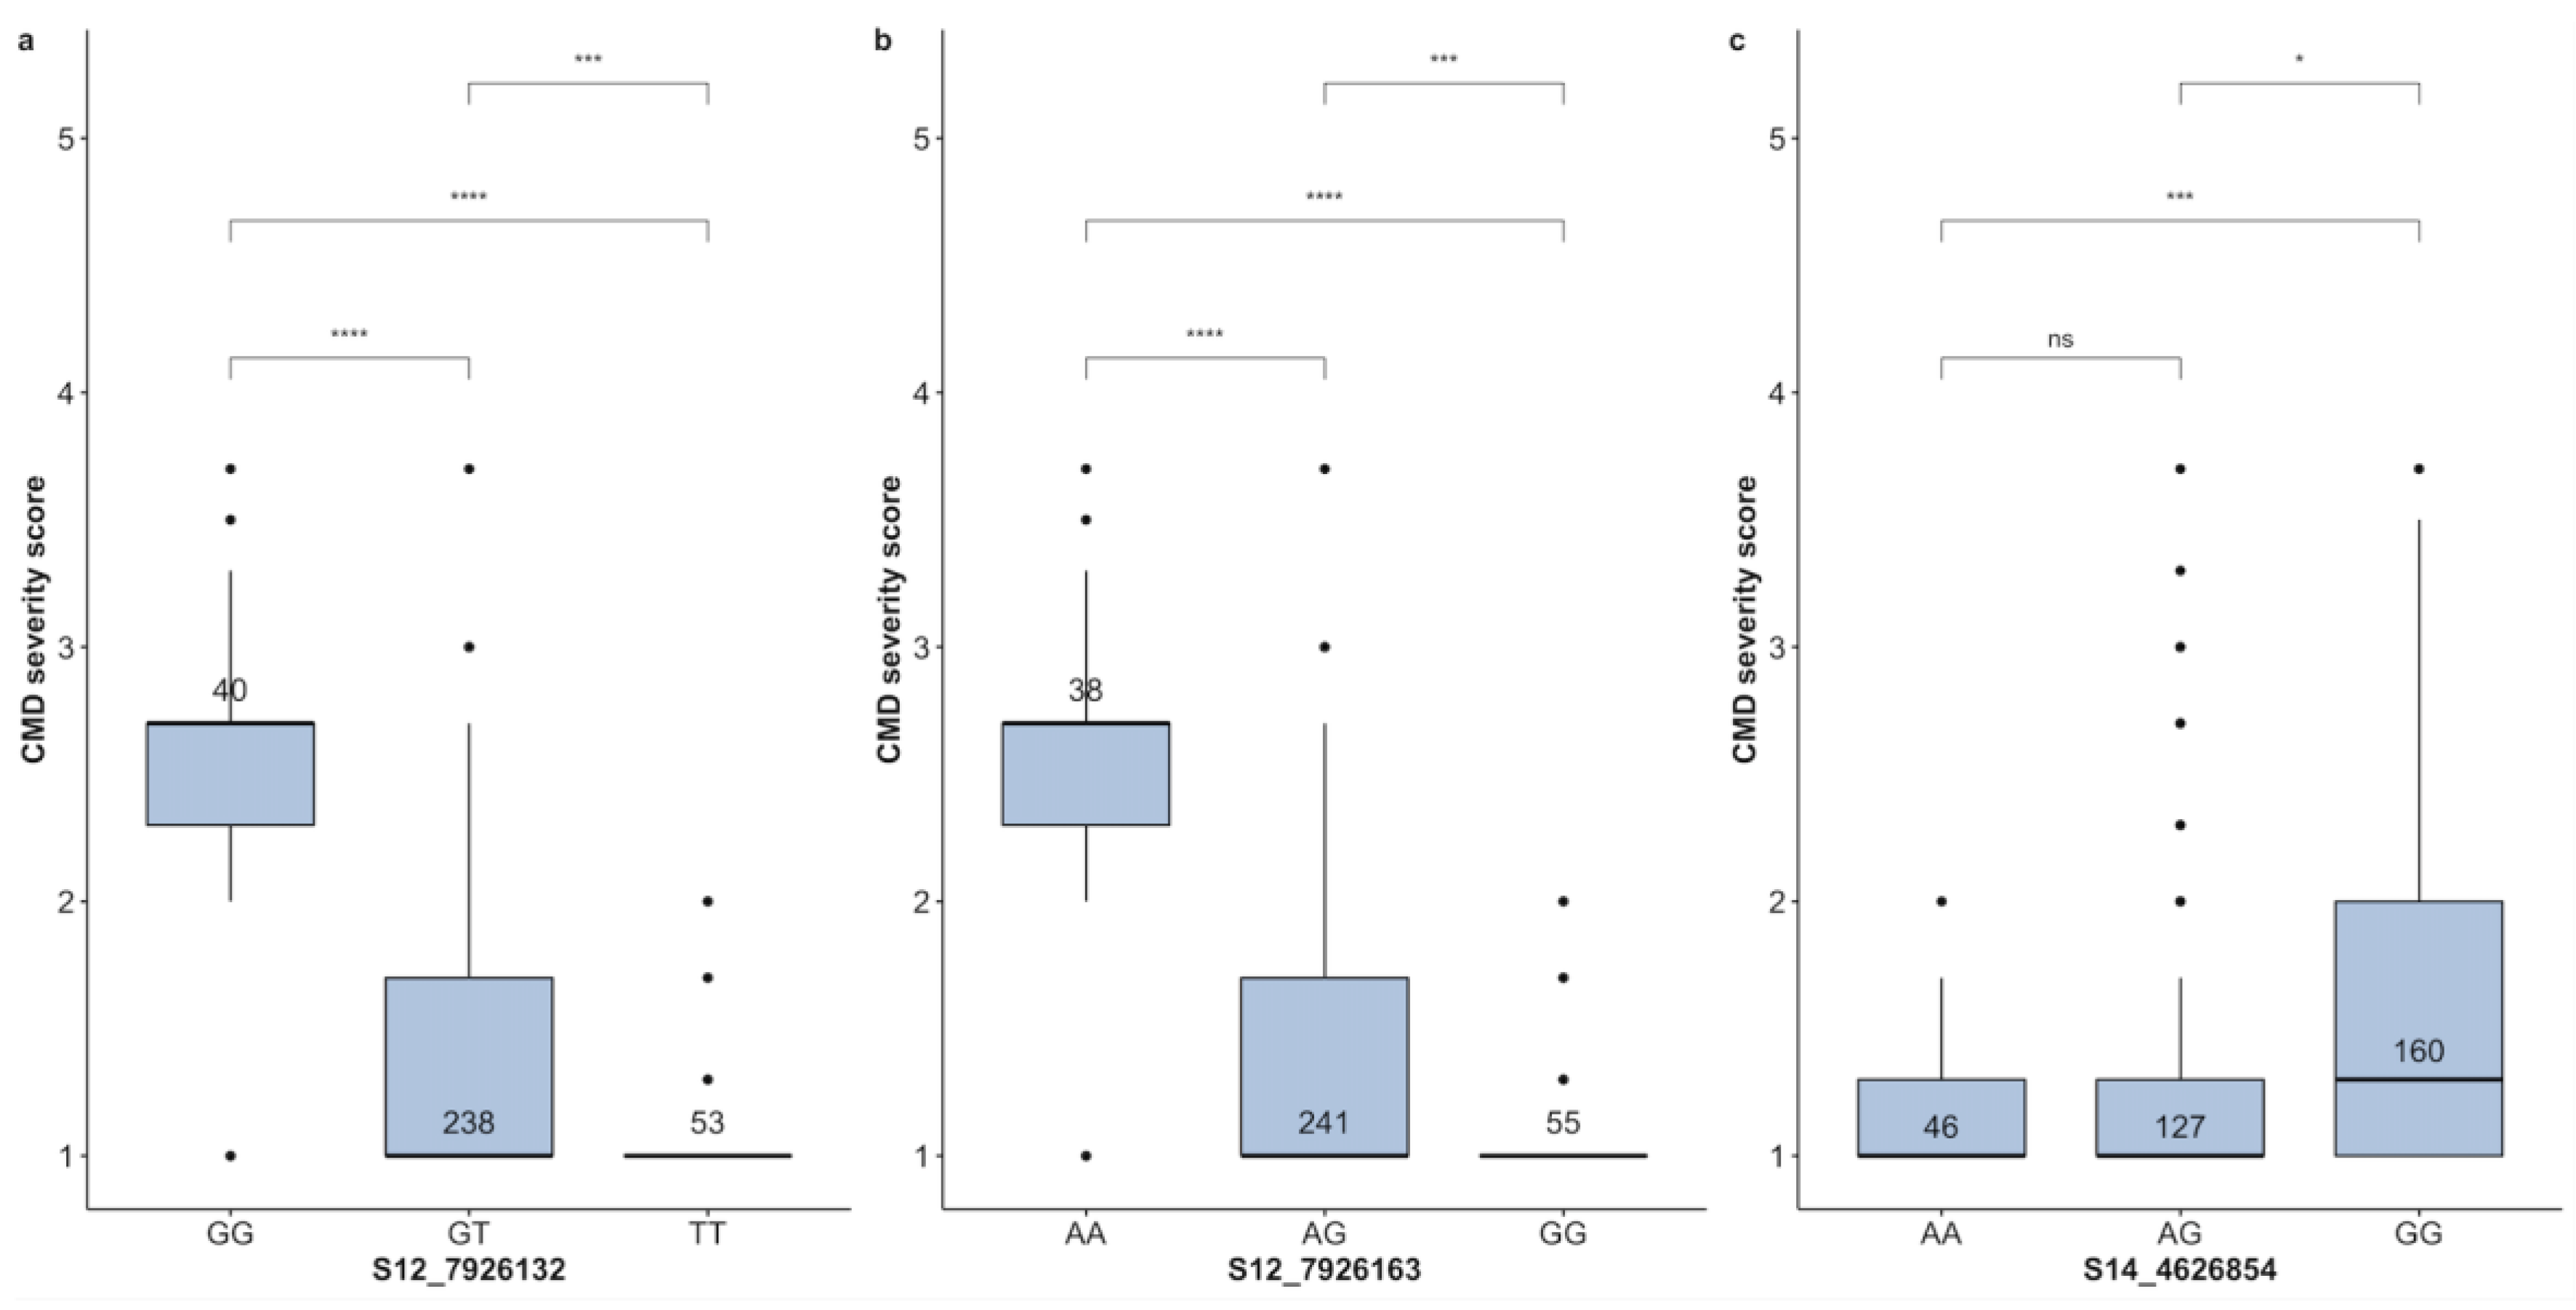
Cassava Mosaic Disease
Dry Matter Content
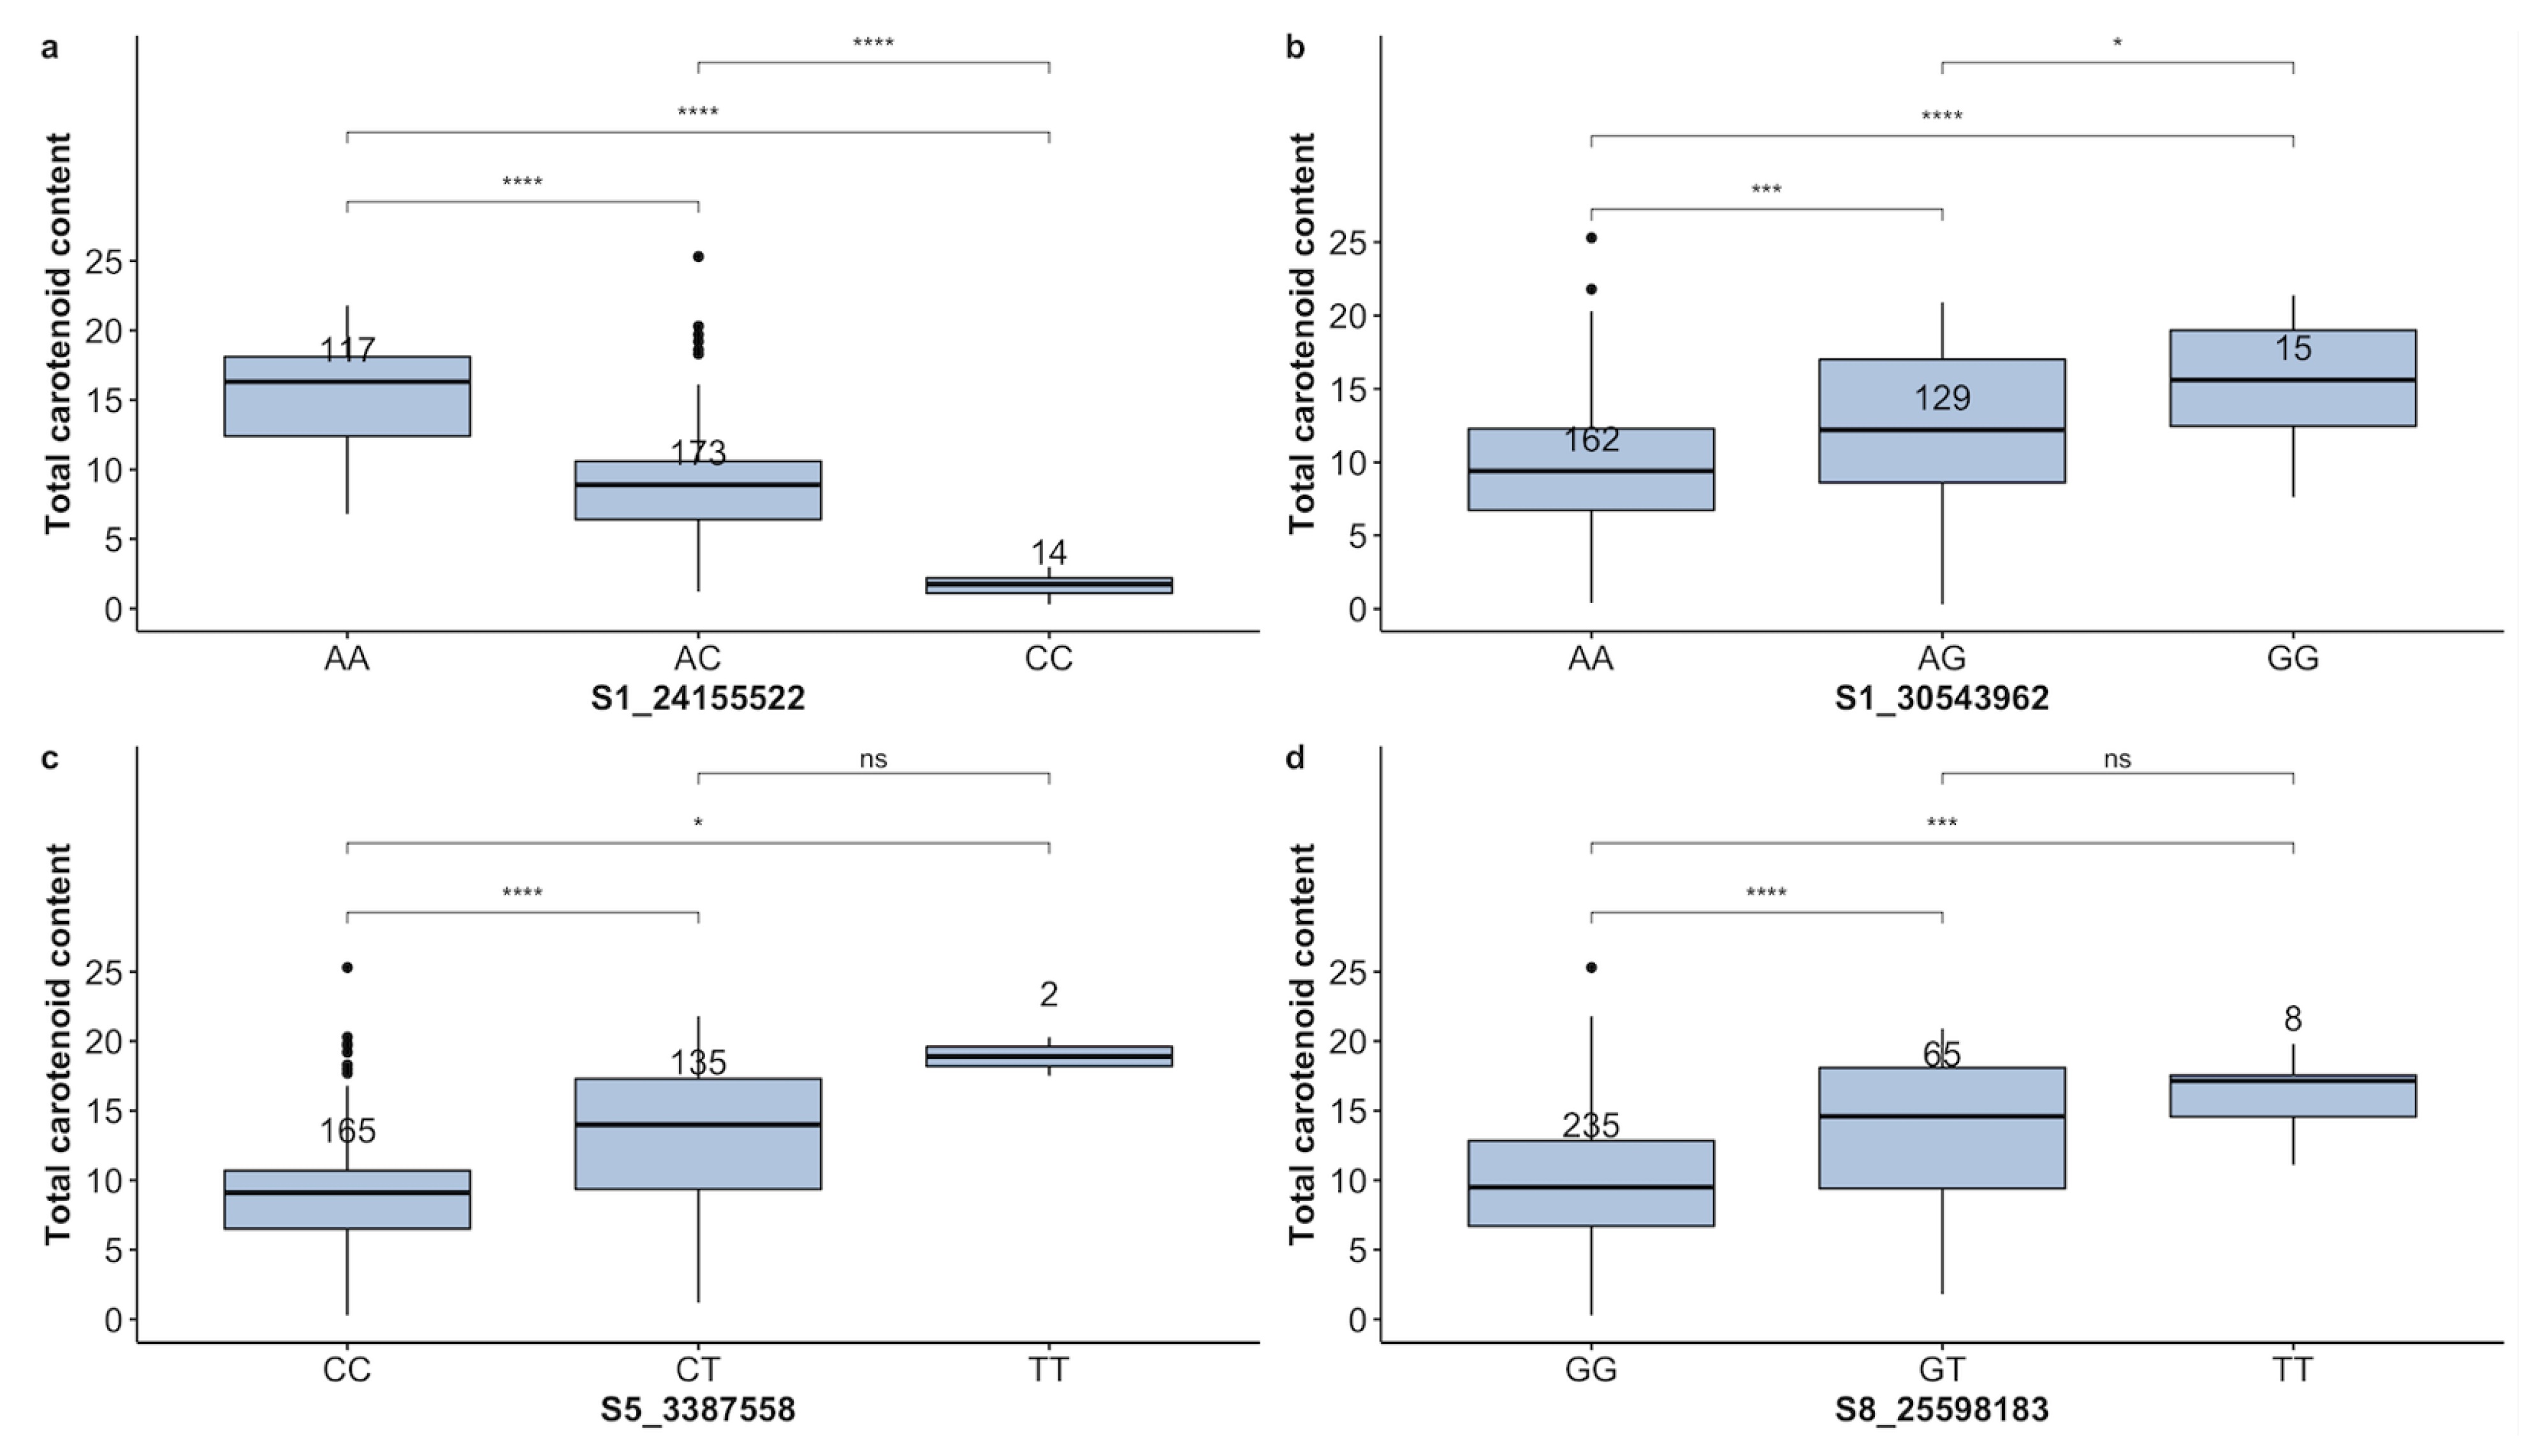
Provitamin A
2.4.2. Marker Quality Metrics
3. Discussion
4. Materials and Methods
4.1. Plant Materials
4.2. Phenotyping Evaluation
4.2.1. Cassava Mosaic Disease Severity
4.2.2. Dry Matter Content Measurement
4.2.3. Visual Evaluation of the Yellowness of the Root Parenchyma
4.2.4. Icheck Carotene™
4.3. Phenotypic Data Analysis
4.4. Leaf Sampling, Genotyping, and Quality Control Analyses
4.5. Diversity Analyses Using DArTseq-Based SNP Markers
4.5.1. Assessment of Population Structure
4.5.2. Estimates of Genetic Diversity Parameters, Analyses of Molecular Variance (AMOVA), and Population Differentiation
4.6. Comparative Analysis of DArTseq and Quality Control KASPTM Markers
4.7. Evaluation of Breeding Material Using Quality Control KASPTM Markers
4.8. Marker-Assisted Trait Selection
4.8.1. Marker Segregation and Marker Effects
4.8.2. Trait-Marker Quality
5. Conclusions
Supplementary Materials
Author Contributions
Funding
Data Availability Statement
Acknowledgments
Conflicts of Interest
References
- FAO. Cassava, a 21st Century Crop. In Save and Grow: Cassava, a Guide to Sustainable Production Intensification; Food and Agriculture Organization of the United Nations: Rome, Italy, 2013; pp. 1–18. [Google Scholar]
- Parmar, A.; Sturm, B.; Hensel, O. Crops that feed the world: Production and improvement of cassava for food, feed, and industrial uses. Food Secur. 2017, 9, 907–927. [Google Scholar] [CrossRef]
- Gillespie, S.; Hodge, J.; Yosef, S.; Pandya-lorch, R. Millions Nourishing in Nutrition; Story of change in nutrition; International Food Policy Research Institute: Washington, DC, USA, 2016; Available online: https://ebrary.ifpri.org/utils/getfile/collection/p15738coll2/id/130395/filename/130606.pdf (accessed on 14 March 2024).
- Stevens, G.A.; Beal, T.; Mbuya, M.N.N.; Luo, H.; Neufeld, L.M.; Addo, O.Y.; Adu-Afarwuah, S.; Alayón, S.; Bhutta, Z.; Brown, K.H.; et al. Micronutrient deficiencies among preschool-aged children and women of reproductive age worldwide: A pooled analysis of individual-level data from population-representative surveys. Lancet Glob. Health 2022, 10, e1590–e1599. [Google Scholar] [CrossRef]
- UN. Zero Hunger: Why It Matters. 2023. Available online: https://www.un.org/sustainabledevelopment/wp-content/uploads/2016/08/2_Why-It-Matters-2020.pdf (accessed on 14 March 2024).
- Gegios, A.; Amthor, R.; Maziya-Dixon, B.; Egesi, C.; Mallowa, S.; Nungo, R.; Gichuki, S.; Mbanaso, A.; Manary, M.J. Children consuming cassava as a staple food are at risk for inadequate zinc, iron, and vitamin A Intake. Plant Foods Hum. Nutr. 2010, 65, 64–70. [Google Scholar] [CrossRef]
- Wieser, S.; Brunner, B.; Tzogiou, C.; Plessow, R.; Zimmermann, M.B.; Farebrother, J.; Soofi, S.; Bhatti, Z.; Ahmed, I.; Bhutta, Z.A. Societal Costs of Micronutrient Deficiencies in 6- to 59-Month-Old Children in Pakistan. Food Nutr. Bull. 2017, 38, 485–500. [Google Scholar] [CrossRef]
- Bechoff, A. Use and Nutritional Value of Cassava Roots and Leaves as a Traditional Food; Burleigh Dodds Science: Cambridge, UK, 2017. [Google Scholar] [CrossRef]
- Garg, M.; Sharma, N.; Sharma, S.; Kapoor, P.; Kumar, A.; Chunduri, V.; Arora, P. Biofortified crops generated by breeding, agronomy, and transgenic approaches are improving lives of millions of people around the world. Front. Nutr. 2018, 5, 12. [Google Scholar] [CrossRef]
- Afolami, I.; Samuel, F.; Borgonjen-Van Den Berg, K.; Mwangi, M.N.; Kalejaiye, O.; Sanusi, R.A.; Putri, L.A.R.; Brivio, F.; Brouwer, I.D.; Melse-Boonstra, A. The contribution of provitamin A biofortified cassava to vitamin A intake in Nigerian pre-schoolchildren. Br. J. Nutr. 2021, 126, 1364–1372. [Google Scholar] [CrossRef]
- Devi, B.; Kumar, M.N.; Chutia, M.; Bhattacharyya, N. Abiotic and Biotic Stress Challenges of Cassava in Changing Climate and Strategies to Overcome: A Review. Sci. Hortic. 2022, 305, 111432. [Google Scholar] [CrossRef]
- Chikoti, P.C.; Mulenga, R.M.; Tembo, M.; Sseruwagi, P. Cassava mosaic disease: A review of a threat to cassava production in Zambia. J. Plant Pathol. 2019, 101, 467–477. [Google Scholar] [CrossRef]
- Houngue, J.A.; Pita, J.S.; Ngalle, H.B.; Zandjanakou-Tachin, M.; Kuate, A.F.; Todjro Cacaï, G.H.; Bell, J.M.; Ahanhanzo, C. Response of cassava cultivars to African cassava mosaic virus infection across a range of inoculum doses and plant ages. PLoS ONE 2019, 14, e0226783. [Google Scholar] [CrossRef]
- Houngue, J.A.; Houédjissin, S.S.; Ahanhanzo, C.; Pita, J.S.; Houndénoukon, M.S.E.; Zandjanakou-Tachin, M. Cassava mosaic disease (CMD) in Benin: Incidence, severity and its whitefly abundance from field surveys in 2020. Crop Prot. 2022, 158, 106007. [Google Scholar] [CrossRef]
- Bisimwa, E.; Walangululu, J.; Bragard, C. Cassava mosaic disease yield loss assessment under various altitude Agro ecosystems in the Sud Kivu region, Democratic Republic of Congo. Tropicultura 2015, 33, 101–110. [Google Scholar]
- Begna, T. Speed breeding to accelerate crop improvement. Int. J. Agric. Sci. Food Technol. 2022, 8, 178–186. [Google Scholar] [CrossRef]
- Rasheed, A.; Hao, Y.; Xia, X.; Khan, A.; Xu, Y.; Varshney, R.K.; He, Z. Crop breeding chips and genotyping platforms: Progress, challenges, and perspectives. Mol. Plant 2017, 10, 1047–1064. [Google Scholar] [CrossRef]
- Thomson, M.J. High-Throughput SNP Genotyping to Accelerate Crop Improvement. Plant Breed. Biotechnol. 2014, 2, 195–212. [Google Scholar] [CrossRef]
- Offornedo, Q.; Menkir, A.; Babalola, D.; Gedil, M. Developing and Deploying an Efficient Genotyping Workflow for Accelerating Maize Improvement in Developing Countries. Gates Open Res. 2022, 6, 3. [Google Scholar] [CrossRef]
- Gemenet, D.C.; Kitavi, M.N.; David, M.; Ndege, D.; Ssali, R.T.; Swanckaert, J.; Makunde, G.; Craig Yencho, G.; Gruneberg, W.; Carey, E.; et al. Development of diagnostic SNP markers for quality assurance and control in sweetpotato [Ipomoea batatas (L.) Lam.] breeding programs. PLoS ONE 2020, 15, e0232173. [Google Scholar] [CrossRef]
- Ongom, P.O.; Fatokun, C.; Togola, A.; Garcia-Oliveira, A.L.; Ng, E.H.; Kilian, A.; Lonardi, S.; Close, T.J.; Boukar, O. A Mid-density single-nucleotide polymorphism panel for molecular applications in cowpea (Vigna unguiculata (L.) Walp). Int. J. Genom. 2024, 2024, 1–19. [Google Scholar] [CrossRef]
- Shen, Y.; Wang, J.; Huifang, Z.; Zaas, Y.; Sheng, X.; Zhenqing, Z.; Zaas, Z.; Gu, H.-H. Development of KASP markers for germplasm characterization and fingerprinting identication of broccoli in China. Res. Sq. 2020. preprint. [Google Scholar] [CrossRef]
- Tang, W.; Lin, J.; Wang, Y.; An, H.; Chen, H.; Pan, G.; Zhang, S.; Guo, B.; Yu, K.; Li, H.; et al. Selection and validation of 48 KASP markers for variety identification and breeding guidance in conventional and hybrid rice (Oryza sativa L.). Rice 2022, 15, 48. [Google Scholar] [CrossRef]
- Rabbi, I.Y.; Kayondo, S.I.; Bauchet, G.; Yusuf, M.; Aghogho, C.I.; Ogunpaimo, K.; Uwugiaren, R.; Smith, I.A.; Peteti, P.; Agbona, A.; et al. Genome-wide association analysis reveals new insights into the genetic architecture of defensive, agro-morphological and quality-related traits in cassava. Plant Mol. Biol. 2020, 109, 195–213. [Google Scholar] [CrossRef]
- Endelman, J.B. Ridge regression and other kernels for genomic selection with R Package rrBLUP. Plant Genome 2011, 4, 250–255. [Google Scholar] [CrossRef]
- Okogbenin, E.; Porto, M.C.M.; Egesi, C.; Mba, C.; Espinosa, E.; Santos, L.G.; Ospina, C.; Marín, J.; Barrera, E.; Gutiérrez, J.; et al. Marker-assisted introgression of resistance to cassava mosaic disease into latin american germplasm for the genetic improvement of cassava in Africa. Crop Sci. 2007, 47, 1895–1904. [Google Scholar] [CrossRef]
- Esuma, W.; Kawuki, R.S.; Herselman, L.; Labuschagne, M.T. Diallel analysis of provitamin A carotenoid and dry matter content in cassava (Manihot esculenta Crantz). Breed. Sci. 2016, 66, 627–635. [Google Scholar] [CrossRef]
- Beyene, G.; Solomon, F.R.; Chauhan, R.D.; Gaitán-Solis, E.; Narayanan, N.; Gehan, J.; Siritunga, D.; Stevens, R.L.; Jifon, J.; Van Eck, J.; et al. Provitamin A biofortification of cassava enhances shelf life but reduces dry matter content of storage roots due to altered carbon partitioning into starch. Plant Biotechnol. J. 2018, 16, 1186–1200. [Google Scholar] [CrossRef]
- De Albuquerque, H.Y.G.; De Oliveira, E.J.; Brito, A.C.; De Andrade, L.R.B.; Do Carmo, C.D.; Morgante, C.V.; Vieira, E.A.; Moura, E.F.; Faleiro, F.G. Identification of duplicates in cassava germplasm banks based on single-nucleotide polymorphisms (SNPs). Sci. Agric. 2019, 76, 328–336. [Google Scholar] [CrossRef]
- Adjebeng-Danquah, J.; Manu-Aduening, J.; Asante, I.K.; Agyare, R.Y.; Gracen, V.; Offei, S.K. Genetic diversity and population structure analysis of Ghanaian and exotic cassava accessions using simple sequence repeat (SSR) markers. Heliyon 2020, 6, e03154. [Google Scholar] [CrossRef]
- Oyesigye, E.; Zacarias, A.; Mondjana, A.; Magaia, H.; Ferguson, M. Single nucleotide polymorphism (SNP) diversity of cassava genotypes in relation to cassava brown streak disease in Mozambique. Plant Genet. Resour. 2018, 16, 533–543. [Google Scholar] [CrossRef]
- Ferguson, M.E.; Shah, T.; Kulakow, P.; Ceballos, H. A global overview of cassava genetic diversity. PLoS ONE 2019, 14, e0224763. [Google Scholar] [CrossRef]
- Kawuki, R.S.; Herselman, L.; Labuschagne, M.T.; Nzuki, I.; Ralimanana, I.; Bidiaka, M.; Kanyange, M.C.; Gashaka, G.; Masumba, E.; Mkamilo, G.; et al. Genetic diversity of cassava (Manihot esculenta Crantz) landraces and cultivars from southern, eastern and central Africa. Plant Genet. Resour. 2013, 11, 170–181. [Google Scholar] [CrossRef]
- Moura, E.F.; Neto, J.T.D.F.; Sampaio, J.E.; Silva, D.T.D.; Ramalho, G.F. Identification of duplicates of cassava accessions sampled on the north region of Brazil using microsatellite markers. Acta Amaz. 2013, 43, 461–467. [Google Scholar] [CrossRef]
- Ogbonna, A.C.; Braatz de Andrade, L.R.; Mueller, L.A.; de Oliveira, E.J.; Bauchet, G.J. Comprehensive genotyping of a Brazilian cassava (Manihot Esculenta Crantz) germplasm bank: Insights into diversification and domestication. Theor. Appl. Genet. 2021, 134, 1343–1362. [Google Scholar] [CrossRef] [PubMed]
- Kante, M.; Lindqvist-Kreuze, H.; Portal, L.; David, M.; Gastelo, M. Kompetitive allele specific Pcr (Kasp) markers for potato: An effective tool for increased genetic gains. Agronomy 2021, 11, 2315. [Google Scholar] [CrossRef]
- Sochor, M.; Jemelkova, M.; Dolezalova, I. Phenotyping and SSR markers as a tool for identification of duplicates in lettuce germplasm. Czech J. Genet. Plant Breed. 2019, 55, 110–119. [Google Scholar] [CrossRef]
- Ertiro, B.T.; Ogugo, V.; Worku, M.; Das, B.; Olsen, M.; Labuschagne, M.; Semagn, K. Comparison of kompetitive allele specific PCR (KASP) and genotyping by sequencing (GBS) for quality control analysis in maize. BMC Genom. 2015, 16, 908. [Google Scholar] [CrossRef]
- Platten, J.D.; Cobb, J.N.; Zantua, R.E. Criteria for Evaluating Molecular Markers: Comprehensive quality metrics to improve marker-assisted selection. PLoS ONE 2019, 14, e0210529. [Google Scholar] [CrossRef]
- Arbelaez, J.D.; Dwiyanti, M.S.; Tandayu, E.; Llantada, K.; Jarana, A.; Ignacio, J.C.; Platten, J.D.; Cobb, J.; Rutkoski, J.E.; Thomson, M.J.; et al. 1k-RiCA (1K-Rice Custom Amplicon) a novel genotyping amplicon-based SNP assay for genetics and breeding applications in rice. Rice 2019, 12, 55. [Google Scholar] [CrossRef]
- Ige, A.D.; Olasanmi, B.; Mbanjo, E.G.N.; Kayondo, I.S.; Parkes, E.Y.; Kulakow, P.; Egesi, C.; Bauchet, G.J.; Ng, E.; Lopez-Lavalle, L.A.B.; et al. Conversion and validation of uniplex Snp markers for selection of resistance to cassava mosaic disease in cassava breeding programs. Agronomy 2021, 11, 420. [Google Scholar] [CrossRef]
- Ige, A.D.; Olasanmi, B.; Bauchet, G.J.; Kayondo, I.S.; Mbanjo, E.G.N.; Uwugiaren, R.; Motomura-Wages, S.; Norton, J.; Egesi, C.; Parkes, E.Y.; et al. Validation of KASP-SNP Markers in Cassava Germplasm for Marker-Assisted Selection of Increased Carotenoid Content and Dry Matter Content. Front. Plant Sci. 2022, 13, 1016170. [Google Scholar] [CrossRef]
- Esuma, W.; Eyoo, O.; Gwandu, F.; Mukasa, S.; Alicai, T.; Ozimati, A.; Nuwamanya, E.; Rabbi, I.; Kawuki, R. Validation of KASP markers associated with cassava mosaic disease resistance, storage root dry matter and provitamin A carotenoid contents in Ugandan cassava germplasm. Front. Plant Sci. 2022, 13, 1017275. [Google Scholar] [CrossRef]
- Książkiewicz, M.; Wójcik, K.; Irzykowski, W.; Bielski, W.; Rychel, S.; Kaczmarek, J.; Plewi, P.; Rudy, E.; Jędryczka, M. Validation of diaporthe toxica resistance markers in european Lupinus angustifolius germplasm and identification of novel resistance donors for marker-assisted selection. J. Appl. Genet. 2020, 61, 1–12. [Google Scholar] [CrossRef]
- Javid, M.; Rosewarne, G.M.; Sudheesh, S.; Kant, P.; Leonforte, A.; Lombardi, M.; Kennedy, P.R.; Cogan, N.O.I.; Slater, A.T.; Kaur, S. Validation of molecular markers associated with boron tolerance, powdery mildew resistance and salinity tolerance in field peas. Front. Plant Sci. 2015, 6, 917. [Google Scholar] [CrossRef] [PubMed]
- Hayes, B.J.; Chamberlain, A.J.; McPartlan, H.; MacLeod, I.; Sethuraman, L.; Goddard, M.E. Accuracy of marker-assisted selection with single markers and marker haplotypes in cattle. Genet. Res. 2007, 89, 215–220. [Google Scholar] [CrossRef] [PubMed]
- Salgotra, R.K.; Neal Stewart, C. Functional markers for precision plant breeding. Int. J. Mol. Sci. 2020, 21, 4972. [Google Scholar] [CrossRef] [PubMed]
- Rabbani, M.T.; Nayak, G. Recruiting distant hybridization for reshaping meiotic recombination. Plant Breed. Biotechnol. 2023, 11, 168–184. [Google Scholar] [CrossRef]
- Singh, L.; Anderson, J.A.; Chen, J.; Gill, B.S.; Tiwari, V.K.; Rawat, N. Development and validation of a perfect KASP marker for fusarium head blight resistance gene Fhb1 in wheat. Plant Pathol. J. 2019, 35, 200–207. [Google Scholar] [CrossRef] [PubMed]
- Yang, H.; Jian, J.; Li, X.; Renshaw, D.; Clements, J.; Sweetingham, M.W.; Tan, C.; Li, C. Application of whole genome re-sequencing data in the development of diagnostic DNA markers tightly linked to a disease-resistance locus for marker-assisted selection in lupin (Lupinus angustifolius). BMC Genom. 2015, 16, 660. [Google Scholar] [CrossRef] [PubMed]
- Ariyoshi, C.; Sera, G.H.; Rodrigues, L.M.R.; Carvalho, F.G.; Shigueoka, L.H.; Mendonça, A.E.S.; Pereira, C.T.M.; Destefano, S.A.L.; Pereira, L.F.P. Development and validation of an allele-specific marker for resistance to bacterial halo blight in coffea arabica. Agronomy 2022, 12, 3178. [Google Scholar] [CrossRef]
- Xiao, Y.; Jiang, S.; Cheng, Q.; Wang, X.; Yan, J.; Zhang, R.; Qiao, F.; Ma, C.; Luo, J.; Li, W.; et al. The genetic mechanism of heterosis utilization in maize improvement. Genome Biol. 2021, 22, 148. [Google Scholar] [CrossRef] [PubMed]
- IITA. Cassava in Tropical Africa. A Reference Mannual. 1990. Available online: https://www.iita.org/wp-content/uploads/2016/06/Cassava_in_tropical_Africa_a_reference_manual_1990.pdf (accessed on 14 March 2024).
- Chávez, A.L.; Sánchez, T.; Jaramillo, G.; Bedoya, J.M.; Echeverry, J.; Bolaños, E.A.; Ceballos, H.; Iglesias, C.A. Variation of quality traits in cassava roots evaluated in landraces and improved clones. Euphytica 2005, 143, 125–133. [Google Scholar] [CrossRef]
- Grosjean, P.; Frederic, I.; Etienne, M. Package “Pastecs”: Package for Analysis of Space-Time Ecological Series. 2018. Available online: https://cran.r-project.org/web/packages/pastecs/pastecs.pdf (accessed on 14 March 2024).
- Harrell, F.E.J.; Dupont, H.; Al, E. Package “Hmisc”. 2024. Available online: https://cran.r-project.org/web/packages/Hmisc/Hmisc.pdf (accessed on 14 March 2024).
- Bradbury, P.J.; Zhang, Z.; Kroon, D.E.; Casstevens, T.M.; Ramdoss, Y.; Buckler, E.S. TASSEL: Software for association mapping of complex traits in diverse samples. Bioinformatics 2007, 23, 2633–2635. [Google Scholar] [CrossRef]
- Purcell, S.; Neale, B.; Todd-Brown, K.; Thomas, L.; Ferreira, M.A.R.; Bender, D.; Maller, J.; Sklar, P.; De Bakker, P.I.W.; Daly, M.J.; et al. PLINK: A tool set for whole-genome association and population-based linkage analyses. Am. J. Hum. Genet. 2007, 81, 559–575. [Google Scholar] [CrossRef]
- Paradis, E.; Claude, J.; Strimmer, K. APE: Analyses of phylogenetics and evolution in R language. Bioinformatics 2004, 20, 289–290. [Google Scholar] [CrossRef]
- RStudio Team. RStudio: Integrated Development for R; RStudio, Inc.: Boston, MA, USA, 2016; Available online: http://www.rstudio.com/ (accessed on 17 March 2023).
- Alexander, D.H.; Lange, K. Enhancements to the ADMIXTURE algorithm for individual ancestry estimation. BMC Bioinform. 2011, 12, 246. [Google Scholar] [CrossRef]
- Lê, S.; Josse, J.; Husson, F. FactoMineR: An R package for multivariate analysis. J. Stat. Softw. 2008, 25, 1–18. [Google Scholar] [CrossRef]
- Jombart, T. Adegenet: A R package for the multivariate analysis of genetic markers. Bioinformatics 2008, 24, 1403–1405. [Google Scholar] [CrossRef]
- Goudet, J. Hierfstat, a package for R to compute and test hierarchical F-statistics. Mol. Ecol. Notes 2005, 5, 184–186. [Google Scholar] [CrossRef]
- Weir, B.S.; Goudet, J. A Unified characterization of population structure and relatedness. Genetics 2017, 206, 2085–2103. [Google Scholar] [CrossRef]
- Kamvar, Z.N.; Tabima, J.F.; Grunwald, N.J. Poppr: An R package for genetic analysis of populations with clonal, partially clonal, and/or sexual reproduction. PeerJ 2014, 2, e281. [Google Scholar] [CrossRef]
- Kassambara, A. Package “Ggpubr”. 2023. Available online: https://cran.r-project.org/web/packages/ggpubr/ggpubr.pdf (accessed on 4 April 2024).


| Ho | He | Fis | Ar | Fst | CI_2.5% | CI_97.5% | |
|---|---|---|---|---|---|---|---|
| K2-Cluster1 | 0.29 | 0.37 | 0.19 | 2.37 | 0.04 | 0.04 | 0.05 |
| K2-Cluster2 | 0.26 | 0.33 | 018 | 2.29 | 0.13 | 0.13 | 0.14 |
| 92 samples (overall) | 0.28 | 0.37 | 0.25 | 0.09 | 0.09 | 0.09 | |
| CIAT | 0.29 | 0.35 | 0.13 | 2.18 | 0.09 | 0.08 | 0.096 |
| IITA | 0.27 | 0.34 | 0.20 | 2.31 | 0.10 | 0.09 | 0.11 |
| Hawaii | 0.28 | 0.36 | 0.18 | 2.29 | 0.06 | 0.06 | 0.09 |
| 89 samples (overall) | 0.28 | 0.37 | 0.21 | 0.08 | 0.08 | 0.09 |
| Source of Variation | Degree of Freedom | Sum of Squares | Mean Sum of Square | Estimate Variance | % of Variation | |
|---|---|---|---|---|---|---|
| K = 2 | Between cluster | 1 | 21,438.06 | 21,438.064 | 217.01 | 8.50 |
| Between genotypes within cluster | 90 | 254,892.12 | 2832.135 | 496.22 | 19.44 | |
| Within genotypes | 92 | 169,251.00 | 1839.685 | 1839.68 | 72.06 | |
| Total | 183 | 445,581.18 | 2434.870 | 2552.92 | 100.00 | |
| Seed sources | Between seed sources | 2 | 29,880.2 | 14,940.10 | 208.40 | 8.30 |
| Between genotypes within seed sources | 86 | 237,676.4 | 2763.68 | 462.08 | 18.41 | |
| Within genotypes | 89 | 163,717.0 | 1839.52 | 1839.52 | 73.29 | |
| Total | 177 | 431,273.6 | 2436.57 | 2510.00 | 100 |
| Trait | Markers | Favorable Allele | Homozygous Minor Allele | Heterozygous | Homozygous Major Allele | % Homozygous Minor Allele | % Heterozygous | % Homozygous Major Allele | FPR (%) | FNR (%) |
|---|---|---|---|---|---|---|---|---|---|---|
| CMD | S12-7926132 | T | GG | GT | TT | 40 | 238 | 53 | 42.59 | 3.28 |
| CMD | S12-7926163 | G | AA | AG | GG | 38 | 241 | 55 | 44.23 | 3.23 |
| CMD | S14-4626854 | A | AA | AG | GG | 46 | 127 | 160 | 26.42 | 43.32 |
| DMC | S1-24197219 | C | CC | CT | TT | 17 | 160 | 142 | 17.33 | 32.79 |
| DMC | S6-20589894 | G | GG | AG | AA | 67 | 178 | 72 | 72.00 | 21.07 |
| DMC | S12-5524524 | C | CC | CT | TT | 52 | 177 | 71 | 75.00 | 23.35 |
| TCC | S1-24155522 | A | CC | AC | AA | 14 | 173 | 117 | 55.88 | − |
| TCC | S1-30543962 | G | GG | AG | AA | 15 | 129 | 162 | 52.17 | 48.81 |
| TCC | S5-3387558 | T | TT | CT | CC | 2 | 135 | 165 | 36.96 | 53.56 |
| TCC | S8-25598183 | T | TT | GT | GG | 8 | 65 | 235 | 19.57 | 73.99 |
Disclaimer/Publisher’s Note: The statements, opinions and data contained in all publications are solely those of the individual author(s) and contributor(s) and not of MDPI and/or the editor(s). MDPI and/or the editor(s) disclaim responsibility for any injury to people or property resulting from any ideas, methods, instructions or products referred to in the content. |
© 2024 by the authors. Licensee MDPI, Basel, Switzerland. This article is an open access article distributed under the terms and conditions of the Creative Commons Attribution (CC BY) license (https://creativecommons.org/licenses/by/4.0/).
Share and Cite
Mbanjo, E.G.N.; Ogungbesan, A.; Agbona, A.; Akpotuzor, P.; Toyinbo, S.; Iluebbey, P.; Rabbi, I.Y.; Peteti, P.; Wages, S.A.; Norton, J.; et al. Validation of SNP Markers for Diversity Analysis, Quality Control, and Trait Selection in a Biofortified Cassava Population. Plants 2024, 13, 2328. https://doi.org/10.3390/plants13162328
Mbanjo EGN, Ogungbesan A, Agbona A, Akpotuzor P, Toyinbo S, Iluebbey P, Rabbi IY, Peteti P, Wages SA, Norton J, et al. Validation of SNP Markers for Diversity Analysis, Quality Control, and Trait Selection in a Biofortified Cassava Population. Plants. 2024; 13(16):2328. https://doi.org/10.3390/plants13162328
Chicago/Turabian StyleMbanjo, Edwige Gaby Nkouaya, Adebukola Ogungbesan, Afolabi Agbona, Patrick Akpotuzor, Seyi Toyinbo, Peter Iluebbey, Ismail Yusuf Rabbi, Prasad Peteti, Sharon A. Wages, Joanna Norton, and et al. 2024. "Validation of SNP Markers for Diversity Analysis, Quality Control, and Trait Selection in a Biofortified Cassava Population" Plants 13, no. 16: 2328. https://doi.org/10.3390/plants13162328
APA StyleMbanjo, E. G. N., Ogungbesan, A., Agbona, A., Akpotuzor, P., Toyinbo, S., Iluebbey, P., Rabbi, I. Y., Peteti, P., Wages, S. A., Norton, J., Zhang, X., Bohórquez-Chaux, A., Mushoriwa, H., Egesi, C., Kulakow, P., & Parkes, E. (2024). Validation of SNP Markers for Diversity Analysis, Quality Control, and Trait Selection in a Biofortified Cassava Population. Plants, 13(16), 2328. https://doi.org/10.3390/plants13162328