Article

Short-Term Effect of the Combined Application of Rice Husk Biochar and Organic and Inorganic Fertilizers on Radish Growth and Nitrogen Use Efficiency

by
War War Mon
1 and
Hideto Ueno
2,*
1
Department of Bioresource Production Science, United Graduate School of Agriculture, Ehime University, 3-5-7 Tarumi, Matsuyama 790-8566, Ehime, Japan
2
Department of Agro-Biological Science, Graduate School of Agriculture, Ehime University, 3-5-7 Tarumi, Matsuyama 790-8566, Ehime, Japan
*
Author to whom correspondence should be addressed.
Plants 2024, 13(17), 2376; https://doi.org/10.3390/plants13172376
Submission received: 31 July 2024 / Revised: 20 August 2024 / Accepted: 24 August 2024 / Published: 26 August 2024

Abstract

:
Research on soil biochar fertilization has mainly been conducted on cereal crops, and information on its potential for radish production remains inconsistent. Therefore, a pot experiment was conducted to examine the short-term effects of rice husk biochar on radish growth and nitrogen use efficiency (NUE). An investigation was conducted with two application rates of biochar alone, (10 t ha−1 (B10) and 25 t ha−1 (B25), and biochar + chicken manure application with and without NPK fertilizer. The results indicated that the application of biochar 25 t ha−1 + chicken manure (B25:CHM) and the combination of biochar 25 t ha−1 + chicken manure + NPK fertilizer (B25:CHM:NPK) significantly increased root yield by improving NUE, fertilizer recovery efficiency (REN), agronomic efficiency (AE), nitrogen harvest index (NHI), and retaining soil NH4+-N. Although biochar application alone did not significantly influence radish growth on a short-term basis, B10 and B25 increased root yields by 10% and 20%, respectively, compared with the control. Notably, the role of biochar application when combined with organic and inorganic fertilizers was to retain fertilizer N and promote N uptake efficiency by radishes, as higher rates of biochar resulted in higher NUE. Our results suggest that B25:CHM is a suitable combination for organic farming.

1. Introduction

With concerns about climate change, extreme weather conditions, and the lack of arable land, crop production must be safeguarded to mitigate potential food crises [1]. Despite the importance of crop production, soil organic matter (SOM) in most agricultural soils is estimated to be depleted [2]. Although nitrogen (N) is an important nutrient and essential element for plant growth, it is not sustainable to apply synthetic N fertilizers to soils with physical degradation and low fertility because it can cause acidification and nutrient imbalances [3]. If N fertilizers are applied far beyond the demands of crops, this results in low N-use efficiency and large nitrate residues in the soil [4]. Therefore, restitution of soil organic matter (SOM) by increasing N-use efficiency is important for sustainable crop production, particularly in low-fertility soils.
Amendment of soil with biochar can serve as a tool for storing soil organic carbon because biochar is a carbon-rich material [5]. The conversion of wastes such as rice husk into biochar facilitates energy production and recycles wastes, thereby improving sustainable waste management [6,7]. Interest in biochar application is widespread and stems from observations of old agricultural soils in the Amazon Basin, called Terra Preta. Compared to neighboring natural soils, these soils are much more fertile and contain a higher level of carbon [8]. These observations led to the pyrolysis of a wide range of feedstocks at different temperatures under oxygen-limited conditions to produce biochar [9,10]. This manufacturing process produces biochar with desirable properties, such as a high surface area, high porosity, rich functional groups, and high cation exchange capacity (CEC) [11]. Due to these unique properties of biochar, it would be an eco-friendly solution focusing on environmental sustainability to address the problem of soil contamination, organic pollutants, and greenhouse gas emissions [12,13].
Currently, the combined application of biochar and organic fertilizers has given rise to a growing interest in agricultural production [14]. Livestock manure is one of the most effective substitutes for synthetic fertilizers [15]. They can be applied either directly (fresh) or after composting [16]. Generally, composting reduces some chemical and biological risks related to organic amendments [17]. Stable compost products made from organic wastes are rich in humus, which is beneficial for organic fertilizers [18]. Organic fertilizers can improve the biological, physical, and chemical properties of soil, as well as provide beneficial effects on agriculture [19]. Among organic fertilizers, chicken manure is commonly used in agriculture and is a nutrient-rich organic waste containing considerable amounts of N, phosphorus, and potassium [20]. In addition, a previous study indicated that biochar and N fertilizer had significant interactions at higher yields with increasing rates of biochar application with NPK fertilizer [21]. Thus, the combined application of biochar and either organic or inorganic fertilizer is expected to enhance soil fertility and provide nutrients to short-season crops with high nutrient requirements, such as radish.
Radish (Raphanus sativus L.) is grown and consumed worldwide, and many colors are available (red, purple, black, yellow, and white through pink). Radishes are typically consumed raw as crunchy vegetables, primarily in salad [22]. It is generally rich in carbohydrates, sugars, dietary fibers, proteins, fat, and fluoride. They contain water-soluble vitamins and minerals. Therefore, it has been recognized as beneficial to human health [23]. Moreover, radish is a good option for small-scale farmers because they pay back in approximately 30 days [24]. Radish is not only a short-cycle crop but also a highly nutrient-demanding crop. Therefore, the co-application of fertilizers with organic amendments, such as biochar, is required to avoid rapid nutrient losses [25]. In addition, more research is needed to fully understand the effect of the application of biochar separately or together with different nitrogen sources on the nitrogen use efficiency of crops [26]. To date, research on soil biochar fertilization has mainly been conducted on cereal crops [14,27]. The nutritional effects of biochar on short-cycle crops are inconsistent. Sousa et al. [24] reported that biochar application alone can supply nutrients in a short period of time, resulting in increased radish productivity. In contrast, some results indicated that the expected benefit of biochar alone without poultry manure may not be achieved within the first year of radish cultivation [28]. To address this research gap, we conducted a pot experiment to examine the effect of biochar in sole and its combined effect with organic and inorganic fertilizers on radish yield, N-use efficiency, and soil chemical properties on a short-term basis.

2. Results

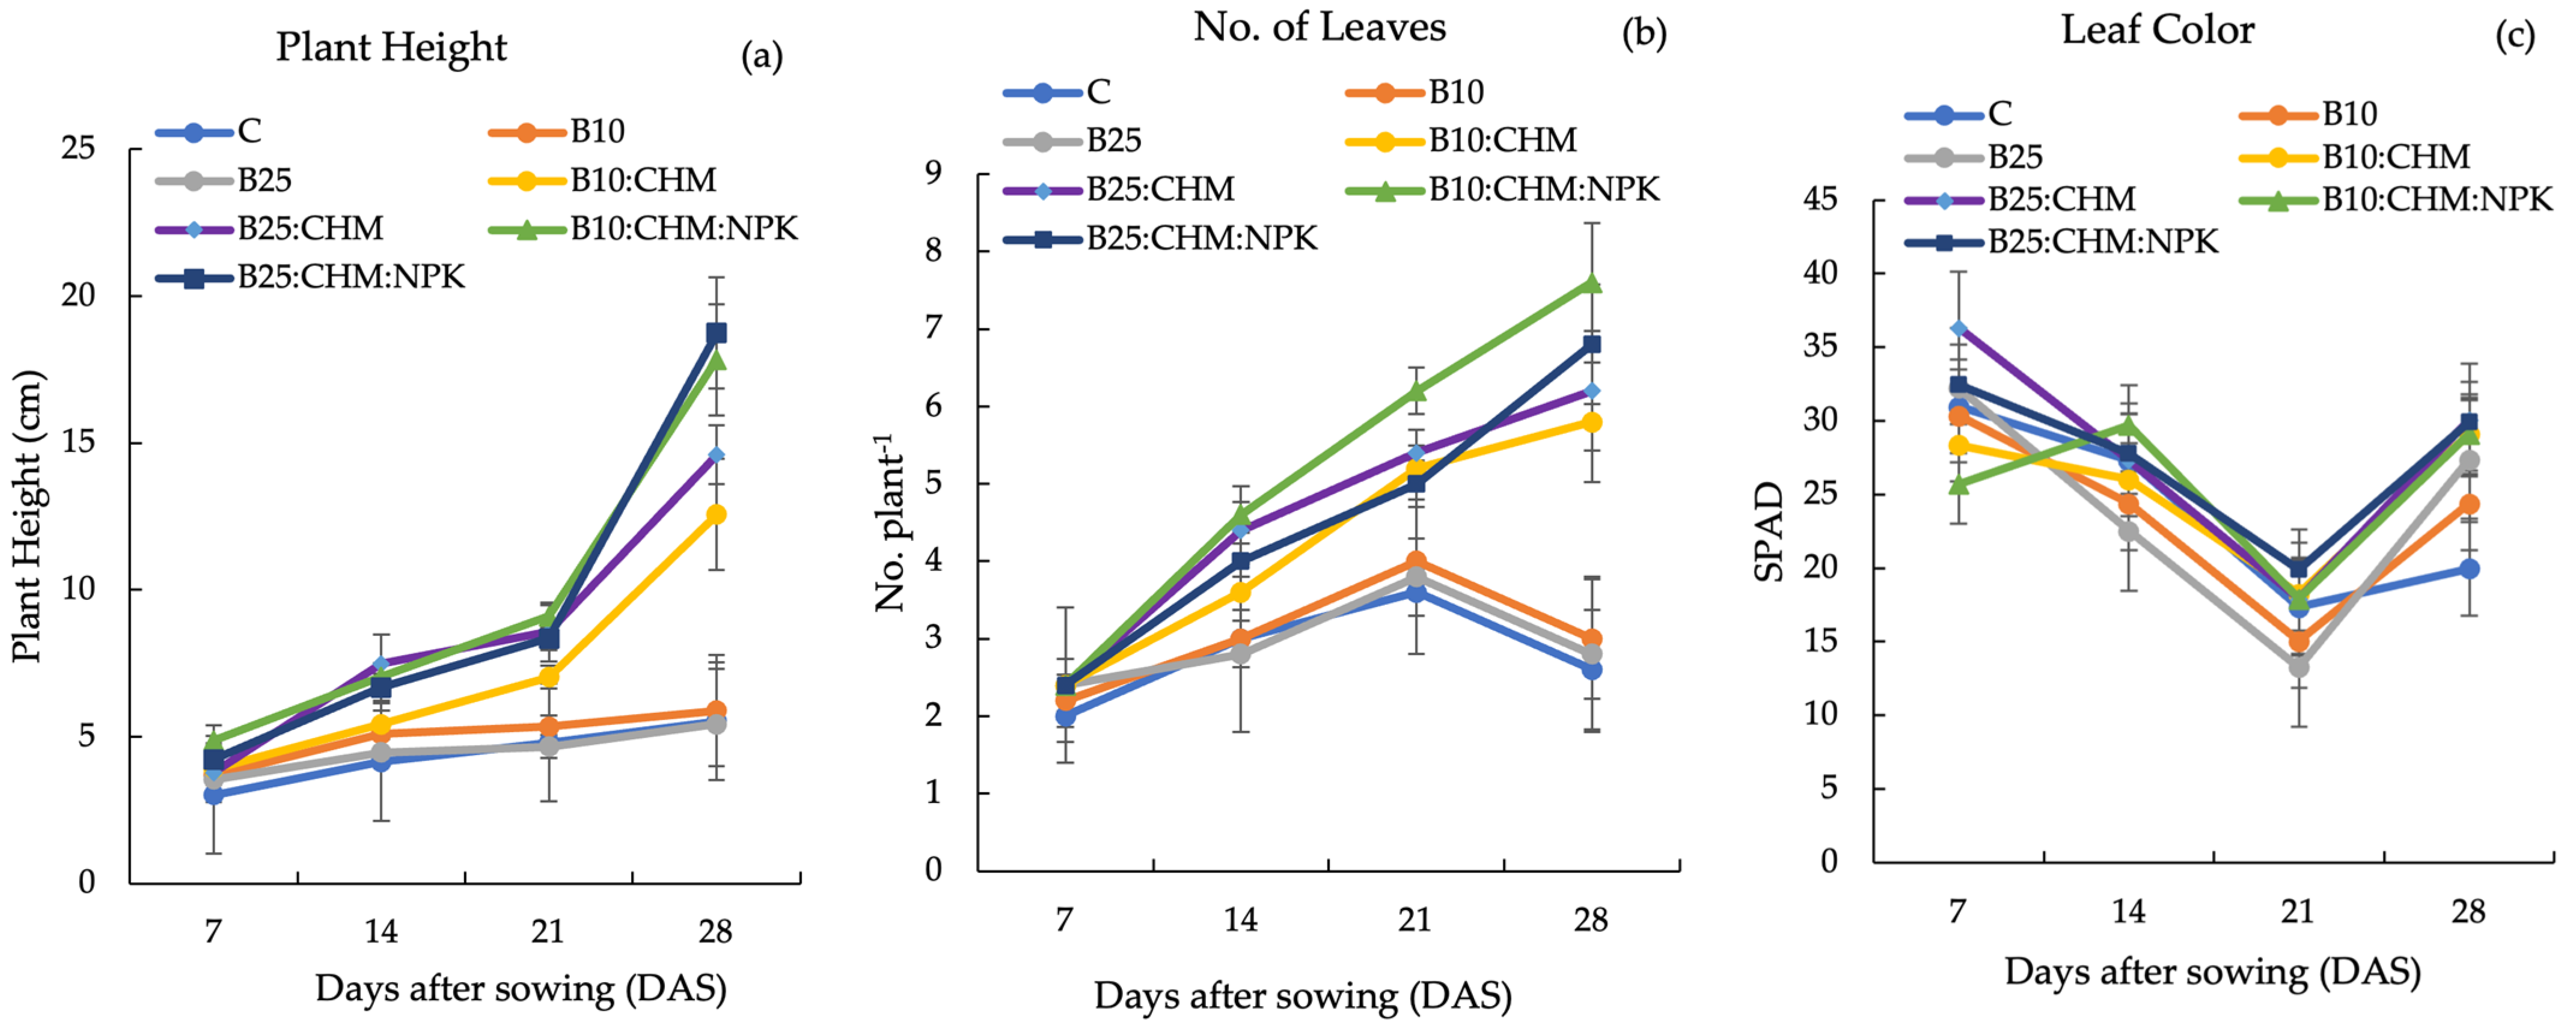
2.1. Plant Growth of Radish under Various Treatments

Our experiments involved measuring radish growth using several parameters such as plant height, number of leaves, and leaf color. As shown in Figure 1a, plant height varied from 3.02 cm to 18.7 cm throughout the growth stage. Plant height increased steadily from 7 days after sowing (DAS), and then B10:CHM, B25:CHM, B10:CHM:NPK, and B25:CHM:NPK increased sharply at 21 DAS. Among the various treatments, B10: CHM: NPK and B25: CHM: NPK showed significant heights at 28 DAS, whereas B25 showed the lowest height, similar to that of C and B10. The number of leaves increased from 7 to 28 DAS under various treatments, except for the C, B10, and B25 treatments, which decreased at 28 DAS (Figure 1b). The highest number of leaves was recorded for B10:CHM:NPK (7.6), and the lowest number was recorded for C (2.6). Regarding chlorophyll content, the SPAD value varied from 13.3 to 36.3 during the entire growth period. As shown in Figure 1c, there was a decreasing trend, which gradually decreased from 7 to 21 DAS and then increased at 28 DAS; however, the differences among the treatments were not significant.

2.2. Germination and Radish Yield Response to Different Treatments

The germination rates and radish yields are compared in Table 1. Seed germination began on the third day after sowing, and the highest germination rate was observed in the B25:CHM:NPK treatment, which induced 100% germination. The lowest germination rates were recorded for B10. No significant differences in germination rate were detected across treatments. Compared to C, B10 reduced the germination rate by 0.41%, whereas B25, B10:CHM, B25:CHM, and B10:CHM:NPK increased the germination rate by 27.3%, and B25:CHM:NPK increased the germination rate by 36.4%. The data revealed that there was a significant effect of the different treatments on both the radish yield and dry biomass of leaves and roots. The maximum leaf yield was observed in B10:CHM:NPK, followed by B25:CHM:NPK, B25:CHM, B10:CHM, B25, B10, and C. However, B10:CHM:NPK and B25:CHM:NPK were not significantly different in leaf yield. The lowest leaf yield was obtained with C; however, it was not significantly different from that of B10 and B25. The same trend was observed for leaf dry biomass weight (B10:CHM:NPK > B25:CHM:NPK > B25:CHM > B10:CHM > B25 > B10 > C). The data regarding root and dry biomass yields showed that B25:CHM:NPK produced the maximum yield, and the minimum yield was noted in C. We found the same trend for both root yield and root dry biomass, as follows: B25:CHM:NPK > B25:CHM > B10:CHM:NPK > B10:CHM > B25 > B10 > C. Biochar application alone (B10 and B25) did not show a significant effect on root and dry biomass yields compared to C. However, B10 increased 10% and B25 increased 20% in root yield, whereas B10 increased 6.3% and B25 increased 12.5% in dry root biomass compared with C.

2.3. Nitrogen Use Efficiency (NUE) under Different Treatments

Table 2 shows the NUE values. NUE, REN, and AE increased for B25:CHM:NPK but the differences were not statistically significant compared to B25:CHM. The highest PE and NHI values were obtained for B25:CHM. B10 and B25 showed very low values for all NUE indices.

2.4. Standardized Regression Coefficients

The standardized regression coefficients derived from the treatment factors are presented in Table 3. A standardized regression coefficient was used to compare the effects of biochar, chicken manure, and NPK fertilizer on the explanatory variables. NPK fertilizer had the greatest effect on radish leaf yield, whereas chicken manure contributed to increased root yield, NUE, RE, PE, AE, and NHI. Biochar tended to increase radish root yield more than leaf yield. The NPK fertilizer reduced the PE and NHI.

2.5. Soil Chemical Properties after Cultivation

The chemical properties of the soil after the experiment are listed in Table 4. Although the values of soil pH ranged from 7.3 to 7.8, treatments with biochar tended to increase the soil pH compared to the control. The pH values of B25 and B10:CHM increased by 4.1%, B25:CHM increased by 6.8%, B10:CHM:NPK increased by 5.5%, and B25:CHM:NPK increased by 1.4% relative to that of C. The highest pH (7.8) was observed for B25:CHM. EC value varied in the range of 12.5 to 187.5 (µS/cm). B25:CHM:NPK exhibited the highest EC value. EC values decreased in the following order: B25:CHM:NPK > B10:CHM:NPK > B25:CHM > B10:CHM > B25 > B10 > C. The highest soil total N was recorded in B25:CHM:NPK; however, it did not differ significantly from that of B10:CHM, B25:CHM, and B10:CHM:NPK. The order of magnitude was arranged from highest to lowest as follows: B25:CHM:NPK, B10:CHM:NPK, B25:CHM, B10:CHM, C, B25, and B10.
In this study, soil NH4+-N increased by 2.4% in B10, 3.1% in B25, 61.7% in B10:CHM, 109.4% in B25:CHM, 122.2% in B10:CHM:NPK, and 148.2% in B25:CHM:NPK relative to C. The soil ammonium content in B25:CHM:NPK greatly increased, but was not significantly different from that in B10:CHM:NPK and B25:CHM. There was no significant difference between biochar application alone (for both 10 t ha−1 and 25 t ha−1) and the control for ammonium N. The order of magnitude of soil NH4+-N was B25:CHM:NPK > B10:CHM:NPK > B25:CHM > B10:CHM > B25 > B10 > C. Regarding soil NO3--N, there was no significant difference among the treatments with biochar; however, it was statistically significant relative to the control. The highest nitrate N content was recorded for B10:CHM:NPK.
After harvest, the value of available P ranged between 241.1 mg kg−1 and 674.4 mg kg−1 with the order of B25:CHM:NPK > B10:CHM:NPK > B25:CHM > B10:CHM > B25 > B10 > C. Although non-significant differences were detected in soil available P among C, B10, B25, and B10:CHM, B10 increased by 7.2%, B25 increased by 11.0%, and B10:CHM increased by 28.8% compared with C. Regarding soil-exchangeable K, the value ranged between 0.09 mg kg−1 and 0.42 mg kg−1. Application of B25:CHM:NPK and B25:CHM influenced soil potassium, and the order of magnitude was arranged from highest to lowest: B25:CHM:NPK > B25:CHM > B10:CHM:NPK > B10:CHM > B25 > B10 > C. The range of soil-exchangeable magnesium concentration was 1.12 mg kg−1 to 7.20 mg kg−1. A relatively high concentration of Mg was observed in B10:CHM:NPK. Statistical analysis revealed no significant differences in soil-exchangeable Mg among B25:CHM:NPK, B10:CHM:NPK, B25:CHM, and B10:CHM. The application of the different treatments did not change the soil Ca content after cultivation. However, there was an increase of 13.3%, 7,8%, 16.4%, 10.1%, 18.0%, and 11.7% in B10, B25, B10:CHM, B25:CHM, B10:CHM:NPK, and B25:CHM:NPK relative to C. Based on these results, the order of soil Ca concentrations was as follows: B25:CHM > B10:CHM:NPK > B10:CHM > B10 > B25:CHM:NPK > B25 > C.

3. Discussion

3.1. Response of Plant Growth to Different Biochar Treatments

Plant growth characteristics such as plant height, number of leaves, and SPAD value responded positively to the combined application of biochar and chicken manure with or without NPK fertilizer, indicating that B10:CHM:NPK and B25:CHM:NPK showed significantly higher plant height. There is evidence to suggest that the combined application of biochar and organic or NPK fertilizers can improve soil quality and plant performance [29,30]. All applications of biochar+ organic + inorganic fertilizer could supply the required nutrients because they would contribute to a better nutritional environment during the active vegetative period, thus leading to increased cell elongation and multiplication, ultimately enhancing plant height. According to our findings, B10:CHM:NPK produced the highest number of leaves (Figure 1b). It should be noted that B10:CHM:NPK did not reach a significance level compared to B25:CHM:NPK and B25:CHM. B10:CHM:NPK increased leaf number more than B25:CHM:NPK and B25:CHM because readily available forms of NPK were positively reflected in radish leaf development, regardless of the biochar application rate.
SPAD values showed a declining trend until 21 DAS. At 28 DAT, the SPAD increased again with the application of B10, B25, B10:CHM, B25:CHM, B10:CHM:NPK, and B25:CHM:NPK. The B10:CHM:NPK and B25:CHM:NPK treatments showed the highest SPAD values from 14 to 28 DAS (Figure 1c). The application of rice husk biochar alone cannot supply sufficient N because of its low N content. These results are in accordance with those of [31], who explained that a low level of N in biochar led to a decrease in the SPAD value. In addition, N released from the applied fertilizers would be taken up by radish roots; thus, transportation to radish leaves would be small and SPAD values would decrease until 21 DAS. Zhang et al. [32] demonstrated that N, P, and K nutrients could be removed by the fleshy root of radish.

3.2. Radish Germination, Yield, and Nitrogen Use Efficiency under Different Treatments

Although biochar had no obvious effect on seed germination, increasing the application rate of biochar combined with organic and inorganic fertilizers (B25:CHM:NPK) resulted in the highest radish germination percentage (Table 1). This result corresponds to that of [33], who reported that peanut hull biochar did not significantly influence barley germination. Solaiman et al. [34] investigated the effects of biochar type and rate on the germination rate and early growth of wheat. In both the soilless Petri dishes and soil-based bioassays, the type and application rate of biochar affected wheat seed germination and seedling growth. Ali et al. [35] demonstrated that corncob biochar could be mixed with soil at different rates (0.5%, 1%, 1.5%, 2%, 2.5%, and 3% w/w). They confirmed that higher application rates have a neutral to favorable impact on maize seed germination and seedling development.
Maximum radish leaf yield was obtained using B10:CHM:NPK. According to the regression coefficient results (Table 3), NPK fertilizer greatly increased radish leaf yield, indicating that radish leaves obtained nutrients mainly from NPK fertilizer. This result is consistent with the number of leaves. Regarding root yield, B25:CHM, B10:CHM:NPK, and B25:CHM:NPK application increased radish root yield, and chicken manure had a greater effect on root yield (Table 1 and Table 3). The lowest root yield was found in C because neither organic nor inorganic fertilizers were applied to the control treatment. In addition, the experimental soil had very low fertility, with a low total N of 0.02%, and radish growth under C depended only on the existing soil N. Therefore, the radish plants under the C treatment could not obtain sufficient required N, which led to a decreased yield. The variations in leaf or root dry biomass yield under different treatments were consistent with the variations in radish yield (Table 1). This result is consistent with that of [20], who reported that crop yield is directly correlated with biomass.
Our findings showed that the maximum fertilizer NUE was achieved with the application of B25:CHM:NPK, followed by B25:CHM and B10:CHM:NPK (Table 2). Standardized regression analysis revealed that chicken manure significantly influenced NUE. Notably, a higher application rate of biochar combined with chicken manure, with or without NPK fertilizer, significantly increased NUE compared to biochar alone. The combined application of biochar along with organic or inorganic fertilizers stimulates plant growth and increases fertilizer utilization owing to the easily degradable components of organic and inorganic fertilizers [36,37]. Additionally, biochar can retain NO3--N and NH4+-N in manure [28]. As previously stated, the higher surface area of biochar makes it more effective at binding nutrients and improving NUE [38,39]. In addition, biochar can facilitate electron transfer to soil-denitrifying microorganisms, which accelerates the last step of denitrification, providing complete denitrification (N2), and thus reducing N loss as N2O [40]. Despite the positive effects of biochar on soil, its relatively low nutrient composition and resistance to biodegradation depend on the production temperature [41,42]. Therefore, biochar decomposition is likely to be minimal, and N immobilization probably occurs over a short time. In this study, biochar itself had a low total N content of 0.81%; thus, biochar application alone could not improve NUE.
B25:CHM:NPK had the highest REN, followed by B10:CHM:NPK, and B25:CHM. This indicates that the higher the N input, the higher the REN. Considering the results of our study, both chicken manure and NPK fertilizer can influence REN (Table 3) by supporting the required N uptake by radishes, thereby improving recovery efficiency (Table 2). The highest NHI value was obtained for B25:CHM, followed by B25:CHM:NPK. As mentioned above, the high level of N accumulated in radish roots was mainly derived from chicken manure, and biochar could enhance NUE; therefore, the radish plant’s N translocation to yield could be the highest under the B25:CHM treatment. This combination resulted in the highest PE. Among the treatments assessed in this study, B25:CHM is a potential amendment for organic farmers.

3.3. Effect of Biochar Application alone and Combined with Organic and Inorganic Fertilizer on Soil Chemical Properties after the Experiment

As a result of this experiment, rice husk biochar application combined with chicken manure, either with or without chemical fertilizer, improved soil chemical properties even over a short period of time compared to the control (see Table 4). Soil pH can directly influence the availability of nutrients because too low to too high a soil pH leads to the insolubility of some nutrients and limits their availability. The various treatments had no significant effects on soil pH because the pH of the soil used in this experiment was higher than that of the biochar. Even though there was no significant difference among the treatments, the soil pH value in the presence of biochar tended to increase slightly relative to the control. Generally, biochar application can increase the soil pH because of its alkaline nature. Basic cations in biochar (Ca2+, Mg2+, and K+) can be converted into alkaline substances (oxides, hydroxides, and carbonates) through pyrolysis. When these components dissolve, biochar acts as a liming ingredient, increasing the soil pH [43].
In agriculture, the soil electrical conductivity (EC) is an indirect indicator of available plant nutrients and salinity. In the present study, soil amendments with the B25:CHM:NPK treatment resulted in a significantly higher soil EC (Table 4). Notably, soils treated with biochar had significantly increased soil EC compared to the control. This is a positive result because our experimental soil had a very low EC with a value of 21 μS/cm. Soils with low EC tend to lose nutrients easily because of their poor capacity to hold cations. Soil EC is directly proportional to nutrient concentration [44]. Rice husk biochar had an EC of 856.3 µS cm−1 and contributed to an increase in soil EC after cultivation. The presence of oxidized functional groups, ash, and alkali compounds, such as Na, K, Mg, and Ca, can influence the EC value of biochar [45]. Zou et al. [46] reported that the release of these soluble compounds was positively correlated with an increase in soil EC. Additionally, adding manure improves organic matter, which can provide a pool of nutrients and ions that can be released into the soil solution, thereby increasing EC [47]. In addition, the obtained results are in agreement with those of Bhatt et al. [48], who indicated that organic fertilizer along with NPK fertilizer enhanced the EC of the soil because the breakdown of organic fertilizers released electrolytes.
After harvest, the highest total soil N content was observed in the B25:CHM:NPK treatment, which was significantly higher than that in the B10, B5, and C. However, B25:CHM:NPK was not significantly different from B10:CHM, B25:CHM, and B10:CHM:NPK (Table 4). Chicken manure, which contains 4.05% of the total N, can lead to increased soil N. Application of B25:CHM:NPK, B10:CHM:NPK, and B25:CHM significantly improved soil ammonium N compared to the control (Table 4). The order of magnitude of soil ammonium N was almost the same as that of soil total N. Soil ammonium N, rather than nitrate N, may have greatly affected plant growth in the present study. Based on the raw materials and the process of manufacturing biochar, the available forms of N vary significantly. Some studies have reported that owing to its porous nature and high surface area, biochar can retain N, thereby increasing the amount of N in the soil [49,50]. In other words, N released from chicken manure and NPK fertilizer was retained on the biochar surface, which led to increased soil available N when combined with biochar, chicken manure, and NPK fertilizer.
Nguyen et al. [51] indicated that soil amendment with biochar decreased soil NH4+-N and NO3--N levels by an average of 11% and 10%, respectively. According to their results, biochar produced from carbohydrates at low treatment temperatures and hydrothermal conditions reduced soil inorganic N more than the other biochars. It is possible that the high surface area (adsorption) and high C/N ratio of the biochar caused the immobilization. Biochar application alone may reduce soil N for a short period, but the available N may increase over time [51,52]. Therefore, organic manure with a low C/N ratio is a good option for promoting biochar production. Mineralization may be rapid and release nutrients from the organic manure [28]. Biochar may create space for soil microorganisms to reproduce and enhance the nutrients released from organic manure [53,54]. Furthermore, inorganic fertilizers can release nutrients in a short time because of their readily available characteristics; hence, the combination of biochar, chicken manure, and NPK fertilizer would be a perfect combination to promote soil available N, even in a short time.
Based on the results of this study, applications of B10, B25, and B10:CHM were not significant in soil-available P content compared with C. Even though we applied the same application rate of chicken manure (0.01 g P2O5 pot−1) and NPK fertilizer (0.25 g P2O5 pot−1) in both B10:CHM:NPK and B25:CHM:NPK, B25:CHM:NPK showed the highest statistically significant result. This indicates that a higher application rate of biochar can retain more available soil P. Biochar can serve as a growth medium for P-solubilizing bacteria owing to its high specific surface area, high internal porosity, and capacity to adsorb organic molecules [55]. B25:CHM:NPK had the highest soil-exchangeable K value, followed by B25:CHM. There is no doubt that the high K content in biochar and chicken manure can contribute to an increase in soil-exchangeable K. Moreover, all combined applications of biochar and chicken manure, with and without NPK fertilizer, enhanced exchangeable Mg. Such enhancement may be due to the relatively high pH of the soil, as well as the ash content in biochar, which could lead to greater qualities of exchangeable basic cations such as K, Mg, and Ca. Furthermore, poultry manure contains high concentrations of basic cations that can serve as liming materials. Therefore, when these cations are released, the cation content and ionic strength of the soil increase, thereby increasing the exchangeable ions [56]. There was no significant difference in soil-exchangeable Ca among the treatments because the experimental soil had relatively high Ca, which led to an abundance of soil-exchangeable Ca, even in the control.

4. Materials and Methods

4.1. Experimental Site, Treatments, and Radish Cultivation

A precise pot experiment was conducted in a greenhouse (33.83° N, 132.79° E) at Ehime University in Matsuyama City, Japan. This study was conducted during the cropping season of 3 June to 5 July 2023. The soil was collected from a mountainous area in Toon City, Ehime Prefecture, Japan. The basic properties of the experimental soil are listed in Table 5.
The rice husk biochar and chicken manure were thoroughly mixed with 4 kg of air-dried soil. Then, well-mixed soil was filled into Wagner pots with an area of 0.02 m2 one week before sowing the radish seeds. NPK fertilizer was applied on sowing day with the application rate of 1.6 g pot−1 of NPK fertilizer. All the pots were placed on the blocks to prevent radiation and latent heat exposure. The experiment consisted of five replicates in a completely randomized design. The experiment included seven treatments: (i) control (C, no amendment), (ii) B10 = 10 t ha−1 of biochar (20 g pot−1), (iii) B25 = 25 t ha−1 of biochar (50 g pot−1), (iv) B10:CHM = 10 t ha−1 of biochar (20 g pot−1) + 5 t ha−1 of chicken manure (10 g pot−1), (v) B25:CHM = 25 t ha−1 of biochar (50 g pot−1) + 5 t ha−1 of chicken manure (10 g pot−1), (vi) B10:CHM:NPK = 10 t ha−1 of biochar (20 g pot−1) + 5 t ha−1 of chicken manure (10 g pot−1 )+ 120 kg ha−1 of NPK (15-15-15), (vii) B25:CHM:NPK = 25 t ha−1 of biochar (50 g pot−1) + 5 t ha−1 of chicken manure (10 g pot−1) + 120 kg ha−1 of NPK (15-15-15). Commercially available rice husk biochar and chicken manure were used in this study. Table 6 lists the chemical characteristics of rice husk biochar. Chicken manure had the following properties: total N 4.05%, total C 25.04%, C/N 6.19, and available P 1334 mg kg−1.
In this study, radishes (Raphanus sativus L. var. radicula Pers.) were used. Three seeds were sown in each pot. Germination tests were performed one week after sowing. The seedlings were thinned to one plant per pot. The germination percentage was calculated based on Fedeli et al. [57]
G e r m i n a t i o n ( % ) = Number   of   g e r m i n a t e d   s e e d s   p e r   p o t T o t a l   n u m b e r   o f   s e e d s   p l a n t e d   p e r   p o t × 100
Irrigation with pure water was performed at least once a week, depending on the weather conditions, to maintain soil moisture throughout the root zone. No supplemental fertilizer was applied during the experiment.

4.2. Plant Growth, Radish Yield Measurements, and Nitrogen Use Efficiency

The plant height, number of leaves, and SPAD values were recorded weekly. A meter ruler was used to measure the plant height. The chlorophyll content of fully healthy and fully expanded leaves was measured from the bottom, center, and top of the leaves per plant (average of three points measured) using a SPAD 502-Plus chlorophyll meter (Konica Minolta, Inc., Osaka, Japan). The radishes were harvested at commercial maturity, 31 days after sowing. Plants were carefully uprooted to avoid damaging their roots, and excess soil around the roots was washed with water. The leaves were then separated from the tubers, and the fresh weights of the leaves and roots per pot were recorded using a digital balance. After weighing, the leaves and roots were oven dried at 70 °C. When they reached a constant weight, the dry matter weights of leaves and roots were recorded. Radish leaf and root yields were determined by weight per plant.
The fertilizer N recovery efficiency (REN), physiological efficiency (PE), and agronomic efficiency (AE) were calculated based on Congreve et al. [58]. PlantN, which is the plant N content, was calculated as the sum of N concentration in both radish leaves and roots multiplied by their dry biomass, whereas PlantN(control) was the N concentration under the control treatment multiplied by its dry biomass. Fertilizer N was calculated as the total N concentration derived from the applied fertilizer.
Nitrogen use efficiency (NUE) was defined as the ratio of the radish root yield to the total N derived from the applied fertilizer. NUE was determined by using the equation proposed by Alkharabsheh et al. [59].
N U E   ( g   g 1   N ) = Y i e l d F e r t i l i z e r
The fertilizer N recovery efficiency (REN) is an indicator of fertilizer N uptake by radish plants. It was computed by subtracting the plant N content under the control treatment (PlantN (control)) from the plant N content (PlantN) under different treatments.
R E N   ( % ) = P l a n t N P l a n t N ( c o n t r o l ) F e r t i l i z e r   N
The amount of N supplied by fertilizers that plant tissues contribute to yield is known as physiological efficiency (PE). PE was calculated by using the following equation:
P E   ( g   g 1   N ) = Y i e l d Y i e l d ( c o n t r o l ) P l a n t N P l a n t N ( c o n t r o l )
Agronomic efficiency (AE) indicates how N fertilizer contributes to the yield in comparison to a control.
A E   ( g   g 1   N ) = Y i e l d Y i e l d c o n t r o l F e r t i l i z e r N
The N harvest index (NHI) was calculated based on Fageria et al. [60] as the N accumulated in the radish roots divided by the total N content in the radish leaves and roots. The yield N was computed as the N concentration in the radish roots multiplied by the dry biomass.
N H I ( % ) = y i e l d   N P l a n t N × 100

4.3. Measurement of Soil Chemical Properties

All soil chemical properties were determined as described by Mon et al. [14]. To determine how the chemical properties of the soil changed, soil analysis was performed before and after cultivation. Prior to examination, the soil samples were air dried and sieved (≤2 mm). A pH meter (B-212, HORIBA, Kyoto, Japan) was used to measure the pH of the soil from soil–water suspensions (1:2.5, v/v), and an EC meter (Horiba Twin Cond Conductivity meter B173) was used to measure the EC of the soil. This study employed calorimetric methods to assess the amounts of ammonium N (NH4+-N) and nitrate N (NO3--N) in the soil. Available P was measured using the Troug technique. Atomic absorption spectrometry was used to quantify the quantities of exchangeable K, Ca, and Mg after extraction using 1 M ammonium acetate. The dry combustion method was used to determine the total C and N contents using a Vario Max CN elemental analyzer (Elementar Analysensysteme GmbH, Langenselbold, Germany).

4.4. Statistical Analysis

We performed a one-way analysis of variance (ANOVA) using the Real Statistics Resource Pack for all data. Tukey’s HSD test at a significance level of p < 0.05 was used to analyze the differences in mean values. Multiple regression analysis was performed by standardizing all variables to obtain standardized regression coefficients.

5. Conclusions

It was found that B25:CHM:NPK produced better results in improving NUE, plant growth, and yield than the other treatments. An important finding of this study was that NPK fertilizer greatly increased radish leaf yield, whereas chicken manure had a greater effect on radish root yield. In addition, B25:CHM and B25:CHM:NPK had no significant effect on soil NH4+-N, NO3--N, exchangeable K, Mg, Ca, or root yield. Our experiments indicated that B25:CHM is a suitable combination for organic farmers. No significant differences were found between treatments in terms of soil pH, soil NO3--N, seed germination, or SPAD. The application of biochar alone (B10 and B25) did not significantly influence on radish growth. However, B10 increased by 10% and B25 increased 20% in radish root yield relative to the control. Notably, when biochar is combined with organic and inorganic fertilizers, a higher application rate of biochar can contribute to greater fertilizer N uptake efficiency by radishes in a short time. Since biochar ages with time, more research is needed to explore the changes in biochar mechanisms in soil over time and to investigate the effects of aging on crop production and nitrogen use efficiency.

Author Contributions

Conceptualization, W.W.M. and H.U.; methodology, W.W.M. and H.U.; data analysis, writing―original draft preparation, W.W.M.; review and editing, H.U. All authors have read and agreed to the published version of the manuscript.

Funding

This work was supported by the JSPS KAKENHI Grant-in-Aid for Scientific Research(B), Grant Number JP22H02472.

Data Availability Statement

Data are contained within the article.

Conflicts of Interest

The authors declare no conflicts of interest.

References

  1. Doulgeris, C.; Kypritidou, Z.; Kinigopoulou, V.; Hatzigiannakis, E. Simulation of Potassium Availability in the Application of Biochar in Agricultural Soil. Agronomy 2023, 13, 784. [Google Scholar] [CrossRef]
  2. Lal, R. Soil Organic Matter Content and Crop Yield. J. Soil Water Conserv. 2020, 75, 27A–32A. [Google Scholar] [CrossRef]
  3. Agbede, T.M.; Adekiya, A.O.; Eifediyi, E.K. Impact of Poultry Manure and NPK Fertilizer On Soil Physical Properties and Growth and Yield of Carrot. J. Hortic. Res. 2017, 25, 81–88. [Google Scholar] [CrossRef]
  4. Zhang, J.; He, W.; Smith, W.N.; Grant, B.B.; Ding, W.; Jiang, R.; Zou, G.; Chen, Y.; He, P. Exploring Management Strategies to Improve Yield and Mitigate Nitrate Leaching in a Typical Radish Field in Northern China. J. Environ. Manag. 2021, 290, 112640. [Google Scholar] [CrossRef]
  5. Huang, M.; Fan, L.; Chen, J.; Jiang, L.; Zou, Y. Continuous Applications of Biochar to Rice: Effects on Nitrogen Uptake and Utilization. Sci. Rep. 2018, 8, 11461. [Google Scholar] [CrossRef] [PubMed]
  6. Asadi, H.; Ghorbani, M.; Rezaei-Rashti, M.; Abrishamkesh, S.; Amirahmadi, E.; Chengrong, C.; Gorji, M. Application of Rice Husk Biochar for Achieving Sustainable Agriculture and Environment. Rice Sci. 2021, 28, 325–343. [Google Scholar] [CrossRef]
  7. Akumuntu, A.; Hong, J.-K.; Jho, E.H.; Omidoyin, K.C.; Park, S.-J.; Zhang, Q.; Zhao, X. Biochar Derived from Rice Husk: Impact on Soil Enzyme and Microbial Dynamics, Lettuce Growth, and Toxicity. Chemosphere 2024, 349, 140868. [Google Scholar] [CrossRef]
  8. Glaser, B.; Lehmann, J.; Zech, W. Ameliorating Physical and Chemical Properties of Highly Weathered Soils in the Tropics with Charcoal—A Review. Biol. Fertil. Soils 2002, 35, 219–230. [Google Scholar] [CrossRef]
  9. Ghorbani, M.; Konvalina, P.; Neugschwandtner, R.W.; Soja, G.; Bárta, J.; Chen, W.-H.; Amirahmadi, E. How Do Different Feedstocks and Pyrolysis Conditions Effectively Change Biochar Modification Scenarios? A Critical Analysis of Engineered Biochars under H2O2 Oxidation. Energy Convers. Manag. 2024, 300, 117924. [Google Scholar] [CrossRef]
  10. Grewal, A.; Abbey, L.; Gunupuru, L.R. Production, Prospects and Potential Application of Pyroligneous Acid in Agriculture. J. Anal. Appl. Pyrolysis 2018, 135, 152–159. [Google Scholar] [CrossRef]
  11. Bian, X.; Ren, Z.; Zeng, L.; Zhao, F.; Yao, Y.; Li, X. Effects of Biochar on the Compressibility of Soil with High Water Content. J. Clean. Prod. 2024, 434, 140032. [Google Scholar] [CrossRef]
  12. Song, Q.; Kong, F.; Liu, B.-F.; Song, X.; Ren, H.-Y. Biochar-Based Composites for Removing Chlorinated Organic Pollutants: Applications, Mechanisms, and Perspectives. Environ. Sci. Ecotechnol. 2024, 21, 100420. [Google Scholar] [CrossRef]
  13. Luo, L.; Wang, J.; Lv, J.; Liu, Z.; Sun, T.; Yang, Y.; Zhu, Y.-G. Carbon Sequestration Strategies in Soil Using Biochar: Advances, Challenges, and Opportunities. Environ. Sci. Technol. 2023, 57, 11357–11372. [Google Scholar] [CrossRef]
  14. Mon, W.W.; Toma, Y.; Ueno, H. Combined Effects of Rice Husk Biochar and Organic Manures on Soil Chemical Properties and Greenhouse Gas Emissions from Two Different Paddy Soils. Soil Syst. 2024, 8, 32. [Google Scholar] [CrossRef]
  15. Chen, A.; Han, Z.; Xie, X.; Song, C.; Zhang, X.; Zhao, Y. Co-Composting Sugar-Containing Waste with Chicken Manure–A New Approach to Carbon Sequestration. J. Environ. Manag. 2024, 356, 120609. [Google Scholar] [CrossRef]
  16. Urra, J.; Alkorta, I.; Lanzén, A.; Mijangos, I.; Garbisu, C. The Application of Fresh and Composted Horse and Chicken Manure Affects Soil Quality, Microbial Composition and Antibiotic Resistance. Appl. Soil Ecol. 2019, 135, 73–84. [Google Scholar] [CrossRef]
  17. Evanylo, G.; Sherony, C.; Spargo, J.; Starner, D.; Brosius, M.; Haering, K. Soil and Water Environmental Effects of Fertilizer-, Manure-, and Compost-Based Fertility Practices in an Organic Vegetable Cropping System. Agric. Ecosyst. Environ. 2008, 127, 50–58. [Google Scholar] [CrossRef]
  18. Qi, H.; Gao, W.; Xie, L.; Zhang, G.; Song, C.; Wei, Z.; Hu, N.; Li, T. Effect of MnO2-Biochar Composites on Promoting Humification during Chicken Manure Composting. Biochar 2024, 6, 32. [Google Scholar] [CrossRef]
  19. Kurniasari, L.; Anggriawan, F.; Lestari, S.A.D.; Sulistyo, N.B.E.; Syahban, R.A.; Rahayu, S. Response of Growth and Seed Yield of Mung Bean (Vigna radiata L.) to Chicken Manure and Banana Hump Liquid Organic Fertilizer Application. JTEP-L 2024, 13, 147. [Google Scholar] [CrossRef]
  20. Manogaran, M.D.; Shamsuddin, R.; Mohd Yusoff, M.H.; Lay, M.; Siyal, A.A. A Review on Treatment Processes of Chicken Manure. Clean. Circ. Bioecon. 2022, 2, 100013. [Google Scholar] [CrossRef]
  21. Chan, K.Y.; Van Zwieten, L.; Meszaros, I.; Downie, A.; Joseph, S. Agronomic Values of Greenwaste Biochar as a Soil Amendment. Soil Res. 2007, 45, 629. [Google Scholar] [CrossRef]
  22. Banihani, S. Radish (Raphanus sativus) and Diabetes. Nutrients 2017, 9, 1014. [Google Scholar] [CrossRef] [PubMed]
  23. Khattak, K.F. Nutrient Composition, Phenolic Content and Free Radical Scavenging Activity of Some Uncommon Vegetables of Pakistan. Pak. J. Pharm. Sci. 2011, 24, 277–283. [Google Scholar]
  24. Sousa, A.A.T.C.; Figueiredo, C.C. Sewage Sludge Biochar: Effects on Soil Fertility and Growth of Radish. Biol. Agric. Hortic. 2016, 32, 127–138. [Google Scholar] [CrossRef]
  25. Nyambo, P.; Motsi, H.; Chiduza, C.; Malobane, M.E. Biochar Ageing Improves Soil Properties, Growth and Yield of Red Radish (Raphanus sativus) in a Haplic Cambisol. PLoS ONE 2023, 18, e0288709. [Google Scholar] [CrossRef] [PubMed]
  26. Ghorbani, M.; Konvalina, P.; Neugschwandtner, R.W.; Kopecký, M.; Amirahmadi, E.; Bucur, D.; Walkiewicz, A. Interaction of Biochar with Chemical, Green and Biological Nitrogen Fertilizers on Nitrogen Use Efficiency Indices. Agronomy 2022, 12, 2106. [Google Scholar] [CrossRef]
  27. Olanrewaju, J.S.; Sato, K.; Yamamoto, S.; Masunaga, T. Influence of Rice Husk Biochar and Its Application Methods on Silicon Dynamics and Rice Yield in Sandy-Loam Soil. Appl. Environ. Soil Sci. 2024, 2024, 6697604. [Google Scholar] [CrossRef]
  28. Adekiya, A.O.; Agbede, T.M.; Aboyeji, C.M.; Dunsin, O.; Simeon, V.T. Effects of Biochar and Poultry Manure on Soil Characteristics and the Yield of Radish. Sci. Hortic. 2019, 243, 457–463. [Google Scholar] [CrossRef]
  29. Głąb, T.; Żabiński, A.; Sadowska, U.; Gondek, K.; Kopeć, M.; Mierzwa–Hersztek, M.; Tabor, S. Effects of Co-Composted Maize, Sewage Sludge, and Biochar Mixtures on Hydrological and Physical Qualities of Sandy Soil. Geoderma 2018, 315, 27–35. [Google Scholar] [CrossRef]
  30. Zheng, W.; Sharma, B.K. Agronomic Effect of Combined Application of Biochar and Nitrogen Fertilizer: A Field Trial. In Biorefinery of Inorganics; Meers, E., Velthof, G., Michels, E., Rietra, R., Eds.; Wiley: Hoboken, NJ, USA, 2020; pp. 301–310. ISBN 978-1-118-92145-6. [Google Scholar]
  31. Varela Milla, O.; Rivera, E.B.; Huang, W.J.; Chien, C.; Wang, Y.M. Agronomic Properties and Characterization of Rice Husk and Wood Biochars and Their Effect on the Growth of Water Spinach in a Field Test. J. Soil Sci. Plant Nutr. 2013, 13, 251–266. [Google Scholar] [CrossRef]
  32. Zhang, J.; He, P.; Ding, W.; Xu, X.; Ullah, S.; Abbas, T.; Ai, C.; Li, M.; Cui, R.; Jin, C.; et al. Estimating Nutrient Uptake Requirements for Radish in China Based on QUEFTS Model. Sci. Rep. 2019, 9, 11663. [Google Scholar] [CrossRef] [PubMed]
  33. Busch, D.; Kammann, C.; Grünhage, L.; Müller, C. Simple Biotoxicity Tests for Evaluation of Carbonaceous Soil Additives: Establishment and Reproducibility of Four Test Procedures. J. Environ. Qual. 2012, 41, 1023–1032. [Google Scholar] [CrossRef] [PubMed]
  34. Solaiman, Z.M.; Murphy, D.V.; Abbott, L.K. Biochars Influence Seed Germination and Early Growth of Seedlings. Plant Soil 2012, 353, 273–287. [Google Scholar] [CrossRef]
  35. Ali, L.; Xiukang, W.; Naveed, M.; Ashraf, S.; Nadeem, S.M.; Haider, F.U.; Mustafa, A. Impact of Biochar Application on Germination Behavior and Early Growth of Maize Seedlings: Insights from a Growth Room Experiment. Appl. Sci. 2021, 11, 11666. [Google Scholar] [CrossRef]
  36. Sarwar, N.; Abbas, N.; Farooq, O.; Akram, M.; Hassan, M.W.; Mubeen, K.; Rehman, A.; Shehzad, M.; Ahmad, M.; Khaliq, A. Biochar Integrated Nutrient Application Improves Crop Productivity, Sustainability and Profitability of Maize–Wheat Cropping System. Sustainability 2023, 15, 2232. [Google Scholar] [CrossRef]
  37. Schulz, H.; Dunst, G.; Glaser, B. Positive Effects of Composted Biochar on Plant Growth and Soil Fertility. Agron. Sustain. Dev. 2013, 33, 817–827. [Google Scholar] [CrossRef]
  38. Rodríguez-Vila, A.; Forján, R.; Guedes, R.S.; Covelo, E.F. Changes on the Phytoavailability of Nutrients in a Mine Soil Reclaimed with Compost and Biochar. Water Air Soil Pollut. 2016, 227, 453. [Google Scholar] [CrossRef]
  39. Ding, Y.; Liu, Y.; Liu, S.; Li, Z.; Tan, X.; Huang, X.; Zeng, G.; Zhou, L.; Zheng, B. Biochar to Improve Soil Fertility. A Review. Agron. Sustain. Dev. 2016, 36, 36. [Google Scholar] [CrossRef]
  40. Abbruzzini, T.F.; Davies, C.A.; Toledo, F.H.; Cerri, C.E.P. Dynamic Biochar Effects on Nitrogen Use Efficiency, Crop Yield and Soil Nitrous Oxide Emissions during a Tropical Wheat-Growing Season. J. Environ. Manag. 2019, 252, 109638. [Google Scholar] [CrossRef]
  41. Partey, S.T.; Preziosi, R.F.; Robson, G.D. Short-Term Interactive Effects of Biochar, Green Manure, and Inorganic Fertilizer on Soil Properties and Agronomic Characteristics of Maize. Agric. Res. 2014, 3, 128–136. [Google Scholar] [CrossRef]
  42. Anyika, C.; Abdul Majid, Z.; Ibrahim, Z.; Zakaria, M.P.; Yahya, A. The Impact of Biochars on Sorption and Biodegradation of Polycyclic Aromatic Hydrocarbons in Soils—A Review. Environ. Sci. Pollut. Res. 2015, 22, 3314–3341. [Google Scholar] [CrossRef]
  43. Singh, H.; Northup, B.K.; Rice, C.W.; Prasad, P.V.V. Biochar Applications Influence Soil Physical and Chemical Properties, Microbial Diversity, and Crop Productivity: A Meta-Analysis. Biochar 2022, 4, 8. [Google Scholar] [CrossRef]
  44. Othaman, N.N.C.; Isa, M.N.M.; Ismail, R.C.; Ahmad, M.I.; Hui, C.K. Factors That Affect Soil Electrical Conductivity (EC) Based System for Smart Farming Application. In AIP Conference Proceedings; AIP Publishing: Putrajaya, Malaysia, 2020; Volume 2203, p. 020055. [Google Scholar] [CrossRef]
  45. Kuppusamy, S.; Thavamani, P.; Megharaj, M.; Venkateswarlu, K.; Naidu, R. Agronomic and Remedial Benefits and Risks of Applying Biochar to Soil: Current Knowledge and Future Research Directions. Environ. Int. 2016, 87, 1–12. [Google Scholar] [CrossRef] [PubMed]
  46. Zou, Q.; An, W.; Wu, C.; Li, W.; Fu, A.; Xiao, R.; Chen, H.; Xue, S. Red Mud-Modified Biochar Reduces Soil Arsenic Availability and Changes Bacterial Composition. Env. Chem. Lett. 2018, 16, 615–622. [Google Scholar] [CrossRef]
  47. Carmo, D.L.D.; Silva, C.A.; Lima, J.M.D.; Pinheiro, G.L. Electrical Conductivity and Chemical Composition of Soil Solution: Comparison of Solution Samplers in Tropical Soils. Rev. Bras. Ciênc. Solo 2016, 40, 20140795. [Google Scholar] [CrossRef]
  48. Bhatt, M.; Singh, A.; Singh, V.; Kala, D.; Kumar, V. Long-Term Effect of Organic and Inorganic Fertilizers on Soil Physico-Chemical Properties of a Silty Clay Loam Soil under Rice-Wheat Cropping System in Tarai Region of Uttarakhand. J. Pharmacogn. Phytochem. 2019, 8, 2113–2118. [Google Scholar]
  49. Huang, M.; Yang, L.; Qin, H.; Jiang, L.; Zou, Y. Quantifying the Effect of Biochar Amendment on Soil Quality and Crop Productivity in Chinese Rice Paddies. Field Crops Res. 2013, 154, 172–177. [Google Scholar] [CrossRef]
  50. Cui, Y.; Meng, J.; Wang, Q.; Zhang, W.; Cheng, X.; Chen, W. Effects of Straw and Biochar Addition on Soil Nitrogen, Carbon, and Super Rice Yield in Cold Waterlogged Paddy Soils of North China. J. Integr. Agric. 2017, 16, 1064–1074. [Google Scholar] [CrossRef]
  51. Nguyen, T.T.N.; Xu, C.-Y.; Tahmasbian, I.; Che, R.; Xu, Z.; Zhou, X.; Wallace, H.M.; Bai, S.H. Effects of Biochar on Soil Available Inorganic Nitrogen: A Review and Meta-Analysis. Geoderma 2017, 288, 79–96. [Google Scholar] [CrossRef]
  52. Hosseini Bai, S.; Xu, C.-Y.; Xu, Z.; Blumfield, T.J.; Zhao, H.; Wallace, H.; Reverchon, F.; Van Zwieten, L. Soil and Foliar Nutrient and Nitrogen Isotope Composition (δ15N) at 5 Years after Poultry Litter and Green Waste Biochar Amendment in a Macadamia Orchard. Env. Sci. Pollut. Res. 2015, 22, 3803–3809. [Google Scholar] [CrossRef]
  53. Ducey, T.F.; Ippolito, J.A.; Cantrell, K.B.; Novak, J.M.; Lentz, R.D. Addition of Activated Switchgrass Biochar to an Aridic Subsoil Increases Microbial Nitrogen Cycling Gene Abundances. Appl. Soil Ecol. 2013, 65, 65–72. [Google Scholar] [CrossRef]
  54. Zavalloni, C.; Alberti, G.; Biasiol, S.; Delle Vedove, G.; Fornasier, F.; Liu, J.; Peressotti, A. Microbial Mineralization of Biochar and Wheat Straw Mixture in Soil: A Short-Term Study. Appl. Soil Ecol. 2011, 50, 45–51. [Google Scholar] [CrossRef]
  55. Lehmann, J.; Rillig, M.C.; Thies, J.; Masiello, C.A.; Hockaday, W.C.; Crowley, D. Biochar Effects on Soil Biota—A Review. Soil Biol. Biochem. 2011, 43, 1812–1836. [Google Scholar] [CrossRef]
  56. Eneji, A.E.; Irshad, M.; Honna, T.; Yamamoto, S.; Endo, T.; Masuda, T. Potassium, Calcium, and Magnesium Mineralization in Manure-Treated Soils. Commun. Soil Sci. Plant Anal. 2003, 34, 1669–1679. [Google Scholar] [CrossRef]
  57. Fedeli, R.; Fiaschi, T.; Angiolini, C.; Maccherini, S.; Loppi, S.; Fanfarillo, E. Dose-Dependent and Species-Specific Effects of Wood Distillate Addition on the Germination Performance of Threatened Arable Plants. Plants 2023, 12, 3028. [Google Scholar] [CrossRef]
  58. Congreves, K.A.; Otchere, O.; Ferland, D.; Farzadfar, S.; Williams, S.; Arcand, M.M. Nitrogen Use Efficiency Definitions of Today and Tomorrow. Front. Plant Sci. 2021, 12, 637108. [Google Scholar] [CrossRef]
  59. Alkharabsheh, H.M.; Seleiman, M.F.; Battaglia, M.L.; Shami, A.; Jalal, R.S.; Alhammad, B.A.; Almutairi, K.F.; Al-Saif, A.M. Biochar and Its Broad Impacts in Soil Quality and Fertility, Nutrient Leaching and Crop Productivity: A Review. Agronomy 2021, 11, 993. [Google Scholar] [CrossRef]
  60. Fageria, N.K. Nitrogen Harvest Index and Its Association with Crop Yields. J. Plant Nutr. 2014, 37, 795–810. [Google Scholar] [CrossRef]
Figure 1. Plant height (a), number of leaves (b), and leaf color (c) under different treatments. Data are presented as the mean ± standard error. C = control, B10 = 10 t ha−1 of biochar application; B25 = 25 t ha−1 of biochar application; B10:CHM = 10 t ha−1 of biochar + 5 t ha−1 of chicken manure; B25:CHM = 25 t ha−1 of biochar + 5 t ha−1 of chicken manure; B10:CHM:NPK = 10 t ha−1 of biochar + 5 t ha−1 of chicken manure + NPK; B25:CHM:NPK = 25 t ha−1 of biochar + 5 t ha−1 of chicken manure + NPK.
Plants 13 02376 g001
Table 1. Application of biochar alone and in combination with organic and inorganic fertilizers: its effects on radish germination and yield component.
TreatmentsGermination (%)Radish Yield (g pot−1)Dry Biomass Yield (g pot−1)
LeavesRootLeavesRoot
C73.3 ± 6.67 a0.20 ± 0.03 de0.10 ± 0.03 bcd0.06 ± 0.004 de0.016 ± 0.002 bcd
B1073.0 ± 12.5 a0.22 ± 0.04 e0.11 ± 0.02 d0.07 ± 0.01 e0.017 ± 0.004 d
B2593.3 ± 6.67 a0.23 ± 0.05 d0.12 ± 0.02 c0.08 ± 0.01 d0.018 ± 0.006 c
B10:CHM93.3 ± 6.67 a3.00 ± 0.26 c2.11 ± 0.43 b0.33 ± 0.05 c1.02 ± 0.110 b
B25:CHM93.3 ± 6.67 a4.11 ± 0.25 b7.38 ± 0.75 a0.46 ± 0.03 b2.09 ± 0.325 a
B10:CHM:NPK93.3 ± 6.67 a8.09 ± 0.35 a5.03 ± 0.78 a0.91 ± 0.03 a1.46 ± 0.370 a
B25:CHM:NPK100 ± 0.00 a7.97 ± 0.64 a9.86 ± 1.96 a0.82 ± 0.08 a2.28 ± 0.545 a
p value0.08<0.001<0.001<0.001<0.001
Data are presented as mean ± standard error. Significant differences (p < 0.05) are indicated by different letters in the same column among the treatments. C, control; B10 = 10 t ha−1 biochar application, B25 = 25 t ha−1 biochar application; B10:CHM = 10 t ha−1 of biochar + 5 t ha−1 of chicken manure; B25:CHM = 25 t ha−1 biochar + 5 t ha−1 of chicken manure; B10:CHM:NPK = 10 t ha−1 of biochar + 5 t ha−1 of chicken manure + NPK; B25:CHM:NPK = 25 t ha−1 biochar + 5 t ha−1 of chicken manure + NPK.
Table 2. Nitrogen use efficiency under different treatments.
TreatmentsNUE (g g−1 N)REN (%)PE (g g−1 N)AE (g g−1 N)NHI (%)
B100.60 ± 0.15 c0.5 ± 0.36 d0.03 ± 0.01 d0.009 ± 0.15 c13.1 ± 3.19 b
B250.24 ± 0.04 d0.6 ± 0.24 c0.05 ± 0.06 c0.006 ± 0.04 d9.5 ± 2.49 c
B10:CHM3.70 ± 0.76 b7.5 ± 1.38 b0.50 ± 0.08 ab3.54 ± 0.76 b53.5 ± 6.11 a
B25:CHM9.11 ± 0.93 a11.6 ± 1.49 a0.93 ± 0.09 a8.99 ± 0.93 a67.0 ± 3.76 a
B10:CHM:NPK8.38 ± 1.30 a17.3 ± 2.35 a0.55 ± 0.02 b8.23 ± 1.30 a48.4 ± 7.91 a
B25:CHM:NPK11.7 ± 2.33 a18.5 ± 2.31 a0.75 ± 0.12 a11.63 ± 2.33 a56.5 ± 7.17 a
P value<0.001<0.001<0.001<0.001<0.001
Data are presented as mean ± standard error. Significant differences (p < 0.05) are indicated by different letters in the same column among the treatments. C, control; B10 = 10 t ha−1 biochar application, B25 = 25 t ha−1 biochar application; B10:CHM = 10 t ha−1 of biochar + 5 t ha−1 of chicken manure; B25:CHM = 25 t ha−1 biochar + 5 t ha−1 of chicken manure; B10:CHM:NPK = 10 t ha−1 of biochar + 5 t ha−1 of chicken manure + NPK; B25:CHM:NPK = 25 t ha−1 biochar + 5 t ha−1 of chicken manure + NPK. NUE: fertilizer nitrogen utilization efficiency; REN: fertilizer nitrogen recovery efficiency; PE: physiological efficiency; AE: agronomic efficiency; NHI: nitrogen harvest index.
Table 3. Standardized regression coefficients derived from treatment factors based on multiple regression analysis.
Response
Variables
Explanatory Variables
Leaf YieldRoot YieldNUEREPEAENHI
Biochar0.040.32 *0.28 *0.120.31 **0.28 **0.13
Chicken Manure0.49 ***0.47 ***0.57 ***0.56 ***0.91 ***0.58 ***0.99 ***
NPK Fertilizer0.61 ***0.30 *0.35 **0.52 ***−0.080.34 **−0.16
NUE: fertilizer nitrogen utilization efficiency; REN: fertilizer nitrogen recovery efficiency; PE: physiological efficiency; AE: agronomic efficiency; NHI: nitrogen harvest index. * Significant at p < 0.05. **: significant at p < 0.01, ***: significant at p < 0.001.
Table 4. Chemical properties of low-fertility soil after harvest.
TreatmentspHEC
(µS cm−1)
Total N (%)NH4-N
(mg kg−1)
NO3-N
(mg kg−1)
Available P
(mg kg−1)
Ex. K
(cmol(c) kg−1)
Ex. Mg
(cmol(c) kg−1)
Ex. Ca
(cmol(c) kg−1)
C7.3 ± 0.19 ab12.5 ± 2.2f0.016 ± 0.011 b7.11 ± 0.8 cd1.28 ± 0.1 b241.1 ± 5.2 cd0.09 ± 0.02 d1.12 ± 0.1 d12.8 ± 0.7 ab
B107.3 ± 0.05 ab20.5 ± 2.3e0.009 ± 0.003 d7.28 ± 0.6 d2.15 ± 0.4 a258.5 ± 20.0 cd0.18 ± 0.01 c2.02 ± 0.5 c14.5 ± 0.1 ab
B257.6 ± 0.04 a41.5 ± 5.6d0.015 ± 0.002 c7.33 ± 0.4 c2.04 ± 0.6 a267.6 ± 15.2 d0.23 ± 0.01 c2.70 ± 0.5 b13.8 ± 1.0 b
B10:CHM7.6 ± 0.04 a118.5 ± 4.3c0.025 ± 0.005 a11.50 ± 1.2 b2.70 ± 0.4 a310.5 ± 10.8 c0.20 ± 0.01 ab4.82 ± 0.3 a14.9 ± 0.3 a
B25:CHM7.8 ± 0.05 a131.5 ± 6.3b0.033 ± 0.008 a14.89 ± 1.0 a3.44 ± 0.5 a439.9 ± 28.1 b0.32 ± 0.06 a6.61 ± 0.5 a17.1 ± 0.4 a
B10:CHM:NPK7.7 ± 0.01 a140.5 ± 5.5b0.034 ± 0.002 a15.80 ± 1.6 a4.22 ± 0.5 a525.8 ± 28.4 b0.26 ± 0.002 b7.20 ± 1.6 a15.1 ± 0.2 a
B25:CHM:NPK7.4 ± 0.03 b187.5 ± 4.1a0.050 ± 0.001 a17.65 ± 1.1 a3.89 ± 0.9 a674.4 ± 30.8 a0.42 ± 0.03 a6.35 ± 0.6 a14.3 ± 0.9 a
p value<0.001<0.001<0.001<0.001<0.05<0.001<0.001<0.001<0.001
Data are presented as means ± standard error. Significant differences (p < 0.05) between treatments are indicated by different letters in the same column. Ex. = exchangeable; C = control; B10 = 10 t ha−1 biochar application; B25 = 25 t ha−1 biochar application; B10:CHM = 10 t ha−1 biochar + 5 t ha−1 chicken manure; B25:CHM = 25 t ha−1 biochar + 5 t ha−1 chicken manure; B10:CHM:NPK = 10 t ha−1 biochar + 5 t ha−1 chicken manure + NPK; B25:CHM:NPK = 25 t ha−1 biochar + 5 t ha−1 chicken manure + NPK.
Table 5. Characteristics of experimental soil.
MeasurementUnits
Total N%0.02
Total C%0.03
C/N 1.68
Available NH4+-Nmg kg−111.7
Available NO3--Nmg kg−10.23
Available Phosphorusmg kg−1125.3
Exchangeable K contentcmol(c) kg−10.006
Exchangeable Ca contentcmol(c) kg−19.84
Exchangeable Mg contentcmol(c) kg−10.88
pH 7.86
ECμS cm−121
Table 6. Chemical properties of rice husk biochar.
MeasurementsUnit
Pyrolysis temperature°C900–1000
pH 6.45
EC(µS cm−1)856.3
CEC(cmol(c) kg−1)25.4
Exchangeable K(mg kg−1)14960
Exchangeable Mg(mg kg−1)421.1
Exchangeable Ca(mg kg−1)2415
Ash%44.9
Volatile Matter%18.7
Total N%0.81
Total C%33.7
C/N 41.8
Disclaimer/Publisher’s Note: The statements, opinions and data contained in all publications are solely those of the individual author(s) and contributor(s) and not of MDPI and/or the editor(s). MDPI and/or the editor(s) disclaim responsibility for any injury to people or property resulting from any ideas, methods, instructions or products referred to in the content.

