Article

Genome-Wide Analysis of the Nramp Gene Family in Kenaf (Hibiscus cannabinus): Identification, Expression Analysis, and Response to Cadmium Stress

1
School of Agriculture, Yunnan University, Kunming 650500, China
2
Zhejiang Xiaoshan Institute of Cotton&Bast Fiber Crops, Zhejiang Institute of Landscape Plants and Flowers, Zhejiang Academy of Agricultural Sciences, Hangzhou 311251, China
*
Authors to whom correspondence should be addressed.
These authors contributed equally to this work.
Plants 2024, 13(17), 2514; https://doi.org/10.3390/plants13172514
Submission received: 25 July 2024 / Revised: 22 August 2024 / Accepted: 5 September 2024 / Published: 7 September 2024
(This article belongs to the Special Issue Crop Functional Genomics and Biological Breeding)

Abstract

:
Kenaf (Hibiscus cannabinu) is a grass bast fiber crop that has the ability to tolerate and accumulate heavy metals, and it has been considered as a potential heavy metal accumulator and remediation plant. Nramp is a natural resistance-related macrophage, which plays an important role in the transport of divalent metal ions, plant growth and development, and abiotic stress. In this study, the Nramp gene family of kenaf was analyzed at the whole genome level. A total of 15 HcNramp genes were identified. They are distributed unevenly on chromosomes. Phylogenetic analysis classified 15 HcNramp proteins into 3 different subfamilies. All proteins share specific motif 4 and motif 6, and the genes belonging to the same subfamily are similar in structure and motif. The promoters are rich in hormone response, meristem expression, and environmental stress response elements. Under different treatments, the expression levels of HcNramp genes vary in different tissues, and most of them are expressed in roots first. These findings can provide a basis for understanding the potential role of the Nramp gene family in kenaf in response to cadmium (Cd) stress, and are of great significance for screening related Cd tolerance genes in kenaf.

1. Introduction

Heavy metal pollution is one of the most serious environmental problems, with cadmium (Cd) pollution being a primary concern among heavy metal pollutants. Cd stress significantly impacts plant growth and development, altering various physiological and metabolic processes [1,2,3,4]. Unlike other elements, Cd does not have a dedicated transporter in plants. It enters the roots and is transported to the shoots by competing with other nutrients for transport pathways [5]. Cd stress can trigger the accumulation of reactive oxygen species in plants, leading to decreased activities of superoxide dismutase (SOD) and peroxidase (POD) enzymes, thereby reducing antioxidant and detoxification capacities. In turn, it disrupts the antioxidant system and can cause membrane lipid peroxidation [1,4]. Hyperaccumulator plants have efficient Cd absorption, transportation, and detoxification systems, and are the main materials for remediation of heavy-metal-contaminated soil, which can be used to study the adaptability of plants in extreme environments [6].
Kenaf (Hibiscus cannabinus L.), also known as hibiscus, is an annual herbaceous bast fiber crop in the Malvaceae [7]. It boasts a short growth cycle coupled with substantial biomass yield [8,9]. Kenaf and other bast fiber crops possess the characteristics of wide cultivation adaptability, making them versatile and multifunctional. Kenaf is recognized as a new type of papermaking raw material that can replace wood pulp. Additionally, it serves as an important raw material in the traditional bast fiber textile industry, and has diverse applications, such as automobile lining, paper mulching, fluff pulp, sewage purification material, soil conditioner, plastic filler, activated carbon, and environmental protection adsorption material, and is known as a “potential superior crop in the 21st century” and “futuristic crop” [6,8,9,10,11]. Kenaf exhibits strong heavy metal tolerance and accumulation ability [1], and is not involved in the circulation of the food chain. It is considered to be a potential plant for repairing heavy metal pollution [1,12]. Cultivating crops in soils contaminated with heavy metals facilitates the remediation of degraded agricultural lands and enables the productive utilization of otherwise uncultivated areas [6,12]. In the treatment of heavy metal Cd stress, adding different forms and concentrations of nitrogen fertilizer can promote the growth of kenaf [13]. These crops can simultaneously provide fiber biomass raw materials for both traditional and innovative industries, offering new avenues for agricultural and industrial chain innovation [1].
Nramp (nature resistance-associated macrophage protein) is a natural resistance-associated macrophage protein [14]. It is an important proton/metal transporter in plants [15,16] and participates in the transport of heavy metals, such as zinc (Zn), iron (Fe), manganese (Mn), Cd, and arsenic (As) [5,17,18,19,20,21,22,23]. At the same time, it plays an important role in the transmembrane transport of divalent metals [5,10,15]. The Nramp sequence has a similar secondary structure among species [18], with 10–12 highly conserved transmembrane domains (TMD) [16,18,22,24], and has the structural characteristics of ion channels and ion transporters in evolution [18]. The gene family plays an important regulatory role in maintaining cell homeostasis, photosynthesis, protein activity, and plant response to environmental stress [18,24,25]. It keeps the balance of metal ions in plants through the transport of metal ions. It plays an important role in the detoxification of heavy metals [18,26,27] and has ion-selective changes in different genes [24]. Nramp proteins have been discovered in a variety of plants, including Arabidopsis thaliana [28], tomato (Solanum lycopersicum) [21], seabuckthorn (Hippophae rhamnoides) [25], soybean (Glycine max) [20], rice (Oryza sativa) [29], Populus trichocarpa [14], and potato (Solanum tuberosum) [21]. Nramp protein is the key to plant uptake and transport of Cd [6].
There is a lot of evidence that Nramp transcription factors in plants play a key role in various biological processes. AtNramp1 is a transporter encoding Fe, Mn, and Cd [21,23,30], which is a key transporter of Mn absorption under low Mn conditions [18]. In response to Cd treatment, AtNramp3 undergoes overexpression, thereby assuming a pivotal role in facilitating Fe transport and modulating the sensitivity of plants to Cd [28]. AtNramp6 functions as a transporter for both Cd and Fe [23], exhibiting a dual role in nutrient and metal homeostasis. When Fe is deficient, AtNramp6 has been shown to influence the growth of lateral roots in mustard plants [30], suggesting its importance in adapting to Fe limiting conditions. Despite its high sensitivity to Cd, AtNramp6 does not significantly alter the overall Cd content within plants. Rather, it appears to enhance the tolerance of plants to Cd stress, allowing them to better withstand exposure to this toxic metal [18,25,30]. Rice OsNramp1 is a transporter that plays a pivotal role in the absorption and translocation of Cd. Its involvement promotes the accumulation of both As and Cd within the plant. Specifically, when OsNramp1 is overexpressed, it enhances the accumulation of Cd in leaves, contributing to elevated Cd levels in the photosynthetic tissues. Furthermore, when overexpressed in roots, OsNramp1 increases the translocation of Cd to stems, indicating its role in facilitating the long-distance movement of this toxic metal within the rice plant [18]. OsNramp6 is a Fe and Mn transporter located in the plasma membrane, which is helpful for disease resistance [5,19]. Tomato SlNramp2 and SlNramp3 are genes related to Cd absorption by roots, and they are highly expressed under Cd stress [31]. SlNramp3 is a heavy metal transporter, which is involved in the transport of heavy metals from roots to stems [32]. SaNramp1 from Sedum alfredii can transport Cd, Mn, and Zn, and its overexpression in tobacco significantly increases the contents of Cd, Zn, and Mn above ground [33]. Overexpression of TtNramp1 can improve Cd transport, while overexpression of TtNramp6 can increase Cd content in plants and promote Cd accumulation [34]. Tian et al. identified and analyzed the Nramp gene family of potato and its response to five kinds of heavy metal stresses, such as Cu2+, Cd2+, and Zn2+ [21]. Chen et al. identified the whole genome of the Nramp gene family of Spirodela polyrhiza and analyzed the expression of Cd stress [19]. Hussain et al. identified and analyzed the whole genome of the Nramp gene family in Kandelia obovate and its response to copper (Cu) stress [35]. Genome-wide identification and evolutionary analysis of the Nramp gene family in the AC genome of Brassica species was performed by Zhao et al. [27]. However, there is no systematic analysis of Nramp transcription factors in kenaf to clarify their role in responding to heavy metal stress.
In this study, the Nramp of kenaf was comprehensively analyzed. Fifteen Nramp genes were identified by bioinformatics, and the phylogenetic analysis, conserved motifs, domains, gene structure, subcellular localization, chromosome position, cis-regulatory elements, and expression profile were deeply analyzed at the whole genome level. In addition, qRT-PCR was used to detect the effects of four treatments on the expression pattern of HcNramps. Our findings serve as a solid foundation for future endeavors aimed at unraveling the multifaceted functions of the Nramp gene family in kenaf’s resilience against heavy metal stress. They offer invaluable insights into the evolutionary mechanisms governing HcNramps, while simultaneously presenting novel strategies to tackle the challenge of heavy metal accumulation in plants. In essence, this study provides insights into a deeper understanding of the interactions between plants and metals and the development of innovative solutions to reduce environmental pollution.

2. Results

2.1. Identification and Characterization of Nramp Genes in Kenaf

Following a search of the kenaf genome database using HMMER 3.0, the identified candidate sequences were examined using NCBI Batch CDD, Pfam, and SMART to confirm the presence of the Nramp domain. A total of 15 HcNramp gene family members were identified from the kenaf genome (Table S1), which were systematically named based on their chromosomal positions, designated as HcNramp1 through HcNramp15 (Table S2). The analysis of the physicochemical properties revealed a diverse range of characteristics among the identified proteins. Specifically, the length varied from 221 to 1379 amino acids, with the relative molecular weight range from 24,223.94 to 150,763.33 Da. The theoretical isoelectric point (pI) ranged from 5.08 to 10.18, with one member having a pI value of 7. Seven were alkaline proteins and another eight were acidic proteins. The instability coefficient ranged from 30.06 to 44.88. Among them, HcNramp2/8/9/10/12 protein was unstable. From the Aliphatic index, HcNramp7 protein was the most stable, with a reading of 124.21. HcNramp12 protein was the most unstable, with a reading of 89.04. The average total hydrophilicity (GRAVY) ranged from −0.092 to 0.656, and HcNramp2/9/10/12 were hydrophilic proteins, and the remaining proteins were hydrophobic proteins. Subcellular localization showed that all HcNramp proteins were located on the plasma membrane, HcNramp3/5 proteins were also located in the vacuole, and HcNramp11 proteins were located on the endoplasmic reticulum.

2.2. Secondary Structure Analysis of HcNramp Family Proteins

The secondary structures of HcNramp family proteins were mainly composed of α-helix, extended chain, folding, and random coil (Table S3). Among them, the proportion of α-helix was the highest, ranging from 39.85% to 59.08%, and the proportion of extended chain was the least, ranging from 5.15% to 13.57%. Only HcNramp2 protein had folding, no random coil, and the rest of the proteins had random coil, indicating that the protein structures were stable. The proportion of secondary structures of HcNramp8/9/10 was extended strand < alpha-helix < random coil, which indicates that the three protein structures were variable and may be the sites of proteins with special functions.

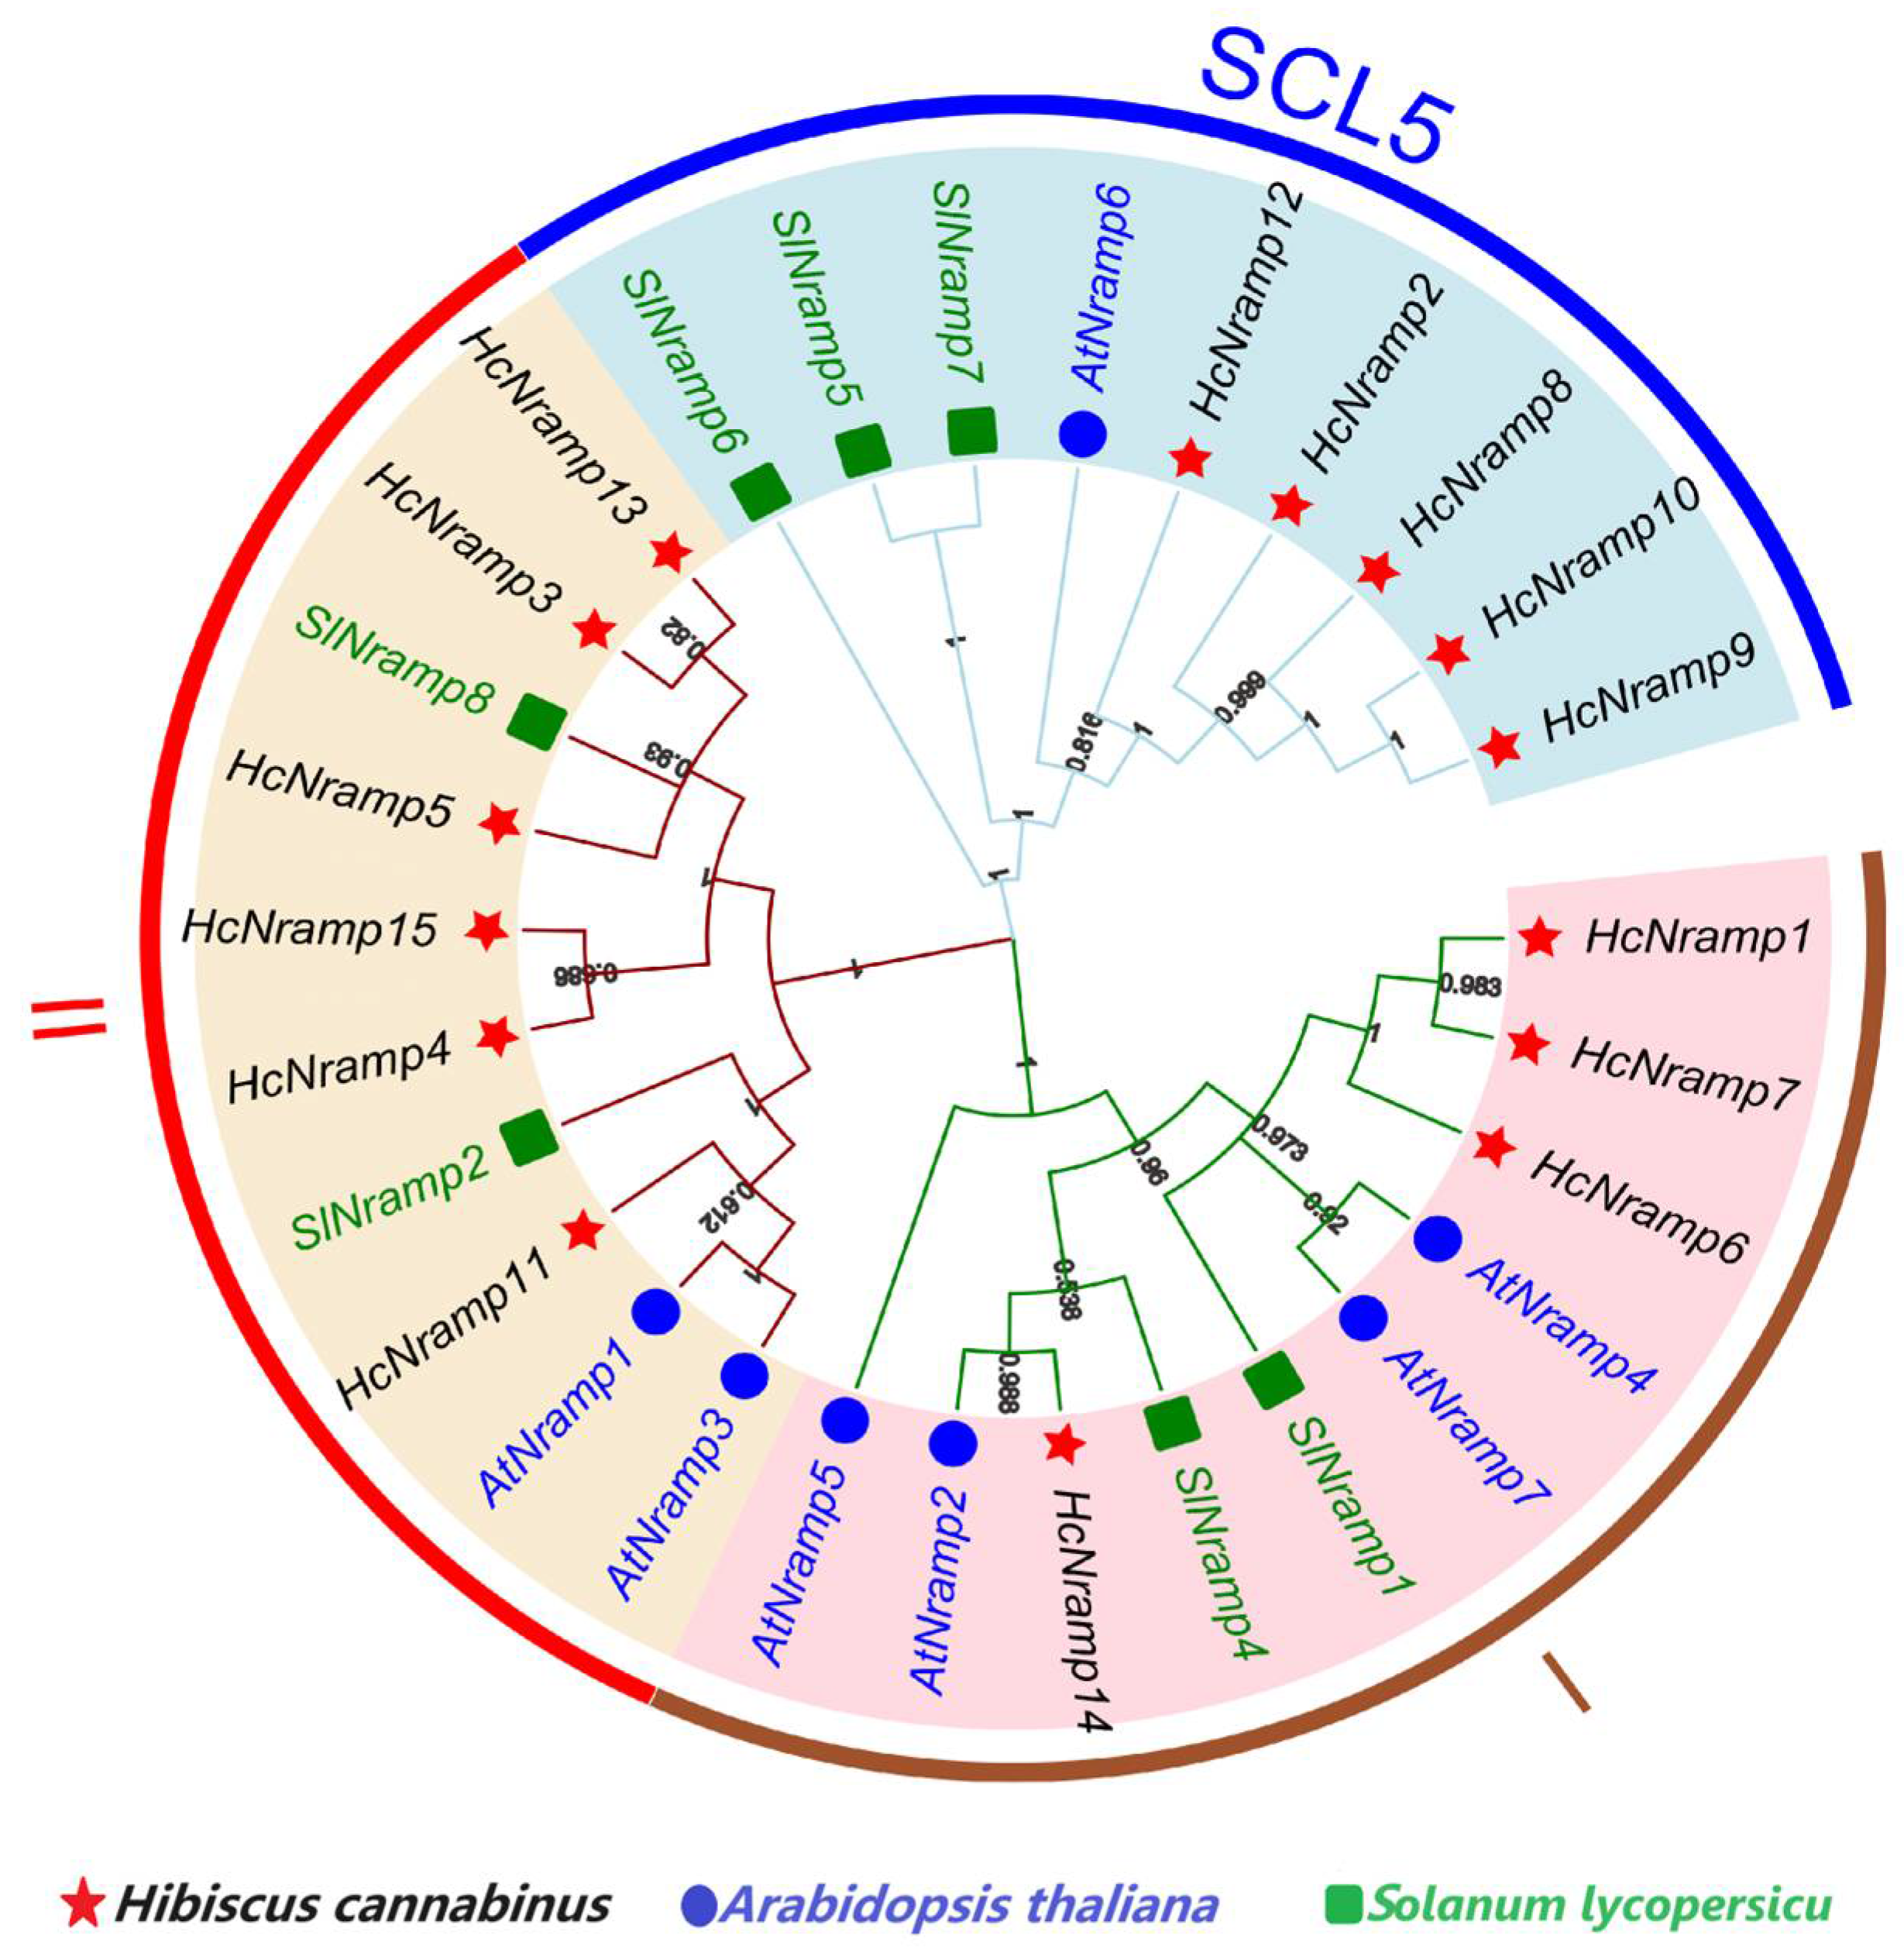
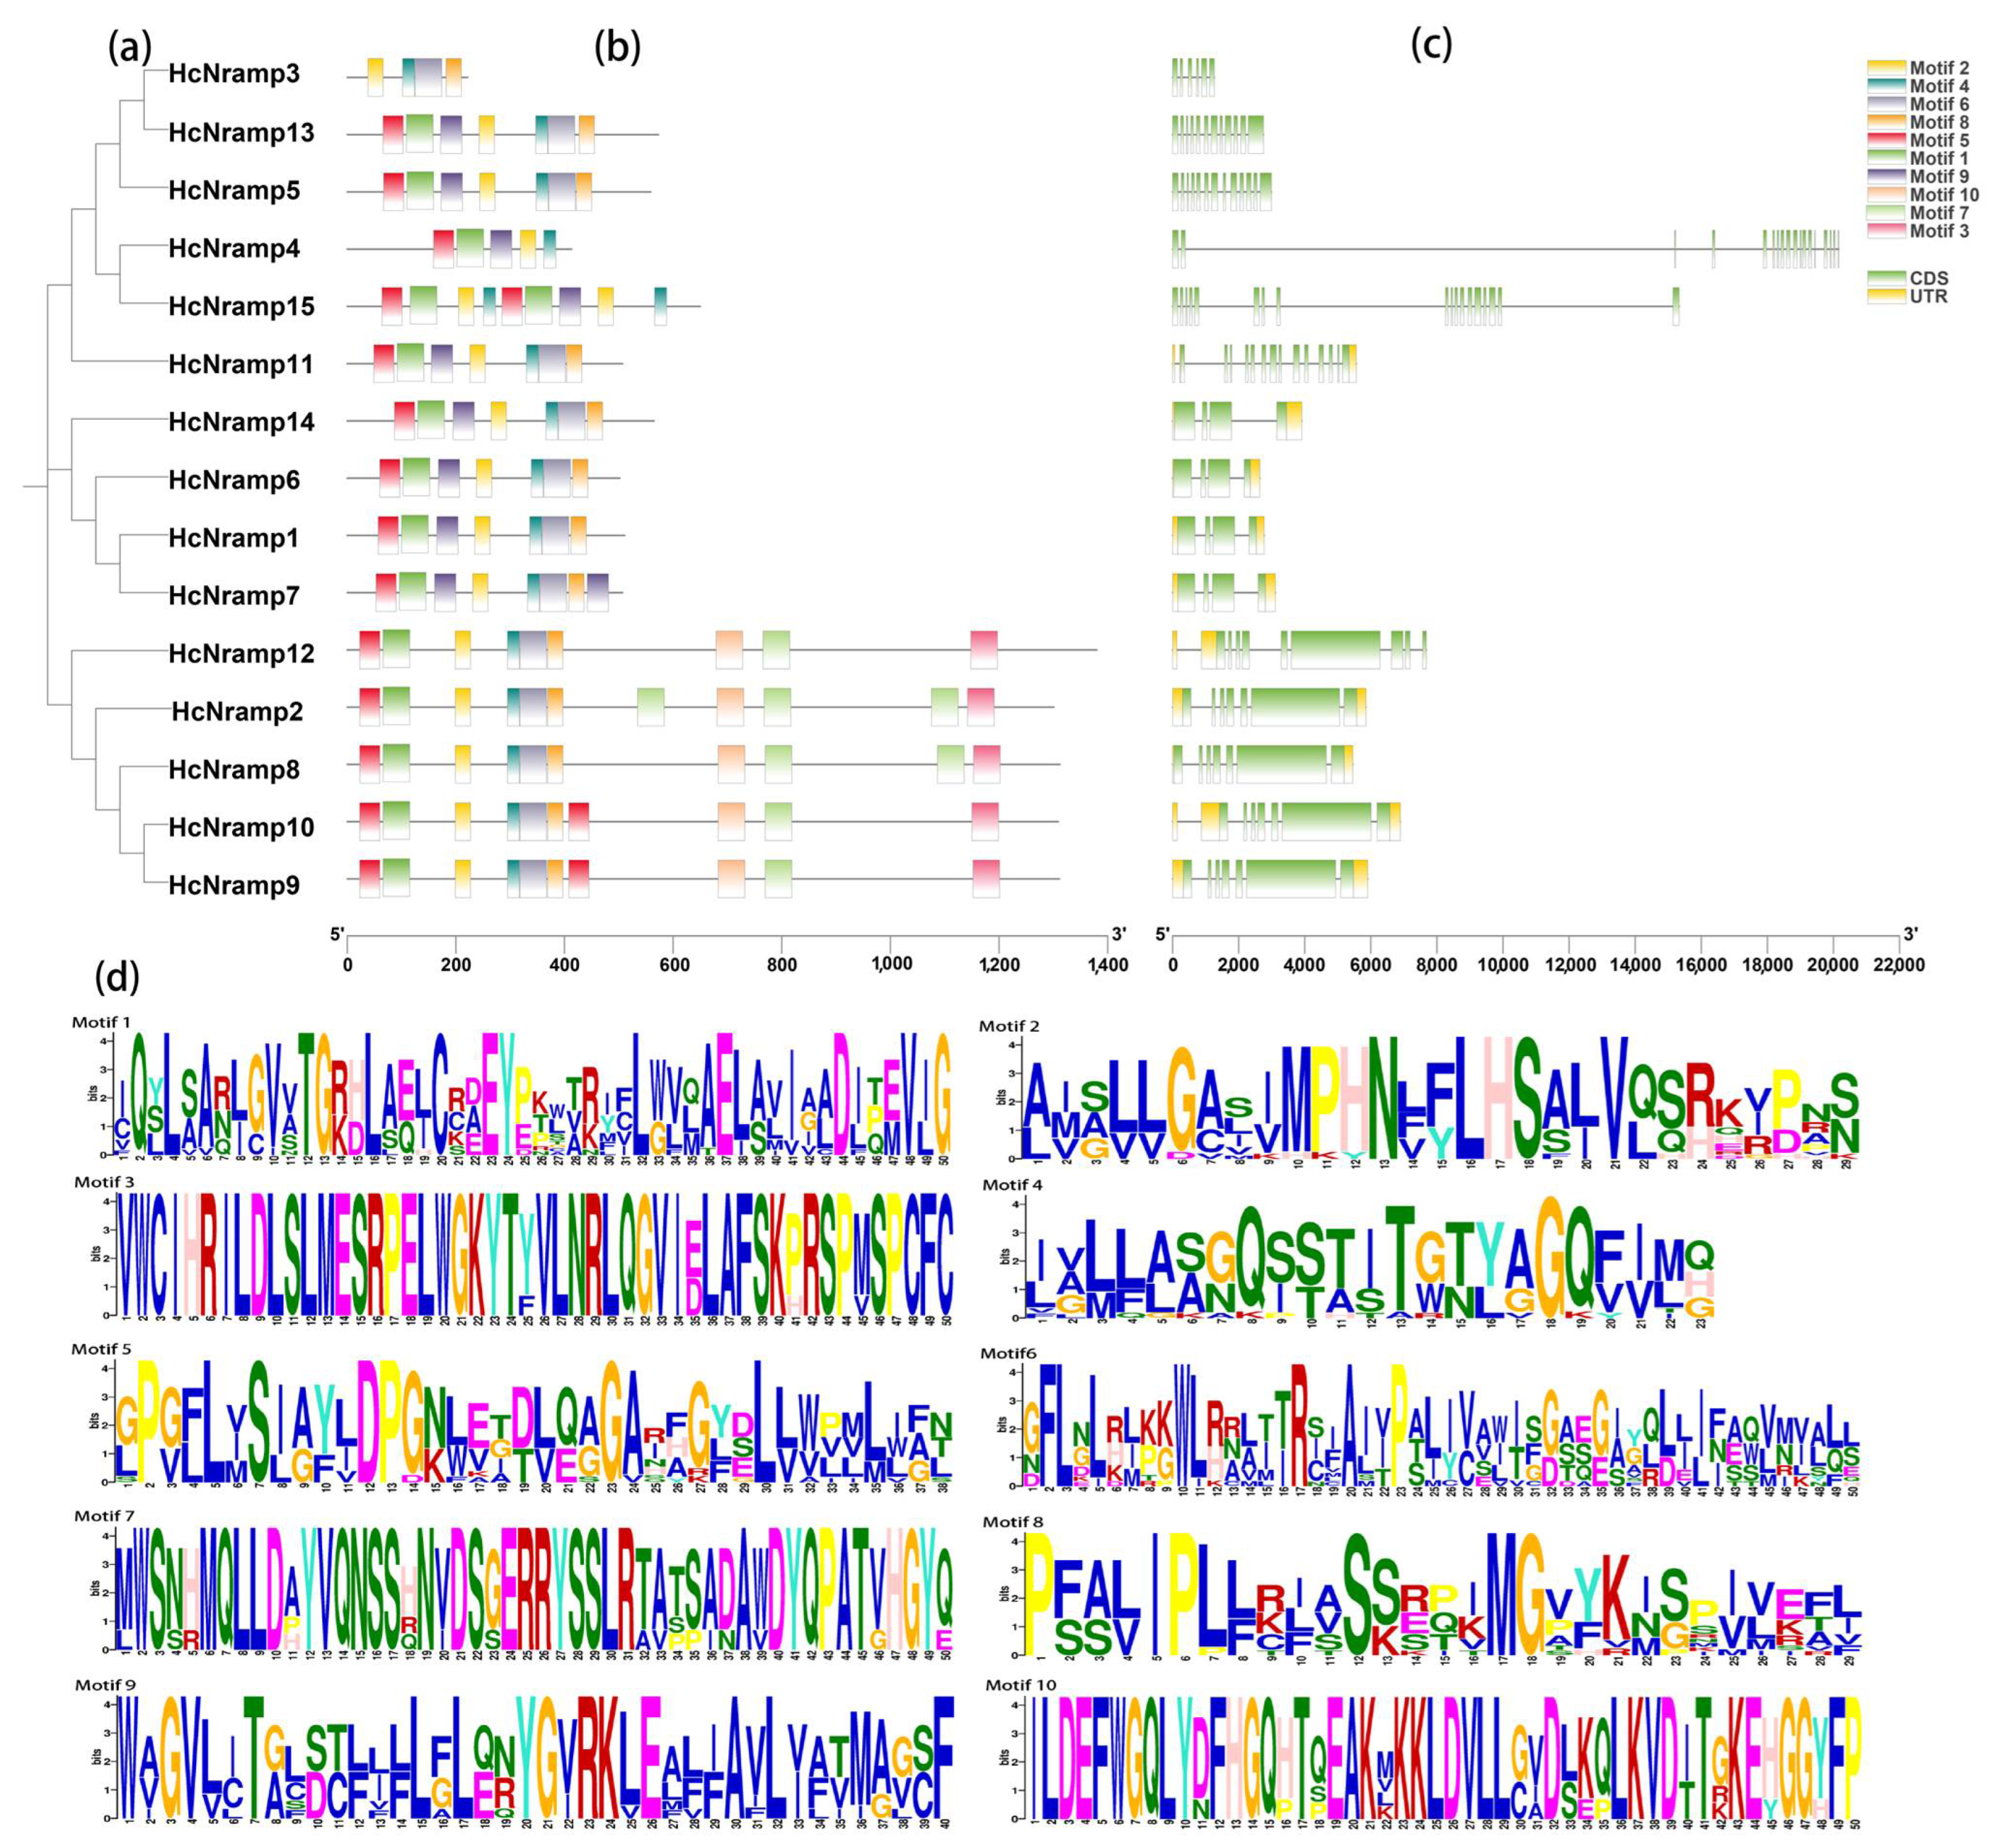
2.3. Classification, Phylogenetic Analysis, Gene Structure, and Conserved Motifs of the HcNramp Gene Family

In order to understand the evolutionary relationship of the Nramp gene family in kenaf and other species, a phylogenetic tree of 29 Nramp protein sequences was constructed, including 15 HcNramp kenaf proteins, 7 A. thaliana proteins, and 7 tomato proteins (Table S4). These three species were divided into three categories (Figure 1), which were the I, II, and SLC5 subfamilies. HcNramp1/6/7/14 belong to subfamily I, with proteins ranging in length from 501 to 564 amino acids, theoretical pI ranging from 5.08 to 5.41, instability coefficient ranging from 32.56 to 37.38, and Aliphatic index ranging from 116.17 to 124.21, indicating that the proteins in this subfamily were stable, all of which were hydrophobic proteins, and this subfamily was secondary in protein. HcNramp3/4/5/11/13/15 belong to subfamily II, with amino acids ranging from 221 to 649, pI ranging from 7.12 to 10.18, instability coefficient ranging from 30.06 to 33.82, and Aliphatic index ranging from 122.53 to 106.97. The proteins were stable and all hydrophobic. HcNramp2/8/9/10/12 belong to the SCL5 subfamily, with the proteins ranging in length from 1300 to 1379 amino acids, the theoretical pI ranging from 5.43 to 7, the instability coefficient ranging from 41.11 to 44.88, and the Aliphatic index ranging from 89.04 to 94.10. All proteins were unstable except HcNramp in the SCL5 subfamily. In the secondary structure of proteins, the proportion of folding was the highest in HcNramp2, and the proportion of random curl was the highest in HcNramp8/9/10. The proportion of α-helix and random curl in HcNramp12 is the same. Protein in the same subfamily is species-specific, indicating that these proteins may have similar structures. The cross-species phylogenetic analysis of Nramps in kenaf, A. thaliana, and tomato showed that all the homologous Nramps could be well clustered together (Figure 1). HcNramp1/6/7/14 in kenaf, AtNramp2/5/4/7 in A. thaliana, and SlNramp1/4 in tomato belong to subfamily I. HcNramp3/4/5/11/13/15 in kenaf, AtNramp1/3 in A. thaliana, and SlNramp2/8 in tomato belong to subfamily II. HcNramp2/8/9/10/12 in kenaf, AtNramp6 in A. thaliana, and SlNramp5/6/7 in tomato belong to subfamily SCL5.
The conserved motif prediction of the kenaf Nramp protein sequence was performed using MEME Suite 5.5.5 online software. The results showed that the motifs between different subfamilies were different, and the motifs between members of the same subfamily were relatively conserved (Figure 2 and Table S5). In the Nramp gene family of kenaf, all 15 HcNramps contained motif 4 and motif 6, indicating that the motif of the kenaf Nramp gene is relatively conservative. Most of the HcNramps contained motifs 1/2/4/5/6/8/9, where only HcNramp4 and HcNramp5 contained only motifs 4 and 5, respectively. The difference in the number of conserved motifs of the gene indicates that the gene has functional differences with other genes and may have different biochemical characteristics and biological functions [3]. Gene structure analysis showed that each gene contained introns, and the number of introns varied greatly, with a maximum of 17 introns and a minimum of 3 introns. The HcNramp genes clustered in the same branch of the phylogenetic tree were similar in exon–intron tissues. The HcNramp3/4/5/13/15 genes in the same branch did not contain untranslated regions (UTRs) at the 5’ and 3’ ends. Among them, HcNramp12 did not contain untranslated regions (UTRs) at the 3’ end, and the remaining nine genes had complete gene structures.

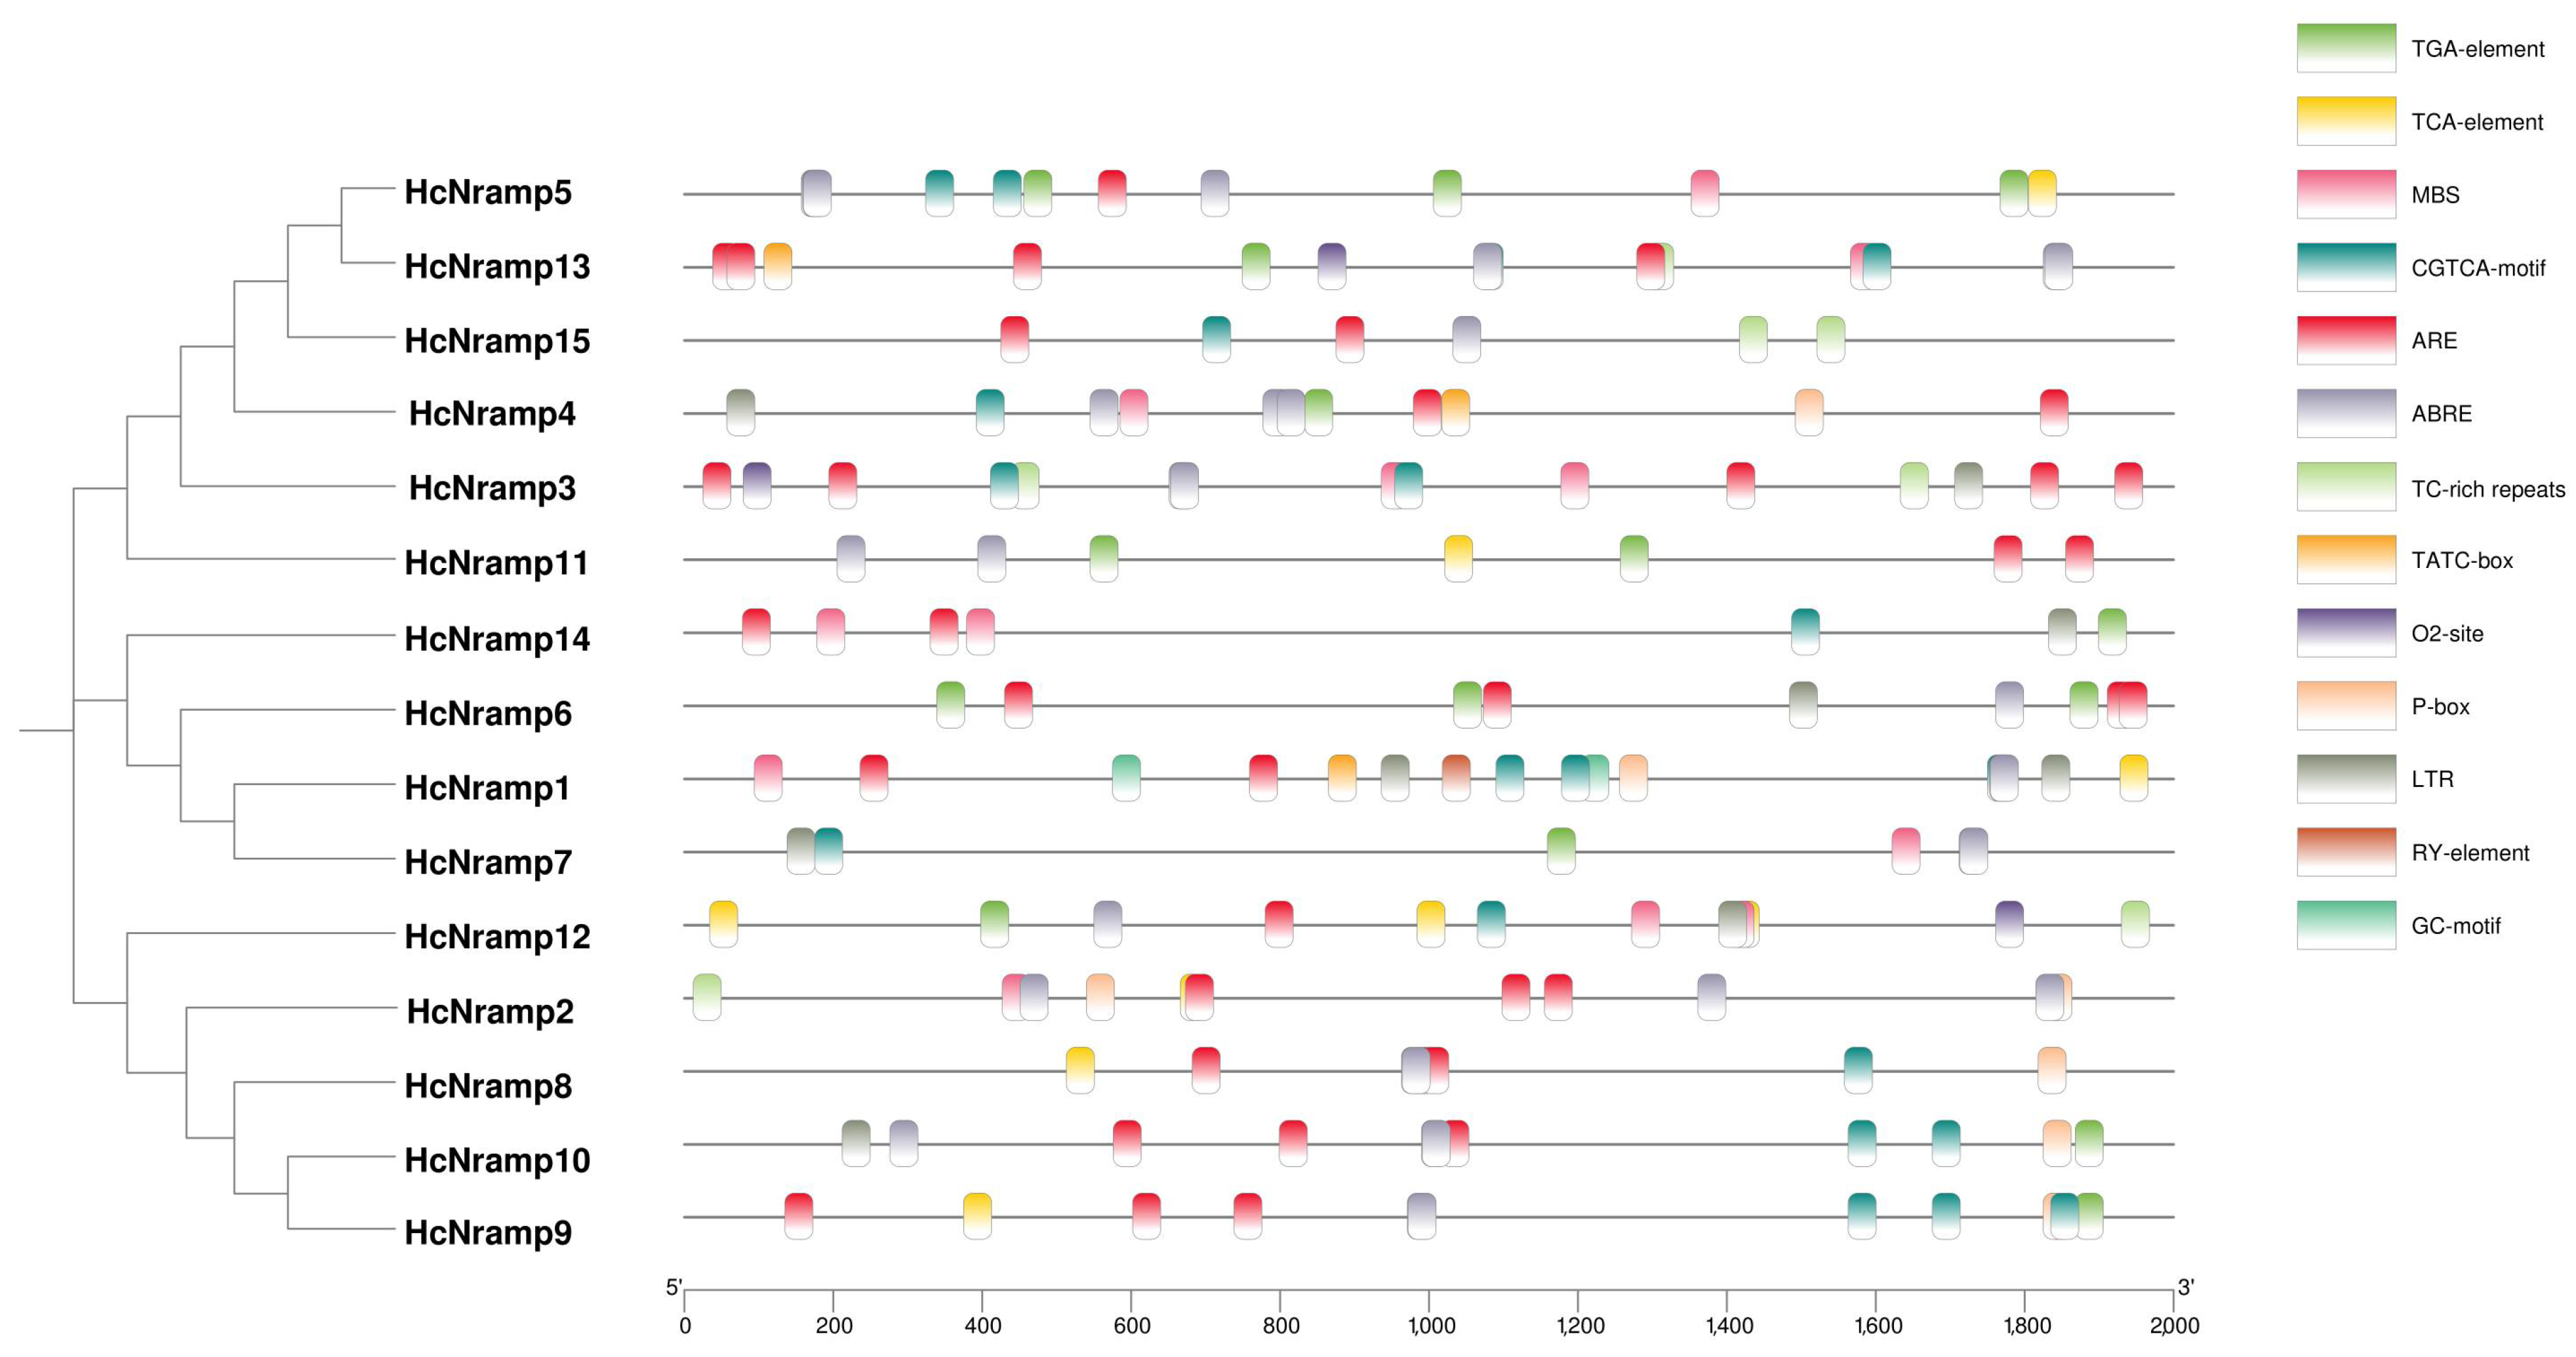
2.4. Analysis of Cis-Acting Elements of HcNramp Promoter

The cis-regulatory elements in the promoter region (including 2,000 base pairs upstream) were comprehensively analyzed and screened, and the online software PlantCare was used for analysis (Figure 3). The results showed that 156 cis-acting elements were divided into 3 parts, including abiotic stress response elements (67 elements accounted for 42.95%), hormone response elements (85 elements accounted for 54.49%), and growth and development response elements (4 elements accounted for 2.56%). HcNramp gene was involved in a complex regulatory network and was regulated by various environmental, developmental, and physiological factors.
The abiotic stress elements are composed of hypoxia/anaerobic induction, defense and stress elements, and cis-elements necessary for drought and low temperature. These abiotic stresses were composed of 2 GC-motifs (2.99%), 37 AREs (55.22%), 7 TC-rich repeats (10.45%), 12 MBSs (17.91%), and 9 LTRs (13.43%). HcNramp3 contains ten abiotic stress response elements, including two TC-rich repeats, two MBSs, one LTR, and five AREs; secondly, HcNramp1 contains seven abiotic stress response elements, including one MBS, two LTRs, two GC-motifs, and two AREs. This indicates that HcNramp3 may play an important role in anaerobic stress.
The hormone response elements include auxin, gibberellin, salicylic acid, abscisic acid, and methyl jasmonate response elements. They were composed of 15 TGA elements (17.65%), 3 TATC-box (3.53%), 7 P-box (8.24%), 9 TCA elements (10.59%), 31 ABREs (36.47%), and 20 CGTCA motifs (23.53%). HcNramp5 has 10 hormone response elements, including 3 TGA elements, 1 TCA element, 2 CGTCA motifs, and 4 ABREs, indicating that the gene may be involved in the regulation of abscisic acid. Secondly, there were two genes containing eight hormone response elements, namely, HcNramp1 (including one TCA element, one TATC-box, one p-box, three CGTCA motifs, and two ABREs) and HcNramp9 (one TGA element, one TCA element, one P-box, three CGTCA motifs, and two ABREs), indicating that HcNramp1 and HcNramp9 genes are involved in the regulation of methyl jasmonate.
Growth and development response elements, including seed-specific cis-acting elements and zein metabolic regulation, were composed of one RY element (25%) and three O2 sites (75%). Among them, HcNramp1 contains a RY element, which indicates that the gene is involved in the specific regulation of seed expression. HcNramp3/2/13 all contained one O2 site, indicating that these three genes may be involved in the metabolism of gliadin.

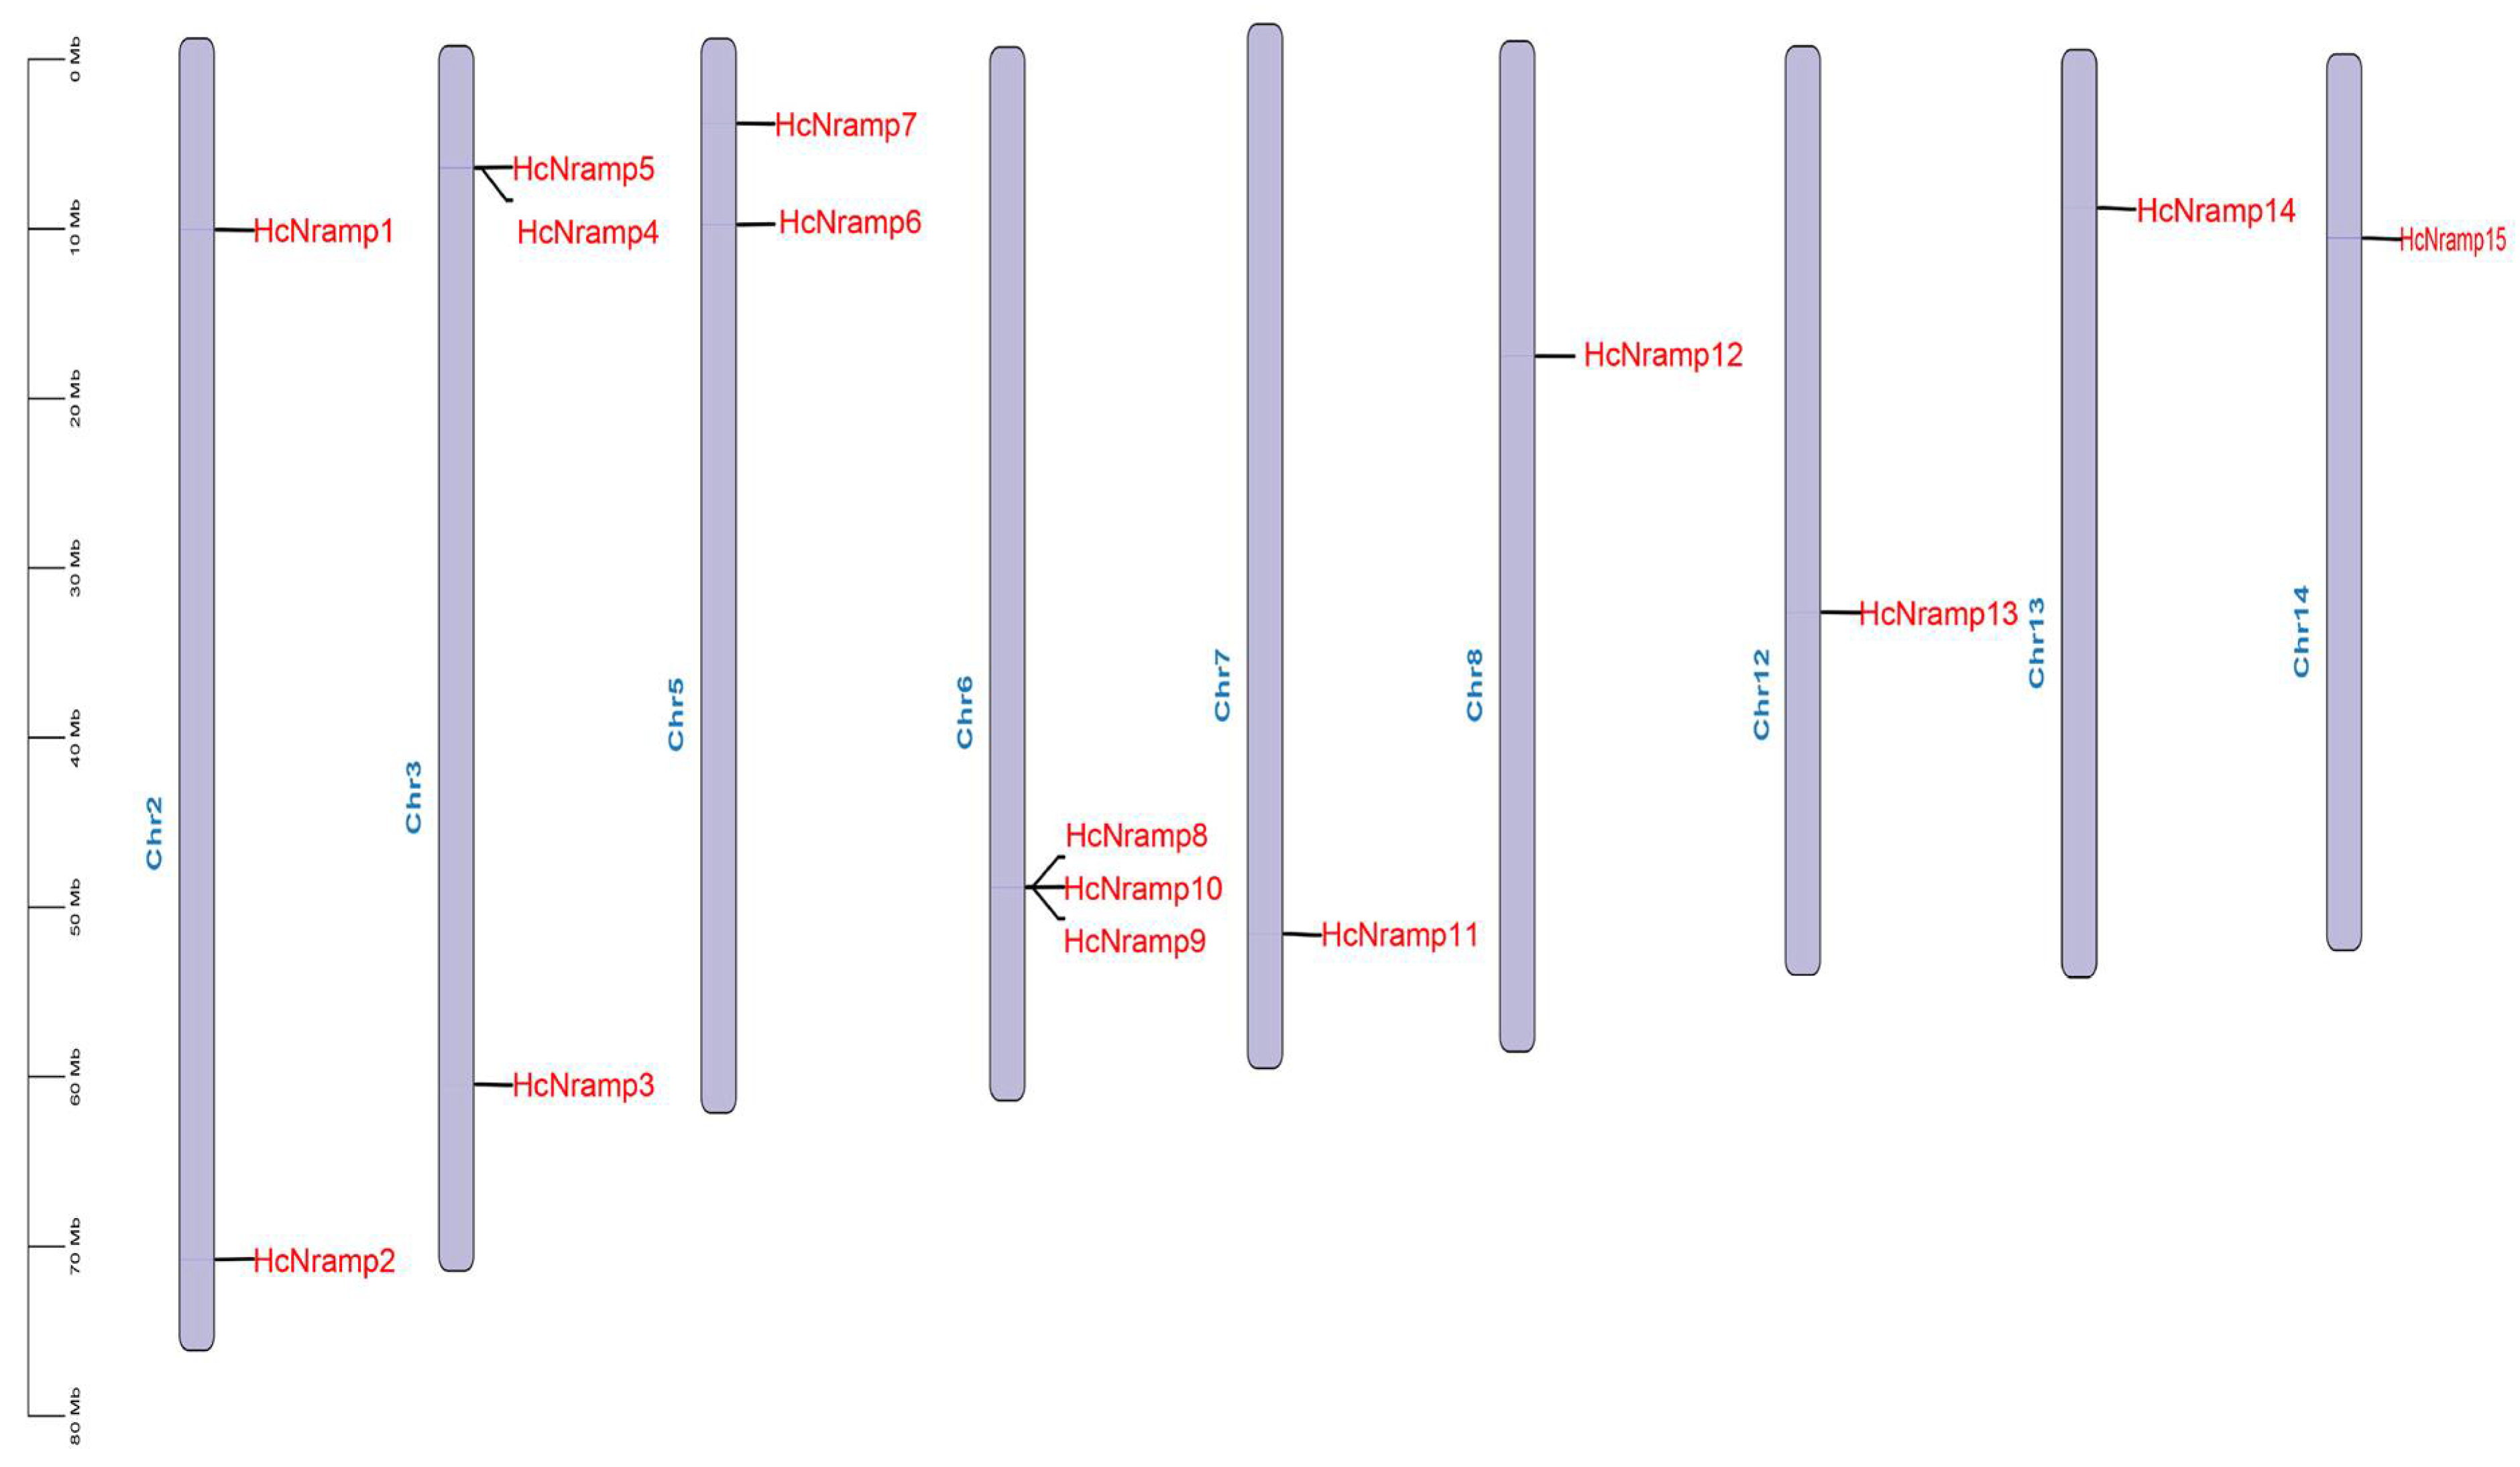
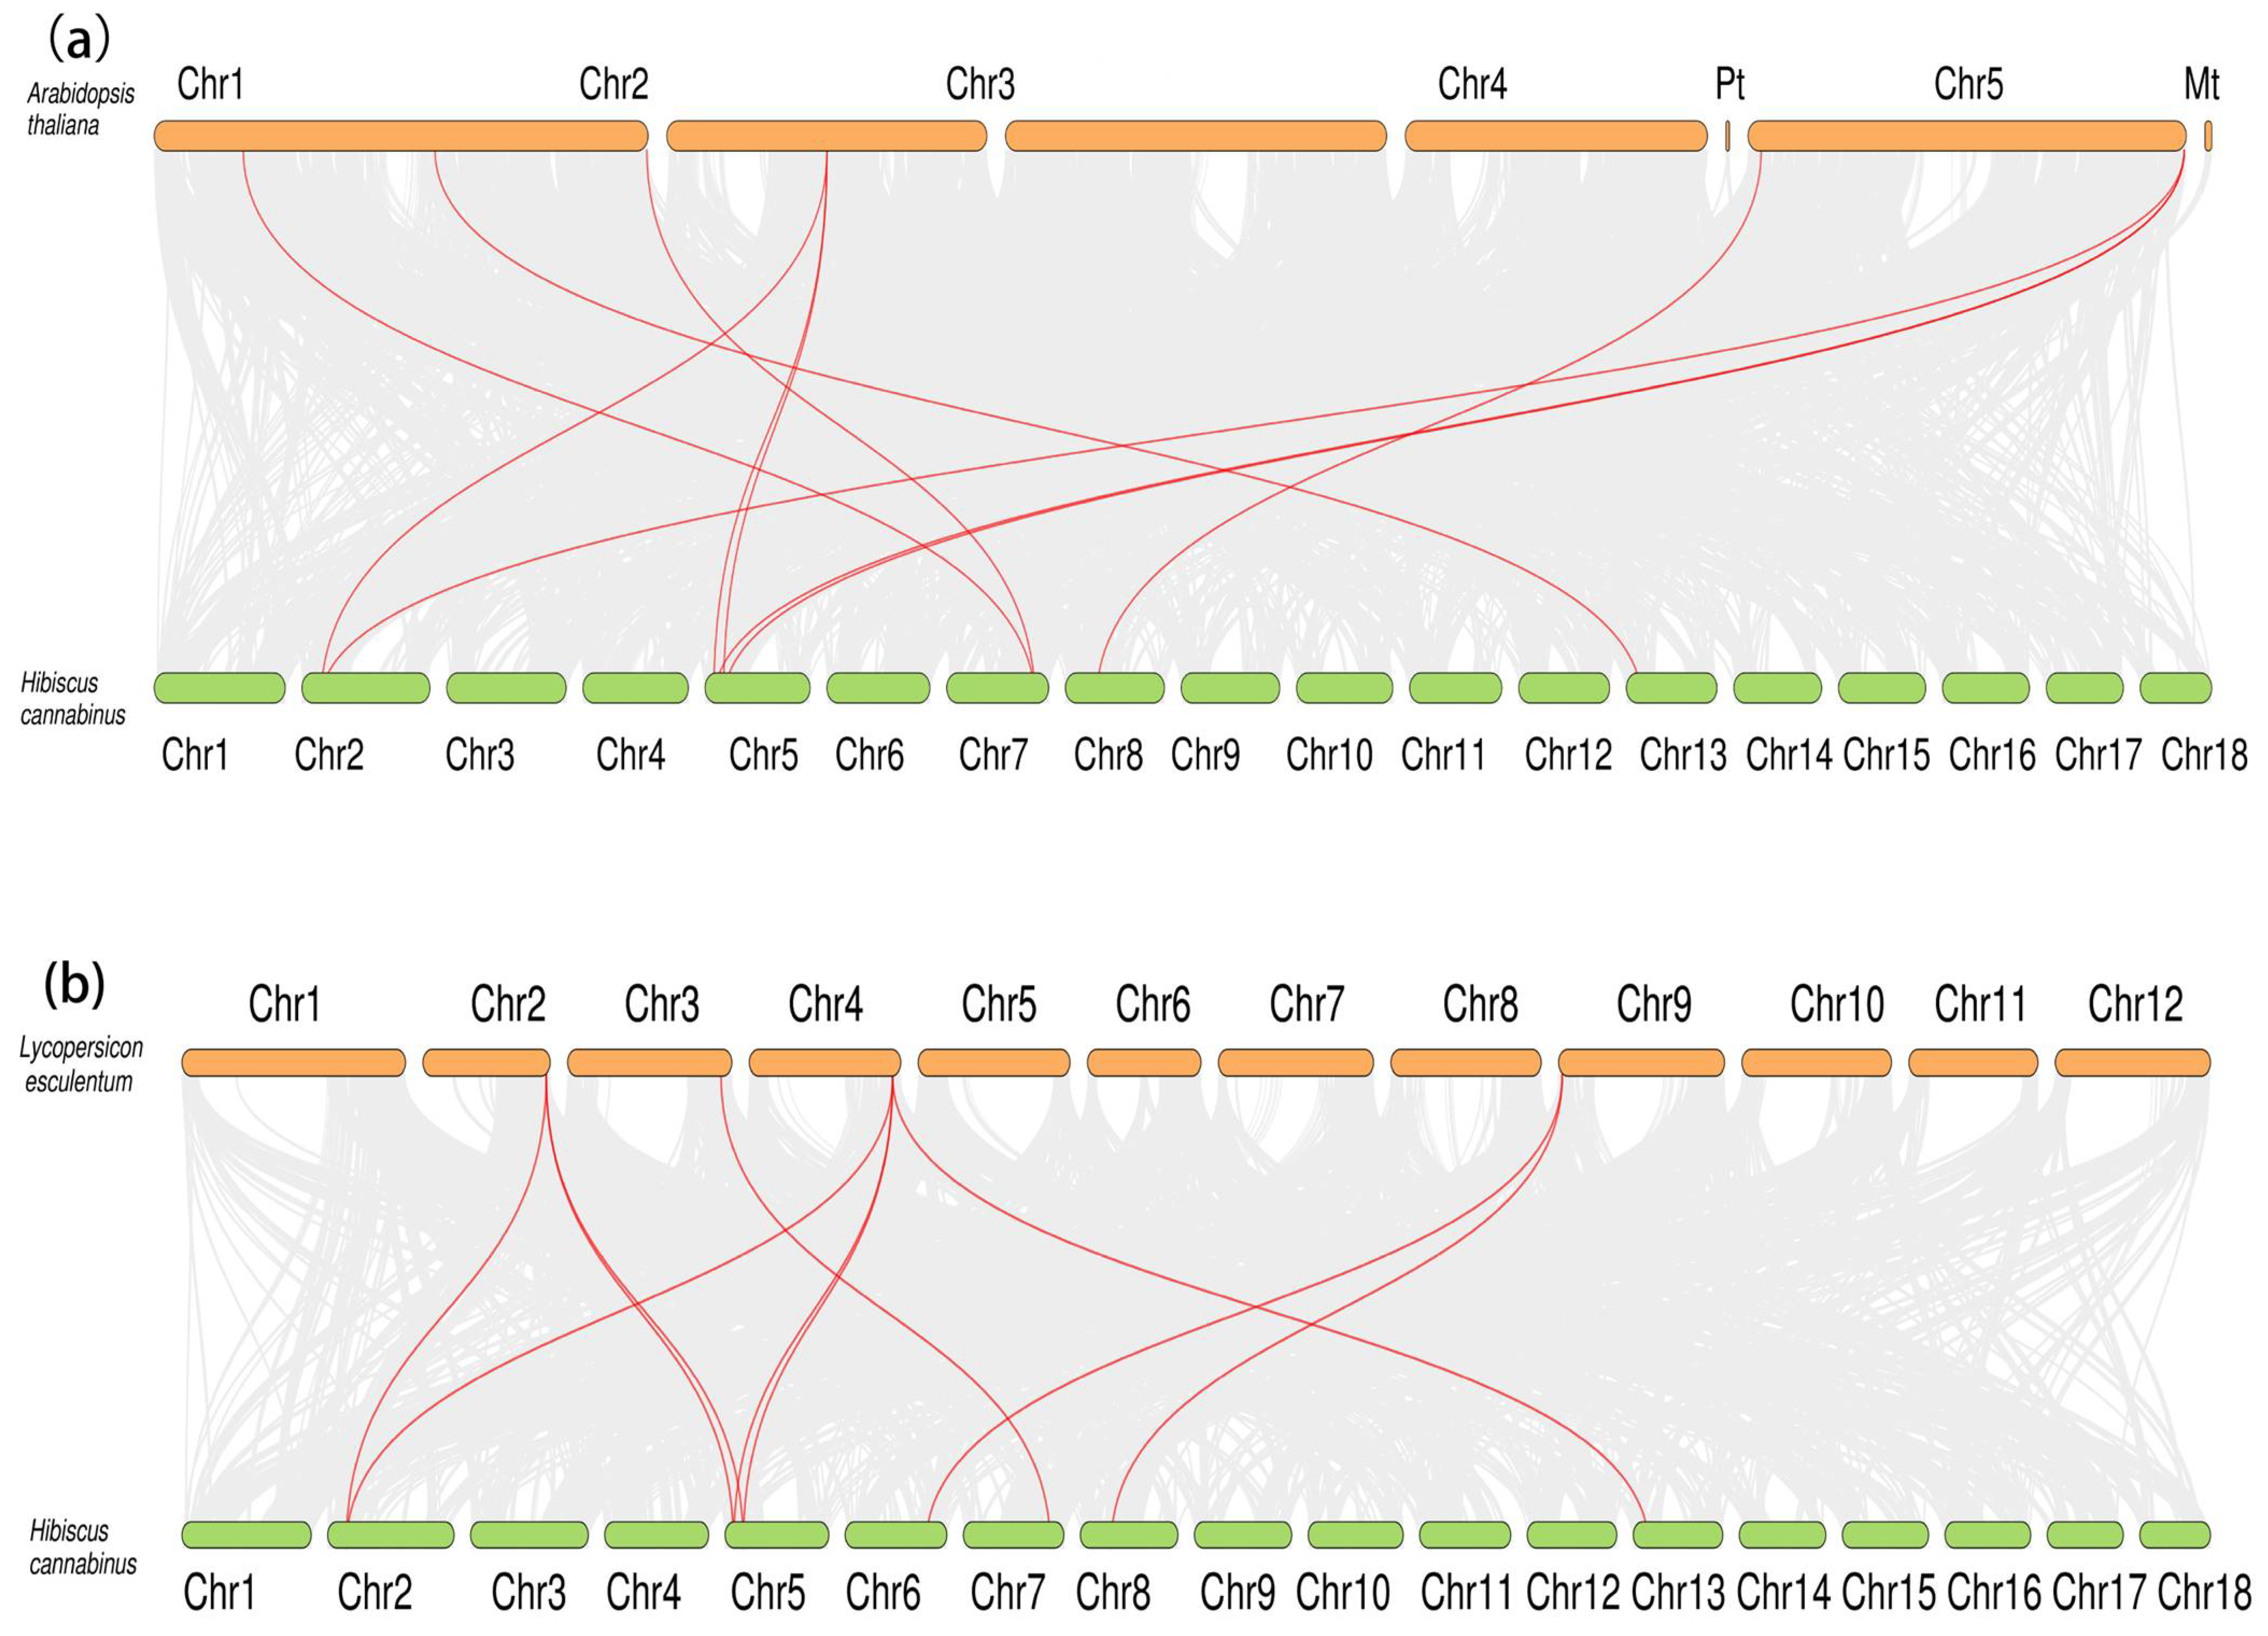
2.5. Chromosomal Localization and Collinearity Analysis of HcNramp Genes

The 15 HcNramp genes were located on 9 chromosomes, and the distribution of each gene on the chromosome was uneven. The HcNramp gene was most distributed on Chr3 and Chr6 chromosomes, with three genes located, followed by two genes located on both Chr2 and Chr5 chromosomes, and only one gene located on Chr7, Chr8, Chr12, Chr13, and Chr14 (Figure 4).
In order to clarify the evolutionary relationship, the replication of the HcNramp gene was studied. It was found that there were six collinear gene pairs in the kenaf species (Figure 5), including HcNramp1:HcNramp6, HcNramp1:HcNramp7, and HcNramp6:HcNramp7 in subfamily I, HcNramp3:HcNramp15 in subfamily II, and HcNramp2:HcNramp8 in subfamily SCL5. In order to further study the homology of Nramp gene members among different species, collinear maps of Nramp gene families of kenaf and A. thaliana, and kenaf and tomato, were drawn. There were ten collinear gene pairs in kenaf and A. thaliana, and ten collinear gene pairs in kenaf and tomato (Figure 6 and Table S6).

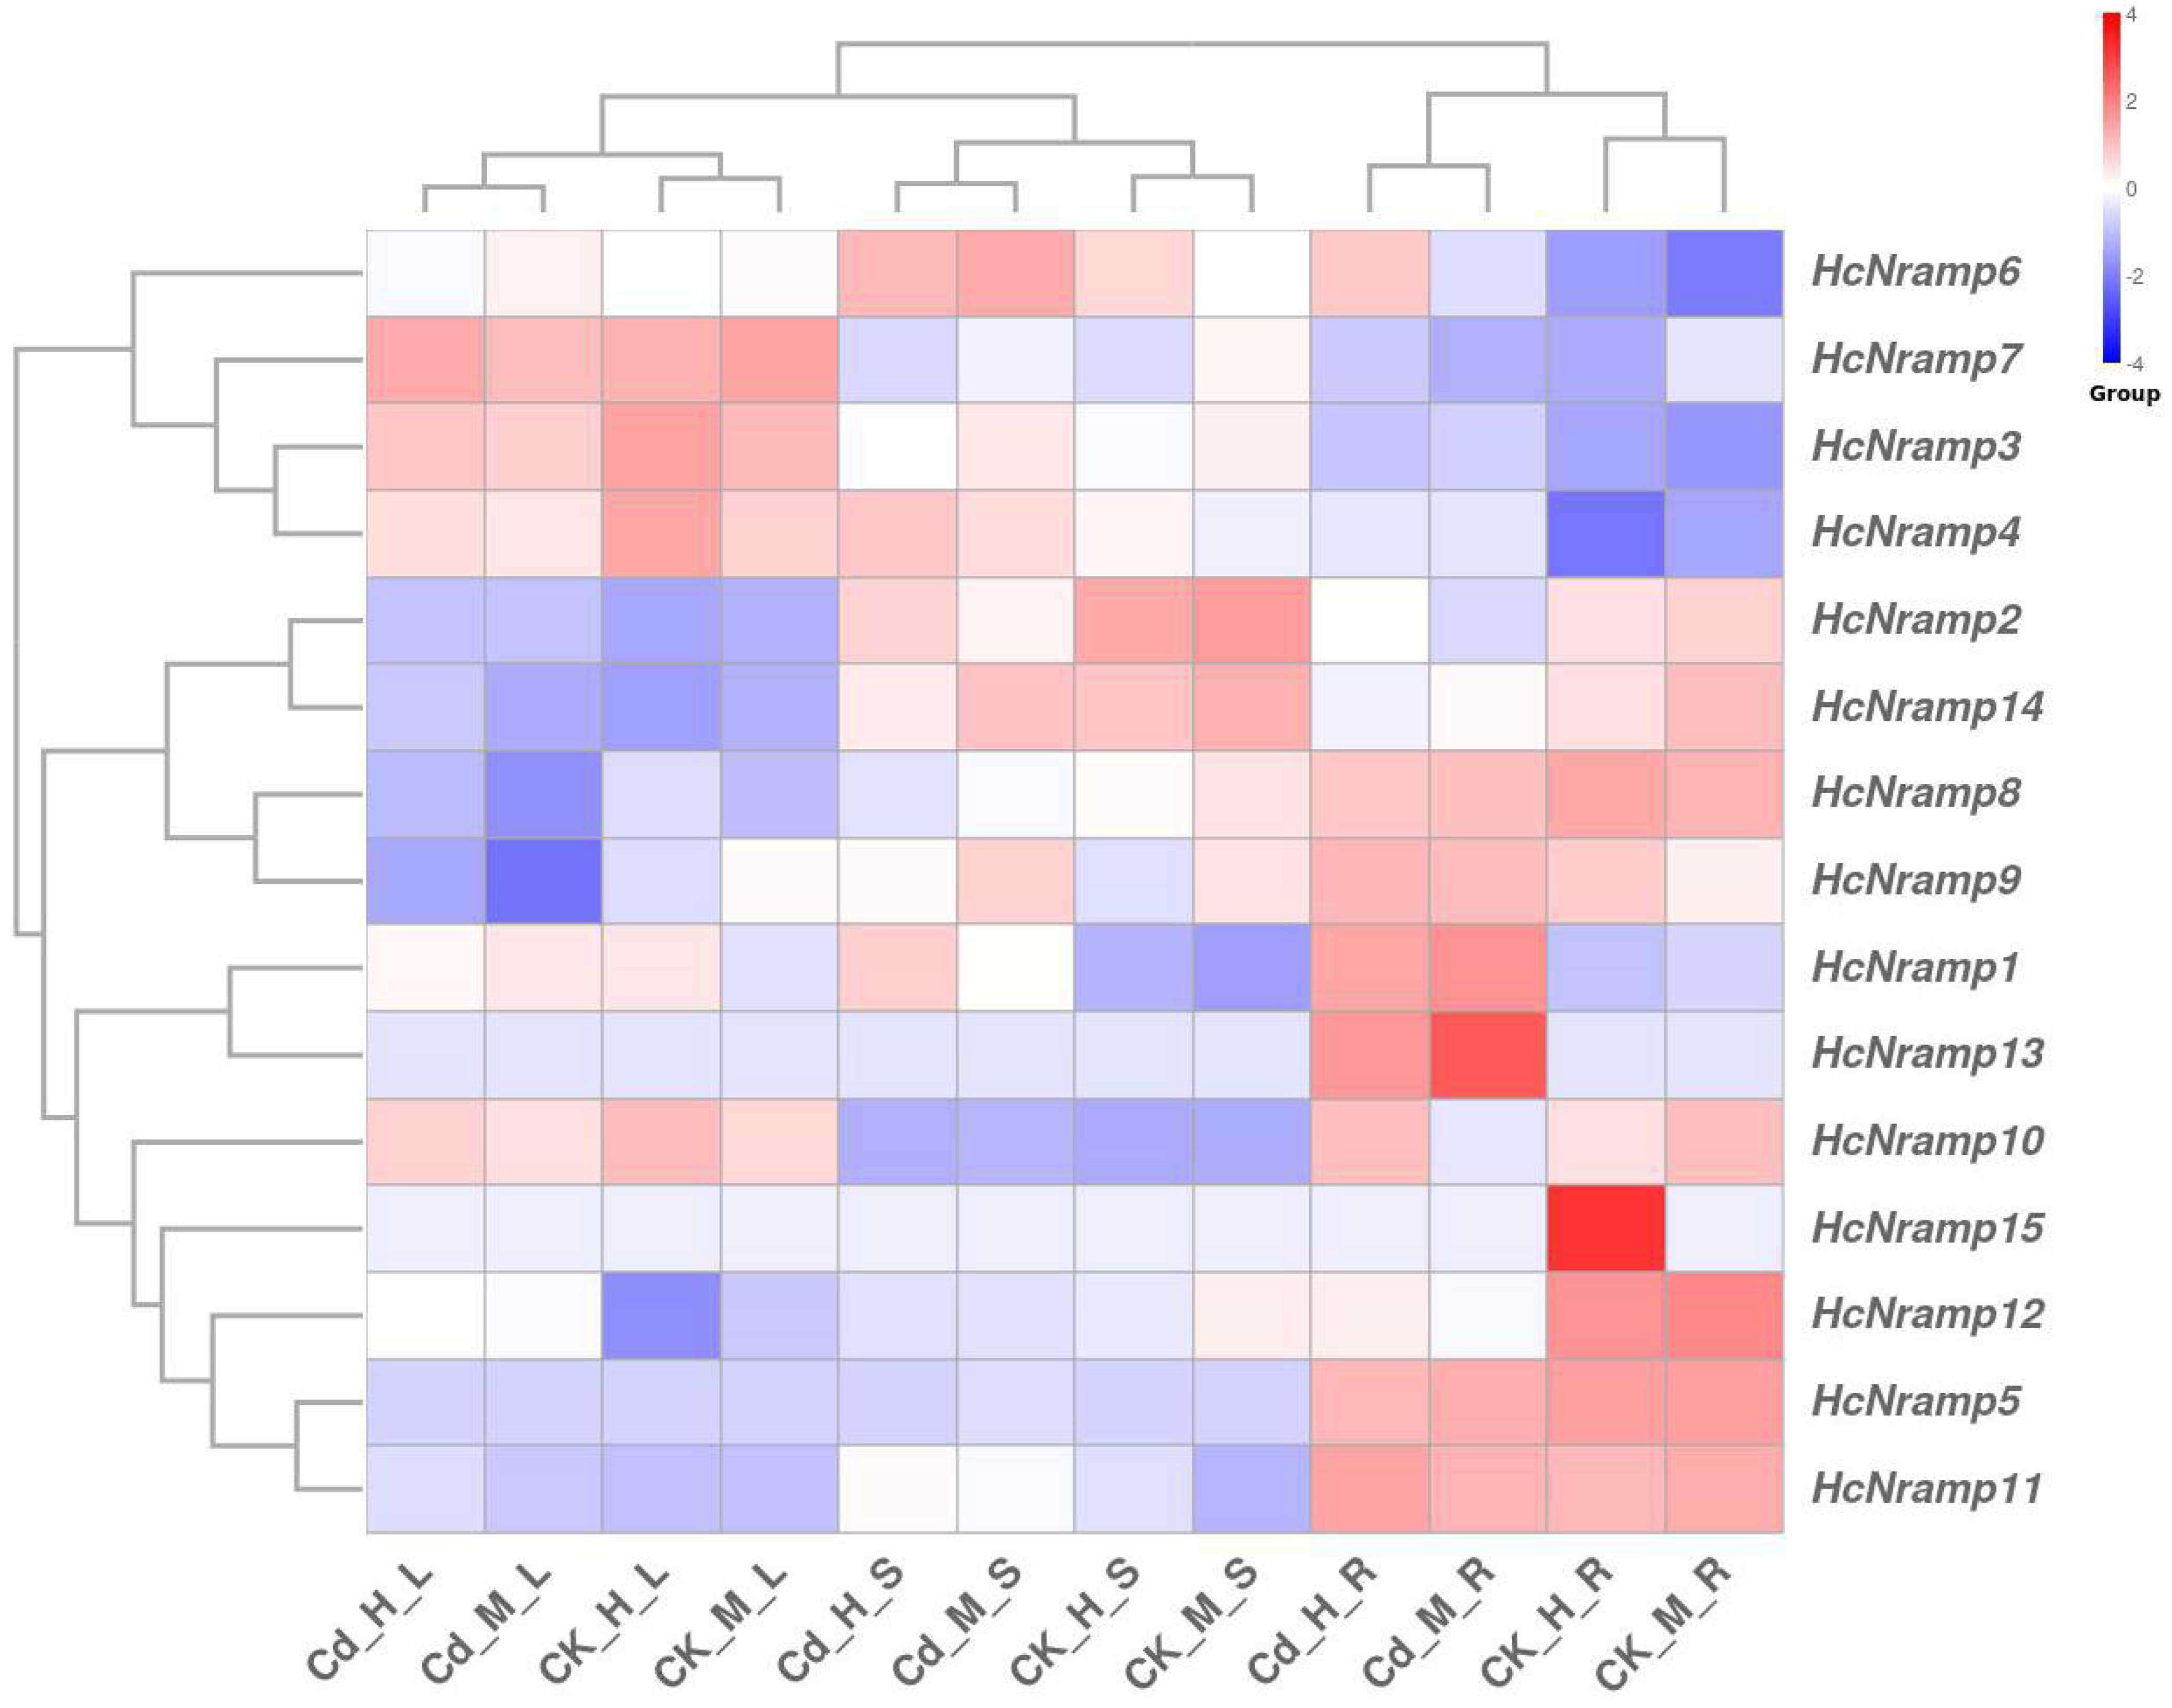
2.6. Tissue-Specific Expression Analysis of the HcNramp Genes

The expression pattern of a gene is crucial for elucidating its function [27]. In order to further explore the role of HcNramp genes, a heat map showing the expression pattern of the HcNramp gene was constructed by using the transcriptome data (Accession: PRJNA1134624). Tissue-specific expression analysis was carried out by calculating the TPM value of the gene. All HcNramp genes showed tissue-specific expression (Figure 7 and Table S7). Fifteen HcNramp genes were divided into three different groups: the first group was HcNramp3/4/6/7, the second group was HcNramp2/8/9/14, and the third group was HcNramp1/5/10/11/12/13/15. The gene expression levels were different in different treatments, with significant differences between normal treatment and Cd treatment. The expression trends of genes in CK-H and CK-M, and Cd-H and Cd-M treatments were similar, but the specific expression levels were different. HcNramp1/6 were expressed relatively high in Cd treatment. HcNramp2/14 was highly expressed in the roots and stems of CK-H and CK-M treatments. HcNramp7 was preferentially expressed in leaves, HcNramp2/6/14 in stems, and HcNramp1/5/8/9/11/12/13/15 in roots. HcNramp3/4/7 was low expressed in roots and HcNramp10 in stems. HcNramp2/14/8/9/11 was low or not expressed in leaves, while HcNramp5/13/15 was low expressed in stems and leaves. HcNramp13 was highly expressed in Cd-M-R, and HcNramp15 was highly expressed in CK-H-R. HcNramp4 was low expressed in CK-H-R, HcNramp6 was low expressed in CK-M-R, HcNramp9 was low expressed in Cd-M-L, and HcNramp12 was low expressed in CK-H-L.

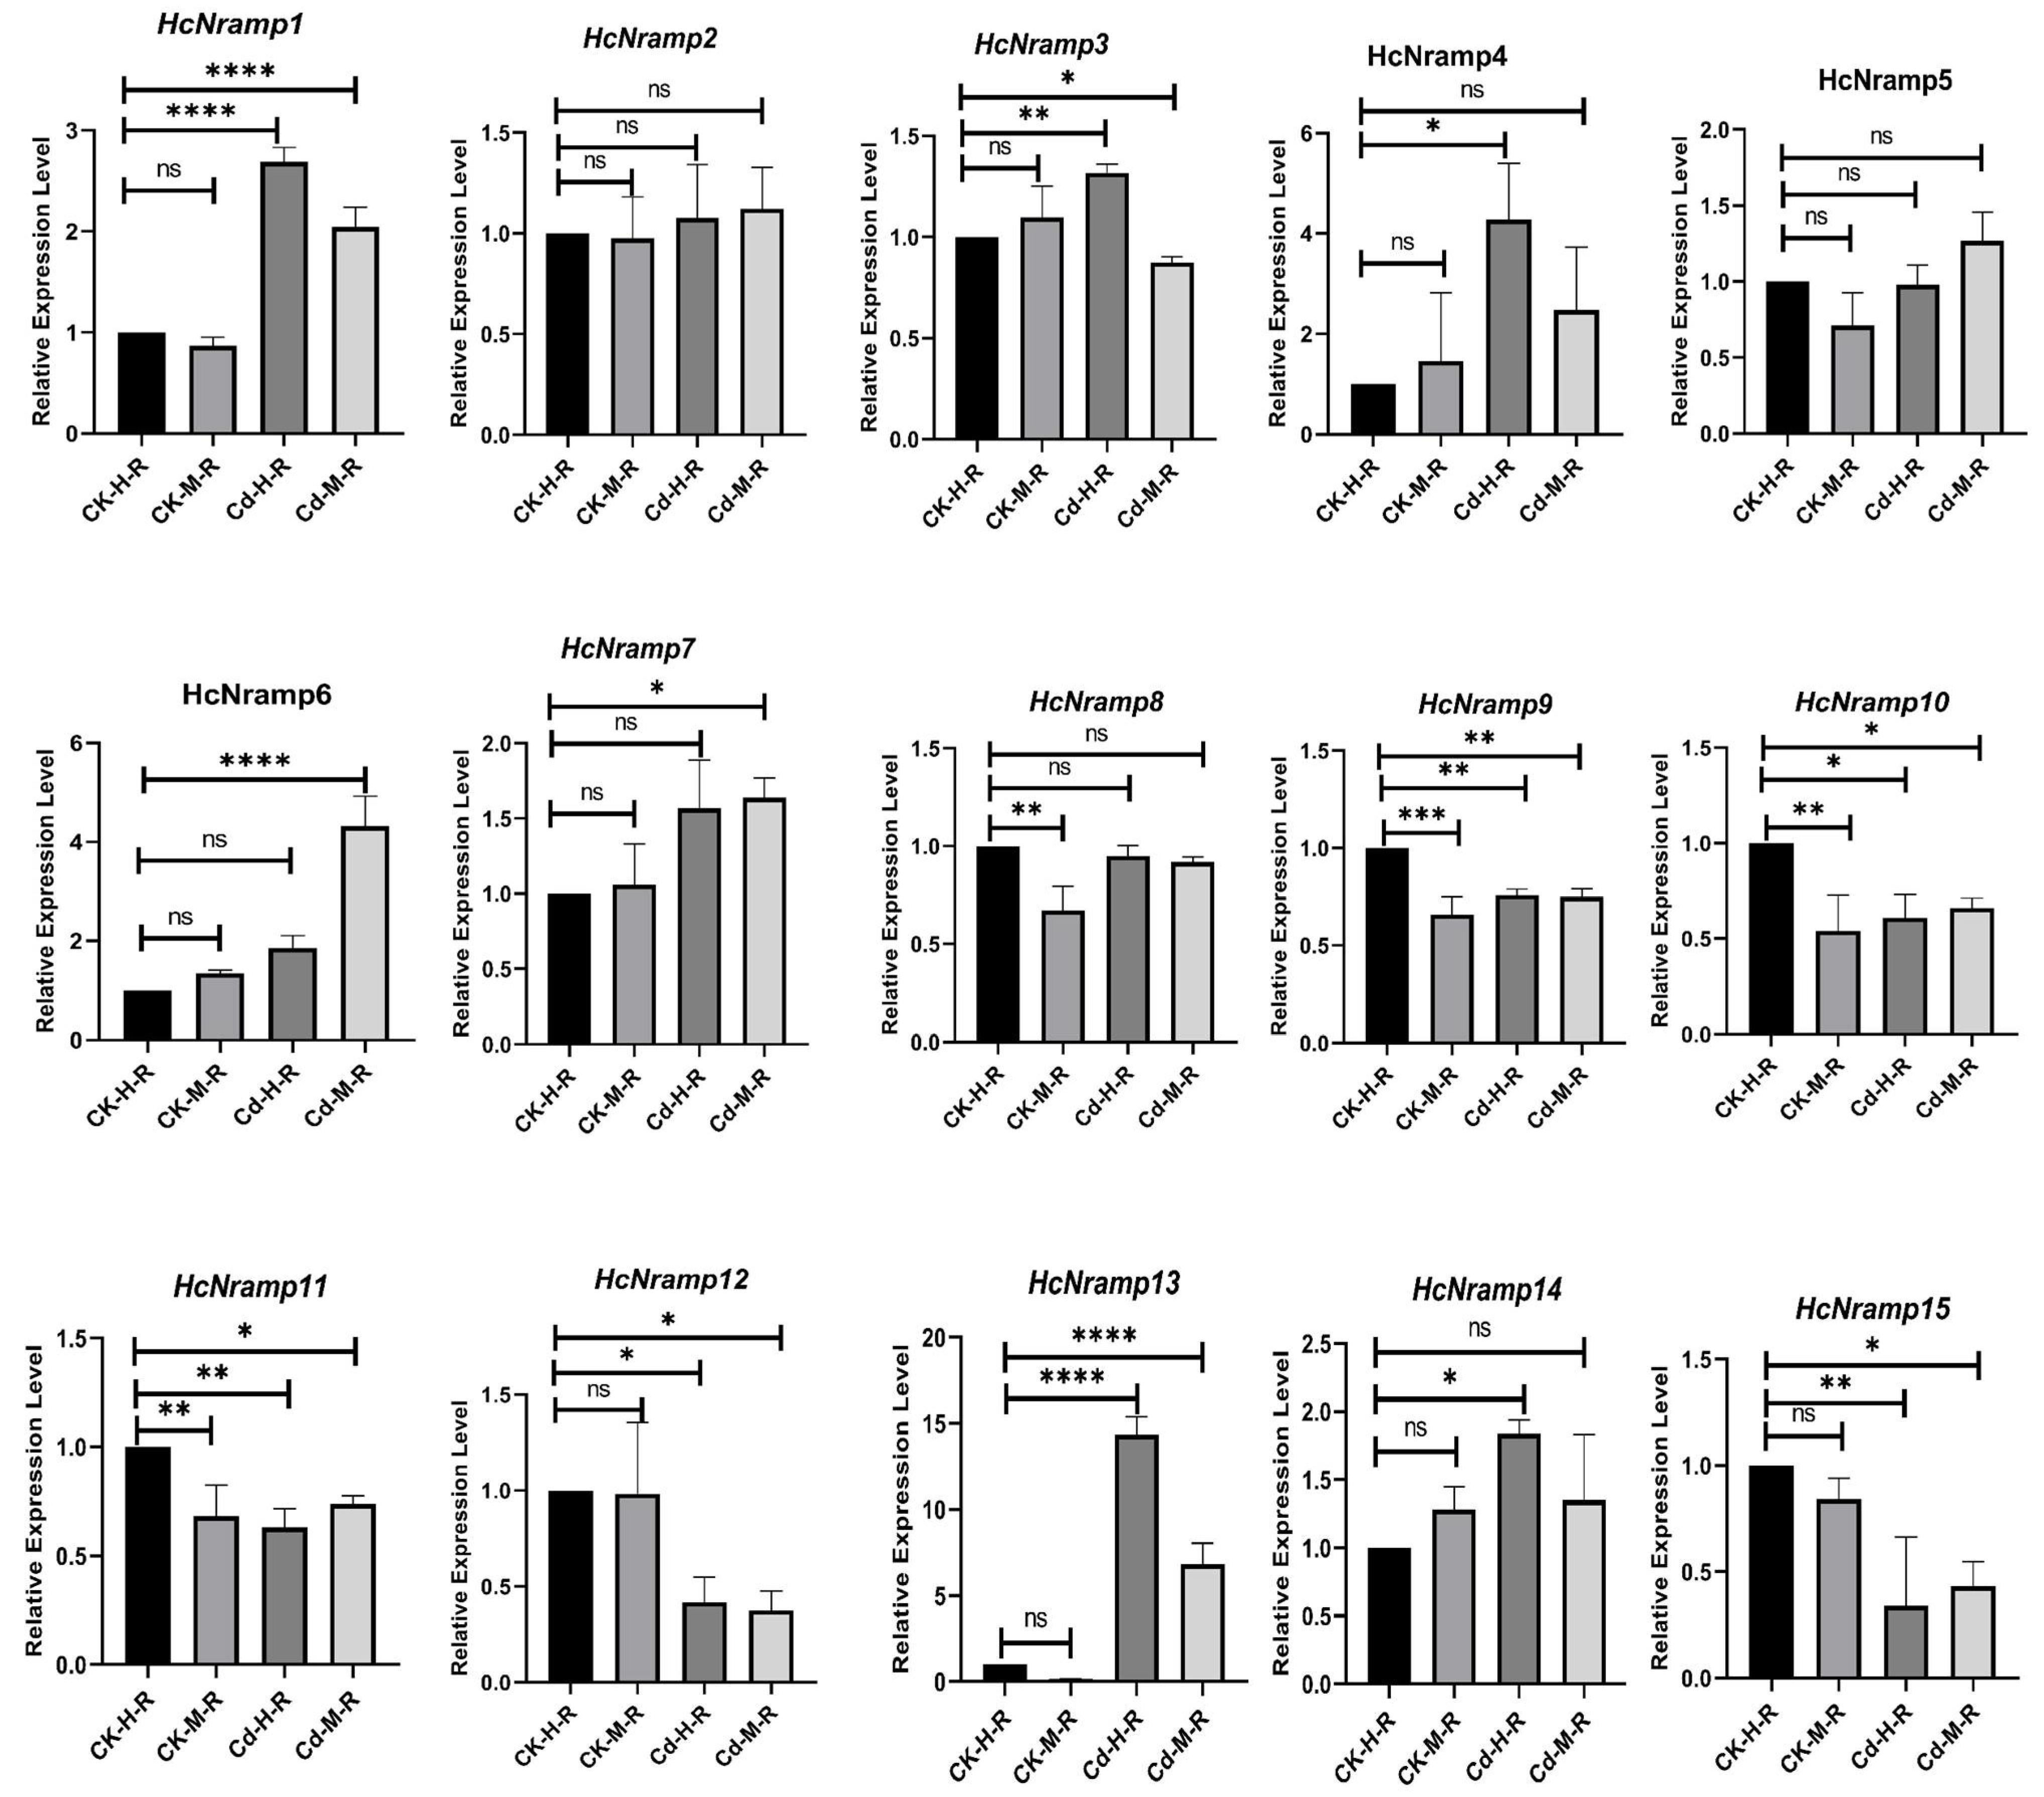
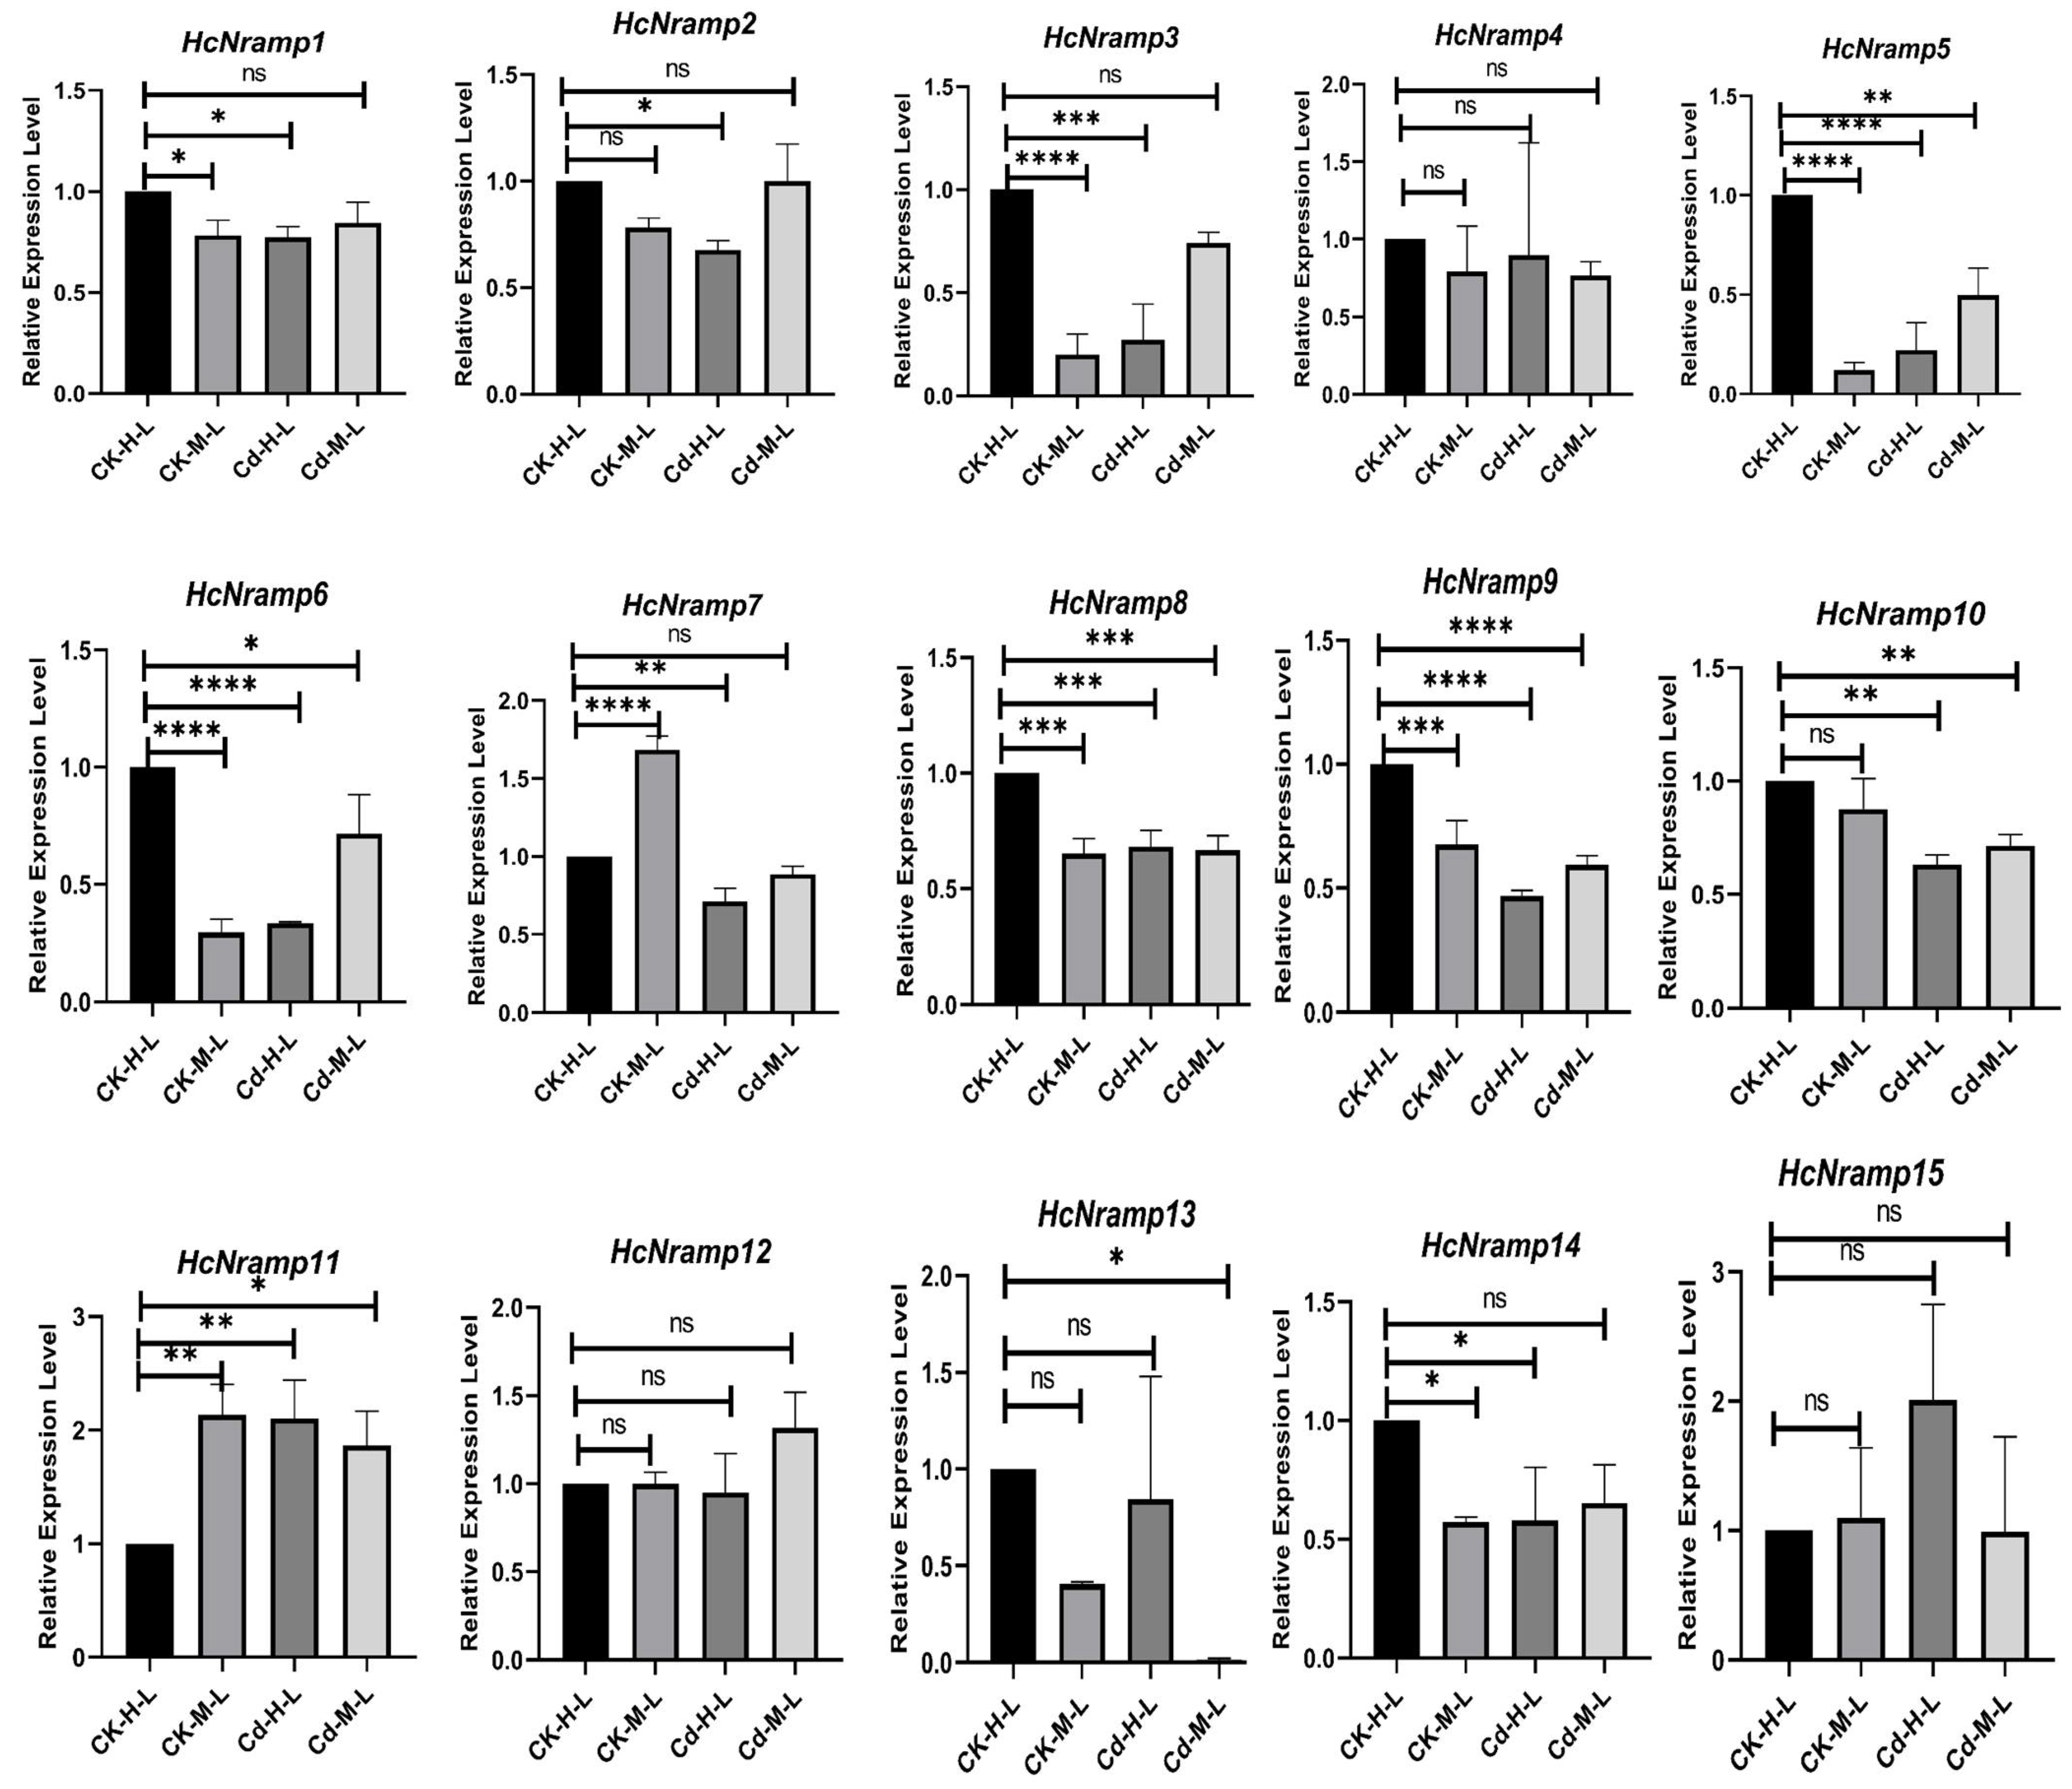
2.7. HcNramp Gene Expressions under Exposure to Different Treatments of Heavy Metals

To clarify the response of the HcNramp genes to Cd stress, we used qRT-PCR to analyze the gene expression level in roots, stems, and leaves under four different treatment conditions (Figure 8, Figure 9 and Figure 10). There were notable differences in the expression patterns of HcNramp genes across roots, stems, and leaves, all significantly influenced by Cd stress. According to the results of the relative gene expression levels in kenaf roots (Figure 8), Cd treatment alone significantly upregulated the expression of HcNramp1/4/7/13/14 compared to the control. Furthermore, combined treatment of Cd and melatonin significantly enhanced the expression of HcNramp1/4/6/7/13, but the expression levels of other genes did not change significantly. In the kenaf stems (Figure 9), melatonin treatment alone significantly increased the expression of HcNramp3/4/5/6/7/8/9/10/11/12/13/14 compared to the control. On the other hand, Cd treatment significantly upregulated the expression of HcNramp3/5/11. In the kenaf leaves (Figure 10), melatonin treatment significantly increased the expression of HcNramp7 and 11 compared to the control. Cd treatment alone significantly upregulated the expression of HcNramp11/15, while combined Cd and melatonin treatment significantly enhanced the expression of HcNramp11. These findings provide valuable insights into the differential regulation of HcNramp genes in response to Cd stress and melatonin treatment, highlighting their potential roles in Cd tolerance and detoxification mechanisms in kenaf.

3. Discussion

Kenaf is an annual herbaceous fiber crop, which has the characteristics of a short growth cycle, large biomass, and not participating in the circulation of the food chain [6]. It can not only be used to remediate polluted soil, but also has certain economic benefits. Kenaf is considered as a potential plant to remediate soil contaminated by heavy metals and has attracted much attention in the field of heavy metals [8,10]. Therefore, it is of great significance to analyze the Nramp gene family of kenaf using bioinformatics.
The Nramp gene plays an important role in the absorption and transport of metal ions. A large number of Nramp genes have been identified functionally [34] and have been analyzed in many species [24]. In our study, fifteen members of the Nramp gene family were identified from the whole genome of kenaf. Compared with A. thaliana (7) and tomato (9) [21], the number of Nramp in kenaf was the largest. The subcellular localization of the Nramp gene family in kenaf is mostly located in the plasma membrane, and a few are located in the vacuole membrane and endoplasmic reticulum. Protein located in the plasma membrane mainly absorbs metal ions from plants in vitro, which may be related to its function of transporting heavy metal ions across membranes [23]. Protein located in the vacuole membrane is responsible for transporting metal ions and their steady state [25]. Protein located in endoplasmic reticulum is mainly involved in the process of cell synthesis and modification of protein. Therefore, it can be inferred that kenaf is a heavy-metal-rich plant with a strong absorption ability and weak transport ability.
Phylogenetic analysis clustered the Nramp proteins into three distinct subfamilies, which was consistent with the assessment that subdivided A. thaliana Nramp proteins into three subgroups (Figure 1) [21]. According to previous studies, different structures and subfamilies have different functions [7]. Further HcNramp gene structure analysis (Figure 2) showed that the members of the most closely related subfamilies usually shared similar exon–intron structures, indicating they have similar evolutionary relationships. All members of the HcNramp gene family contained introns, and conserved motifs 4 and 6, and only the protein in the SCL5 subfamily had motif 3. All members contained motif 4 (GQSSTITGTYAGQFIMQ), a transport motif of the Nramp family, which indicated that the Nramp family is highly conserved [25]. Furthermore, the HcNramp genes in the different subfamilies displayed different exon–intron structures, while subtle differences may play a critical role in the gene evolution progress. Therefore, it is speculated that different gene structures are involved in divergent functions.
Twenty-nine protein sequences of kenaf, A. thaliana, and tomato were used to construct the phylogenetic tree. According to the phylogenetic tree, they can be divided into three subfamilies. According to the grouping of A. thaliana and tomato, these three subfamilies were named I, II, and SCL5, respectively [21]. The protein grouping of A. thaliana and tomato in each branch of the phylogenetic tree was consistent with Tian’s findings [21]. Different species have different evolutionary speeds, so there are differences in the classification of evolutionary trees. The distribution of HcNramp genes in the three subfamilies of kenaf was uneven. Subfamily I contained four HcNramp genes, subfamily II contained six HcNramp genes, and subfamily SCL5 contained five HcNramp genes. These differences indicate that there is asymmetric evolution among the three subfamilies of kenaf [5]. In this study, SlNramp3 and SlNramp9 proteins were not mentioned because SlNramp3 and SlNramp9 in tomato belong to the Mnth family, while HcNramp in kenaf has only three subfamilies, and there are no members of the Mnth family in A. thaliana and kenaf [21]. The Nramps of A. thaliana and tomato were collinear with 15 HcNramp genes of kenaf, and there were 10 collinear gene pairs between the 2 species and kenaf, which indicated that there was a close evolutionary relationship between them. Among them, HcNramp1/6/7/11/12/14 genes of kenaf had collinear gene pairs with AtNramp1/2/3/4/6/7 of A. thaliana, and HcNramp1/2/6/7/8/11/12/14 had collinear gene pairs with SlNramp1/2/3/7 of tomato. Previous studies have mentioned that there are multiple collinear gene pairs between species, which indicates that there are multiple gene copies in the process of species evolution [36]. There were 6 pairs of collinear genes in kenaf, 10 pairs in kenaf and A. thaliana, and 10 pairs in kenaf and tomato. Previous studies have mentioned that there are multiple collinear gene pairs between species, which indicated that there are multiple gene copies in species evolution [21].
The Nramp family is a family of transporters, which can transport divalent metal cations. All HcNramp have transport motifs [25], so it is speculated that these proteins may transport Cd related to transport motifs. The cis-acting promoter elements were identified to address HcNramp gene expression regulation. The analysis of cis-acting elements of promoters showed that the promoter sequences of genes in the same subfamily were similar. The promoter region of HcNramps contained a variety of stress response elements and hormone response elements, so it is speculated that HcNramps genes may be regulated by complex regulatory networks [21]. Studies have shown that some phytohormones, such as jasmonic acid (JA) and SA, participate in the plant response to different metal stress [37,38]. We also found that in the HcNramp gene promoters, there were many cis elements associated with heavy metal stress, which may be involved in the transport and absorption of metals. For example, SA significantly reduces Cd in rice grains by regulating the expression levels of OsNramp2 associated with Cd translocation and accumulation [39]. Among the various HcNramp genes, HcNramp2/3/12/13/15 are unique in possessing TC-rich repetitive sequences, which may confer specific regulatory or structural properties.
The expression of 15 HcNramp genes was divided into 3 different groups. The expression trends of the genes in the same group were similar, with significant differences between the different groups [24]. In different treatments, the expression level of the genes was different, and there was a significant difference between CK and Cd treatments. However, the expression trends of CK-H and CK-M, and Cd-H and Cd-M, were similar, but the specific expression levels were different. It is speculated that the reason for the above situation may be that the Nramp gene family is mainly involved in the transport of divalent cations, and HcNramps may be involved in the transport of Cd2+, so there is a significant difference in expression between CK and Cd treatments, and the expressions in CK-H and CK-M, and Cd-H and Cd-M, are similar. There are significant differences between CK and Cd treatments in BnNRAMPs (Brassica napus) [27], between CK and Pb (lead) stress in HrLNRAMPs [25], and between CK and Cu treatments in KoNRAMPs (Kandelia obovata) [35], which are consistent with the significant differences in the expression of HcNramps between CK and Cd treatments in this paper. These results were consistent with previous studies, indicating that Nramps were responsible for Cd uptake and transport.
HcNramp3 exhibited preferential expression in leaves, whereas the remaining four genes, HcNramp2/12/13/15, were predominantly expressed in roots. This differential expression pattern suggests that these genes may play an important role in roots, as they may be induced by stress. This function is similar to the mechanisms observed in peanuts [24]. AtNramp1 is a Cd transporter [21,30], and AtNramp3 plays a role in Cd sensitivity [28]. HcNramp3/11 are homologous genes, so it can be speculated that these genes may be candidates for Cd regulation of kenaf. AtNramp5 is involved in Cd transport [19], and it has homology with four HcNramp5 genes in subfamily I, and all of them are located in stable hydrophobic proteins on the plasma membrane, so it is speculated that HcNramp1/6/7/14 genes may be involved in Cd transport. AtNramp6 is a transport protein of Cd [23], and it can also improve the tolerance of plants to heavy metal Cd [18,25,30]. It has homology with five genes of the SCL5 subfamily, indicating that HcNramp2/6/8/9/12 may also improve the tolerance of kenaf to Cd. The tolerance of heavy metal hyperaccumulator plants and their ability to accumulate metals mainly depend on their adaptation to the dynamic balance of metals. In some hyperaccumulator plants, the Nramp metal transporter is highly expressed [40]. High-accumulation plants can enrich toxic heavy metals through the Nramp gene, which can improve the soil where heavy metals accumulate and is beneficial to the development of phytoremediation biotechnology of transgenic plants [18]. Therefore, the Nramp gene family can be excavated more comprehensively and systematically, and its biological function can be deeply analyzed.

4. Materials and Methods

4.1. Identification and Sequence Analysis of Nramp Genes in Kenaf

The genomic data of kenaf were obtained from the nucleic acid sequence archiving system (CNCB; https://download.cncb.ac.cn/gwh/Plants/Hibiscus_cannabinus_Fuhong952_GWHACDB00000000.1/, accessed on 6 May 2024) of the China National Center for Bioinformation [41], including genome-wide files, protein sequence files, and GFF annotation files. The genomic files of A. thaliana and tomato were download from EnsembPlants (https://ftp.Ensemblgenomes.ebi.ac.uk/pub/plants/release-59/, accessed on 16 May 2024). The protein sequence files of kenaf, A. thaliana, and tomato were obtained by TBtools-II (Toolbox for Biologists) v2.119 software [42,43]. The Hidden Markov Model (HMM) profile of the Nramp domain (PF01566) was obtained from the Pfam database (https://pfam.xfam.org/, accessed on 10 May 2024) [20], and we used TBtools software [42,43] to localize Blast to obtain the protein sequences of members of the Nramp gene family. We obtain the candidate proteins of kenaf, A. thaliana, and tomato by Hmm search with an E value of <0.001, and named them according to the chromosome structures. The Nramp protein sequence of kenaf was submitted to the SMART (http://smart.embl.de/, accessed on 17 July 2024) database as a search query sequence to verify the existence of the Nramp domain [44].
The candidate protein sequence files of kenaf were submitted to NCBI Batch CDD (https://www.ncbi.nlm.nih.gov/Structure/bwrpsb/bwrpsb.cgi, accessed on 31 May 2024) to obtain the conservation domain. We used the protein molecular weight analysis website ExPASy (http://web.expasy.org/protparam/, accessed on 1 June 2024) to analyze the physical and chemical properties of kenaf Nramp gene family proteins [24]. We used the WoLF PSORT website (https://wolfpsort.hgc.jp/, accessed on 31 May 2024) to determine the subcellular location of the family members [44]. Through the online website SOPMA (https:npsa-prabi.ibcp.fr/cgi-bin/npsa_automat.pl?Page=/NPSA/npsa_sopma.html, accessed on 10 May 2024), we predicted the secondary structures of the family proteins.

4.2. Sequence Alignment, Phylogenetics, Gene Structure, and Conserved Motif Analysis of Nramp Genes

To study the phylogenetic relationships of kenaf, A. thaliana, and tomato, the protein full-length sequences of plants were compared using the MUSCLE program provided by MEGA11.0 software [45], using the neighbor-joining (NJ) method with 1000 bootstrap replicates to build a multi-species phylogenetic tree [24,46,47]. The phylogenetic tree used Evolview v3 online (https://www.evolgenius.info/evolview/#/, accessed on 27 June 2024) software for visual analysis and beautification [24,36].
The gene structure was analyzed by Tbtools software. Conserved domains and motifs of the HcNramp proteins were analyzed with the Pfam 37.0 tool (http://pfam.xfam.org/,accessed on 17 July 2024) and the MEME Suite 5.5.5 (https://meme-suite.org/me/me/tools/meme, accessed on 14 May 2024), respectively. The relevant parameters were set as a maximum base ordinal number of 20, and the others used the default parameters. TBtools software [42,43] was used to visualize the phylogenetic trees and conserved motifs.

4.3. Cis Element Analysis of HcNramp Genes

The ATG sequence of the genomic start codon was extracted from the HcNramp gene family as the promoter sequence, and then we used the online software of PlantCare (http://bioinformatics.psb.ugent.be/webtools/plantcare/html/, accessed on 30 May 2024) to analyze the promoter sequence [24,47]. The target cis-acting elements were screened in Excel, and then drawn with TBtools software [42,43].

4.4. Chromosome Localization and Collinearity Analyses of the Kenaf Nramp Gene Family

We extracted the position information of the HcNramp sequence from the kenaf GFF file and used TBtools software [42,43] to map the position distribution on the kenaf chromosome.
To explore the collinearity of Nramp genes in kenaf, A. thaliana, and tomato, whole-genome information was analyzed using TBtools software [42,43,48].

4.5. Plant Materials and Treatments

The kenaf “H368” variety was used as the test material, provided by the Institute of Bast Fiber Crops, Chinese Academy of Agricultural Sciences. Seeds were surface-sterilized with 75% alcohol for 2 min, washed with deionized water three times, germinated for one week, then transplanted into Hoagland nutrient solution for another week. Following this, they were cultured in 0/30 μmol/L of CdCl2 for two weeks. Subsequently, the plants were sprayed with 100 μmol/L of melatonin solution once every two days for a total of three times over a period of one week. The culture conditions were 25 °C/20 °C for 16 h/8 h (light/dark), relative humidity of 65%, and illumination of 12,000 lx. Finally, the roots, stems, and leaves (the third leaf from the top) of kenaf seedlings were sampled with liquid nitrogen and put in a refrigerator at −80 °C for further experiments. There were four treatments: control treatment (CK + water, CK-H), melatonin treatment (CK + melatonin, CK-M), Cd treatment (30 μmol/L CdCl2 + water, Cd-H), and Cd + melatonin treatment (30 μmol/L CdCl2 + melatonin, Cd-M). Nutrients were renewed every three days. There were three replicates for each treatment.

4.6. RNA Extraction and qRT-PCR Analysis

The total RNA was extracted from the root, stem, and leaf samples of kenaf by using the EASYspin Plus plant RNA rapid extraction kit. The NanoReadyF-1100 was used to determine the quality and concentration of RNA samples. Then, the first-strand cDNA was synthesized by using 5 × Prime Script RT Master Mix (TaKaRa). Taking the Histone3 of kenaf as the reference gene [49], the primer sequence of HcNramp was designed by using TBtools and listed in Table S8. The qRT-PCR reaction was detected in the Step OnePlus Real-Time PCR System. The total reaction volume of PCR was 10 µL, including 1 µL of diluted cDNA, 5 µL of TB Green Premix Ex Taq (Tli RNaseH Plus) (2×) reagent, 0.2 µL of ROX Reference Dye, 0.2 µL of forward primer, 0.2 µL of reverse primer, and 3.4 µL of RNA-free H2O. The amplification conditions were as follows: in the first stage, 95 °C acted for 30 s; in the second stage, 95 °C for 5 s and 60 °C for 30 min, with 40 cycles; in the third stage, 95 °C for 15 s and 60 °C for 1 min. The expression of HcNramp genes was calculated using the 2−△△ct method. Three replicates were set for each reaction.

4.7. Statistical Analyses

GraphPad Prism was used for statistical analyses. Error bars indicate mean ± SD and asterisks indicate statistical differences (n = 3; * p < 0.05, ** p < 0.01, and *** p < 0.001; ns, not significant; Student’s t-test) [50].

5. Conclusions

A comprehensive analysis of the Nramp gene family in kenaf was carried out in this study. Fifteen HcNramp genes were identified and further classified into three main phylogenetic subfamilies. A phylogenetic comparison of Nramp genes among kenaf, A. thaliana, and tomato was constructed, which provided some clues for understanding the evolution of HcNramp genes. All proteins of the HcNramp family were located in the plasma membrane, and they had highly similar exon–intron structures, motifs, and promoter elements in the same subfamilies. The distribution of chromosomes was not uniform, and the expression levels of different tissues in different treatments were also different. Most HcNramp genes were preferentially expressed in roots. These findings provide necessary information for understanding the potential role of the HcNramp genes in Cd stress and are also of great significance for screening Cd-tolerant genes in kenaf.

Supplementary Materials

The following supporting information can be downloaded at: https://www.mdpi.com/article/10.3390/plants13172514/s1. Table S1: 15 protein sequences of HcNramp identified from kenaf. Table S2: Physical and chemical properties of HcNramp gene family members. Table S3: Secondary structure of HcNramp family protein. Table S4: List of 29 Nramp protein sequences. Table S5: List of the putative motifs of HcNramp proteins. Table S6: Collinearity information. Table S7: Transcriptome data of 15 HcNramp genes. Table S8: Primer sequences for ten target genes.

Author Contributions

Conceptualization, Q.L. and S.L.; methodology, Q.L. and S.L.; software, Q.L. and S.L.; validation, X.A. and G.D.; formal analysis, X.A. and G.D.; investigation, Q.L. and S.L.; resources, Q.L. and S.L.; data curation, Q.L. and S.L.; writing—original draft preparation, Q.L.; writing—review and editing, Q.L. and S.L.; visualization, X.A. and G.D.; supervision, X.A. and G.D.; project administration, X.A. and G.D.; funding acquisition, X.A. All authors have read and agreed to the published version of the manuscript.

Funding

This research was funded by the China Agriculture Research System of MOF and MARA, China Agriculture Research System for Bast and Leaf Fiber Crops (CARS-16-S05).

Data Availability Statement

All datasets generated for this study are included in the article/Supplementary Materials.

Conflicts of Interest

The authors declare that the research was conducted in the absence of any commercial or financial relationships that could be construed as a potential conflict of interest.

References

  1. Chen, P.; Li, Z.; Luo, D.; Jia, R.; Lu, H.; Tang, M.; Hu, Y.; Yue, J.; Huang, Z. Comparative transcriptomic analysis reveals key genes and pathways in two different cadmium tolerance kenaf (Hibiscus cannabinus L.) cultivars. Chemosphere 2021, 263, 128211. [Google Scholar] [CrossRef] [PubMed]
  2. Gong, Z.; Duan, Y.; Liu, D.; Zong, Y.; Zhang, D.; Shi, X.; Hao, X.; Li, P. Physiological and transcriptome analysis of response of soybean (Glycine max) to cadmium stress under elevated CO2 concentration. J. Hazard. Mater. 2023, 448, 130950. [Google Scholar] [CrossRef]
  3. Meng, J.G.; Zhang, X.D.; Tan, S.K.; Zhao, K.X.; Yang, Z.M. Genome-wide identification of Cd-responsive NRAMP transporter genes and analyzing expression of NRAMP 1 mediated by miR167 in Brassica napus. BioMetals 2017, 30, 917–931. [Google Scholar] [CrossRef]
  4. Zhang, X.; Yang, M.; Yang, H.; Pian, R.; Wang, J.; Wu, A.-M. The Uptake, Transfer, and Detoxification of Cadmium in Plants and Its Exogenous Effects. Cells 2024, 13, 907. [Google Scholar] [CrossRef]
  5. Tan, Z.; Li, J.; Guan, J.; Wang, C.; Zhang, Z.; Shi, G. Genome-Wide Identification and Expression Analysis Reveals Roles of the NRAMP Gene Family in Iron/Cadmium Interactions in Peanut. Int. J. Mol. Sci. 2023, 24, 1713. [Google Scholar] [CrossRef]
  6. Chen, P.; Chen, T.; Li, Z.; Jia, R.; Luo, D.; Tang, M.; Lu, H.; Hu, Y.; Yue, J.; Huang, Z. Transcriptome analysis revealed key genes and pathways related to cadmium-stress tolerance in Kenaf (Hibiscus cannabinus L.). Ind. Crops Prod. 2020, 158, 112970. [Google Scholar] [CrossRef]
  7. Li, H.; Yang, X.; Niyitanga, S.; He, Q.; Chen, S.; Xu, J.; Qi, J.; Tao, A.; Fang, P.; Zhang, L. Transcriptomes of Different Tissues for Expression Characteristics Analysis of MYB gene Family in Kenaf (Hibiscus cannabinus L.). Trop. Plant Biol. 2022, 15, 261–275. [Google Scholar] [CrossRef]
  8. An, X.; Jin, G.; Zhang, J.; Ma, G.; Jin, L.; Luo, X.; Chen, C.; Shi, X.; Zhou, J.; Wei, W.; et al. Research Progress on Tissue Culture and Genetic Transformation of Kenaf (Hibiscus cannabinus). Open Life Sci. 2017, 12, 465–472. [Google Scholar] [CrossRef]
  9. Chen, M.; She, Z.; Aslam, M.; Liu, T.; Wang, Z.; Qi, J.; Niu, X. Genomic insights of the WRKY genes in kenaf (Hibiscus cannabinus L.) reveal that HcWRKY44 improves the plant’s tolerance to the salinity stress. Front. Plant Sci. 2022, 13, 984233. [Google Scholar] [CrossRef]
  10. An, X.; Chen, J.; Liu, T.; Li, W.; Luo, X.; Zou, L. Transcriptomic and Metabolic Profiling of Kenaf Stems under Salinity Stress. Plants 2022, 11, 1448. [Google Scholar] [CrossRef]
  11. Niu, X.; Chen, M.; She, Z.; Aslam, M.; Qi, J.; Qin, Y. Ectopic Expression of Kenaf (Hibiscus cannabinus L.) HcWRKY50 Improves Plants’ Tolerance to Drought Stress and Regulates ABA Signaling in Arabidopsis. Agronomy 2022, 12, 1176. [Google Scholar] [CrossRef]
  12. Deng, Y.; Li, D.; Huang, Y.; Huang, S. Physiological response to cadmium stress in kenaf (Hibiscus cannabinus L.) seedlings. Ind. Crops Prod. 2017, 107, 453–457. [Google Scholar] [CrossRef]
  13. Li, W.; Chen, C.; Deng, Y.; Luo, X.; Liu, T.; An, X.; Zou, L.; Luan, M.; Li, D. Influence of Nitrogen Supply on Growth, Antioxidant Capacity and Cadmium Absorption of Kenaf (Hibiscus cannabinus L.) Seedlings. Plants 2023, 12, 4067. [Google Scholar] [CrossRef] [PubMed]
  14. Liu, S.; Long, T.; Chen, Z.; Liu, J.; Cui, W.; Leng, H.; Xing, Y.; Rodriguez, L.G.; Gao, Y.; Yao, Y. Genome-wide identification of NRAMP family genes in Populus trichocarpa and their roles in transport of heavy metals. Tree Genet. Genomes 2023, 19, 51. [Google Scholar] [CrossRef]
  15. Segond, D.; Dellagi, A.; Lanquar, V.; Rigault, M.; Patrit, O.; Thomine, S.; Expert, D. NRAMP genes function in Arabidopsis thaliana resistance to Erwinia chrysanthemi infection. Plant J. 2009, 58, 195–207. [Google Scholar] [CrossRef]
  16. Wei, W.; Chai, T.; Zhang, Y.; Han, L.; Xu, J.; Guan, Z. The Thlaspi caerulescens NRAMP Homologue TcNRAMP3 is Capable of Divalent Cation Transport. Mol. Biotechnol. 2008, 41, 15–21. [Google Scholar] [CrossRef]
  17. Cailliatte, R.; Schikora, A.; Briat, J.-F.; Mari, S.; Curie, C. High-Affinity Manganese Uptake by the Metal Transporter NRAMP1 Is Essential for Arabidopsis Growth in Low Manganese Conditions. Plant Cell 2010, 22, 904–917. [Google Scholar] [CrossRef] [PubMed]
  18. Chen, K.; Jiang, X.; Zhu, Z.; Wang, H.; Feng, S. Advances in the study of plant Nramp family involved in metal ion absorption and distribution. Plant Physiol. J. 2020, 56, 345–355. [Google Scholar] [CrossRef]
  19. Chen, Y.; Zhao, X.; Li, G.; Kumar, S.; Sun, Z.; Li, Y.; Guo, W.; Yang, J.; Hou, H. Genome-Wide Identification of the Nramp Gene Family in Spirodela polyrhiza and Expression Analysis under Cadmium Stress. Int. J. Mol. Sci. 2021, 22, 6414. [Google Scholar] [CrossRef]
  20. Qin, L.; Han, P.; Chen, L.; Walk, T.C.; Li, Y.; Hu, X.; Xie, L.; Liao, H.; Liao, X. Genome-Wide Identification and Expression Analysis of NRAMP Family Genes in Soybean (Glycine max L.). Front. Plant Sci. 2017, 8, 1436. [Google Scholar] [CrossRef]
  21. Tian, W.; He, G.; Qin, L.; Li, D.; Meng, L.; Huang, Y.; He, T. Genome-wide analysis of the NRAMP gene family in potato (Solanum tuberosum): Identification, expression analysis and response to five heavy metals stress. Ecotoxicol. Environ. Saf. 2021, 208, 111661. [Google Scholar] [CrossRef] [PubMed]
  22. Tiwari, M.; Sharma, D.; Dwivedi, S.; Singh, M.; Tripathi, R.D.; Trivedi, P.K. Expression in Arabidopsis and cellular localization reveal involvement of rice NRAMP, OsNRAMP1, in arsenic transport and tolerance. Plant Cell Environ. 2013, 37, 140–152. [Google Scholar] [CrossRef] [PubMed]
  23. Zhao, Z.; Yuan, M.; Wu, J.; Men, Y.; Jiang, M.; Gu, L.; Wang, J. Genome-wide Identification and Bioinformatics Analysis of Poplar NRAMP Gene Family. J. Anhui Agric. Sci. 2023, 51, 90–94+141. [Google Scholar] [CrossRef]
  24. Yan, L.; Jin, H.; Raza, A.; Huang, Y.; Gu, D.p.; Zou, X. Natural resistance-associated macrophage proteins (NRAMPs) are involved in cadmium enrichment in peanut (Arachis hypogaea L.) under cadmium stress. Plant Growth Regul. 2023, 102, 619–632. [Google Scholar] [CrossRef]
  25. Li, J.; Li, H.; Liu, L.-E.; Zhang, T.; Zhou, W. Identification and Analysis of the NRAMP Family in Seabuckthorn Under Lead Stress. Biotechnol. Bull. 2024, 40, 191–202. [Google Scholar] [CrossRef]
  26. Kumar, A.; Singh, G.; Prasad, B.; Sharma, P.; Kumar, R. Genome wide analysis and identification of NRAMP gene family in wheat (Triticum aestivum L.). Pharma Innov. J. 2022, SP-11, 499–504. [Google Scholar]
  27. Zhao, Y.; Xie, Q.; Yang, Q.; Cui, J.; Tan, W.; Zhang, D.; Xiang, J.; Deng, L.; Guo, Y.; Li, M.; et al. Genome-wide identification and evolutionary analysis of the NRAMP gene family in the AC genomes of Brassica species. BMC Plant Biol. 2024, 24, 311. [Google Scholar] [CrossRef]
  28. Thomine, S.B.; Wang, R.W.; John, M.; Crawford, N.M.; Schroeder, J.I. Cadmium and iron transport by members of a plant metal transporter family in Arabidopsis with homology to Nramp genes. Proc. Natl. Acad. Sci. USA 2000, 97, 4991–4996. [Google Scholar] [CrossRef]
  29. Mani, A.; Sankaranarayanan, K. In Silico Analysis of Natural Resistance-Associated Macrophage Protein (NRAMP) Family of Transporters in Rice. Protein J. 2018, 37, 237–247. [Google Scholar] [CrossRef]
  30. Cailliatte, R.; Lapeyre, B.; Briat, J.-F.; Mari, S.; Curie, C. The NRAMP6 metal transporter contributes to cadmium toxicity. Biochem. J. 2009, 422, 217–228. [Google Scholar] [CrossRef]
  31. Zhao, S.; Zhang, Y.; Zhang, Q.; Gangjun, W.; Ye, X. Differential responses of two tomato cultivars to cadmium stress. J. Plant Nutr. Fertil. 2015, 21, 1261–1268. [Google Scholar] [CrossRef]
  32. Wei, T.; Sun, Y.; Yashir, N.; Li, X.; Guo, J.; Liu, X.; Jia, H.; Ren, X.; Hua, L. Inoculation with Rhizobacteria Enhanced Tolerance of Tomato (Solanum lycopersicum L.) Plants in Response to Cadmium Stress. J. Plant Growth Regul. 2021, 41, 445–460. [Google Scholar] [CrossRef]
  33. Zhang, J.; Zhang, M.; Song, H.; Zhao, J.; Shabala, S.; Tian, S.; Yang, X. A novel plasma membrane-based NRAMP transporter contributes to Cd and Zn hyperaccumulation in Sedum alfredii Hance. Environ. Exp. Bot. 2020, 176, 104121. [Google Scholar] [CrossRef]
  34. Wang, C.; Chen, X.; Yao, Q.; Long, D.; Fan, X.; Kang, H.; Zeng, J.; Sha, L.; Zhang, H.; Zhou, Y.; et al. Overexpression of TtNRAMP6 enhances the accumulation of Cd in Arabidopsis. Gene 2019, 696, 225–232. [Google Scholar] [CrossRef] [PubMed]
  35. Hussain, Q.; Ye, T.; Shang, C.; Li, S.; Khan, A.; Nkoh, J.N.; Mustafa, A.E.-Z.M.A.; Elshikh, M.S. NRAMP gene family in Kandelia obovata: Genome-wide identification, expression analysis, and response to five different copper stress conditions. Front. Plant Sci. 2024, 14, 1318383. [Google Scholar] [CrossRef] [PubMed]
  36. He, Z.; Zhang, H.; Gao, S.; Lercher, M.J.; Chen, W.-H.; Hu, S. Evolview v2: An online visualization and management tool for customized and annotated phylogenetic trees. Nucleic Acids Res. 2016, 44, W236–W241. [Google Scholar] [CrossRef]
  37. Guo, B.; Liu, C.; Li, H.; Yi, K.; Ding, N.; Li, N.; Lin, Y.; Fu, Q. Endogenous salicylic acid is required for promoting cadmium tolerance of Arabidopsis by modulating glutathione metabolisms. J. Hazard. Mater. 2016, 316, 77–86. [Google Scholar] [CrossRef]
  38. Lei, G.J.; Sun, L.; Sun, Y.; Zhu, X.F.; Li, G.X.; Zheng, S.J. Jasmonic acid alleviates cadmium toxicity in Arabidopsis via suppression of cadmium uptake and translocation. J. Integr. Plant Biol. 2019, 62, 218–227. [Google Scholar] [CrossRef]
  39. Wang, F.; Tan, H.; Huang, L.; Cai, C.; Ding, Y.; Bao, H.; Chen, Z.; Zhu, C. Application of exogenous salicylic acid reduces Cd toxicity and Cd accumulation in rice. Ecotoxicol. Environ. Saf. 2021, 207, 111198. [Google Scholar] [CrossRef]
  40. Oomen, R.J.F.J.; Wu, J.; Lelièvre, F.; Blanchet, S.; Richaud, P.; Barbier-Brygoo, H.; Aarts, M.G.M.; Thomine, S. Functional characterization of NRAMP3 and NRAMP4 from the metal hyperaccumulator Thlaspi caerulescens. New Phytol. 2008, 181, 637–650. [Google Scholar] [CrossRef]
  41. Wu, Q.; Chen, C.; Yue, J.; Mubeen, S.; Cao, S.; Li, X.; Wang, M.; Zhang, H.; Wu, X.; Wang, C.; et al. Genome-wide identification of CUC gene family and functional analysis of HcCUC1 in kenaf. Plant Cell Tissue Organ Cult. 2023, 155, 91–102. [Google Scholar] [CrossRef]
  42. Chen, C.; Chen, H.; Zhang, Y.; Thomas, H.R.; Frank, M.H.; He, Y.; Xia, R. TBtools: An Integrative Toolkit Developed for Interactive Analyses of Big Biological Data. Mol. Plant 2020, 13, 1194–1202. [Google Scholar] [CrossRef] [PubMed]
  43. Chen, C.; Wu, Y.; Li, J.; Wang, X.; Zeng, Z.; Xu, J.; Liu, Y.; Feng, J.; Chen, H.; He, Y.; et al. TBtools-II: A “one for all, all for one” bioinformatics platform for biological big-data mining. Mol. Plant 2023, 16, 1733–1742. [Google Scholar] [CrossRef] [PubMed]
  44. Kasapoğlu, A.G.; Muslu, S.; Aygören, A.S.; Öner, B.M.; Güneş, E.; İlhan, E.; Yiğider, E.; Aydin, M. Genome-wide characterization of the GPAT gene family in bean (Phaseolus vulgaris L.) and expression analysis under abiotic stress and melatonin. Genet. Resour. Crop Evol. 2024, 25, 6101. [Google Scholar] [CrossRef]
  45. Kumar, S.; Stecher, G.; Li, M.; Knyaz, C.; Tamura, K.; Battistuzzi, F.U. MEGA X: Molecular Evolutionary Genetics Analysis across Computing Platforms. Mol. Biol. Evol. 2018, 35, 1547–1549. [Google Scholar] [CrossRef]
  46. Liu, J.; Wang, X.; Chen, Y.; Liu, Y.; Wu, Y.; Ren, S.; Li, L. Identification, evolution and expression analysis of WRKY gene family in Eucommia ulmoides. Genomics 2021, 113, 3294–3309. [Google Scholar] [CrossRef]
  47. Yao, Y.; He, Z.; Li, X.; Xu, J.; Han, X.; Liang, H.; Zhuo, R.; Qiu, W. Genome-wide identification of bHLH gene family and its response to cadmium stress in Populus × canescens. PeerJ 2024, 12, e17410. [Google Scholar] [CrossRef]
  48. Yang, W.; Zhao, L.; Tang, B.; Fu, W.; Wang, Q.; Mo, C.; Zhang, Y.; Ao, N.; Li, Y.; Li, F.; et al. Genome-wide identification and expression analysis of the SBP-box gene family in Brassica juncea L. J. Northeast. Agric. Univ. 2023, 54, 23. [Google Scholar] [CrossRef]
  49. Jia, R. Comparative Morphological and Physiological Responses and Differential Gene Discovery in Kenaf (Hibiscus cannabinus L.) under Cadmium Stress. Master’s Thesis, Guangxi University, Nanning, China, 2019. [Google Scholar]
  50. Singh, R.; Jha, A.B.; Misra, A.N.; Sharma, P. Differential responses of growth, photosynthesis, oxidative stress, metals accumulation and NRAMP genes in contrasting Ricinus communis genotypes under arsenic stress. Environ. Sci. Pollut. Res. 2019, 26, 31166–31177. [Google Scholar] [CrossRef]
Figure 1. Phylogenetic analysis of 29 Nramp proteins in kenaf, A. thaliana, and tomato. Fifteen proteins of kenaf are labeled in black font, seven proteins of A. thaliana are in blue font, and seven proteins of tomato are in green font. The maximum likelihood tree was created using MEGAX (bootstrap value = 1000) and the bootstrap value of each branch is displayed.
Plants 13 02514 g001
Figure 2. Conservation motif and gene structure analysis of HcNramp genes according to the phylogenetic relationship. (a) The phylogenetic relationship of HcNramps. (b) Conserved motifs of HcNramps. Different colors represent different motifs. (c) Exon and intron structures of the HcNramp genes in kenaf. The grey lines indicate introns, the green boxes represent exons, and the orange boxes indicate untranslated regions. (d) The amino acid composition of each motif.
Plants 13 02514 g002
Figure 3. Identification of the cis-acting elements in the promoter of HcNramp genes.
Plants 13 02514 g003
Figure 4. Chromosome location of HcNramp genes. Chromosome numbers are shown to the left of the chromosomes. Nramp genes are labeled to the right of the chromosomes. Scale bar on the left indicates the chromosome lengths (Mb).
Plants 13 02514 g004
Figure 5. Intraspecific collinearity analysis of the kenaf Nramp gene family. The green lines in the figure are common genes, and the gray lines represent collinear blocks of the plant genome.
Plants 13 02514 g005
Figure 6. Interspecific collinearity analysis of the kenaf Nramp gene family. (a) Interspecific collinearity analysis of kenaf and A. thaliana. (b) Interspecific collinearity analysis of kenaf and tomato. The red lines in the figure are the common genes between kenaf, A. thaliana, and tomato, and the gray lines represent the collinear blocks of the plant genome.
Plants 13 02514 g006
Figure 7. Tissue-specific expression profiles of HcNramp genes in kenaf. CK-H-R represents the root samples treated by CK + water spraying, CK-M-R represents the root samples treated by CK + melatonin spraying, Cd-H-R represents the root samples treated by Cd + water spraying, and Cd-M-R represents the root samples treated by Cd + melatonin spraying. L, S, and R represent the leaves, stems, and roots of kenaf samples. Red and blue boxes indicate high and low expression levels of genes, respectively.
Plants 13 02514 g007
Figure 8. The expression levels of HcNramp genes in kenaf roots under different treatments. Data represent means ± SD of three biological replicates. CK-H-R represents control samples. The expression levels of each gene were normalized against its own expression level in the root tissue in control (CK-H-R) conditions. Error bars indicate mean ± SD and asterisks indicate statistical differences between the treatment samples and the corresponding control samples, the roots (n = 3; * p < 0.05, ** p < 0.01, and *** p < 0.001, **** p < 0.0001 and ns not significant; Student’s t-test).
Plants 13 02514 g008
Figure 9. The expression levels of HcNramp genes in kenaf stems under different treatments. Data represent means ± SD of three biological replicates. CK-H-S represents control samples. The expression levels of each gene were normalized against its own expression level in the stem tissue in control (CK-H-S) conditions. Error bars indicate mean ± SD and asterisks indicate statistical differences between the treatment samples and the corresponding control samples, the stems (n = 3; * p < 0.05, ** p < 0.01, *** p < 0.001, **** p < 0.0001 and ns not significant; Student’s t-test).
Plants 13 02514 g009
Figure 10. The expression levels of HcNramp genes in kenaf leaves under different treatments. Data represent means ± SD of three biological replicates. CK-H-L represents control samples. The expression levels of each gene were normalized against its own expression level in the leaf tissue in control (CK-H-L) conditions. Error bars indicate mean ± SD and asterisks indicate statistical differences between the treatment samples and the corresponding control samples, the leaves (n = 3; * p < 0.05, ** p < 0.01, and *** p < 0.001, **** p < 0.0001 and ns not significant; Student’s t-test).
Plants 13 02514 g010
Disclaimer/Publisher’s Note: The statements, opinions and data contained in all publications are solely those of the individual author(s) and contributor(s) and not of MDPI and/or the editor(s). MDPI and/or the editor(s) disclaim responsibility for any injury to people or property resulting from any ideas, methods, instructions or products referred to in the content.

