
Characteristics of Phenotypic Variation of Malus Pollen at Infrageneric Scale

 , ,
, ,
Abstract
1. Introduction
2. Results
2.1. General Characteristics of Malus Taxa Pollen
2.2. Intraspecifc Uniformity Test and Interspecific Distinctness Analysis of Pollen Morphology Traits
2.3. Cluster Analysis Based on Pollen’s Phenotypic Traits
2.4. The Characteristics of Family Aggregation Distribution
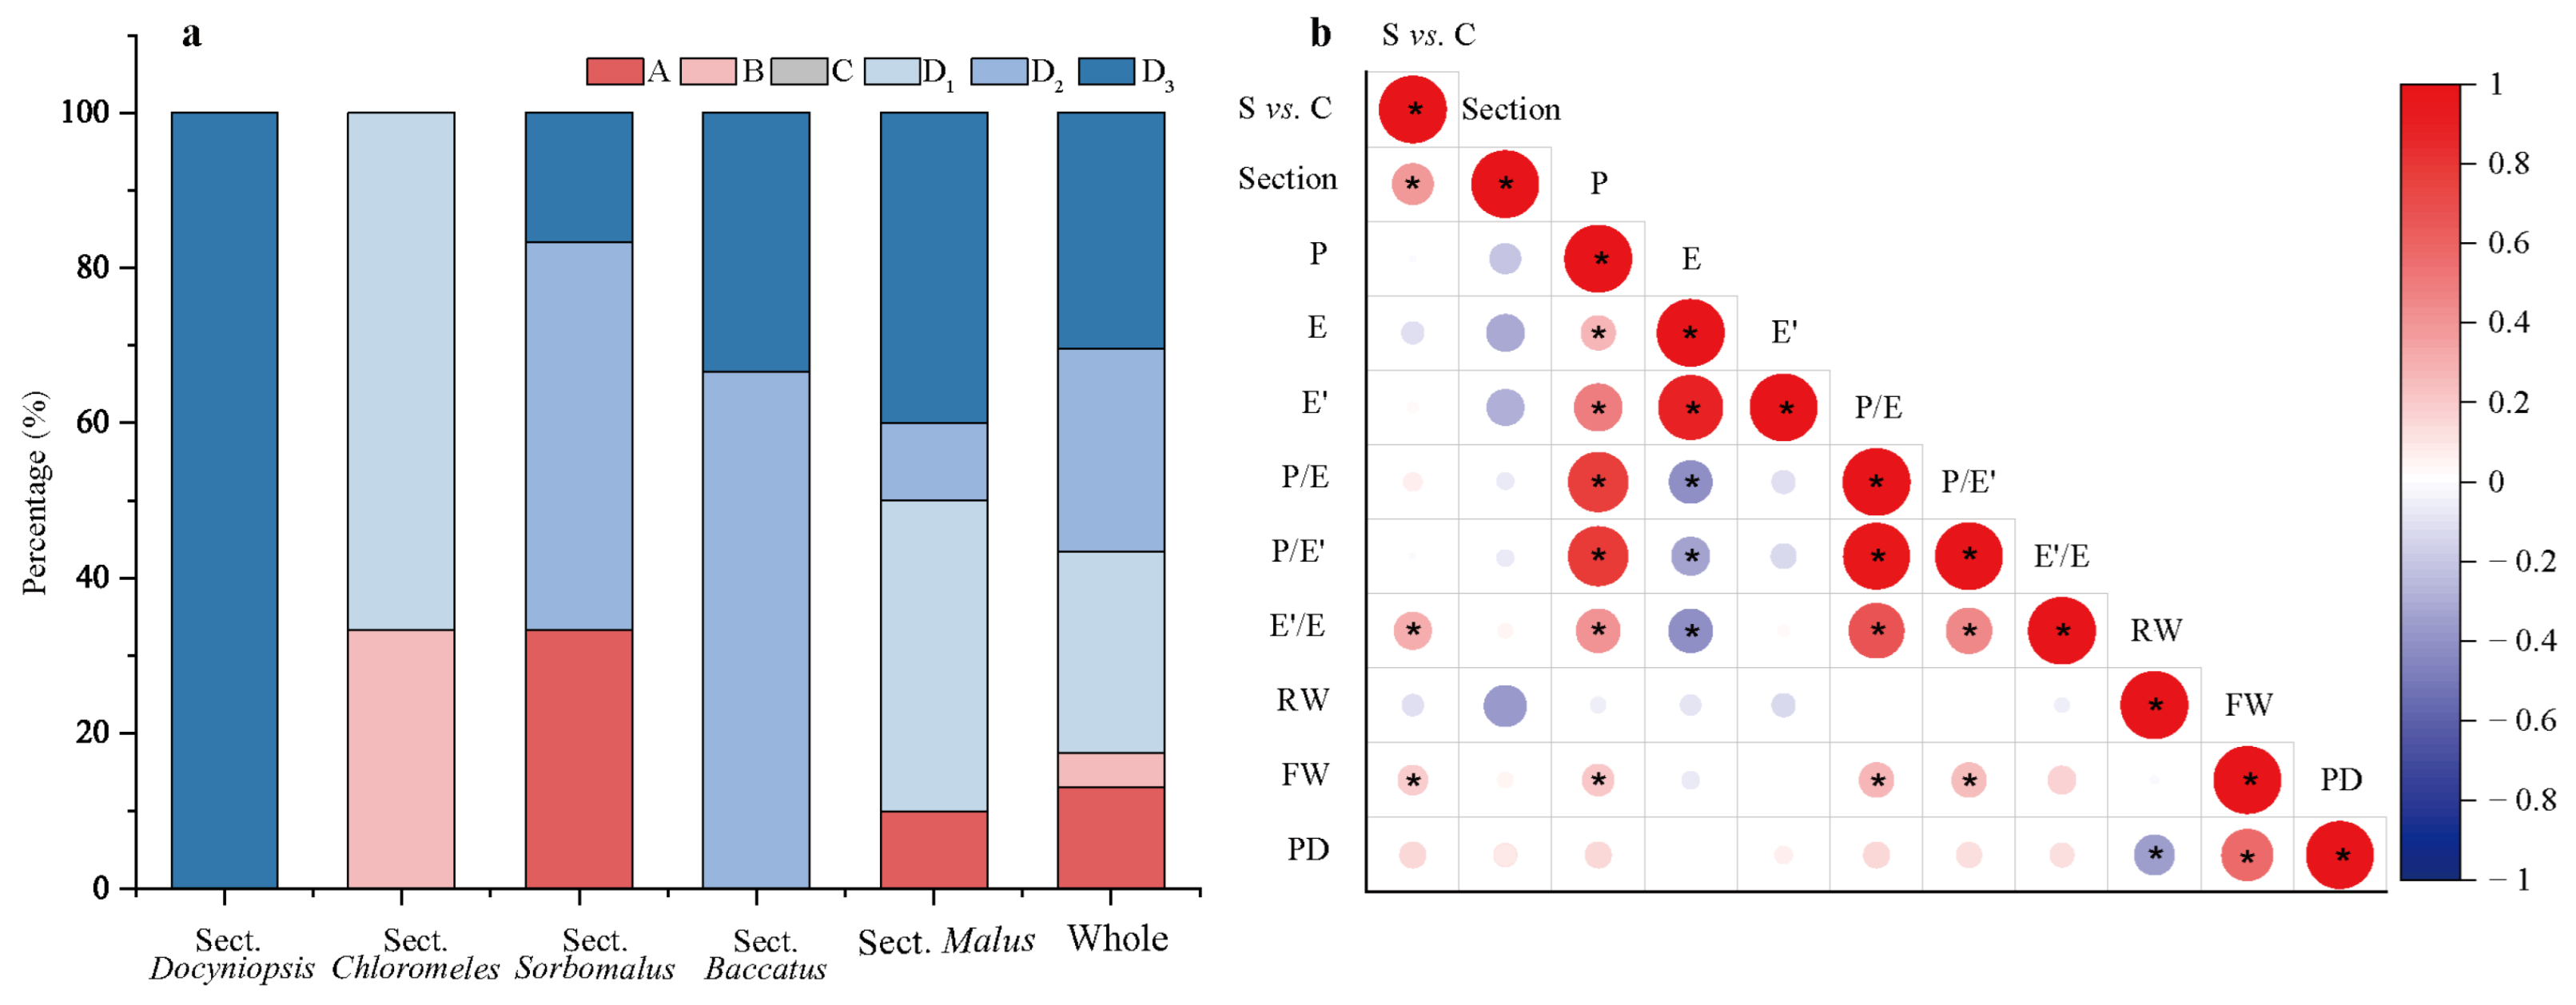
2.4.1. The Family Aggregation Distribution between Species and Their Sections
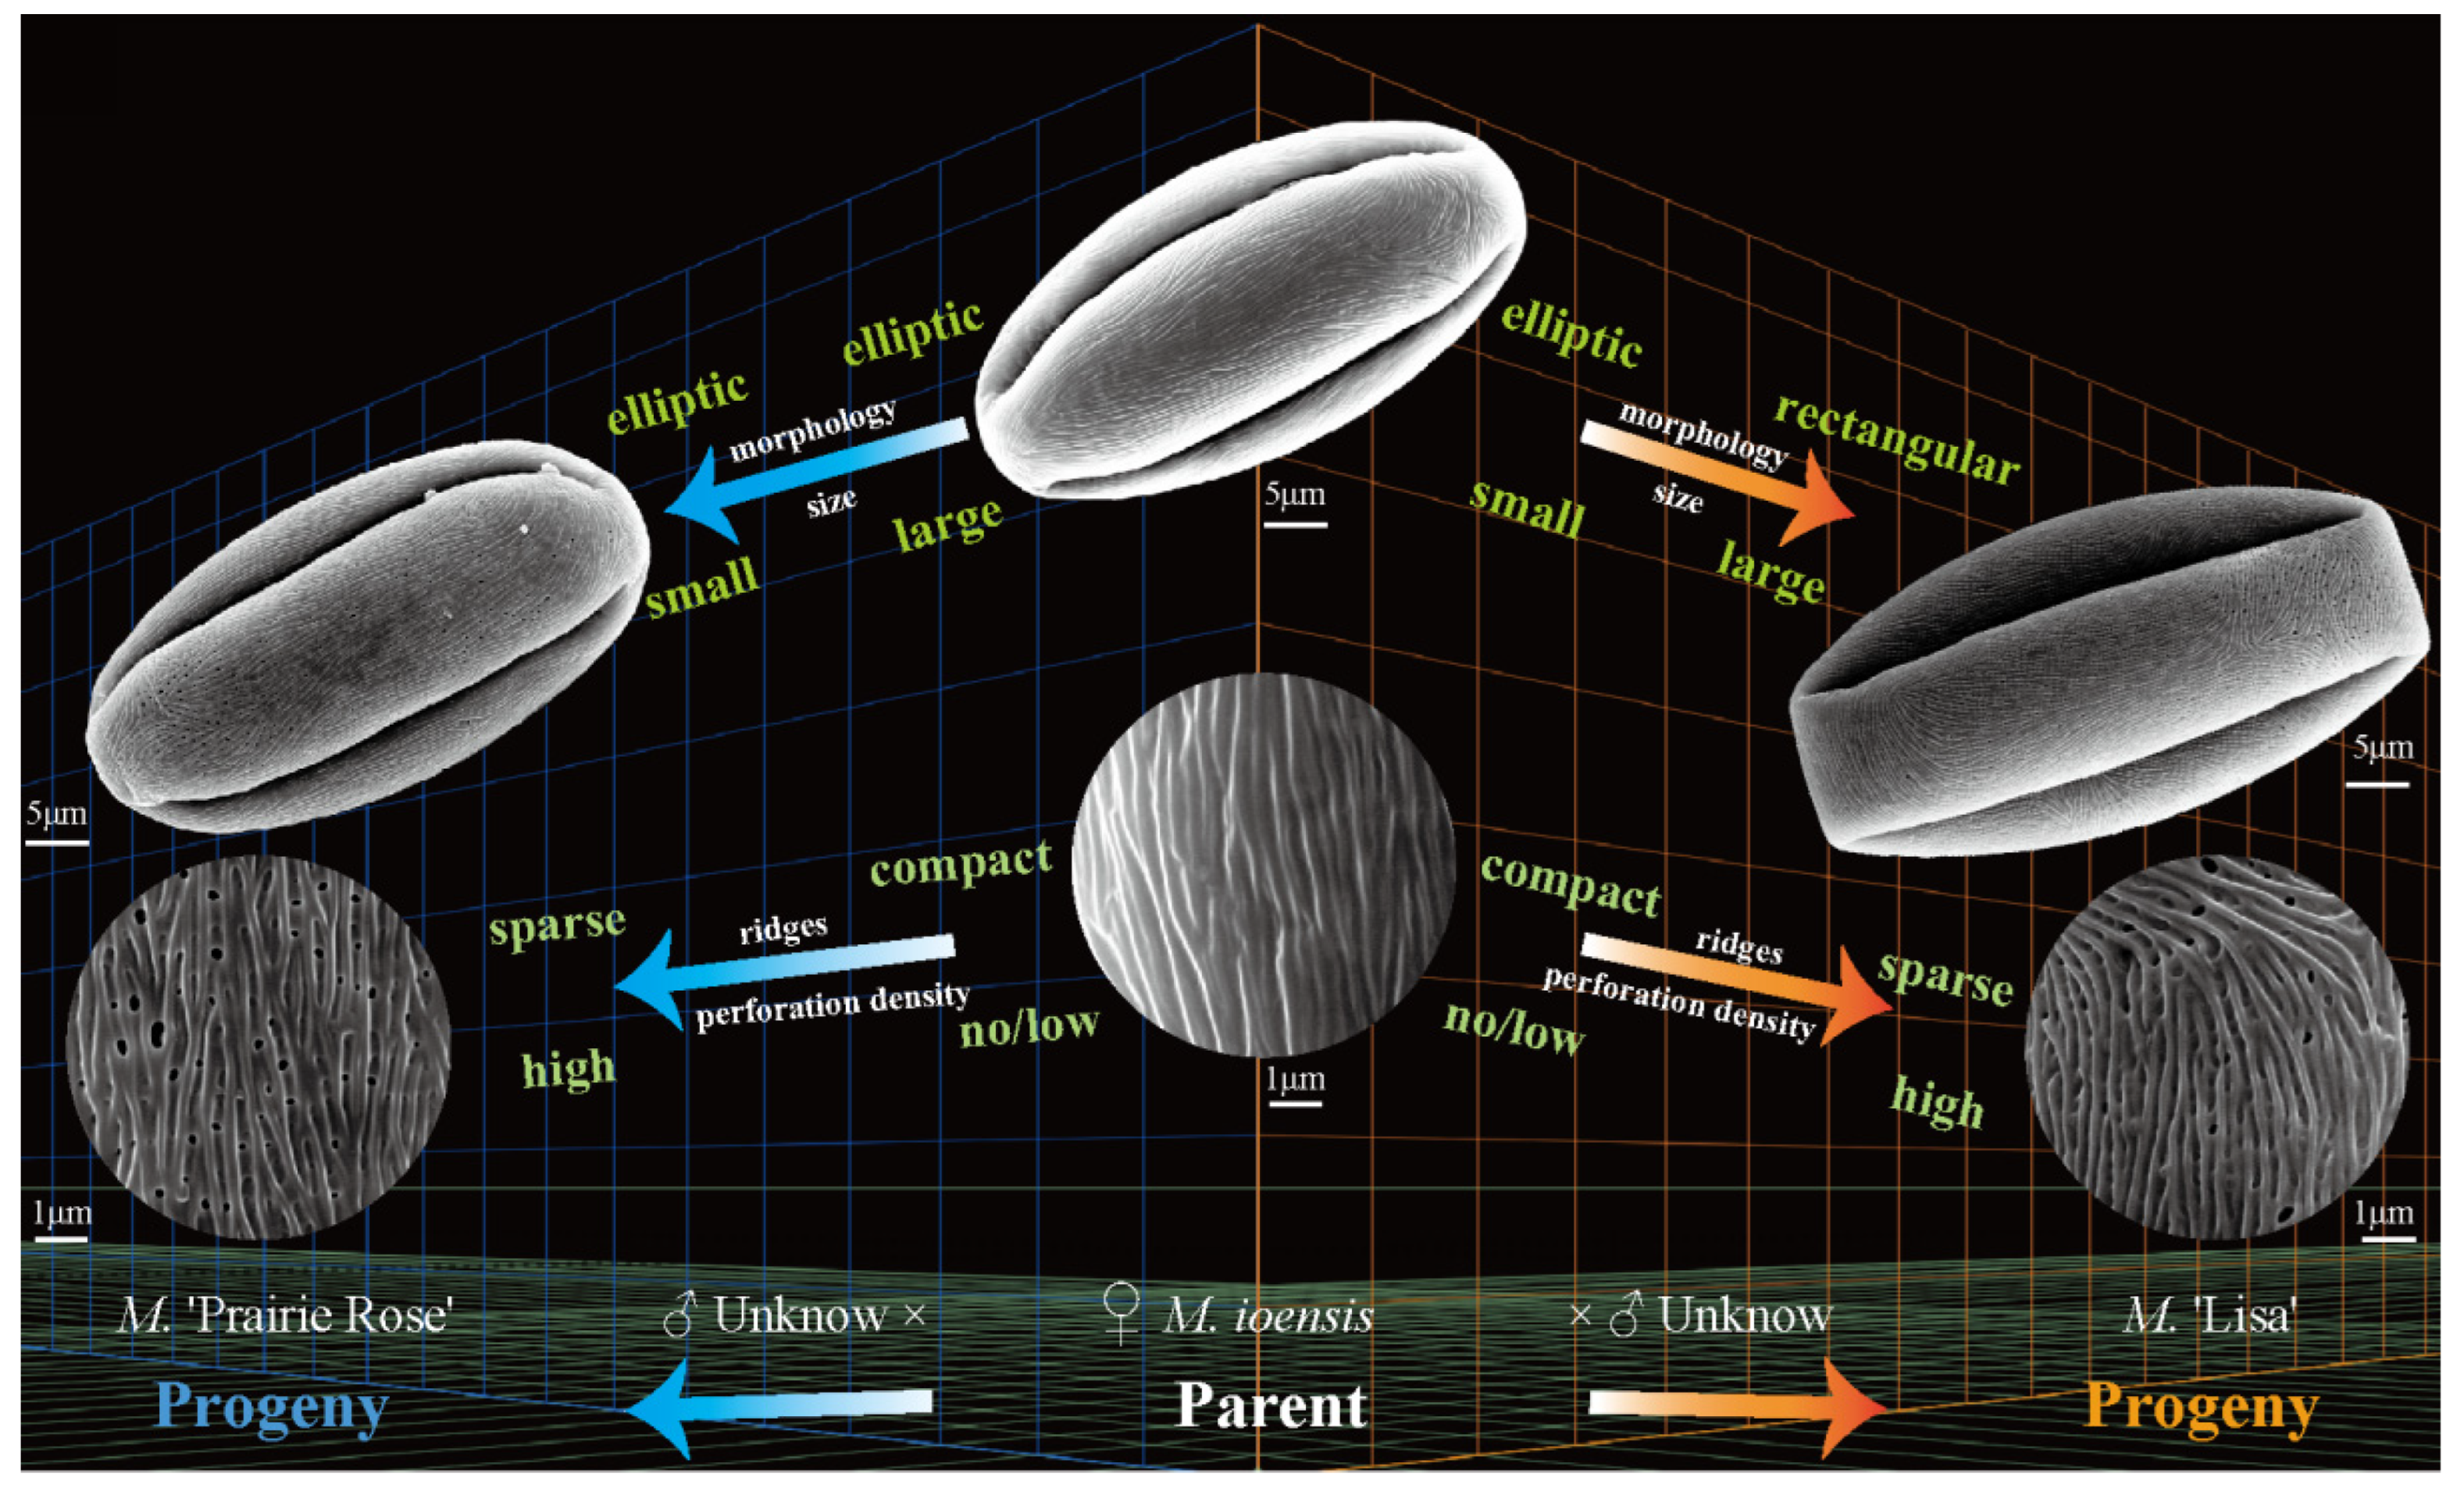
2.4.2. The Family Aggregation Distribution between Cultivars and Their Parents (Species)
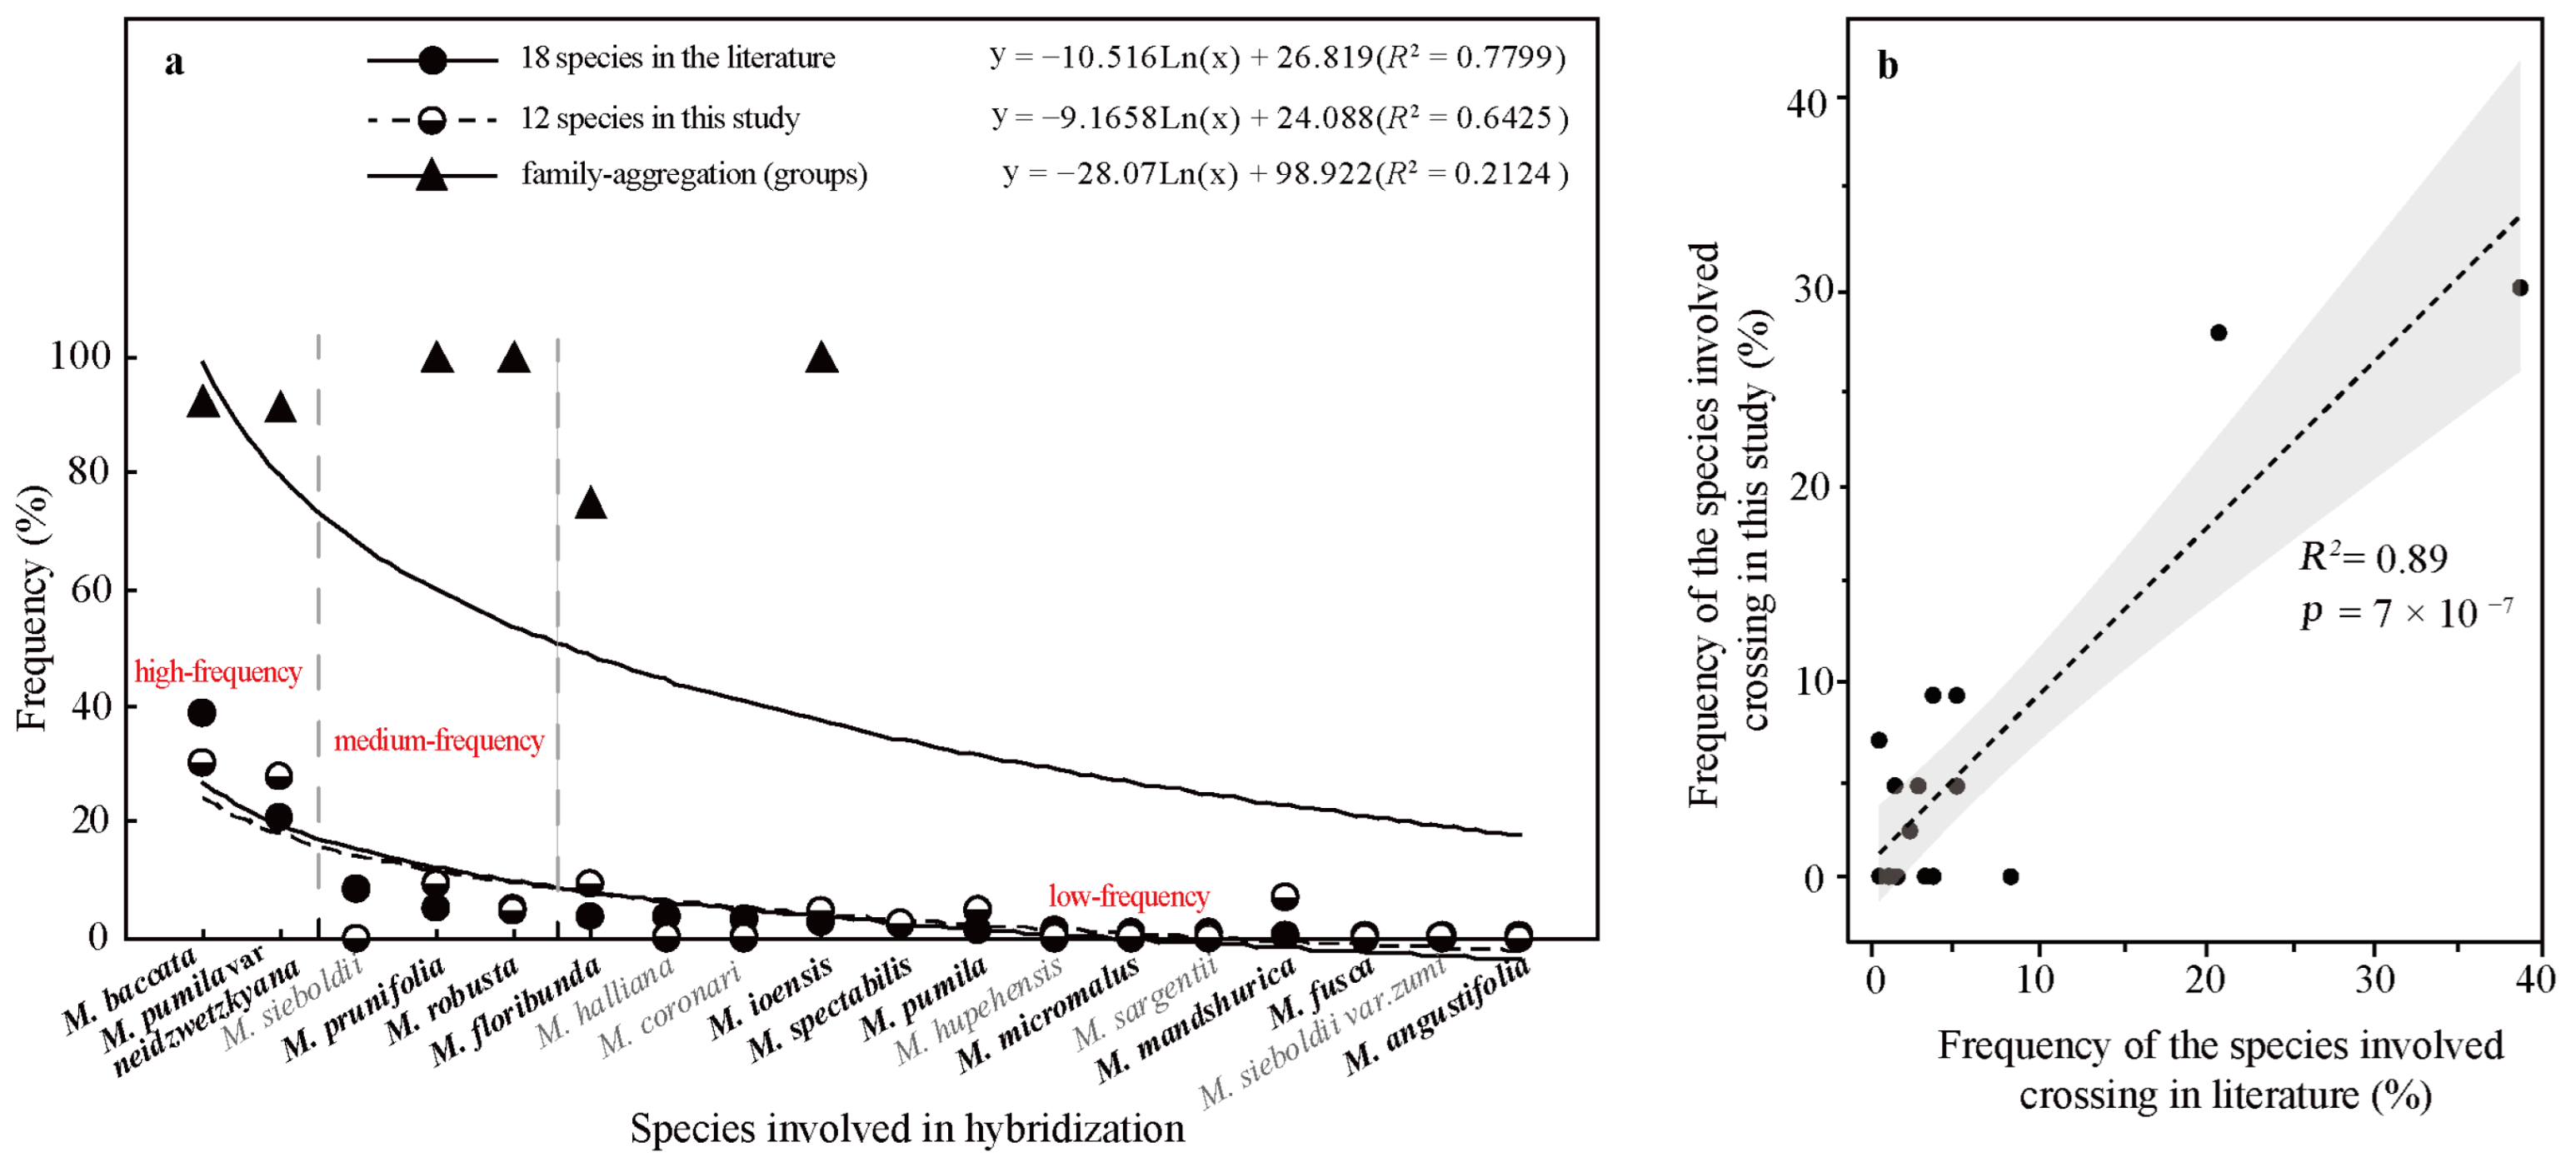
2.4.3. Hybridization Frequency of Species
3. Discussion
3.1. High Aberrant Pollen Rates May Be an Effective Indicator for Apomixis or Multiploid Cultivar Selection
3.2. Variation Tendency of Malus Pollen Morphology
3.3. Genetic Relationships of Malus Taxa Based on Phenotypic Traits of Pollen
4. Materials and Methods
4.1. Materials
4.2. Pollen Observations
4.3. Data Analysis
5. Conclusions
Supplementary Materials
Author Contributions
Funding
Data Availability Statement
Conflicts of Interest
References
- Blackmore, S.; Wortley, A.H.; Skvarla, J.J.; Rowley, J.R. Pollen Wall Development in Flowering Plants. New Phytol. 2007, 174, 483–498. [Google Scholar] [CrossRef]
- Katifori, E.; Alben, S.; Cerda, E.; Nelson, D.R.; Dumais, J. Foldable Structures and the Natural Design of Pollen Grains. Proc. Natl. Acad. Sci. USA 2010, 107, 7635–7639. [Google Scholar] [CrossRef]
- Sarwar, A.K.M.G.; Takahashi, H. Pollen Morphology of Kalmia L. (Phyllodoceae, Ericaceae) and its Taxonomic Significance. Bangladesh J. Plant Taxon. 2012, 19, 123–133. [Google Scholar] [CrossRef]
- Lechowicz, K.; Wrońska-Pilarek, D.; Bocianowski, J.; Maliński, T. Pollen Morphology of Polish Species from the Genus Rubus L. (Rosaceae) and its Systematic Importance. PLoS ONE 2020, 15, e0221607. [Google Scholar] [CrossRef]
- Jardine, P.E.; Palazzesi, L.; Tellería, M.C.; Barreda, V.D. Why does Pollen Morphology Vary? Evolutionary Dynamics and Morphospace Occupation in the Largest Angiosperm Order (Asterales). New Phytol. 2022, 234, 1075–1087. [Google Scholar] [CrossRef]
- Nazeri, J.V. Pollen Morphology of the Genus Malus (Rosaceae). Iran. J. Sci. Technol. (Sci.) 2008, 32, 89–97. [Google Scholar] [CrossRef]
- Li, M.; Tian, C.-F.; Idrees, M.; Pathak, M.; Xiong, X.-H.; Gao, X.-F.; Wang, X.-R. Pollen Morphology in Sorbus L. (Rosaceae) and Its Taxonomic Implications. Plants 2023, 12, 3318. [Google Scholar] [CrossRef] [PubMed]
- Romeiro, L.d.A.; da Silva, E.F.; Vasconcelos, L.V.; Lopes, K.d.S.; Carreira, L.M.M.; Guimarães, J.T.F. Pollen Morphology of Convolvulaceae from Southeastern Amazonian Cangas and Its Relevance for Interaction Networks and Paleoenvironmental Studies. Plants 2023, 12, 2256. [Google Scholar] [CrossRef]
- Banks, H.; Forest, F.; Lewis, G. Evolution and Diversity of Pollen Morphology in Tribe Cercideae (Leguminosae). Taxon 2014, 63, 299–314. [Google Scholar] [CrossRef]
- Tellería, M.C.; Barreda, V.D.; Jardine, P.E.; Palazzesi, L. The use of Pollen Morphology to Disentangle the Origin, Early Evolution, and Diversification of the Asteraceae. Int. J. Plant Sci. 2023, 184, 350–365. [Google Scholar] [CrossRef]
- Gonçalves-Esteves, V.; Vieira, G.R.M.; Carvalho, R.J.P.D.; Crespo, S.R.D.M.; Mendonça, C.B.F. Pollen Morphology of some Species of Spermacoceae s.s. (Rubiaceae) of the Atlantic Forest, Rio de Janeiro, Brazil. Acta Bot. Bras. 2020, 34, 243–255. [Google Scholar] [CrossRef]
- Sarwar, A.K.M.G.; Hoshino, Y.; Araki, H. Pollen Morphology and Its Taxonomic Significance in the Genus Bomarea Mirb. (Alstroemeriaceae)—I. Subgenera Baccata, Sphaerine, and Wichuraea. Acta Bot. Bras. 2015, 29, 425–432. [Google Scholar] [CrossRef]
- Walker, J.W.; Walker, A.G. Ultrastructure of Lower Cretaceous Angiosperm Pollen and the Origin and Early Evolution of Flowering Plants. Ann. Mo. Bot. Gard. 1984, 71, 464–521. [Google Scholar] [CrossRef]
- Quamar, M.F.; Singh, P.; Garg, A.; Tripathi, S.; Farooqui, A.; Shukla, A.N.; Prasad, N. Pollen Characters And Their Evolutionary and Taxonomic Significance: Using Light and Confocal Laser Scanning Microscope to Study Diverse Plant Pollen Taxa from Central India. Palynology 2022, 46, 1–13. [Google Scholar] [CrossRef]
- Guo, L.; Zhou, S.L.; Zhang, Z.S.; Shen, X.; Cao, Y.; Zhang, D.L.; Shu, H.R. Relationships of Species, Hybrid Species and Cultivars in Genus Malus Revealed by AFLP Markers. Sci. Silvae Sin. 2009, 45, 33–40. [Google Scholar] [CrossRef]
- Rehder, A. Manual of Cultivated Trees and Shrubs, 2nd ed.; Environmental Science, Biology: New York, NY, USA, 1940; pp. 389–399. [Google Scholar]
- Li, Y.N. Researches of Germplasm Resources of Malus Mill; China Agriculture Press: Beijing, China, 2001; pp. 181–183, 315–335. [Google Scholar]
- Fiala, J.L. Flowering Crabapples: The genus Malus; Timber Press: Portland, OR, USA, 1994; pp. 106–273. [Google Scholar]
- Jefferson, R.M. History, Progeny, and Locations of Crabapples of Documented Authentic Origin. Agricultural Research Service U.S. Department of Agriculture: Washington, DC, USA, 1970; pp. 8–83. [Google Scholar]
- Zhou, T.; Shen, X.; Zhou, D.J.; Fan, J.J.; Zhao, M.M.; Zhang, W.X.; Cao, F.L. Advances in the Classification of Crabapple Cultivars. Acta Hortic. Sin. 2018, 45, 380. [Google Scholar] [CrossRef]
- Zhang, W.X.; Fan, J.J.; Xie, Y.F.; Peng, Y.; Zhou, T.; Zhao, M.M. An Illustrated Electron Microscopic Study of Crabapple Pollen; Science Press: Beijing, China, 2018; pp. 37–197. [Google Scholar]
- Erdtman, G. Handbook of Palynology: An Introduction to the Study of Polllen Grains and Spores; Hafner: New York, NY, USA, 1969; pp. 6–100. [Google Scholar]
- Zheng, Y.; Qu, X.; Guo, L.; Sun, F.Y.; Mao, Z.Q.; Shen, X. Advances on Ornamental Crabapple Resources. J. Shandong Agric. Univ. (Nat. Sci. Ed.) 2008, 39, 152–160. [Google Scholar] [CrossRef]
- Reznick, D.N.; Ricklefs, R.E. Darwin’s Bridge between Microevolution and Macroevolution. Nature 2009, 457, 837–842. [Google Scholar] [CrossRef]
- Pozhidaev, A.E. Pollen Variety and Aperture Patterning. In Pollen and Spores: Morphology and Biology; Harley, M.M., Morton, C.M., Blackmore, S., Eds.; Royal Botanic Gardens: Kew, UK, 2000; pp. 205–225. [Google Scholar]
- Banks, H.; Stafford, P.; Crane, P.R. Aperture variation in the pollen of Nelumbo (Nelumbonaceae). Grana 2007, 46, 157–163. [Google Scholar] [CrossRef]
- Halbritter, H.; Ulrich, S.; Grímsson, F.; Weber, M.; Zetter, R.; Hesse, M.; Buchner, R.; Svojtka, M.; Frosch-Radivo, A. Illustrated Pollen Terminology; Springer: Cham, Switzerland, 2018; pp. 61–63. [Google Scholar] [CrossRef]
- Olien, W.C. Apomictic Crabapples and Their Potential for Research and Fruit Production. HortScience 1987, 22, 541–546. [Google Scholar] [CrossRef]
- Wei, Z.Q.; Peng, Y.; Li, F.X.; Di, C.Y.; Zhang, W.X. Study on the Cross Compatibility and Parent Selection among Ornamental Crabapple Cultivars. Acta Bot. Boreal.-Occident. Sin. 2023, 43, 1910–1919. [Google Scholar] [CrossRef]
- Mao, B.Q.; Chin, M.H.; Liu, C.J.; Zheng, B.; Fan, M.H. A Research on the Ability of Apomixis in Malus Plants. J. Southwest Univ. 1995, 17, 220–223. [Google Scholar]
- Xu, B.S. An Overview of Macroevolution on the Viewpoint of Microevolution. Acta Bot. Yunnanica 1991, 13, 101–112. [Google Scholar]
- Walker, J.W. Evolution of Exine Structure in the Pollen of Primitive Angiosperms. Am. J. Bot. 1974, 61, 891–902. [Google Scholar] [CrossRef]
- Walker, J.W.; Walker, A.G. Comparative Pollen Morphology of the Mainland African Genera of Myristicaceae (Cephalosphaera, Coelocaryon, Pycnanthus, and Scyphocephalium). Am. J. Bot. 1980, 67, 603–611. [Google Scholar] [CrossRef]
- Welsh, M.; Stefanović, S.; Costea, M. Pollen Evolution and its Taxonomic Significance in Cuscuta, (dodders, Convolvulaceae). Plant Syst. Evol. 2010, 285, 83–101. [Google Scholar] [CrossRef]
- Akhila, H.; Beevy, S.S. Palynological Characterization of Species of Sesamum (Pedaliaceae) from Kerala: A Systematic Approach. Plant Syst. Evol. 2015, 301, 2179–2188. [Google Scholar] [CrossRef]
- Yang, X.H. Observation and study on Malus pollen. J. Southwest Agric. Univ. 1986, 3, 122–129. [Google Scholar]
- Lee, S.; Heo, K.I.; Cho, J.; Lee, C.; Chen, W.; Kim, S.C. New Insights into Pollen Morphology and Its Implications in the Phylogeny of Sanguisorba L. (Rosaceae; Sanguisorbeae). Plant Syst. Evol. 2011, 291, 227–242. [Google Scholar] [CrossRef]
- Gasi, F.; Simon, S.; Pojskic, N.; Kurtovic, M.; Pejic, I. Genetic Assessment of Apple Germplasm in Bosnia and Herzegovina Using Microsatellite and Morphologic Markers. Sci. Horti. 2010, 126, 164–171. [Google Scholar] [CrossRef]
- Patzak, J.; Paprštein, F.; Henychová, A.; Sedlák, J. Comparison of Genetic Diversity Structure Analyses of SSR Molecular Marker Data within Apple (Malus × domestica) Genetic Resources. Genome 2012, 55, 647–665. [Google Scholar] [CrossRef]
- Wagner, I.; Weeden, N.F. Isozymes in Malus sylvestris, Malus domestica and in related Malus species. Acta Hortic. 2000, 538, 51–56. [Google Scholar] [CrossRef]
- Zhang, W.X.; Zhao, M.M.; Fan, J.J.; Zhou, T.; Chen, Y.X.; Cao, F.L. Study on Relationship between Pollen Exine Ornamentation Pattern and Germplasm Evolution in Flowering Crabapple. Sci. Rep. 2017, 7, 39759. [Google Scholar] [CrossRef] [PubMed]
- Chen, X.; Li, S.; Zhang, D.; Han, M.; Xin, J.; Zhao, C.; Wang, S.; Xin, L.; Ma, J.; Ji, J.; et al. Sequencing of a Wild Apple (Malus baccata) Genome Unravels the Differences between Cultivated and Wild Apple Species Regarding Disease Resistance and Cold Tolerance. G3 Genes Genomes Genet. 2019, 9, 2051–2060. [Google Scholar] [CrossRef] [PubMed]
- Yang, M.; Che, S.; Zhang, Y.; Song, W.; Yan, G.; Yu, W. Malus niedzwetzkyana (Dieck) Langenf Transcriptome Comparison and Phylogenetic Analysis with Malus sieversii (Ledeb) Roem. Genet. Resour. Crop Evol. 2019, 67, 313–323. [Google Scholar] [CrossRef]
- Schneider, C.A.; Rasband, W.S.; Eliceiri, K.W. Nih Image to Imagej: 25 Years of Image Analysis. Nat. Methods 2012, 9, 671–675. [Google Scholar] [CrossRef]


| Pollen Phenotypic Traits | Group/Subgroup | ||||||
|---|---|---|---|---|---|---|---|
| A | B | C | D | D1 | D2 | D3 | |
| P (μm) | 36.26 ± 4.21 d | 48.42 ± 4.36 a | 46.54 ± 2.69 abc | 45.29 ± 3.01 bc | 46.18 ± 3.58 abc | 47.14 ± 2.26 ab | 43.90 ± 2.54 c |
| E (μm) | 24.24 ± 1.02 bc | 27.42 ± 0.82 a | 22.95 ± 1.33 de | 23.39 ± 1.11 de | 24.86 ± 0.76 b | 23.72 ± 0.85 cd | 22.74 ± 0.79 e |
| E′ (μm) | 19.25 ± 1.10 c | 22.41 ± 0.67 a | 19.85 ± 1.20 bc | 19.78 ± 0.90 bc | 20.49 ± 0.76 b | 20.14 ± 0.83 b | 19.35 ± 0.75 c |
| S (μm2) | 690.05 ± 74.49 e | 1 043.46 ± 71.34 a | 840.68 ± 77.43 bcd | 834.03 ± 83.22 cd | 902.58 ± 76.27 b | 879.84 ± 64.92 bc | 785.28 ± 63.12 d |
| P/E | 1.51 ± 0.21 d | 1.78 ± 0.20 c | 2.04 ± 0.13 a | 1.94 ± 0.11 ab | 1.86 ± 0.15 bc | 1.99 ± 0.08 a | 1.94 ± 0.10 ab |
| P/E′ | 1.90 ± 0.24 c | 2.17 ± 0.19 b | 2.36 ± 0.15 a | 2.30 ± 0.13 a | 2.27 ± 0.19 ab | 2.35 ± 0.09 a | 2.28 ± 0.12 ab |
| E′/E | 0.80 ± 0.02 d | 0.82 ± 0.03 c | 0.87 ± 0.00 a | 0.85 ± 0.02 b | 0.82 ± 0.01 c | 0.85 ± 0.01 b | 0.85 ± 0.01 b |
| RW (μm) | 0.19 ± 0.04 a | 0.20 ± 0.02 a | 0.17 ± 0.03 a | 0.19 ± 0.03 a | 0.18 ± 0.06 a | 0.17 ± 0.02 a | 0.20 ± 0.03 a |
| FW (μm) | 0.10 ± 0.05 c | 0.12 ± 0.04 bc | 0.20 ± 0.04 a | 0.12 ± 0.04 bc | 0.10 ± 0.05 c | 0.15 ± 0.03 b | 0.12 ± 0.03 bc |
| PD (No./μm2) | 3.66 ± 3.49 b | 1.81 ± 1.92 c | 9.23 ± 1.41 a | 1.87 ± 2.23 c | 0.42 ± 0.64 c | 4.72 ± 1.53 b | 0.57 ± 0.81 c |
| Taxa quantity (No. and %) | 7 and 6.54 | 6 and 5.61 | 6 and 5.61 | 88 and 82.24 | 14 and 15.91 | 28 and 31.82 | 46 and 52.27 |
| No. | Progeny | Breeding Routes | References | Class Group in Figure 2 | Is the Family- Aggregation Distributed? | Is the Perforation Density of the Progeny Higher than that of one of Its Parents? | ||
|---|---|---|---|---|---|---|---|---|
| A, B, C, D | A, B, C, D1, D2, D3 | Unknown/Untested Taxa Are Considered with Lower Perforation Densities. | Unknown/Untested Taxa Are Excluded. | |||||
| 1 | M. ‘Adams’ | M. baccata × unknown → M. ‘Adams’ | [19] | D2 × unknown → D2 | Yes | Yes | Yes | Yes |
| 2 | M. ‘Almey’ | M. baccata × M. pumila var. neidzwetzkyana → M. ‘Almey’ | [19] | D2 × D3 → D2 | Yes | Yes | Yes | Yes |
| 3 | M. ‘Brandywine’ | 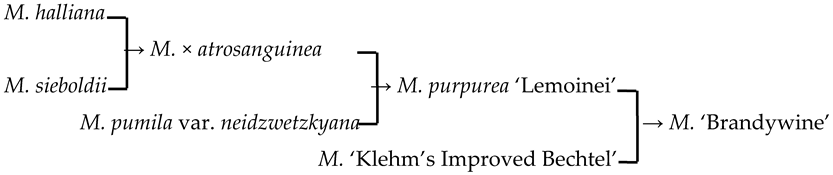 | [18,19] |  | No | No | Yes | No |
| 4 | M. ‘Cardinal’ | 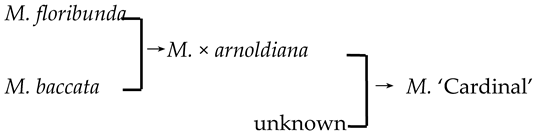 | [18,19] |  | Yes | No | Yes | No |
| 5 | M. ‘Dolgo’ | 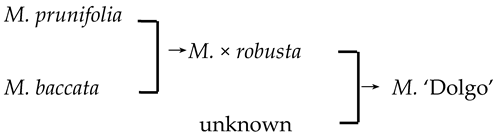 | [18] |  | Yes | Yes | Yes | Yes |
| 6 | M. ‘Eleyi’ | 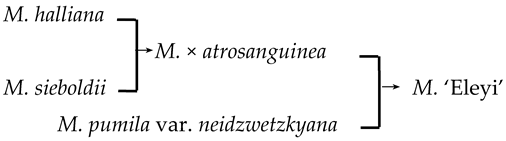 | [19] |  | Yes | Yes | Yes | No |
| 7 | M. ‘Flame’ | M. pumila × unknown → M. ‘Flame’ | [18] | D3 × unknown → D3 | Yes | Yes | Yes | No |
| 8 | M. ‘Golden Hornet’ | M. mandshurica × M. sieboldii → M. ‘Golden Hornet’ | [19] | D3 × untest→ D3 | Yes | Yes | Yes | Yes |
| 9 | M. ‘Hillier’ | M. floribunda × M. prunifolia → M. ‘Hillier’ | [23] | D2 × D1 → D3 | Yes | No | Yes | Yes |
| 10 | M. ‘Hopa’ | M. baccata × M. pumila var. neidzwetzkyana → M. ‘Hopa’ | [18] | D3 × D3→ D3 | Yes | Yes | Yes | Yes |
| 11 | M. ‘Klehm’s Improved Bechtel’ | M. ioensis × unknown → M. ‘Klehm’s Improved Bechtel’ | [17] | D1 × unknown → D2 | Yes | No | Yes | Yes |
| 12 | M. ‘Lisa’ | M. ioensis × unknown → M. ‘Lisa’ | [18] | D1 × unknown → D2 | Yes | No | Yes | Yes |
| 13 | M. ‘Liset’ | 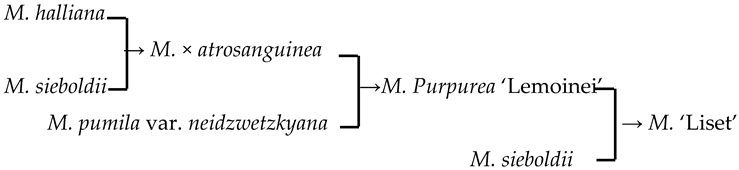 | [18] | 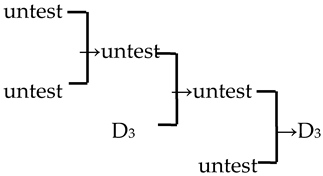 | Yes | Yes | Yes | No |
| 14 | M. ‘Makamik’ | M. pumila var. neidzwetzkyana × Unknown → M. ‘Makamik’ | [18] | D3 × unknown → D3 | Yes | Yes | Yes | No |
| 15 | M. ‘Prairie Rose’ | M. ioensis × unknown → M. ‘Prairie Rose’ | [18] | D1 × unknown → D2 | Yes | No | Yes | Yes |
| 16 | M. ‘Professor Sprenger’ | M. mandshurica × M. sieboldii → M. ‘Professor Sprenger’ | [23] | D3 × untest → D3 | Yes | Yes | Yes | Yes |
| 17 | M. ‘Profusion’ | 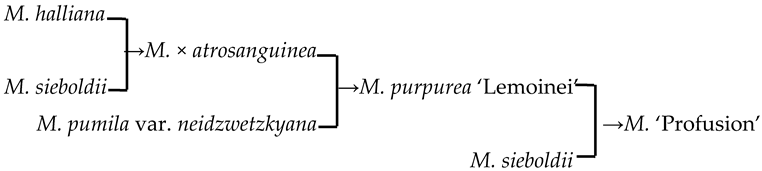 | [19] | 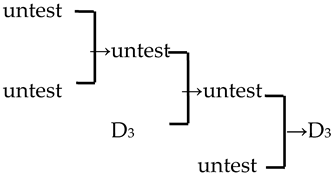 | Yes | Yes | Yes | No |
| 18 | M. ‘Purple prince’ | 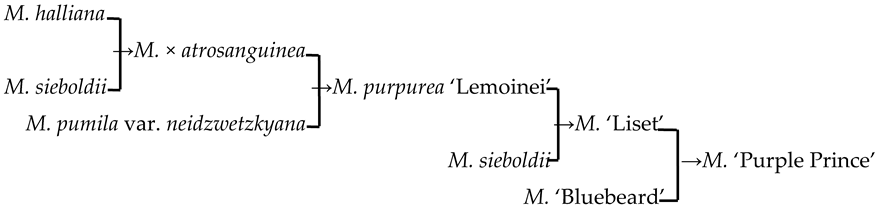 | [18] | 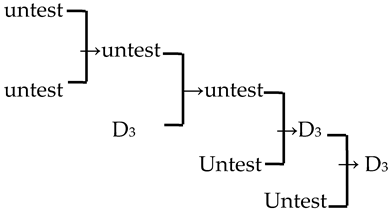 | Yes | Yes | Yes | Yes |
| 19 | M. ‘Radiant’ |  | [19] | 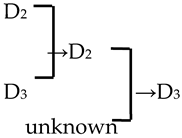 | Yes | Yes | Yes | No |
| 20 | M. ‘Red Jade’ | 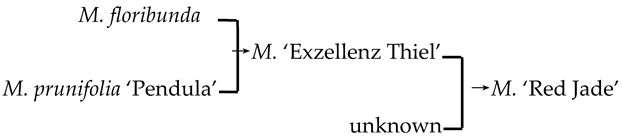 | [19] | 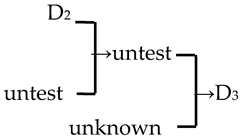 | Yes | No | Yes | No |
| 21 | M. ‘Red Splendor’ | 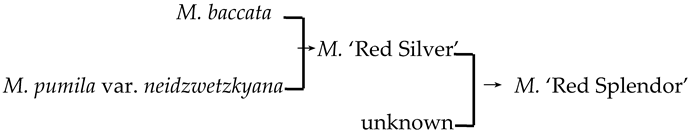 | [19] |  | Yes | Yes | Yes | Yes |
| 22 | M. ‘Robinson’ | M. baccata × M. pumila → M. ‘Robinson’ | [19] | D2 × D3 → D3 | Yes | Yes | No | No |
| 23 | M. ‘Royalty’ | 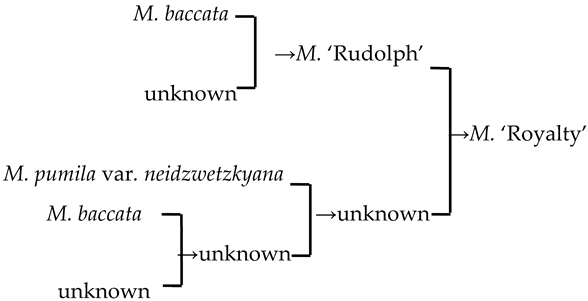 | [19] | 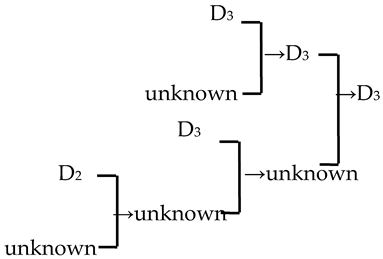 | Yes | Yes | Yes | No |
| 24 | M. ‘Rudolph’ | M. baccata × unknown→ M. ‘Rudolph’ | [18,19] | D2 × unknown →D3 | Yes | No | Yes | No |
| 25 | M. ‘Sparkler’ |  | [18] | 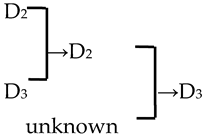 | Yes | Yes | Yes | No |
| 26 | M. ‘Spring Snow’ | 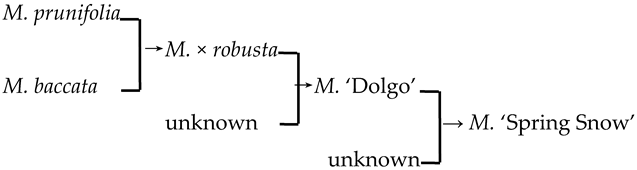 | [19] | 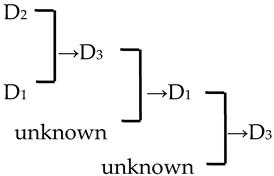 | Yes | Yes | Yes | Yes |
| 27 | ‘Van Eseltine’ | 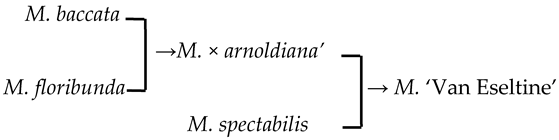 | [19] |  | No | No | Yes | Yes |
| 28 | M. zumi ‘Calocarpa’ | M. mandshurica × M. sieboldii → M. zumi ‘Calocarpa’ | [17] | D3 × untest →D3 | Yes | Yes | Yes | Yes |
| The probability of family aggregation distribution (the percentage of the progeny and its parents belonging to the same group, %) | 92.86 | 67.86 | / | / | ||||
| The percentage of the progeny whose perforation density is higher than that of its parents (%) | / | / | 96.43 | 53.57 | ||||
| Species | Cultivars | Cultivars | Cultivars |
|---|---|---|---|
| Malus angustifolia II | M. ‘Abundance’ | M. ‘Hopa’ | M. ‘Red Sentinel’ |
| M. baccata IV | M. ‘Adams’ | M. ‘Indian Magic’ | M. ‘Red Splendor’ |
| M. domestica var. binzi V | M. ‘Almey’ | M. ‘Indian Summer’ | M. ‘Regal’ |
| M. floribunda V | M. ‘Ballet’ | M. ‘Kelsey’ | M. ‘Robinson’ |
| M. fusca III | M. ‘Brandywine’ | M. ‘King Arthur’ | M. ‘Roger’s Selection’ |
| M. honanensis III | M. ‘Butterball’ | M. ‘Klehm’s Improve Bechtel’ | M. ‘Royal Beauty’ |
| M. ioensis II | M. ‘Cardinal’ | M. ‘Lancelot’ | M. ‘Royal Gem’ |
| M. mandshurica IV | M. ‘Centurion’ | M. ‘Lisa’ | M. ‘Royal Raindrop’ |
| M. micromalus V | M. ‘Cinderella’ | M. ‘Liset’ | M. ‘Royalty’ |
| M. ombrophila III | M. ‘Cloudsea’ | M. ‘Lollipop’ | M. ‘Rudolph’ |
| M. platycarpa II | M. ‘Coralburst’ | M. ‘Louisa Contort’ | M. ‘Rum’ |
| M. prunifolia V | M. ‘Darwin’ | M. ‘Makamik’ | M. ‘Show Time’ |
| M. pumila V | M. ‘David’ | M. ‘Mary Potter’ | M. ‘Snowdrift |
| M. Pumila var. neidzwetzkyana V | M. ‘Dolgo’ | M. ‘May’s Delight’ | M. ‘Sparkler’ |
| M. robusta V | M. ‘Donald Wyman’ | M. ‘Molten Lava’ | M. ‘Spring Glory’ |
| M. rockii IV | M. ‘Eleyi’ | M. ‘Perfect Purple’ | M. ‘Spring Sensation’ |
| M. sieversii V | M. ‘Everest’ | M. ‘Pink Princess’ | M. ‘Spring Snow’ |
| M. spectabilis V | M. ‘Fairytail Gold’ | M. ‘Pink Spires’ | M. ‘Sugar Tyme’ |
| M. sylvestris V | M. ‘Firebird’ | M. ‘Prairie Rose’ | M. ‘Sweet Sugar Tyme’ |
| M. toringoides III | M. ‘Flame’ | M. ‘Prairifire’ | M. ‘Thunderchild’ |
| M. tschonoskii I | M. ‘Furong’ | M. ‘Professor Sprenger’ | M. ‘Tina’ |
| M. turkmenorum V | M. ‘Golden Hornet’ | M. ‘Profusion’ | M. ‘Vans Eseltine’ |
| M. yunnanensis III | M. ‘Golden Raindrop’ | M. ‘Purple Gems’ | M. ‘Velvet Pillar’ |
| M. ‘Gorgeous’ | M. ‘Purple Prince’ | M. ‘Weeping Madonna’ | |
| M. ‘Guard’ | M. purpurei ‘Neville Copeman’ | M. ‘White Cascade’ | |
| M. halliana ‘Pink Double’ | M. ‘Radiant’ | M. ‘Winter Gold’ | |
| M. ‘Harvest Gold’ | M. ‘Red Baron’ | M. ‘Winter Red | |
| M. ‘Hillier’ | M. ‘Red Jade’ | M. zumi ‘Calocarpa’ |
Disclaimer/Publisher’s Note: The statements, opinions and data contained in all publications are solely those of the individual author(s) and contributor(s) and not of MDPI and/or the editor(s). MDPI and/or the editor(s) disclaim responsibility for any injury to people or property resulting from any ideas, methods, instructions or products referred to in the content. |
© 2024 by the authors. Licensee MDPI, Basel, Switzerland. This article is an open access article distributed under the terms and conditions of the Creative Commons Attribution (CC BY) license (https://creativecommons.org/licenses/by/4.0/).
Share and Cite
Fan, J.; Wang, Y.; Hao, Z.; Peng, Y.; Ma, J.; Zhang, W.; Zhao, M.; Zai, X. Characteristics of Phenotypic Variation of Malus Pollen at Infrageneric Scale. Plants 2024, 13, 2522. https://doi.org/10.3390/plants13172522
Fan J, Wang Y, Hao Z, Peng Y, Ma J, Zhang W, Zhao M, Zai X. Characteristics of Phenotypic Variation of Malus Pollen at Infrageneric Scale. Plants. 2024; 13(17):2522. https://doi.org/10.3390/plants13172522
Chicago/Turabian StyleFan, Junjun, Yun Wang, Zhenping Hao, Ye Peng, Jingze Ma, Wangxiang Zhang, Mingming Zhao, and Xueming Zai. 2024. "Characteristics of Phenotypic Variation of Malus Pollen at Infrageneric Scale" Plants 13, no. 17: 2522. https://doi.org/10.3390/plants13172522
APA StyleFan, J., Wang, Y., Hao, Z., Peng, Y., Ma, J., Zhang, W., Zhao, M., & Zai, X. (2024). Characteristics of Phenotypic Variation of Malus Pollen at Infrageneric Scale. Plants, 13(17), 2522. https://doi.org/10.3390/plants13172522