Article

The Ectopic Expression of the MpDIR1(t) Gene Enhances the Response of Plants from Arabidopsis thaliana to Biotic Stress by Regulating the Defense Genes and Antioxidant Flavonoids

1
College of Agronomy and Life Sciences, Zhaotong University, Zhaotong 657000, China
2
State Key Laboratory of Subtropical Silviculture, College of Forestry and Biotechnology, Zhejiang A & F University, Hangzhou 311300, China
3
Institute of Pure & Applied Biology (IP&AB), Bahauddin Zakariya University, Multan 60800, Punjab, Pakistan
4
State Key Laboratory for Conservation and Utilization of Subtropical Agro-Bioresources, College of Agriculture, Guangxi University, 100 Daxue Rd., Nanning 530004, China
5
Key Laboratory of Horticultural Plant Biology (Ministry of Education), Key Laboratory of Biology and Genetic Improvement of Horticultural Crops (Ministry of Agriculture), Huazhong Agricultural University, Wuhan 430070, China
*
Authors to whom correspondence should be addressed.
These authors contributed equally to this work.
Plants 2024, 13(19), 2692; https://doi.org/10.3390/plants13192692
Submission received: 20 July 2024 / Revised: 16 September 2024 / Accepted: 23 September 2024 / Published: 25 September 2024
(This article belongs to the Special Issue Plant Defense against Pathogens: Micro- to Molecular Insights)

Abstract

:
The Defective in Induced Resistance 1 (DIR1) gene, a member of the lipid transferase proteins (LTPs), plays a crucial role in plant defense against pathogens. While previous transcriptomic studies have highlighted the significant expression of citrus LTPs during biotic stress, functional annotations of LTPs in the Citrus genera remain limited. In this study, we cloned the Murraya paniculata DIR1 (MpDIR1(t)) gene and overexpressed it in Arabidopsis thaliana to evaluate its stress response mechanisms against biotic stress. The transgenic Arabidopsis lines showed fewer disease symptoms in response to Pseudomonas syringae (Pst DC3000) compared to wild-type Arabidopsis. Defense and pathogenesis-responsive genes such as PR1, PR4, PR5, and WRKY12 were significantly induced, showing a 2- to 12-fold increase in all transgenic lines compared to the wild type. In addition, the Pst DC3000-infected transgenic Arabidopsis lines demonstrated elevated levels of flavonoids and salicylic acid (SA), along with higher expression of SA-related genes, compared to the wild type. Moreover, all transgenic lines possessed lower reactive oxygen species levels and higher activity of antioxidant defense enzymes such as superoxide dismutase, peroxidase, and catalase under Pst DC3000 stress compared to the wild type. The up-regulation of defense genes, activation of the SA pathway, accumulation of flavonoids, and reinforcement of antioxidant defense mechanisms in transgenic Arabidopsis lines in response to Pst DC3000 underscore the critical role of MpDIR1(t) in fortifying plant immunity. Thus, MpDIR1(t) constitutes a promising candidate gene for improving bacterial disease resistance in commercial citrus cultivars.

1. Introduction

Plants possess a defense mechanism known as systemic acquired resistance (SAR), which protects them from a wide range of pathogens via signal transduction from infected to non-infected parts of the plant following a primary inoculation [1]. A key protein involved in SAR signal transduction is Defective in Induced Resistance 1 (DIR1) protein, which is expressed in all living cells [2]. DIR1 is a lipid transfer protein that plays a crucial role in plant defense signaling by facilitating the movement of lipid-based molecules between different parts of the plant, essential for systemic acquired resistance [2]. As a lipid transfer protein (LTP), DIR1 aids in the long-distance signaling of defense-related molecules such as azelaic acid (AzA), dehdryoabietinal (DA), glycerol-3-phosphate (G3P), and methyl salicylate (MeSA). These molecules are vital in amplifying the defense signals in distant tissues, ensuring that the entire plant can respond to pathogenic attacks [3]. The coordinated action of these signals enables the plant to effectively combat and resist subsequent pathogen attacks, thereby enhancing its overall resilience and health. Mutants deficient in DIR1 exhibit a SAR-deficient phenotype [4]. Homologs of DIR1 have been identified in Arabidopsis thaliana [2,3] and appear to be conserved in plant species such as tobacco (Nicotiana tabacum) [5] and cucumber [6]. Functional analyses have revealed that orthologs of DIR1 also exist in tomato and soybean [6]. Studies indicate that the DIR1 gene is conserved across various plant species, including citrus, and is expressed in response to pathogen infection and other stress conditions, underscoring its role in the citrus plant’s defense mechanisms [7]. The DIR1 protein, belonging to the LTP family, produces a strong mobile signal that is activated locally after local infection and subsequently moves through the phloem to induce SAR in distant uninfected Arabidopsis leaves [4,8]. Furthermore, the resistance-promoting activity of molecules such as AzA, DA, G3P, and MeSA all require a functional DIR1 protein [2].
Plant species possess different sets of genes that respond to a variety of abiotic and biotic stresses, providing local or systemic defense mechanisms [9,10]. These defense genes usually belong to the WRKY transcriptional factors, PR (pathogenesis-related) proteins, and PI (protease inhibitors) gene families and are also associated with secondary metabolites that produce antimicrobial compounds [11,12,13,14]. The WRKY, PR, and PI transcription factor families, along with the PAL (phenylalanine ammonia-lyase) gene, play crucial roles in plant biotic stress defense mechanisms. The expression of these defense genes is highly dependent on the type of pathogen and varies among species [15]. Notably, several transcriptomic studies on citrus greening disease (CGD) have revealed that citrus species stimulate a number of genes belonging to the WRKY, PR, and secondary metabolic pathways, such as PAL gene categories, in response to CGD [16,17,18]. The PAL gene encodes an enzyme that catalyzes the conversion of phenylalanine to cinnamic acid, a key step in the phenylpropanoid pathway. This pathway leads to the production of a diverse group of secondary metabolites, including salicylic acid and various antioxidant flavonoids [19,20]. Generally, citrus species resistant to the CGD pathogen Candidatus Liberibacter asiaticus (CLas) exhibit a rapid and resilient response to CLas invasion (prior to CLas stability), whereas CLas-susceptible species show a weak or delayed activation of defense gene [18,21]. Meanwhile, CLas induces certain virulence proteins and enzymes that degrade salicylic acid and its derivatives, contributing to the failure of the host defense system [22,23] and resulting in serve symptoms [24].
As no CGD-resistant germplasm has been identified within the Citrus genus, some promising citrus relatives have shown resistance to CGD disease. Notable examples include orange jasmine (Murraya paniculata) [25] and Poncirus trifoliata [26], as well as primitive citrus such as papeda (Citrus ichangensis) [21] and the semi-tolerant Atalantia buxifolia, which exhibits mild symptoms [27,28]. Conversely, pummelo (Citrus maxima) [29] is susceptible, while sweet orange (Citrus sinensis) and mandarins (Citrus reticulata) are considered highly susceptible citrus species [28]. CGD-resistant and susceptible species exhibit the activation of different set of genes, metabolites, and defense pathways in response to CLas progression [21]. The high expression of certain genes in resistant species, as opposed to their lower expression in susceptible citrus species, highlights promising candidate genes potentially involved in resistance against CLas. The primary objective of this study was to determine whether the overexpression of the MpDIR1(t) gene could confer enhanced biotic stress resistance in transgenic Arabidopsis thaliana by modulating the expression of defense-related genes and the biosynthesis of antioxidant flavonoids. This study involved the assessment of gene expression profiles, salicylic acid determination in transgenic lines, antioxidant flavonoids, antioxidant enzymatic defense assays, and biochemical attributes of transgenic lines to quantify the levels of defense-related metabolites. Through this research, we aimed to better understand the mechanisms underlying biotic stress resistance and potentially develop crops with improved resistance to bacterial diseases in commercial citrus cultivars.

2. Results and Discussion

2.1. Gene Expression and Sequence Variation of DIR1 Gene between CGD-Resistant and Susceptible Species

Wild citrus and its relatives exhibit varying degrees of resistance to the CLas pathogen. Previous transcriptomic studies have shown that citrus germplasm responds differently to CLas infection [7,28]. These studies revealed that the DIR1 gene is significantly induced in CLas-resistant citrus species [30], whereas in susceptible species, such as sweet orange, the DIR1 gene is either less expressed or down-regulated [30,31]. In our study, we used a resistant citrus relative, Murraya paniculata, and a highly susceptible species, Citrus sinensis, to examine the gene expression pattern of DIR1 gene in response to CLas infection (Figure 1A). Upon CLas inoculation, the gene expression results indicated that the DIR1 gene was significantly up-regulated in Murraya paniculata compared to sweet orange (Figure 1A).
Previous studies revealed that CLas-infected Murraya paniculata exhibits resistance or no symptoms and remains healthy in long-term field evaluation [25]. Additionally, Murraya paniculata has shown the lowest number of CLas bacterium titers compared to other citrus species [25,32]. These field and laboratory evaluations indicate that Murraya paniculata is resistant to CGD disease. The high expression of the DIR1 gene following CLas invasion in Murraya paniculata, compared to sweet orange (Figure 1A), suggests a candidate gene that might confer resistance to bacterial stress. Moreover, we have cloned the DIR1 gene to examine sequence variations among citrus species; the results revealed four amino acid variations between the resistant Murraya paniculata MpDIR1(t) gene and the susceptible Citrus sinensis CsDIR1 gene (Figure 1B). Additionally, the MpDIR1(t) amino acid sequence showed the highest homology with Morella rubra and Arabidopsis thaliana (Figure 1C), which are involved in lipid transport, systemic acquired resistance, and salicylic acid-mediated defense signaling pathway activities [3].

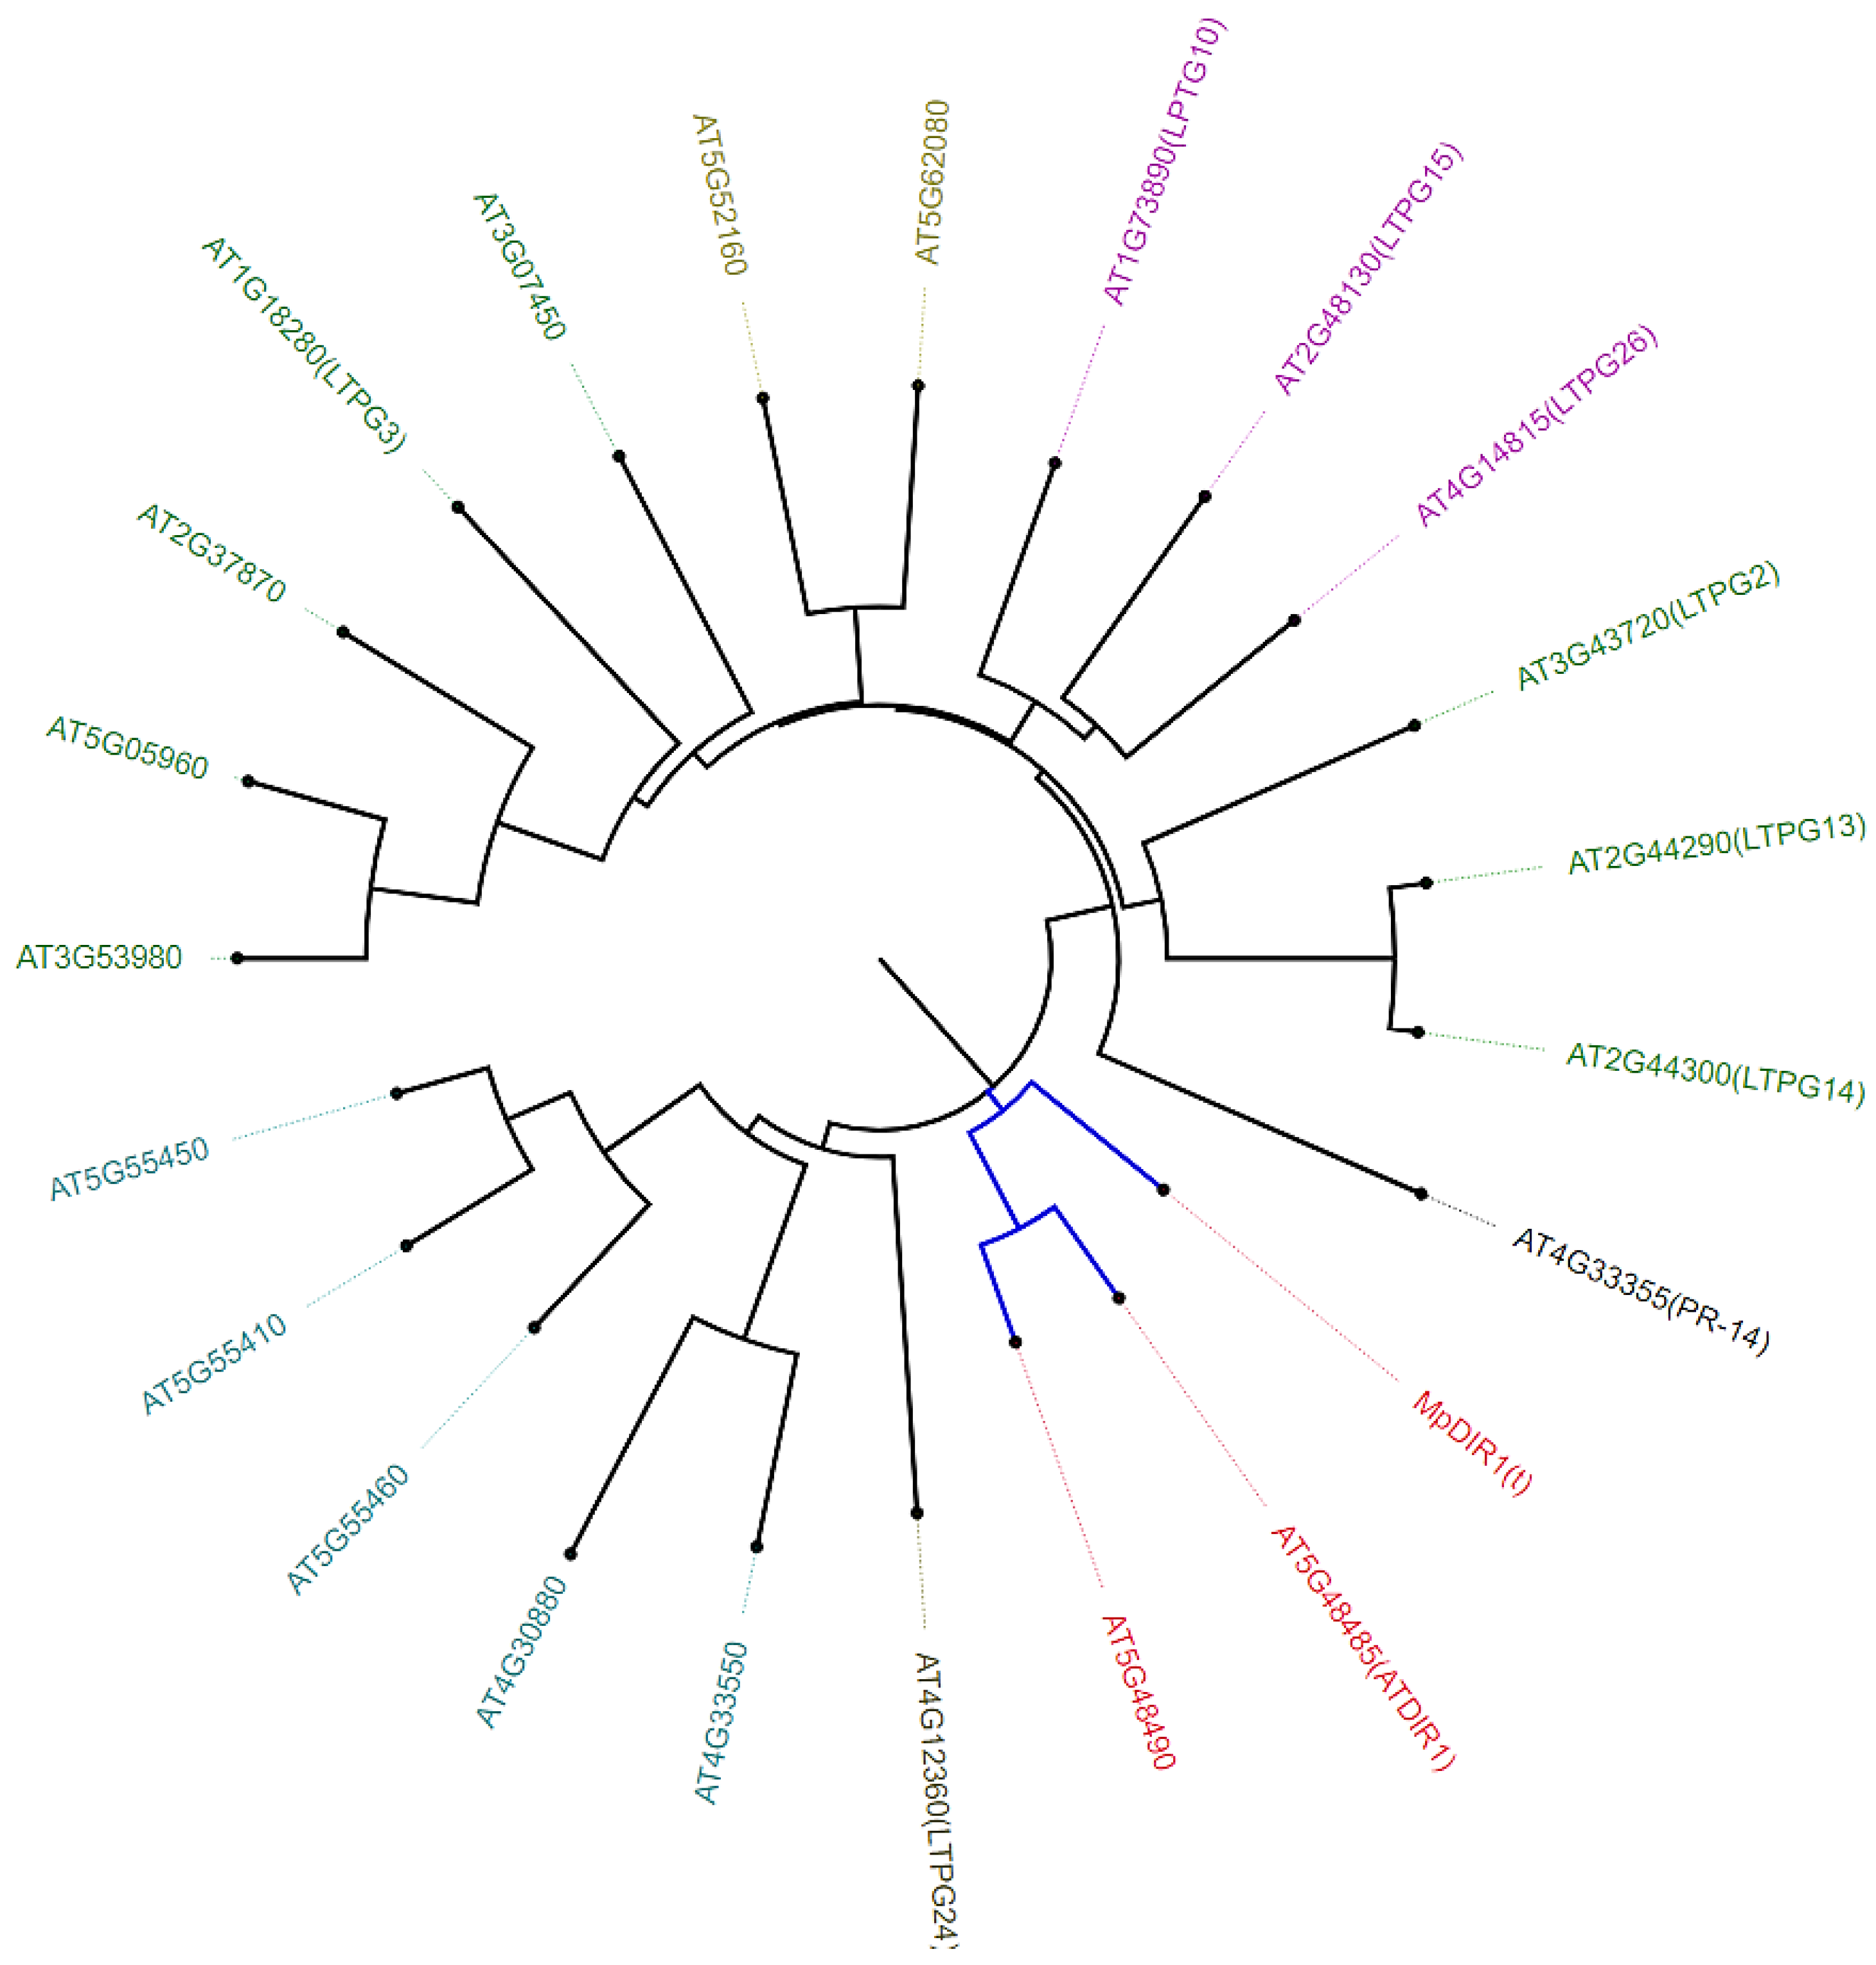
2.2. Phylogenetic Analysis of MpDIR1(t) Gene

The MpDIR1(t) gene nucleotide sequence was subjected to a BLASTx (translated nucleotide to protein) analysis using an online tool to find homologous protein sequences in other plant species (https://blast.ncbi.nlm.nih.gov/Blast.cgi?PROGRAM=blastx&PAGE_TYPE=BlastSearch&LINK_LOC=blasthome (accessed on 20 January 2024)). In addition, the MpDIR1(t) gene was analyzed using the BLAST tool on the TAIR website (https://www.arabidopsis.org/ (accessed on 15 February 2024)). The phylogenetic analysis revealed that the MpDIR1(t) protein exhibits the highest similarity and homology to the Arabidopsis DIR1 gene (Figure 2) [2,3,8,25,27]. Transient expression of the Arabidopsis DIR1 gene has been shown to stimulate local or systematic resistance to biotic stress [8]. The phylogenetic and amino acid sequence analyses suggest that the MpDIR1(t) gene may function similarly to the Arabidopsis DIR1 gene in systemic acquired resistance and the salicylic acid-mediated signaling pathways.

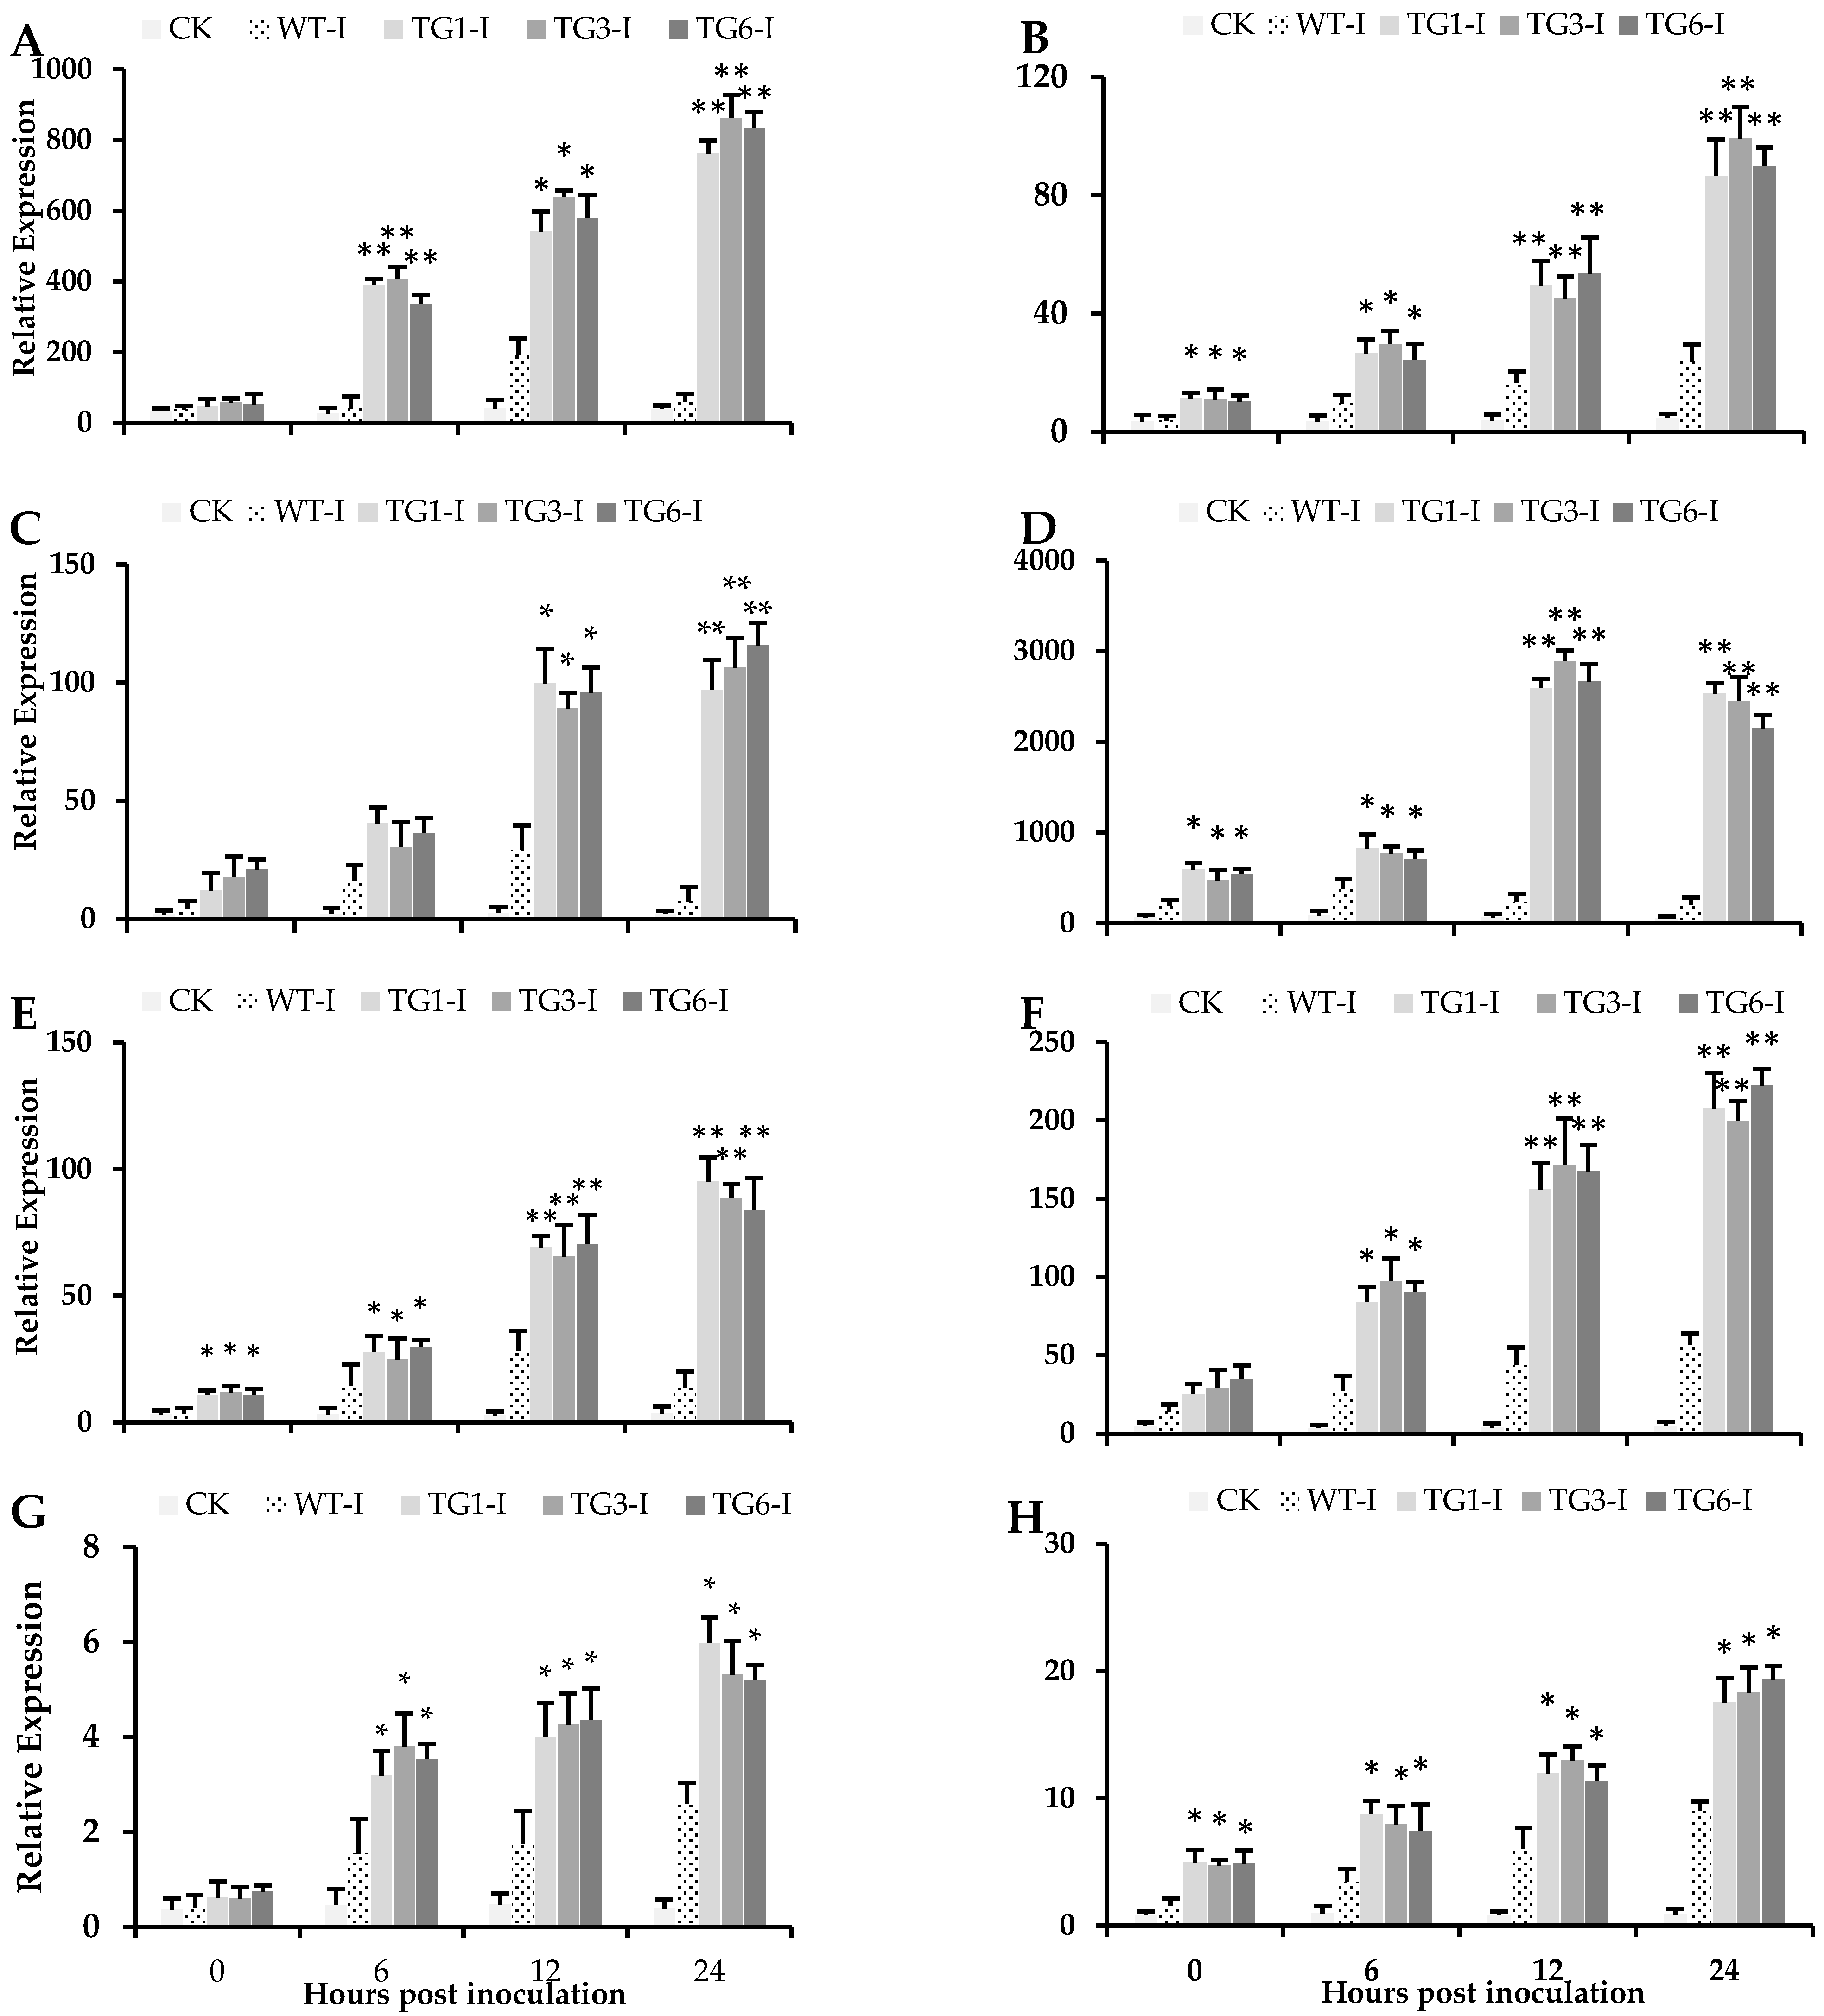
2.3. Ectopic Expression of MpDIR1(t) in Arabidopsis Confer Resistance to the Pst DC3000 Bacteria

The MpDIR1(t) gene was significantly overexpressed in all transgenic Arabidopsis thaliana lines compared to the wild-type plants (Supplementary Materials; Figure S1). A Pst DC3000 bacterial suspension was infiltrated into the leaves of both wild-type and transgenic Arabidopsis expressing the MpDIR1(t) gene. Wild-type plants exhibited obvious symptoms of Pst DC3000 infection 12 h post-inoculation, with severe symptoms observed after 24 h. In contrast, all transgenic leaves displayed delayed symptoms between 24 to 48 h post-inoculation, with symptom intensity being slight in transgenic leaves. The gene expression analysis indicated that Pst DC3000 gene expression rapidly increased in the wild-type Arabidopsis leaves from 0 to 24 h post-inoculation with Pst DC3000 (Figure 3A). The increase in bacterial transcripts in both the transgenic and wild-type leaves was similar from 0 to 6 h post-inoculation, but from 6 to 24 h post-inoculation, the bacterial transcript levels were significantly lower in all transgenic lines compared to the wild type (Figure 3A). Conversely, all inoculated leaves of the transgenic lines showed a rapid increase in MPDIR1(t) expression from 0 to 24 h post-inoculation with Pst DC3000 (Figure 3B). These results suggest that the overexpression of the MpDIR1(t) gene plays a significant role in restricting the bacterial colonization of leaf tissues.
The gene expression data indicated that the defense response genes, such as pathogenesis-related (PR) genes AtPR1, AtPR4, AtPR5, and AtPAL, were significantly induced in all transgenic Arabidopsis leaves (Figure 4). Previous studies have reported that a lipid transfer protein exhibits antifungal and antioxidant activity in transgenic wheat [33]. Pathogenesis-related genes including PR1, PR2, PR4, PR5, PR10, PI family genes, and WRKY DNA-binding transcription factor (WRKY12) genes, are involved in defense mechanisms and various processes in plants [34,35]. It has been previously documented that the PAL gene plays a role in the biosynthesis of salicylic acid in Arabidopsis, and a high expression of the PR1 gene serves as a marker for the SA-mediated defense signaling pathway [36]. Furthermore, following inoculation with Pst DC3000, several genes associated with pathogenesis-related (PR) genes, protease inhibitors (PI) family, WRKY transcription factors, and PAL were significantly induced in the leaves of the transgenic lines compared to the wild type (Figure 4A–H). The WRKY, PR, and PI family genes are involved in both local and systematic defense responses to pathogen progression [11,12,13]. The expression of four additional genes, including PI2 and NPR1 (a positive regulator of SAR during biotic stress), is presented in the Supplementary Materials, Figure S2. Genes related to the PR, PI, and WRKY families are implicated in local or systemic defense against a variety of pathogens across many plant species [35,37,38]. The biosynthesis of salicylic acid and the induction of different defense responses (WRKY, PR, and PI) vary among plant species and are influenced by the lifestyle of the pathogen [15,39]. The intricate interplay between the PR, PI, and WRKY gene families underscores the complex defense mechanisms employed by plants to cope with pathogens. Species-specific variations in salicylic acid biosynthesis and defense gene induction highlight the adaptability of plants in responding to diverse bacterial disease challenges.

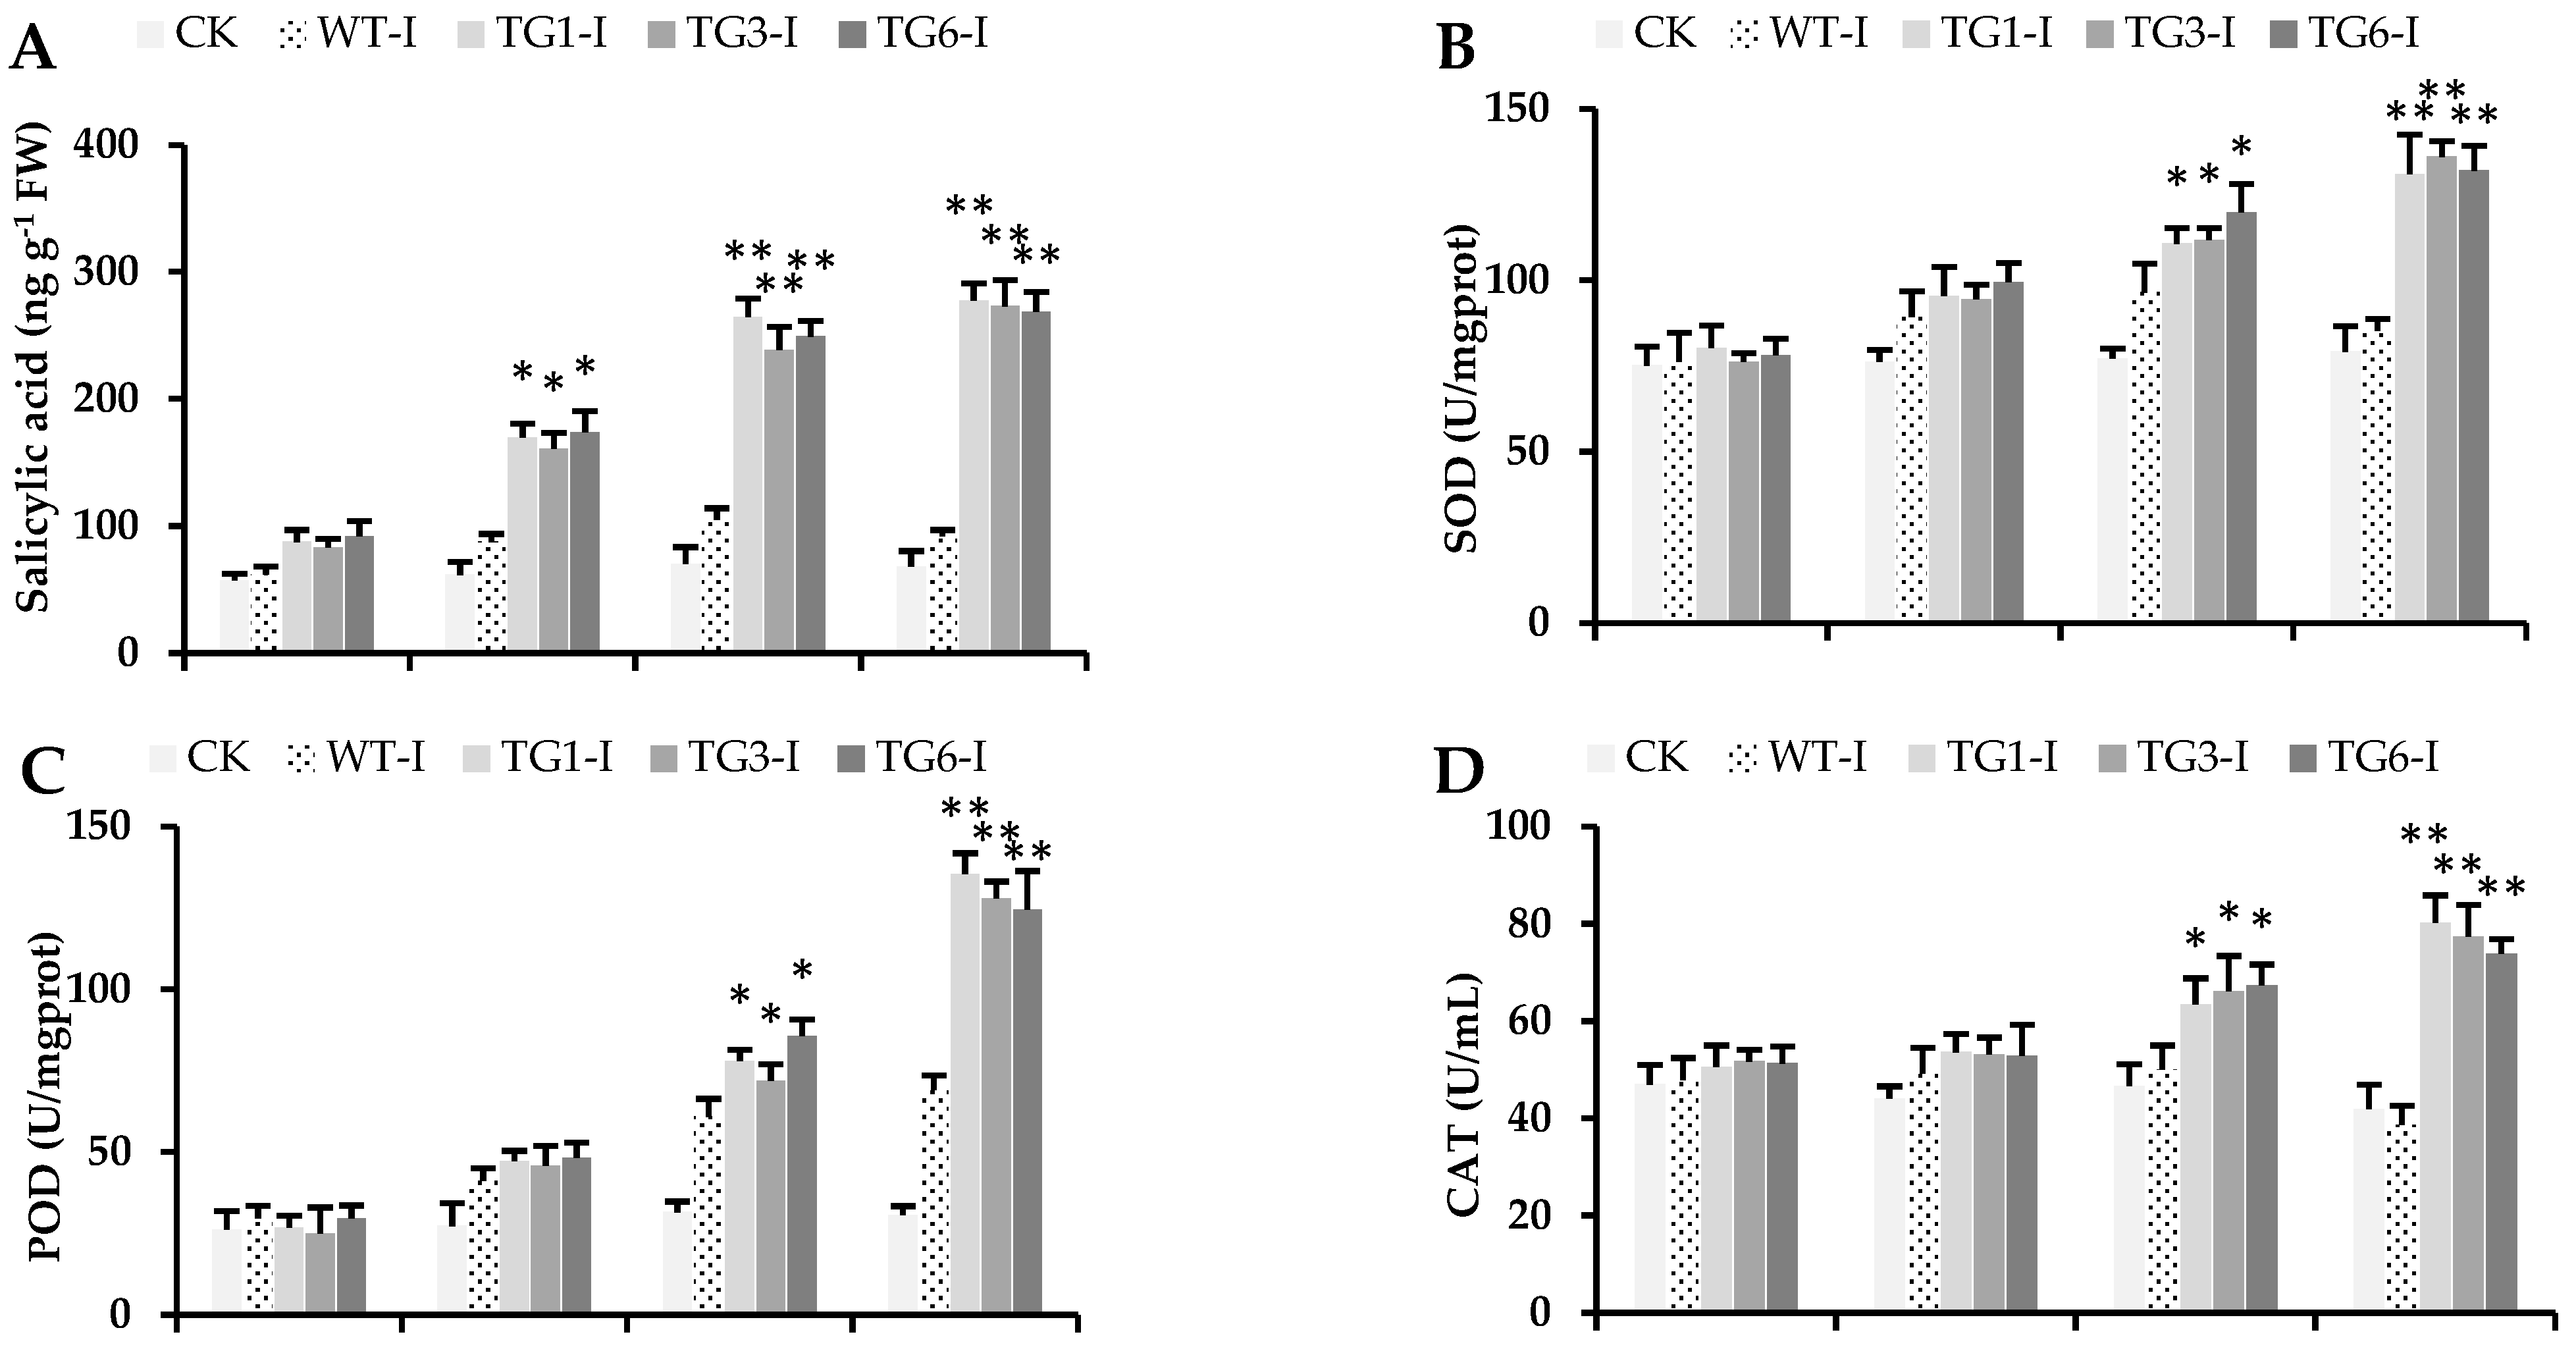
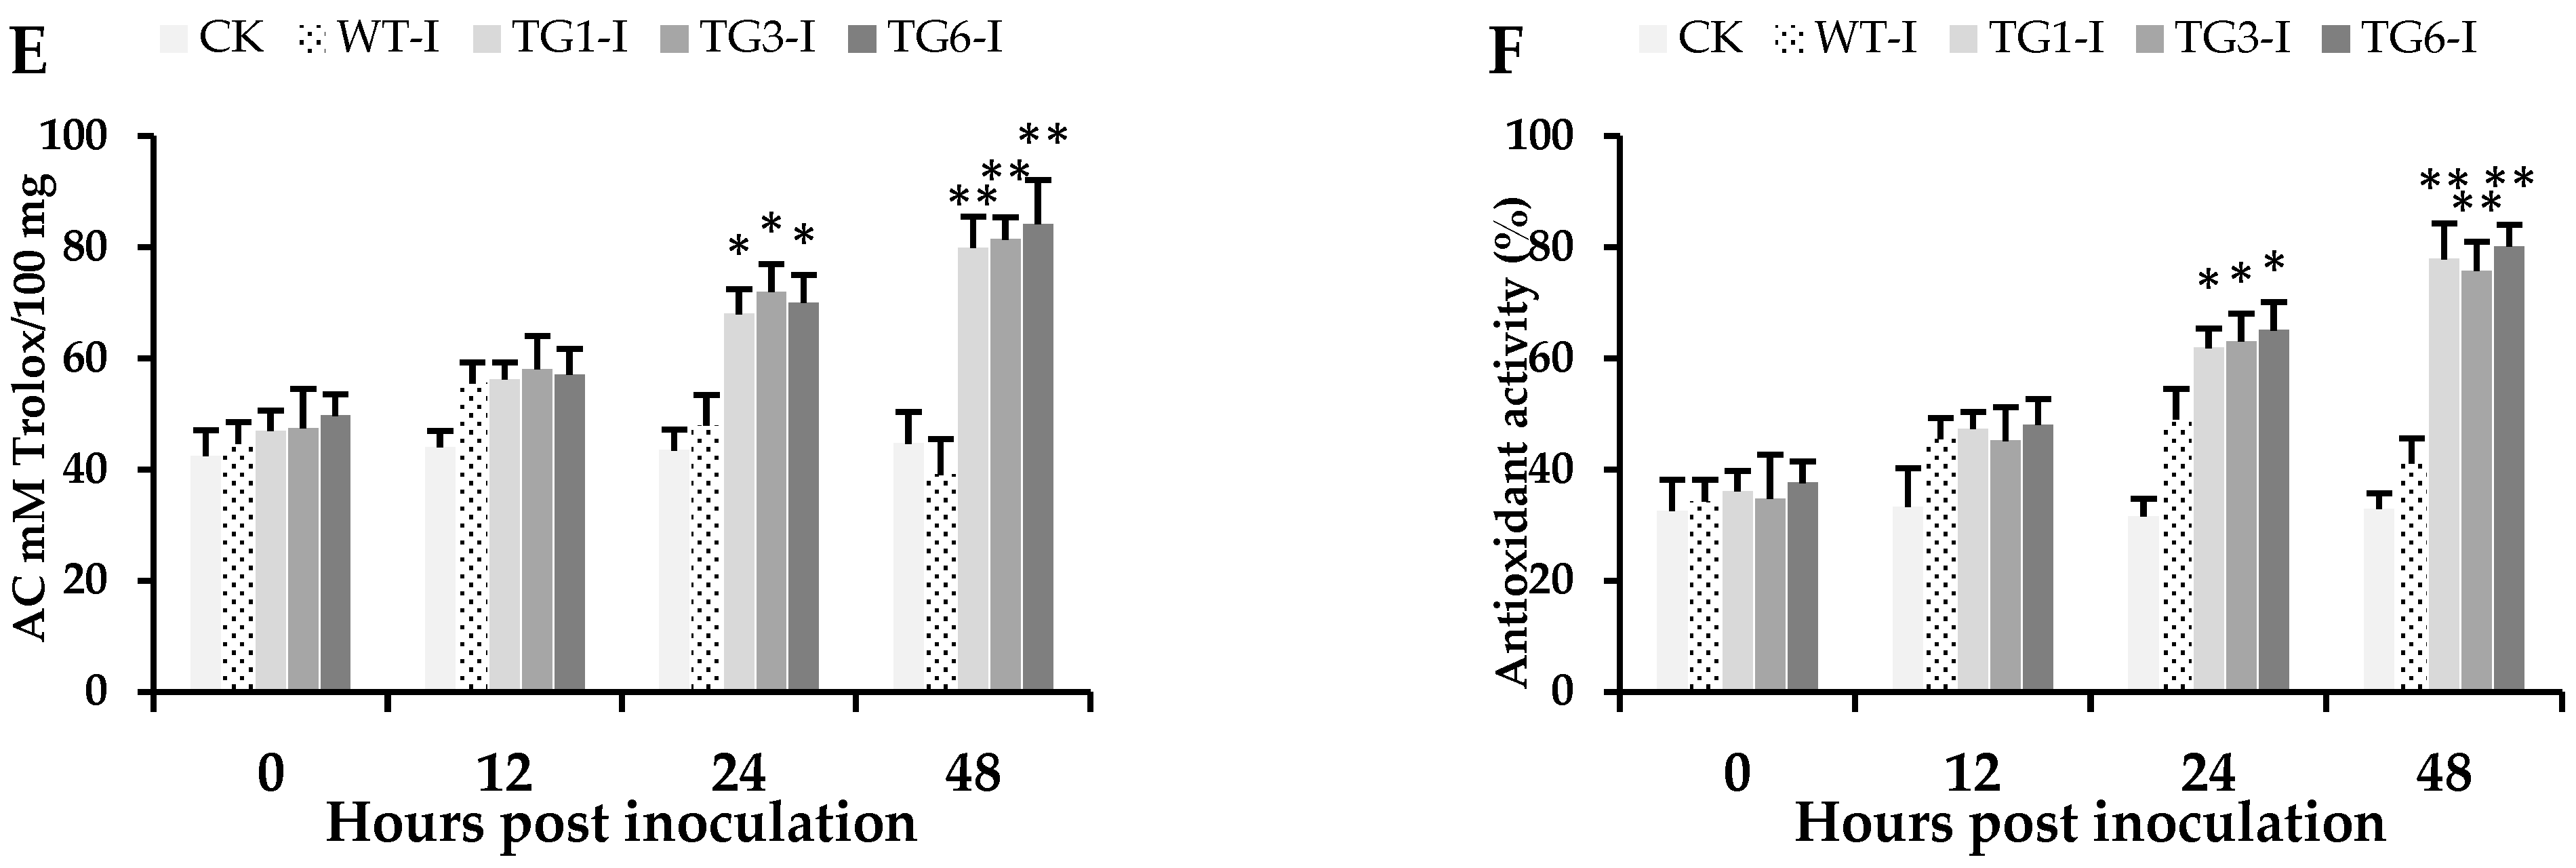
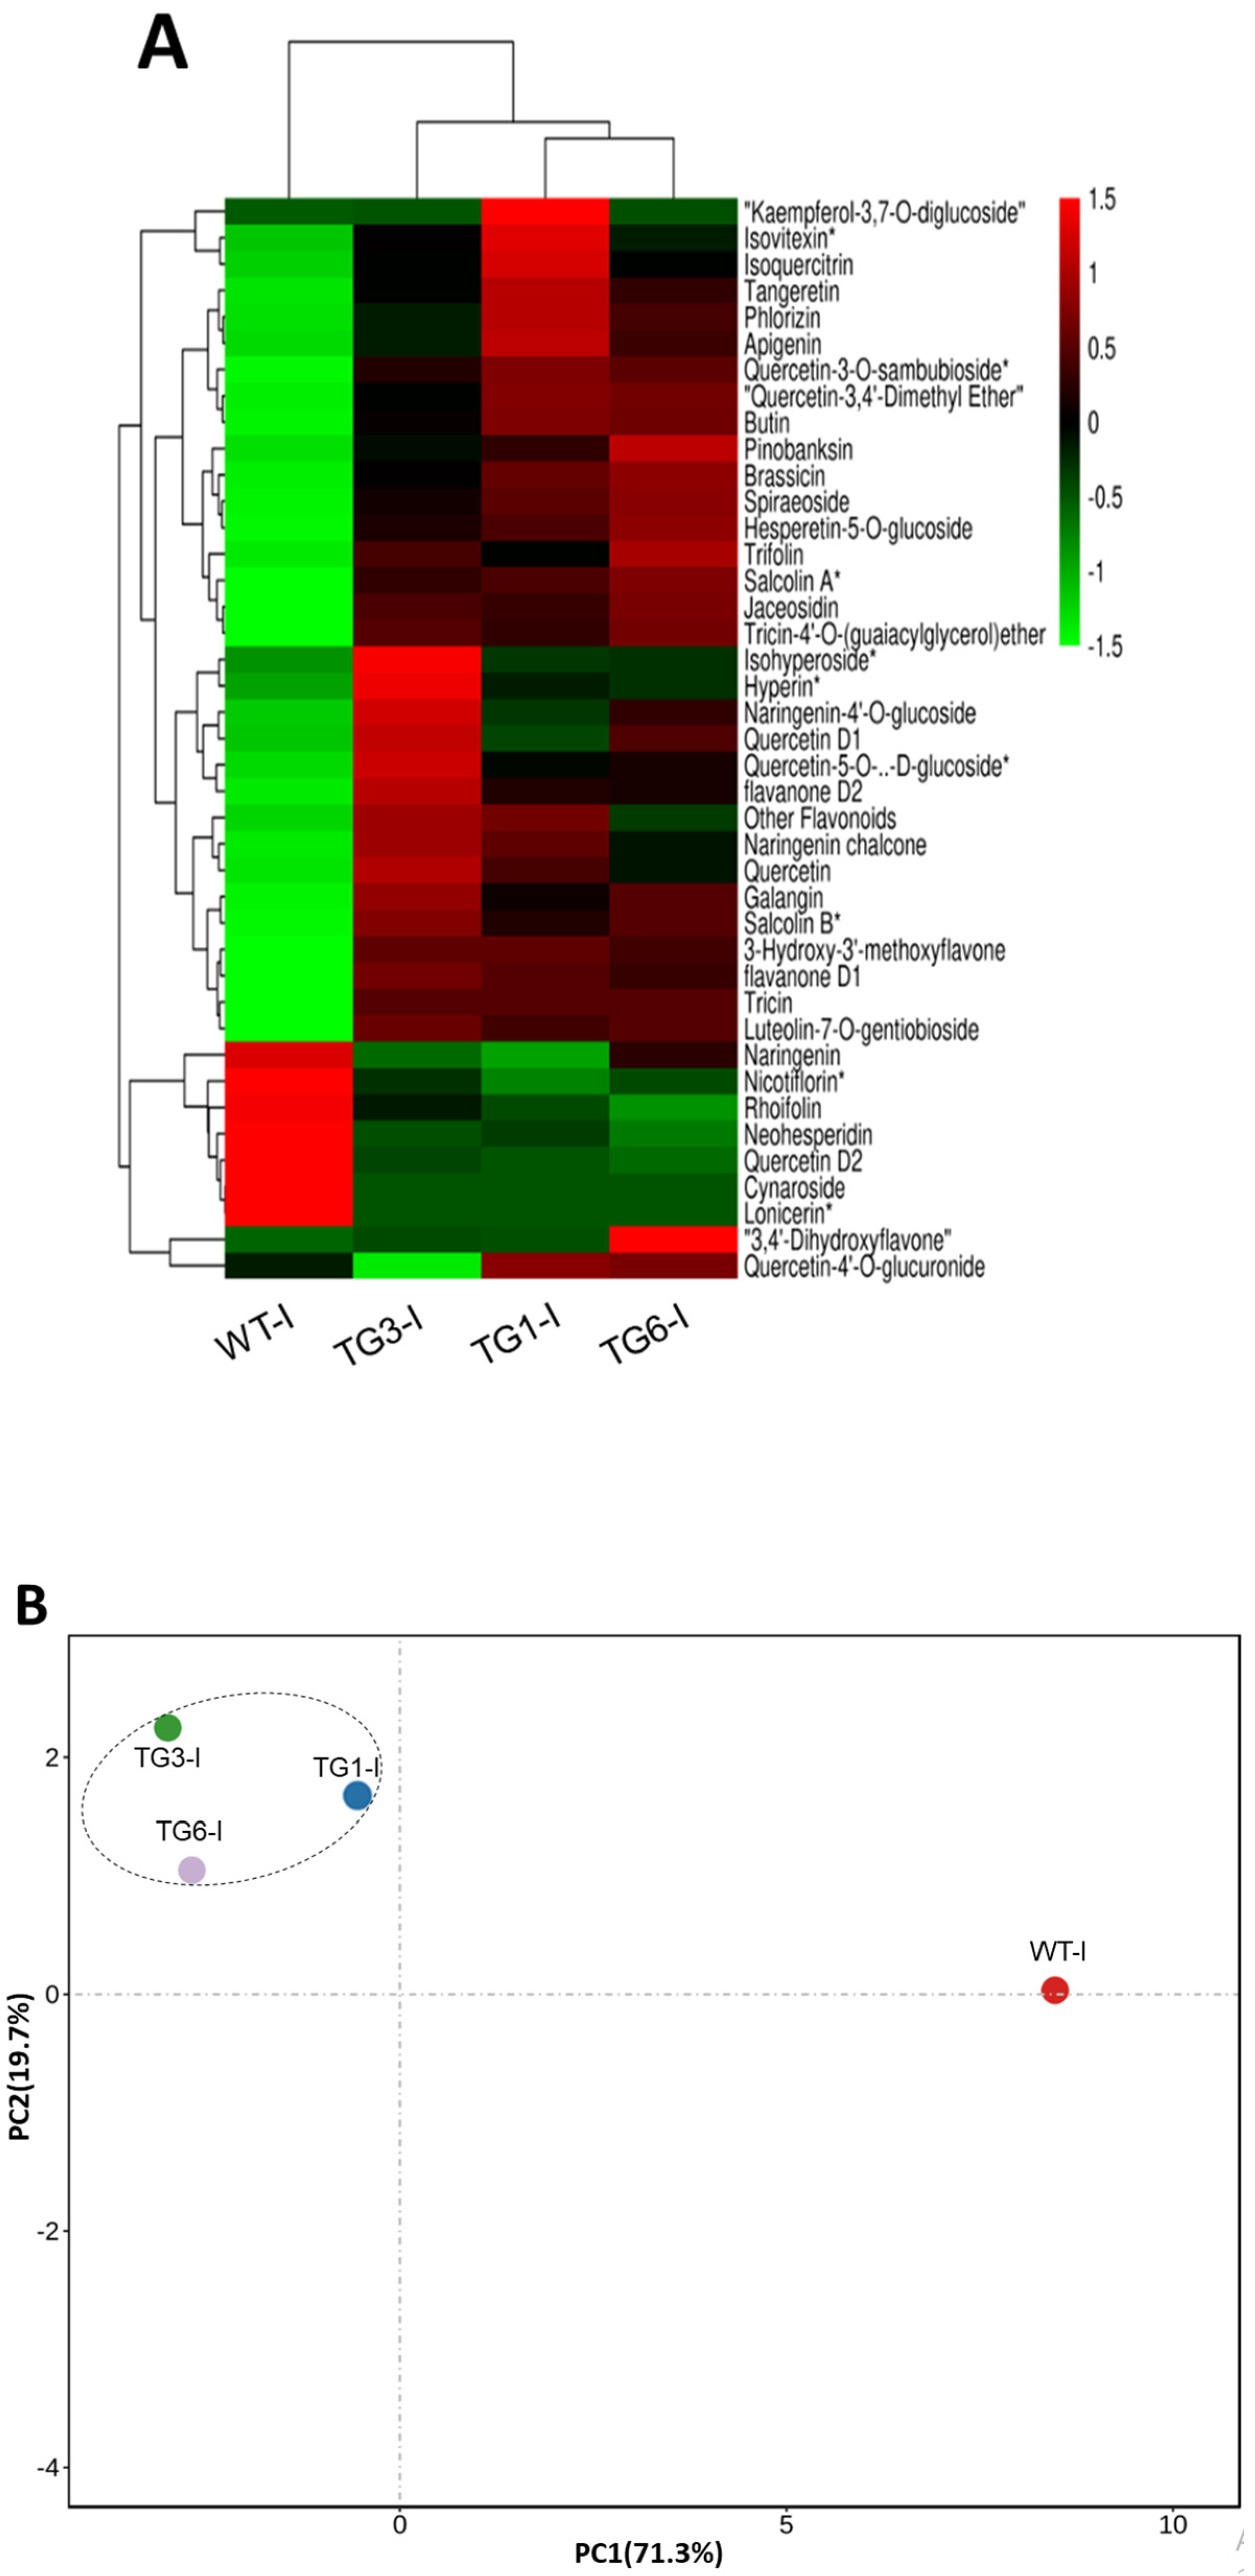
2.4. Higher Salicylic Acid, Antioxidants, and Flavonoid Compounds in Transgenic Lines Infected by Pst DC3000

The concentration of SA was significantly higher in all transgenic leaves infected with Pst DC3000 6 h post-inoculation compared to the wild-type leaves (Figure 5A). Moreover, the MpDIR1(t) transgenic lines exhibited elevated levels of SA even in their healthy leaves relative to the wild-type leaves (Figure 5A). A high expression or overexpression of the PAL gene in Arabidopsis enhances SA accumulation, thereby increasing resistance to pathogen progression [19,40,41]. Notably, a significantly higher expression of the PR1 gene was observed in all transgenic Arabidopsis lines compared to the wild type (Figure 4B). PR1 is involved in the SA signaling pathway [36], and our results demonstrated elevated PR1 gene expression in the transgenic lines (Figure 4B). The increase in SA levels (Figure 5A), coupled with the high expression of the PAL gene (Figure 4H) and the induction of several SA-related defense genes (Figure 4), clearly indicates that the MpDIR1(t) gene is involved in SA-mediated defense signaling. These findings elucidate the molecular mechanisms by which MpDIR1(t) enhances plant immunity and underscore its potential as a target for engineering SA-mediated defense strategies in crop plants.
A high expression or overexpression of the PAL gene in Arabidopsis enhances flavonoids biosynthesis and leads to the accumulation of antioxidant flavonoids [19]. These compounds play a crucial role in mitigating the detrimental effects of oxidative stress, thereby enhancing the plant’s resilience against pathogen progression. Several flavonoids, including luteolin-7-O-gentiobioside, tricin, flavanone D1, salcolin B, 3-hydroxy-3′-methoxyflavone, galangin, quercetin, naringenin chalcone, and flavanone D2, were significantly elevated in all MpDIR1(t) transgenic lines infected with Pst DC3000, as detailed in Figure 6A. The high accumulation of flavonoids targets the Pst DC3000 type III secretion system and its flagella, significantly decreasing pathogen progression [42].
To further elucidate the variations in the abundance of these flavonoid compounds, a principal component analysis (PCA) was conducted on MpDIR1(t) transgenic lines infected with Pst DC3000 compared to the WT-I groups. The analysis revealed that the first principal component (PC1) accounted for 73.3% of the total variance observed, while the second principal component (PC2) accounted for 19.7% of the variance, as illustrated in Figure 6B. The PCA plot demonstrated a significant differentiation in the flavonoid profiles, with samples from the WT-I group positioned on the right side of the PC1 axis and those from the MpDIR1(t) transgenic lines infected with Pst DC3000 aligned on the left side. This distinct separation along the PC2 axis further underscores the differences in flavonoid profiles between the transgenic and wild-type groups (Figure 6B). The PCA clearly explains the distinct clustering patterns observed among the MpDIR1(t) transgenic lines and WT-I treatment groups in the leaves of Arabidopsis, emphasizing the prominent variations in the profiles of flavonoid compounds.

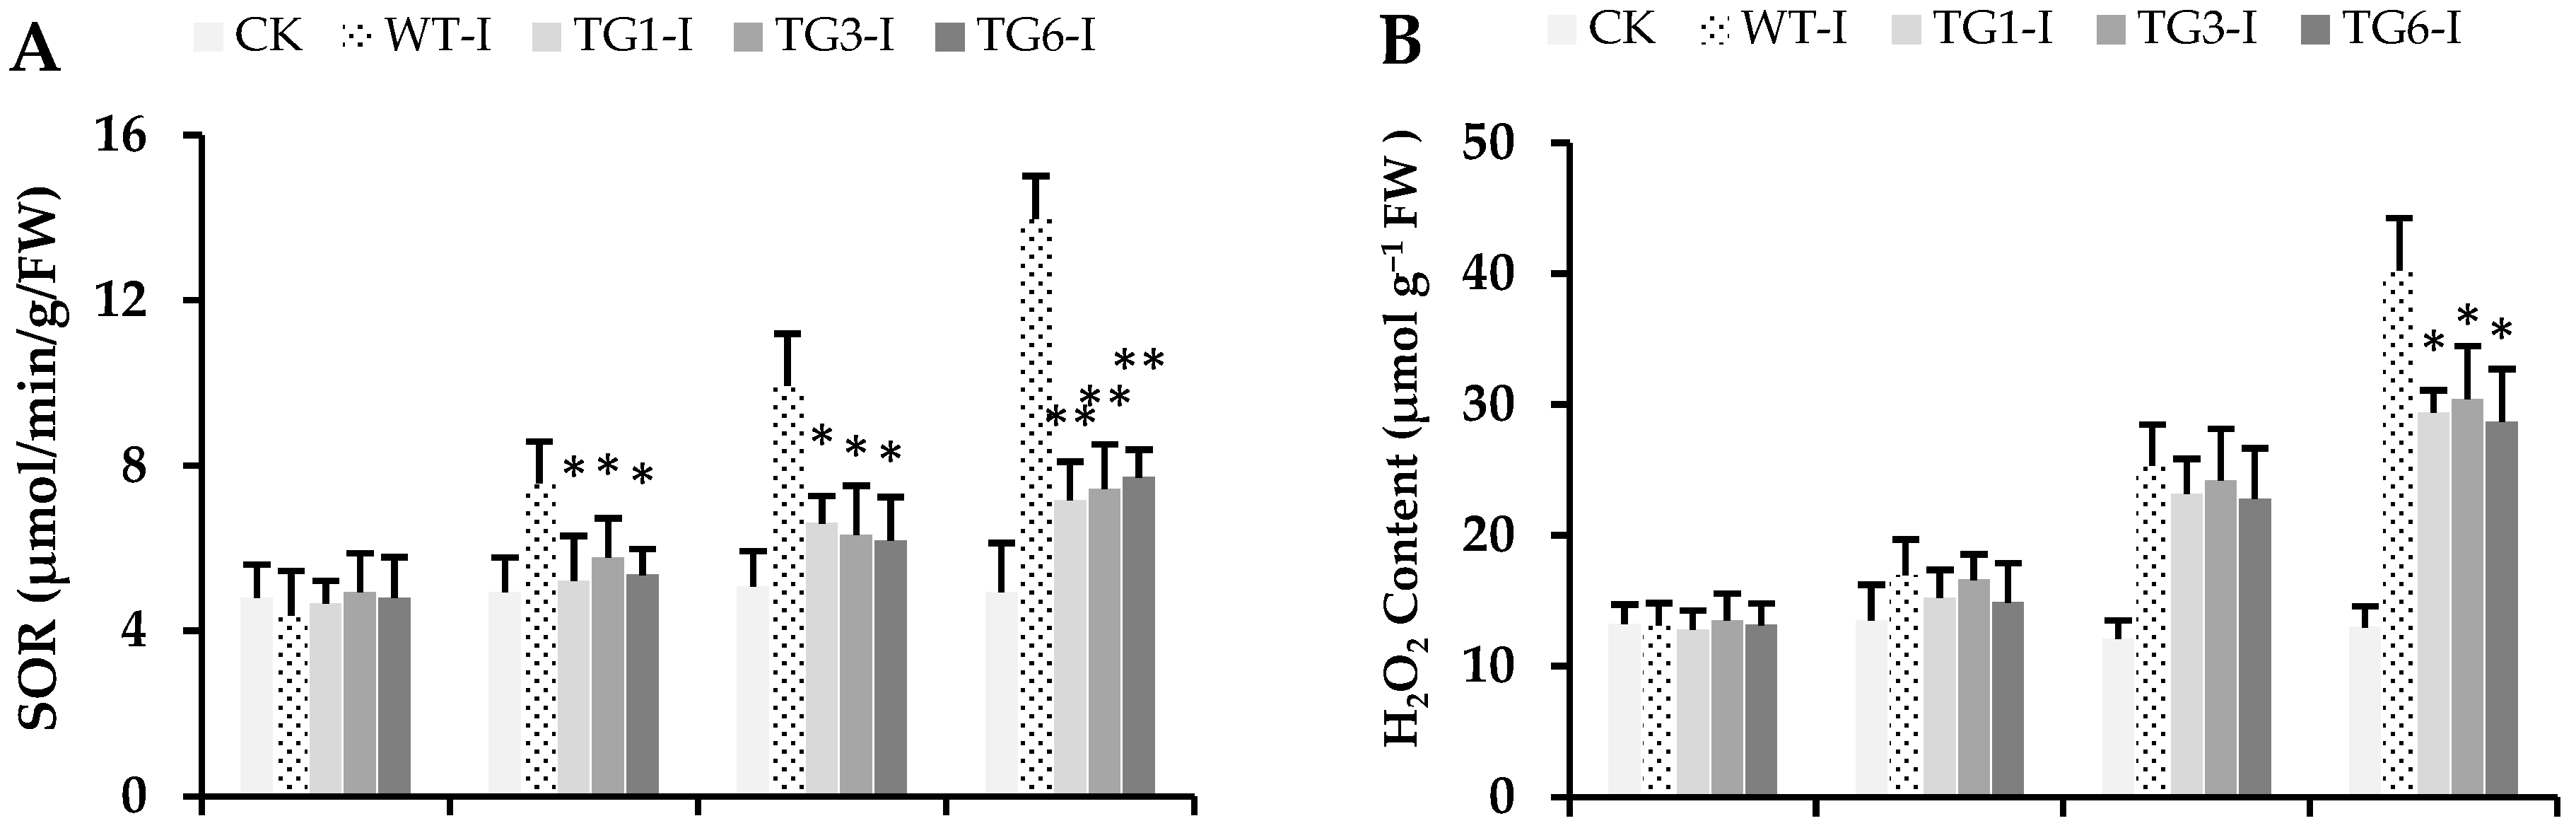
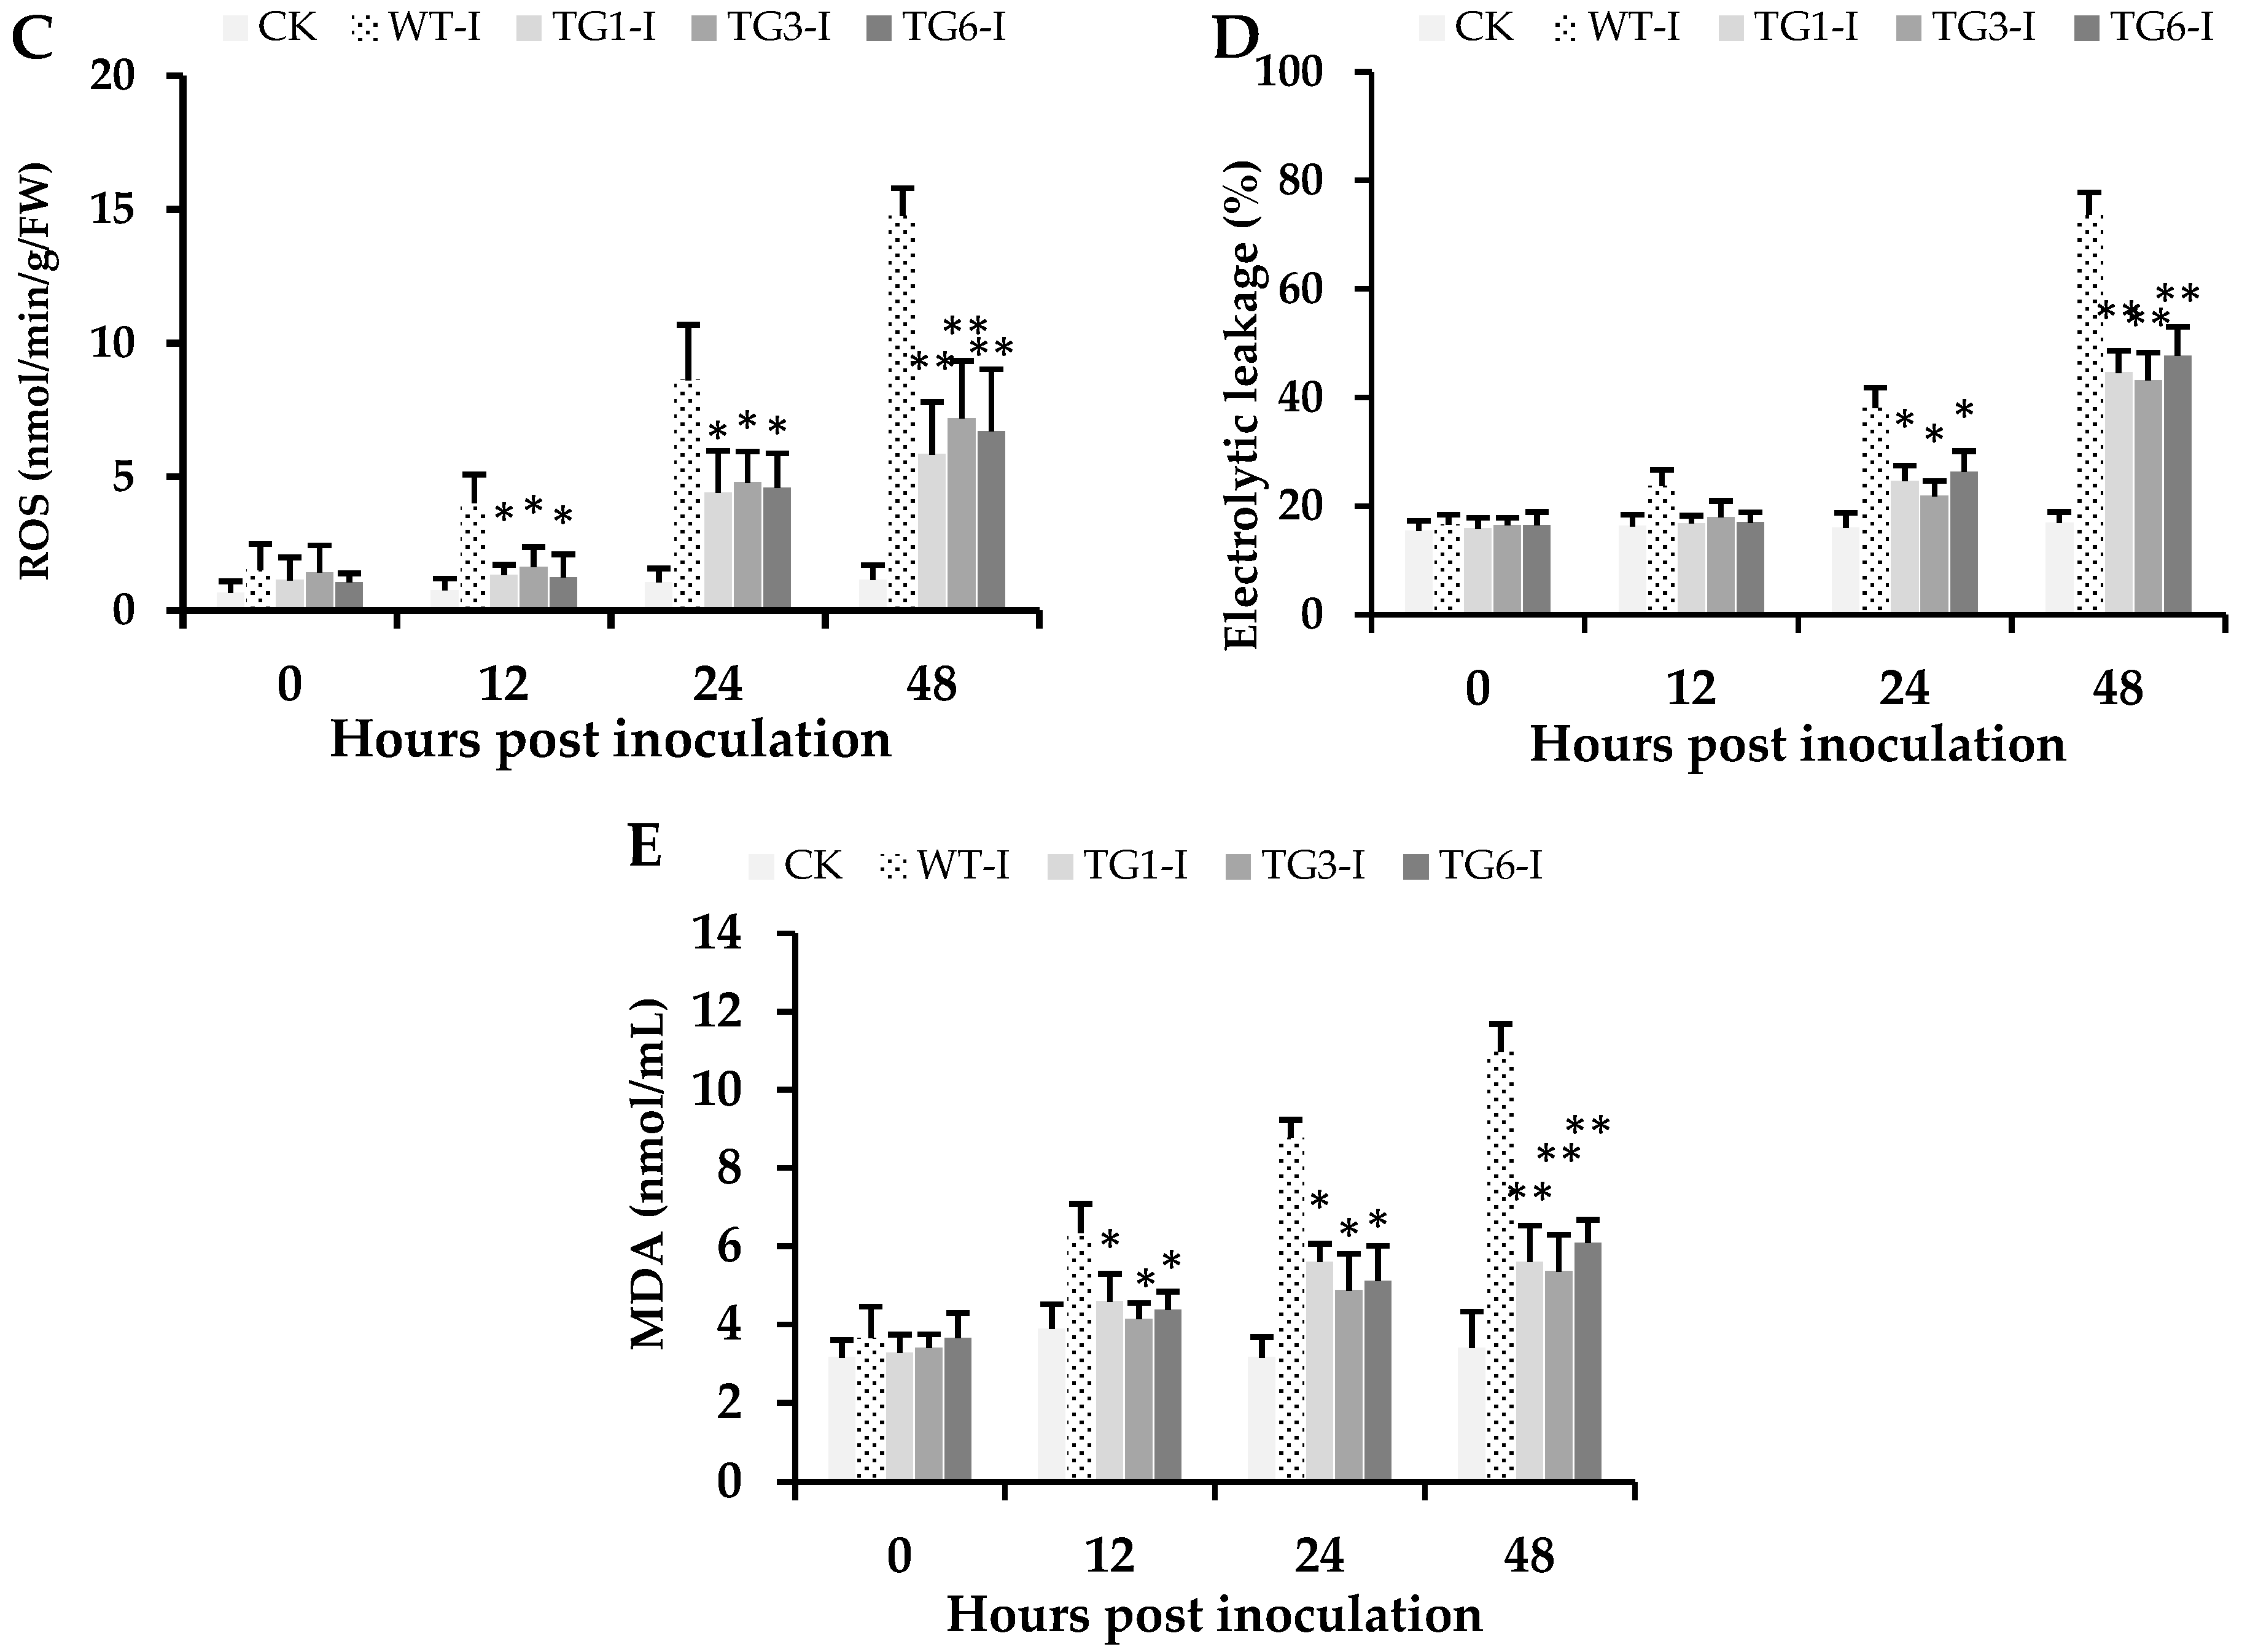
2.5. Biochemical Attributes of Plants from Transgenic Lines Infected by Pst DC3000

The contents of superoxide radicals (O2), H2O2, and reactive oxygen species (including H2O2, O2, •OH, and 1O2) were significantly lower in the transgenic leaves compared to the wild-type leaves following Pst DC3000 inoculation (24 to 48 h) (Figure 7A–C). In addition, the wild-type plants exhibited higher levels of electrolytic leakage and malondialdehyde (MDA), indicating that the wild-type leaves experienced more severe stress than the transgenic lines (Figure 7D,E). Generally, plants with lower levels of reactive oxygen species (ROS), MDA, and electrolytic leakage under biotic stress are considered resistant, whereas Arabidopsis plants with elevated levels of these markers are deemed as susceptible to Pst DC3000 [11,43]. The superoxide radicals, hydrogen peroxide, and malondialdehyde levels significantly increased following both abiotic [44,45] and biotic stresses [43]. Elevated levels of these biochemical markers trigger protein oxidation and cause serve damage to various cellular organelles.
Antioxidant enzymes such as superoxide dismutase (SOD), peroxidase (POD), and catalase (CAT) were significantly induced in transgenic lines challenged by Pst DC3000 compared to wild-type Arabidopsis (Figure 5B–D). In addition, the antioxidant activity and capacity were significantly increased in the transgenic lines relative to the wild type (Figure 5E,F). Maintaining higher antioxidant levels during progressive stress indicates that these plants possess a durable capability to detoxify the oxidants, such as reactive oxygen species, thereby tolerating stress condition [20,46]. From 0 to 12 h post-inoculation, the antioxidant enzymatic activities increased similarly in both wild-type and transgenic plants (Figure 5B–D). However, from 24 to 48 h post-inoculation, the antioxidant enzymatic activities were significantly higher in all transgenic lines compared to the wild type (Figure 5B–D). Additionally, the wild-type plants exhibited a considerable reduction in enzymatic activities after 48 h post-inoculation; similar trends were observed for antioxidant activity and capacity (Figure 5E,F). Higher antioxidant activity can assist plants in scavenging the ROS generated during biotic stress [43]. Our results indicate that in wild-type plants, the antioxidant defense machinery failed to scavenge ROS effectively after 24 to 48 h of infection by Pst DC3000, whereas transgenic plants demonstrated a resilient antioxidant defense mechanism, enabling them to scavenge the oxidants and withstand stress condition.
Previous studies reported that LTP genes are not directly involved in SA biosynthesis. However, they are implicated in peptide and lipid signaling, which initiates several defense pathways contributing to high SA accumulation and triggering disease resistance responses in plants [9,47,48]. Earlier research on Arabidopsis DIR1-overexpressed transgenic lines indicated the induction of SA-mediated defense signaling [4]. Transgenic Arabidopsis lines expressing a Capsicum annuum LTP gene demonstrated a positive interaction with SA signaling, triggering the expression of several pathogenesis-related genes, including PR1, PR2, PR4, and PR5 [34,47]. Our study demonstrates that all transgenic lines exhibit a resilient ability to tolerate Pst DC3000 stress by activating several defense genes (Figure 4A–G) compared to wild-type plants. Moreover, all transgenic lines showed higher contents of SA; elevated levels of SOD, POD, and CAT; elevated antioxidant activity and capacity; and lower levels of superoxide radicals, electrolytic leakage, H2O2, ROS, and MDA after Pst DC3000 stress than the wild-type plants. These results revealed that wild-type Arabidopsis plants are highly susceptible to Pst DC3000 pathogen stress; however, all transgenic lines exhibited resistance to Pst DC3000 stress by maintaining lower ROS, MDA, and electrolytic leakage with higher free radical scavenging competence. In this study, we focused on Arabidopsis thaliana as a model system, and the effectiveness of MpDIR1(t) in citrus species or other crops remains to be tested.

3. Materials and Methods

3.1. Growing Conditions and Plant Material

Six seedlings of Murraya paniculata (Murraya) and Citrus sinensis (Sweet orange) at 12 months of age were selected for exposure to citrus greening disease (Candidatus Liberibacter asiaticus), whereas three plants from each species were selected as healthy controls. RNA was extracted from CLas-positive plants, and the synthesized cDNA was used to perform qPCR. An expression analysis of ten selected genes among six different citrus species (each plant species had six plants) was conducted, and the qPCR primer sequences are provided in Supplementary Table S1. Moreover, the DIR1 gene was cloned from Murraya paniculata, and details of the vector-designing primers are characterized in Supplementary Table S2.
For the development of transgenic lines, Arabidopsis wild-type seeds were surface-sterilized with 70% ethanol (v/v) and grown on Murashige and Skoog (MS) medium (containing 4.43 g of MS-dried basal medium (phyto-technology laboratories), 10 g of agar, and 25 g of sucrose per liter). The seeds were left for three weeks in a growth chamber maintained at 22–24 °C with a 16/8 h light and dark cycle. After one month, Arabidopsis plants with flowers were used to overexpress the MpDIR1(t) gene via the flower dip method [49].

3.2. Agrobacterium Mediated Stable Transformation

The pK7WG2D vector was constructed to overexpress the MpDIR1(t) gene in Arabidopsis through stable transformation. The pK7WG2D vector contains a green fluorescent protein (GFP) for visual or manual selection of positive plants and confers kanamycin resistance due to the presence of the neomycin phosphotransferase II gene [50]. The MpDIR1(t) gene was amplified from cDNA using PCR targeting the coding region. Following plasmid extraction, the gene was cloned into a pDONR221 vector, followed by LR clonase reactions as per the manufacturer’s instructions, and subsequently integrated into the pK7WG2D binary vector for stable transformation using Gateway technology (Invitrogen). The pK7WG2D vector was then transformed into the Agrobacterium strain GV3101 for stable transformation and transferred into Arabidopsis via the flower dip method [49] to develop individual transgenic lines expressing the MpDIR1(t) gene.
T0 Arabidopsis seeds were collected and sown on the MS medium containing kanamycin for the manual selection of positive T1 stage Arabidopsis plants. Confirmation was achieved through DNA extraction and PCR amplification using CaMV35S forward and reverse MpDIR1(t) gene-specific primers [51]. Three independent transgenic lines (TGs) of Arabidopsis were selected, designated as TG1, TG3, and TG6.

3.3. Bacterial Inoculation and Sampling Time

The Pseudomonas syringae pv. DC3000 (Pst DC 3000) strain was selected to treat both transgenic and wild-type Arabidopsis plants. King’s B (KB) medium supplemented with 50 microgram per milliliter of rifampicin antibiotic was utilized to culture the Pst DC 3000 bacteria [11]. After 12 h, the log-phase bacterial cultures were optimized to an optimum density among (OD600 nm) 0.6–0.8, as measured by a UV-1800 spectrophotometer, where an OD600 nm of 0.1 corresponds to 108 colony-forming units (cfu) per milliliter. Prior to infiltration, the bacterial solution was adjusted to a concentration of 107 cfu per milliliter using 10 millimolar MgCl2. A 1 milliliter sterile syringe (without needle) was used to infiltrate the bacterial suspensions onto the abaxial surface (inter-veinal space) of Arabidopsis leaves. Different time points were selected to evaluate the response of transgenic lines to Pst DC3000. For the gene expression analysis, samples were collected at 0, 6, 12, and 24 h post-inoculation, while for the biochemical analysis, samples were collected at 0, 12, 24, and 48 h post-inoculation. At each time interval, the leaves were sampled, immediately frozen in liquid nitrogen, and subsequently stored at −80 °C for further analysis. The Arabidopsis plants were cultivated under the following conditions: 70% relative humidity, a temperature of 22 ± 2 °C, a 16/8 h light/dark interval, and a light intensity of 120 micromoles quanta m−2 per sec.

3.4. DNA Extraction and PCR Analysis

Genomic DNA exaction was performed using the 2% CTAB method [52,53]. Fresh Arabidopsis leaves (0.1–0.2 g) were powdered in liquid nitrogen, followed by the addition of 0.7 milliliter of a DNA extraction buffer, and gently inverted for mixing. After incubation at 65 °C for 90 min, 0.8 milliliters of chloroform-isoamyl alcohol (24:1) was added to each DNA sample, mixed thoroughly, and centrifuged for 10 min at 8000 rpm. The supernatant was transferred to a new tube, and an equal volume of isopropyl alcohol was added. Following 30 min of incubation at −20 °C, the DNA pellet was collected by centrifugation at 8000 rpm. The pellet was then washed with 1 milliliter of chilled 100% ethanol and 60 microliter of 5 M NaCl [52]. For amplification of the targeted DIR1 gene, the PCR-Master mix (Thermo Scientific, Shanghai, China) was used, and the bands were amplified according to the manufacturer’s instructions.

3.5. RNA Isolation, cDNA Synthesis, and Quantitative PCR

The TRIzol RNA extraction kit (Takara; Beijing, China) was used to extract RNA from the fresh leaves of Arabidopsis. Total RNA was extracted, and complementary DNA (cDNA) was synthesized using the HiScript II QRT reverse transcriptase kit (Vazyme, R223-01; Nanjing, China). Then, 1 microgram (μg) of total RNA was used for cDNA synthesis. The SuperMix (+gDNA wiper) was used to eliminate genomic DNA from each sample, followed by the addition of the reverse transcriptase enzyme according to the manufacturer’s instructions. Post cDNA synthesis, a quantitative-polymerase chain reaction (q-PCR) was conducted using the q-PCR SYBR Green master mix (YEASEN Biotec. Co., Ltd.; Shanghai, China). The β-actin gene from Arabidopsis served as an internal reference (control), and all standard procedures were applied as recommended by the producer’s guidelines for q-PCR. The q-PCR analysis was performed using the LightCycler 480 II instrument (Roche Diagnostics, Shanghai, China) to study the expression patterns of different defense genes. Each sample, in triplicate, was loaded onto a 384-well white plate; the LightCycler 480 and the 2−ΔΔCt methodology were employed to calculate the relative expression levels [54]. Detailed information on the q-PCR primers for Arabidopsis is provided in the Supplementary Table S3, whereas the primers for Pst DC3000 bacterial gene expression [55] are listed in the Supplementary Table S4.

3.6. Electrolytic Leakage and Malondialdehyde

The Ohaus Company Starter3100C machine (Shanghai, China) was used to determine electrolytic leakage (EL). Fresh Arabidopsis leaves were removed, cut into small sections, and soaked in deionized water. The solution was then left for 20 min at room temperature on a shaker set to 200 rpm. Following the shaking period, EL readings were obtained by immersing the stirrer of the Starter3100C apparatus. Each sample tube was subsequently covered, and the leaf solution was boiled for 15 min. After cooling, additional readings were collected. The EL percentage of each sample solution was calculated using a previously described formula [56].
For the measurement of Malondialdehyde (MDA), the A003-1 kit from Nanjing Jiancheng Bioengineering Institute (Nanjing, China) was utilized. According to the company’s instructions, 0.1 g of Arabidopsis leaves was homogenized, and the absorbance of the MDA sample (reaction mixture) was measured using a UV-1800 spectrophotometer (Shimadzu, Kyoto, Japan).

3.7. Salicylic Acid Determination

The previous protocol was modified to quantify the salicylic acid (SA) level [57]. Then, 100 milligrams of Arabidopsis leaves was homogenized in one milliliter of deionized water. After centrifugation, 500 microliters of the supernatant was transferred to a new tube, and ferric chloride (0.1% freshly prepared) was added to make a total volume of 3 milliliters. The ferric chloride reacted with aqueous SA to form an iron complex, which produces a violet color. This was determined using a UV-1800 spectrophotometer at 540 nm (Shimadzu, Japan). Different concentrations of salicylic acid were used to generate standard curves, whereas deionized water served as the blank control.

3.8. Hydrogen Peroxide (H2O2) Determination

H2O2 determination was performed according to previous protocol [58]. Briefly, 0.1 g of Arabidopsis leaves were grounded into powder, followed by the addition of 1 mL of 1% trichloro-acetic acid, and mixed well in an ice bath for 10 min. After incubation in the ice bath, the samples were centrifuged at 10,000 rpm for 8 min at room temperature, and the supernatant was collected into fresh tube. The reaction mixture contained 0.5 mL of the supernatant mixed with an equal volume of potassium phosphate buffer (10 mM concentration). Finally, 1 mL of 1 M potassium iodide was added, followed by vortexing. For the standard curve, commercial H2O2 was used. The absorbance of each sample and standard reaction mixture was measured using a UV-1800 spectrophotometer (Shimadzu, Japan) at 390 nm, and the H2O2 concentration was determined as micromoles/gram of each sample.

3.9. Superoxide Radicals and Reactive Oxygen Species Assay

From each sample, 0.1 g of Arabidopsis leaves was homogenized to measure superoxide radicals (O2) [59]. A 0.1 unit change in absorbance was considered as one unit of O2/min at the corresponding wavelength, as previously described [59]. For the determination of reactive oxygen species, including H2O2, O2−, hydroxyl radicals (•OH), and singlet oxygen (1O2), a kit (Elabscience: CAT No: E-BC-K138-F; Wuhan, China) was used according to the manufacturer’s guidelines.

3.10. Antioxidant Activity and Capacity (DPPH Free Radical Scavenging Assay)

To calculate antioxidant capacity and activity, the 2,2-diphenyl-1-picrylhydrazyl (DPPH 0.1 mM) method was used [60]. Arabidopsis leaves (0.1 g) were homogenized in 1 mL of reaction solution having 70% ethanol, 29% water, and 1% acetic acid, followed by centrifugation for 8 min at 8000 rpm. The supernatant (0.03 mL) was collected into a new tube, and 2.97 mL of DPPH solution was added to each sample. The mixture was then incubated in the dark at room temperature for 30 min. A reaction mixture without the sample served as the control. Absorbance of each sample was measured using a UV-1800 spectrophotometer (Shimadzu, Japan) at 517 nm. Trolox was used to generate the standard curve, and the antioxidant capacity was expressed in millimolars of trolox equivalents/100 mg. Antioxidant activity (free radical scavenging percentage) was calculated using the following formula:
Antioxidant activity (%) = [1 − {sample OD/control OD}] × 100.

3.11. Antioxidant Enzymatic Activity

The antioxidant enzymatic activities, including superoxide dismutase (SOD), peroxidase (POD), and catalase (CAT), were observed in the Arabidopsis leaves using kits purchased from Nanjing Jiancheng Bioengineering Institute (Nanjing, China). The following kits were employed for the respective enzymatic assays: SOD (A001-1-1), POD (A084-3-1), CAT (A007-1-1), and total protein content (A045-2-2). Protein contents and enzymatic activities were measured using 500 mg of Arabidopsis leaves, following the manufacturer’s protocol. In addition, control, standard, and sample readings were taken using a UV-1800 spectrophotometer.

3.12. Flavonoid Profiling in Transgenic Arabidopsis Leaves

Flavonoid compounds in transgenic Arabidopsis leaf samples were examined using ultra-performance liquid chromatography–tandem mass spectrometry (UPLC-MS/MS). Freeze-dried transgenic Arabidopsis leaf samples were pulverized using liquid nitrogen, with 50 mg of the resulting powder used for both qualitative and quantitative analysis. To each powdered sample, 500 μL of 70% aqueous methanol was added, followed by ultrasonic extraction (Model: KQ5200E) at 5 °C for 30 min. Centrifugation was then conducted at 12,000 rpm for 5 min. The resulting supernatant was collected and passed through a 0.22 μm membrane into a fresh centrifuge tube. This filtrate was then analyzed using UPLC-MS/MS and multiple reaction monitoring, operating in both negative 4500 and positive 5500 ion modes, as previously described [20,61,62]. Rutin, at a volume of ten microliters, served as the internal standard. Analyst 1.6.3 software was used for analysis of the mass spectrum data.

3.13. Statistical Analysis

All data were statistically analyzed using Statistix 8.1 statistical software (Tallahassee, FL, USA; Analytical Software). The Excel program (Microsoft Corp., Redmond, WA, USA) was used for calculating standard errors and developing graphs. Hierarchical cluster analysis (HCA) and principal component analysis (PCA) were performed on the MpDIR1(t) transgenic lines and WT, both infected with Pst DC3000. The data were min–max normalized, as described before [63]. GeneDoc (version 2.6) software was used for the amino acid sequence analysis [64], whereas MEGA7 and TBtools were used for generating phylogenetic trees [65,66].

4. Conclusions

Our study concluded that the DIR1 gene was significantly induced, more than 12-fold, in CLas-resistant Murraya paniculata after CLas inoculation compared to the CLas-susceptible Citrus sinensis DIR1 gene, which showed less than a 2-fold induction. Moreover, overexpression of the MpDIR1(t) gene significantly induced defense-responsive genes and salicylic acid biosynthetic genes in all transgenic Arabidopsis lines. In addition, all transgenic Arabidopsis lines exhibited resistance to Pst DC3000. Our gene expression results revealed that many genes associated with defense, such as PR1, PR2, PR5, PR10, WRKY12, and PAL were significantly up-regulated 2–12 folds in transgenic Arabidopsis lines infected with Pst DC3000 compared to the wild type. Furthermore, the transgenic Arabidopsis lines showed lower levels of reactive oxygen species and superoxide radicals, as well as higher levels of antioxidant flavonoids and enzymatic activities compared to the wild type. The gene expression, phenotypic, biochemical, SA, and antioxidant enzymatic results determined that the MpDIR1(t) gene conferred resistance to Pst DC3000. The Murraya paniculata DIR1 gene is a promising candidate for increasing bacterial diseases resistance in susceptible citrus cultivars and contributing to the healthy development of the citrus industry.

Supplementary Materials

The following supporting information can be downloaded at https://www.mdpi.com/article/10.3390/plants13192692/s1, Figure S1: The gene expression pattern of the MpDIR1 gene in overexpressed Arabidopsis lines compared with the wild type. CK: healthy control; WT: wild type; TG1: transgenic line 1; TG3: transgenic line 3; TG6: transgenic line 6. Each value is the mean of three biological replicates. A Student’s t-test was used to compare transgenic Arabidopsis lines expressing MpDIR1-TG and WT at ** p < 0.01. Figure S2: The gene expression pattern of different genes associated with the pathogen-responsive and SA-mediated defense pathways. (A) AtPI2, (B) WRKY1, (C) CBP60G, (D) AtNPR1. At: Arabidopsis thaliana; CK: healthy control; WT-I: infected plants from the wild type; TG1-I: infected plants from transgenic line 1; TG3-I: infected plants from transgenic line 3; TG6-I: infected plants from transgenic line 6. Each value is the mean of three biological replicates. A Student’s t-test was used to compare transgenic Arabidopsis expressing MpDIR1-TG and WT at * p < 0.05 and ** p < 0.01. Table S1: The primer sequences used for the gene expression analysis in six different species of citrus. Table S2: The cloning and MpDIR1(t)-Vector construction primers used to amplify the DIR1 gene from Murraya. Table S3: The primer sequences used for gene expression analysis of Arabidopsis. Table S4: The primer sequences used to monitor the Pst DC3000 gene expression analysis.

Author Contributions

Conceptualization, S.Y., M.J.R., M.D., L.B. and M.E.; methodology, M.D., M.J.R., D.H. and M.E.; software, M.J.R., M.E., D.H. and M.D.; formal analysis, M.J.R., M.D., M.E., L.B., D.H. and Y.Z.; investigation, M.J.R., Y.Z., M.E., M.D. and S.Y.; data curation, M.E., D.H., L.B. and S.Y.; writing—original draft preparation, M.J.R., M.E., B.Z., M.D. and S.Y.; writing—review and editing, S.Y., M.J.R., L.B., B.Z. and Y.Z.; supervision, S.Y. and M.D.; project administration, M.J.R. and M.E.; funding acquisition, S.Y. All authors have read and agreed to the published version of the manuscript.

Funding

This work was jointly funded by the project of “Kunpeng Plan” in Zhaotong City—Shunqiang Yang [grant number 20211124] and by the Scientific and technological innovation team of agricultural waste resource utilization in universities of Yunnan Province [grant number 20190703].

Data Availability Statement

All data are available in the manuscript and Supplementary Materials.

Conflicts of Interest

The authors declare no conflicts of interest.

References

  1. Ádám, A.L.; Nagy, Z.Á.; Kátay, G.; Mergenthaler, E.; Viczián, O. Signals of systemic immunity in plants: Progress and open questions. Int. J. Mol. Sci. 2018, 19, 1146. [Google Scholar] [CrossRef] [PubMed]
  2. Champigny, M.J.; Isaacs, M.; Carella, P.; Faubert, J.; Fobert, P.R.; Cameron, R.K. Long distance movement of DIR1 and investigation of the role of DIR1-like during systemic acquired resistance in Arabidopsis. Front. Plant Sci. 2013, 4, 230. [Google Scholar] [CrossRef]
  3. Carella, P.; Kempthorne, C.J.; Wilson, D.C.; Isaacs, M.; Cameron, R.K. Exploring the role of DIR1, DIR1-like and other lipid transfer proteins during systemic immunity in Arabidopsis. Physiol. Mol. Plant Pathol. 2017, 97, 49–57. [Google Scholar] [CrossRef]
  4. Maldonado, A.M.; Doerner, P.; Dixon, R.A.; Lamb, C.J.; Cameron, R.K. A putative lipid transfer protein involved in systemic resistance signalling in Arabidopsis. Nature 2002, 419, 399–403. [Google Scholar] [CrossRef] [PubMed]
  5. Liu, P.-P.; von Dahl, C.C.; Park, S.-W.; Klessig, D.F. Interconnection between methyl salicylate and lipid-based long-distance signaling during the development of systemic acquired resistance in Arabidopsis and tobacco. Plant Physiol. 2011, 155, 1762–1768. [Google Scholar] [CrossRef] [PubMed]
  6. Isaacs, M.; Carella, P.; Faubert, J.; Champigny, M.J.; Rose, J.K.C.; Cameron, R.K. Orthology analysis and in vivo complementation studies to elucidate the role of DIR1 during systemic acquired resistance in Arabidopsis thaliana and Cucumis sativus. Front. Plant Sci. 2016, 7, 566. [Google Scholar] [CrossRef]
  7. Wang, Y.; Zhou, L.; Yu, X.; Stover, E.; Luo, F.; Duan, Y. Transcriptome profiling of Huanglongbing (HLB) tolerant and susceptible citrus plants reveals the role of basal resistance in HLB tolerance. Front. Plant Sci. 2016, 7, 933. [Google Scholar] [CrossRef]
  8. Champigny, M.J.; Shearer, H.; Mohammad, A.; Haines, K.; Neumann, M.; Thilmony, R.; He, S.Y.; Fobert, P.; Dengler, N.; Cameron, R.K. Localization of DIR1 at the tissue, cellular and subcellular levels during systemic acquired resistance in Arabidopsis using DIR1: GUS and DIR1: EGFP reporters. BMC Plant Biol. 2011, 11, 125. [Google Scholar] [CrossRef]
  9. Suzuki, H.; Xia, Y.; Cameron, R.; Shadle, G.; Blount, J.; Lamb, C.; Division, P.B.; Roberts, S.; Foundation, N.; Parkway, S.N. Signals for local and systemic responses of plants to pathogen attack. J. Exp. Bot. 2004, 55, 169–179. [Google Scholar] [CrossRef]
  10. Rao, M.J.; Wang, L.; Ahmad, U.; Ahmad, M.H.; Hussain, S. Citrus metabolic and antioxidant responses to high light stress. In Citrus Production; CRC Press: Boca Raton, FL, USA, 2022; pp. 167–179. [Google Scholar]
  11. Liu, Y.; Wang, L.; Cai, G.; Jiang, S.; Sun, L.; Li, D. Response of tobacco to the Pseudomonas syringae pv. tomato DC3000 is mainly dependent on salicylic acid signaling pathway. FEMS Microbiol. Lett. 2013, 344, 77–85. [Google Scholar] [CrossRef]
  12. Hammond-Kosack, K.E.; Jones, J.D. Resistance gene-dependent plant defense responses. Plant Cell 1996, 8, 1773. [Google Scholar]
  13. Christeller, J.; Laing, W. Plant serine proteinase inhibitors. Protein Pept. Lett. 2005, 12, 439–447. [Google Scholar] [CrossRef] [PubMed]
  14. Rao, M.J.; Zuo, H.; Xu, Q. Genomic insights into citrus domestication and its important agronomic traits. Plant Commun. 2021, 2, 100138. [Google Scholar] [CrossRef] [PubMed]
  15. Kunkel, B.N.; Brooks, D.M. Cross talk between signaling pathways in pathogen defense. Curr. Opin. Plant Biol. 2002, 5, 325–331. [Google Scholar] [CrossRef]
  16. Rawat, N.; Kiran, S.P.; Du, D.; Gmitter, F.G.; Deng, Z. Comprehensive meta-analysis, co-expression, and miRNA nested network analysis identifies gene candidates in citrus against Huanglongbing disease. BMC Plant Biol. 2015, 15, 184. [Google Scholar] [CrossRef]
  17. Yu, Q.; Chen, C.; Du, D.; Huang, M.; Yao, J.; Yu, F.; Brlansky, R.H.; Gmitter, F.G., Jr. Reprogramming of a defense signaling pathway in rough lemon and sweet orange is a critical element of the early response to ‘Candidatus Liberibacter asiaticus’. Hortic. Res. 2017, 4, 17063. [Google Scholar] [CrossRef]
  18. Hu, Y.; Zhong, X.; Liu, X.; Lou, B.; Zhou, C.; Wang, X. Comparative transcriptome analysis unveils the tolerance mechanisms of Citrus hystrix in response to ‘Candidatus Liberibacter asiaticus’ infection. PLoS ONE 2017, 12, e0189229. [Google Scholar] [CrossRef]
  19. Huang, J.; Gu, M.; Lai, Z.; Fan, B.; Shi, K.; Zhou, Y.-H.; Yu, J.-Q.; Chen, Z. Functional analysis of the Arabidopsis PAL gene family in plant growth, development, and response to environmental stress. Plant Physiol. 2010, 153, 1526–1538. [Google Scholar] [CrossRef] [PubMed]
  20. Rao, M.J.; Feng, B.; Ahmad, M.H.; Tahir, M.; Aslam, M.Z.; Khalid, M.F.; Hussain, S.; Zhong, R.; Ali, Q.; Xu, Q.; et al. LC-MS/MS-based metabolomics approach identified novel antioxidant flavonoids associated with drought tolerance in citrus species. Front. Plant Sci. 2023, 14, 1150854. [Google Scholar] [CrossRef]
  21. Wu, H.; Hu, Y.; Fu, S.; Zhou, C.; Wang, X. Physiological and Molecular Plant Pathology Coordination of multiple regulation pathways contributes to the tolerance of a wild citrus species (Citrus ichangensis ‘2586’) against Huanglongbing. Physiol. Mol. Plant Pathol. 2020, 109, 101457. [Google Scholar] [CrossRef]
  22. Li, J.; Pang, Z.; Trivedi, P.; Zhou, X.; Ying, X.; Jia, H.; Wang, N. ‘Candidatus Liberibacter asiaticus’ encodes a functional salicylic acid (SA) hydroxylase that degrades SA to suppress plant defenses. Mol. Plant-Microbe Interact. 2017, 30, 620–630. [Google Scholar] [CrossRef] [PubMed]
  23. Hu, B.; Rao, M.J.; Deng, X.; Pandey, S.S.; Hendrich, C.; Ding, F.; Wang, N.; Xu, Q. Molecular signatures between citrus and Candidatus Liberibacter asiaticus. PLoS Pathog. 2021, 17, e1010071. [Google Scholar] [CrossRef] [PubMed]
  24. Tolba, I.H.; Soliman, M.A. Citrus Huanglongbing (Greening Disease) in Egypt: Symptoms Documentation and Pathogen Detection. Am. Eurasian J. Agric. Environ. Sci. 2015, 15, 2045–2058. [Google Scholar]
  25. Miles, G.P.; Stover, E.; Ramadugu, C.; Keremane, M.L.; Lee, R.F. Apparent tolerance to Huanglongbing in Citrus and Citrus-related germplasm. HortScience 2017, 52, 31–39. [Google Scholar] [CrossRef]
  26. Killiny, N.; Hijaz, F. Amino acids implicated in plant defense are higher in Candidatus Liberibacter asiaticus-tolerant citrus varieties. Plant Signal. Behav. 2016, 11, e1171449. [Google Scholar] [CrossRef] [PubMed]
  27. Hijaz, F.; Nehela, Y.; Killiny, N. Possible role of plant volatiles in tolerance against huanglongbing in citrus. Plant Signal. Behav. 2016, 11, e1138193. [Google Scholar] [CrossRef]
  28. Folimonova, S.Y.; Robertson, C.J.; Garnsey, S.M.; Gowda, S.; Dawson, W.O. Examination of the responses of different genotypes of citrus to Huanglongbing (citrus greening) under different conditions. Phytopathology 2009, 99, 1346–1354. [Google Scholar] [CrossRef]
  29. Ramadugu, C.; Keremane, M.L.; Halbert, S.E.; Duan, Y.P.; Roose, M.L.; Stover, E.; Lee, R.F. Long-Term Field Evaluation Reveals Huanglongbing Resistance in Citrus Relatives. Plant Dis. 2016, 100, 1858–1869. [Google Scholar] [CrossRef]
  30. Zheng, Z.-L.; Zhao, Y. Transcriptome comparison and gene coexpression network analysis provide a systems view of citrus response to ‘Candidatus Liberibacter asiaticus’ infection. BMC Genom. 2013, 14, 27. [Google Scholar] [CrossRef]
  31. Fan, J.; Chen, C.; Yu, Q.; Khalaf, A.; Achor, D.S.; Brlansky, R.H.; Moore, G.A.; Li, Z.-G.; Gmitter Jr, F.G. Comparative transcriptional and anatomical analyses of tolerant rough lemon and susceptible sweet orange in response to ‘Candidatus Liberibacter asiaticus’ infection. Mol. Plant-Microbe Interact. 2012, 25, 1396–1407. [Google Scholar] [CrossRef]
  32. Li, T.; Ke, C. Detection of the bearing rate of Liberobacter asiaticum, in citrus psylla and its host plant Murraya paniculata by nested PCR. Acta Phytopathol. Sin. 2002, 29, 31–35. [Google Scholar]
  33. McLaughlin, J.E.; Darwish, N.I.; Garcia-Sanchez, J.; Tyagi, N.; Trick, H.N.; McCormick, S.; Dill-Macky, R.; Tumer, N.E. A lipid transfer protein has antifungal and antioxidant activity and suppresses Fusarium head blight disease and DON accumulation in transgenic wheat. Phytopathology 2021, 111, 671–683. [Google Scholar] [CrossRef]
  34. Jung, H.W.; Kim, W.; Hwang, B.K. Three pathogen-inducible genes encoding lipid transfer protein from pepper are differentially activated by pathogens, abiotic, and environmental stresses. Plant. Cell Environ. 2003, 26, 915–928. [Google Scholar] [CrossRef] [PubMed]
  35. Eulgem, T.; Rushton, P.J.; Robatzek, S.; Somssich, I.E. The WRKY superfamily of plant transcription factors. Trends Plant Sci. 2000, 5, 199–206. [Google Scholar] [CrossRef] [PubMed]
  36. Flors, V.; Ton, J.; Van Doorn, R.; Jakab, G.; García-Agustín, P.; Mauch-Mani, B. Interplay between JA, SA and ABA signalling during basal and induced resistance against Pseudomonas syringae and Alternaria brassicicola. Plant J. 2008, 54, 81–92. [Google Scholar] [CrossRef]
  37. Saikia, R.; Kumar, R.; Singh, T.; Srivastava, A.K.; Arora, D.K.; Lee, M.-W. Induction of defense related enzymes and pathogenesis related proteins in Pseudomonas fluorescens-treated chickpea in response to infection by Fusarium oxysporum f. sp. ciceri. Mycobiology 2004, 32, 47–53. [Google Scholar] [CrossRef]
  38. Tang, Y.; Kuang, J.; Wang, F.; Chen, L.; Hong, K.; Xiao, Y.; Xie, H.; Lu, W.; Chen, J. Molecular characterization of PR and WRKY genes during SA-and MeJA-induced resistance against Colletotrichum musae in banana fruit. Postharvest Biol. Technol. 2013, 79, 62–68. [Google Scholar] [CrossRef]
  39. Robert-Seilaniantz, A.; Grant, M.; Jones, J.D.G. Hormone crosstalk in plant disease and defense: More than just jasmonate-salicylate antagonism. Annu. Rev. Phytopathol. 2011, 49, 317–343. [Google Scholar] [CrossRef] [PubMed]
  40. D’Maris Amick Dempsey, A.C.; Vlot, M.C.W.; Daniel, F.K. Salicylic acid biosynthesis and metabolism. Arab. Book/Am. Soc. Plant Biol. 2011, 9, e0156. [Google Scholar]
  41. Rao, M.J.; Ding, F.; Wang, N.; Deng, X.; Xu, Q. Metabolic mechanisms of host species against citrus Huanglongbing (Greening Disease). CRC Crit. Rev. Plant Sci. 2018, 37, 496–511. [Google Scholar] [CrossRef]
  42. Vargas, P.; Farias, G.A.; Nogales, J.; Prada, H.; Carvajal, V.; Barón, M.; Rivilla, R.; Martín, M.; Olmedilla, A.; Gallegos, M. Plant flavonoids target Pseudomonas syringae pv. tomato DC 3000 flagella and type III secretion system. Environ. Microbiol. Rep. 2013, 5, 841–850. [Google Scholar] [CrossRef] [PubMed]
  43. Zhang, M.; Kang, H.; Zhang, G.; Chen, Y.; Kong, X.; Guo, Q.; Wang, W. Overexpression of TaUb2 enhances disease resistance to Pseudomonas syringae pv. tomato DC3000 in tobacco. Physiol. Mol. Plant Pathol. 2015, 90, 98–104. [Google Scholar] [CrossRef]
  44. Rao, M.J.; Xu, Y.; Huang, Y.; Tang, X.; Deng, X.; Xu, Q. Ectopic expression of citrus UDP-GLUCOSYL TRANSFERASE gene enhances anthocyanin and proanthocyanidins contents and confers high light tolerance in Arabidopsis. BMC Plant Biol. 2019, 19, 603. [Google Scholar] [CrossRef] [PubMed]
  45. Rao, M.J.; Xu, Y.; Tang, X.; Huang, Y.; Liu, J.; Deng, X. CsCYT75B1, a citrus CYTOCHROME P450 gene, is involved in accumulation of antioxidant flavonoids and anduces drought tolerance in transgenic Arabidopsis. Antioxidants 2020, 9, 161. [Google Scholar] [CrossRef]
  46. Rao, M.J.; Wu, S.; Duan, M.; Wang, L. Antioxidant metabolites in primitive, wild, and cultivated citrus and their role in stress tolerance. Molecules 2021, 26, 5801. [Google Scholar] [CrossRef] [PubMed]
  47. Sarowar, S.; Kim, Y.J.; Kim, K.D.; Kim, D. Overexpression of lipid transfer protein (LTP) genes enhances resistance to plant pathogens and LTP functions in long-distance systemic signaling in tobacco. Plant Cell Rep. 2009, 28, 419–427. [Google Scholar] [CrossRef]
  48. Salminen, T.A.; Blomqvist, K.; Edqvist, J. Lipid transfer proteins: Classification, nomenclature, structure, and function. Planta 2016, 244, 971–997. [Google Scholar] [CrossRef]
  49. Clough, S.J.; Bent, A.F. Floral dip: A simplified method for Agrobacterium-mediated transformation of Arabidopsis thaliana. Plant J. 1998, 16, 735–743. [Google Scholar] [CrossRef]
  50. Karimi, M.; Inzé, D.; Depicker, A. GATEWAYTM vectors for Agrobacterium-mediated plant transformation. Trends Plant Sci. 2002, 7, 193–195. [Google Scholar] [CrossRef]
  51. Amack, S.C.; Antunes, M.S. CaMV35S promoter—A plant biology and biotechnology workhorse in the era of synthetic biology. Curr. Plant Biol. 2020, 24, 100179. [Google Scholar] [CrossRef]
  52. Edwards, K.; Johnstone, C.; Thompson, C. A simple and rapid method for the preparation of plant genomic DNA for PCR analysis. Nucleic Acids Res. 1991, 19, 1349. [Google Scholar] [CrossRef] [PubMed]
  53. Kasajima, I.; Ide, Y.; Ohkama-Ohtsu, N.; Hayashi, H.; Yoneyama, T.; Fujiwara, T. A protocol for rapid DNA extraction fromArabidopsis thaliana for PCR analysis. Plant Mol. Biol. Rep. 2004, 22, 49–52. [Google Scholar] [CrossRef]
  54. Livak, K.J.; Schmittgen, T.D. Analysis of relative gene expression data using real-time quantitative PCR and the 2−ΔΔCT method. Methods 2001, 25, 402–408. [Google Scholar] [CrossRef]
  55. Smith, A.; Lovelace, A.H.; Kvitko, B.H. Validation of RT-qPCR approaches to monitor Pseudomonas syringae gene expression during infection and exposure to pattern-triggered immunity. Mol. Plant-Microbe Interact. 2018, 31, 410–419. [Google Scholar] [CrossRef]
  56. Jambunathan, N. Determination and detection of reactive oxygen species (ROS), lipid peroxidation, and electrolyte leakage in plants. In Plant Stress Tolerance; Springer: Berlin/Heidelberg, Germany, 2010; pp. 291–297. [Google Scholar]
  57. Warrier, R.R.; Paul, M.; Vineetha, M. V Estimation of salicylic acid in Eucalyptus leaves using spectrophotometric methods. Genet. Plant Physiol. 2013, 3, 90–97. [Google Scholar]
  58. Velikova, V.; Yordanov, I.; Edreva, A. Oxidative stress and some antioxidant systems in acid rain-treated bean plants: Protective role of exogenous polyamines. Plant Sci. 2000, 151, 59–66. [Google Scholar] [CrossRef]
  59. Feng, Y.; Zhang, M.; Guo, Q.; Wang, G.; Gong, J.; Xu, Y.; Wang, W. Manipulation of monoubiquitin improves chilling tolerance in transgenic tobacco (Nicotiana tabacum). Plant Physiol. Biochem. 2014, 75, 138–144. [Google Scholar] [CrossRef]
  60. Ozgen, M.; Scheerens, J.C.; Reese, R.N.; Miller, R.A. Total phenolic, anthocyanin contents and antioxidant capacity of selected elderberry (Sambucus canadensis L.) accessions. Pharmacogn. Mag. 2010, 6, 198–203. [Google Scholar] [CrossRef]
  61. Chen, W.; Gong, L.; Guo, Z.; Wang, W.; Zhang, H.; Liu, X.; Yu, S.; Xiong, L.; Luo, J. A novel integrated method for large-scale detection, identification, and quantification of widely targeted metabolites: Application in the study of rice metabolomics. Mol. Plant 2013, 6, 1769–1780. [Google Scholar] [CrossRef]
  62. Rao, M.J.; Duan, M.; Eman, M.; Yuan, H.; Sharma, A.; Zheng, B. Comparative Analysis of Citrus Species’ Flavonoid Metabolism, Gene Expression Profiling, and Their Antioxidant Capacity under Drought Stress. Antioxidants 2024, 13, 1149. [Google Scholar] [CrossRef]
  63. Chanana, S.; Thomas, C.S.; Zhang, F.; Rajski, S.R.; Bugni, T.S. HCAPCA: Automated hierarchical clustering and principal component analysis of large metabolomic datasets in R. Metabolites 2020, 10, 297. [Google Scholar] [CrossRef] [PubMed]
  64. Nicholas, K.B. GeneDoc: Analysis and visualization of genetic variation. EMBnet News 1997, 4, 14. [Google Scholar]
  65. Kumar, S.; Stecher, G.; Tamura, K. MEGA7: Molecular evolutionary genetics analysis version 7.0 for bigger datasets. Mol. Biol. Evol. 2016, 33, 1870–1874. [Google Scholar] [CrossRef] [PubMed]
  66. Chen, C.; Chen, H.; Zhang, Y.; Thomas, H.R.; Frank, M.H.; He, Y.; Xia, R. TBtools: An integrative toolkit developed for interactive analyses of big biological data. Mol. Plant 2020, 13, 1194–1202. [Google Scholar] [CrossRef]
Figure 1. Gene expression and amino acid sequence analysis of DIR1 gene. (A) Our gene expression pattern of the DIR1 gene in six different citrus species (with and without CLas inoculation); (B) an amino acid sequence analysis of the DIR1 homologous genes cloned from Citrus reticulata (CsDIR1), Atalantia buxifolia (AbDIR1), and Citrus maxima (CmDIR1); (C) the MpDIR1(t) amino acid sequence compared with its homologous genes from other plants (MR: Morella rubra, AT: Arabidopsis thaliana) Five-pointed star * in (B,C) marks every 10th amino acid for sequence counting. Healthy control: without CLas; CLas-infected: 4 weeks post inoculation with CLas bacteria. Each value is the mean of three biological replicates. A Student’s t-test was used to compare the gene expression of healthy and CLas-infected citrus at ** p < 0.01.
Plants 13 02692 g001
Figure 2. Phylogenetic analysis of the deduced protein sequence of the MpDIR1(t) gene with its homolog genes from Arabidopsis thaliana.
Plants 13 02692 g002
Figure 3. Inoculation of Pst DC3000 bacteria and gene expression analyses in the wild-type and transgenic lines. (A) Gene expression of the Pst DC3000 bacterial pathogen in Arabidopsis at different time points after inoculation, (B) Expression of the MpDIR1(t) gene in Arabidopsis at different time intervals after Pst DC3000 inoculation. CK: healthy control; WT-I: infected plants from the transgenic wild type (control); TG1-I: infected plants from transgenic line 1; TG3-I: infected plants from transgenic line 3; TG6-I: infected plants from transgenic line 6. Each value is the mean of three biological replicates. A Student’s t-test was used to compare transgenic Arabidopsis expressing MpDIR1(t)-TG and WT at * p < 0.05 and ** p < 0.01.
Plants 13 02692 g003
Figure 4. Expression pattern of pathogen-responsive and SA-mediated defense genes. (A) Protease inhibitors 1, AtPI1; (B) pathogenesis-related protein 1, AtPR1; (C) pathogenesis-related protein 2, AtPR2; (D) pathogenesis-related protein 4, AtPR4; (E) pathogenesis-related protein 5, AtPR5; (F) pathogenesis-related protein 10, AtPR10; (G) AtWRKY12; (H) phenylalanine ammonia lyase AtPAL. At: Arabidopsis thaliana; CK: healthy control; WT-I: infected plants from the wild type; TG1-I: infected plants from transgenic line 1; TG3-I: infected plants from transgenic line 3; TG6-I: infected plants from transgenic line 6. Each value is the mean of three biological replicates. A Student’s t-test was used to compare transgenic Arabidopsis expressing MpDIR1(t)-TG and WT at * p < 0.05 and ** p < 0.01.
Plants 13 02692 g004
Figure 5. Salicylic acid and antioxidant enzymatic activities of Arabidopsis leaves injected with Pst DC3000. (A) Salicylic acid; (B) superoxide dismutase, SOD; (C) peroxidase, POD; (D) catalase, CAT; (E) antioxidant capacity (mM Trolox/100 mg); (F) antioxidant activity (%). CK: healthy control; WT-I: infected plants from the wild type; TG1-I: infected plants from transgenic line 1; TG3-I: infected plants from transgenic line 3; TG6-I: infected plants from transgenic line 6. Each value is the mean of three biological replicates. A Student’s t-test was used to compare transgenic Arabidopsis expressing MpDIR1(t)-TG and WT at * p < 0.05 and ** p < 0.01.
Plants 13 02692 g005aPlants 13 02692 g005b
Figure 6. Arabidopsis leaf flavonoids infected with Pst DC3000 bacteria. (A) Hierarchical cluster analysis (HCA), where the columns signify Arabidopsis WT and transgenic lines and the rows represent flavonoid compounds (rows were normalized). (B) Principal component analysis (PCA). (*) means isomers of compound; WT-I: infected plants from the wild type; TG1-I: infected plants from transgenic line 1; TG3-I: infected plants from transgenic line 3; TG6-I: infected plants from transgenic line 6.
Plants 13 02692 g006
Figure 7. Biochemical variables of Arabidopsis leaves infected from Pst DC3000. (A) Superoxide radicals (SOR), (B) hydrogen peroxide (H2O2) contents, (C) reactive oxygen species (ROS), (D) electrolytic leakage (%), (E) malondialdehyde (MDA). CK: healthy control; WT-I: infected plants from the wild type; TG1-I: infected plants from transgenic line 1; TG3-I: infected plants from transgenic line 3; TG6-I: infected plants from transgenic line 6. Each value is the means of three biological replicates. A Student’s t-test was used to compare transgenic Arabidopsis expressing MpDIR1(t)-TG and WT at * p < 0.05 and ** p < 0.01.
Plants 13 02692 g007aPlants 13 02692 g007b
Disclaimer/Publisher’s Note: The statements, opinions and data contained in all publications are solely those of the individual author(s) and contributor(s) and not of MDPI and/or the editor(s). MDPI and/or the editor(s) disclaim responsibility for any injury to people or property resulting from any ideas, methods, instructions or products referred to in the content.

