Article

Light-Regulated Growth, Anatomical, Metabolites Biosynthesis and Transcriptional Changes in Angelica sinensis

1
State Key Laboratory of Arid Land Crop Science, College of Agronomy, Gansu Agricultural University, Lanzhou 730070, China
2
National and Local Joint Engineering Research Center on Germplasms Innovation and Utilization of Chinese Medicinal Materials in Southwest China, Yunnan Agricultural University, Kunming 650500, China
3
Institute of Medicinal Plant Development, Chinese Academy of Medical Sciences & Peking Union Medical College, Beijing 100193, China
4
Department of Chemistry and Biochemistry, Texas Tech University, Lubbock, TX 79409, USA
*
Author to whom correspondence should be addressed.
These authors contributed equally to this work.
Plants 2024, 13(19), 2744; https://doi.org/10.3390/plants13192744
Submission received: 31 July 2024 / Revised: 18 September 2024 / Accepted: 29 September 2024 / Published: 30 September 2024

Abstract

:
Angelica sinensis is an alpine medicinal plant that has been widely used as a general blood tonic and gynecological indications over 2000 years, which depend on the bioactive metabolites (e.g., volatile oils, organic acids, and flavonoids). Although the accumulation of these metabolites is significantly affected by the environmental factors (e.g., altitude, temperature, and sunshine) as found in previous studies, the regulatory mechanism of different lights has not been clearly revealed. Here, growth parameters, contents of bioactive metabolites, and expression levels of related genes were examined when A. sinensis was exposed to different white-light (WL) and UV-B radiation treatments. The results showed that the differences in growth parameters (e.g., plant height, root length, and plant biomass) and leaf tissue characteristics (e.g., leaf thickness, stomatal density and shape, and chloroplast density) were observed under different light treatments. The contents of Z-ligustilide and ferulic acid elevated with the increase of WL (50 to 150 µmol·m2/s) and maximized under the combination of WL-100 and UV-B (107 µW/m2, UV-107) radiation, while the total flavonoids and polysaccharides contents, as well as in vitro antioxidant capacity, elevated with the increasing of WL and UV-B. mRNA transcripts encoding for the biosynthesis of volatile oils, ferulic acid, flavonoids, and polysaccharides were found to be differentially regulated under the different WL and UV-B treatments. These morphological, anatomical, and transcriptional changes are consistent with the elevated bioactive metabolites in A. sinensis under the combination of WL and UV-B. These findings will provide useful references for improving bioactive metabolite production via the cultivation and bioengineering of A. sinensis.

1. Introduction

Angelica sinensis (Oliv.) Diels (family Apiaceae) is a perennial rhizomatous herb that is originally native to northwest China, thriving in wet and cold regions at altitudes of 2200 to 3000 m [1,2]. The roots (renowned as dang gui) have been widely used as a general blood tonic and for gynecological indications over 2000 years, and for the treatment of cardiovascular, hepatoprotective, and gynecological diseases in recent years [1]. The most important constituents associated with the biological activity are thought to be alkylphthalides (e.g., Z-ligustilide) and possibly ferulic acid, flavonoids, and polysaccharides [1,3,4].
Z-ligustilide and ferulic acid are often used as the quality marker (Q-mark) for the assessment of dang gui [1,5]. To date, the biosynthetic pathway of phthalides belonging to volatile oils, especially in Z-ligustilide, has not been mapped [6,7,8], while several genes participating in the biosynthesis of volatile oils have been previously identified in RNA-seq of A. sinensis [9,10,11], such as the t-anol/isoeugenol O-methyltransferase 1 (AIMT1) involved in converting trans-anol to trans-anethole and isoeugenol to isomethyleugenol [12], acetyl-CoA-benzylalcohol acetyltransferase (BEAT) involved in the biosynthesis of benzyl acetate [13], and cytochrome P450 705A1 (CYP705A1) involved in the biosynthesis of the volatile homoterpene (E)-4,8-dimethyl-1,3,7-nonatriene [14]. Presently, the biosynthetic pathway of ferulic acid and flavonoids belonging to the phenylpropanoids has been mapped in plants, and the genes identified from A. sinensis and related to ferulic acid biosynthesis include phenylalanine ammonia lyase (PAL), cinnamate 4-hydroxylase (C4H), p-coumarate 3 hydroxylase (C3H), and caffeic acid 3-O-methyltransferase (COMT), as well as to flavonoids biosynthesis include: chalcone synthase (CHS), chalcone isomerase (CHI), and UDP-glycosyltransferases (UGTs), amongst others (Figure S1) [9,10,11,15,16].
Geographical modeling on A. sinensis has predicted that the four environmental factors (i.e., altitude, temperature, sunshine, and rainfall) play determining roles in plant growth and biosynthesis of metabolites (e.g., Z-ligustilide, ferulic acid, and butenyl phthalide) [7,17]. Extensive experiments have demonstrated that there is a significant positive correlation between the content of metabolites (i.e., Z-ligustilide, ferulic acid, butenyl phthalide, flavonoids, polysaccharides, and phenolics) and the increase in altitude from 2000 to 2900 m [18,19,20,21,22,23].
Generally, there is a decrease in temperature and an increase in sunshine and rainfall with increasing altitude [24]. Previous studies on A. sinensis have found that a cooler temperature (15 °C) improves plant biomass, the contents of ferulic acid and total flavonoids, and expression levels of related genes (e.g., PAL, C3H, and CHS), while decreasing polysaccharides content compared with 22 °C [15]; soil drought decreases root biomass and the content of ferulic acid and volatile oils [25]; reducing light intensity with 50% to 75% sunshade improves root biomass and ferulic acid content [26,27], and an increase of UV-B radiation improves phthalide content [28].
Extensive experiments have demonstrated that light, especially in UV-B, significantly affects plant growth and regulates metabolites biosynthesis, such as chlorogenic acid in Scutellaria baicalensis [29], flavonoids in Chrysanthemum morifolium [30], and lignans in Schisandra chinensis [31]. Although previous studies have indicated that there were significant effects of light intensities and UV-B radiation on plant growth (i.e., root biomass) and the content of some metabolites (i.e., ferulic acid and phthalides) in A. sinensis [26,27,28], the regulatory mechanism of growth characteristics, metabolites accumulation, and related genes expression has not been examined when plants are exposed to synergistic white-light (WL) and UV-B radiation. In the present study, we probe the role of leaf tissue structures, metabolites content, and expression level of genes related to the biosynthesis of volatile oils, ferulic acid, flavonoids, and polysaccharides to identify possible links between light and metabolites accumulation.

2. Results

2.1. Changes in Growth Parameters in Response to White-Light (WL) and UV-B Radiation

In this study, significant differences in plant growth parameters (i.e., plant height, root length, aerial parts and root dry weight, and chlorophyll content) were observed under different light treatments. Specifically, there was a significant decrease in plant height, root length, aerial parts and root dry weight, and chlorophyll (a + b) content under the 50 µmol·m2/s white-light (WL-50), 100 µmol·m2/s white-light [WL-100, control (CK)] supplemented with a 107 µW/m2 UV-B (CK+UV-107), and CK supplemented with a 214 µW/m2 UV-B (CK+UV-214), while a 1.03-, 1.06-, 1.08-, 1.04-, and 1.05-fold increase was observed under the 150 µmol·m2/s white-light (WL-150) compared with CK, respectively. These results indicated that the WL-150 was more beneficial to plant growth (Table 1 and Figure S2).

2.2. Changes in Cell Micro-Structure and Leaf Stomata in Response to WL and UV-B Radiation

Significant alteration of leaf tissue structure (e.g., leaf thickness, chloroplast number, and stomata characteristics) was observed under different light treatments (Figure 1). Specifically, an increase in leaf thickness and chloroplast number was observed with the increase of WL from 50 to 150 µmol·m2/s (Figure 1A–C), while a decrease was observed with the increase of UV-B radiation from 0 to 214 µW/m2 (Figure 1C–E). Similarly, there were 1.24- and 1.40-fold as well as 1.97- and 2.22-fold increases in stomata density and stomatal opening percentage under the CK and WL-150 compared with WL-50 (Figure 1F–H,K–M), while there were 1.38- and 1.57-fold as well as 1.36- and 2.32-fold decreases under the CK+UV-107 and CK+UV-214 compared with CK (Figure 1H–J,M–O; Table S1). The greater stomatal opening percentage under the CK and WL-150 will contribute to an increase in the net CO2 fixation rate during photosynthesis and overall biomass accumulation. These results further indicated that plant growth could be improved under the WL compared with UV-B radiation.

2.3. Changes in Cell Ultra-Structure in Response to WL and UV-B Radiation

The leaf cell ultra-structures were significantly affected by different light treatments (Figure 2). Specifically, vacuole (V) occupied most of the space of the whole cell, and chloroplasts (Chs) were near to the cell wall (CW) (Figure 2A–E); mitochondria (Mi) were near the Ch (Figure 2F–J); starch grains (Ss) (Figure 2K–M), osmiophilic granules (OGs) (Figure 2K,M–O,Q), and thylakoid grana (TG) (Figure 2P–T) were present in the Ch. The number of Ch, S, TG, and OG obviously appeared to be greater under the CK and WL-150 compared with WL-50, while the number of Ch appeared to be lower under the CK+UV-107 and CK+UV-214 compared with CK (Figure 2A–E,K–T); the number of S gradually increased with the increase of WL, while it completely disappeared under UV-B radiation (Figure 2K–O). These changes in cell ultra-structure are consistent with the plant parameters under different light treatments.

2.4. Changes in Contents of Z-Ligustilide and Ferulic Acid in Response to WL and UV-B Radiation

As shown in Figure 3, the representative chromatogram of Z-ligustilide and ferulic acid is shown in Figure 3A, and significant differences in Z-ligustilide and ferulic acid were observed under different light treatments. Specifically, a 1.06-, 1.13-, and 1.11-fold increase in Z-ligustilide content was observed under the WL-150, CK+UV-107, and CK+UV-214, while a 1.09-fold decrease was observed under the WL-50 compared with CK, respectively (Figure 3B); a 1.15- and 1.47-fold increase in ferulic acid content was observed under the WL-150 and CK+UV-107, while a 1.15- and 1.07-fold decrease was observed under the WL-50 and CK+UV-214 compared with CK, respectively (Figure 3C).

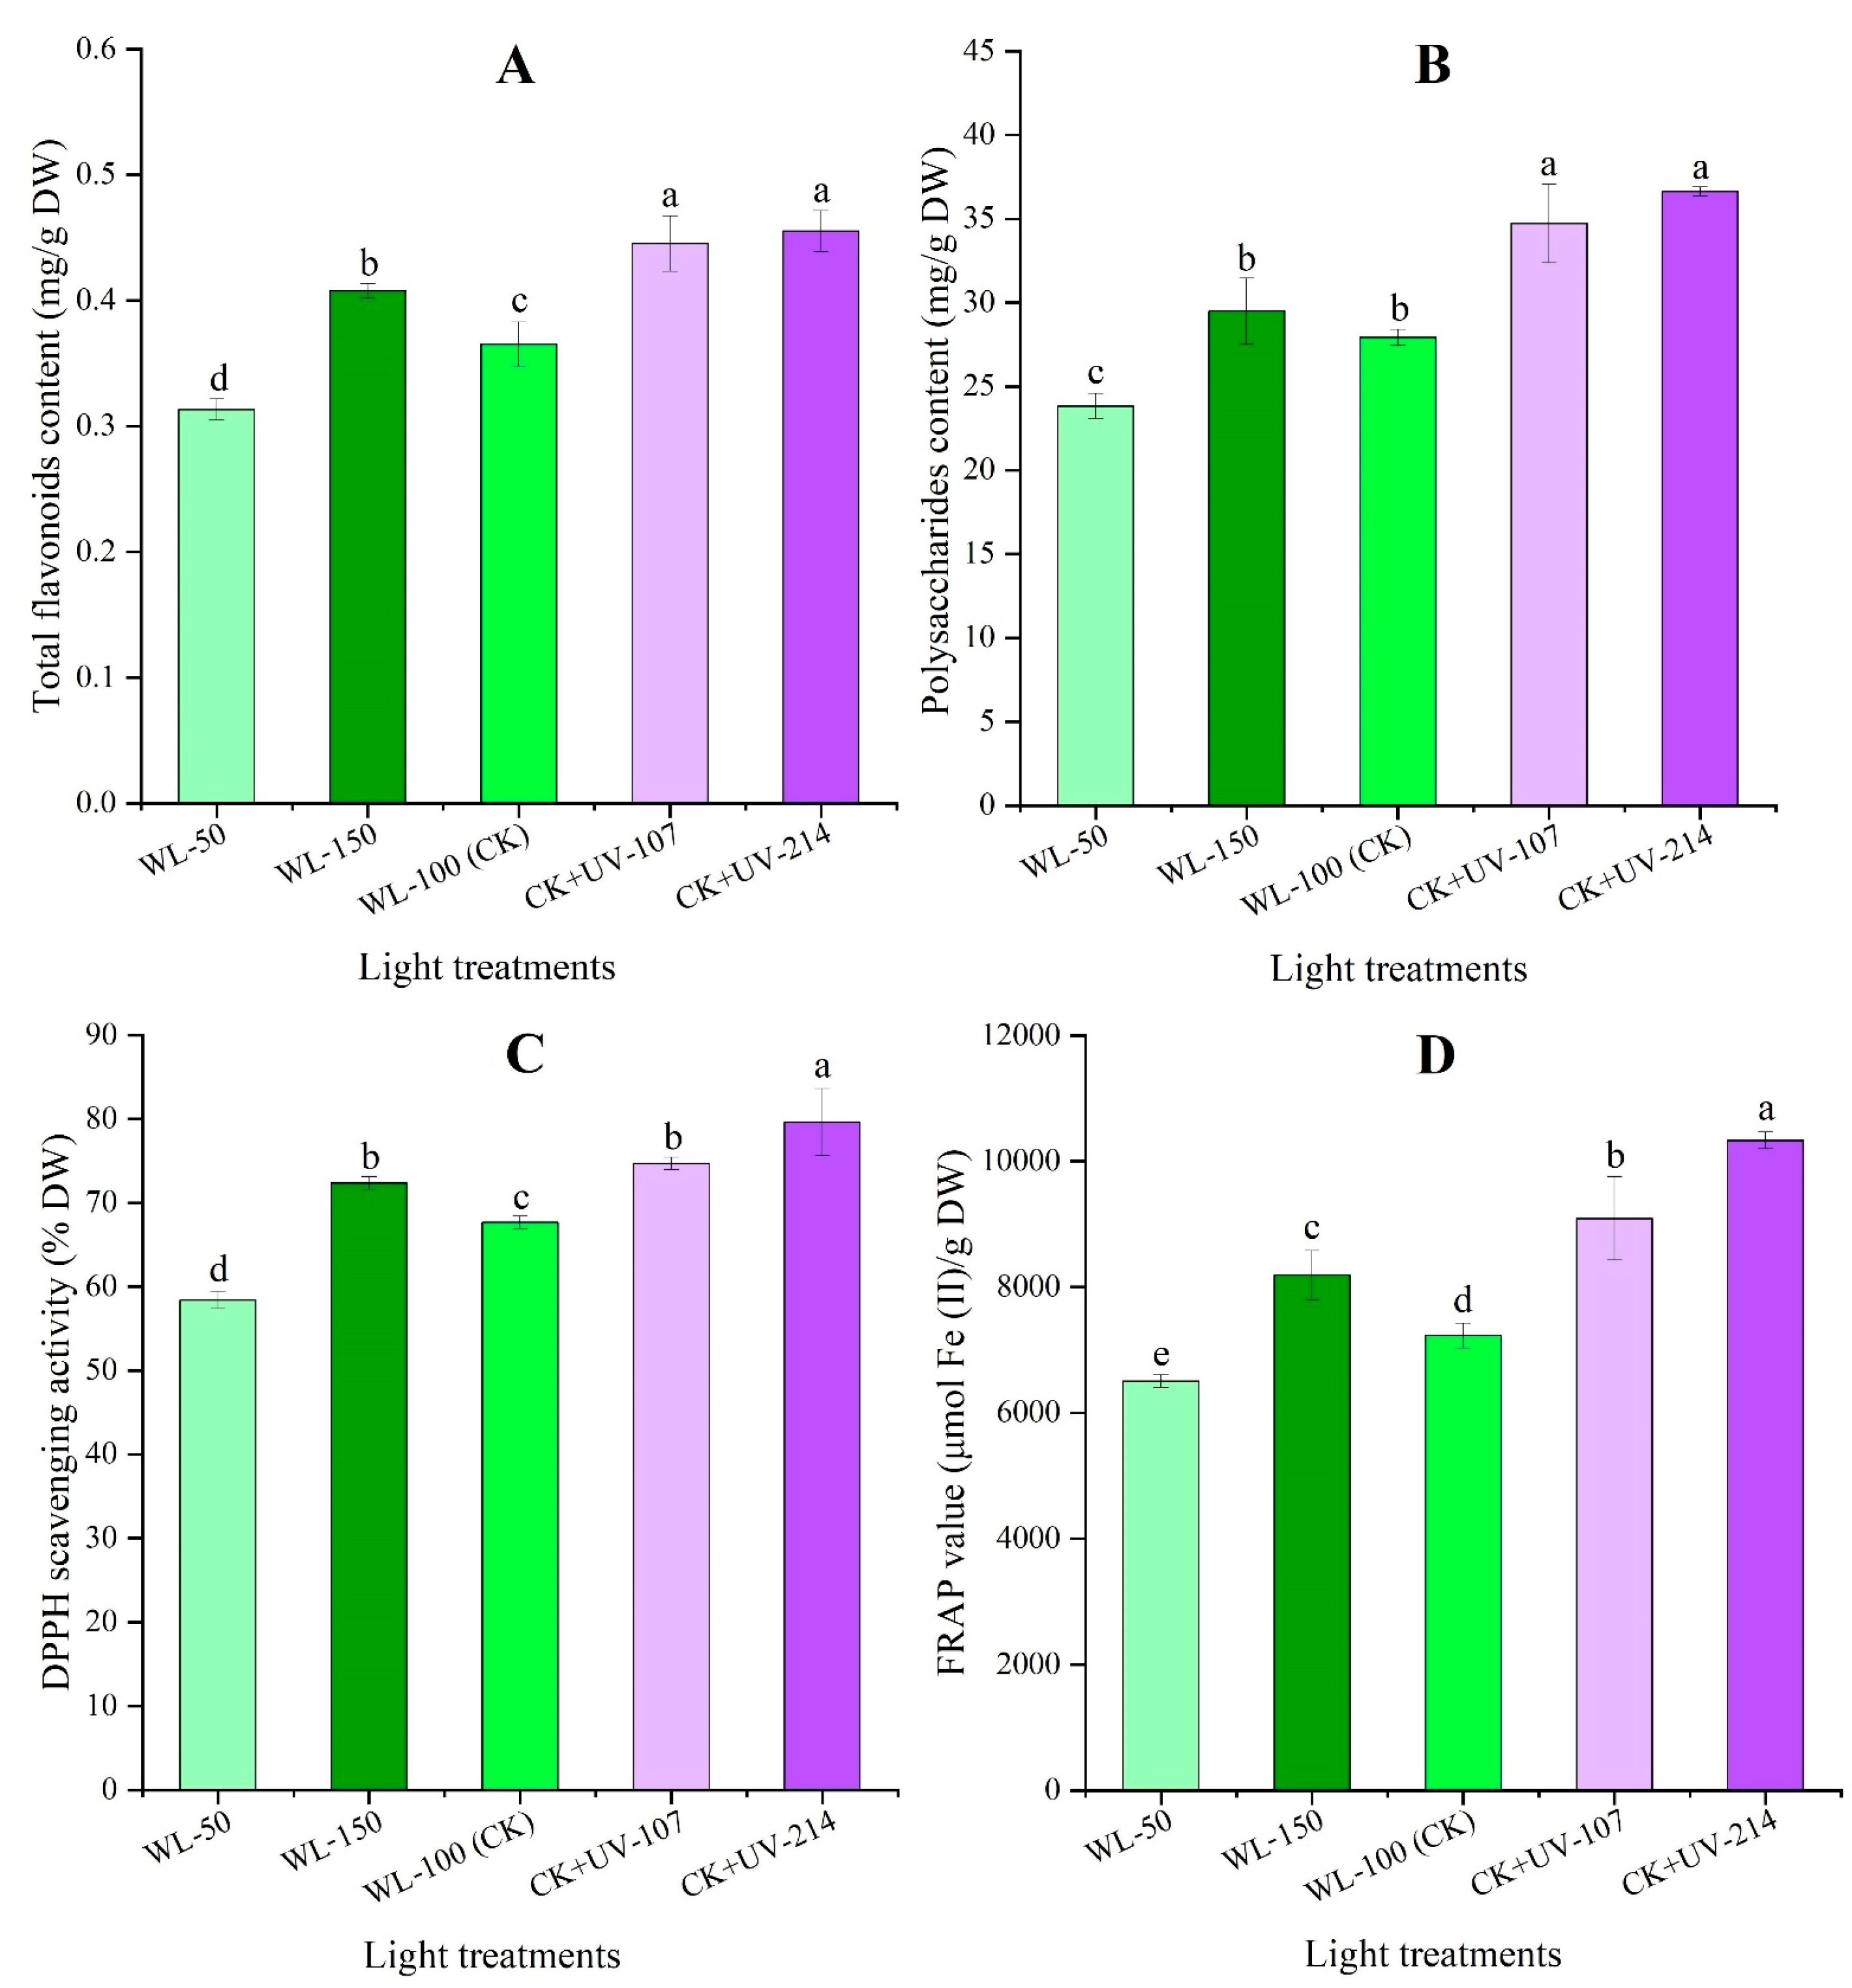
2.5. Changes in Contents of Bioactive Metabolites and Antioxidant Capacity in Response to WL and UV-B Radiation

Significant differences in bioactive metabolites (total flavonoids and polysaccharides) and antioxidant capacity [1,1-diphenyl-2-prcrylhydrazyl (DPPH) and Ferric reducing/antioxidant power (FRAP)] were observed under different light treatments (Figure 4). Specifically, a 1.12-, 1.22-, and 1.25-fold as well as 1.06-, 1.24, and 1.31-fold increase in total flavonoids and polysaccharides contents were observed under the WL-150, CK+UV-107, and CK+UV-214, while a 1.17- and 1.17-fold decrease was observed under the WL-50 compared with CK (Figure 4A,B). Similarly, a 1.07-, 1.10-, and 1.18-fold as well as 1.13-, 1.26-, and 1.43-fold increase of DPPH scavenging activity and FRAP value were observed under the WL-150, CK+UV-107, and CK+UV-214, while a 1.16- and 1.11-fold decrease was observed under the WL-50 compared with CK (Figure 4C,D). These results showed that higher WL and UV-B radiation could improve the accumulation of total flavonoids and polysaccharides in A. sinensis.

2.6. Changes in Gene Expression in Response to WL and UV-B Radiation

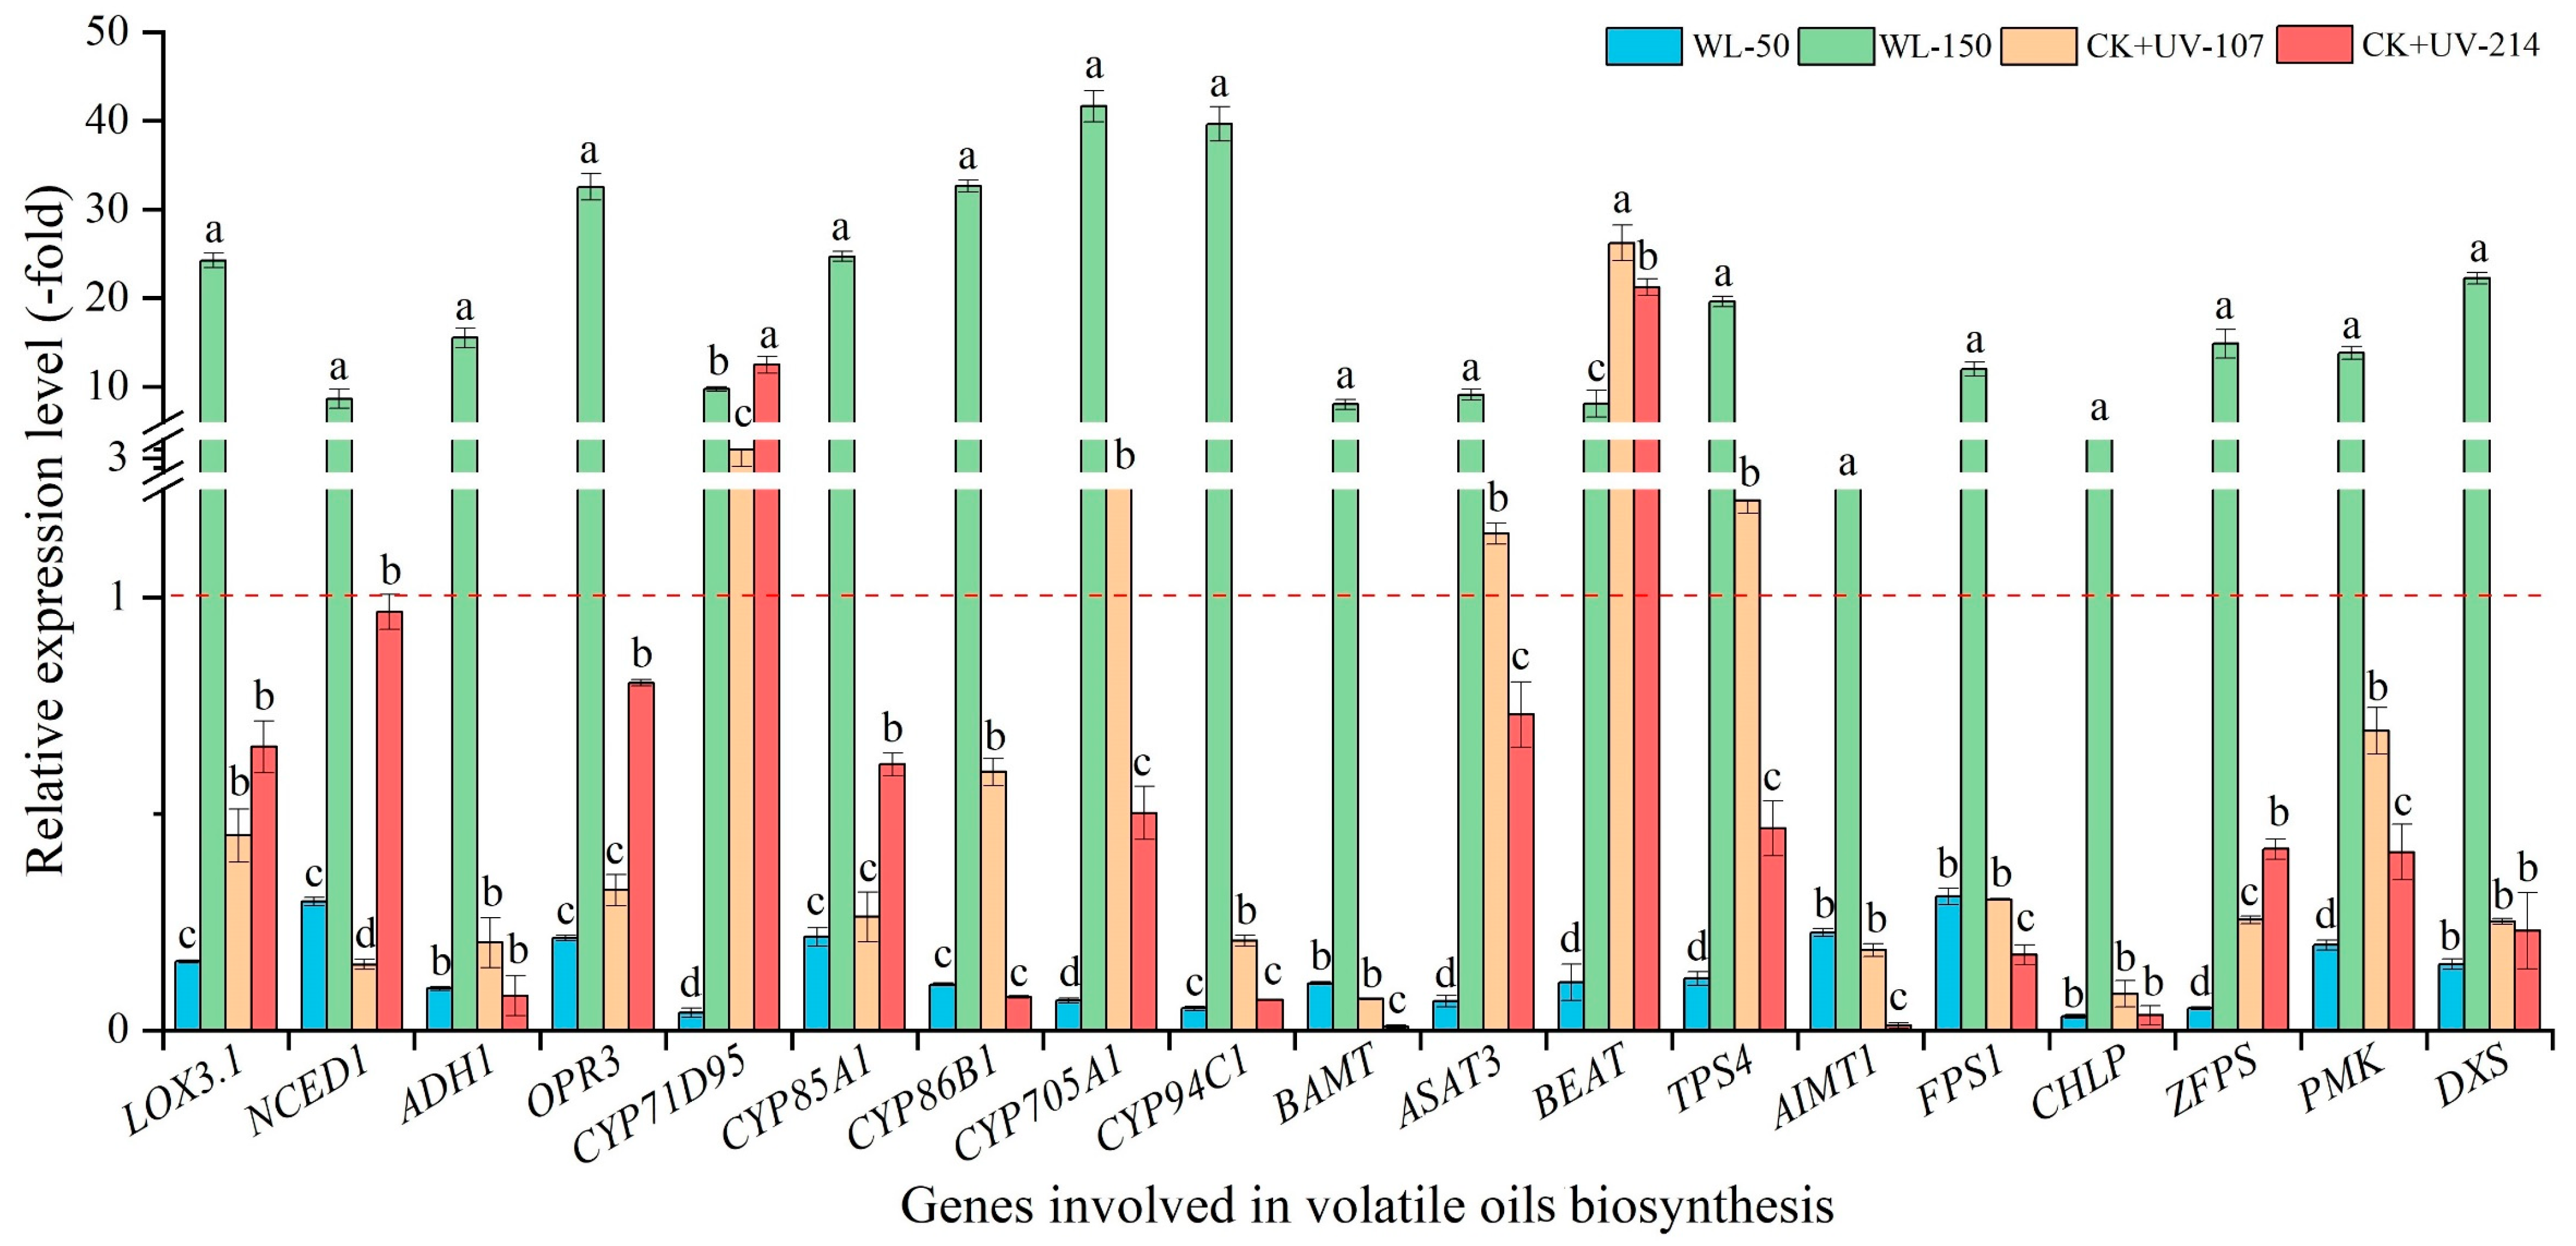
2.6.1. Changes in Expression Level of Genes Related to Volatile Oil Biosynthesis

As shown in Figure 5, the mRNA expression level of the selected 19 genes related to volatile oil biosynthesis showed a significant alteration under different light treatments, with a 1.56- (AIMT1) to 41.64-fold (CYP705A1) up-regulation (UR) under WL-150, while a 0.03- (CHLP) to 0.31-fold (FPS1) down-regulation (DR) under WL-50 compared with CK; a 1.15- (ASAT3) to 26.22-fold (BEAT) UR for the five genes (i.e., CYP71D95, CYP705A1, ASAT3, BEAT, and TPS4) and a 12.49- (CYP71D95) to 21.22-fold (BEAT) UR, while a 0.08- (CHLP) to 0.69 -fold (PMK) DR and 0.01- (BAMT) to 0.97-fold (NCED1) DR under CK+UV-107 and CK+UV-214 compared with CK, respectively.

2.6.2. Changes in Expression Level of Genes Related to Ferulic Acid Biosynthesis

As shown in Figure 6, the mRNA expression level of the selected six genes related to ferulic acid biosynthesis showed a significant alteration under different light treatments, with a 5.54- (PAL2) to 37.58-fold (4CLL6) UR under WL-150, while a 0.0007- (COMT and CCOMT) to 0.18-fold (HCT4) DR under WL-50 compared with CK; with a 1.50- (COMT) to 3.16-fold (CCOMT) UR and a 1.04- (CYP73A10) to 3.16-fold (CCOMT) UR, while a 0.53- (PAL2) to 0.90-fold (CYP73A10) DR and a 0.42- (PAL2) to 0.05-fold (4CLL6) DR under CK+UV-107 and CK+UV-214 compared with CK, respectively. The change trend of the expression level of the six key genes is almost consistent with the content of ferulic acid (Figure 3C and Figure 6).

2.6.3. Changes in Expression Level of Genes Related to Flavonoids Biosynthesis

As shown in Figure 7, the mRNA expression level of the selected 18 genes related to flavonoid biosynthesis showed a significant alteration under different light treatments, with a 7.03- (F3H-3) to 49.92-fold (F3GT1) UR under WL-150 compared with CK; with a 2.69- (ANS) to 20.95-fold (F3GT1) UR, 1.07- (CYP71A12) to 28.63-fold (F3GT1) UR, and 1.93- (ANS) to 8.52-fold (F3GT1) UR, while a 0.07- (CHS2) to 0.87-fold (LDOX) DR, 0.07- (CHS2) to 0.98-fold (DFRA) DR, and 0.01- (CHS2) to 0.84-fold (RhGT1) DR under WL-50, CK+UV-107, and CK+UV-214 compared with CK, respectively. The change trend of the expression level of the 18 key genes is almost consistent with the content of flavonoids (Figure 4A and Figure 7).

2.6.4. Changes in Expression Level of Genes Related to Polysaccharides Biosynthesis

As shown in Figure 8, the mRNA expression level of the selected six genes related to polysaccharides biosynthesis showed a significant alteration under different light treatments, with a 13.42- (SUS2) to 63.33-fold (TPS5) UR under WL-150 compared with CK, while a 0.29- (TPS5) to 0.62-fold (AGAL2) DR under WL-50 compared with CK; with a 1.43- (AGAL2) to 9.54-fold (INVA) UR and 1.22- (TPS5) to 6.97-fold (INVA) UR, while a 0.27- (SUS2) to 0.64-fold (TPS5) DR and 0.68- (UXS5) to 0.80-fold (SUS2) DR under CK+UV-107 and CK+UV-214 compared with CK, respectively. The change trend of the expression level of the six key genes is almost consistent with the content of polysaccharides (Figure 4B and Figure 8).

3. Discussion

Light plays critical roles in affecting plant growth and metabolite biosynthesis, with different plants responding to different light conditions [32,33]. In this study, the growth and leaf tissue characteristics, contents of bioactive metabolites, and expression levels of related genes were significantly affected when A. sinensis was exposed to white-light (WL) and UV-B radiation.
Previous studies have found that the plant growth improved by appropriate light, whereas inhibition by UV-B radiation has been observed in other plants. For example, there was an increase of plant growth (e.g., plant height, leaf number and area, and biomass) and photosynthetic ability of Sinopodophyllum hexandrum and Mahonia bodinieri under moderate light [34,35]; while there was a decrease in plant growth (e.g., plant height, fresh weight of leaves, shoots and roots as well as leaf area) of Avena fatua and Setaria viridis under different doses of UV-B radiation [36]. For A. sinensis, root biomass and ferulic acid content respectively showed a 1.13- and 1.18-fold increase, respectively, under 75% sunshade compared with 50% sunshade [26,27]; and the phthalide content showed a 1.29-fold increase under UV-B radiation compared with CK [28]. In this study, significant differences in plant growth were observed under different light treatments (Table 1 and Figure S2).
For the leaf tissue structure, previous studies on other plants have found that the leaf tissue structure is significantly affected by light intensity and quality; for example, there was an increase in leaf thickness (e.g., palisade parenchyma, spongy parenchyma, and lower epidermis) of Petunia × hybrida and stomatal density of M. bodinieri with increasing light intensity [34,37], while a decrease in leaf thickness occurred(e.g., epidermis, palisade, and mesophyll) with increasing UV-B radiation [38], as well as a decrease in stomatal opening rate of Cucumis sativus under UV-B radiation [39]. In this study, significant alterations of leaf tissue structure (e.g., leaf thickness, chloroplast number, and stomata characteristics) were observed under different light treatments (Figure 1). Previous studies on other plants have found that leaf ultra-structure is also significantly affected by light intensity and quality; for example, an increase in Ch and S numbers in Lycopersicon esculentum was observed with the increasing light intensity [40]; the Ch became coarsened and shortened, TG was swollen and distorted, and the number of OGs increased in Morus alba under increasing UV-B radiation [41]. In this study, significant alterations of leaf ultra-structure (e.g., Ch, TG, and OG) were also observed under different light treatments (Figure 2). These changes were consistent with the changes in chlorophyll (a + b) content, and the increase of photosynthetic components (i.e., Ch and TG) plays critical roles in energy acquisition and metabolites storage (i.e., S) for greater biomass [42].
For the bioactive metabolites, previous studies on A. sinensis have found that the Z-ligustilide content showed a 1.28-fold increase under UV-B radiation compared with CK [28]; the ferulic acid content showed a 1.18-fold increase under 75% sunshade compared with 50% sunshade [27]; and the Z-ligustilide and ferulic acid contents showed a 1.05- and 1.14-fold increase at 2780 m compared with 2360 m [21]. In this study, significant alteration of Z-ligustilide and ferulic acid content was observed under different light treatments (Figure 3). Extensive experiments have demonstrated that there is a significant positive correlation between total flavonoids and polysaccharides contents with in vitro antioxidant capacity in plants [43,44,45]. Previous studies on other plants have found that the total flavonoids and polysaccharides contents and in vitro antioxidant capacity were enhanced with an appropriate dose of light intensity and UV-B radiation [45,46,47]. In this study, the total flavonoids and polysaccharides contents, as well as in vitro antioxidant capacity, elevated with increasing WL and UV-B (Figure 4).
For the volatile oil biosynthesis, previous studies have found that genes (e.g., LOX3.1, NCED1, and ADH1) participate in the biosynthesis of volatile oils [9,10,11,15]. For example, the BAMT is involved in converting benzoic acid into the volatile ester methyl benzoates [48]; the LOX3.1 is involved in catalyzing the hydroperoxidation of lipids containing a pentadiene structure [49]; and the ZFPS is involved in the biosynthesis of several sesquiterpenes [50]. For the ferulic acid biosynthesis, previous studies have demonstrated that the genes (e.g., PAL2, CYP73A10, and 4CLL6) are directly participating in ferulic acid biosynthesis (Figure S1) [8,9,10,15,16]. In this study, these genes’ expression levels were almost consistent with the ferulic acid content (Figure 3C and Figure 6).
Extensive studies have demonstrated that flavonoids exhibit multi-biological functions in plants [51,52]. Previous studies have found that some genes participate in flavonoid biosynthesis (Figure S1) [15]. For example, the CYPs are involved in flavonoid and pigment biosynthesis [53,54]; and the GT6 is involved in the biosynthesis of flavonol 3-O-glucosides [55]. These genes’ expression levels were almost consistent with the flavonoids content (Figure 4A and Figure 7). For polysaccharides biosynthesis, previous studies have found that these genes participate in polysaccharides biosynthesis [11]. For example, the GOLS1 is involved in the biosynthesis of raffinose family oligosaccharides [56]; the INVA is involved in converting sucrose into glucose and fructose [57]; and the TPS5 is involved in the starch and sucrose degradation [58]. These genes’ expression levels were almost consistent with the polysaccharides content (Figure 4B and Figure 8).
Based on the results above, a model of light-regulated growth, anatomical, metabolites biosynthesis, and transcriptional changes in A. sinensis is proposed (Figure 9). Specifically, when plants are exposed to different lights, there are significant alterations in growth and leaf tissue parameters, bioactive metabolites accumulation, and in vitro antioxidant capacity. The changes in related gene expression (e.g., LOX3.1, NCED1, and ADH1) are almost consistent with the growth parameters (e.g., plant height, root length, and plant biomass), leaf tissue parameters (e.g., leaf thickness, stomatal density and shape, and chloroplast density), and contents of bioactive metabolites (i.e., Z-ligustilide, ferulic acid, total flavonoids, and polysaccharides). These findings demonstrate that the combination of WL and UV-B treatments can promote plant growth and metabolites accumulation in A. sinensis.

4. Materials and Methods

4.1. Plant Materials

The seedlings (root shoulder diameter 0.4–0.5 cm) developed from the mature seeds of 3-year-old plants of Angelica sinensis (Oliv.) Diels (cultivar Mingui 1) were stored in a refrigerator at 0 °C for 50 days [59]. The species was identified by Professor Mengfei Li (Gansu Agricultural University, Lanzhou, Gansu, China). Then, the stored seedlings were transplanted to pots (17 cm × 20 cm; two seedlings per pot) with a nutrition matrix (peat moss, organic content > 98%; soil relative water content 60–70%) and grown under a 12/12 h light/dark photocycle (white light 100 µmol/m2/s photon flux density) at 20 °C and 60% air relative humidity in a greenhouse.
After 30 days of growth, the plants were divided into 5 groups. Specifically, the first group continued growing under the WL-100 (CK); the second group was transferred to WL-50; the third group was transferred to WL-150; the fourth group was transferred to CK+UV-107 at 306 nm for 3 h per day (G40T10E, SANKYO DENKI, Kanagawa, Japan); and the fifth group was transferred to CK+UV-214 at 306 nm for 3 h per day. Each group has 20 repeats (20 pots × 2 seedlings per pot = 40 seedlings).
After 15 days of growth under 5 treatments, the plants were harvested, and the plant height and root length were measured (n = 40). Thereafter, 10 fresh plants were used for the measurement of chlorophyll content and leaf tissue structures; 10 fresh plants were stored at −80 °C for the determination of related gene expression; the other 20 plants were dried at room temperature for the determination of dry weight (DW) of aerial parts and roots, main metabolite content, and in vitro antioxidant capacity.

4.2. Measurement of Chlorophyll Content, Leaf Stomata, and Cell Structure

The total chlorophyll content was measured using a spectrophotometer (UV-6100, Shanghai, China) at 665 and 649 nm according to previous protocols [60]; leaf stomata were measured using a scanning electron microscope (SEM, S-3400N, Hitachi, Tokyo, Japan) according to previous protocols [61]; cell micro-structure was measured using an inverted microscope (Revolve RVL-100-G, ECHO, Lake Zurich, IL, USA), and cell ultra-structure was measured using a transmission electron microscope (TEM, JEM1230, JEOL Ltd., Tokyo, Japan) according to previous protocols [62].

4.3. Determination of Bioactive Metabolites Content and Antioxidant Capacity

The fine powder (1.5 g) of air-dried roots was soaked in 95% ethanol (20 mL) and agitated at 25 °C and 120 r/min for 48 h. The mixture was centrifuged at 4 °C and 5000 r/min for 10 min. The extracts were increased to 20 mL with 95% ethanol for the determination of bioactive metabolites (Z-ligustilide, ferulic acid, total flavonoids, and polysaccharides) contents and in vitro antioxidant capacities (DPPH scavenging activity and FRAP value).
The content of Z-ligustilide and ferulic acid was determined using a high-performance liquid chromatography (HPLC) according to previous protocols [63]. The content of total flavonoids, polysaccharides, and in vitro antioxidant capacity (DPPH and FRAP) was determined using the spectrometer (UV-6100, Shanghai, China) at 510 nm, 485 nm, 515 nm, and 593 nm, respectively. Specifically, the total flavonoids content used a NaNO2-AlCl3-NaOH method [64]; the polysaccharides content used the phenolsulfuric acid method [65]; the DPPH scavenging activity used a scavenging of DPPH radicals [66]; and the FRAP value used a reduction of ferric-tripyridyltriazine complex [67]. The roots from the 20 dried plants were mixed, and all the determinations have 3 technical repeats.

4.4. Quantification of Gene Expression

A total of 49 genes was selected based on the RNA-seq of A. sinensis in our previously published literature [9,10,11], including: 19 genes related to volatile oils biosynthesis, 6 genes related to ferulic acid biosynthesis, 18 genes related to flavonoids biosynthesis, and 6 genes related to polysaccharides biosynthesis. Their primer sequences (Table S2) were designed using a tool of primer-blast in the National Center for Biotechnology Information (NCBI). Total RNA was extracted from the roots using an RNA kit, and the purity was determined using a NanoDrop. First-strand cDNA was synthesized using a FastKing RT kit, and PCR amplification was performed using a SuperReal PreMix. Gene expression was quantified by qRT-PCR. Actin (ACT) gene [8] was used as an internal reference, and relative expression level (REL) of the gene was calculated using a 2−ΔΔCt method [68]. The roots from the 10 freezing fresh plants were mixed, and all the determinations have 3 technical repeats.

4.5. Statistical Analysis

Statistical analysis was performed using Duncan’s multiple range test in SPSS 22.0 with p < 0.05 considered as a significant difference.

5. Conclusions

Based on the above observations, light is an important environmental factor that regulates growth and bioactive metabolites biosynthesis, as well as related genes’ expression levels in A. sinensis, with the combination of WL and UV-B radiation altering growth characteristics (e.g., plant height, root length, and plant biomass) and leaf tissue structures (e.g., leaf thickness, stomatal density and shape, and chloroplast density), and enhancing the accumulation of bioactive metabolites (e.g., Z-ligustilide, ferulic acid, and flavonoids) via the differential expression of related genes. These findings will provide useful references for improving bioactive metabolites production via the cultivation and bioengineering of A. sinensis.

Supplementary Materials

The following supporting information can be downloaded at: https://www.mdpi.com/article/10.3390/plants13192744/s1, Figure S1: Schematic representation of biosynthetic pathways leading from shikimic acid pathway to phenylpropanoid pathway. Solid arrow indicates known steps, whereas multiple arrows indicate multiple reaction steps. Enzyme abbreviations are as follows: EMB3004, Bifunctional 3-dehydroquinate dehydratase/shikimate dehydrogenase, chloroplastic; CM, chorismate mutase; PAL, phenylalanine ammonia lyase; C4H, cinnamate 4-hydroxylase; 4CL, 4-coumarate-CoA ligase; HCT, hydroxycinnamoyl shikimate transferase; C3H, p-coumarate 3-hydroxylase; CCOAMT, caffeoyl-CoA 3-O-methyltransferase; CCR, cinnamoyl CoA oxidoreductases; COMT, caffeic acid 3-O-methyltransferase; CHS, chalcone synthase; CHI, chalcone isomerase. ① Showing the ferulic acid biosynthesis via CCOAMT sub-pathway; ② Showing the ferulic acid biosynthesis via COMT sub-pathway;③ Showing the flavonoid biosynthetic sub-pathway (15); Figure S2: Morphological characteristics of A. sinensis in response to WL and UV-B. Table S1: Stomata parameters of A. sinensis in response to WL and UV-B (mean ± SD, n = 10); Table S2: Primer sequences used to amplify the 49 genes related to the biosynthesis of volatile oils, ferulic acid, flavonoids, and polysaccharides.

Author Contributions

H.S., methodology, investigation, data curation, and writing—original draft; X.C., methodology, investigation, and data curation; Y.Z., methodology; M.L., conceptualization, methodology, supervision, as well as writing—review and editing, project administration; J.W., conceptualization and project administration; P.W.P., writing—review and editing. All authors have read and agreed to the published version of the manuscript.

Funding

This research was funded by the National Key R&D Program of China (2022YFC3501500), earmarked fund for CARS (CARS-21), National Natural Science Foundation of China (32160083 and 03123053), and Key R&D Program of Science and Technology Department of Gansu Province (22YF7NA111).

Data Availability Statement

The datasets of transcriptomics are publicly available at NCBI, with accession: PRJNA591308 and ID: 591308 (https://www.ncbi.nlm.nih.gov/bioproject/PRJNA591308, accessed on 20 August 2021), accession SAMN24046640 to SAMN24046648; SRA accession SRR17235563 to SRR17235571 (https://www.ncbi.nlm.nih.gov/bioproject/PRJNA789039, accessed on 14 December 2021), and Sequence Read Archive (SRA) accession: SRR16993328 to SRR16993332.

Conflicts of Interest

The authors declare no conflict of interest.

References

  1. Upton, R. American Herbal Pharmacopoeia and Therapeutic Compendium: Dang Gui Root-Angelica sinensis (Oliv.); American Herbal Pharmacopoeia: Scotts Valley, CA, USA, 2003; pp. 1–41. [Google Scholar]
  2. Zhang, H.Y.; Bi, W.G.; Yu, Y.; Liao, W.B. Angelica sinensis (Oliv.) Diels in China: Distribution, cultivation, utilization and variation. Genet. Resour. Crop Evol. 2012, 59, 607–613. [Google Scholar] [CrossRef]
  3. Ma, J.P.; Guo, Z.B.; Jin, L.; Li, Y.D. Phytochemical progress made in investigations of Angelica sinensis (Oliv.) Diels. Chin. J. Nat. Med. 2015, 13, 241–249. [Google Scholar] [CrossRef] [PubMed]
  4. Wei, W.L.; Zeng, R.; Gu, C.M.; Qu, Y.; Huang, L.F. Angelica sinensis in China-A review of botanical profile, ethnopharmacology, phytochemistry and chemical analysis. J. Ethnopharmacol. 2016, 190, 116–141. [Google Scholar] [CrossRef]
  5. Pharmacopoeia of the People’s Republic of China; China Medical Science and Technology Press: Beijing, China, 2020; p. 139.
  6. Turi, C.E.; Murch, S.J. Targeted and untargeted phytochemistry of Ligusticum canbyi: Indoleamines, phthalides, antioxidant potential, and use of metabolomics as a hypothesis-generating technique for compound discovery. Planta Med. 2013, 79, 1370–1379. [Google Scholar] [CrossRef]
  7. Xu, X.Q.; Zhu, T.T.; Shi, T.T.; Chen, J.; Jin, L. Quality suitability regionalization analysis of Angelica sinensis in Gansu, China. PLoS ONE 2020, 15, 0243750. [Google Scholar] [CrossRef]
  8. Xu, R.; Xu, J.; Li, Y.C.; Dai, Y.T.; Zhang, S.P.; Wang, G.; Liu, Z.G.; Dong, L.L.; Chen, S.L. Integrated chemical and transcriptomic analyses unveils synthetic characteristics of different medicinal root parts of Angelica sinensis. Chin. Herb. Med. 2020, 12, 19–28. [Google Scholar] [CrossRef]
  9. Li, M.F.; Li, J.; Wei, J.H.; Paré, P.W. Transcriptional controls for early bolting and flowering in Angelica sinensis. Plants 2021, 10, 1931. [Google Scholar] [CrossRef]
  10. Li, J.; Li, M.L.; Zhu, T.T.; Zhang, X.N.; Li, M.F.; Wei, J.H. Integrated transcriptomics and metabolites at different growth stages reveals the regulation mechanism of bolting and flowering of Angelica sinensis. Plant Biol. 2021, 23, 574–582. [Google Scholar] [CrossRef] [PubMed]
  11. Luo, M.M.; Liu, X.X.; Su, H.Y.; Li, M.L.; Li, M.F.; Wei, J.H. Regulatory networks of flowering genes in Angelica sinensis during vernalization. Plants 2022, 11, 1355. [Google Scholar] [CrossRef]
  12. Koeduka, T.; Baiga, T.J.; Noel, J.P.; Pichersky, E. Biosynthesis of t-anethole in anise: Characterization of t-anol/isoeugenol synthase and an O-methyltransferase specific for a C7–C8 propenyl side chain. Plant Physiol. 2009, 149, 384–394. [Google Scholar] [CrossRef]
  13. Nam, K.H.; Dudareva, N.; Pichersky, E. Characterization of benzylalcohol acetyltransferases in scented and non-scented Clarkia species. Plant Cell Physiol. 1999, 40, 916–923. [Google Scholar] [CrossRef] [PubMed]
  14. Sohrabi, R.; Huh, J.H.; Badieyan, S.; Rakotondraibe, L.H.; Kliebenstein, D.J.; Sobrado, P.; Tholl, D. In planta variation of volatile biosynthesis: An alternative biosynthetic route to the formation of the pathogen-induced volatile homoterpene DMNT via triterpene degradation in Arabidopsis roots. Plant Cell 2015, 27, 874–890. [Google Scholar] [CrossRef] [PubMed]
  15. Dong, H.; Li, M.L.; Jin, L.; Xie, X.R.; Li, M.F.; Wei, J.H. Cool temperature enhances growth, ferulic acid and flavonoid biosynthesis while inhibiting polysaccharide biosynthesis in Angelica sinensis. Molecules 2022, 27, 320. [Google Scholar] [CrossRef] [PubMed]
  16. Li, M.L.; Cui, X.W.; Jin, L.; Li, M.F.; Wei, J.H. Bolting reduces ferulic acid and flavonoid biosynthesis and induces root lignification in Angelica sinensis. Plant Physiol. Biochem. 2022, 170, 171–179. [Google Scholar] [CrossRef] [PubMed]
  17. Fan, Q.; Zhang, Y.Y.; Chen, H.P.; Lin, X.Y.; Xia, P.F.; Sun, Y.J.; Zhao, L.; Luo, J.; Yang, F.X.; Li, S.H. Influence of ecological factors on the quality of Angelica sinensis based on OPLS model. Chin. Tradit. Pat. Med. 2021, 43, 1226–1230. [Google Scholar]
  18. Li, M.S.; Hao, Y.R.; Zhang, Z.G. Influence of the high altitude on the yield of Angelica sinensis and principal components of essential oils. Acta Bot. Bor. Occ. Sin. 1985, 5, 155–160. [Google Scholar]
  19. Ma, Y.; Jin, L.; Wang, Z.H.; Cui, Z.J.; Zhang, Y.L.; Li, Y.D. Comparative study of cultivated radix Angelica sinensis polysaccharide content from different altitude in Min county of Gansu province. J. Trad. Chin. Vet. Med. 2013, 32, 7–9. [Google Scholar]
  20. Jin, L.; Jin, Y.; Wang, H.Z.; Zhang, X.F.; Zhang, P.S.; Li, Y.D. Effects of altitude on the yield and content of ferulic acid in Angelica sinensis. J. Trad. Chin. Vet. Med. 2014, 33, 47–49. [Google Scholar]
  21. Li, J.; Gao, S.F.; Li, Y.D.; Jin, L.; Wang, H.Z. Response study of ferulic and ligustilide in the root of Angelica sinensis on altitude. J. Gansu Coll. Tradit. Chin. Med. 2014, 31, 23–26. [Google Scholar]
  22. Wang, H.Z.; Jin, L.; Zhang, E.H. Effect of altitude on the photosynthate accumulation and distribution pattern of Angelica sinensis. J. Chin. Medic. Mater. 2012, 35, 1191–1194. [Google Scholar]
  23. Wang, H.Z.; Jin, L.; Zhang, E.H. Effect of altitude on ferulic acid in Angelica sinensis and analysis in key factors. Chin. Trad. Herb. Drugs 2013, 44, 219–223. [Google Scholar]
  24. Jacobson, M.Z. Fundamentals of Atmospheric Modeling, 2nd ed.; Cambridge University Press: Cambridge, UK, 2005. [Google Scholar]
  25. Liu, B.; Rao, B.Y.; Qian, C.; Wu, Z.J. Effect on different irrigation treatments on growth, yield and quality of Angelica sinensis. Mod. Agric. Sci. Technol. 2013, 2, 77–80+82. [Google Scholar]
  26. Lin, H.M.; Wu, Y.A.; Cao, Z.F.; Lv, S.L.; Mao, X.J. Influence of sun shade cultivation on premature bolting in Angelica sinensis and growth environment factors. Chin. J. Exp. Tradit. Med. For. 2010, 16, 79–83. [Google Scholar]
  27. Xiang, H.; Li, Y.; Jin, Y. Effects of light intensity on yield and ferulic acid content in Angelica sinensis. J. Tradit. Chin. Vet. Med. 2015, 2, 53–54. [Google Scholar]
  28. Wang, Z.H.; Wang, Y.Q.; Fan, Q.; Yang, X.; Luo, J.; Li, S.N.; Jiao, M.T. Effects of UV-B radiation on the content of phthalides in Angelica sinensis. J. Gansu Univ. Chin. Med. 2019, 36, 31–34. [Google Scholar]
  29. Miao, N.; Yun, C.; Shi, Y.T.; Gao, Y.; Wu, S.; Zhang, Z.H.; Han, S.L.; Wang, H.M.; Wang, W.J. Enhancement of flavonoid synthesis and antioxidant activity in Scutellaria baicalensis aerial parts by UV-A radiation. Ind. Crops Prod. 2022, 187, 115532. [Google Scholar] [CrossRef]
  30. Yang, Y.J.; Liu, J.; Yi, T.Y.; Li, Y.; Li, M.Y.; Liu, H.D.; Zheng, L.J.; Chen, Z.H.; Hao, J.; Xu, M.J.; et al. Integrated mRNA and miRNA omics reveal the regulatory role of UV-B radiation in active ingredient biosynthesis of Chrysanthemum morifolium Ramat. Ind. Crops Prod. 2023, 197, 116657. [Google Scholar] [CrossRef]
  31. Ri, I.; Pak, S.; Pak, U.; Yun, C.; Tang, Z.H. How does UV-B radiation influence the photosynthesis and secondary metabolism of Schisandra chinensis leaves? Ind. Crops Prod. 2024, 208, 117832. [Google Scholar] [CrossRef]
  32. Kami, C.; Lorrain, S.; Hornitschek, P.; Fankhauser, C. Chapter two-light-regulated plant growth and development. In Timmermans, Current Topics in Developmental Biology; Marja, C.P., Ed.; Academic Press: Cambridge, MA, USA, 2010; Volume 91, pp. 29–66. [Google Scholar]
  33. Fang, L.Z.; Ma, Z.Y.; Wang, Q.B.; Nian, H.; Ma, Q.B.; Huang, Q.L.; Mu, Y.H. Plant growth and photosynthetic characteristics of soybean seedlings under different LED lighting quality conditions. J. Plant Growth Regul. 2021, 40, 668–678. [Google Scholar] [CrossRef]
  34. Kong, D.X.; Li, Y.Q.; Wang, M.L.; Bai, M.; Zou, R.; Tang, H.; Wu, H. Effects of light intensity on leaf photosynthetic characteristics, chloroplast structure, and alkaloid content of Mahonia bodinieri (Gagnep.) Laferr. Acta Physiol. Plant. 2016, 38, 120. [Google Scholar] [CrossRef]
  35. Guo, Q.Q.; Li, H.E.; Gao, C.; Yang, R. Leaf traits and photosynthetic characteristics of endangered Sinopodophyllum hexandrum (Royle) Ying under different light regimes in Southeastern Tibet Plateau. Photosynthetica 2019, 57, 548–555. [Google Scholar] [CrossRef]
  36. Zuk-Golaszewska, K.; Upadhyaya, M.K.; Golaszewski, J. The effect of UV-B radiation on plant growth and development. Plant Soil Environ. 2003, 49, 135–140. [Google Scholar] [CrossRef]
  37. Haliapas, S.; Yupsanis, T.A.; Syros, T.D.; Kofidis, G.; Economou, A.S. Petunia × hybrida during transition to flowering as affected by light intensity and quality treatments. Acta Physiol. Plant. 2008, 30, 807–815. [Google Scholar] [CrossRef]
  38. Inostroza-Blancheteau, C.; Reyes-Díaz, M.; Arellano, A.; Latsague, M.; Acevedo, P.; Loyola, R.; Arce-Johnson, P.; Alberdi, M. Effects of UV-B radiation on anatomical characteristics, phenolic compounds and gene expression of the phenylpropanoid pathway in highbush blueberry leaves. Plant Physiol. Biochem. 2014, 85, 85–95. [Google Scholar] [CrossRef] [PubMed]
  39. An, L.Z.; Wang, J.H.; Liu, Y.H.; Chen, T.; Xu, S.J.; Feng, H.Y.; Wang, X.L. The effects of enhanced UV-B radiation on growth, stomata, flavonoid, and ABA content in cucumber leaves. In Proceedings of the Third International Asia-Pacific Environmental Remote Sensing Remote Sensing of the Atmosphere, Ocean, Environment, and Space, Hangzhou, China, 23–27 October 2002; Volume 4896. [Google Scholar]
  40. Wang, W.X.; Wang, Y.J.; Fu, Q.S.; Zhao, B.; Guo, Y.D. Effects of low light stress on morphological trait physiological characters and leaf ultrastructure of Tomato (Lycopersicon esculentum L.) seedlings. Acta Agric. Bor. Sin. 2009, 24, 144–149. [Google Scholar]
  41. Chen, M.H.; Huang, Y.Y.; Liu, G.; Qin, F.; Yang, S.A.; Xu, X. Effects of enhanced UV-B radiation on morphology, physiology, biomass, leaf anatomy and ultrastructure in male and female mulberry (Morus alba) saplings. Environ. Exp. Bot. 2016, 129, 85–93. [Google Scholar] [CrossRef]
  42. Whitmarsh, J.; Govindjee, G. The Photosynthetic Process. Concepts in Photobiology: Photosynthesis and Photomorphogenesis; Springer: Dordrecht, The Netherlands, 1999; pp. 11–51. [Google Scholar]
  43. Chen, H.X.; Qu, Z.S.; Fu, L.L.; Dong, P.; Zhang, X. Physicochemical properties and antioxidant capacity of 3 polysaccharides from green tea, oolong tea, and black tea. J. Food Sci. 2009, 74, C469–C474. [Google Scholar] [CrossRef] [PubMed]
  44. Li, S.; Li, S.K.; Gan, R.Y.; Song, F.L.; Kuang, L.; Li, H.B. Antioxidant capacities and total phenolic contents of infusions from 223 medicinal plants. Ind. Crops Prod. 2013, 51, 289–298. [Google Scholar] [CrossRef]
  45. Zhao, Q.Z.; Dong, M.Y.; Li, M.F.; Jin, L.; Pare, P.W. Light-induced flavonoid biosynthesis in Sinopodophyllum hexandrum with high-altitude adaptation. Plants 2023, 12, 575. [Google Scholar] [CrossRef]
  46. Sakalauskaitė, J.; Viskelis, P.; Dambrauskienė, E.; Sakalauskienė, S.; Samuolienė, G.; Brazaitytė, A.; Duchovskis, P.; Urbonavicien, D. The effects of different UV-B radiation intensities on morphological and biochemical characteristics in Ocimum basilicum L. J. Sci. Food Agric. 2013, 93, 1266–1271. [Google Scholar] [CrossRef]
  47. Lv, M.; Su, H.Y.; Li, M.L.; Yang, D.L.; Yao, R.Y.; Li, M.F.; Wei, J.H. Effect of UV-B radiation on growth, flavonoid and podophyllotoxin accumulation, and related gene expression in Sinopodophyllum hexandrum. Plant Biol. 2021, 23, 202–209. [Google Scholar] [CrossRef] [PubMed]
  48. Dudareva, N.; Murfitt, L.M.; Mann, C.J.; Gorenstein, N.; Kolosova, N.; Kish, C.M.; Bonham, C.; Wood, K. Developmental regulation of methyl benzoate biosynthesis and emission in snapdragon flowers. Plant Cell 2000, 12, 949–961. [Google Scholar] [CrossRef] [PubMed]
  49. Royo, J.; Vancanneyt, G.; Pérez, A.G.; Sanz, C.; Störmann, K.; Rosahl, S.; Sánchez-Serrano, J.J. Characterization of three potato lipoxygenases with distinct enzymatic activities and different organ-specific and wound-regulated expression patterns. J. Biol. Chem. 1996, 271, 21012–21019. [Google Scholar] [CrossRef]
  50. Sallaud, C.; Rontein, D.; Onillon, S.; Jabès, F.; Duffé, P.; Giacalone, C.; Thoraval, S.; Escoffier, C.; Herbette, G.; Leonhardt, N.; et al. A novel pathway for sesquiterpene biosynthesis from Z, Z-farnesyl pyrophosphate in the wild tomato Solanum habrochaites. Plant Cell 2009, 21, 301–317. [Google Scholar] [CrossRef]
  51. Cushnie, T.P.T.; Lamb, A.J. Antimicrobial activity of flavonoids. Int. J. Antimicrob. Agents 2005, 26, 343–356. [Google Scholar] [CrossRef] [PubMed]
  52. Forni, C.; Rossi, M.; Borromeo, I.; Feriotto, G.; Platamone, G.; Tabolacci, C.; Mischiati, C.; Beninati, S. Flavonoids: A myth or a reality for cancer therapy? Molecules 2021, 26, 3583. [Google Scholar] [CrossRef]
  53. Sunnadeniya, R.; Bean, A.; Brown, M.; Akhavan, N.; Hatlestad, G.; Gonzalez, A.; Symonds, V.V.; Lloyd, A. Tyrosine hydroxylation in betalain pigment biosynthesis is performed by Cytochrome P450 enzymes in Beets (Beta vulgaris). PLoS ONE 2016, 11, e0149417. [Google Scholar] [CrossRef] [PubMed]
  54. Ahmad, N.; Liu, J.Y.; Xu, T.; Noman, M.; Jameel, A.; Yao, N.; Dong, Y.Y.; Wang, N.; Li, X.W.; Wang, F.W.; et al. Overexpression of a novel Cytochrome P450 promotes flavonoid biosynthesis and osmotic stress tolerance in transgenic Arabidopsis. Genes 2019, 10, 756. [Google Scholar] [CrossRef]
  55. Griesser, M.; Vitzthum, F.; Fink, B.; Bellido, M.L.; Raasch, C.; Munoz-Blanco, J.; Schwab, W. Multi-substrate flavonol O-glucosyltransferases from strawberry (Fragaria × ananassa) achene and receptacle. J. Exp. Bot. 2008, 59, 2611–2625. [Google Scholar] [CrossRef]
  56. Panikulangara, T.J.; Eggers-Schumacher, G.; Wunderlich, M.; Stransky, H.; Schöffl, F. Galactinol synthase1. A novel heat shock factor target gene responsible for heat-induced synthesis of raffinose family oligosaccharides in Arabidopsis. Plant Physiol. 2004, 136, 3148–3158. [Google Scholar] [CrossRef]
  57. Xiang, L.; Le Roy, K.; Bolouri-Moghaddam, M.R.; Vanhaecke, M.; Lammens, W.; Rolland, F.; Van den Ende, W. Exploring the neutral invertase-oxidative stress defense connection in Arabidopsis thaliana. J. Exp. Bot. 2011, 62, 3849–3862. [Google Scholar] [CrossRef] [PubMed]
  58. Vogel, G.; Fiehn, O.; Jean-Richard-dit-Bressel, L.; Boller, T.; Wiemken, A.; Aeschbacher, R.A.; Wingler, A. Trehalose metabolism in Arabidopsis: Occurrence of trehalose and molecular cloning and characterization of trehalose-6-phosphate synthase homologues. J. Exp. Bot. 2001, 52, 1817–1826. [Google Scholar] [CrossRef] [PubMed]
  59. Liu, X.X.; Luo, M.M.; Li, M.F.; Wei, J.H. Depicting precise temperature and duration of vernalization and inhibiting early bolting and flowering of Angelica sinensis by freezing storage. Front Plant Sci. 2022, 13, 853444. [Google Scholar] [CrossRef]
  60. Li, L.; Li, N.H.; Jiang, S.M. Experimental Guidance of Plant Physiology Module; Science Press: Beijing, China, 2009; pp. 22–39. [Google Scholar]
  61. Hu, C.H.; Xu, Q.; Sun, X.; Yu, H.; Yuan, Y.Q. Several biological typical samples preparation methods of scanning electron microscope. Hubei Agric. Sci. 2016, 55, 5389–5392. [Google Scholar]
  62. Li, Y.; Huang, H.P.; Deng, R.; Zhang, X.C.; Cui, Y.M.; Lu, X.L.; Lin, P.Q. The improvement of the sample preparation technique for TEM of plant. Chin. J. Trop. Crop. 2016, 37, 2100–2105. [Google Scholar]
  63. Deng, X.Q.; Guan, X.J.; Huang, N.N.; Li, J. Simultaneous determination of eight constituents in Angelica sinensis by HPLC. Chin. Tradit. Pat. Med. 2020, 42, 2075–2079. [Google Scholar]
  64. Ma, M.L.; Karsani, S.A.; Mohajer, S.; Malek, S.N.A. Phytochemical constituents, nutritional values, phenolics, flavonols, flavonoids, antioxidant and cytotoxicity studies on Phaleria macrocarpa (Scheff.) Boerl fruits. BMC Complement. Altern. Med. 2014, 14, 1187–1198. [Google Scholar]
  65. Dubois, M.; Gilles, K.A.; Hamilton, J.K.; Rebers, P.A.; Smith, F. Colorimetric method for determination of sugars and related substances. Anal. Biochem. 1956, 28, 350–356. [Google Scholar] [CrossRef]
  66. Nencini, C.; Menchiari, A.; Franchi, G.G.; Micheli, L. In vitro antioxidant activity of aged extracts of some Italian Allium species. Plant Foods Hum. Nutr. 2011, 66, 11–16. [Google Scholar] [CrossRef] [PubMed]
  67. Benzie, I.F.; Strain, J.J. The ferric reducing ability of plasma (FRAP) as a measure of “antioxidant power”: The FRAP assay. Anal. Biochem. 1996, 239, 70–76. [Google Scholar] [CrossRef]
  68. Willems, E.; Leyns, L.; Vandesompele, J. Standardization of real-time PCR gene expression data from independent biological replicates. Anal. Biochem. 2008, 379, 127–129. [Google Scholar] [CrossRef] [PubMed]
Figure 1. Changes in cell micro- and leaf stomata structure of A. sinensis in response to white-light (WL) and UV-B. WL-100 as a reference (CK); Ch: chloroplast; GC: guard cell; LE: lower epidermis; PC: palisade cell; SP: stomatal pore; ST: spongy tissue; UE: upper epidermis. Images (A,F,K) represent the cell micro- and leaf stomata structure under WL-50 treatment; images (B,G,L) represent the structure under WL-150 treatment; images (C,H,M) represent the structure under WL-100 (CK) treatment; images (D,I,N) represent the structure under CK + UV-107 treatment; and images (E,J,O) represent the structure under CK + UV-214 treatment.
Plants 13 02744 g001
Figure 2. Changes in cell ultra-structure of A. sinensis leaf in response to WL and UV-B. WL-100 as a reference (CK); CW: cell wall; Ch: chloroplast; Mi: mitochondria; S: starch grain; TG: thylakoid grana; OG: osmiophilic granule; V: vacuole. The scale in the first line shows 5 µm, and the scales in second to fourth lines show 1 µm. Images (A,F,K,P) represent the cell ultra- structure under WL-50 treatment; images (B,G,L,Q) represent the structure under WL-150 treatment; images (C,H,M,R) represent the structure under WL-100 (CK) treatment; images (D,I,N,S) represent the structure under CK + UV-107 treatment; and images (E,J,O,T) represent the structure under CK + UV-214 treatment.
Plants 13 02744 g002
Figure 3. Changes in the contents of Z-ligustilide and ferulic acid, as well as their representative chromatogram, in response to WL and UV-B. WL-100 is usedas a reference (CK); Image (A) shows the representative chromatogram of the ferulic acid and Z-ligustilide; Image (B) shows the content of Z-ligustilide; and Image (C) shows the content of ferulic acid. Different lowercase letters represent significant differences (p < 0.05) among different treatments.
Plants 13 02744 g003
Figure 4. Changes in the contents of total flavonoids (A), polysaccharides (B), DPPH scavenging activity (C), and FRAP value (D) in rhizomes of A. sinensis in response to WL and UV-B. WL-100 as a reference (CK); different lowercase letters represent significant differences (p < 0.05) among different treatments.
Plants 13 02744 g004
Figure 5. Expression levels of genes related to volatile oils biosynthesis in response to WL and UV-B. WL-100 as a reference (CK); different lowercase letters represent significant differences (p < 0.05) among different treatments.
Plants 13 02744 g005
Figure 6. Expression levels of genes related to ferulic acid biosynthesis in response to WL and UV-B. WL-100 as a reference (CK); different lowercase letters represent significant differences (p < 0.05) among different treatments.
Plants 13 02744 g006
Figure 7. Expression levels of genes related to flavonoids biosynthesis in response to WL and UV-B. WL-100 as a reference (CK); different lowercase letters represent significant differences (p < 0.05) among different treatments.
Plants 13 02744 g007
Figure 8. Expression levels of genes related to polysaccharides biosynthesis in response to WL and UV-B. WL-100 as a reference (CK); different lowercase letters represent significant differences (p < 0.05) among different treatments.
Plants 13 02744 g008
Figure 9. A proposed model of light-regulated growth, anatomical changes, metabolite biosynthesis, and transcriptional changes in A. sinensis.
Plants 13 02744 g009
Table 1. Changes in growth parameters of A. sinensis in response to white-light (WL) and UV-B.
Growth ParametersWL-50WL-150WL-100 (CK)CK+UV-107CK+UV-214
Plant height (cm)20.34 ± 0.83 d23.34 ± 1.69 a22.62 ± 1.31 b21.46 ± 1.29 c20.13 ± 0.79 d
Root length (cm)10.81 ± 0.55 c12.08 ± 0.73 a11.42 ± 0.88 b11.30 ± 0.65 b10.45 ± 0.45 d
Aerial parts dry weight (g)0.22 ± 0.02 c0.26 ± 0.02 a0.24 ± 0.02 b0.22 ± 0.02 c0.20 ± 0.02 d
Root dry weight (g)0.20 ± 0.02 c0.24 ± 0.03 a0.23 ± 0.03 a0.21 ± 0.02 b0.19 ± 0.02 c
Chlorophyll (a + b) (mg/g FW)1.54 ± 0.03 c1.77 ± 0.02 a1.69 ± 0.01 b1.38 ± 0.03 d1.04 ± 0.02 e
Note: Different letters in the same line show a significant difference at p < 0.05 level among different treatments.
Disclaimer/Publisher’s Note: The statements, opinions and data contained in all publications are solely those of the individual author(s) and contributor(s) and not of MDPI and/or the editor(s). MDPI and/or the editor(s) disclaim responsibility for any injury to people or property resulting from any ideas, methods, instructions or products referred to in the content.

