Article

Metabolomics Reveals Rubiadin Accumulation and the Effects of Methyl Jasmonate Elicitation in Damnacanthus major Calli

Biodiversity Research Institute, Jeju Technopark, Seogwipo, Jeju 63608, Republic of Korea
*
Author to whom correspondence should be addressed.
These authors contributed equally to this work.
Plants 2024, 13(2), 167; https://doi.org/10.3390/plants13020167
Submission received: 7 December 2023 / Revised: 26 December 2023 / Accepted: 6 January 2024 / Published: 8 January 2024
(This article belongs to the Special Issue Plant Biotechnology Applications in Secondary Metabolite Production)

Abstract

:
Callus suspension techniques have been considered attractive for improving bioactive metabolite productivity; methyl jasmonate (MeJA) is a widely used elicitor for stimulating synthetic pathways. In this study, a multivariate analysis-based metabolomics approach was employed to investigate the primary and specialized metabolites in the leaves, unelicited calli, and 100 or 200 μM MeJA elicited calli of Damnacanthus major. Rubiadin, a powerful anthraquinone with various therapeutic properties, was only identified in D. major calli, accumulating in a MeJA elicitation concentration-dependent manner. Callus cultures also contained high levels of amino acids, sugars, and phenolic compounds, indicating energy metabolism and metabolic adaptation responses for proliferation and stabilization. Regarding MeJA application, elicited calli contained higher amounts of quinic acid, kaempferol, and glucose with lower amounts of sucrose and raffinose than those in the unelicited control, which were closely related to protective mechanisms against MeJA. Moreover, excessive elicitation increased the asparagine, fructose, and raffinose levels and decreased the glucose and sucrose levels, which was ascribed to increased activation of the aminoacyl-tRNA biosynthesis pathway and wider utilization of glucose than of fructose after sucrose degradation. These results will be useful for optimizing plant cell culture techniques to achieve high production rates for valuable specialized metabolites.

Graphical Abstract

1. Introduction

Damnacanthus major, an evergreen shrub of the Rubiaceae family, is approximately 30–70 cm tall, and grows naturally in warm regions, such as Korea (southern), China (southern), Japan (southern), Thailand, and India [1,2]. Recently, the genetics [3,4], medicinal material quality control [5], and synthesis of new metabolites and drug prototypes [6] have been studied in the Rubiaceae family owing to the diversity of chemical constituents. Among various secondary metabolites produced by the Rubiaceae family, anthraquinones are biologically active with anti-inflammatory, antioxidant, anticancer, hemostatic, and antibacterial activities [7]. Phenolic compounds are dominant in the Rubiaceae family and are medicinally important owing to their anticancer, anti-inflammatory, hepatoprotective, antibacterial, and antiviral properties [8]. However, increased demand for these bioactive plant-derived compounds may lead to excessive use of plant resources, ultimately causing biodiversity loss [9].
To overcome this problem, callus cultures can be used for the industrial production of rare or endangered plants, as well as those that are difficult to secure because of their small size or small number [10]. Callus cultures can produce specialized metabolites at a faster rate than that of traditional cultivation and are performed under controlled conditions without being affected by various environmental factors (seasonal changes, microbial diseases, pests, and geographical constraints); therefore, their functional substances are continuously produced with consistent quality [11]. Elicitation is an effective strategy for increasing the biosynthesis of bioactive compounds and enhancing biomass in plant cultures in vitro [12]. Methyl jasmonate (MeJA) is a powerful abiotic elicitor. Exogenous MeJA treatment of in vitro cultures increases bioactive compound biosynthesis, antioxidant enzyme activity, and defense-related gene expression [12,13]. Notably, Komaraiah et al. reported that anthraquinone production was significantly increased with MeJA elicitation than with polyunsaturated fatty acid elicitation [14].
Metabolomics, an omics approach for studying the metabolite changes in biological systems, has drawn significant interest in systems biology, as it can reflect the reactions of plant cells or tissues to various abiotic stresses [15]. Primary metabolites are compounds involved in essential physiological functions, including growth, development, and reproduction [16]. Unlike the primary metabolites commonly observed in all plant species through central metabolism, specialized metabolites are biosynthetic end products that play significant roles in defense by enhancing resistance against biotic and abiotic stresses [16]. Specialized metabolites are commercially utilized in the food and pharmacological industries because of their structural diversity and biological functions [17]. Therefore, metabolic profiling of both primary and specialized metabolites can provide a comprehensive understanding of the biological pathways occurring in plants under various stresses.
Most plant cell culture techniques focus on the presence of bioactive compounds; however, a combination of primary and specialized metabolite profiling is rare. Further, little information is available regarding the metabolic profiles of Rubiaceae family cell cultures, especially the calli of D. major, under stress conditions. Therefore, the present study aimed to identify the primary and specialized metabolite differences among D. major leaves, unelicited calli, and calli elicited with 100 or 200 μM MeJA. The findings of this study can be helpful for increasing biomass and specialized metabolite production in calluses in vitro compared with that in explants through elicitor treatment. Further, the metabolic profiling strategy adopted in the current study can provide a reference for future plant biotechnology approaches on the effects of MeJA elicitation and determine the potential relationship of primary and specialized metabolites with the plant stress response in D. Major calli.

2. Results and Discussion

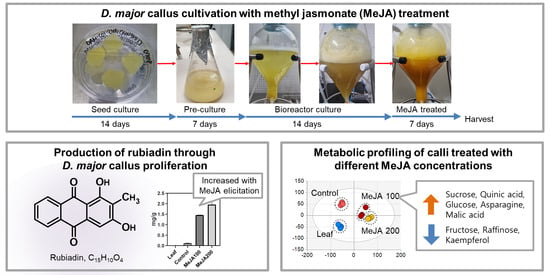
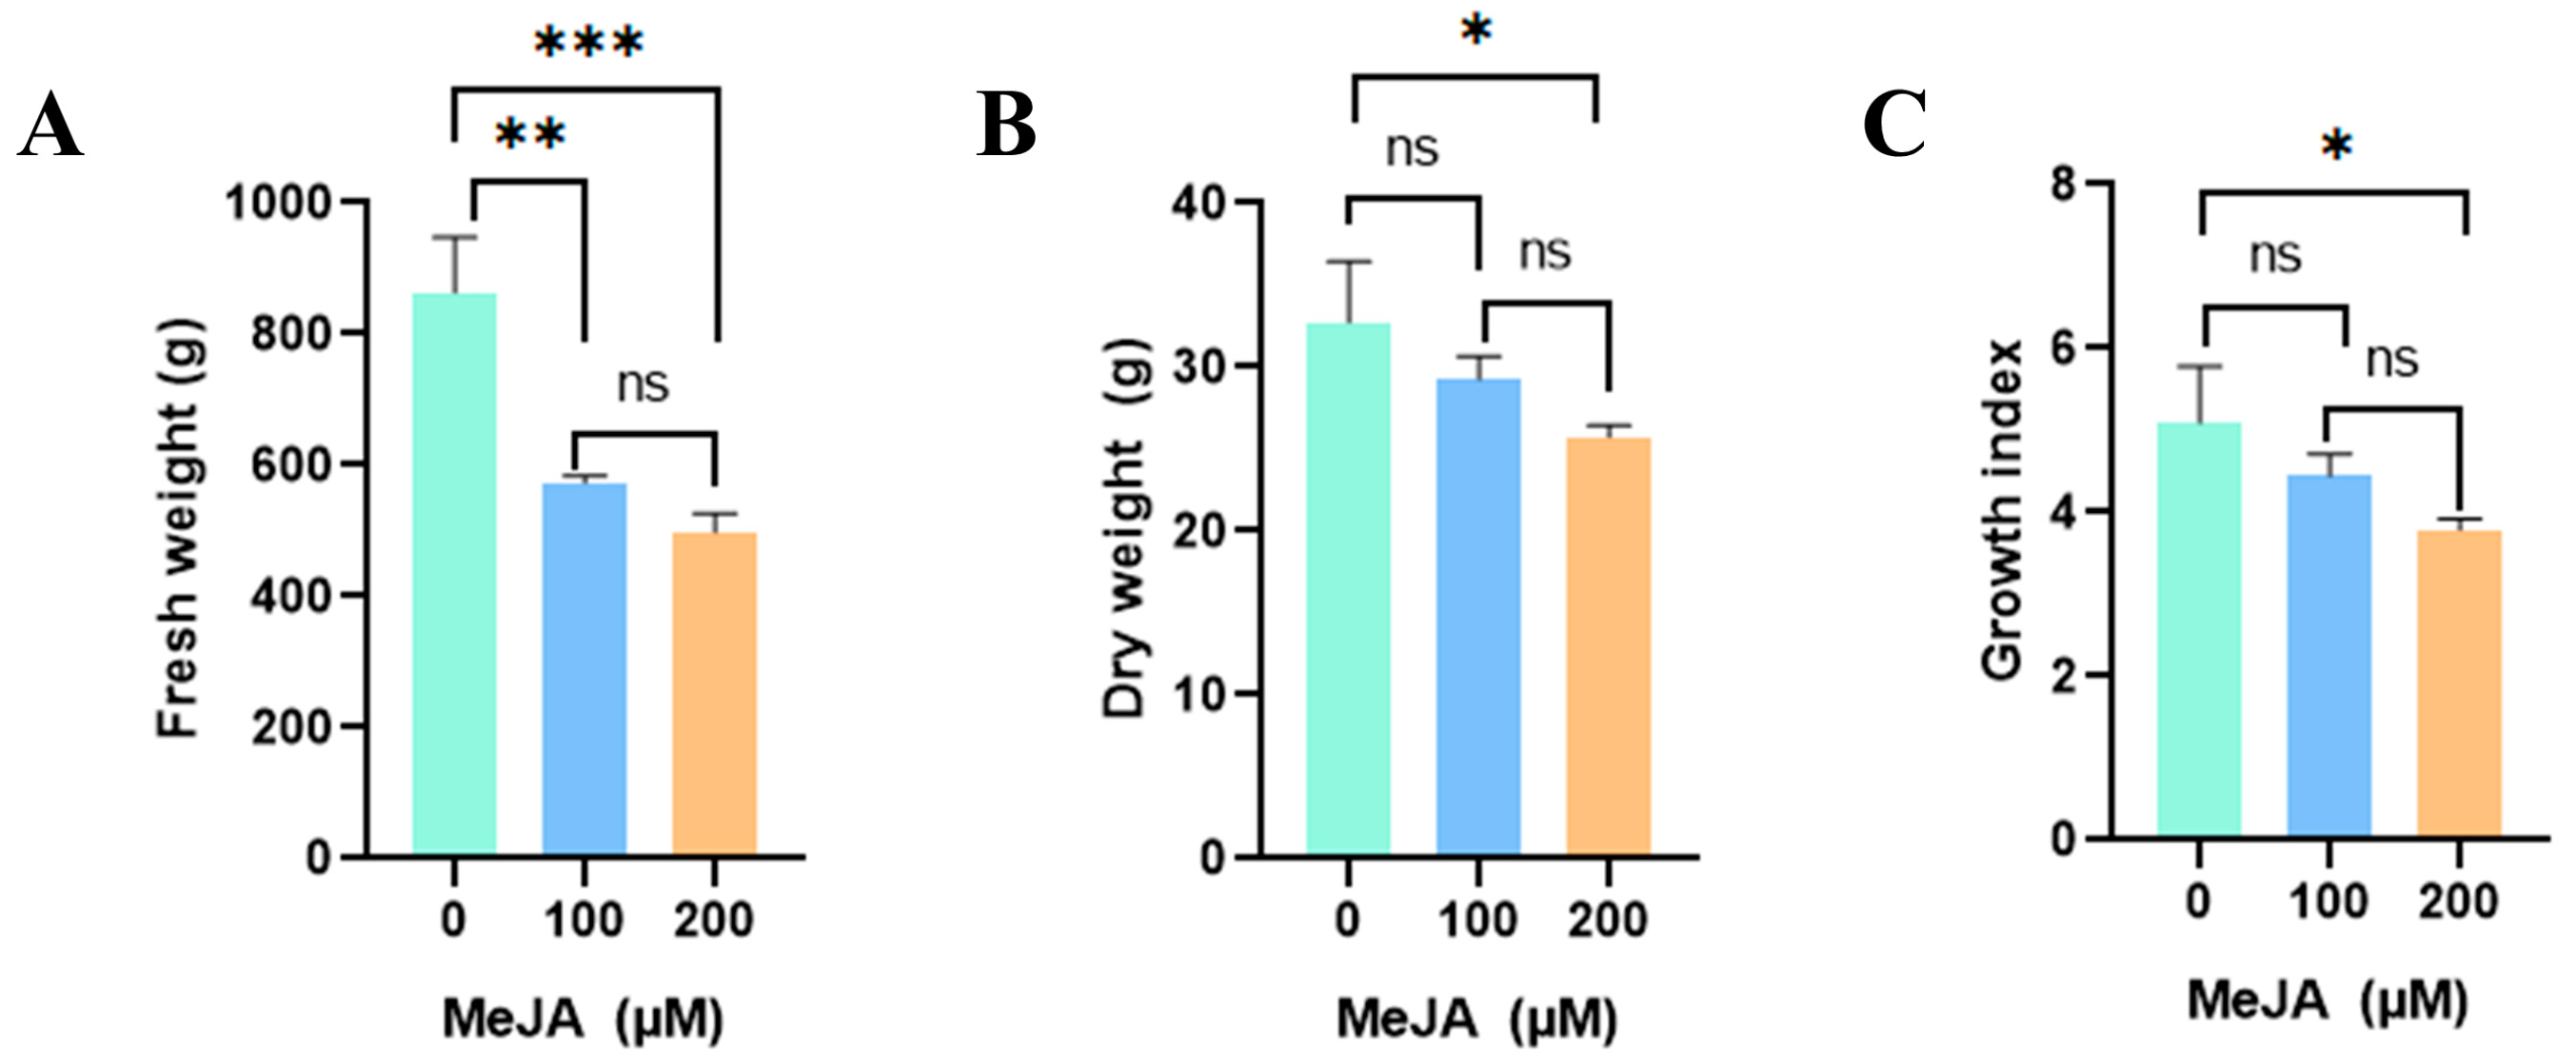
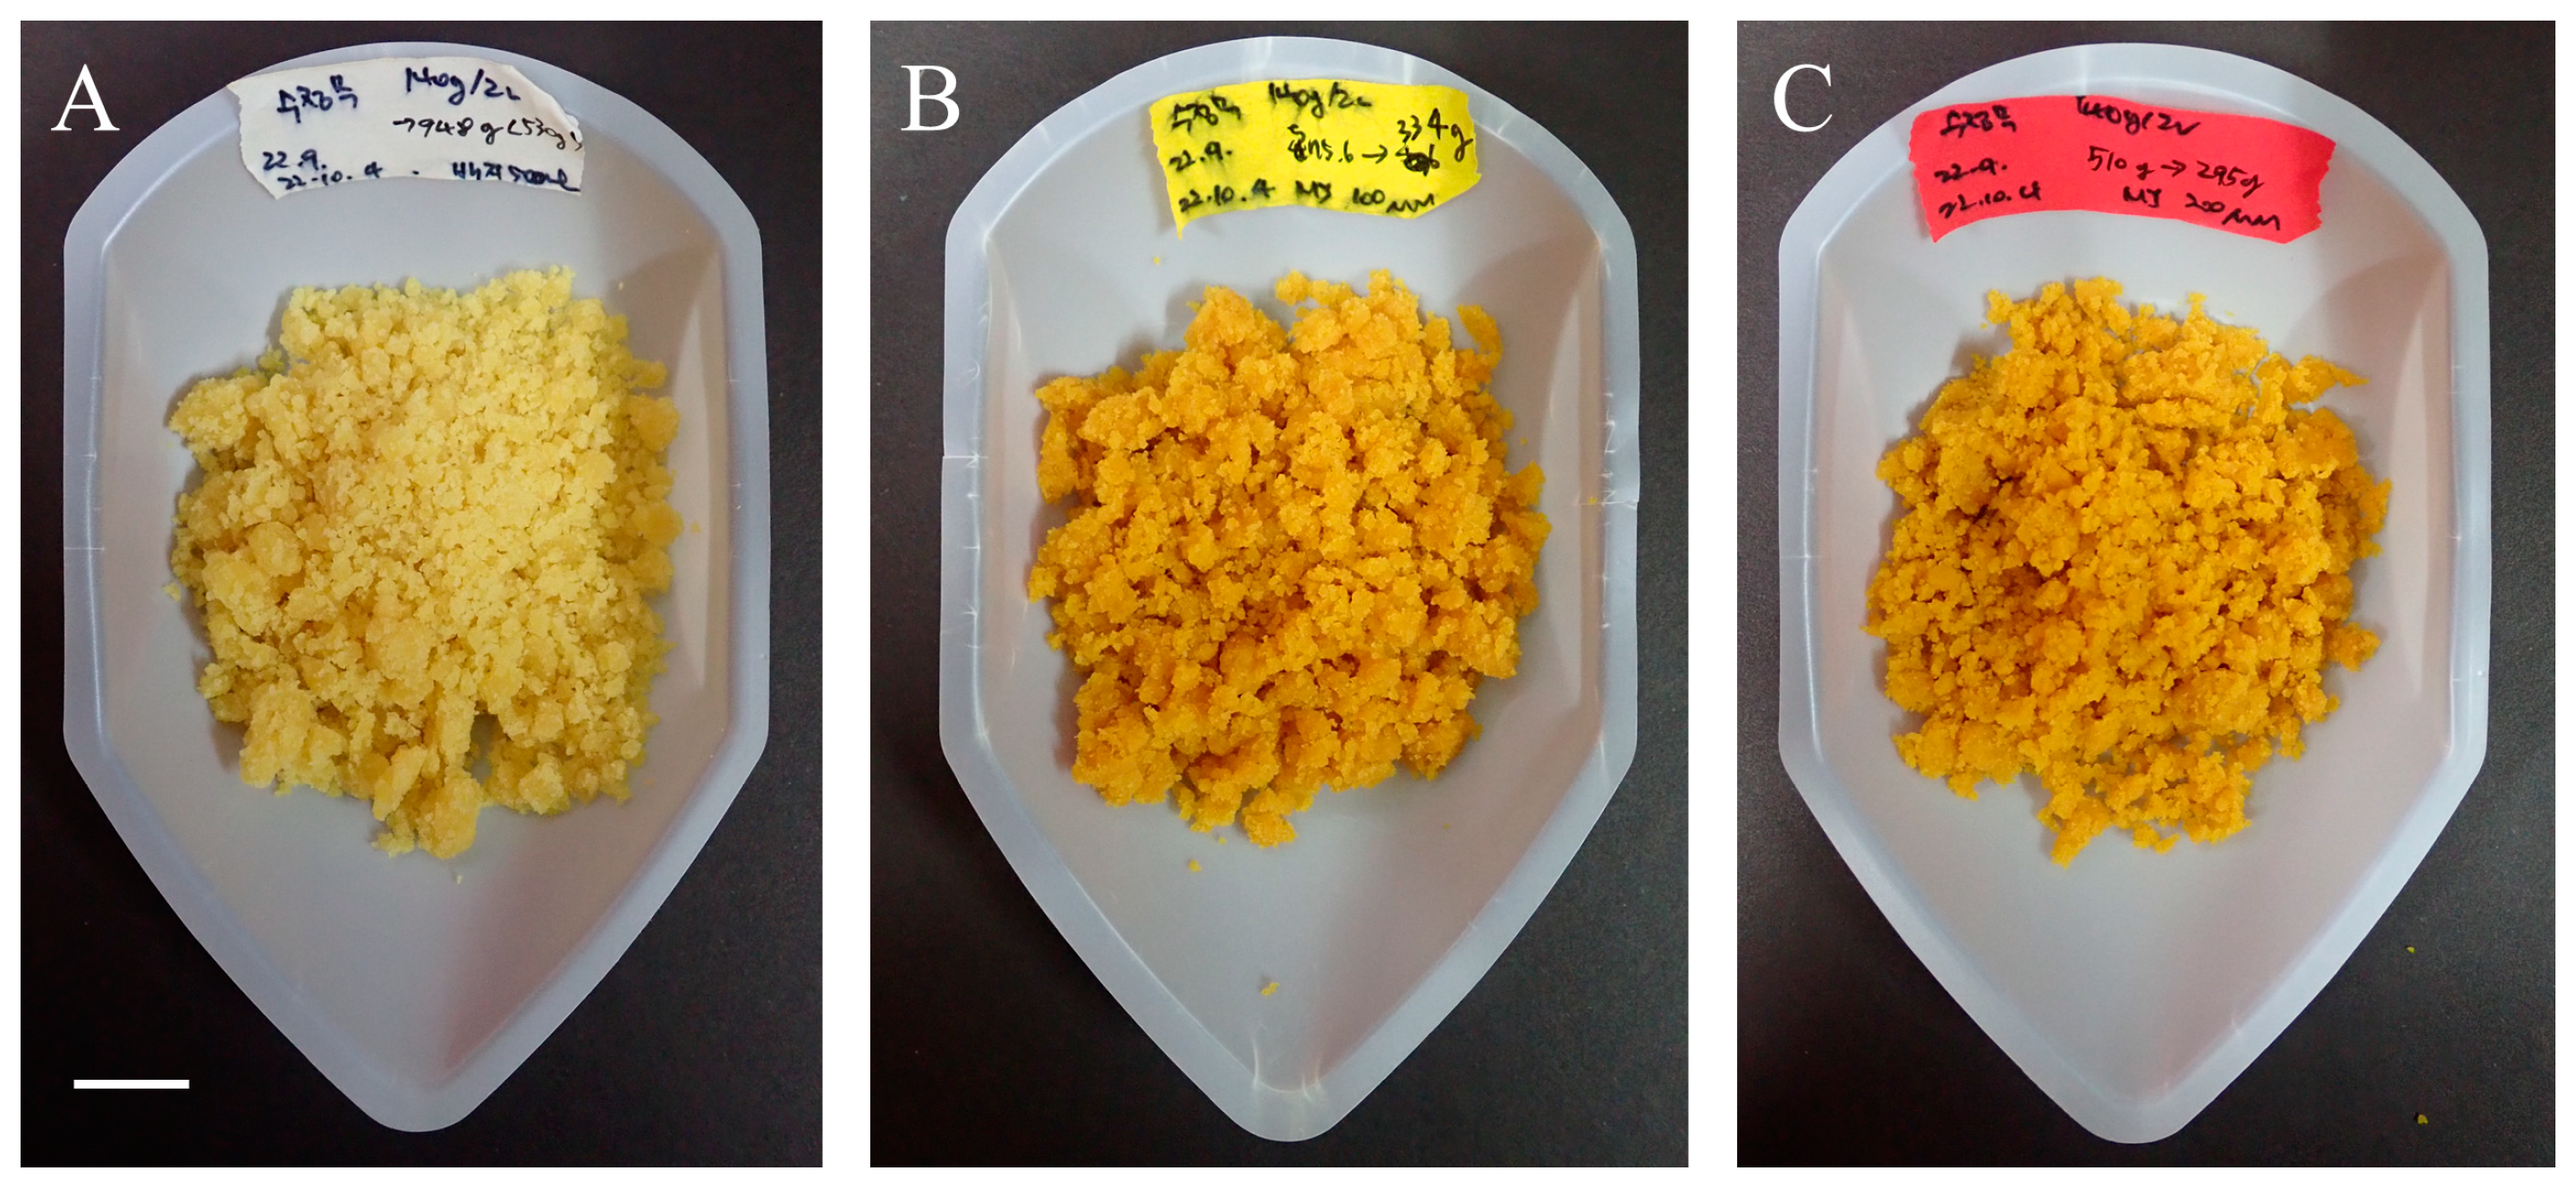
2.1. Effects of Methyl Jasmonate on Callus Proliferation

Fresh weight was the highest in the control group at 864.0 g, which was 1.5 (100 μM) and 1.7 (200 μM) times higher than that in the MeJA-treated calli (Figure 1A). There was no significant difference between the samples treated with two different MeJA concentrations. The dry weight was 1.3-times higher in the untreated group than in the 200 μM-treated group (Figure 1B). However, as the 100 μM treated group did not show a significant difference from the untreated group, it was considered more advantageous for producing bioactive compounds. Additionally, the color darkened depending on the MeJA concentration (Figure 2). MeJA increases the activity of phenylalanine ammonia lyase (PAL), cinnamate 4-hydroxylase (C4H), chalcone isomerase, stilbene synthase, and anthocyanin synthase, which produce secondary metabolites or inhibit reactive oxygen species (ROS) [18]. Browning is mainly associated with the accumulation of phenolics; phenols upon oxidation form compounds called quinones, which polymerize to give a characteristic brown color and inhibit plant cell growth [19]. Notably, MeJA application to the adventitious roots and calluses of various plants, such as Ajuga bracteosa [20], Thevetia peruviana [21], and Mentha × piperita [22], has been reported to reduce biomass and/or cause browning.

2.2. Rubiadin Production through Callus Suspension Cultures

Rubiadin, an anthraquinone found in numerous Rubiaceae family members, has excellent pharmacological properties, including anticancer, anti-inflammatory, antibacterial, antioxidant, and neuroprotective activities [23]. In particular, the chemical properties of rubiadin, a free aglycone with high liposolubility, increase absorption rates in the intestine and induce stronger bioavailability than that obtained with other anthraquinone glycosides [24]. Therefore, we primarily investigated the rubiadin contents in D. major leaves and calli.
As shown in Table 1, rubiadin was detected only in the calli of D. major. In response to MeJA elicitation, higher levels of rubiadin were observed with increasing MeJA concentration, showing 12.0- and 16.2-times higher levels in the 100 μM and 200 μM MeJA-treated calli than in the control calli. These high–performance liquid chromatograph (HPLC) results were in accordance with previous studies revealing the accumulation of anthraquinones in plant cell cultures with enhanced MeJA elicitation. For instance, Komaraiah et al. determined that 100 μM MeJA maximized the yield of anthraquinones in Morinda citrifolia calli, showing four times higher yields than in the control [14]. Perassolo et al. revealed that MeJA treatment induced higher levels of total anthroquinone in Rubia tinctorum hairy roots, with an increase of 130% [25]. Zhang et al. reported that 100 μM MeJA treatment in R. yunnanensis hairy roots increased the expression of 15 putative genes involved in anthraquinone synthesis, and some of these genes were positively correlated with the contents of rubiquinone and anthraquinone glycoside [26]. In agreement with previously reported results, our data support the idea that MeJA acts as a powerful signal inducer for anthraquinone production in D. major calli.

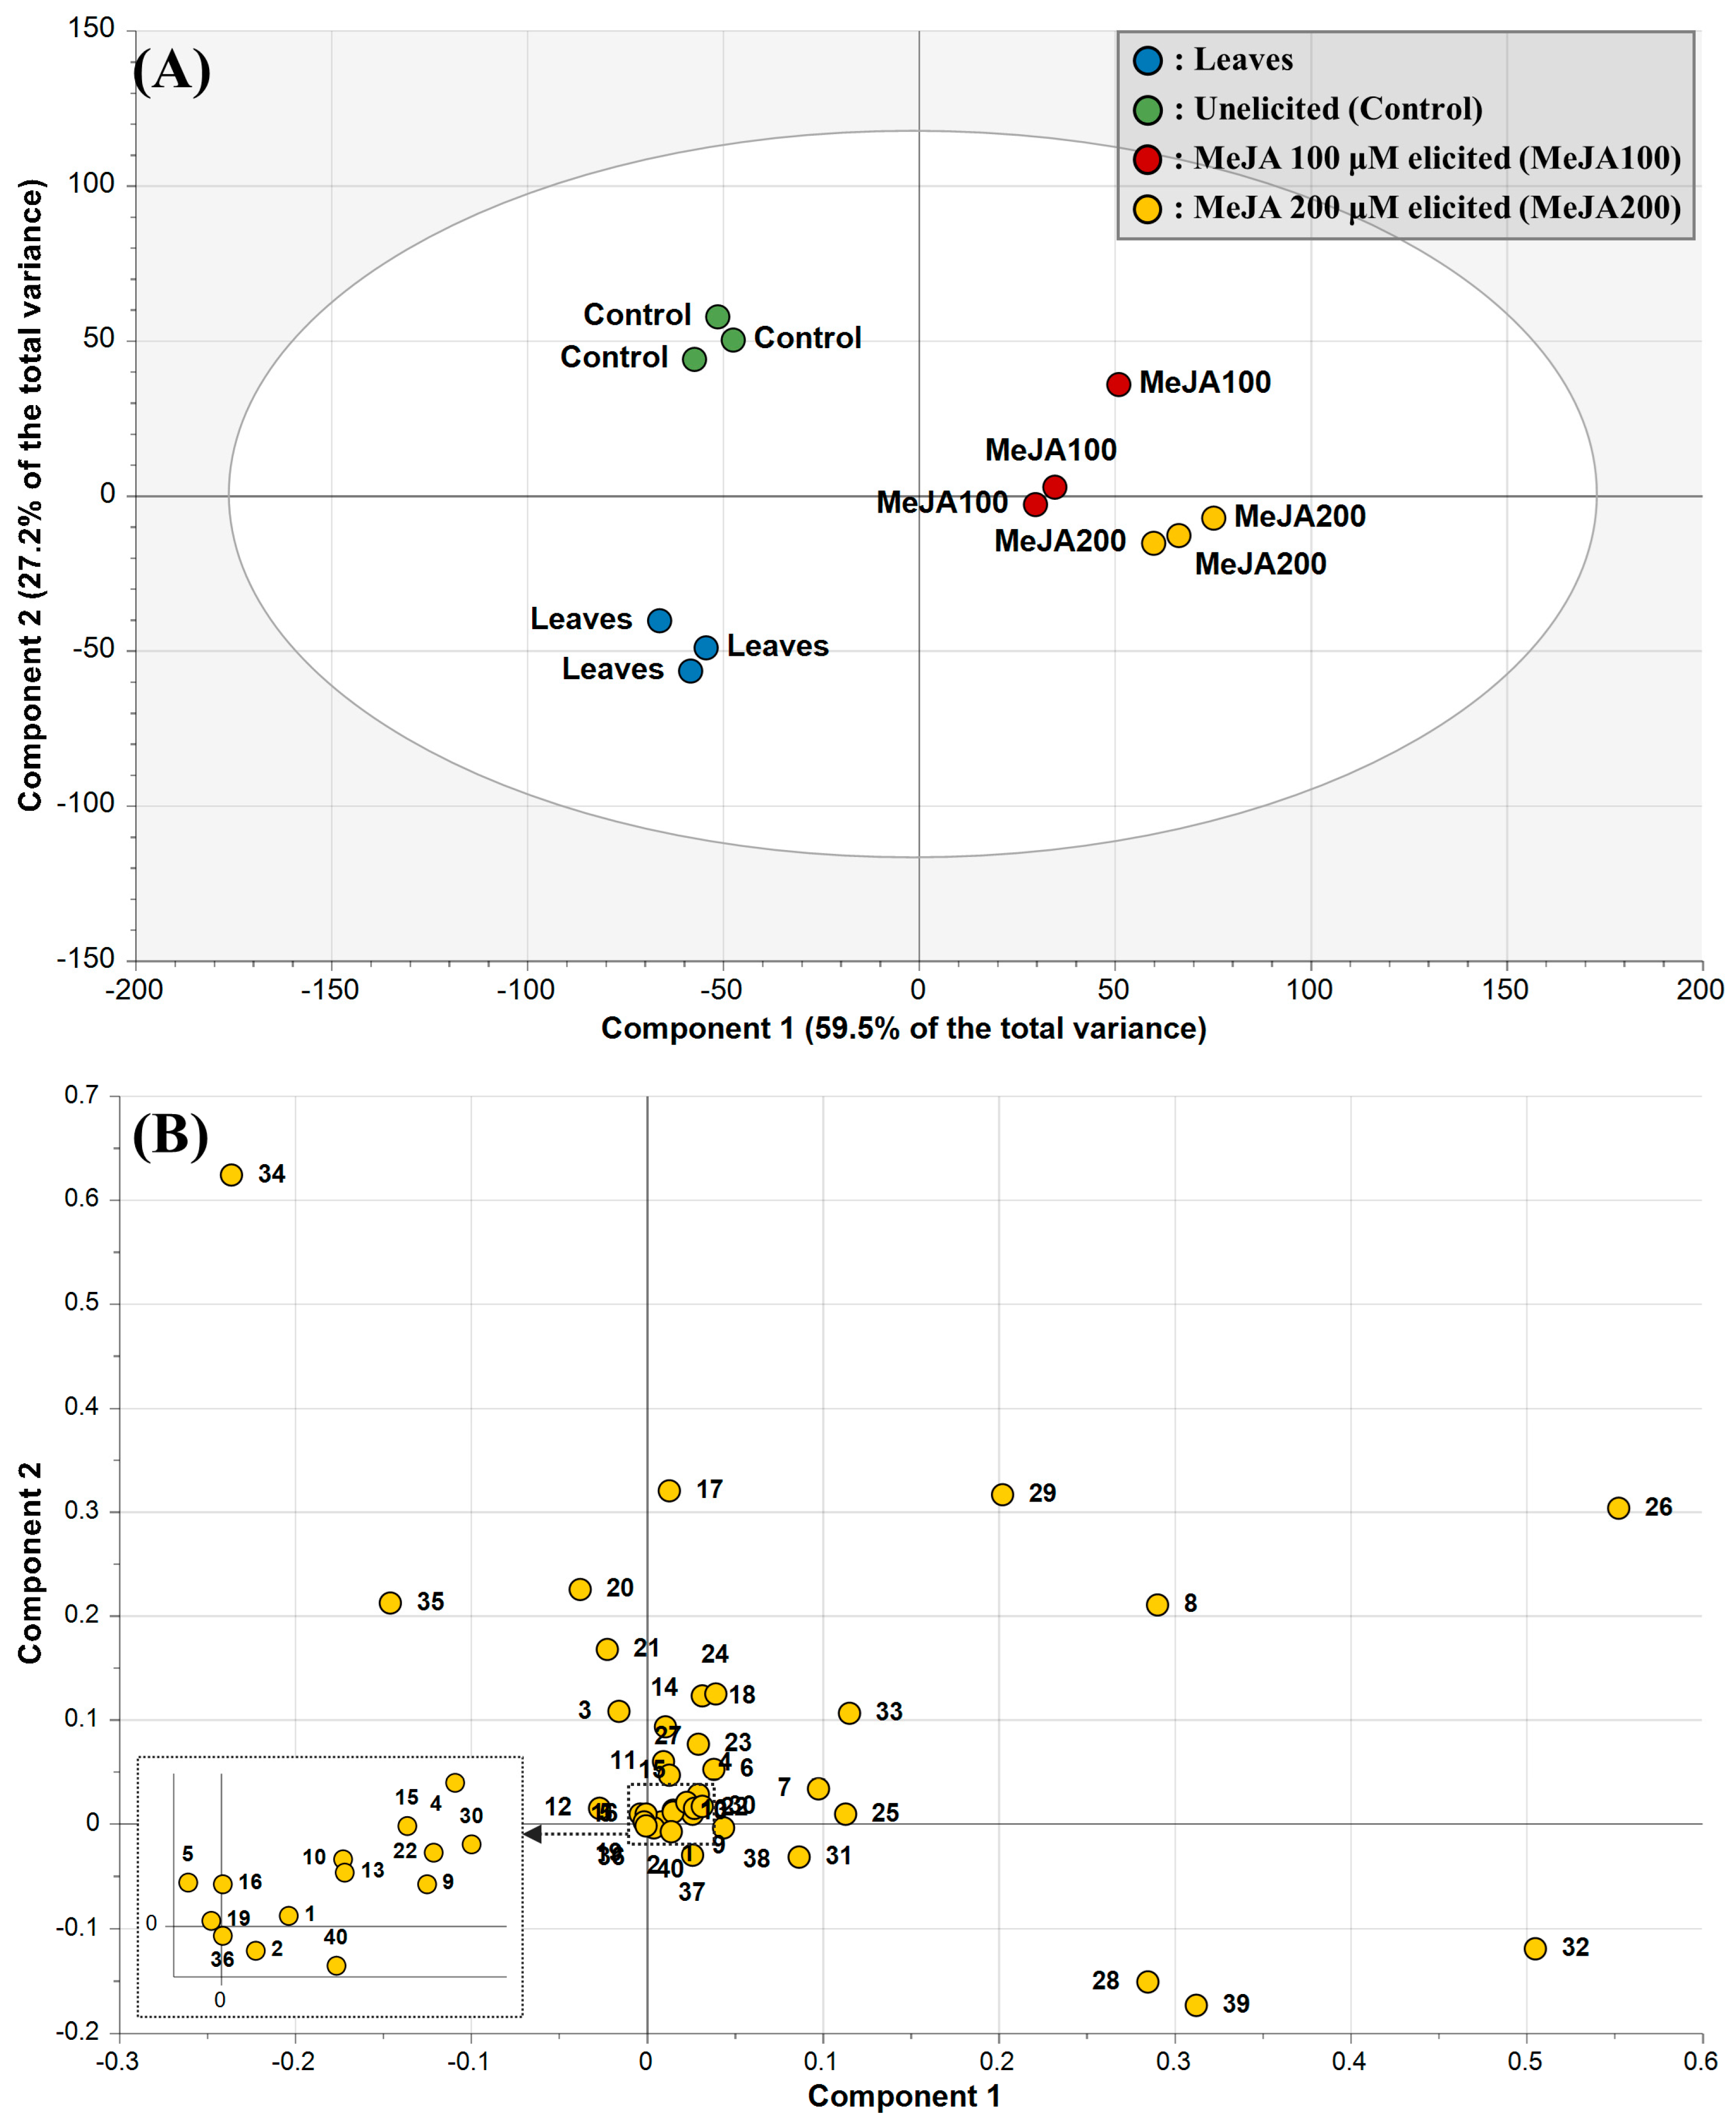
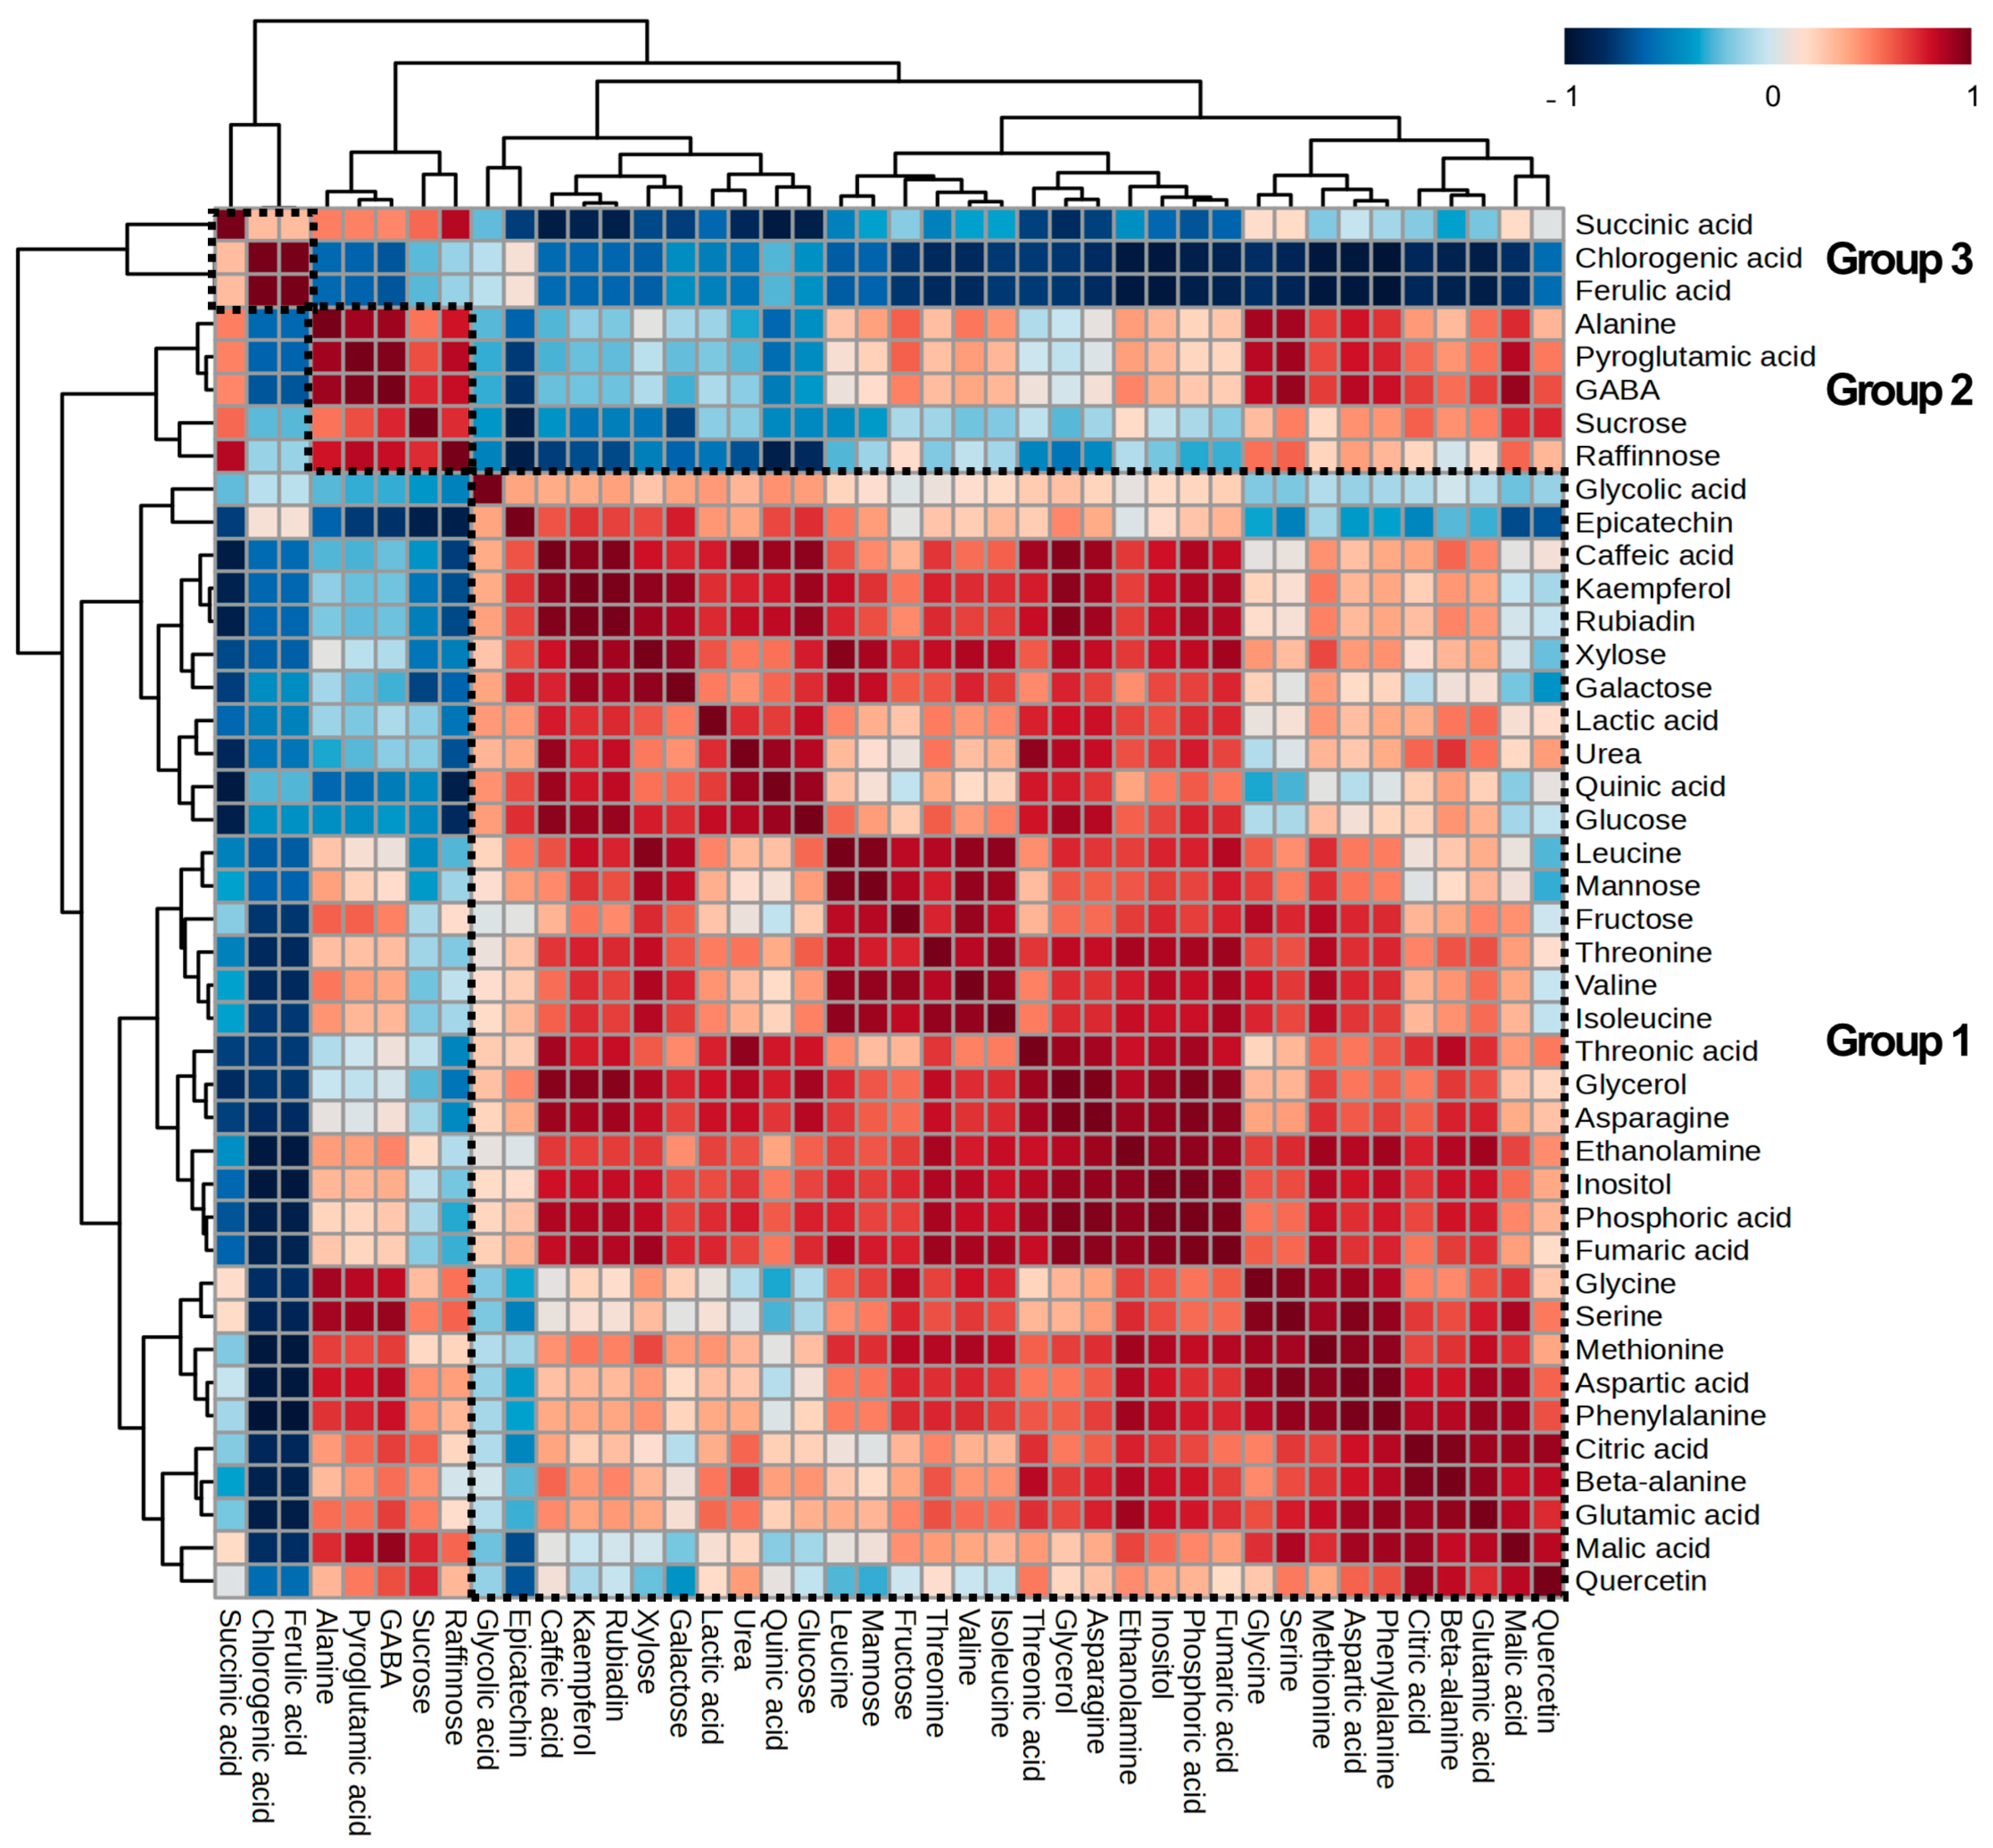
2.3. Principal Component Analysis and Metabolite–Metabolite Correlations

Through in vitro callus cultures of D. major treated with MeJA, we successfully produced rubiadin, which is a valuable metabolite. In addition to the present findings, MeJA elicitation has also been employed to generate phenolic compounds in various plant cell cultures such as Thevetia peruviana [21], Sageretia thea [27], and Cnidium officinale [28]. Phenolic compounds have attracted considerable attention in culture systems in vitro because they can manipulate biosynthetic routes and accumulate the desired metabolites [29]. They exhibit excellent antioxidant and other pharmacological activities including anti-inflammatory, antibacterial, antiviral, and antifungal properties [30]. However, the biosynthetic pathways of these specialized metabolites are quite complex and are comprehensively correlated with primary metabolites. Therefore, the fundamental quantitative differences in both primary metabolites (amino acids, organic acids, sugars, and sugar alcohols) (Table S1) and specialized metabolites (rubiadin and phenolic compounds) (Table S2) were analyzed to elucidate the overall metabolome patterns in D. major leaves and calli.
Among the various data processing strategies used in metabolomics, principal component analysis (PCA) is a well-known unsupervised dimensionality reduction method and the most widely used multivariate analysis method for extracting interpretative information from a total dataset [31,32]. Thus, the quantification data of 40 primary and specialized metabolites were subjected to PCA for holistic large-scale data analysis (Figure 3A). In the score plot, the two highest-ranking principal components (PCs) accounted for 86.7% of the total variance in the dataset. PC1 accounted for 59.5% of the total variance and separated all elicited D. major calli from unelicited D. major calli and D. major leaves. With PC2, which accounted for 27.2% of the total variance, D. major leaves were discriminated from unelicited D. major calli. The PCA score plot in the present study provided an overview of the sample clustering patterns but could not clearly distinguish 100 μM and 200 μM MeJA-treated calli. To further investigate the metabolites closely related to the PCs, the corresponding loadings in PC1 and PC2 were compared (Figure 3B). The preferential distribution of metabolites (asparagine, glucose, kaempferol, quinic acid, phosphoric acid, and fructose) in the first and fourth quadrants of the loading plot primarily accounted for differences in the elicited D. major calli. Moreover, the distribution in the second quadrant of the loading plot (sucrose and raffinose) represented variation in the unelicited D. major calli. In the case of D. major leaves, none of the other metabolites appeared to cause significant variation in the third quadrant of the loading plot. This result indicates that most of the primary and secondary metabolites were present at lower levels in D. major leaves than in D. major calli. This result supports the results of previous studies showing that in vitro calluses accumulate more sugars and amino acids owing to the easy availability of these compounds during their proliferation stage, allowing increased production of secondary metabolites [33,34].
Together with PCA, metabolite–metabolite correlation analysis plays a primary role in indicating the metabolite differences between samples and interpreting metabolite data related to metabolic pathways [35]. To decipher the relationships among 40 identified metabolites in D. major leaves and calli, we performed a hierarchical cluster analysis (HCA) using Pearson’s correlation coefficients (Figure 4). Metabolites located close to each other exhibited higher correlations and were represented by red color intensity. In the first group, most metabolites belonging to closely related biochemical pathways, including branched-chain amino acids (valine, leucine, and isoleucine), TCA cycle intermediates (citric acid, malic acid, and fumaric acid), monosaccharides (glucose, galactose, and xylose), and phenolic compounds (kaempferol, epicatechin, and caffeic acid), showed strong correlations. This correlation clustering showed the same pattern as that observed in the PCA loading plots, indicating that all the compounds were positive in PC1. In contrast, pyroglutamic acid, GABA, and alanine were positively correlated with di- and tri-saccharides (sucrose and raffinose) and clustered together in the second group rather than in the first, which included most amino acids. These results were consistent with the PCA results, indicating that these metabolites were located in the second quadrant of the PCA loading plot. Interestingly, both pyroglutamic acid and GABA are glutamic acid-derived amino acids that are used to increase plant resistance to abiotic stress [36,37]. In the third group, succinic acid, chlorogenic acid, and ferulic acid were clustered together. Overall, the observed metabolite–metabolite correlations helped elucidate the PCA results and reflected significant metabolite differences in D. major leaves and calli with respect to closely related biological pathways.

2.4. Major Metabolite Differences in Response to MeJA Treatment and Concentrations

Although the initial PCA and HCA results provided gross separation among the metabolite data obtained from D. major leaves and calli, they had limitations in exploring among-group or within-group variabilities [38]. A previous study reported that partial least squares-discriminant analysis (PLS-DA) is more suitable than PCA for measuring significantly different metabolites when analyzing more than two sample groups [39]. In order to clearly examine the role of MeJA elicitation, we adopted PLS-DA, which allows separation of classes based on their variables, which were unelicited callus, 100 μM MeJA-treated calli, and 200 μM MeJA-treated calli in the present case.
The PLS-DA score plot showed clear separation among the samples and explained 94.1% of the total variance, with 89.1% prediction goodness (Figure 5A). These results indicated that the PLS-DA model was reliable. The metabolite profiles of the unelicited and elicited calli were separated using PLS1, accounting for 75.4% of the total variance. In addition, 100 μM and 200 μM MeJA-treated calli were separated by PLS2, accounting for 18.6% of the total variance. In the loading column plot for PLS1, strong metabolites on the positive side with variable importance in the projection (VIP) value ≥ 0.8 included malic acid, pyroglutamic acid, sucrose, and raffinose, indicating higher levels in unelicited calli (Figure 5B and Figure S1A). In contrast, metabolites marked on the negative side of PLS1 with VIP values ≥ 0.8 included phosphoric acid, asparagine, quinic acid, glucose, and kaempferol, which were significant metabolites in elicited calli (both 100 μM and 200 μM MeJA-treated calli) (Figure 5B and Figure S1A). These properties caused by MeJA treatment might be attributed to a shift in the primary metabolism of plant cells toward specialized metabolism, followed by the upregulation of pathogenesis-related genes as well as higher endogenous sugars, and finally, a decrease in cell growth, producing phenolic compounds as defensive compounds (Figure 5B and Figure S2) [40]. As part of specialized metabolism, quinic acid, a phenolic acid derived from the phenylpropanoid pathway, was enhanced by the expression of PAL, C4H, and 4-coumarate CoA ligase in response to MeJA elicitation, as revealed in Gardenia jasminoides cells [41]. Moreover, endogenous phenolic acids triggered the synthesis of flavonoids by inducing oxidative stress in Coriandrum sativum calli [42]. In sugar metabolism, sucrose and raffinose are the commonly used di- and tri-saccharide carbohydrate sources, respectively, required for flavonoid production [43,44]. Consistent with previous studies, subsequent glycolysis and gluconeogenesis after the exogenous application of phytohormones also increased glucose content to facilitate defense mechanisms [45,46]. Higher levels of asparagine and lower levels of pyroglutamic acid and malic acid were observed after MeJA treatment. Similarly, a recent investigation involving the metabolite profiling of elicited Salvia miltiorrhiza showed upregulated asparagine and glutamic acid, implying that the conversion of glutamic acid to pyroglutamic acid was stopped [46]. When elicited with MeJA, a lower concentration of malic acid might be linked with the utilization of precursors in other related pathways; however, this cannot be clearly explained by their ecological functions or through common catabolic phenomena, such as protein degradation [47]. Consistent with these previous studies, our results indicated that MeJA elicitation reorganized various primary metabolites (including central carbons, amino acids, and sugars) as well as specialized metabolites in D. major calli, and that these metabolic strategies were significantly linked to defensive mechanisms against elicitation.
Considering the effects of MeJA concentration, a loading column plot for PLS2 marked on positive side with VIP values ≥ 0.8 indicated the main metabolites that were significantly higher in 100 μM MeJA-treated calli, including sucrose, quinic acid, glucose, asparagine, malic acid, and phosphoric acid (Figure 5C and Figure S1B). Further, the metabolites presenting strong negative values of PLS2 with VIP values ≥ 0.8 included fructose, raffinose, and kaempferol, explaining their significantly higher values in 200 μM MeJA-treated calli (Figure 5C and Figure S1B). Consistent with the above results regarding metabolic changes induced by MeJA, kaempferol content increased and that of sucrose and malic acid decreased in response to elevated MeJA treatment concentrations (Figure 5C and Figure S2). Related to the morphogenic characteristics of D. major calli under elicitation with 200µM MeJA, our results showed that excessive MeJA treatment reduced the growth index and that the calli underwent oxidative stress, which overwhelmed their own antioxidant capabilities (Figure 1). Further, the metabolite differences presented in PLS2 were that D. major calli treated with 200µM MeJA contained higher levels of raffinose and fructose but lower levels of glucose, quinic acid, asparagine, and phosphoric acid, compared with those in calli treated with 100 µM MeJA (Figure 5C and Figure S2). Although MeJA is widely utilized as a signaling molecule for regulating plant growth and the production of specialized metabolites, over-exploitation of MeJA often leads to cell growth inhibition, which might be caused by inhibitory photosynthesis [48]. These results are further supported by those of ElSayed et al., who reported that raffinose levels in chloroplasts were significantly higher upon exposure to excessive abiotic stress [49]. Consistent with our results, another report mentioned that although both fructose and glucose were decomposition products of sucrose, glucose was utilized for monosaccharide metabolism in Salvia miltiorrhiza cells under prolonged exposure to the elicitor [50]. Another study also reported that asparagine metabolism was upregulated with 100 µM MeJA to activate the aminoacyl-tRNA biosynthesis pathway, which is a critical pathway in the plant stress response and is responsible for the attachment of amino acids such as asparagine and 4-aminobutyrate [51]. However, this pathway was dramatically decreased upon adding 200 µM MeJA as asparagine was altered to stimulate specialized metabolite production [51]. As 200 µM MeJA increased the accumulation of asparagine, which acts as an enzyme stimulator, quinic acid entered the phenylpropanoid pathway and was altered to other specialized metabolites [52,53]. Thus, MeJA dose-response experiments were important for discovering an efficient alternative method for producing specialized metabolites with improved cell growth rates.

3. Materials and Methods

3.1. Callus Production and Elicitation

D. major calli were maintained in suspension cultures in Murashige and Skoog (MS) [54] liquid medium supplemented with 16.11 μM α-naphthaleneacetic Acid (NAA), 0.46 μM kinetin, and 3% sucrose. A 5 L bioreactor containing 2.5 L of medium was cultured with 70.0 g fresh weight (FW)/L calli, and sterilized air was continuously supplied at 0.1 vvm (aeration volume/medium volume/minute). Methyl jasmonate (MeJA, Sigma Chemical Co., MO, USA) stock solutions (1000 μM) were prepared in absolute ethanol and filter-sterilized. MeJA was added to D. major calli after 2 weeks of culture at 100 μM or 200 μM. The two most commonly used concentrations of MeJA (100 μM and 200 μM) were chosen on the basis of previous studies (Table S3). The calli were then harvested after 1 week of elicitor treatment. All cultures were maintained at 25 ± 1 °C in the dark. The callus biomass was measured after 3 weeks of culture, and the fresh weight (FW) was determined after washing the calli with distilled water and removing excess surface water. Dry weight (DW) was recorded after drying the callus in an oven at 40 °C for 48 h. The growth index (GI) was calculated as follows:
GI = [Final DW (g) − Initial DW (g)]/Initial DW (g)

3.2. Preparation of Plant Materials

D. major leaves were collected from Seogwipo-si, Jeju, Republic of Korea, on 30 September 2022. The harvested leaves and calli were dried using an oven at 40 °C and then ground to fine powder in a mechanical grinder. Prior to compound extraction, each sample was passed through a 200 μm sieve. For each analysis, three biological replicates were analyzed under identical conditions.

3.3. Extraction and Analysis of Rubiadin

Rubiadin analysis was conducted as previously described with some modifications [55,56]. Dried and ground D. major leaves and calli (approximately 10 g) were extracted with 200 mL of 70% ethanol (v/v) for 24 h in a rotary shaker. After filtering through a filter paper (No. 2; Advantec, Tokyo, Japan), the extracts were evaporated and freeze-dried. Powdered sample extracts (10 mg) were dissolved in 1 mL of 50% methanol (v/v) and sonicated for 10 min. The final extracts were then filtered through a 0.50 µm PTFE syringe filter (13JP010AN; Advantec) for HPLC analysis. Chromatographic separation was performed on a Waters Alliance e2695 HPLC system (Waters Corp., Milford, MA USA) equipped with a photodiode array (PDA) detector, and a Sunfire C18 column (250 × 4.6 mm, 5 μm particle size; Waters Corp., Milford, MA, USA). The injection volume was 10 µL, and the column temperature was maintained at 40 °C. The flow rate was set at 1 mL/min. The solvent gradient was formed using 0.1% of phosphoric acid in water (v/v) as solvent A and acetonitrile as solvent B, and was consecutively programmed as follows: 0 min–20% B; 10 min–20% B; 30 min–100% B; 40 min–100% B; 41 min–20% B; 50 min–20% B. HPLC chromatograms were monitored in the wavelength range of 200–400 nm. For quantitative analysis, peaks were obtained at 250 nm and identified by comparing the retention times and PDA spectra with those of an authentic standard. An external calibration curve was constructed by loading rubiadin in the range of 2.5–50 μg/mL. Chromatographic data were obtained using Empower 3 software (Waters Corp.).

3.4. Extraction and Analysis of Phenolic Compounds

The phenolic compounds were extracted and analyzed as described in our previous study, with slight modifications [57,58]. For extracting phenolic compounds, 70 mg of powdered samples was weighed and placed in 2 mL tubes. To this, 1 mL of methanol and 200 μL of 0.1 M hydrochloric acid (HCl) were added followed by sonication for 1 h. The samples were centrifuged at 4 °C and 15,000 rpm for 10 min, and then 850 μL of the supernatants was transferred to fresh tubes. The remaining pellet was re-extracted with methanol (1 mL) and sonicated for 1 h. After centrifugation at 4 °C and 15,000 rpm for 10 min, 1 mL of the supernatants was concentrated together with 850 μL of previously collected supernatants using a centrifugal evaporator (CVE-3000; EYELA, Tokyo, Japan). The resulting extracts were dissolved in 1 mL of methanol and then filtered through a 0.50 µm PTFE syringe filter (Adventac). For the analysis, 10 μL of filtrate was injected into a Waters Alliance e2695 HPLC system (Waters Corp.) coupled with a PDA detector. Separations were performed on a Zorbax SB-C18 column (250 × 4.6 mm, 5 μm particle size; Agilent, Palo Alto, CA, USA) at 40 °C with a flow rate of 1 mL/min. Mobile phase solvents A and B were 0.1% acetic acid in water (v/v) and acetonitrile, respectively. The solvent gradient conditions were programmed as follows: 0 min–8% B; 2 min–10% B; 50 min–28% B; 55 min–92% B; 60 min–92% B; 70 min–8% B. Chromatograms were observed in the range of 200–400 nm, and the detection wavelength was set at 280 nm. Each compound was identified by matching the retention times and spectral characteristics to those of authentic standards. Each analysis was externally calibrated by loading standard solutions with concentrations ranging from 2.5 to 80 μg/mL. Data were acquired using Empower 3 software (Waters Corp.).

3.5. Extraction and Analysis of Low-Molecular Hydrophilic Compounds

Low-molecular-weight hydrophilic compounds (including amino acids, organic acids, sugars, and sugar alcohols) were extracted and analyzed using our previously reported methods [57,58]. For extraction, 1 mL of a methanol:chloroform:water (2.5:1:1, v/v/v) solution was added to 15 mg of each sample. Subsequently, 60 μL of adonitol (200 μg/mL in methanol) was added as an internal standard (IS). The samples were then vortexed and incubated in a thermo shaker at 37 °C and 1200 rpm for 30 min. After centrifugation at 4 °C and 13,000 rpm for 3 min, 800 μL of supernatant was transferred into fresh tubes, and 400 μL of water was added. The mixed samples were centrifuged under the conditions described above. Next, 900 μL of the upper methanol/water phase was transferred into fresh tubes and then dried in a centrifugal concentrator (CVE-3000; EYELA) for 3 h. After lyophilization for 16 h, methoxime derivatization was performed by adding 80 μL of methoxyamine hydrochlorides (20 mg/mL in pyridine) and incubating in a thermo shaker at 30 °C and 1200 rpm for 90 min. Trimethylsilyl esterification was subsequently performed by introducing 80 μL of N-methyl-N-(trimethylsilyl) trifluoroacetamide and incubating in a thermo shaker at 37 °C and 1200 rpm for 30 min. The derivatized samples were analyzed using an Agilent 7890A gas chromatograph (GC) (Agilent, Palo Alto, CA, USA) equipped with an Agilent 5975C mass spectrometer (MS) on a CP-Sil 8CB low-bleed/MS fused-silica capillary column (30 m × 0.25 mm i.d. × 0.25 μm film thickness; Agilent). For each analysis, 1 μL of sample was injected with a split ratio of 25:1. The inlet temperature was set at 230 °C. Helium was used as the carrier gas, flowing at a constant rate of 1.00 mL/min. The column temperature was programmed as follows: the initial temperature was set at 80 °C for 2 min, followed by ramping to 320 °C at 15 °C/min, and holding at 320 °C for 10 min. The MS quadrupole and ion source temperatures were set as 150 °C and 230 °C, respectively. Mass spectra were scanned in the range of 85–600 m/z. The ionization voltage was set as 70 eV. Peaks were identified by comparing the mass spectral data of each sample with those of the NIST and in-house libraries. For quantification, the ratios of the analyte to the IS peak area were calculated for selected ions.

3.6. Statistical Analysis

All analyses were performed in triplicate. The experimental data for rubiadin were analyzed using analysis of variance (ANOVA), and significant differences among means were identified using Tukey’s multiple-range test (GraphPad Prism 8; San Diego, CA, USA). Using soft independent modeling of class analogy (SIMCA) software (version 17.0, Umetrics, Umeå, Sweden), all data were normalized using Pareto scaling; PCA and PLS-DA were subsequently performed to reveal relationships among or within group variances. HCA and Pearson’s correlation analyses were performed using MetaboAnalyst 5.0 (https://www.metaboanalyst.ca (accessed on 4 December 2023)) to identify metabolite–metabolite correlations. For pathway analysis, the normalized metabolic abundance data were visualized on a metabolic pathway through Pathvisio Software (version 3.3.0, http://www.pathvisio.org, Maastricht University, Maastricht, The Netherlands (accessed on 4 December 2023)).

4. Conclusions

Overall, this study described the metabolic differences between D. major leaves and callus cultures treated with different concentrations of MeJA. First, we compared the growth characteristics of D. major calli to determine suitable MeJA concentrations for high production rates. We found that there was no significant difference in the biomass reduction of D. major calli upon treatment with 100 µM MeJA, and that browning occurred in a MeJA concentration-dependent manner. Using the callus culture technique with MeJA elicitation, we produced rubiadin, an anthraquinone with various biological activities. Rubiadin was not observed in D. major leaves; however, the rubiadin content in D. major calli increased with increasing levels of MeJA. Further, multivariate analysis to distinguish significant differences in the levels of primary and specialized metabolites in D. Major leaves and calli treated with different elicitors revealed that the in vitro calli had higher amino acid, sugar, and phenolic compound levels than those in D. major leaves, explained by the availability of these primary metabolites in their proliferation stage; these then stimulated the production of functional specialized metabolites. Further, our results indicated that MeJA elicitation contributed to activate the production of kampferol and quinic acid as defensive mechanisms, followed by degradation of sucrose and raffinose to glucose for exploiting them as energy sources. Moreover, elicitation decreased the conversion to pyroglutamic acid and increased asparagine metabolism. Concerning the MeJA treatment concentration, 200 µM MeJA-treated calli also featured high amounts of asparagine, which was ascribed to aminoacyl-tRNA biosynthesis pathway activated by the attachment of asparagine to respective transfer RNAs. Moreover, lower levels of glucose and sucrose and a higher level of fructose were observed in the 200 µM MeJA-treated calli, because glucose is more utilized than fructose as a decomposition product of sucrose in monosaccharide metabolism with excessive stress. Overall, our results suggest that 100 µM MeJA treatment of D. Major calli can be the best strategy for increasing valuable specialized metabolites with maintained production rates. The obtained insights will facilitate optimization of plant cell culture techniques for improved biosynthesis of anthraquinones and flavonoids.

Supplementary Materials

The following supporting information can be downloaded at: https://www.mdpi.com/article/10.3390/plants13020167/s1, Figure S1: The influence of variables in projection plots displaying contributed metabolites to construct partial least squares (PLS) 1 (A) and 2 (B) from partial least squares discriminant analysis (PLS-DA) results obtained from leaves and calli treated with different methyl jasmonate (MeJA) concentrations; Figure S2: Metabolic pathways of D. major calli treated with various methyl jasmonate (MeJA) concentrations. Metabolite differences were visualized as the scaling factor ranges from −1.8 to 1.8. A scaling value above zero represents higher than average levels in each value of the control, MeJA 100 μM-treated calli, and MeJA 200 μM-treated calli, and is colored by the red color intensity. A scaling value below zero represents lower than the average levels and is indicated by green color intensity. Gray color represents not detected metabolites; Table S1: Composition and content (ratio/g) of low-molecular hydrophilic compounds in D. major leaves and calli treated with different methyl jasmonate (MeJA) concentrations; Table S2: Composition and content (μg/g) of phenolic compounds in D. major leaves and calli treated with different methyl jasmonate (MeJA) concentrations; Table S3: Suitable concentrations of methyl jasmonate (MeJA) in cell cultures of various plants. References [59,60,61,62,63,64,65,66,67,68,69,70] are cited in the supplementary materials.

Author Contributions

Conceptualization, S.-A.Y. and Y.-M.H.; methodology, H.H., E.B.J. and S.C.K.; formal analysis, H.H., E.B.J. and S.C.K.; investigation, B.G. and H.B.H.; resources, E.B.J. and J.-D.L.; data curation, H.H., E.B.J. and Y.-M.H.; writing—original draft preparation, H.H. and E.B.J.; writing—review and editing, H.H. and Y.-M.H.; visualization, H.H. and E.B.J.; supervision, Y.-M.H.; project administration, Y.-M.H.; funding acquisition, Y.-M.H. All authors have read and agreed to the published version of the manuscript.

Funding

This research was funded by the Ministry of Trade, Industry, and Energy (MOTIE), Republic of Korea, under the “Regional Cooperation Innovative Growth R&D Program” (R&D, P0021579) supervised by the Korea Institute for Advancement of Technology (KIAT).

Data Availability Statement

The data presented in this study are available upon request from the corresponding author.

Conflicts of Interest

The authors declare no conflicts of interest.

References

  1. Jang, Y.-J.; Park, J.-S.; Lee, J.-S.; Lee, J.-Y.; Choi, B.-H. Re-Examination of the Vascular Plants on Hongdo Island, Korea. Korean J. Plant Taxon. 2021, 51, 205–249. [Google Scholar] [CrossRef]
  2. Tao, C.; Hua, Z.; Jiarui, C.; Taylor, C.M.; Ehrendorfer, F.; Lantz, H.; Funston, A.M.; Puff, C. Rubiaceae. In Flora of China; Wu, Z.Y., Raven, P.H., Hong, D.Y., Eds.; Science Press: Beijing, China; Missouri Botanical Garden Press: St. Louis, MI, USA, 2011; Volume 19, pp. 654–656. [Google Scholar]
  3. Lou, S.; Li, H.; Qin, X.; Huang, Z.; Jiang, S.; Huang, X. The Complete Chloroplast Genome of Damnacanthus indicus CF Gaertn. (Rubiaceae). Mitochondrial DNA Part B 2021, 6, 1251–1252. [Google Scholar] [CrossRef]
  4. Han, E.-K.; Cho, W.-B.; Tamaki, I.; Choi, I.-S.; Lee, J.-H. Comparative Mitogenomic Analysis Reveals Gene and Intron Dynamics in Rubiaceae and Intra-Specific Diversification in Damnacanthus indicus. Int. J. Mol. Sci. 2021, 22, 7237. [Google Scholar] [CrossRef] [PubMed]
  5. Wei, J.; Ma, X.; Wang, Y.; Nong, B.; Tang, C.; Lu, J.; Zhao, F. Analysis and Study on Quality Control of Yao Medicine Damnacanthus macrophyllus Based on Methods in Chinese Pharmacopoeia. Med. Plant 2021, 12, 40–43. [Google Scholar] [CrossRef]
  6. Suksungworn, R.; Duangsrisai, S. Phytochemical Contents and Antioxidant Activity of Medicinal Plants from the Rubiaceae Family in Thailand. Plant Sci. Today 2021, 8, 24–31. [Google Scholar] [CrossRef]
  7. Murthy, H.N.; Joseph, K.S.; Paek, K.Y.; Park, S.Y. Anthraquinone Production from Cell and Organ Cultures of Rubia Species: An Overview. Metabolites 2022, 13, 39. [Google Scholar] [CrossRef] [PubMed]
  8. Das, B.P.; Ghosh, A. Medicinal Properties of Phyto-Constituents from Rubiaceae Family of Assam: Critical Review. Int. J. Appl. Chem. Biol. Sci. 2020, 1, 1–25. [Google Scholar]
  9. D’Amelia, V.; Docimo, T.; Crocoll, C.; Rigano, M.M. Specialized Metabolites and Valuable Molecules in Crop and Medicinal Plants: The Evolution of their use and Strategies for their Production. Genes 2021, 12, 936. [Google Scholar] [CrossRef]
  10. Benjamin, E.D.; Ishaku, G.A.; Peingurta, F.A.; Afolabi, A.S. Callus Culture for the Production of Therapeutic Compounds. Am. J. Plant Biol. 2019, 4, 76–84. [Google Scholar] [CrossRef]
  11. Efferth, T. Biotechnology Applications of Plant Callus Cultures. Engineering 2019, 5, 50–59. [Google Scholar] [CrossRef]
  12. Jeyasri, R.; Muthuramalingam, P.; Karthick, K.; Shin, H.; Choi, S.H.; Ramesh, M. Methyl Jasmonate and Salicylic Acid as Powerful Elicitors for Enhancing the Production of Secondary Metabolites in Medicinal Plants: An Updated Review. Plant Cell Tiss. Organ Cult. 2023, 153, 447–458. [Google Scholar] [CrossRef] [PubMed]
  13. Naik, P.M.; Al-Khayri, J.M. Abiotic and biotic elicitors–role in secondary metabolites production through in vitro culture of medicinal plants. In Abiotic and Biotic Stress in Plants-Recent Advances and Future Perspectives; Shanker, A.K., Shanker, C., Eds.; IntechOpen Limited: London, UK, 2016; pp. 247–277. [Google Scholar] [CrossRef]
  14. Komaraiah, P.; Kishor, P.K.; Carlsson, M.; Magnusson, K.; Mandenius, C. Enhancement of Anthraquinone Accumulation in Morinda Citrifolia Suspension Cultures. Plant Sci. 2005, 168, 1337–1344. [Google Scholar] [CrossRef]
  15. Khoo, S.H.G.; Al-Rubeai, M. Metabolomics as a Complementary Tool in Cell Culture. Biotechnol. Appl. Biochem. 2007, 47, 71–84. [Google Scholar] [CrossRef]
  16. Salam, U.; Ullah, S.; Tang, Z.; Elateeq, A.A.; Khan, Y.; Khan, J.; Khan, A.; Ali, S. Plant Metabolomics: An Overview of the Role of Primary and Secondary Metabolites Against Different Environmental Stress Factors. Life 2023, 13, 706. [Google Scholar] [CrossRef] [PubMed]
  17. Twaij, B.M.; Hasan, M.N. Bioactive Secondary Metabolites from Plant Sources: Types, Synthesis, and their Therapeutic Uses. Int. J. Plant Biol. 2022, 13, 4–14. [Google Scholar] [CrossRef]
  18. Nabi, N.; Singh, S.; Saffeullah, P. Responses of in Vitro Cell Cultures to Elicitation: Regulatory Role of Jasmonic Acid and Methyl Jasmonate: A Review. Vitr. Cell. Dev. Biol. Plant 2021, 57, 341–355. [Google Scholar] [CrossRef]
  19. Chaudhary, G.; Dantu, P.K. Evaluation of Callus Browning and Develop a Strategically Callus Culturing of Boerhaavia diffusa L. J. Plant Develop. 2015, 22, 47–58. [Google Scholar]
  20. Saeed, S.; Ali, H.; Khan, T.; Kayani, W.; Khan, M.A. Impacts of Methyl Jasmonate and Phenyl Acetic Acid on Biomass Accumulation and Antioxidant Potential in Adventitious Roots of Ajuga bracteosa Wall Ex Benth., a High Valued Endangered Medicinal Plant. Physiol. Mol. Biol. Plants 2017, 23, 229–237. [Google Scholar] [CrossRef]
  21. Mendoza, D.; Cuaspud, O.; Arias, J.P.; Ruiz, O.; Arias, M. Effect of Salicylic Acid and Methyl Jasmonate in the Production of Phenolic Compounds in Plant Cell Suspension Cultures of Thevetia peruviana. Biotechnol. Rep. 2018, 19, e00273. [Google Scholar] [CrossRef]
  22. Krzyzanowska, J.; Czubacka, A.; Pecio, L.; Przybys, M.; Doroszewska, T.; Stochmal, A.; Oleszek, W. The Effects of Jasmonic Acid and Methyl Jasmonate on Rosmarinic Acid Production in Mentha× Piperita Cell Suspension Cultures. Plant Cell Tiss. Organ Cult. 2012, 108, 73–81. [Google Scholar] [CrossRef]
  23. Watroly, M.N.; Sekar, M.; Fuloria, S.; Gan, S.H.; Jeyabalan, S.; Wu, Y.S.; Subramaniyan, V.; Sathasivam, K.V.; Ravi, S.; Mat Rani, N.N.I. Chemistry, Biosynthesis, Physicochemical and Biological Properties of Rubiadin: A Promising Natural Anthraquinone for New Drug Discovery and Development. Drug Des. Devel. Ther. 2021, 15, 4527–4549. [Google Scholar] [CrossRef] [PubMed]
  24. Wang, D.; Wang, X.; Yu, X.; Cao, F.; Cai, X.; Chen, P.; Li, M.; Feng, Y.; Li, H.; Wang, X. Pharmacokinetics of Anthraquinones from Medicinal Plants. Front. Pharmacol. 2021, 12, 638993. [Google Scholar] [CrossRef] [PubMed]
  25. Perassolo, M.; Cardillo, A.B.; Mugas, M.L.; Montoya, S.C.N.; Giulietti, A.M.; Talou, J.R. Enhancement of Anthraquinone Production and Release by Combination of Culture Medium Selection and Methyl Jasmonate Elicitation in Hairy Root Cultures of Rubia tinctorum. Ind. Crops Prod. 2017, 105, 124–132. [Google Scholar] [CrossRef]
  26. Zhang, R.; Miao, Y.; Chen, L.; Yi, S.; Tan, N. De Novo Transcriptome Analysis Reveals Putative Genes Involved in Anthraquinone Biosynthesis in Rubia yunnanensis. Genes 2022, 13, 521. [Google Scholar] [CrossRef]
  27. Kim, J.-H.; Han, J.-E.; Murthy, H.N.; Kim, J.-Y.; Kim, M.-J.; Jeong, T.-K.; Park, S.-Y. Production of Secondary Metabolites from Cell Cultures of Sageretia thea (Osbeck) MC Johnst. using Balloon-Type Bubble Bioreactors. Plants 2023, 12, 1390. [Google Scholar] [CrossRef] [PubMed]
  28. Ho, T.-T.; Murthy, H.N.; Park, S.-Y. Methyl Jasmonate Induced Oxidative Stress and Accumulation of Secondary Metabolites in Plant Cell and Organ Cultures. Int. J. Mol. Sci. 2020, 21, 716. [Google Scholar] [CrossRef]
  29. Dias, M.I.; Sousa, M.J.; Alves, R.C.; Ferreira, I.C. Exploring Plant Tissue Culture to Improve the Production of Phenolic Compounds: A Review. Ind. Crops Prod. 2016, 82, 9–22. [Google Scholar] [CrossRef]
  30. Barros, L.; Dueñas, M.; Dias, M.I.; Sousa, M.J.; Santos-Buelga, C.; Ferreira, I.C. Phenolic Profiles of Cultivated, in Vitro Cultured and Commercial Samples of Melissa officinalis L. Infusions. Food Chem. 2013, 136, 1–8. [Google Scholar] [CrossRef]
  31. Worley, B.; Powers, R. Multivariate Analysis in Metabolomics. Curr. Metabolomics 2013, 1, 92–107. [Google Scholar]
  32. Hendriks, M.M.; van Eeuwijk, F.A.; Jellema, R.H.; Westerhuis, J.A.; Reijmers, T.H.; Hoefsloot, H.C.; Smilde, A.K. Data-Processing Strategies for Metabolomics Studies. TrAC Trends Anal. Chem. 2011, 30, 1685–1698. [Google Scholar] [CrossRef]
  33. Singh, S.; Tanwer, B.S.; Khan, M. Callus Induction and in Vivo and in Vitro Comparative Study of Primary Metabolites of Withania somnifera. Adv. Appl. Sci. Res. 2011, 2, 47–52. [Google Scholar]
  34. Al-Jibouri, A.M.J.; Abed, A.S.; Ali, A.A.; Majeed, D.M. Improvement of Phenols Production by Amino Acids in Callus Cultures of Verbascum thapsus L. Am. J. Plant Sci. 2016, 7, 84–91. [Google Scholar] [CrossRef]
  35. Kim, T.J.; Hyeon, H.; Park, N.I.; Yi, T.G.; Lim, S.-H.; Park, S.-Y.; Ha, S.-H.; Kim, J.K. A High-Throughput Platform for Interpretation of Metabolite Profile Data from Pepper (Capsicum) Fruits of 13 Phenotypes Associated with Different Fruit Maturity States. Food Chem. 2020, 331, 127286. [Google Scholar] [CrossRef] [PubMed]
  36. Jiménez-Arias, D.; Garcia-Machado, F.J.; Morales-Sierra, S.; Luis, J.C.; Suarez, E.; Hernández, M.; Valdés, F.; Borges, A.A. Lettuce Plants Treated with L-Pyroglutamic Acid Increase Yield Under Water Deficit Stress. Environ. Exp. Bot. 2019, 158, 215–222. [Google Scholar] [CrossRef]
  37. Zarbakhsh, S.; Shahsavar, A.R. Exogenous Γ-Aminobutyric Acid Improves the Photosynthesis Efficiency, Soluble Sugar Contents, and Mineral Nutrients in Pomegranate Plants Exposed to Drought, Salinity, and Drought-Salinity Stresses. BMC Plant Biol. 2023, 23, 543. [Google Scholar] [CrossRef] [PubMed]
  38. Park, S.-Y.; Lim, S.-H.; Ha, S.-H.; Yeo, Y.; Park, W.T.; Kwon, D.Y.; Park, S.U.; Kim, J.K. Metabolite Profiling Approach Reveals the Interface of Primary and Secondary Metabolism in Colored Cauliflowers (Brassica oleracea L. ssp. Botrytis). J. Agric. Food Chem. 2013, 61, 6999–7007. [Google Scholar] [CrossRef]
  39. Park, H.-E.; Kim, Y.J.; Do, K.-H.; Kim, J.K.; Ham, J.-S.; Lee, W.-K. Effects of Queso Blanco Cheese Containing Bifidobacterium longum KACC 91563 on the Intestinal Microbiota and Short Chain Fatty Acid in Healthy Companion Dogs. Korean J. Food Sci. Anim. Resour. 2018, 38, 1261. [Google Scholar] [CrossRef]
  40. Andi, S.A.; Gholami, M.; Ford, C.M.; Maskani, F. The Effect of Light, Phenylalanine and Methyl Jasmonate, Alone or in Combination, on Growth and Secondary Metabolism in Cell Suspension Cultures of Vitis Vinifera. J. Photochem. Photobiol. B Biol. 2019, 199, 111625. [Google Scholar] [CrossRef]
  41. Liu, Z.; Mohsin, A.; Wang, Z.; Zhu, X.; Zhuang, Y.; Cao, L.; Guo, M.; Yin, Z. Enhanced Biosynthesis of Chlorogenic Acid and its Derivatives in Methyl-Jasmonate-Treated Gardenia jasminoides Cells: A Study on Metabolic and Transcriptional Responses of Cells. Front. Bioeng. Biotechnol. 2021, 8, 604957. [Google Scholar] [CrossRef]
  42. Kdhim, S.J.; Jassim, E.H.; Salih, H.H. Effect of Salicylic Acid on Increasing of some Phenolic Acid and Flavonoids in Coriandrum sativum Callus. Plant Arch. 2020, 20, 3007–3014. [Google Scholar]
  43. Lahuta, L.B.; Zalewski, K.; Głowacka, K.; Nitkiewicz, B.; Amarowicz, R. Effect of Methyl Jasmonate on Carbohydrate Composition, A-Amylase Activity and Growth of Triticale (Triticosecale witmmack) Seedlings. J. Agr. Sci. Technol. 2018, 19, 1127–1137. [Google Scholar]
  44. Larronde, F.; Krisa, S.; Decendit, A.; Cheze, C.; Deffieux, G.; Mérillon, J. Regulation of Polyphenol Production in Vitis Vinifera Cell Suspension Cultures by Sugars. Plant Cell Rep. 1998, 17, 946–950. [Google Scholar] [CrossRef]
  45. Benevenuto, R.F.; Seldal, T.; Hegland, S.J.; Rodriguez-Saona, C.; Kawash, J.; Polashock, J. Transcriptional Profiling of Methyl Jasmonate-Induced Defense Responses in Bilberry (Vaccinium myrtillus L.). BMC Plant Biol. 2019, 19, 70. [Google Scholar] [CrossRef]
  46. Lee, J.-E.; Cho, Y.U.; Kim, K.H.; Lee, D.Y. Distinctive Metabolomic Responses of Chlamydomonas reinhardtii to the Chemical Elicitation by Methyl Jasmonate and Salicylic Acid. Process Biochem. 2016, 51, 1147–1154. [Google Scholar] [CrossRef]
  47. Kim, Y.B.; Kim, J.K.; Uddin, M.R.; Xu, H.; Park, W.T.; Tuan, P.A.; Li, X.; Chung, E.; Lee, J.-H.; Park, S.U. Metabolomics Analysis and Biosynthesis of Rosmarinic Acid in Agastache rugosa Kuntze Treated with Methyl Jasmonate. PLoS ONE 2013, 8, e64199. [Google Scholar] [CrossRef] [PubMed]
  48. Ji, J.; Feng, Q.; Sun, H.; Zhang, X.; Li, X.; Li, J.; Gao, J. Response of Bioactive Metabolite and Biosynthesis Related Genes to Methyl Jasmonate Elicitation in Codonopsis pilosula. Molecules 2019, 24, 533. [Google Scholar] [CrossRef]
  49. ElSayed, A.I.; Rafudeen, M.S.; Golldack, D. Physiological Aspects of Raffinose Family Oligosaccharides in Plants: Protection Against Abiotic Stress. Plant Biol. 2014, 16, 1–8. [Google Scholar] [CrossRef]
  50. Yu, Y.; Wang, T.; Wu, Y.; Zhou, Y.; Jiang, Y.; Zhang, L. Effect of Elicitors on the Metabolites in the Suspension Cell Culture of Salvia miltiorrhiza Bunge. Physiol. Mol. Biol. Plants 2019, 25, 229–242. [Google Scholar] [CrossRef]
  51. Abdelsalam, A.; Chowdhury, K.; Boroujerdi, A.; El-Bakry, A. Effect of Stress Hormones on the Metabolome of a Suspension Culture of the Aromatic Medicinal Plant Cymbopogon schoenanthus subsp. proximus. Plant Cell Tiss. Organ Cult. 2023, 155, 137–163. [Google Scholar] [CrossRef]
  52. Madhloom, A.A.A.; Abd-Al-Hussan, G.F.; Kadhim, N.J.; Abass, M.C.; Header, H.R.; Talib, A.K.; Al-Hussain, M.A.T.A.; Aziz, D.Z. The Interaction Effect of Salt Stress and Lysine Concentrations in some Properties of Fenugreek Callus. J. Phys. Conf. Ser. 2020, 1660, 012018. [Google Scholar] [CrossRef]
  53. Malarz, J.; Yudina, Y.V.; Stojakowska, A. Hairy Root Cultures as a Source of Phenolic Antioxidants: Simple Phenolics, Phenolic Acids, Phenylethanoids, and Hydroxycinnamates. Int. J. Mol. Sci. 2023, 24, 6920. [Google Scholar] [CrossRef]
  54. Classic Murashige, T.; Skoog, F. A Revised Medium for Rapid Growth and Bioassays with Tobacco Tissue Cultures. Physiol. Plant. 1962, 15, 473–497. [Google Scholar] [CrossRef]
  55. Blömeke, B.; Poginsky, B.; Schmutte, C.; Marquardt, H.; Westendorf, J. Formation of Genotoxic Metabolites from Anthraquinone Glycosides, Present in Rubia tinctorum L. Mutat. Res. 1992, 265, 263–272. [Google Scholar] [CrossRef] [PubMed]
  56. Kim, M.-K.; Jeong, C.-S.; Shin, Y.-K.; Park, K.-H.; Lee, W.-J.; Lee, E.-J.; Paek, K.-Y. Effects of Extraction Condition on Extraction Efficiency of Rubiadin in Adventitious Roots of Noni (Morinda citrifolia). Kor. J. Hort. Sci. Technol. 2010, 28, 685–690. [Google Scholar]
  57. Hyeon, H.; Jang, E.B.; Yoon, W.-J.; Lee, J.-D.; Hyun, H.B.; Jung, Y.-H.; Min, J.; Ham, Y.-M. Proliferation and Metabolic Profiling of Cynanchum wilfordii Adventitious Roots using Explants from Different Cultivation Methods. ACS Omega 2022, 7, 46756–46768. [Google Scholar] [CrossRef]
  58. Hyeon, H.; Hyun, H.B.; Go, B.; Kim, S.C.; Jung, Y.-H.; Ham, Y.-M. Profiles of Essential Oils and Correlations with Phenolic Acids and Primary Metabolites in Flower Buds of Magnolia heptapeta and Magnolia denudata var. purpurascens. Molecules 2021, 27, 221. [Google Scholar] [CrossRef] [PubMed]
  59. Hayashi, H.; Huang, P.; Inoue, K. Up-regulation of soyasaponin biosynthesis by methyl jasmonate in cultured cells of Glycyrrhiza glabra. Plant Cell Physiol. 2003, 44, 404–411. [Google Scholar] [CrossRef]
  60. Wang, J.; Qian, J.; Yao, L.; Lu, Y. Enhanced production of flavonoids by methyl jasmonate elicitation in cell suspensionculture of Hypericum perforatum. Bioresour. Bioprocess. 2015, 2, 5–13. [Google Scholar] [CrossRef]
  61. Sun, J.; Wang, Y.; Chen, X.; Gong, X.; Wang, N.; Ma, L.; Qui, Y.; Wang, Y.; Feng, S. Effects of methyl jasmonate and abscisic acid on anthocyanin biosynthesis in callus cultures of red-fleshed apple (Malus sieversii f. niedzwetzkyana). Plant Cell Tiss. Organ Cult. 2017, 130, 227–237. [Google Scholar] [CrossRef]
  62. Ali, M.B.; Yu, K.W.; Hahn, E.J.; Paek, K.Y. Differential responses of anti-oxidants enzymes, lipoxygenase activity, ascorbate content and the production of saponins in tissue cultured root of mountain Panax ginseng CA Mayer and Panax quinquefolium L. in bioreactor subjected to methyl jasmonate stress. Plant Sci. 2005, 169, 83–92. [Google Scholar] [CrossRef]
  63. Sampedro, M.A.S.; Tárrago, J.F.; Corchete, P. Yeast extract and methyl jasmonate-induced silymarin production in cell cultures of Silybum marianum (L.) Gaertn. J. Biotechnol. 2005, 119, 60–69. [Google Scholar] [CrossRef] [PubMed]
  64. Wang, W.; Zhao, Z.J.; Xu, Y.; Qian, X.; Zhong, J.J. Efficient induction of ginsenoside biosynthesis and alteration of ginsenoside heterogeneity in cell cultures of Panax notoginseng by using chemically synthesized 2-hydroxyethyl jasmonate. Appl. Microbiol. Biotechnol. 2006, 70, 298–307. [Google Scholar] [CrossRef]
  65. Cho, H.Y.; Son, S.Y.; Rhee, H.S.; Yoon, S.Y.H.; Lee-Parsons, C.W.T.; Park, J.M. Synergistic effects of sequential treatment with methyl jasmonate, salicylic acid and yeast extract on benzophenanthridine alkaloid accumulation and protein expression in Eschscholtzia californica suspension cultures. J. Biotechnol. 2008, 135, 117–122. [Google Scholar] [CrossRef]
  66. Khojasteh, A.; Mirjalili, M.H.; Palazon, J.; Eibl, R.; Cusido, R.M. Methyl jasmonate enhanced production of rosmarinic acid in cell cultures of Satureja khuzistanica in a bioreactor. Eng. Life Sci. 2016, 16, 740–749. [Google Scholar] [CrossRef]
  67. Cai, J.; Ma, Y.; Hu, P.; Zhang, Y.; Chen, J.; Li, X. Elicitation of furanocoumarins in Changium smyrnioides suspension cells. Plant Cell Tiss. Organ Cult. 2017, 130, 1–12. [Google Scholar] [CrossRef]
  68. Sellapan, P.; Rohani, E.R.; Noor, N.M. Sesquiterpene production in methyl Jasmonate-induced Persicaria minor cell suspension culture. Sains Malays. 2018, 47, 3051–3059. [Google Scholar] [CrossRef]
  69. Liu, Z.B.; Chen, J.G.; Yin, Z.P.; Shangguan, X.C.; Peng, D.Y.; Lu, T.; Lin, P. Methyl jasmonate and salicylic acid elicitation increase content and yield of chlorogenic acid and its derivatives in Gardenia jasminoides cell suspension cultures. Plant Cell Tiss. Organ Cult. 2018, 134, 79–93. [Google Scholar] [CrossRef]
  70. Hao, Y.J.; Cui, X.H.; Li, J.R.; An, X.L.; Sun, H.D.; Piao, X.C.; Lian, M.L. Cell bioreactor culture of Orostachys cartilaginous A. Bor. and involvement of nitric oxide in methyl jasmonate-induced flavonoid synthesis. Acta Physiol. Plant. 2020, 42, 9. [Google Scholar] [CrossRef]
Figure 1. Biomass accumulation in response to different methyl jasmonate (MeJA) concentrations in the calli of D. major. (A) Fresh weight, (B) dry weight, (C) growth index (not significant, ns; significant * p < 0.05, ** p < 0.01, *** p < 0.001).
Plants 13 00167 g001
Figure 2. Effect of methyl jasmonate (MeJA) concentration on D. major callus browning for 3 weeks. (A) Unelicited (control), (B) 100 µM MeJA, (C) 200 µM MeJA (Scale bar = 1 cm).
Plants 13 00167 g002
Figure 3. The score (A) and loading (B) plots of principal components 1 and 2 in the principal component analysis results obtained from D. major leaves and calli treated with different methyl jasmonate (MeJA) concentrations. Plot annotations: 1, Lactic acid; 2, Glycolic acid; 3, Alanine; 4, Valine; 5, Urea; 6, Ethanolamine; 7, Glycerol; 8, Phosphoric acid; 9, Leucine; 10, Isoleucine; 11, Glycine; 12, Succinic acid; 13, Fumaric acid; 14, Serine; 15, Threonine; 16, β-Alanine; 17, Malic acid, 18, Aspartic acid; 19, Methionine; 20, Pyroglutamic acid; 21, GABA 22, Threonic acid; 23, Glutamic acid; 24, Phenylalanine; 25, Xylose; 26, Asparagine; 27, Citric acid; 28, Quinic acid; 29, Fructose; 30, Mannose; 31, Galactose; 32, Glucose; 33, Inositol; 34, Sucrose; 35, Raffinnose; 36, Caffeic acid; 37, Epicatechin; 38, Quercetin; 39, Kaempferol; 40, Rubiadin.
Plants 13 00167 g003
Figure 4. Metabolite to metabolite correlation matrix and hierarchical cluster analysis (HCA) obtained from D. major leaves and calli treated with different methyl jasmonate (MeJA) concentrations. Each square indicates the Pearson’s correlation coefficient of a pair of compounds, with the value of this coefficient represented by blue or red colors. A higher intensity of red indicates a positive correlation between metabolites, whereas a higher intensity of blue indicates a negative correlation between metabolites. Each group is marked by a dotted box.
Plants 13 00167 g004
Figure 5. Score plots (A) and loading column plots of partial least squares (PLS) 1 (B) and 2 (C) from the partial least squares discriminant analysis (PLS-DA) of D. major leaves and calli treated with different methyl jasmonate (MeJA) concentrations. Asterisk symbols in the loading column plots represent significantly different and influential metabolites with p < 0.05 and VIP values ≥ 0.8. Plot annotations: 1, Lactic acid; 2, Glycolic acid; 3, Alanine; 4, Valine; 5, Urea; 6, Ethanolamine; 7, Glycerol; 8, Phosphoric acid; 9, Leucine; 10, Isoleucine; 11, Glycine; 12, Succinic acid; 13, Fumaric acid; 14, Serine; 15, Threonine; 16, β-Alanine; 17, Malic acid, 18, Aspartic acid; 19, Methionine; 20, Pyroglutamic acid; 21, GABA; 22, Threonic acid; 23, Glutamic acid; 24, Phenylalanine; 25, Xylose; 26, Asparagine; 27, Citric acid; 28, Quinic acid; 29, Fructose; 30, Mannose; 31, Galactose; 32, Glucose; 33, Inositol; 34, Sucrose; 35, Raffinnose; 36, Caffeic acid; 37, Epicatechin; 38, Quercetin; 39, Kaempferol; 40, Rubiadin.
Plants 13 00167 g005
Table 1. One-way analysis of variance (ANOVA) results for the content of rubiadin in D. major leaves and calli treated with different methyl jasmonate (MeJA) concentrations.
(mg/g Dry Weight)LeavesUnelicitedElicited
ControlMeJA 100MeJA 200
Rubiadin* N.D. a0.121 ± 0.007 b1.458 ± 0.008 c1.961 ± 0.143 d
* N.D. Not detected; a,b,c,d Different superscript letters indicate statistical differences with p < 0.05 (Tukey’s multiple-range test).
Disclaimer/Publisher’s Note: The statements, opinions and data contained in all publications are solely those of the individual author(s) and contributor(s) and not of MDPI and/or the editor(s). MDPI and/or the editor(s) disclaim responsibility for any injury to people or property resulting from any ideas, methods, instructions or products referred to in the content.

