Article

Functional Characterization of CsF3Ha and Its Promoter in Response to Visible Light and Plant Growth Regulators in the Tea Plant

1
School of Landscape Architecture and Horticulture Sciences, Southwest Forestry University, Kunming 650224, China
2
Qiannan Academy of Agricultural Sciences, Duyun 558000, China
*
Author to whom correspondence should be addressed.
Plants 2024, 13(2), 196; https://doi.org/10.3390/plants13020196
Submission received: 4 December 2023 / Revised: 4 January 2024 / Accepted: 8 January 2024 / Published: 11 January 2024
(This article belongs to the Section Plant Genetics, Genomics and Biotechnology)

Abstract

:
Flavanone 3-hydroxylase (F3H) catalyzes trihydroxyflavanone formation into dihydroflavonols in the anthocyanin biosynthesis pathway, serving as precursors for anthocyanin synthesis. To investigate the CsF3Ha promoter’s regulation in the ‘Zijuan’ tea plant, we cloned the CsF3Ha gene from this plant. It was up-regulated under various visible light conditions (blue, red, and ultraviolet (UV)) and using plant growth regulators (PGRs), including abscisic acid (ABA), gibberellic acid (GA3), salicylic acid (SA), ethephon, and methyl jasmonate (MeJA). The 1691 bp promoter sequence was cloned. The full-length promoter P1 (1691 bp) and its two deletion derivatives, P2 (890 bp) and P3 (467 bp), were fused with the β-glucuronidase (GUS) reporter gene, and were introduced into tobacco via Agrobacterium-mediated transformation. GUS staining, activity analysis, and relative expression showed that visible light and PGRs responded to promoter fragments. The anthocyanin content analysis revealed a significant increase due to visible light and PGRs. These findings suggest that diverse treatments indirectly enhance anthocyanin accumulation in ‘Zijuan’ tea plant leaves, establishing a foundation for further research on CsF3Ha promoter activity and its regulatory role in anthocyanin accumulation.

1. Introduction

The ‘Zijuan’ tea plant is classified as Camellia sinensis var. assamica, a specific variant rich in anthocyanins among the cultivated varieties of tea plants in the Yunnan large-leaf population. Typically, the anthocyanin content in the ‘Zijuan’ tea plant comprises 2.7–3.6% of dry matter [1], a notable contrast to the 0.01% in green tea. As ‘Zijuan’ leaves progress from a young to mature state, the anthocyanin accumulations induces a shift in leaf color, transitioning from purple to green due to reduced concentrations of flavonoids and anthocyanins. Anthocyanins, as secondary metabolites, impart red, purple, and blue pigmentation to all tissues of higher plants [2]. Widely distributed in fruits and most flowers of higher plants, anthocyanins belong to a group of flavonoids recognized for their health-promoting properties [3,4,5], including antioxidative, anti-inflammatory, and anticancer capacities [6,7].
The flavonoid biosynthetic pathway via the phenylpropanoid pathway leading to anthocyanins is well-established. CHS, CHI, F3′H, FLS, and F3H function in the early stages, yielding flavonols and other compounds. In the later stages, DFR, ANS, and UGT play crucial roles [8,9]. CHS initiates flavonoid biosynthesis, while FLS, IFS, and FNS contribute to the accumulation of colorless flavonoids (flavone and flavonol glycosides) [10]. Flavanone 3-hydroxylase (F3H), a pivotal enzyme in the central pathway, catalyzes the hydroxylation of naringin and other flavonoids to form 3-hydroxyflavonols [11]. This catalyzes the formation of trihydroxyflavanones into dihydroflavonols in the anthocyanin biosynthesis pathway, serving as common precursors for anthocyanins, flavanols, and proanthocyanidins. Exploring ways to enhance F3H’s ability to catalyze substrate conversion is crucial for promoting anthocyanin accumulation.
Anthocyanin susceptibility to pH, light, PGRs, temperatures, and metal ions, among other abiotic factors, is well-established. While the genetic background primarily determines the occurrence of specific anthocyanins in plants, environmental factors can variably affect the concentration of these compounds [12,13]. In CsF3H transgenic Arabidopsis thaliana seeds, a significant increase in flavonol glycosides and oligomeric proanthocyanidins was observed, accompanied by a decrease in monocatechin derivatives [14]. Research demonstrated significant induction of CsF3H genes under different abiotic stresses, including UV light radiation, sucrose, and ABA [14]. However, limited reports exist on the effects of environmental and biological factors on the promoters of different structural genes. The factors responsible for increased anthocyanin content remain largely unexplored. Studies on the CsF3H promoter in Camellia sinensis need further research. To elucidate the regulation of F3H expression, identifying promoter sequences interacting with regulatory proteins is crucial. In this study, we aim to clone the CsF3Ha gene and its promoter from the ‘Zijuan’ tea plant, predicting promoter-acting elements. Agrobacterium-mediated techniques were used to study different promoter segments’ activity. The investigation seeks to unveil the primary induction factors regulating anthocyanin content, offering insights for subsequent exploration of transcription factors associated with this gene.

2. Results

2.1. Changes of the Anthocyanin Content in Tea Plant under Different Treatments

The anthocyanin content in tea plant leaves varied significantly (p < 0.05) under visible light conditions, surpassing levels observed under white light (Figure 1A). Specifically, anthocyanin content differed across blue, UV, red, and white light settings, reaching peaks of 9.80 mg/g under blue light and 6.27 mg/g under white light. The results showed that the blue light significantly increased anthocyanin content (p < 0.05), and blue light was the most effective method for enhancing anthocyanin levels.
Anthocyanin content responded differentially to various PGR conditions. A notable downward parabolic trend in anthocyanin content accompanied an increasing ABA concentration (Figure 1B). When the ABA concentration increased to 100 mg/L, the anthocyanin content peaked (12.01 mg/g). However, beyond this threshold, it gradually decreased. A similar trend in anthocyanin content was observed with GA3 (Figure 1C). Upon reaching 100 mg/L GA3 concentration, the anthocyanin content peaked. The anthocyanin content exhibited a gradual increase with increasing SA concentration, reaching the maximum of 11.72 mg/g at 300 mg/L. Conversely, at 500 mg/L SA concentration, it reached the lowest of 9.49 mg/g (Figure 1D). Ethephon concentration correlated with a downward parabolic shift in anthocyanin content (Figure 1E). The ethephon significantly (p < 0.05) increased anthocyanin content at ≤100 mg/L, reaching a peak of 11.72 mg/g at 60 mg/L ethephon, sharply declining at 100 mg/L. This concentration marked a critical value, distinguishing between increased and decreased anthocyanin content compared to the control. The anthocyanin content changed significantly (p < 0.05) with increasing MeJA concentrations (Figure 1F), with the highest content of 12.36 mg/g observed at 150 mg/L MeJA concentration.
In summary, irradiating tea plant leaves with blue, UV, and red light or spraying with 100 mg/L ABA, 100 mg/L GA3, 300 mg/L SA, 60 mg/L ethephon, and 150 mg/L MeJA enhanced anthocyanin accumulation. These PGR concentrations served as the basis for subsequent experiments in this study.

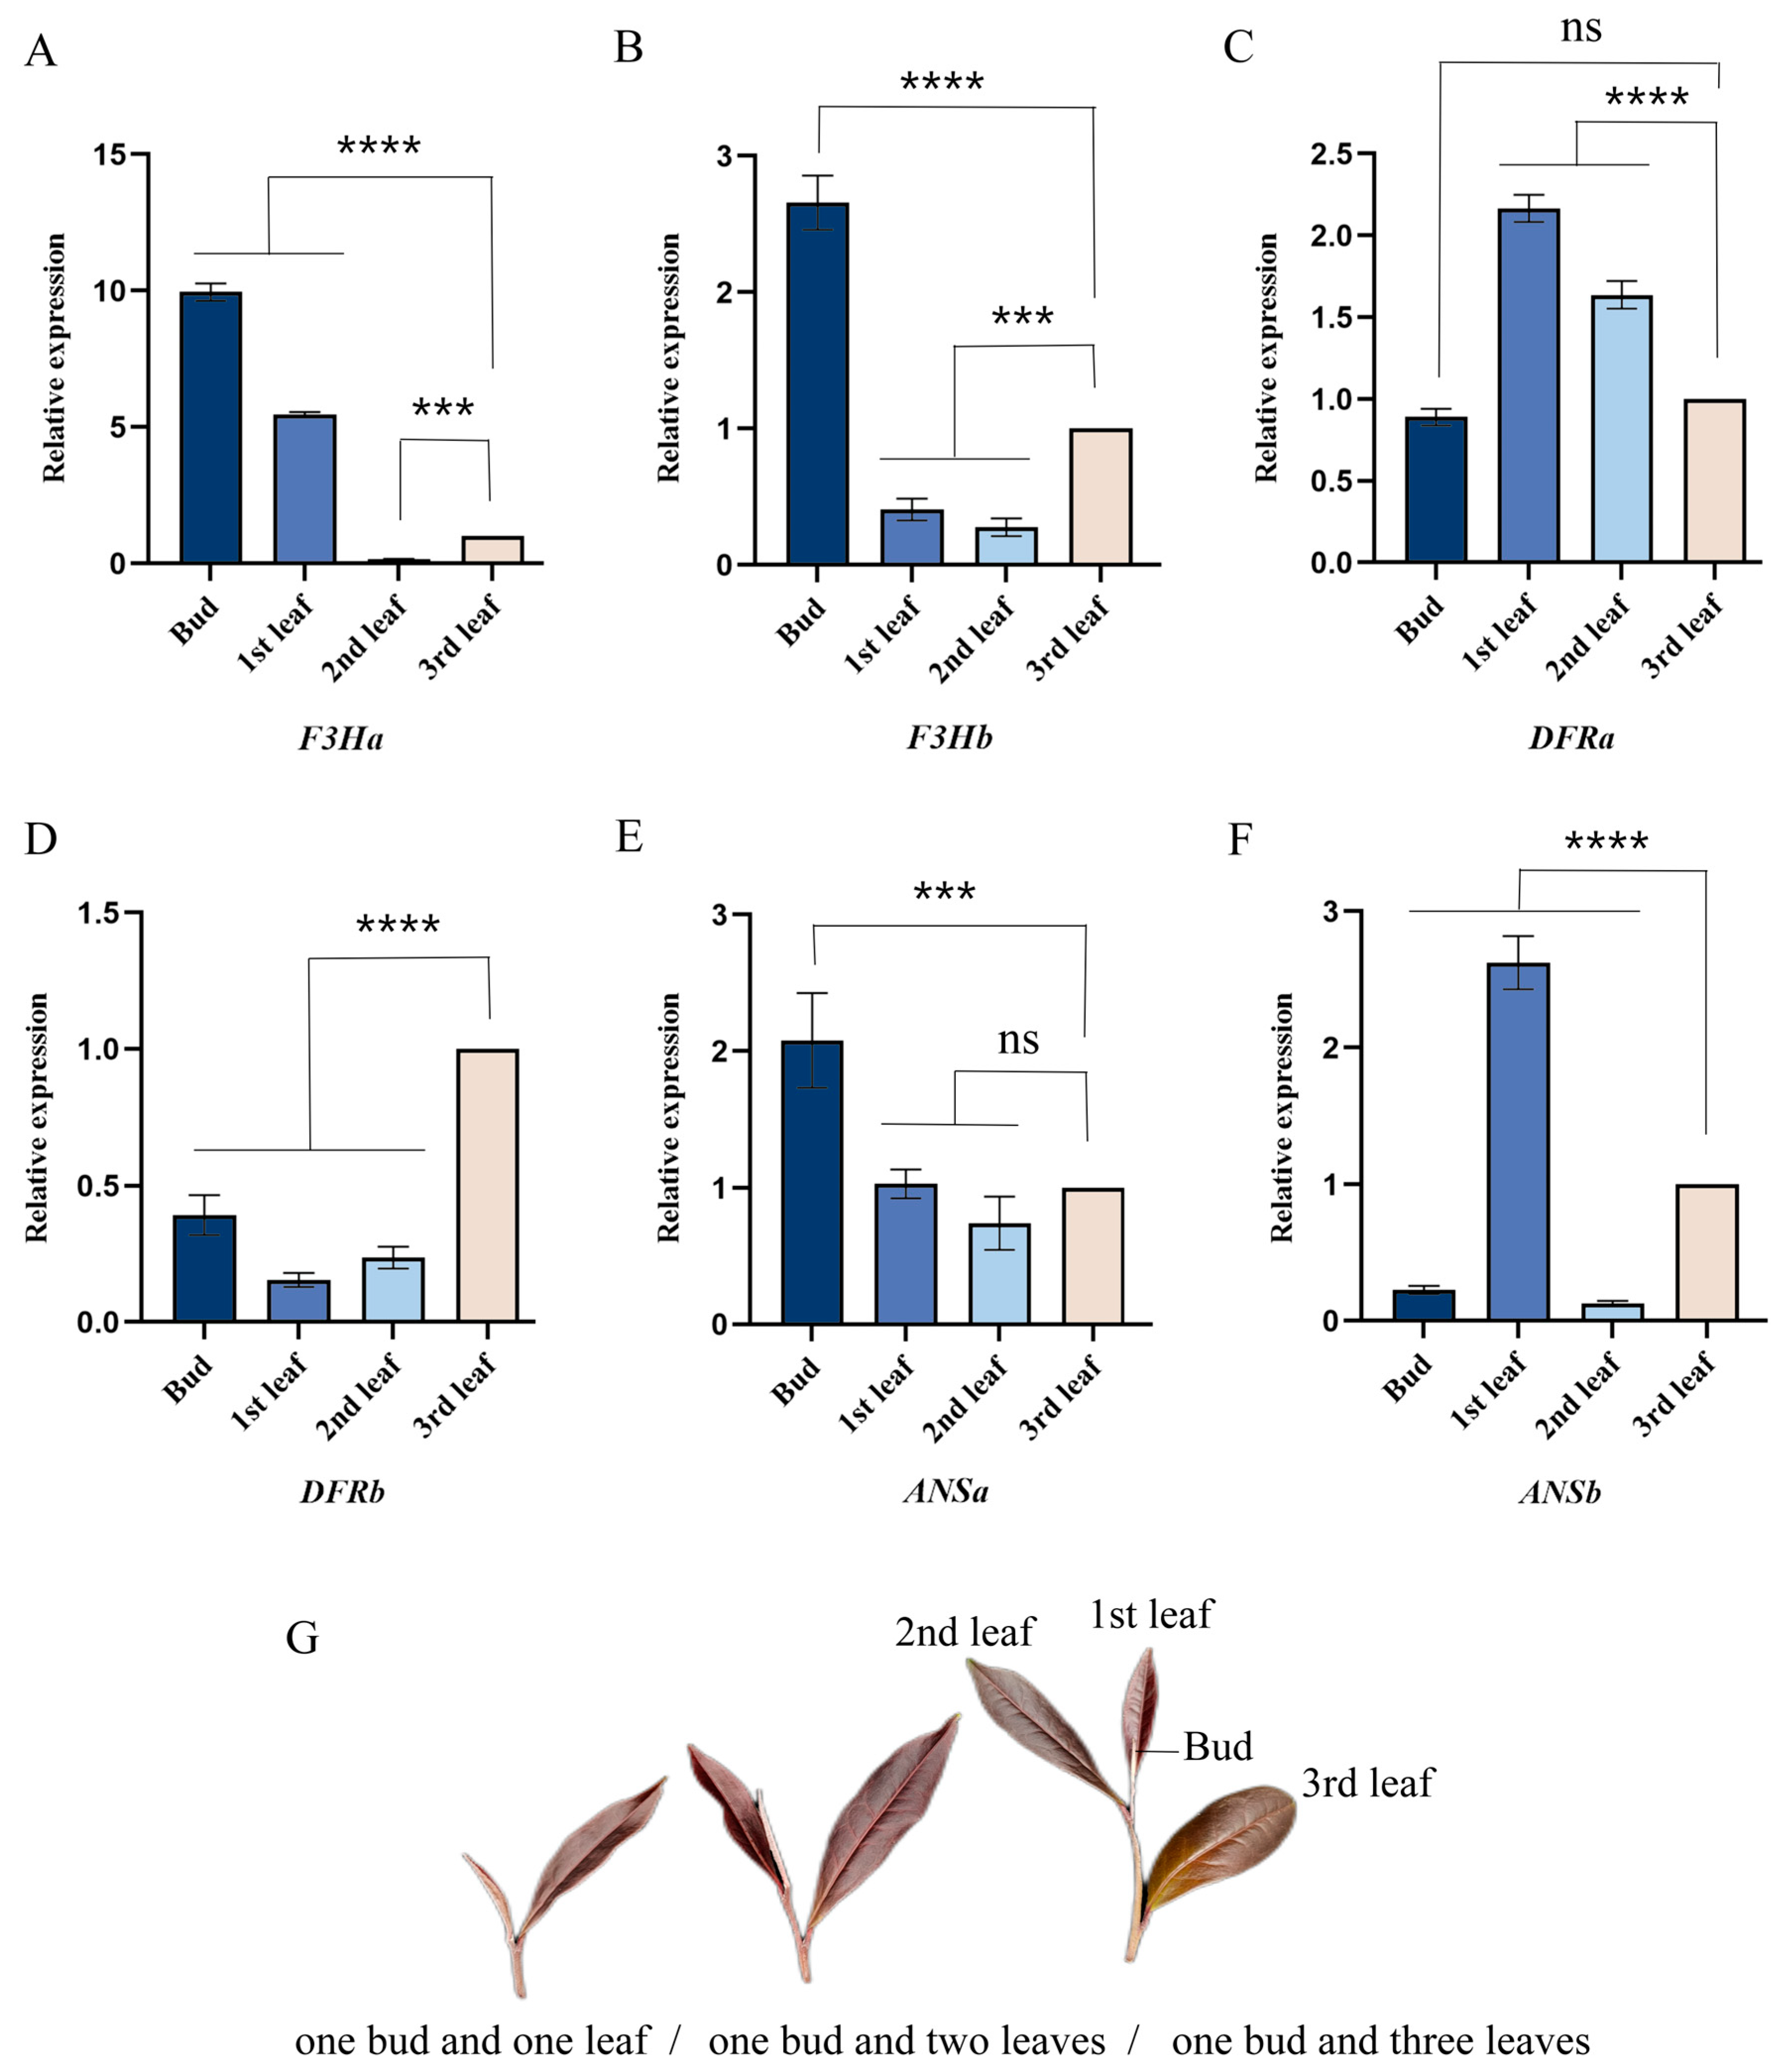
2.2. Analysis of the Quantitative Real-Time PCR for Candidate Genes

In leaves of the tea plant with varying tenderness (Figure 2G) levels during the same period, the relative expression of genes in the anthocyanin synthesis pathway differed. The bud of the tea plant exhibits a significantly higher expression of F3Ha (Figure 2A), F3Hb (Figure 2B), and ANSa (Figure 2E) compared to the first, second, and third leaves. Conversely, the first leaf showed significantly higher expressions of DFRa (Figure 2C), F3Ha, and ANSb (Figure 2F) compared to the second and third leaves. Notably, DFRb expression in the bud, first leaf, and second leaf was significantly lower than that in the third leaf (Figure 2D). In conclusion, the expression of three genes was elevated in the bud and the first leaf, with F3Ha demonstrating a significantly higher expression level in the bud and the first leaf than that of other genes. Therefore, F3Ha was selected as a candidate gene for subsequent experiments to explore its regulation of anthocyanin synthesis.

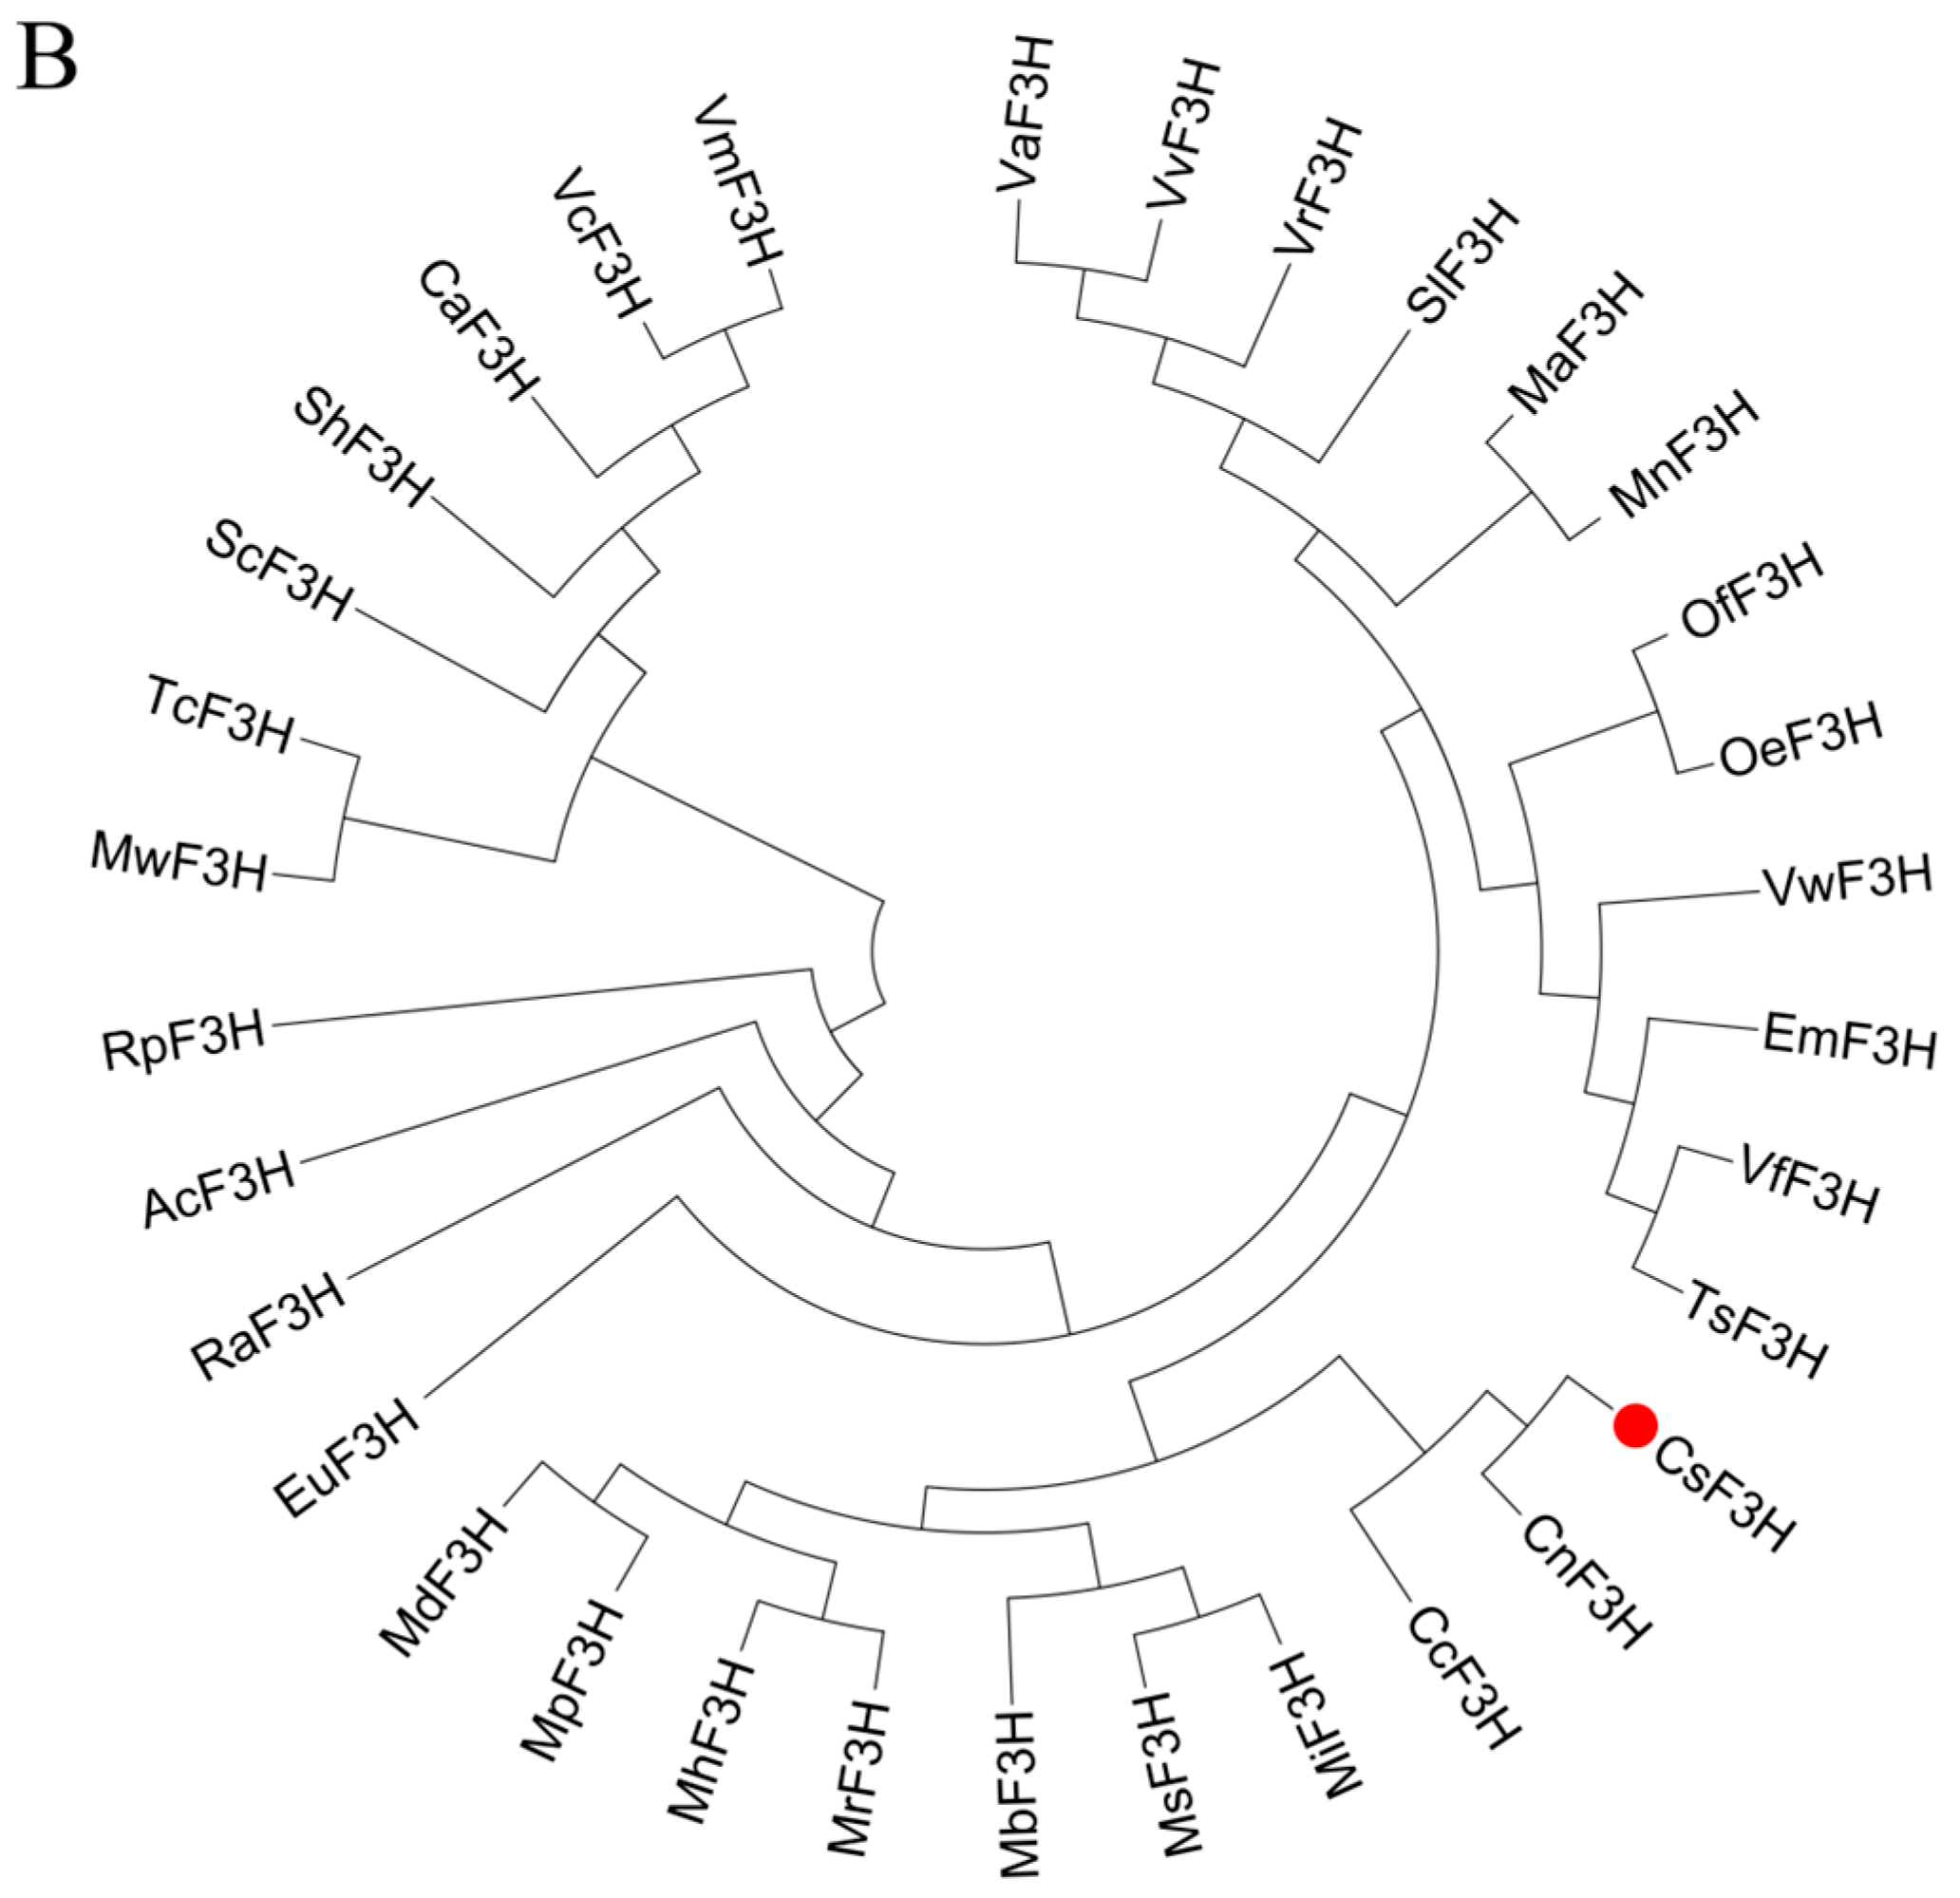
2.3. Characterization of CsF3Ha Gene and Phylogenetic Tree Analysis

The CsF3Ha gene (Genbank: MT355076), spanning 1107 bp, was cloned, featuring open reading frames encoding 368 amino acids. It exhibited 99% homology compared to other plants in the tea group. Further, a multiple alignment analysis of the CsF3H protein and F3Hs from various plants revealed highly conservative amino acid sequences among F3Hs (Figure 3A). The 2OG-FeⅡ-Oxy oxidase domain, part of the 2-ketoglutaric acid and Fe (Ⅱ)-dependent oxidase superfamily, included the C terminal of the α subunit of prolyl 4-hydroxylase. A phylogenetic tree analysis encompassed F3H genes from 32 plants with high similarity (Figure 3B). Notably, the F3H gene from the ‘Zijuan’ tea plant demonstrated high similarities with F3H gene from Camellia nitidissima and Camellia chekiangoleosa.

2.4. Expression Analysis of CsF3Ha Gene

CsF3Ha expression significantly (p < 0.05) differed under visible light conditions (Figure 4A). Concurrently, CsF3Ha expression in one bud and two leaves of tea plants subjected to different visible light was significantly (p < 0.05) higher than under white light, following the order of blue, red, UV, and white light, with its expression being insignificant under UV light and the highest under blue light. Furthermore, CsF3Ha expression under different PGRs was significantly (p < 0.05) higher than that under H2O, following the order of ABA, SA, MeJA, GA3, ethephon, H2O, with it being the highest under ABA (Figure 4B).

2.5. Cloning and Cis-Element Analysis of the CsF3Ha Promoter

The 1691 bp fragment upstream of the ATG start codon was obtained and was preliminarily designated as CsF3Ha’s full-length promoter. The CsF3Ha promoter, as per predictions, exhibited typical eukaryotic features, including potential TATA-box, CAAT-box, and TA-rich intensifier elements. Several vital regulatory elements within the CsF3Ha promoter were identified (Figure 5A), encompassing numerous PGR response elements and cis-elements involved in ABA (CATGCA-motif), MeJA (CGTCA-motif), GA3 (GARE-motif), SA (TCA-motif), and auxin (TGA-motif) responses. Numerous elements, notably those related to light response (BOX 4, I-BOX, GATABOX, especially the blue, white, or UV -10 PEHVPSBD), were detected within specific regions: −467 to +1 bp (light (GATABOX), SA, ABA, and GA3 response elements), −890 to +1 bp (light (GATABOX, I-BOX, BOX 4, -10 PEHVPSBD), SA, ABA, and GA3 response elements), and −1691 to +1 bp (light (GATABOX, I-BOX, BOX4, -10 PEHVPSBD) SA, ABA, GA3, and MeJA response elements). Stress-responsive elements, including the CATGTG-motif (dehydration reaction), E-box (defense signaling), and MYB-binding site (drought inducibility), were also identified. Transcription factors binding to hormone response elements further suggested the potential regulation of CsF3Ha expression in tea plants by PGRs (GA3, MeJA, ABA, SA) and abiotic stress (light, water, and metal ions) (Table 1). To assess the functionality of pCsF3Ha’s various fragments, we constructed the full-length promoter P1 (1691 bp) and its two deletion derivatives, P2 (890 bp) and P3 (467 bp). Each fragment was fused to the GUS gene in the vector, creating three pCsF3Ha::GUS constructs for further examination (Figure 5B).

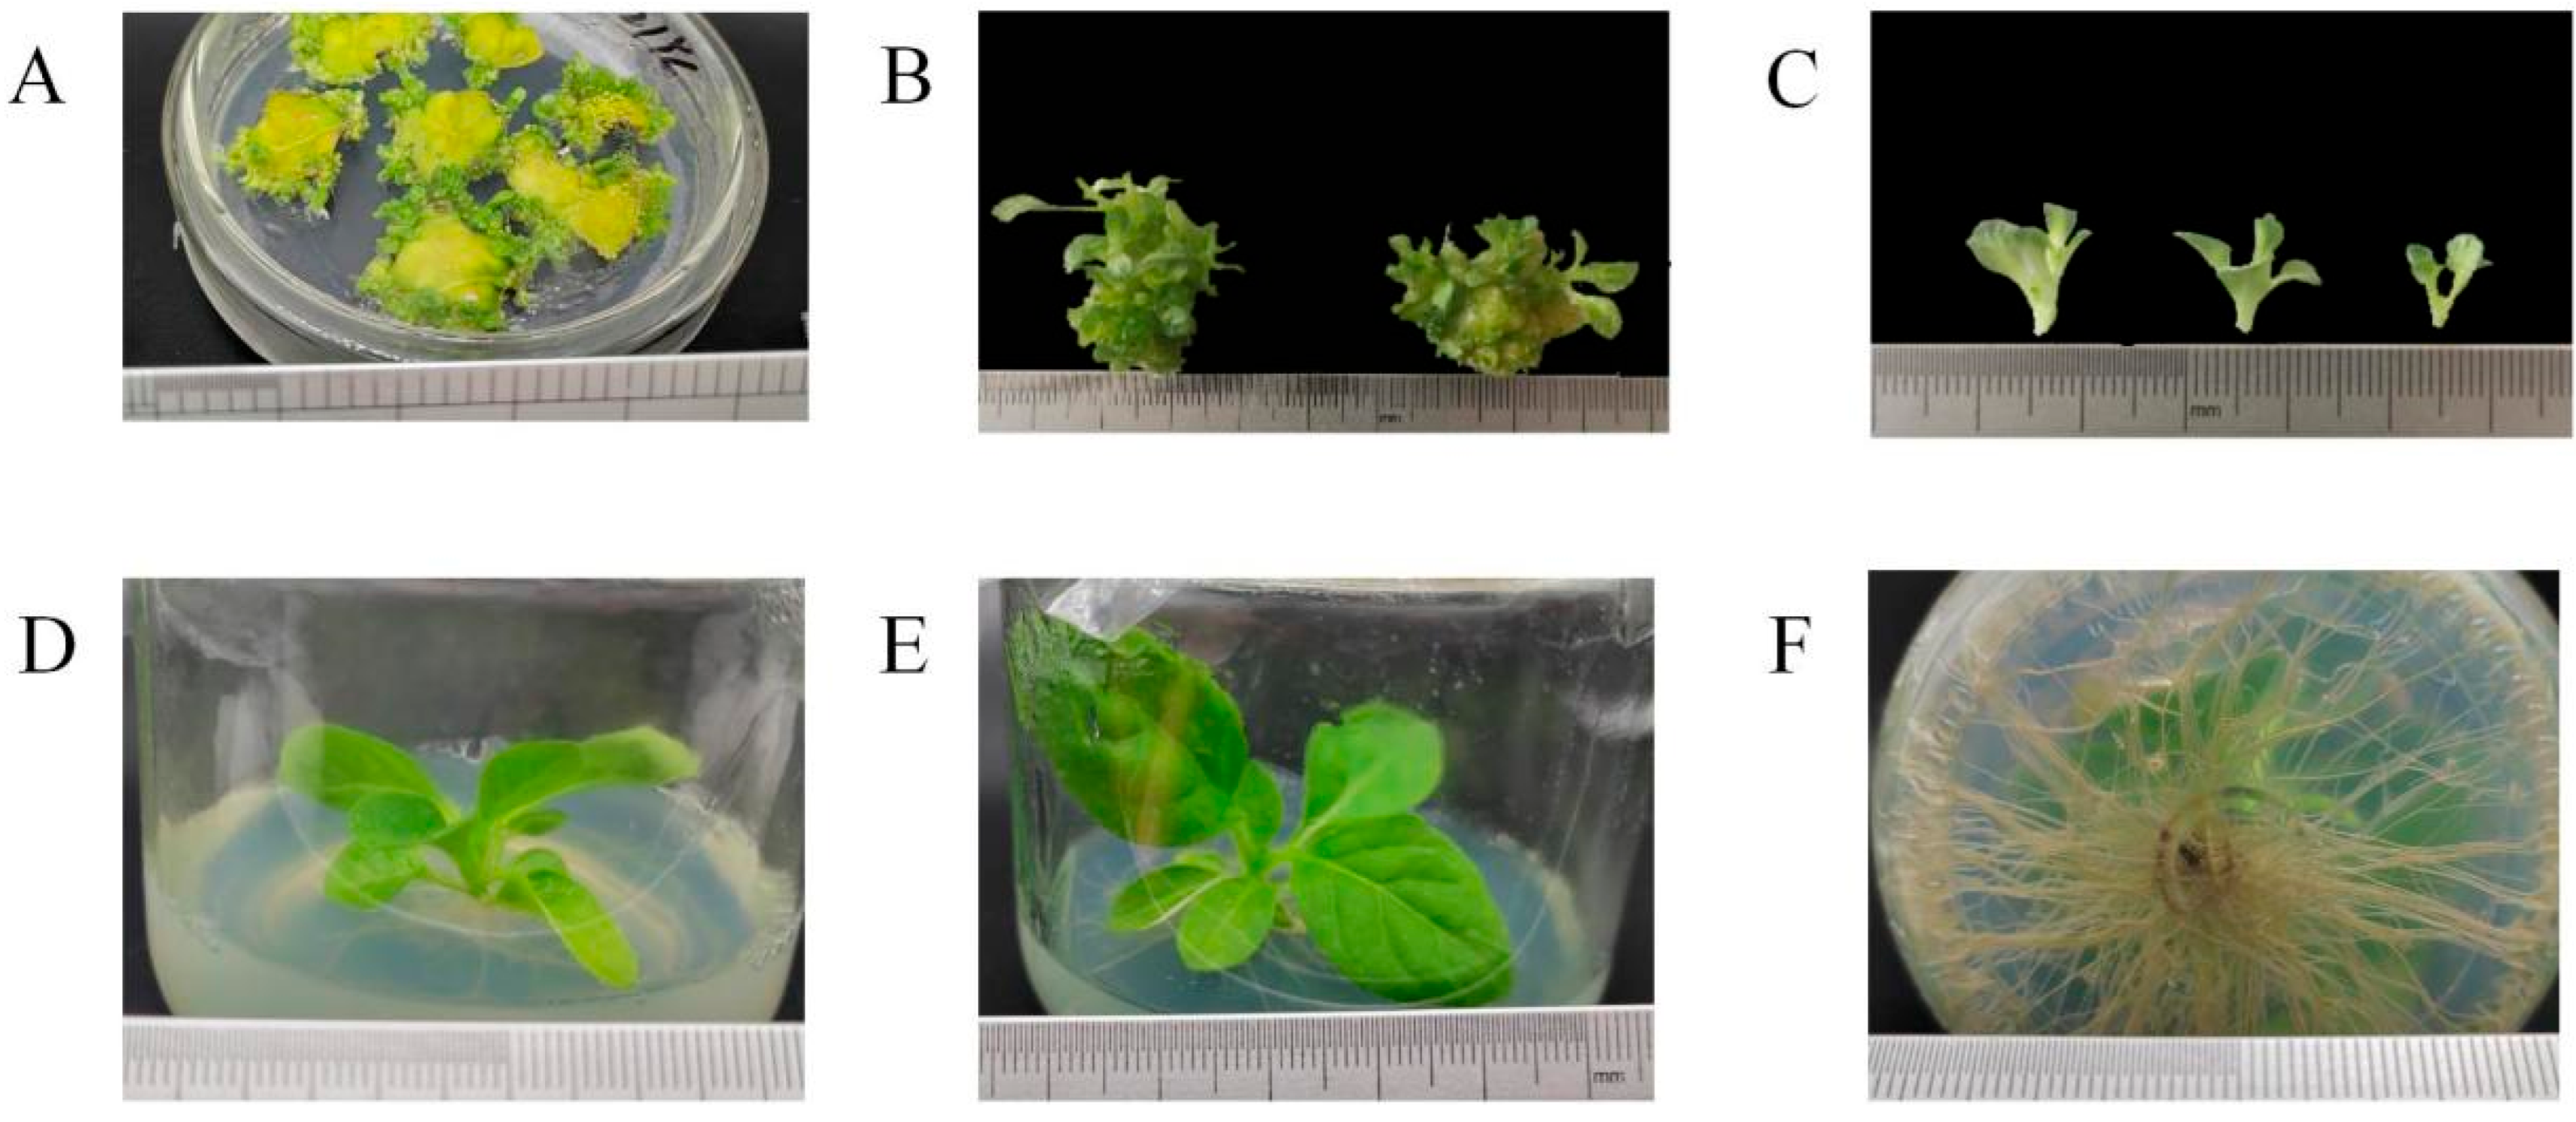
2.6. Transgenic Tobacco Lines with Hygromycin Resistance

The hygromycin-resistant lines, namely pP1::GUS (1–87 lines), pP2::GUS (1–96 lines), and pP3::GUS (1–84 lines), were generated (Figure 6). Upon seed germination, resistant buds exhibited robust growth, while individual buds with a white crown were identified as not hygromycin-resistant, possibly indicating false positive resistance. In the medium, the transgenic tobacco’s resistance allowed for normal growth, and its phenotype did not significantly differ from that of wild-type tobacco. The hygromycin-resistant lines were propagated monthly for subsequent experiments.

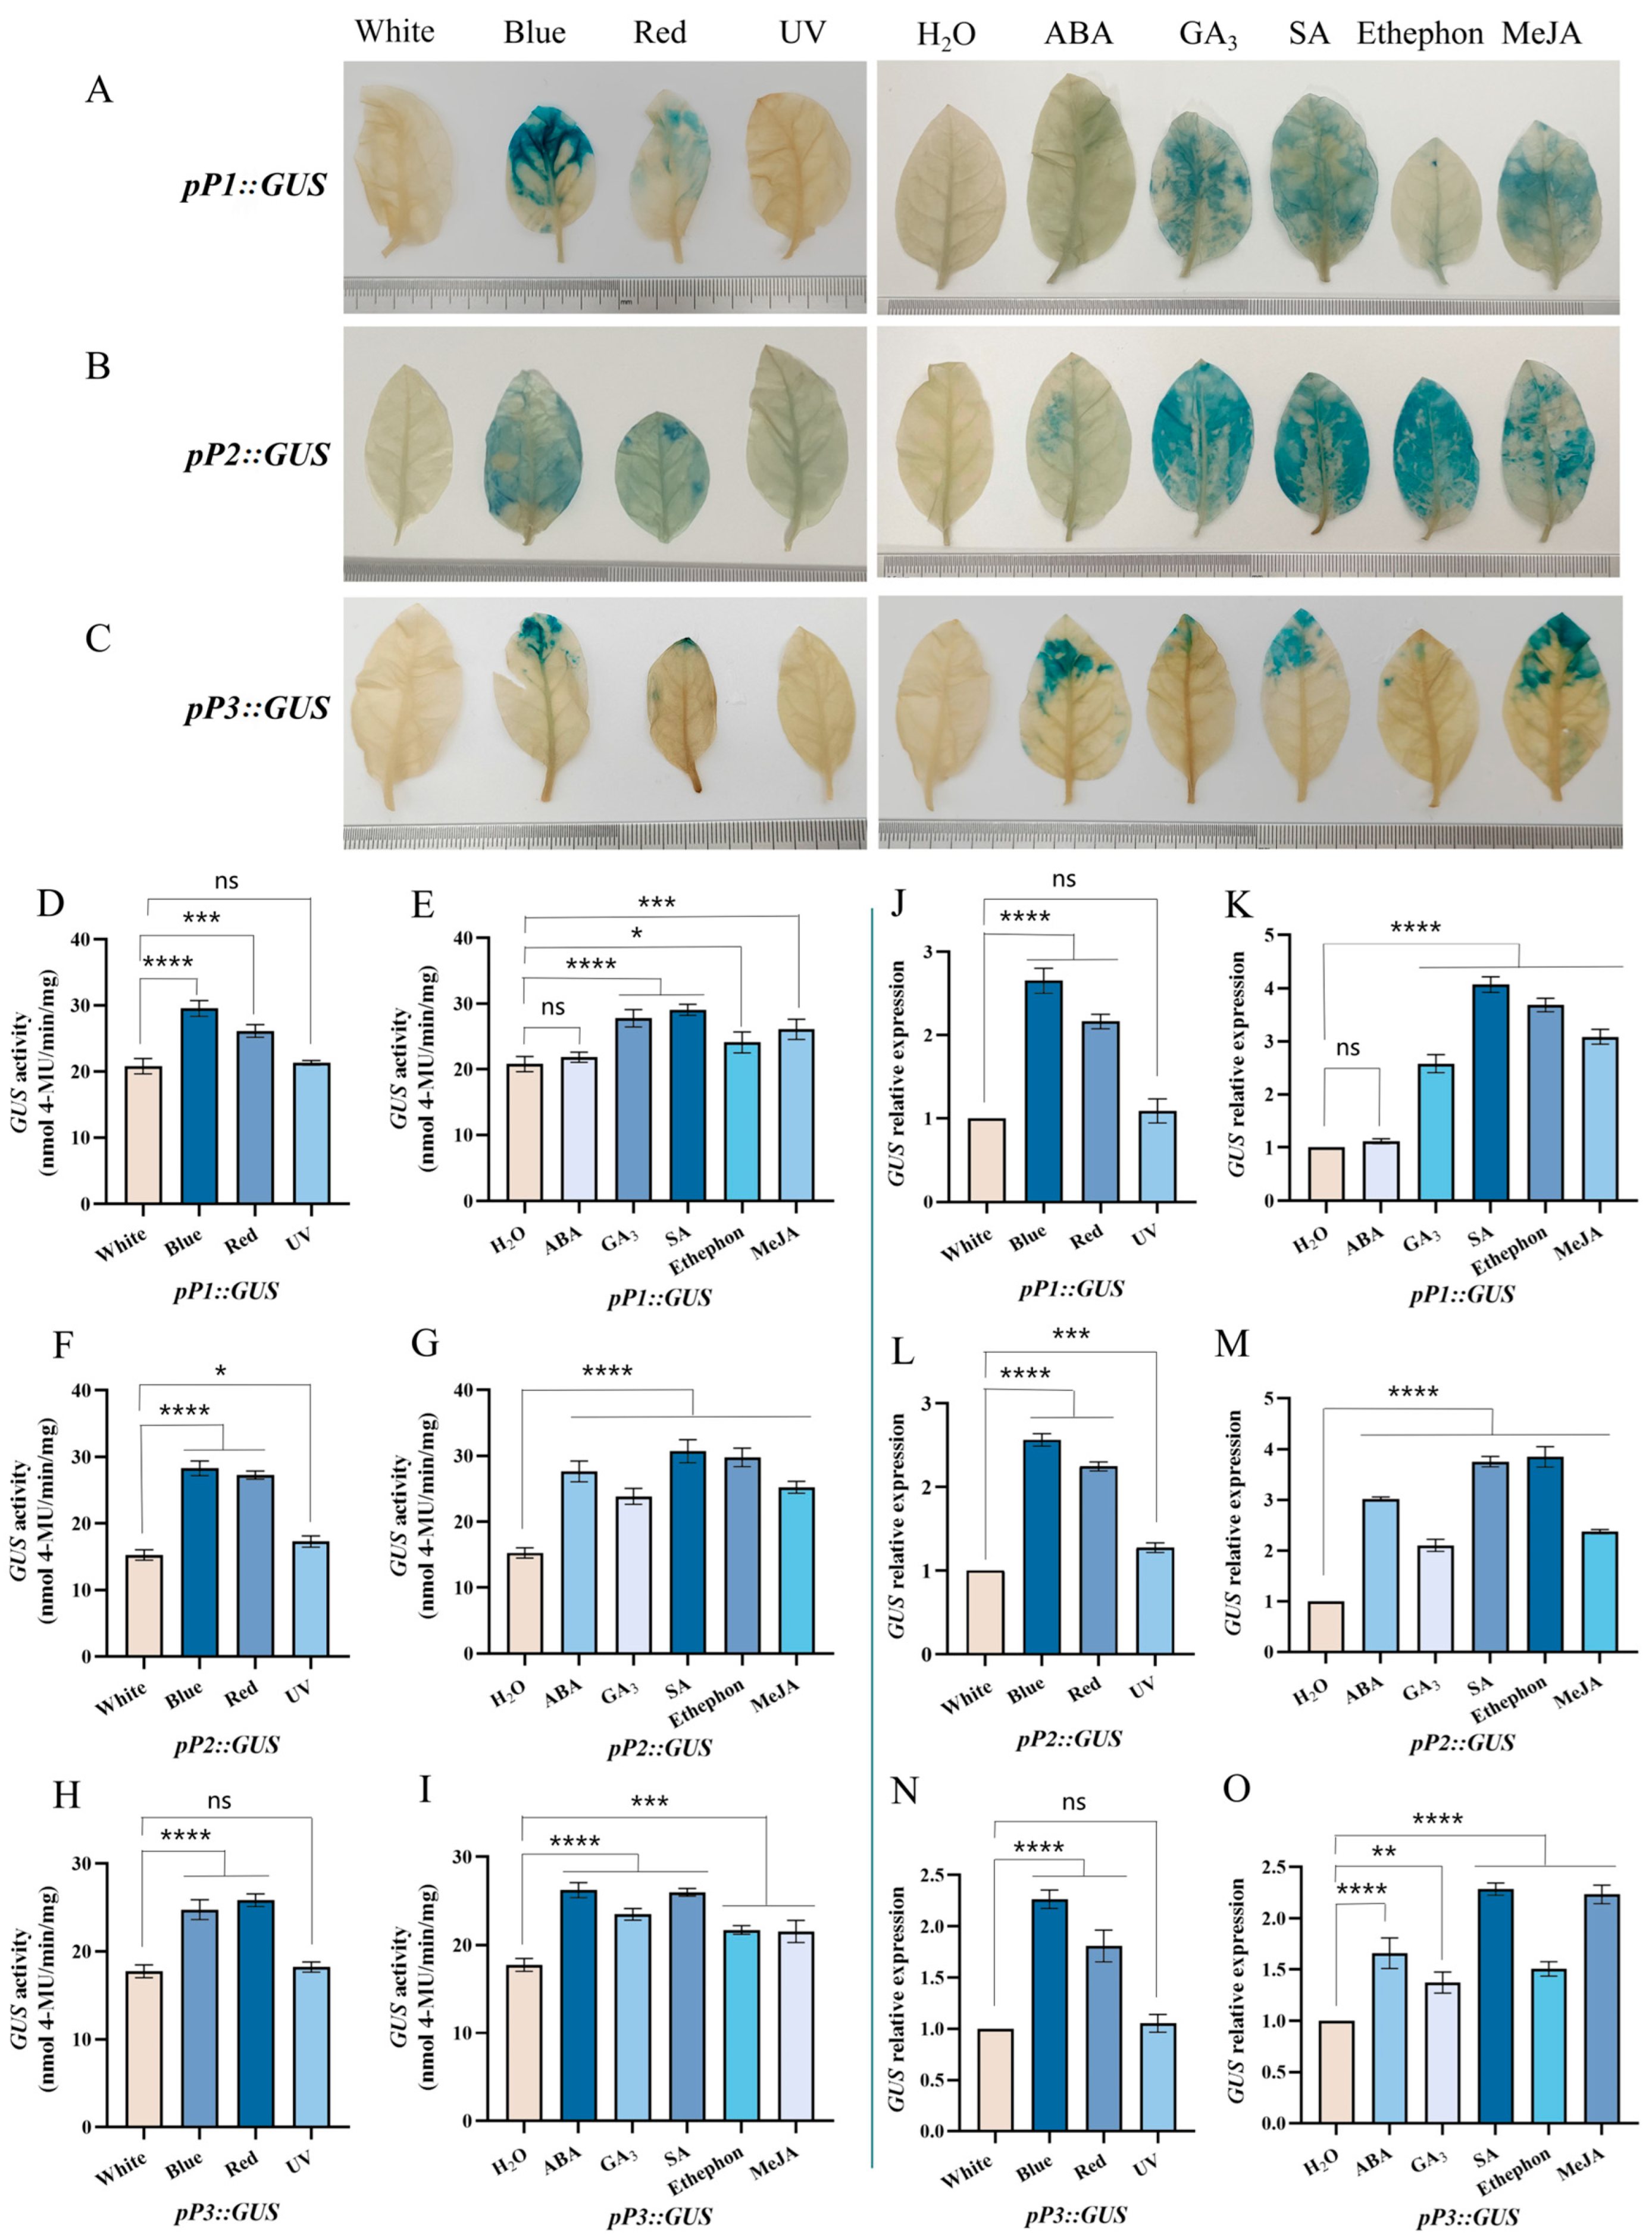
2.7. Histochemical GUS Staining

The GUS staining, observed under visible light and PGRs, was prominent in the pP1::GUS line excluding under UV light (Figure 7A). In contrast, the blue area in other treatments was less extensive than in the pP2::GUS line. The leaves of the pP2::GUS line all displayed blue staining across all treatments, the blue area extending throughout the leaves excluding those treated with UV light and ABA (Figure 7B). The GUS staining in the pP3::GUS line, visible under visible light and PGRs excluding those treated under UV light (Figure 7C), was mainly at the blue area on the tip of the leaves. Based on the staining area, the order was pP2::GUS, pP1::GUS, and pP3::GUS.

2.8. GUS Activity Assay

The enzyme activity of the pP1::GUS line under visible light surpassed that under white light, excluding UV light (Figure 7D). The highest activity occurred under blue light. Enzyme activity under PGRs was significantly higher than under H2O, with the peak under SA, but with no significant difference under ABA (Figure 7E). Similarly, the pP2::GUS line exhibited significantly higher enzyme activity under visible light and PGRs compared to H2O, with the highest activity under blue light and SA (Figure 7F,G). For pP3::GUS, enzyme activity under visible light and PGRs was significantly higher than under H2O, with the highest activity under red light and ABA, and no significant difference under UV light (Figure 7H,I).

2.9. The GUS Gene’s Relative Expression

The relative expression of GUS in the pP1::GUS line under visible light, especially blue light, was significantly higher than under white light, excluding UV light (Figure 7J). The relative expression was significantly higher under treatment with PGRs than with H2O besides ABA, and the highest with SA (Figure 7K). For pP2::GUS, both visible light and PGRs resulted in significantly higher relative expression, with the highest under blue light and ethephon (Figure 7L,M). In contrast, pP3::GUS showed significantly higher relative expression under blue light, red light, and PGRs compared to H2O, with the highest expression under blue light and SA, and no significant difference under UV light (Figure 7N,O). In summary, the leaves of the transgenic tobacco expressing the CsF3Ha-GUS construct exhibited responsive behavior to both visible light and PGRs.

3. Discussion

3.1. The Key Cis-Elements of CsF3Ha Promoter

The CsF3Ha promoter’s key cis-acting elements included blue light, red light, UV light, ABA, GA3, SA, and MeJA. Among these, light was one of the most important environmental factors affecting plant anthocyanin biosynthesis [15]. Data showed that the CsF3Ha promoter was significantly increased under blue light, red light, and UV light (Figure 7), with the light response element (BOX 4, I-BOX, GATABOX, and -10 PEHVPSBD) identified within the CsF3Ha promoter (Figure 5A). While predictive analysis exclusively revealed these light response elements, there might be other potential elements influencing CsF3Ha promoter activity that eluded prediction. Both blue light and UV light induced anthocyanin content by activating anthocyanin biosynthesis genes [16,17]. PGRs also impacted anthocyanin biosynthesis [18], with PGRs treatments up-regulating the CsF3Ha promoter (Figure 7). This suggested widespread distribution of PGR-responsive elements within P1, P2, and P3, consistent with promoter prediction results (Figure 5A). Interestingly, MeJA-related elements were not predicted in P2 and P3, but data demonstrated that P2 and P3 transgenic plants respond to MeJA, suggesting their potential as MeJA-inducing elements. PGRs, including ABA [19], MeJA [20], GA3 [21], and ethephon [22], play a role in foliar anthocyanin accumulation [23,24]. Notably, ethephon-related elements were not predicted in CsF3Ha promoter prediction analysis. Nevertheless, we speculated that P1, P2, and P3 might harbor potential ethephon-inducible elements. While the precise identification of cis-acting element sequences remains elusive, the CsF3Ha promoter undeniably contained a rich array of cis-acting elements associated with blue light, red light, UV light, ABA, GA3, SA, and MeJA.

3.2. Differences of CsF3Ha Promoter the P1, P2 and P3

The most robust expression of GUS was detected in pP1::GUS and pP3::GUS lines under blue light and SA conditions. In contrast, the most potent GUS expression was observed in pP2::GUS lines under blue light and ethephon, warranting further investigation (Figure 7). Interestingly, pP2::GUS lines exhibited expression under UV light, whereas pP1::GUS and pP3::GUS lines did not, suggesting possible inhibition of pP1::GUS and pP3::GUS activity by specific cis-elements under UV light. Histochemical GUS staining and GUS activity analysis validated these findings. Differences in the induction intensity of various promoter segments under diverse light and PGR conditions might be linked to specific cis-elements’ distribution in their sequences [25]. Following ABA treatment, the GUS activity of pP3::GUS was strongly induced, indicating that the ABA response element could activate gene expression, promoting CsF3Ha transcription under ABA treatment. Our study aligns with earlier reports that CsF3Ha functions through an ABA-dependent pathway [26,27]. Similar results were observed under GA3, SA, ethephon, and MeJA treatments. These findings echo those in other plants, where small promoter segments, like the 300 bp AtTCTP gene promoter [28], the 262 bp MdHB-1 promoter [29], and the 171 bp SaBS promoter [30], effectively directed gene expression. In Figure 7, certain GUS expression data deviated from the observed GUS activity and staining results. Notably, discrepancies were observed in the pP1::GUS line under ethephon and GA3 treatments, as well as in the pP2::GUS line under ABA and GA3 treatments and the pP3::GUS line under red light and blue light treatments. In particular, after the ABA treatment, the GUS activity of pP1::GUS showed no significant difference, while ABA induction on staining resulted in a blue tint. This incongruity can be attributed to a temporal and spatial gap between gene transcription and translation [31]. The response of pP3::GUS to GA3 was weak, potentially due to the prevalence of numerous GA3-inhibiting transcription factors in P3. Additionally, GUS gene expression declined after certain treatments for six hours. However, the protein might remain up-regulated for an extended period due to the delay between transcriptional induction and protein level increases during state transition [32]. The above results indicated that the regulation pattern of the CsF3Ha promoter was an intricate behavior exerting a significant cumulative induction effect on anthocyanins and requires further investigation.

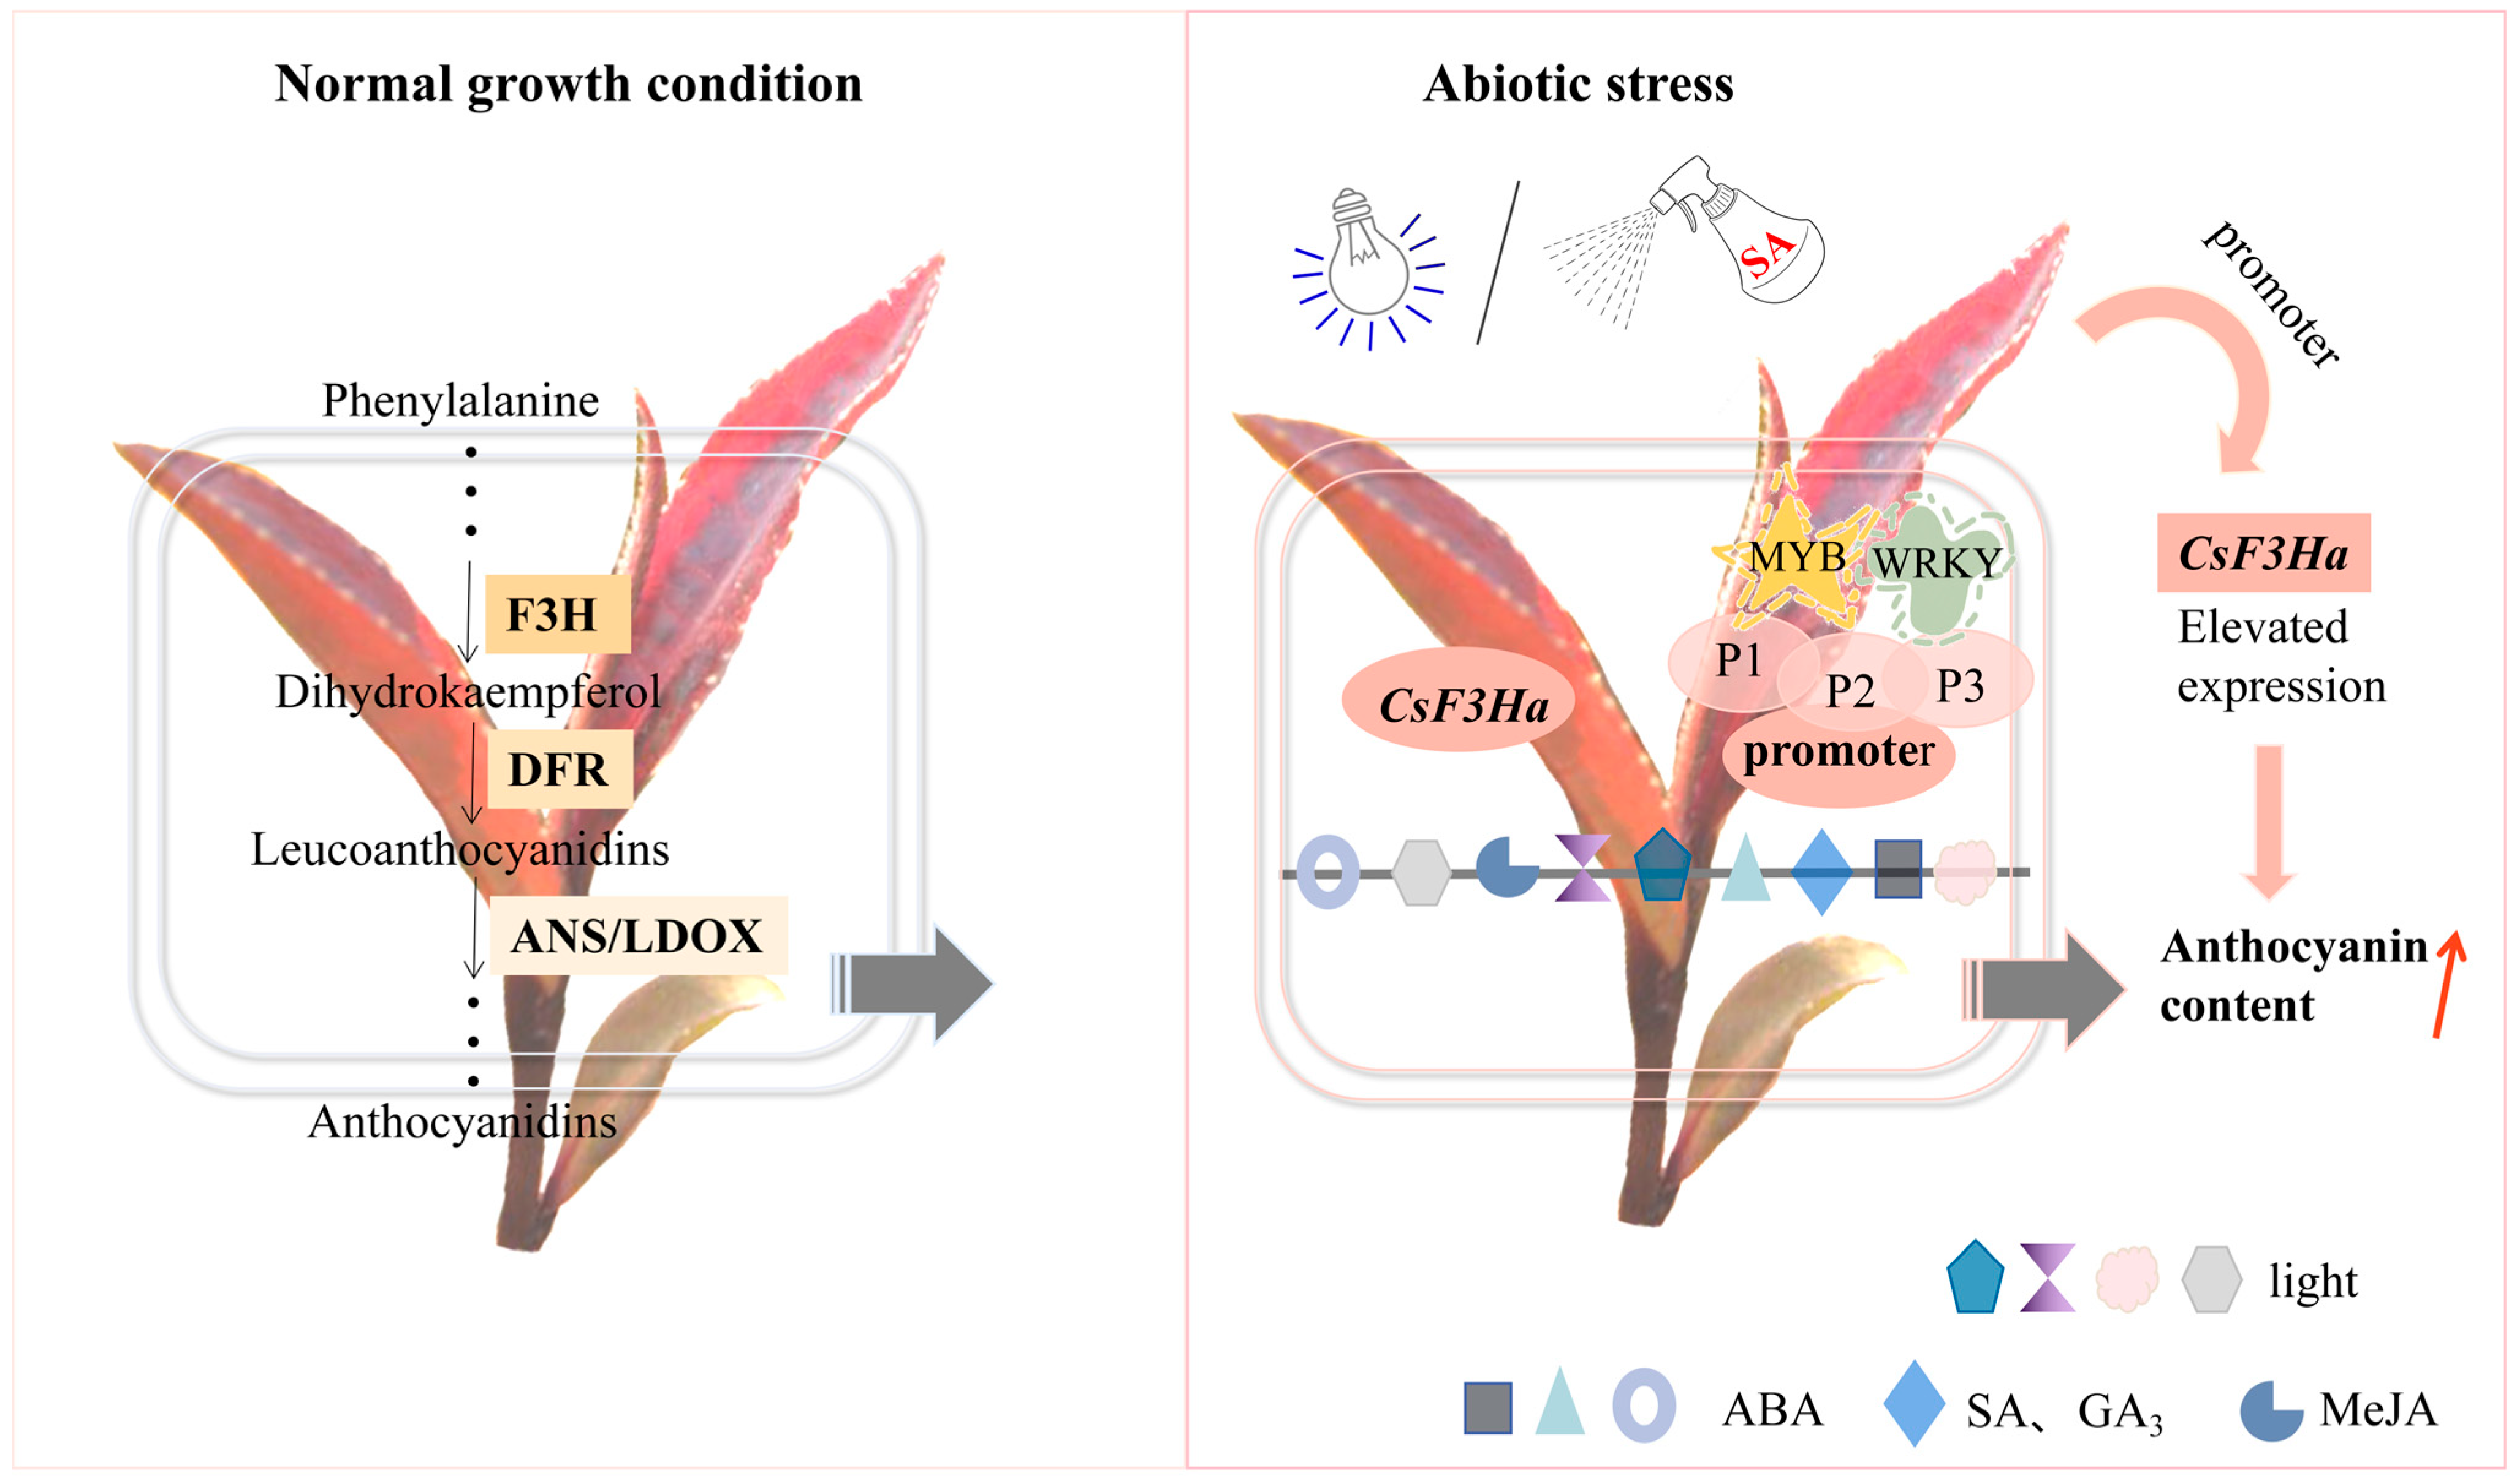
3.3. Molecular Regulatory Mechanism of CsF3Ha Promoter on Anthocyanin Synthesis in the Tea Plant

In this study, the CsF3Ha gene expression was up-regulated under blue light, red light, ABA, GA3, SA, ethephon, and MeJA treatments compared to controls (Figure 4). The visible light and PGRs stimulated the interaction between transcription factors and promoters, activating CsF3Ha promoter activity and inducing anthocyanin accumulation. To understand CsF3Ha promoter’s multiple functions, we predicted its transcriptional regulators in the model plant Nicotiana tabacum. The MYB transcription factor might directly bind to the CsF3Ha promoter, participating in flavonoid biosynthesis (Table 2). CIRCADIAN CLOCK ASSOCIATED1 (CCA1), an MYB transcription factor, was found to directly bind to the GI promoter [33]. Transcription factors like MYB, bHLH, and WD40 could regulate sweet potato’s anthocyanin synthase gene expression and synthesis [34]. Both AaORA and AaERF2 activated ALDH1 promoter expression [35]. MdERF114 directly bound to the GCC-box of MdPRX63 promoter, activating its expression and resulting in lignin deposition in apple roots [36]. R2R3-MYB transcription factors PAP1 and PAP2 were dependent regulators of anthocyanin biosynthesis [23]. In Arabidopsis thaliana, the complex of R2R3-MYB, bHLH, and WD40 (TT2, TT8, and TTG1) proteins activated proanthocyanidin gene expression [37]. Moreover, the WRKY transcription factor was WRKY DNA binding protein induced by SA, a cluster of WRKY binding sites that act as negative regulatory elements for the inducible expression of AtWRKY18 [38]. The MYB transcription factor might bind to PGR-responsive elements in the CsF3Ha promoter and Arabidopsis AtMYB2 was found to act as a transcriptional activator in ABA signaling [39]. Thus, we speculated that visible light (blue, red, and UV light) and PGRs (ABA, GA3, SA, ethephon, and MeJA) could enhance CsF3Ha promoter activity, initiating gene expression and inducing anthocyanin accumulation. Further research was needed to identify the molecular regulation mechanism of transcription factors on anthocyanin synthesis in the tea plant.

4. Materials and Methods

4.1. Plant Materials and Growth Conditions

In this study, Dr. Zhang Chi from Zhejiang A&F University generously provided Nicotiana tabacum seeds. The tobacco seedlings were cultivated for 30 days in a growth chamber at 25 °C, following a day/night photoperiod of 16/8 h, serving as the basis for genetic transformation. ‘Zijuan’ tea plants were grown in the experimental fields of Southwest Forestry University in Kunming, Yunnan Province, China (102°10′–103°40′ E, 24°23′–26°33′ N). Anthocyanin content analysis was conducted using one bud and two leaves of the ‘Zijuan’ tea plant.

4.2. Visible Light and PGRs Treatments on the Tea Plant

One bud and two leaves of the tea plant underwent treatment with blue, red, and ultraviolet (UV) light, along with the following plant growth regulators (PGRs): abscisic acid (ABA), gibberellic acid (GA3), salicylic acid (SA), ethephon, and methyl jasmonate (MeJA). The samples were arranged flat in the culture frame, with 2–3 layers of wet filter paper at the base. This ensured that the lower stem segment made contact with the wet filter paper, preventing sample water loss from influencing the experimental results. After placement, the samples received 12 h of red (1.8 W/cm2, 625–740 nm), blue (1.8 W/cm2, 400–480 nm), and UV light (3 W/cm2, 200–400 nm) exposure. Simultaneously, the leaves were sprayed with various PGRs at different concentrations, quickly sealed to avoid mutual influence, and left for a 12 h treatment period. The culture frame was positioned at approximately 25 °C with a 16 h/d day/night photoperiod, maintaining humidity. The control group was sprayed with deionized water and cultured under white light (1.8 W/cm2, 400–760 nm). Subsequently, the labeled samples were immediately frozen in liquid nitrogen and stored at −80 °C. The light source utilized was the T5 lamp.

4.3. Assay of Anthocyanin Content

The anthocyanin content in tea plant samples was quantified using the spectrophotometric method previously described with modifications by Abdel-Aal [40]. Plant materials (1 g), quick-frozen and ground with liquid nitrogen in a mortar, were then adjusted to 50 mL volume with acidic ethanol. After centrifugation at 4 °C, 2000–2500 rpm for 5 min, 4 mL supernatant was transferred to a tube. Then, 6 mL acidic ethanol were added and it developed color for 30 min. Acidic ethanol served as a blank control for measuring OD525, and anthocyanin content was calculated based on absorption values. The concentration of anthocyanin were measured by the following formula: anthocyanin (mg/g) = [(A fluid to be checked—A control solution) × 101.83/(4 × sample weight)]. Finally, the anthocyanin content was expressed as the amount in a 1 g sample.

4.4. Screening of Candidate Genes

The cDNAs from the apical bud and the first, second, and third leaves under the bud served as templates. A working solution of 1–5 ng/μL concentration was added to the fluorescence quantitative plate per the reaction system. The 20.0 μL reaction system comprised 10.0 μL EvaGreen 2 × qPCR Master Mix, 0.6 µL forward and reverse primers each (Table 2), 2.0 µL DNA template (<100 ng), and ddH2O used to adjust to a final volume of 20.0 µL. After attachment of the membrane, centrifugation was performed at 2400 rpm at 4 °C for 3 min, and then amplified by qPCR. The relative expressions of F3Ha, F3Hb, DFRa, DFRb, ANSa, and ANSb were calculated using the 2−ΔΔCt method following Zhao [41], with the β-actin gene as the reference.

4.5. Analysis of the Quantitative Real-Time PCR for CsF3Ha Gene

Total RNA from buds or leaves was extracted using the Hipure HP Plant RNA Mini Kit (Magen, Shanghai, China) following the manufacturer’s instructions. Subsequently, first-strand cDNA was synthesized via reverse transcription using the respective kit (TransGen Biotech, Beijing, China) according to the manufacturer’s guidelines. Gene structure was elucidated by comparing coding and genomic sequences of CsF3Ha sourced from the Camellia sinensis var. sinensis cultivar genomic database (XP-028107405.1). The primers were then designed based on the full-length cDNA of CsF3Ha and β-actin (Table 2). The relative expression of CsF3Ha was calculated using the 2−ΔΔCt method, as detailed by Zhao [41].

4.6. Promoter Cloning and Sequence Analysis

The 5’ upstream genomic sequence was obtained from the genomic database. Specific primers for promoter isolation were designed based on the reference sequence P F/R (Table 2). Genomic DNA, extracted from tea plant leaves using the DNA secure Plant Kit (Tiangen, Beijing, China), served as the template. The CsF3Ha promoter region was PCR-amplified under the following conditions: initial denaturation at 94 °C for 5 min, followed by 35 cycles at 94 °C for 30 s, 56 °C for 30 s, and 72 °C for 1 min, with a final extension at 72 °C for 10 min. The PCR product underwent purification, cloning into the pMD18-T vector (TaKaRa, Dalian, China), and sequencing by Shanghai Sangon Biotech Co. Ltd. (Shanghai, China). PlantCARE was utilized to predict the CsF3Ha promoter’s cis-elements [42].

4.7. Vector Construction of CsF3Ha Promotor and Transformation

The bacterial liquid from the preceding step served as a template. Three promoter fragments, named P1, P2, and P3, were derived using different primers (P1 F/R, P2 F/R, and P3 F/R, incorporating EcoRI and SalI restriction sites) (Table 2). These fragments comprised the full-length promoter (1691 bp, denoted as P1), −890 to +1 bp (designated as P2), and −467 to +1 bp (labeled as P3). The products were cloned and sequenced, and the correct sequence clones were obtained. The plasmids of the correct clones were extracted, and digested with EcoRI and SalI. Subsequently, they were ligated into the binary expression vector pCAMBIA1300-GUS, which had been digested by EcoRI and SalI. This process yielded three expression vectors: P1-GUS, P2-GUS, and P3-GUS. These plasmids were transformed into EHA105 and subsequently transformed into tobacco plantlet leaves.
Using the Agrobacterium-mediated leaf disc method, the P1, P2, and P3 constructs were transformed into tobacco [25]. Transgenic plants were screened on MS medium containing 20 mg/L of hygromycin. The transgenic plants after one propagation cycle were utilized for further GUS activity analysis.

4.8. Histochemical GUS Staining

After one month of growth, three transgenic tobacco lines (P1, P2, and P3), exhibiting robust growth and normal rooting, were randomly chosen. The leaves of the one positive plants were treated with visible light (red, blue, and UV light) and PGRs (100 mg/L ABA, 100 mg/L GA3, 300 mg/L SA, 60 mg/L ethephon, and 150 mg/L MeJA) for a 2 h duration. Controls involved white light irradiation and spraying with deionized water. Histochemical staining, following Jefferson’s protocol [43], was conducted on the leaves, which were subsequently incubated in GUS staining buffer, including 50 mM sodium phosphate buffer (pH 7.2), 2 mM 5-Bromo-4chloro-indolyl-b-D-glucuronide (X-Gluc), 2 mM K3Fe[CN]6, 2 mM K4[Fe(CN)6]·3H2O, 0.1% Triton X-100, and 10 mM Na2EDTA·2H2O for a 12 h duration at 37 °C. Stained samples were then cleared with 70% ethanol, and observed visually.

4.9. GUS Activity Assay

The leaves of lines and treatment methods used the same method as the histochemical GUS staining. The leaves were ground in a mortar, with a sample mass (g) to 0.01 M PBS (pH 7.2–7.4) volume (mL) ratio of 1:9. After homogenization, the sample was centrifuged, and the supernatant was collected. GUS enzyme activity was assessed using the GUS enzyme activity kit (Plant GUS Elisa Kit, Shanghai, China), following standard instructions. The absorbance value at 450 nm, obtained post-reaction, was measured using an enzyme label meter. GUS activity in the sample was then calculated based on the standard curve.

4.10. The GUS Gene Relative Expression

The leaves of lines and treatment methods used the same method as the histochemical GUS staining. The total RNA was extracted under RNase-free conditions using the Trigol reagent (Invitrogen, Carlsbad, CA, USA). The cDNA fragment was then synthesized using the Tiangen Quant cDNA reverse transcription kit (Tiangen, Beijing, China). The RNA quality and integrity were assessed via 1% agarose gel electrophoresis. Table 2 presents the list of primers for the GUS gene and reference genes (EF1α F/R) used in qRT-PCR GUS gene expression was calculated using the same method for screening candidate genes.

4.11. Statistical Analysis

Each P1, P2, and P3 transgenic tobacco line underwent three replicates. Three biological replicates were used for each measurement. Statistical analysis employed IBM SPSS Statistics 25, Origin 2023, and GraphPad Prism 9, utilizing the Duncan’s multiple range test for examining significant differences between groups. One-way ANOVA was used for multiple comparisons. All data was presented as mean ± standard error of the mean. A p < 0.05 indicated significance.

5. Conclusions

In this study, the CsF3Ha promoter regions of P1, P2, and P3 were fused to the GUS reporter gene, and many cis-elements were predicted. We observed a significant induction of the CsF3Ha promoter by SA and blue light under diverse abiotic stresses. Expression analysis of the CsF3Ha gene and anthocyanin content assay substantiated this observation. Thus, we speculated that transcription factors WRKY and MYB could bind CsF3Ha promoter motifs, enhancing its activity, initiating gene expression, and thereby inducing anthocyanin accumulation (Figure 8). This study elucidated the expression characteristics of the CsF3Ha promoter in tea plants, thus contributing to a deeper understanding of the complex regulatory mechanisms governing CsF3Ha expression in anthocyanin synthesis and accumulation. The functionally validated CsF3Ha promoter identified in this study stands as a promising candidate for genetic engineering to regulate anthocyanin synthesis and accumulation.

Author Contributions

Y.B. conducted the data analysis and finished the manuscript; R.Z. prepared the tables; H.Z. and J.L. prepared the figures; T.W. designed the experiments and modified the manuscript. In addition, all authors provided critical feedback and helped shape the research, analysis, and manuscript. All authors have read and agreed to the published version of the manuscript.

Funding

This work was funded by the Joint Special Project of Yunnan Province for Agricultural Basic Research (202301BD070001-242).

Data Availability Statement

The data presented in this study are available on request from the corresponding author.

Conflicts of Interest

The authors declare no conflicts of interest.

References

  1. Lv, H.P.; Dai, W.D.; Tan, J.F.; Guo, L.; Zhu, Y.; Lin, Z. Identification of the anthocyanins from the purple leaf coloured tea cultivar Zijuan (Camellia sinensis var. assamica) and characterization of their antioxidant activities. J. Funct. Foods 2015, 17, 449–458. [Google Scholar] [CrossRef]
  2. Khusnutdinov, E.; Sukhareva, A.; Panfilova, M.; Mikhaylova, E. Anthocyanin biosynthesis genes as model genes for genome editing in plants. Int. J. Mol. Sci. 2021, 22, 8752. [Google Scholar] [CrossRef] [PubMed]
  3. Mattioli, R.; Francioso, A.; Mosca, L.; Silva, P. Anthocyanins: A comprehensive review of their chemical properties and health effects on cardiovascular and neurodegenerative diseases. Molecules 2020, 25, 3809. [Google Scholar] [CrossRef] [PubMed]
  4. Salehi, J.; Sharifi-Rad, F.; Cappellini, Z.; Reiner, D.; Zorzan, M.; Imran, B.; Sener, M.; Kilic, M.; El-Shazly, N.M.; Fahmy, E.; et al. The therapeutic potential of anthocyanins: Current approaches based on their molecular mechanism of action. Front. Pharmacol. 2020, 11, 1300. [Google Scholar] [CrossRef] [PubMed]
  5. Kozłowska, A.; Dzierzanowski, T. Targeting inflammation by anthocyanins as the novel therapeutic potential for chronic diseases: An update. Molecules 2021, 26, 4380. [Google Scholar] [CrossRef] [PubMed]
  6. Joshi, R.; Rana, A.; Kumar, V.; Kumar, D.; Padwad, Y.S.; Yadav, S.K.; Gulati, A. Anthocyanins enriched purple tea exhibits antioxidant, immunostimulatory and anticancer activities. J. Food Sci. Technol. 2017, 54, 1953–1963. [Google Scholar] [CrossRef] [PubMed]
  7. Zhang, H.; Xu, Z.; Zhao, H.; Wang, X.; Pang, J.; Li, Q.; Yang, Y.; Ling, W. Anthocyanin supplementation improves anti-oxidative and anti-inflammatory capacity in a dose-response manner in subjects with dyslipidemia. Redox. Biol. 2020, 32, 101474. [Google Scholar] [CrossRef]
  8. Guo, N.; Cheng, F.; Wu, J.; Liu, B.; Zheng, S.; Liang, J.; Wang, X. Anthocyanin biosynthetic genes in Brassica rapa. BMC Genom. 2014, 15, 426. [Google Scholar] [CrossRef]
  9. Goswami, G.; Nath, U.K.; Park, J.I.; Hossain, M.R.; Biswas, M.K.; Kim, H.T.; Kim, H.R.; Nou, I.S. Transcriptional regulation of anthocyanin biosynthesis in a high-anthocyanin resynthesized Brassica napus cultivar. J. Biol. Res. (Thessalon) 2018, 25, 19. [Google Scholar] [CrossRef]
  10. Tanaka, Y.; Sasaki, N.; Ohmiya, A. Biosynthesis of plant pigments: Anthocyanins, betalains and carotenoids. Plant J. 2008, 54, 733–749. [Google Scholar] [CrossRef]
  11. Alappat, B.; Alappat, J. Anthocyanin pigments: Beyond aesthetics. Molecules 2020, 25, 5500. [Google Scholar] [CrossRef]
  12. Carbone, F.; Preuss, A.; De Vos, R.C.; D’Amico, E.; Perrotta, G.; Bovy, A.G.; Martens, S.; Rosati, C. Developmental, genetic and environmental factors affect the expression of flavonoid genes, enzymes and metabolites in strawberry fruits. Plant Cell Environ. 2009, 32, 1117–1131. [Google Scholar] [CrossRef] [PubMed]
  13. Yang, P.; Yuan, C.; Wang, H.; Han, F.; Liu, Y.; Wang, L.; Yang, L. Stability of anthocyanins and their degradation products from cabernet sauvignon red wine under gastrointestinal pH and temperature conditions. Molecules 2018, 23, 354. [Google Scholar] [CrossRef]
  14. Han, Y.; Huang, K.; Liu, Y.; Jiao, T.; Ma, G.; Qian, Y.; Wang, P.; Dai, X.; Gao, L.; Xia, T. Functional analysis of two flavanone-3-hydroxylase genes from Camellia sinensis: A critical role in flavonoid accumulation. Genes 2017, 8, 300. [Google Scholar] [CrossRef] [PubMed]
  15. Zoratti, L.; Karppinen, K.; Luengo Escobar, A.; Häggman, H.; Jaakola, L. Light-controlled flavonoid biosynthesis in fruits. Front. Plant Sci. 2014, 5, 534. [Google Scholar] [CrossRef]
  16. Tao, R.; Bai, S.; Ni, J.; Yang, Q.; Zhao, Y.; Teng, Y. The blue light signal transduction pathway is involved in anthocyanin accumulation in ‘Red Zaosu’ pear. Planta 2018, 248, 37–48. [Google Scholar] [CrossRef] [PubMed]
  17. Li, W.; Tan, L.; Zou, Y.; Tan, X.; Huang, J.; Chen, W.; Tang, Q. The effects of ultraviolet A/B treatments on anthocyanin accumulation and gene expression in dark-purple tea cultivar ‘Ziyan’ (Camellia sinensis). Molecules 2020, 25, 354. [Google Scholar] [CrossRef] [PubMed]
  18. Das, P.K.; Shin, D.H.; Choi, S.B.; Park, Y.I. Sugar-hormone cross-talk in anthocyanin biosynthesis. Mol. Cells 2012, 34, 501–507. [Google Scholar] [CrossRef]
  19. An, J.P.; Zhang, X.W.; Liu, Y.J.; Wang, X.F.; You, C.X.; Hao, Y.J. ABI5 regulates ABA-induced anthocyanin biosynthesis by modulating the MYB1-bHLH3 complex in apple. J. Exp. Bot. 2020, 72, 1460–1472. [Google Scholar] [CrossRef]
  20. An, J.P.; Xu, R.R.; Liu, X.; Zhang, J.C.; Wang, X.F.; You, C.X.; Hao, Y.J. Jasmonate induces biosynthesis of anthocyanin and proanthocyanidin in apple by mediating the JAZ1-TRB1-MYB9 complex. Plant J. 2021, 106, 1414–1430. [Google Scholar] [CrossRef]
  21. Xie, S.; Liu, Y.; Chen, H.; Yang, B.; Ge, M.; Zhang, Z. Effects of gibberellin applications before flowering on the phenotype, ripening, and flavonoid compounds of Syrah grape berries. J. Sci. Food Agric. 2022, 102, 6100–6111. [Google Scholar] [CrossRef]
  22. An, J.P.; Wang, X.F.; Li, Y.Y.; Song, L.Q.; Zhao, L.L.; You, C.X.; Hao, Y.J. EIN3-LIKE1, MYB1, and ethylene response factor3 act in a regulatory loop that synergistically modulates ethylene biosynthesis and anthocyanin accumulation. Plant Physiol. 2018, 178, 808–823. [Google Scholar] [CrossRef] [PubMed]
  23. Loreti, E.; Povero, G.; Novi, G.; Solfanelli, C.; Alpi, A.; Perata, P. Gibberellins, jasmonate and abscisic acid modulate the sucrose-induced expression of anthocyanin biosynthetic genes in Arabidopsis. New Phytol. 2008, 179, 1004–1016. [Google Scholar] [CrossRef]
  24. Wang, Y.C.; Wang, N.; Xu, H.F.; Jiang, S.H.; Fang, H.C.; Su, M.Y.; Zhang, Z.Y.; Zhang, T.L.; Chen, X.S. Auxin regulates anthocyanin biosynthesis through the Aux/IAA-ARF signaling pathway in apple. Hortic. Res. 2018, 5, 59. [Google Scholar] [CrossRef]
  25. Dong, G.; Fan, M.; Wang, H.; Leng, Y.; Sun, J.; Huang, J.; Zhang, H.; Yan, J. Functional characterization of TkSRPP promoter in response to hormones and wounding stress in transgenic tobacco. Plants 2023, 12, 252. [Google Scholar] [CrossRef] [PubMed]
  26. Riboni, M.; Galbiati, M.; Tonelli, C.; Conti, L. GIGANTEA enables drought escape response via abscisic acid-dependent activation of the florigens and suppressor of overexpression of constans. Plant Physiol. 2013, 162, 1706–1719. [Google Scholar] [CrossRef] [PubMed]
  27. Baek, D.; Kim, W.Y.; Cha, J.Y.; Park, H.J.; Shin, G.; Park, J.; Lim, C.J.; Chun, H.J.; Li, N.; Kim, D.H.; et al. The GIGANTEA-ENHANCED EM LEVEL complex enhances drought tolerance via regulation of abscisic acid synthesis. Plant Physiol. 2020, 184, 443–458. [Google Scholar] [CrossRef]
  28. Han, Y.J.; Kim, Y.M.; Hwang, O.J.; Kim, J.I. Characterization of a small constitutive promoter from Arabidopsis translationally controlled tumor protein (AtTCTP) gene for plant transformation. Plant Cell Rep. 2015, 34, 265–275. [Google Scholar] [CrossRef]
  29. Wang, H.J.; Jiang, Y.H.; Qi, Y.W.; Dai, J.Y.; Liu, Y.L.; Zhu, X.B.; Liu, C.H.; Lü, Y.R.; Ren, X.L. Identification and functional characterization of the MdHB-1 gene promoter sequence from Malus×domestica. J. Integr. Agric. 2017, 16, 1730–1741. [Google Scholar] [CrossRef]
  30. Yan, H.; Xiong, Y.; Teixeira da Silva, J.A.; Pang, J.; Zhang, T.; Yu, X.; Zhang, X.H.; Niu, M.Y.; Ma, G.H. Molecular cloning and functional characterization of Bisabolene Synthetase (SaBS) promoter from Santalum album. Forests 2020, 11, 85. [Google Scholar] [CrossRef]
  31. Tang, W.; Wang, X.X.; Kou, M.; Yan, H.; Gao, R.F.; Li, C.; Song, W.H.; Zhang, Y.G.; Wang, X.; Liu, Y.J.; et al. The sweetpotato GIGANTEA gene promoter is co-regulated by phytohormones and abiotic stresses in Arabidopsis thaliana. Plant Physiol. Bioch. 2021, 168, 143–154. [Google Scholar] [CrossRef]
  32. Liu, Y.; Beyer, A.; Aebersold, R. On the dependency of cellular protein levels on mRNA abundance. Cell 2016, 165, 535–550. [Google Scholar] [CrossRef]
  33. Lu, S.X.; Webb, C.J.; Knowles, S.M.; Kim, S.H.; Wang, Z.; Tobin, E.M. CCA1 and ELF3 interact in the control of hypocotyl length and flowering time in Arabidopsis. Plant Physiol. 2012, 158, 1079–1088. [Google Scholar] [CrossRef]
  34. Fu, D.; Zhang, J.; Wang, D.; Gao, F. Molecular cloning, functional characterization and transcriptional regulation of the promoter of dihydroflavonal-4-reductase gene from purple-fleshed sweet potato. S. Afr. J. Bot. 2020, 131, 206–213. [Google Scholar] [CrossRef]
  35. Wang, H.; Liu, W.; Qiu, F.; Chen, Y.; Zhang, F.; Lan, X.; Chen, M.; Zhang, H.; Liao, Z. Molecular cloning and characterization of the promoter of aldehyde dehydrogenase gene from Artemisia annua. Biotechnol. Appl. Biochem. 2017, 64, 902–910. [Google Scholar] [CrossRef] [PubMed]
  36. Liu, Y.; Liu, Q.; Li, X.; Zhang, Z.; Ai, S.; Liu, C.; Ma, F.; Li, C. MdERF114 enhances the resistance of apple roots to Fusarium solani by regulating the transcription of MdPRX63. Plant Physiol. 2023, 31, kiad057. [Google Scholar] [CrossRef]
  37. Xu, W.; Dubos, C.; Lepiniec, L. Transcriptional control of avonoid biosynthesis by MYB-bHLH-WDR complexes. Trends Plant. Sci. 2015, 20, 176–185. [Google Scholar] [CrossRef]
  38. Chen, C.; Chen, Z. Potentiation of developmentally regulated plant defense response by AtWRKY18, a pathogen-induced Arabidopsis transcription factor. Plant Physiol. 2002, 129, 706–716. [Google Scholar] [CrossRef]
  39. Abe, H.; Urao, T.; Ito, T.; Seki, M.; Shinozaki, K.; Yamaguchi-Shinozaki, K. Arabidopsis AtMYC2 (bHLH) and AtMYB2 (MYB) function as transcriptional activators in abscisic acid signaling. Plant Cell 2003, 15, 63–78. [Google Scholar] [CrossRef]
  40. Abdel-Aal, J.; El-Sayed, M.; Young, J.C.; Rabalski, I. Anthocyanin composition in black, blue, pink, purple, and red cereal grains. J. Agric. Food Chem. 2006, 54, 4696–4704. [Google Scholar] [CrossRef]
  41. Zhao, K.; Shen, X.; Yuan, H.; Liu, Y.; Liao, X.; Wang, Q.; Liu, L.; Li, F.; Li, T. Isolation and characterization of dehydration-responsive element-binding factor 2C (MsDREB2C) from Malus sieversii Roem. Plant Cell Physiol. 2013, 54, 1415–1430. [Google Scholar] [CrossRef]
  42. Song, H.; Wang, P.; Hou, L.; Zhao, S.; Zhao, C.; Han, X.; Li, P.; Zhang, Y.; Bian, X.; Wang, X. Globalanalysis of WRKY genes and their response to dehydration and salt stress in soybean. Front. Plant Sci. 2016, 7, 9. [Google Scholar] [CrossRef]
  43. Wang, C.; Gao, G.; Cao, S.; Xie, Q.; Qi, H. Isolation and functional validation of the CmLOX08 promoter associated with signalling molecule and abiotic stress responses in oriental melon, Cucumis melo var. makuwa Makino. BMC Plant Biol. 2019, 19, 75. [Google Scholar] [CrossRef]
Figure 1. Effects of different treatments on anthocyanin content in tea plant leaves. (A): The change in anthocyanin content following irradiation with blue, UV, or red light. (BF): Effects on anthocyanin content of different concentrations of ABA, GA3, SA, ethephon, and MeJA, respectively. Different small letters indicate significant differences at p < 0.05, and the same below.
Plants 13 00196 g001
Figure 2. Relative expression of the genes in the anthocyanin synthesis pathway of tea plant leaves. (AF): The relative expression of F3Ha, F3Hb, DFRa, DFRb, ANSa, and ANSb genes, respectively. (G): Schematic drawing of one bud and one leaf, one bud and two leaves, and one bud and three leaves. Note: the bar chart shows the mean of the three biological replicates, and the error bars are standard deviations, and the asterisks indicate statistical difference in one-way analysis of variance (ns p < 0.1234, *** p < 0.0002, **** p < 0.0001).
Plants 13 00196 g002
Figure 3. Multiple alignment of CsF3H protein and phylogenetic tree analysis of CsF3Ha. (A): Multiple alignment of CsF3H protein from other plants. (B): Phylogenetic tree analysis of CsF3H among multitudinous horticultural herbaceous and woody plants. CsF3Ha was highlighted with the red dot in the phylogenetic tree. Note: VaF3H (KP966099.1, Vitis amurensis), VvF3H (NM001281105.1, Vitis vinifera), VrF3H (KF040970.1, Vitis rotundifolia), SlF3H (KT954907.1, Silene littorea), MaF3H (ON055162.1, Morus alba), MnF3H (KF438044.1, Morus notabilis), OfF3H (MT495418.1, Osmanthus fragrans), OeF3H (XM023028959.1, Olea europaea), VwF3H (KJ463622.1, Viola wittrockiana), EmF3H (MW767838.1, Euphorbia maculata), VfF3H (KY656685.1, Vernicia fordii), TsF3H (MN906942.1, Triadica sebifera), CsF3Ha (MT355076, Camellia sinensis), CnF3H (HQ290517.1, Camellia nitidissima), CcF3H (HQ290517.1, Camellia nitidissima), MiF3H (KF513568.1, Meconopsis integrifolia), MsF3H (KF513571.1, Meconopsis simplicifolia), MbF3H (KF513559.1, Meconopsis betonicifolia), MrF3H (KF513570.1, Meconopsis racemosa), MhF3H (KF513566.1, Meconopsis horridula), MpF3H (KF513569.1, Meconopsis pseudohorridula), MdF3H (KF513565.1, Meconopsis delavayi), EuF3H (OK648437.1, Erythronium umbilicatum), RaF3H (OP018672.1, Rhododendron agastum), AcF3H (FJ542819.1, Actinidia chinensis), RpF3H (AB289594.1, Rhododendron pulchrum), MwF3H (MW373502.1, Meconopsis wilsonii), TcF3H (KU551927.1, Thesium chinense), ScF3H (AY332537.1, Sinningia cardinalis), ShF3H (LC322157.1, Saintpaulia hybrid), CaF3H (KY348830.1, Camptotheca acuminata), VcF3H (MH321462.1, Vaccinium corymbosum), VmF3H (MZ926696.1, Vaccinium myrtillus).
Plants 13 00196 g003aPlants 13 00196 g003b
Figure 4. The expression of the CsF3Ha gene under different treatments. (A): Effects of visible light irradiation on CsF3Ha gene expression. (B): Effects of spraying different PGRs on CsF3Ha gene expression. Note: The samples were treated by red (1.8 W/cm2, 625–740 nm), blue (1.8 W/cm2, 400–480 nm), and UV (3 W/cm2, 200–400 nm) light, as well as 100 mg/L ABA, 100 mg/L GA3, 300 mg/L SA, 60 mg/L ethephon, and 150 mg/L MeJA for 12 h. The control group was sprayed with deionized water and cultured under white light (1.8 W/cm2, 400–760 nm) for 12 h.
Plants 13 00196 g004
Figure 5. Predictive analysis of active elements in promoter sequence of the CsF3Ha gene. (A): Several potential cis-acting elements were predicted by the PLACE database, which were shaded colors and designated with the name of each of the motifs and constructed into an expression vector. The translation start codon ATG was displayed at the end of the promoter sequence, and the “A” in “ATG” was designated as “+1” position. (B): Diagram of the main cis-acting elements in the CsF3Ha promoter segments (P1, P2, and P3). The cis-elements associated with lights and PGRs were represented by different colored boxes.
Plants 13 00196 g005
Figure 6. Transgenic tobacco in the media with hygromycin resistance. (A): Differentiated adventitious buds from the tobacco callus were screened for culture on 15th day. (B): Adventitious bud of hygromycin-resistant tobacco. (C): Adventitious buds cut from the callus. (D): Adventitious buds after 30 days. (E): Adventitious buds were induced during rooting. (F): Root of transgenic tobacco.
Plants 13 00196 g006
Figure 7. Histochemical GUS staining, GUS activity assay, and the GUS gene’s relative expression. (AC): The GUS staining was detected under visible light and PGRs in the lines from pP1::GUS, pP2::GUS, and pP3::GUS. GUS activity assay under visible light and PGRs in the lines from pP1::GUS (D,E), pP2::GUS (F,G), and pP3::GUS (H,I). The GUS gene relative expression under visible light and PGRs in the lines from pP1::GUS (J,K), pP2::GUS (L,M), and pP3::GUS (N,O). The asterisks indicate statistical difference in one-way analysis of variance (ns p < 0.1234, * p < 0.0332, ** p < 0.0021, *** p < 0.0002, **** p < 0.0001).
Plants 13 00196 g007
Figure 8. A model illustrating the role of the CsF3Ha promoter in anthocyanin accumulation of the ‘Zijuan’ tea plant.
Plants 13 00196 g008
Table 1. Transcription-factor-related analysis of the cis-acting element of the CsF3Ha promoter.
Cis-ElementsNumberFunctionMotif
W-BOX10transcription suppressor of the GA3 signaling pathwayTGAC
W-BOX5They were recognized specifically by salicylic acid (SA)-induced WRKY DNA-binding proteinsTTGAC
W-BOX3A novel WRKY transcription factor, SUSIBA2, participates in sugar signaling in barley by binding to the sugar-responsive elements of the iso1 promoterTGACT
MYB PZM1cis-acting regulatory element involved in plant red pigment regulationCCWACC
MYB PLANT1Promoters of phenylpropanoid biosynthetic genes, such as PAL, CHS, CHI, DFRMACCWAMC
MYB CORE3Cis-acting regulatory element involved in flavonoid biosynthesisCNGTTR
MYB1AT2MYB recognition site found in the promoters of the dehydration-responsive gene rd22 and many other genes in ArabidopsisWAACCA
Table 2. Primer sequences mentioned in this research.
Primer NameSequences (5′-3′)Primer NameSequences (5′-3′)
F3HaFCCGATTCTTGAAGAGCCAATCACGF3HaRTGAGAAGGCCAAGGTGGAAAT
F3HbFTCAATAATGGAGGAACCAATCACCF3HbRGGAGTCCAAGCCAGTAGATGA
DFRaFGAATCATTGAAACCTATCCDFRaRTAGAGAAAAGGGGATGTTGT
DFRbFAAGGACTTGCCAGTTGTGTDFRbRCAGAAAACCCTGTCAATGGC
ANSaFGTCTAGCAACAAAAGTCCTGTCGANSaRGAGACGTCGGTGTGGGCTTCG
ANSbFCGAGCCCTAACTACCAAGACGANSbRGGGTTGAGGGCATTTTGGGT
β-actinFGCCATCTTTGATTGGAATGGβ-actinRGGTGCCACAACCTTGATCTT
PFCCTGCCAACTGTCACCATACAPRTGAGGGACGAAGATGAACGT
P1FCCGGAATTCTAAAATGTTGAGAATCGP1RGACGTCGACCTCTCAACTGAATCGAGCAA
P2FCCGGAATTCAACCAAACTAAACTATTP2RGACGTCGACCTCTCTCTATCTCTCTCTCTCTCCTCTCTCCCTCTCTCTTCAA
P3FCCGGAATTCCACGTTGATCGGACATCGP3RGACGTCGACGGTAGGACATTTTGGGGCAA
GUS-qFGATCGCGAAAACTGTGGAATGUS-qRTAATGAGTGACCGCATCGAA
EF1α-qFTGGTTGTGACTTTTGGTCCCAEF1α-qRACAAACCCACGCTTGAGATCC
The underlined were adding restriction sites.
Disclaimer/Publisher’s Note: The statements, opinions and data contained in all publications are solely those of the individual author(s) and contributor(s) and not of MDPI and/or the editor(s). MDPI and/or the editor(s) disclaim responsibility for any injury to people or property resulting from any ideas, methods, instructions or products referred to in the content.

