Article

RNA-Seq-Based WGCNA and Association Analysis Reveal the Key Regulatory Module and Genes Responding to Salt Stress in Wheat Roots

1
College of Agronomy, Shanxi Key Laboratory of Crop Genetics and Molecular Improvement, Shanxi Agricultural University, Taiyuan 030031, China
2
Department of Biology, Taiyuan Normal University, Taiyuan 030031, China
3
Institute of Wheat Research, Shanxi Agricultural University, Linfen 041000, China
*
Authors to whom correspondence should be addressed.
Plants 2024, 13(2), 274; https://doi.org/10.3390/plants13020274
Submission received: 19 December 2023 / Revised: 13 January 2024 / Accepted: 15 January 2024 / Published: 17 January 2024
(This article belongs to the Special Issue Mining of Stress-Resistance Gene in Wheat)

Abstract

:
Soil salinization is the main abiotic stressor faced by crops. An improved understanding of the transcriptional response to salt stress in roots, the organ directly exposed to a high salinity environment, can inform breeding strategies to enhance tolerance and increase crop yield. Here, RNA-sequencing was performed on the roots of salt-tolerant wheat breeding line CH7034 at 0, 1, 6, 24, and 48 h after NaCl treatment. Based on transcriptome data, a weighted gene co-expression network analysis (WGCNA) was constructed, and five gene co-expression modules were obtained, of which the blue module was correlated with the time course of salt stress at 1 and 48 h. Two GO terms containing 249 differentially expressed genes (DEGs) related to osmotic stress response and salt-stress response were enriched in the blue module. These DEGs were subsequently used for association analysis with a set of wheat germplasm resources, and the results showed that four genes, namely a Walls Are Thin 1-related gene (TaWAT), an aquaporin gene (TaAQP), a glutathione S-transfer gene (TaGST), and a zinc finger gene (TaZFP), were associated with the root salt-tolerance phenotype. Using the four candidate genes as hub genes, a co-expression network was constructed with another 20 DEGs with edge weights greater than 0.6. The network showed that TaWAT and TaAQP were mainly co-expressed with fifteen interacting DEGs 1 h after salt treatment, while TaGST and TaZFP were mainly co-expressed with five interacting DEGs 48 h after salt treatment. This study provides key modules and candidate genes for understanding the salt-stress response mechanism in wheat roots.

1. Introduction

Soil salinization is a universal environmental issue that results in detrimental abiotic stress in agriculture, which inhibits crop growth and reduces grain yield [1]. Approximately 1 billion hectares of land worldwide are currently salinized, representing about 7% of the Earth’s land surface and 33% of irrigated lands [2]. With the continuous growth of the global population, it is necessary to fully utilize salinized land to increase crop yields and meet the growing demand for food. As the most widely planted crop in the world, common wheat (Triticum aestivum L., 2n = 6x = 42; AABBDD) contributes about one-fifth of the total calories and proteins of daily dietary intake [3]. To ensure food security, it is crucial to explore salt-tolerance genes from germplasm and to utilize them to enhance the adaptability of wheat varieties in saline soil.
For common wheat, which has an enormous and complex hexaploid genome, transcriptome sequencing is a rapid and effective method for mining candidate genes [4,5,6], especially in studies involving a stress response. Based on RNA-sequencing (RNA-Seq) data, many important biological or abiotic stress response genes have been further identified, such as the leaf rust-resistance gene Lr47 [7] and the cold tolerance gene TaSnRK1α [8]. RNA-Seq has also been applied in salt tolerance research. In Kharchia Local, a well-known salt-tolerant wheat germplasm resource in India, 2495 differentially expressed genes (DEGs) in the roots [9] and 3197 DEGs in the flag leaves [10] were identified by comparing the transcriptomes of seedlings in the NaCl-treated group and the control group, and 22 salt-induced unigenes were selected and validated through qRT-PCR. Similar analysis on Saudi salt-tolerant wheat germplasm resource No. 193 showed that 5829 genes were differentially expressed in the roots, whereas 3495 genes were identified in the shoots, of which eight DEGs were validated [11]. Moreover, RNA-Seq data from other salt-tolerant germplasm, such as the Chinese cultivars Qingmai 6 [12], Xiaoyan 60 [13], Jimai 22 [14], and Cangmai 6005 [15], as well as Iranian cultivar Arg [16], also revealed many DEGs responding to salt stress, helping to further identify salt-tolerance genes in wheat. However, most of the previously reported RNA-Seq analyses have been based solely on DEGs and use simple qRT-PCR to validate candidate genes, which cannot uncover more useful information. The salt tolerance of wheat is a complex quantitative trait controlled by multiple genes, making it more suitable to use network analysis methods to identify important salt-tolerance response pathways and strongly related genes.
In model plants, such as Arabidopsis, seedlings respond strongly at the molecular level in the early stage of salt stress. As the first organ to be exposed to stress, the roots directly face osmotic stress due to high salt concentrations in the soil [17] and suffer from salt stress, as well as the entrance of Na+ through a nonselective cation channel or other means [18]. Subsequently, pathways such as signal transduction and transcriptional regulation respond, initiating the plant’s salt-tolerance mechanism [19,20]. With the development of high-throughput sequencing technology, weighted gene co-expression network analysis (WGCNA) is becoming increasingly mature [21]. This method can obtain a series of biologically significant co-expression modules, and has been successfully used to analyze the transcriptome data of multiple samples in rice [22] and maize [23], identifying key regulatory pathways and genes responsive to salt stress. WGCNA was also adopted in a recent study on wheat that reported the expression patterns and the time course of root tissue from salt-tolerant wheat line ST9644 under NaCl stress [24]. Here, we performed RNA-Seq on the roots of salt-tolerant wheat breeding line CH7034 [25] after 0, 1, 6, 24, and 48 h of NaCl treatment, and performed WGCNA to screen for important gene co-expression modules related to salt stress. Then, we used salt-tolerant phenotype data from a set of wheat germplasm to perform association analyses on the genes in the selected co-expression modules to identify key salt-tolerance genes.

2. Results

2.1. RNA-Seq Data Evaluation

The transcriptome sequencing of 15 root samples of the salt-tolerant breeding line CH7034 resulted in 166.70 Gb clean reads. Each sample obtained clean data above 9.54 Gb with Q30-based percentages greater than 93.60% and GC percentages ranging from 52.06 to 54.05% (Table S1), indicating that the RNA-Seq data were of high quality for further analysis. Subsequently, 452,237,372 clean reads were mapped on the Chinese Spring reference genome RefSeq v1.0, and the uni-transcripts were annotated as known genes. A total of 56,420 genes with an average fragments per kilobase of exon model per million mapped fragments (FPKM) of >1 in at least one treatment (1, 6, 24, and 48 h) were considered expressed genes.
Differential expression analysis identified 6571, 19,414, 20,273, and 22,105 DEGs at 1, 6, 24, and 48 h of NaCl treatment, respectively, compared with the transcriptome data at 0 h (Figure 1a). The number of DEGs upregulated by salt stress was greater than that of downregulated DEGs (Figure 1a). Overall, 30,369 DEGs were upregulated or downregulated in at least one treatment, and 4017 DEGs appeared at each stress time point (Figure 1b).

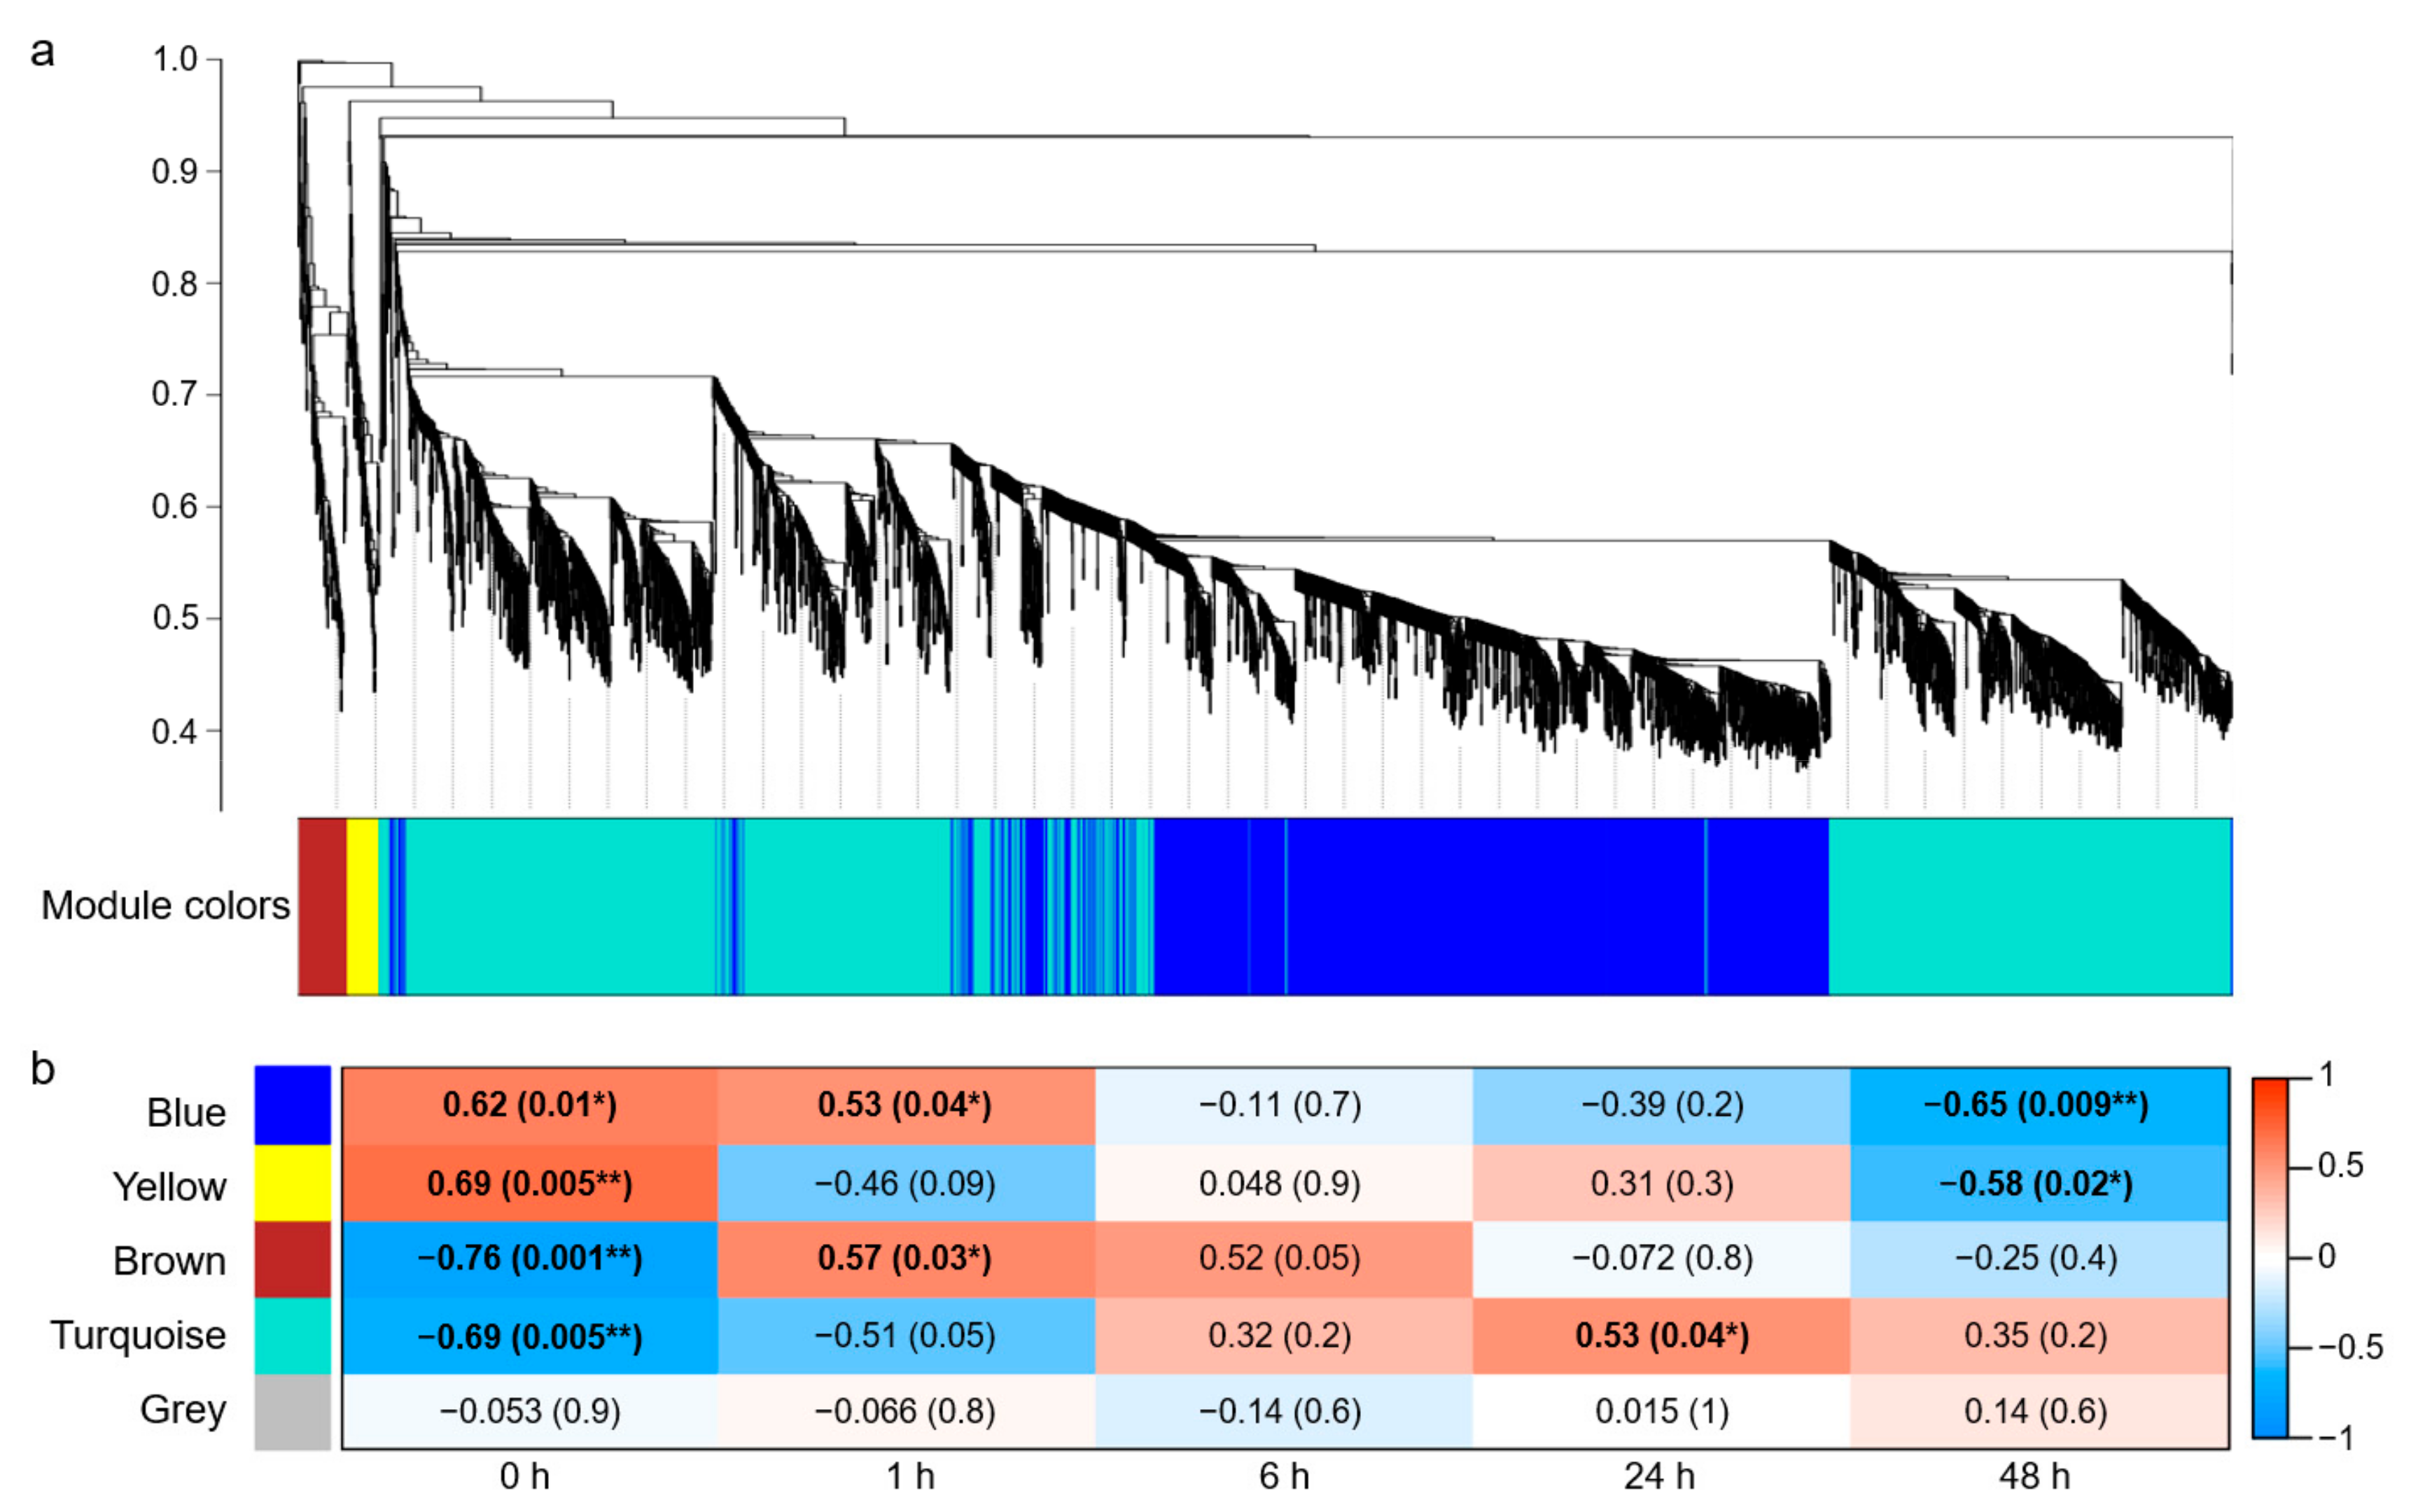
2.2. Gene Co-Expression Modules Responding to Salt Stress in Roots

WGCNA was performed on the 30,369 DEGs screened above, and 4202 genes were clustered and divided into five modules with different colors based on their expression patterns (Figure 2a). Among them, the gray module contained two genes that could not be assigned to any module, and the remaining four modules, namely turquoise, blue, brown, and yellow, contained 2305, 1706, 118, and 71 genes, respectively (Table S2).
The Pearson correlation coefficient (r > 0.5) and the significance of the p value (p < 0.05) were used as the criteria to measure the relationship between module and time course of salt stress. The results revealed a significant correlation between the blue module and time points 0, 1, and 48 h, with “blue module—1 h” showing a positive correlation (r = 0.53; p = 0.04) and “blue module—48 h” showing a negative correlation (r = −0.65; p = 0.009). Moreover, a positive and negative correlation was shown between the yellow module and time points 0 h (r = 0.69; p = 0.005) and 48 h (r = −0.58; p = 0.02), respectively. The brown module was negatively correlated with 0 h (r = −0.76; p = 0.001) and positively correlated with 1 h (r = 0.57; p = 0.03). The turquoise module was negatively correlated with 0 h (r = −0.69; p = 0.005) and positively correlated with 24 h (r = 0.53; p = 0.04), and the gray module was not related to any time point (Figure 2b).
Compared with the other modules, the blue module was associated with more salt-treatment time points (0, 1, 48 h) and showed a strong correlation at 48 h. Therefore, all genes in the blue module were used for subsequent Gene ontology (GO) enrichment analysis.

2.3. The GO Enrichment of the Blue Module

A total of 455 terms were enriched from the blue module, of which 302 involved biological processes, 86 involved molecular functions, and 67 involved cellular components (Table S3). The 20 terms with the highest −log10 (FDR, false discovery rate) values, including 11 cellular component terms and nine biological process terms, are shown in Figure 3. The cellular component terms contained Cytosolic ribosome, Nucleolus, and Ribosomal subunit, among others, indicating a close correlation with gene transcription and protein synthesis. Furthermore, the biological process terms included Response to osmotic stress (GO:0006970) and Response to salt stress (GO:0009651), the two key GO terms related to the salt-stress response (Figure 3). Interestingly, all 236 DEGs of the GO:0009651 term were included in the 249 DEGs of the GO:0006970 term; hence, we focused on these 249 DEGs, which could be related to osmotic/salt stress (Table S4).

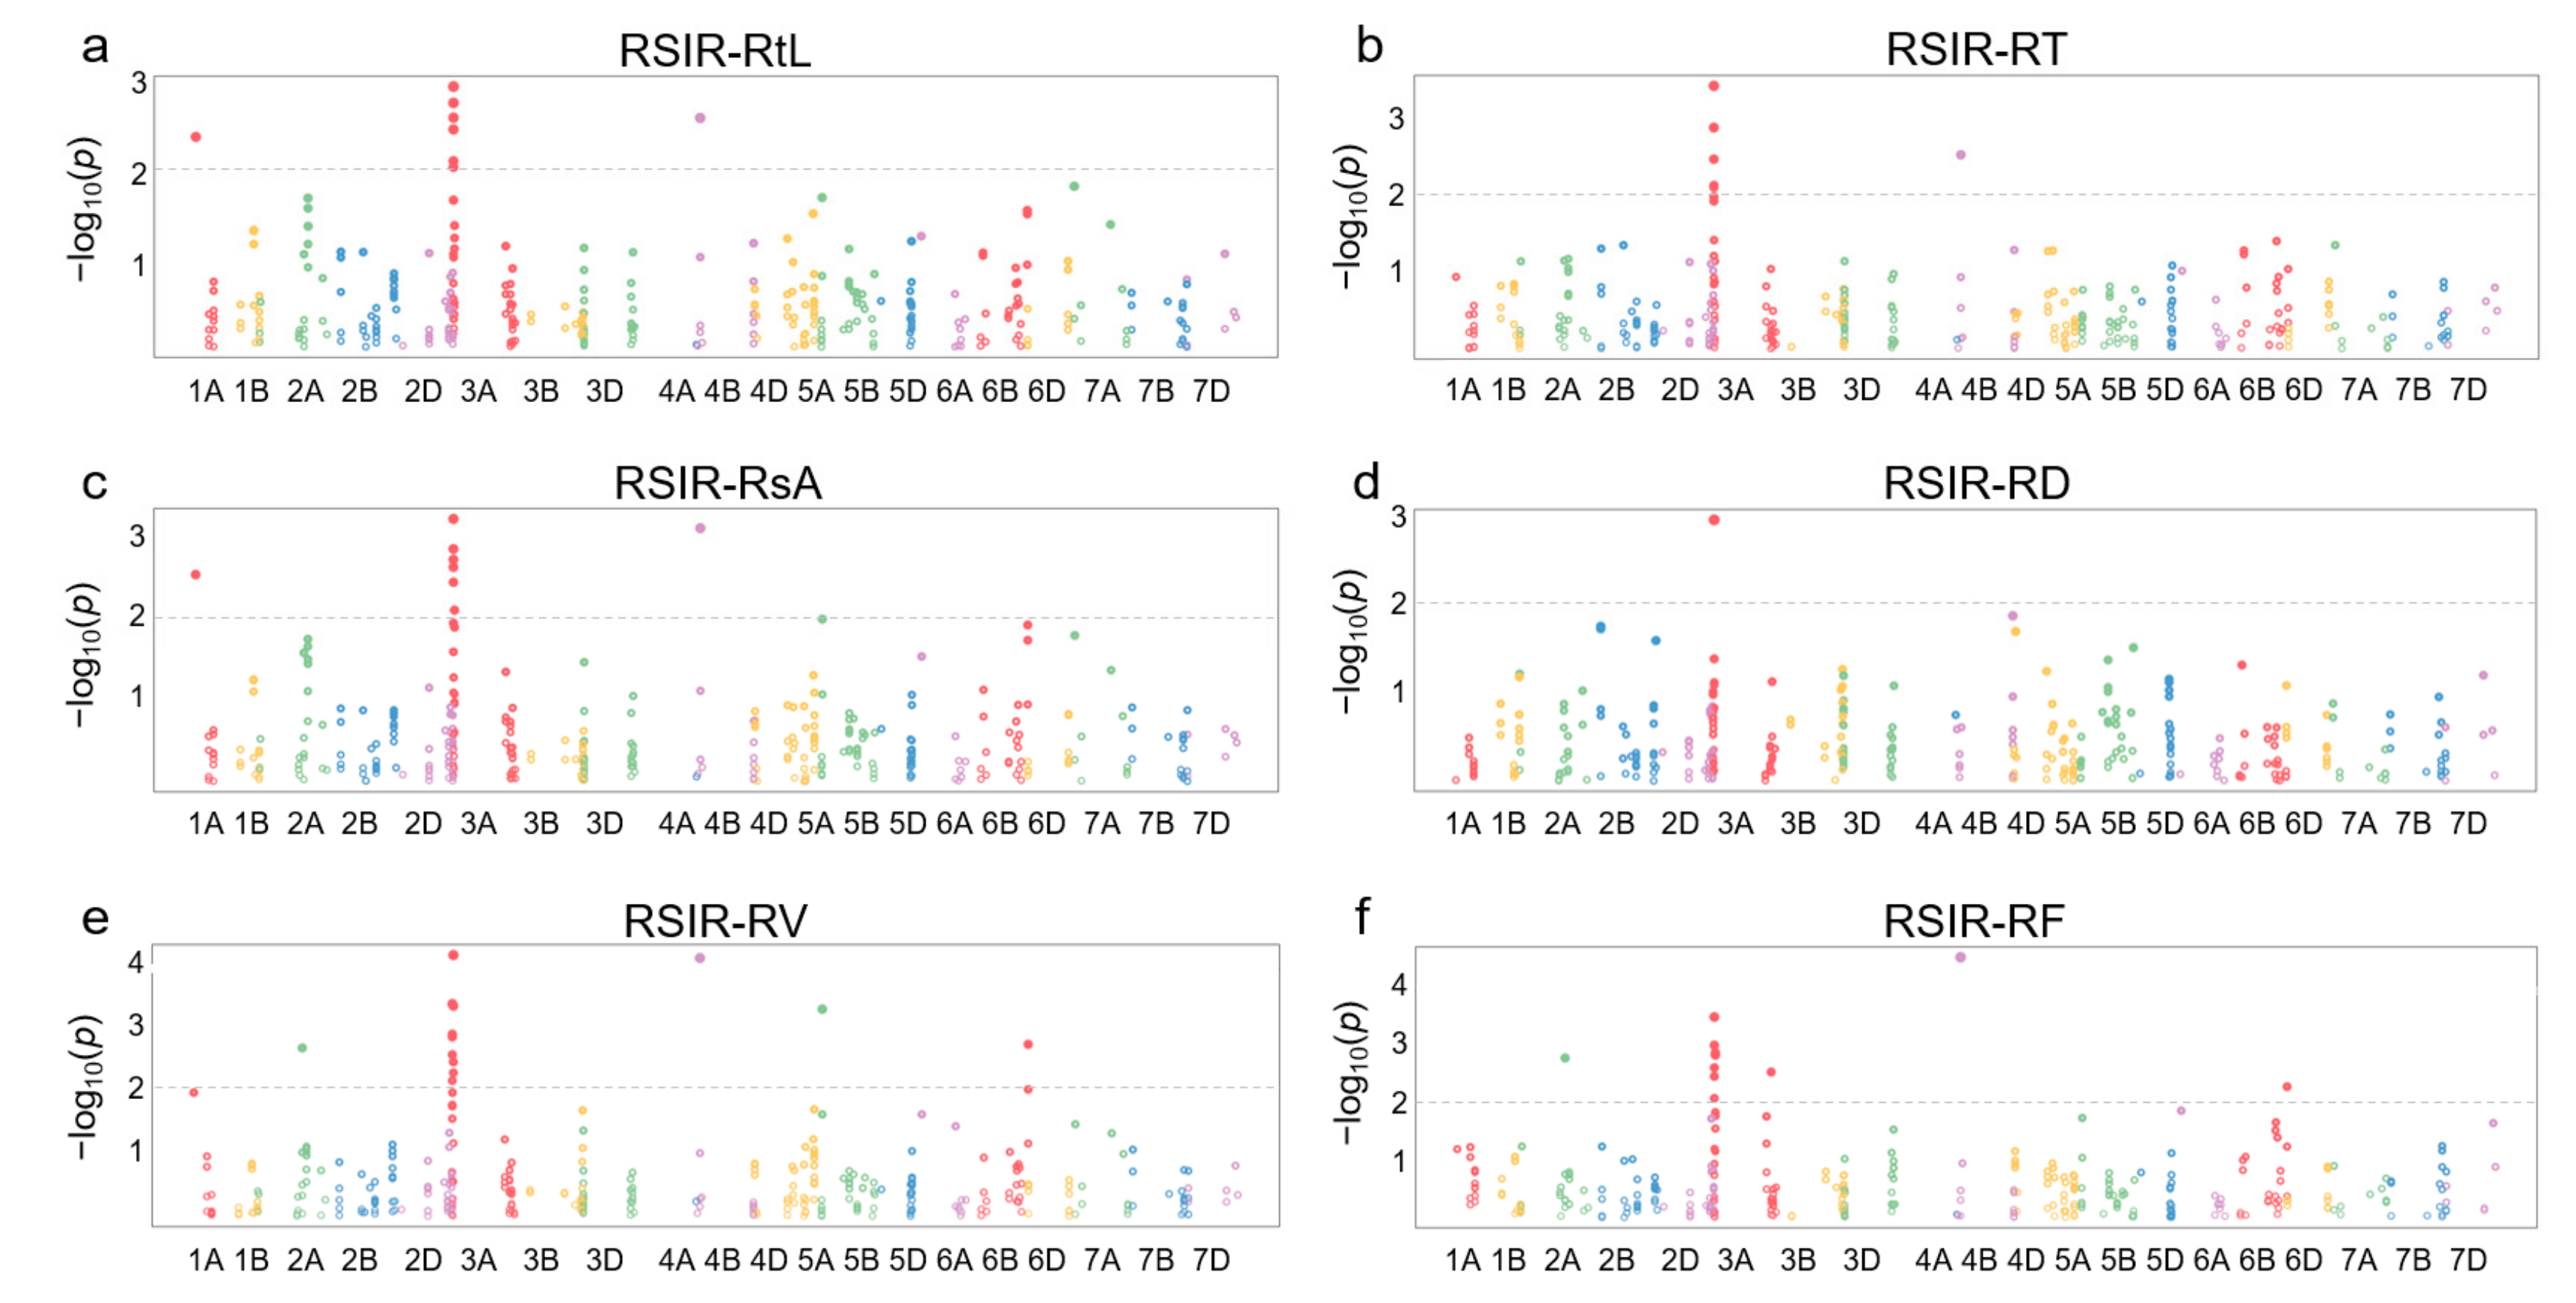
2.4. Association Analysis of the DEGs from the Key Terms

Information on 368 SNPs from 120 of 249 DEGs in 114 wheat germplasm resources was obtained from the WheatUnion database (Table S5). For the involved wheat germplasm, six salt-tolerant phenotypes associated with roots, including total root length (RtL), root tip number (RT), total surface area (RsA), average diameter (RD), total volume (RV), and root branching number (RF), were identified, and the relative salt-injury rates (RSIR) were calculated based on data from the control group and NaCl treatment group. Association analysis results showed that 47 SNPs distributed on chromosomes 1A, 2A, 3A, 4B, 5B, and 6B were correlated with salt-tolerance phenotypes in roots (p < 0.01) (Figure 4).
After further screening, four high-confidence SNPs were selected, including 1A337654393, 3A7437277, 5B91533091, and 6B708989259, with a minimum allele frequency > 10% and a maximum missing rate of <5% (Table S6). Among them, 1A337654393 from TraesCS1A02G186300 was associated with RSIR-RtL (p = 0.0043) and RSIR-RsA (p = 0.003), and 3A7437277 from TraesCS3A02G007100 was associated with RSIR-RtL (p = 0.0018), RSIR-RsA (p = 0.0024), RSIR-RT (p = 0.0076), and RSIR-RV (p = 0.0076). SNP 5B91533091 from TraesCS5B02G076400 and 6B708989259 from TraesCS6B02G450000 were both associated with RSIR-RV (p = 0.0006 and p = 0.002, respectively) (Table S6).

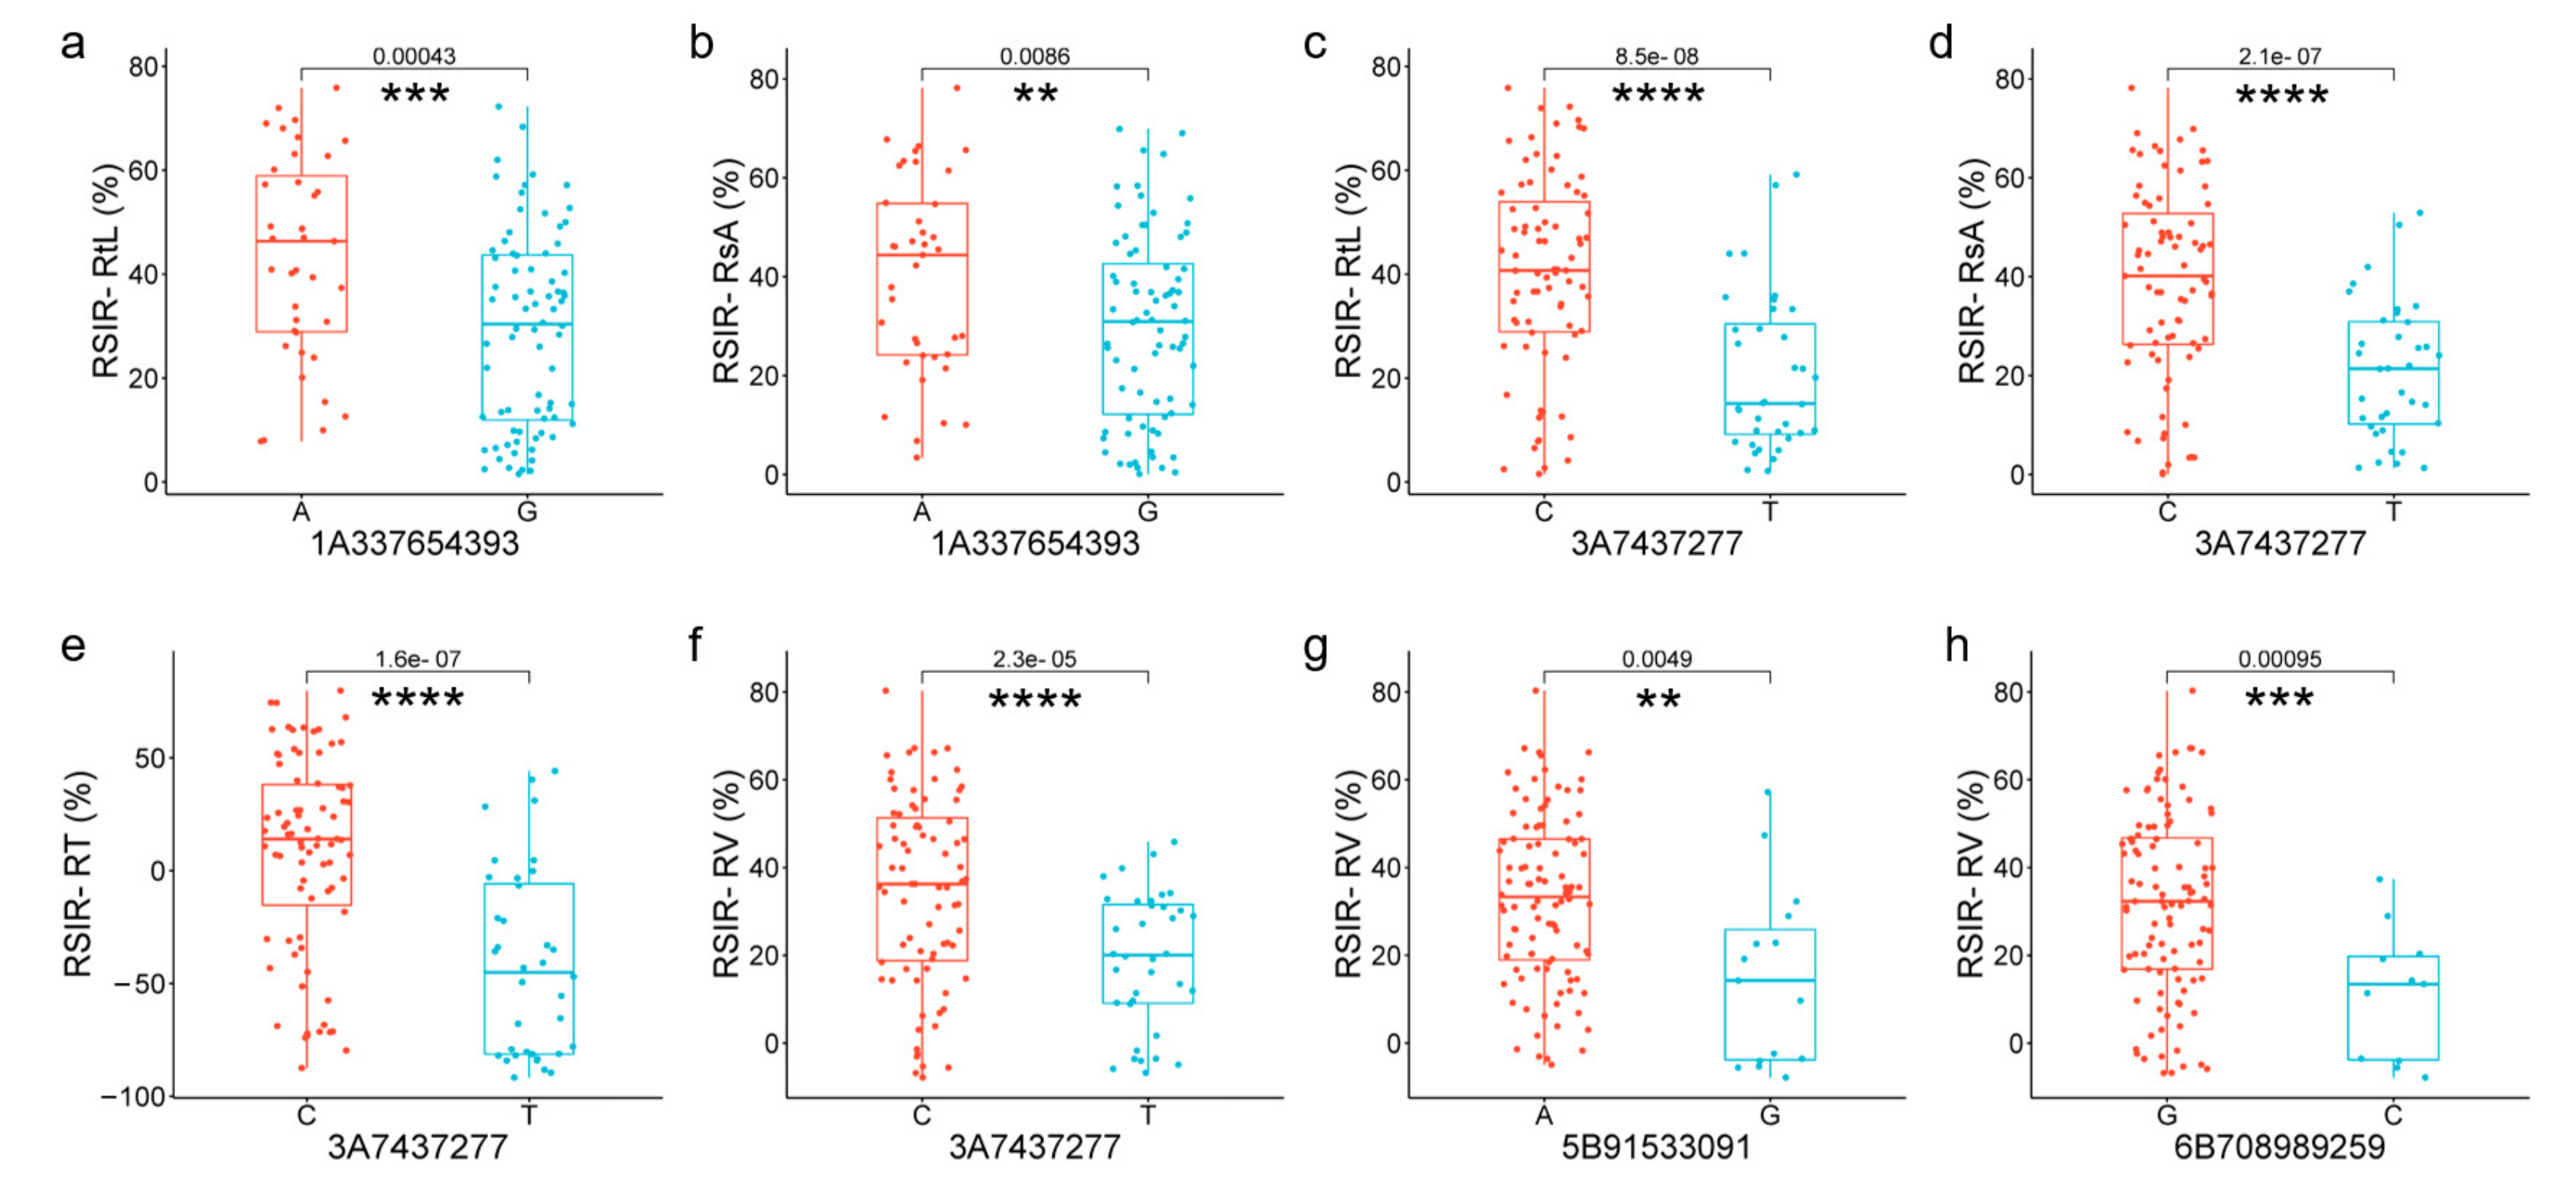
2.5. Candidate Genes Responding to Salt Stress in Roots

Among the four candidate genes, TraesCS1A02G186300 encoded glutathione S-transferase (TaGST). SNP 1A337654393, located in exon 2 of TaGST, changed A to G, causing the amino acid Leucine (L) to change to Proline (P), decreasing RSIR-RtL (p = 0.00043, Figure 5a) and RSIR-RsA (p = 0.0086, Figure 5b). TraesCS3A02G007100 encoded the Walls Are Thin 1 (WAT1)-related protein (TaWAT). SNP 3A7437277 (C/T), located in exon 2 of TaWAT, caused amino acids to change from Glycine (G) to Serine (S), decreasing RSIR-RtL (p = 8.5 × 10⁻⁸, Figure 5c), RSIR-RsA (p = 2.1 × 10⁻⁷, Figure 5d), RSIR-RT (p = 1.6 × 10⁻⁷, Figure 5e), and RSIR-RV (p = 2.3 × 10⁻⁵, Figure 5f). TraesCS5B02G076400 with no intron encoded a putative zinc finger protein (TaZFP). SNP 5B91533091(A/G) in TaZFP caused amino acid S to change to G, decreasing RSIR-RV (p = 0.0049, Figure 5g), and TraesCS6B02G450000 encoded Aquaporin (TaAQP). SNP 6B708989259(G/C), located in exon 3 of TaAQP, changed the amino acid Alanine (A) to p, which was associated with the decrease in RSIR-RV (p = 0.00095, Figure 5h).

2.6. Gene Co-Expression Networks Responding to Short-Term Salt Stress in Roots

Twenty genes with the highest edge weight co-expressed with the four candidate genes were selected from the 249 DEGs to construct an interaction network. The results showed that 3, 6, 21, and 22 genes interacted with TaGST, TaWAT, TaAQP, and TaZFP, respectively (Figure 6, Table S7). These interacting genes were divided into two categories. One category contained regulatory genes, including TraesCS3A02G413700 encoding Broad Complex, Tramtrack, and Bric-A-Brac (BTB)/POX Virus and Zinc Finger (POZ) protein, and TraesCS6A02G301900 and TraesCS6B02G331000, encoding ethylene-responsive factor (ERF). The other category contained the following structural genes: TraesCS3A02G313600, TraesCS5B02G511800, and TraesCS5B02G529300, encoding kinase; TraesCS3B02G290200 and TraesCS7A02G189500, encoding glycosyltransferase; and TraesCS4B02G304300, encoding a detoxification protein (Table S7).
Among the genes in this network, 17 genes, including TaWAT and TaAQP, were upregulated in the early stage of NaCl treatment, while the remaining seven genes, including TaZFP and TaGST, were upregulated in the later stages of stress, mainly at 48 h (Figure 7).

3. Discussion

3.1. The Blue Module Is Related to the Time Course of Salt-Stress Response in Wheat Roots

The roots are the first organ exposed to high salt stress. Exploring the key modules and genes in roots is crucial not only for a deeper understanding of salt-tolerance mechanisms but also for salt-tolerance molecular breeding in wheat. Research in model plants has shown that cellular responses can be placed in different phases after salt treatment [26]. Early signaling represents changes observed within 5 min of salt stress application in the roots. The transcriptional response from the nucleus is activated, and the growth rate decreases during the stop phase and the quiescent phase within 5 min to 5 h and 5–9 h of salt application, respectively. Later, plants partially recover their growth rate during the growth recovery phase after 9 h of salt application [26].
In this study, we set four time points for the NaCl treatment of roots: 1 h during the stop phase, 6 h during the quiescent phase, and 24 and 48 h during the growth recovery phase. The RNA-Seq results showed that, compared with the untreated control, the number of DEGs increased with the prolongation of treatment time, and there were more upregulated genes than downregulated genes. These DEGs were divided into five modules through WGCNA, of which the blue module was significantly positively correlated with 0 and 1 h and significantly negatively correlated with 48 h, indicating that this module was related to the time course and primarily functioned during the stop and growth recovery phases. Transcriptional changes occurring in the stop phase promote the synthesis of functional proteins, such as biochemical enzymes and ion transporters [27], and activate stress-related ABA or ethylene signaling pathways [19,28]. In the later growth recovery phase, genes involved in growth repair begin to be regulated [29].

3.2. Four Novel Candidate Genes Responding to Salt Stress Discovered from the Blue Module

Two biological process terms, Response to osmotic stress (GO:0006970) and Response to salt stress (GO:0009651), were enriched in the blue module. Of 249 DEGs, 4, namely TaWAT, TaAQP, TaZFP, and TaGST, from the two GO terms were significantly correlated with salt-tolerance phenotypes in the roots using a set of wheat germplasm.
TaWAT and TaAQP were upregulated in the roots of CH7034 at 1 h of salt treatment. The WAT1 gene encoding the transmembrane protein was involved in auxin transport and homeostasis [30], and was significantly upregulated by salinity stress [31,32]. In this study, TaWAT was associated with RSIR-RtL, -RsA, -RT, and -RV, indicating that this gene may ultimately impact the ability of roots to transport auxin and alter growth under salt application, as predicted in another study [33]. Aquaporins located on the cell plasma membrane mediate the regulation of root hydraulic conductivity in response to osmotic stress and salt stress [17,34]. The overexpression of two wheat AQP genes, TaNIP (GenBank No. DQ530420) [35] and TaAQP8 (GenBank No. HQ650110) [36], significantly enhanced salt tolerance in the transgenic plants of Arabidopsis and tobacco, respectively. The upregulation of TaAQP8 under salt stress involved an ethylene signaling pathway, causing a positive effect and then increased root elongation [36]. Moreover, a recent study reported that the AQP activity of wheat varied with the diurnal cycle, which periodically affected the plant’s tolerance to salt stress [37]. In our case, a novel TaAQP gene was associated with RSIR-RV, and exhibited similar expression patterns 24 and 48 h after salt treatment (Figure 7).
TaZFP and TaGST were mainly upregulated in CH7034 roots 48 h after salt treatment during the growth recovery phase. ZFP, located in the nucleus, is a type of well-studied transcription factor related to salt stress responsiveness [38,39]. ZFP overexpression significantly increased the levels of ascorbic acid (AsA) in Arabidopsis and tomato, which strengthened the AsA-mediated reactive oxygen species (ROS)-scavenging capacity and enhanced the salt tolerance of the plants [40]. In salt-tolerant wheat cultivar Shanrong No. 3, the ZFP gene TaCHP (GenBank No. GQ379226) was expressed in the roots of seedlings at the three-leaf stage, and its transcript was localized in the cells of the root tip cortex and meristem [41]. The TaZFP reported in this study is a novel gene associated with RSIR-RV, and the other gene, TaGST, is related to RSIR-RtL and RSIR-RsA. Overexpressing GST in cotton or soybean improves their salt tolerance [42,43,44]. In addition, GST is involved in scavenging ROS induced by salt stress in cells [45]. Therefore, TaGST and TaZFP may recover cell growth by alleviating oxidative stress, thereby enhancing the roots’ tolerance to salt stress.

3.3. A Predicted Gene Co-Expression Network for Salt Tolerance

Based on edge weight values, an interaction network was predicted, setting the four candidate genes as hub genes. After salt stress application to roots, TaWAT and TaAQP were upregulated and promoted the expression of multiple genes involving biochemical reactions. Some of these genes were coding kinase proteins. In the salt-stress response in Arabidopsis, kinase proteins play a crucial role in ion transport and in signal transduction [46,47]. Some genes referred to transcription and translation, such as the 60S ribosomal protein L5 (RPL-5), ATP synthase subunit b (ATP5H), and RNA-binding protein (RBP), which are related to salt tolerance in rice or cotton [42,43,44], and some genes referred to the metabolic processes in response to salt stress [48,49], such as the aminotransferase-related protein gene and ketol-acid reductoisomerase NADP(+) (KARI). In addition, two ERF genes, TraesCS6A02G301900 and TraesCS6B02G331000, were also induced. Currently, three salt stress-response ERF genes have been identified in wheat, including two salt-tolerant genes, TaERF1 [50] and TaERF3 [51], as well as one salt-sensitive gene, TaERF4 [52]. The two ERFs identified in this study are novel genes related to salt-stress responsiveness.
In the 6 to 48 h after salt stress, TaZFP and TaGST gene activities gradually increased, and multiple genes were induced. TraesCS4B02G304300 encodes a detoxification protein that may alleviate cation toxicity in cells [53,54], and TraesCS2A02G032500 encodes ATP sulfurylase that can chelate SO42− under salt stress [55]. TraesCS3A02G413700 encodes a BTB/POZ transcription factor, and TraesCS3B02G290200 and TraesCS7A02G189500 encode glycosyltransferases. Both BTB/POZ and glycosyltransferases have been reported to scavenge ROS, which are induced by salt stress [56,57,58]. Therefore, the genes that respond during this period may primarily perform growth recovery functions under salt stress.
However, the blue module was significantly negatively correlated with the 48 h after the salt-stress time course. One possible explanation is that some genes, especially the hub genes TaZFP and/or TaGST, exist as negative regulatory factors in certain salt-tolerance pathways. Similar results have been reported. Several ZFP genes, such as MtZPT2-2 in Medicago truncatula [59], AZF1 and AZF2 in Arabidopsis [60], and DST [61] and OsZFP185 [62] in rice, can negatively regulate plant salt tolerance by inhibiting the ABA signaling pathway or transport proteins. Moreover, the GST gene AtGSTU17 has also been shown to play a negative role in salt stress tolerance in Arabidopsis [63]. Further experiments are needed to confirm this speculation.

4. Materials and Methods

4.1. Plant Materials and Salt Treatment

Wheat breeding line CH7034 with salt tolerance was used for RNA-Seq and qRT-PCR. A set of wheat germplasm containing 114 varieties (Table S8) was used for salt-tolerance phenotype identification and association analysis.
Sterilized seeds were laid on Petri dishes covered with moist filter paper for 2–3 days. The uniform germinated seeds were then selected and transferred to half-strength Hoagland’s culture solution in a growth chamber under a 22/16 °C (day/night) temperature regime and a 16/8 h (light/dark) photoperiod with 60% relative humidity. When the seedlings grew to the three-leaf stage, they were exposed to 250 mM NaCl for salt-stress treatment.

4.2. RNA-Seq

The root samples of the CH7034 seedlings were collected with three replications after 0, 1, 6, 24, and 48 h of NaCl stress, then frozen in liquid nitrogen, and stored at −80 °C. Total RNA was extracted by TRIzol reagent (Invitrogen, Carlsbad, CA, USA) according to the manufacturer’s instructions, and the cDNA libraries were constructed using TruSeq RNA Sample Preparation Kit v2 (Illumina, San Diego, CA, USA). RNA-Seq was performed on all libraries by Biomarker Technologies Co., Ltd. (Beijing, China) using the HiSeq 4000 platform (Illumina, San Diego, CA, USA). Clean reads were obtained by removing low-quality reads containing adapters or poly-N from the raw data and mapped to the Chinese Spring reference genome RefSeq v1.0 (http://wheat-urgi.ver-sailles.inra.fr/, accessed on 10 March 2023). The transcript level of each gene was measured with FPKM and then normalized by log2. Differential expression analysis between the control (0 h of NaCl treatment) and salt-stress groups (1, 6, 24, and 48 h of NaCl treatment) was performed using DESeq R package [64], with a threshold of |log2FoldChange| ≥ 1 and FDR ≤ 0.01.

4.3. Co-Expression Network Construction

Gene co-expression networks were constructed using R (version 4.3.1) software and the WGCNA package (version 1.72) for the RNA-Seq data from the roots. The transcript levels of all of the DEGs were converted into a similarity matrix and transformed to a topological overlap matrix using a parameter β value of 12. Genes with similar expression patterns were categorized into different modules using a bottom-up algorithm with a module minimum size cutoff of 30.
The correlation between module eigengenes and the time points for salt stress was calculated using a Pearson test, and the individual modules with p < 0.05 were considered significantly correlated with the time course. Then, the module with the highest correlation coefficient was used for GO enrichment analysis on the BMKCloud platform (www.biocloud.net, accessed on 24 November 2023), and items with a high correlation with salt tolerance were selected. Genes with a WGCNA edge weight > 0.6 in the selected items were visualized using Cytoscape 3.7.2 software.

4.4. Association Analysis

RSIR-R was investigated for 114 wheat germplasm resources. Salt stress was imposed for germplasm according to the method described in Section 4.1. A Root Scanner (MicroTek, Shanghai, China) was used to scan the wheat roots after 7 days of H2O treatment (CK) and NaCl treatment to obtain the total root length (RtL), total surface area (RsA), total volume (RV), average diameter (RD), root tip number (RT), and root branching number (RF). The relative salt-injury rate of each root phenotype for wheat variety was calculated using the following formula: RSIR-R (%) = (XCKXNaCl)/XCK × 100%.
Information on sequence variation in the gene coding region was downloaded from the WheatUnion database (http://wheat.cau.edu.cn/WheatUnion/, accessed on 24 November 2023). Using 114 wheat germplasm resources, the correlation between the root-relative salt-injury rate data and the genes screened by WGCNA, the edge weight was evaluated using association analysis in the R (version 4.3.1) software with the GAPIT package (version 3). The correlation was considered significant when −log10(p) > 2 (i.e., p < 0.01).

4.5. Statistical Analysis

The Origin software (version 3.1) was used to perform the statistical analysis by one-way analysis of variance (ANOVA), and p < 0.05 was considered a statistically significant difference.

5. Conclusions

Based on RNA-sequencing data performed for the roots of salt-tolerant wheat breeding line CH7034 at 0, 1, 6, 24, and 48 h after NaCl treatment, we conducted WGCNA and obtained five gene co-expression modules, of which the blue module was correlated with the time course of salt stress at 1 and 48 h. Two GO terms containing 249 DEGs related to osmotic stress response and salt-stress response were enriched in the blue module, and 4 DEGs, including TaWAT, TaAQP, TaGST, and TaZFP, were associated with the root salt-tolerance phenotype in a set of wheat germplasm resources. A co-expression network constructed with the four candidate genes and another 20 DEGs showed that TaWAT and TaAQP were mainly co-expressed with 15 interacting DEGs 1 h after salt treatment, while TaGST and TaZFP were mainly co-expressed with 5 interacting DEGs 48 h after salt treatment.

Supplementary Materials

The following supporting information can be downloaded at: https://www.mdpi.com/article/10.3390/plants13020274/s1, Table S1: Summary of RNA-sequencing results, Table S2: The modules and 4202 clustered genes in WGCNA, Table S3: GO enrichment of the blue-module, Table S4: 249 DEGs of GO terms related osmotic and/or salt-stress response in the blue module, Table S5: Information on 368 SNPs of DEGs used for association analysis, Table S6: Four high-confidence SNPs associated with root salt-tolerant phenotypes, Table S7: Twenty genes with the highest edge weight co-expressed with the four candidate genes, Table S8: 114 wheat germplasms used in association analysis.

Author Contributions

Conceptualization, Z.C. and L.Q.; formal analysis, L.Q. and J.C.; methodology, L.Q.; software, L.Q. and J.C.; validation, L.Z.; investigation, Y.L., X.S. and Y.G.; resources, X.M., X.Z., X.L., T.C. and H.W.; data curation, L.Q. and J.C.; writing—original draft preparation, L.Q. and J.C.; writing—review and editing, L.Q. and Z.C.; project administration, L.Q. All authors have read and agreed to the published version of the manuscript.

Funding

This research was funded by the S&T Development Foundation of Central Guides Local Government Project (YDZJSX2022A046, YDZJSX2022C009), Scientific and Technological Innovation Programs of Higher Education Institutions in Shanxi (2021L439), the Basic Research Program of Shanxi Province (20210302124235), the Research Project Supported by Shanxi Scholarship Council of China (2021-070), and the Shanxi Agricultural University Research Project for Doctor (2021BQ39).

Data Availability Statement

Data are contained within the article and Supplementary Materials.

Conflicts of Interest

The authors declare no conflicts of interest.

References

  1. Hassani, A.; Azapagic, A.; Shokri, N. Global predictions of primary soil salinization under changing climate in the 21st century. Nat. Commun. 2021, 12, 6663. [Google Scholar] [CrossRef]
  2. Hopmans, J.W.; Qureshi, A.S.; Kisekka, I.; Munns, R.; Grattan, S.R.; Rengasamy, P.; Ben-Gal, A.; Assouline, S.; Javaux, M.; Minhas, P.S.; et al. Chapter One—Critical knowledge gaps and research priorities in global soil salinity. In Advances in Agronomy; Sparks, D.L., Ed.; Academic Press: Cambridge, MA, USA, 2021; Volume 169, pp. 1–191. [Google Scholar]
  3. Shewry, P.R.; Hey, S.J. The contribution of wheat to human diet and health. Food Energy Secur. 2015, 4, 178–202. [Google Scholar] [CrossRef]
  4. Wang, Z.; Gerstein, M.; Snyder, M. RNA-Seq: A revolutionary tool for transcriptomics. Nat. Rev. Genet. 2009, 10, 57–63. [Google Scholar] [CrossRef]
  5. Yang, G.; Pan, W.; Cao, R.; Guo, Q.; Cheng, Y.; Zhao, Q.; Cui, L.; Nie, X. Multi-omics reveals the key and specific miRNA-mRNA modules underlying salt tolerance in wild emmer wheat (Triticum dicoccoides L.). BMC Genom. 2022, 23, 724. [Google Scholar] [CrossRef]
  6. Pfeifer, M.; Kugler, K.G.; Sandve, S.R.; Zhan, B.; Rudi, H.; Hvidsten, T.R.; Mayer, K.F.; Olsen, O.A.; International Wheat Genome Sequencing Consortium. Genome interplay in the grain transcriptome of hexaploid bread wheat. Science 2014, 345, 1250091. [Google Scholar] [CrossRef] [PubMed]
  7. Li, H.; Hua, L.; Zhao, S.; Hao, M.; Song, R.; Pang, S.; Liu, Y.; Chen, H.; Zhang, W.; Shen, T.; et al. Cloning of the wheat leaf rust resistance gene Lr47 introgressed from Aegilops speltoides. Nat. Commun. 2023, 14, 6072. [Google Scholar] [CrossRef]
  8. Zhang, L.; Zhang, N.; Wang, S.; Tian, H.; Liu, L.; Pei, D.; Yu, X.; Zhao, L.; Chen, F. A TaSnRK1α modulates TaPAP6L-mediated wheat cold tolerance through regulating endogenous jasmonic acid. Adv. Sci. 2023, 10, e2303478. [Google Scholar] [CrossRef]
  9. Goyal, E.; Amit, S.K.; Singh, R.S.; Mahato, A.K.; Chand, S.; Kanika, K. Transcriptome profiling of the salt-stress response in Triticum aestivum cv. Kharchia Local. Sci. Rep. 2016, 6, 27752. [Google Scholar] [CrossRef] [PubMed]
  10. Mahajan, M.M.; Goyal, E.; Singh, A.K.; Gaikwad, K.; Kanika, K. Transcriptome dynamics provide insights into long-term salinity stress tolerance in Triticum aestivum cv. Kharchia Local. Plant Physiol. Biochem. 2017, 121, 128–139. [Google Scholar] [CrossRef] [PubMed]
  11. Alyahya, N.; Taybi, T. Comparative transcriptomic profiling reveals differentially expressed genes and important related metabolic pathways in shoots and roots of a Saudi wheat cultivar (Najran) under salinity stress. Front. Plant Sci. 2023, 14, 1225541. [Google Scholar] [CrossRef]
  12. Zhang, Y.; Liu, Z.; Khan, A.A.; Lin, Q.; Han, Y.; Mu, P.; Liu, Y.; Zhang, H.; Li, L.; Meng, X.; et al. Expression partitioning of homeologs and tandem duplications contribute to salt tolerance in wheat (Triticum aestivum L.). Sci. Rep. 2016, 6, 21476. [Google Scholar] [CrossRef] [PubMed]
  13. Luo, Q.; Teng, W.; Fang, S.; Li, H.; Li, B.; Chu, J.; Li, Z.; Zheng, Q. Transcriptome analysis of salt-stress response in three seedling tissues of common wheat. Crop J. 2019, 7, 378–392. [Google Scholar] [CrossRef]
  14. Dugasa, M.; Feng, X.; Wang, N.; Wang, J.; Wu, F. Comparative transcriptome and tolerance mechanism analysis in the two contrasting wheat (Triticum aestivum L.) cultivars in response to drought and salinity stresses. Plant Growth Regul. 2021, 94, 101–114. [Google Scholar] [CrossRef]
  15. Wang, W.; Cao, J.; Huang, S.; Wang, Z.; Wang, W.; Zou, J.; Wang, F.; Luo, M.; Zhang, J. Integrated transcriptomics and metabolomics analyses provide insights into salt-stress response in germination and seedling stage of wheat (Triticum aestivum L.). Curr. Plant Biol. 2023, 33, 100274. [Google Scholar] [CrossRef]
  16. Amirbakhtiar, N.; Ismaili, A.; Ghaffari, M.R.; Mirdar Mansuri, R.; Sanjari, S.; Shobbar, Z.S. Transcriptome analysis of bread wheat leaves in response to salt stress. PLoS ONE 2021, 16, e0254189. [Google Scholar] [CrossRef]
  17. Boursiac, Y.; Chen, S.; Luu, D.T.; Sorieul, M.; van den Dries, N.; Maurel, C. Early effects of salinity on water transport in Arabidopsis roots. Molecular and cellular features of aquaporin expression. Plant Physiol. 2005, 139, 790–805. [Google Scholar] [CrossRef] [PubMed]
  18. Demidchik, V.; Tester, M. Sodium fluxes through nonselective cation channels in the plasma membrane of protoplasts from Arabidopsis roots. Plant Physiol. 2002, 128, 379–387. [Google Scholar] [CrossRef]
  19. Duan, L.; Dietrich, D.; Ng, C.H.; Chan, P.M.; Bhalerao, R.; Bennett, M.J.; Dinneny, J.R. Endodermal ABA signaling promotes lateral root quiescence during salt stress in Arabidopsis seedlings. Plant Cell. 2013, 25, 324–341. [Google Scholar] [CrossRef] [PubMed]
  20. Choi, W.G.; Toyota, M.; Kim, S.H.; Hilleary, R.; Gilroy, S. Salt stress-induced Ca2+ waves are associated with rapid, long-distance root-to-shoot signaling in plants. Proc. Natl. Acad. Sci. USA 2014, 111, 6497–6502. [Google Scholar] [CrossRef]
  21. Langfelder, P.; Horvath, S. WGCNA: An R package for weighted correlation network analysis. BMC Bioinform. 2008, 9, 559. [Google Scholar] [CrossRef] [PubMed]
  22. Zhu, M.; Xie, H.; Wei, X.; Dossa, K.; Yu, Y.; Hui, S.; Tang, G.; Zeng, X.; Yu, Y.; Hu, P.; et al. WGCNA analysis of salt-responsive core transcriptome identifies novel hub genes in rice. Genes 2019, 10, 719. [Google Scholar] [CrossRef] [PubMed]
  23. Ma, L.; Zhang, M.; Chen, J.; Qing, C.; He, S.; Zou, C.; Yuan, G.; Yang, C.; Peng, H.; Pan, G.; et al. GWAS and WGCNA uncover hub genes controlling salt tolerance in maize (Zea mays L.) seedlings. Theor. Appl. Genet. 2021, 134, 3305–3318. [Google Scholar] [CrossRef] [PubMed]
  24. Li, J.; Gao, X.; Chen, X.; Fan, Z.; Zhang, Y.; Wang, Z.; Shi, J.; Wang, C.; Zhang, H.; Wang, L.; et al. Comparative transcriptome responses of leaf and root tissues to salt stress in wheat strains with different salinity tolerances. Front. Genet. 2023, 14, 1015599. [Google Scholar] [CrossRef] [PubMed]
  25. Qiao, L.; Zhang, X.; Li, X.; Yang, Z.; Li, R.; Jia, J.; Yan, L.; Chang, Z. Genetic incorporation of genes for the optimal plant architecture in common wheat. Mol. Breed. 2022, 42, 66. [Google Scholar] [CrossRef]
  26. Van Zelm, E.; Zhang, Y.; Testerink, C. Salt tolerance mechanisms of plants. Annu. Rev. Plant Biol. 2020, 71, 403–433. [Google Scholar] [CrossRef] [PubMed]
  27. Maathuis, F.J. The role of monovalent cation transporters in plant responses to salinity. J. Exp. Bot. 2006, 57, 1137–1147. [Google Scholar] [CrossRef] [PubMed]
  28. Dou, L.; He, K.; Higaki, T.; Wang, X.; Mao, T. Ethylene signaling modulates cortical microtubule reassembly in response to salt Stress. Plant Physiol. 2018, 176, 2071–2081. [Google Scholar] [CrossRef]
  29. Geng, Y.; Wu, R.; Wee, C.W.; Xie, F.; Wei, X.; Chan, P.M.; Tham, C.; Duan, L.; Dinneny, J.R. A spatio-temporal understanding of growth regulation during the salt stress response in Arabidopsis. Plant Cell 2013, 25, 2132–2154. [Google Scholar] [CrossRef] [PubMed]
  30. Ranocha, P.; Dima, O.; Nagy, R.; Felten, J.; Corratgé-Faillie, C.; Novák, O.; Morreel, K.; Lacombe, B.; Martinez, Y.; Pfrunder, S.; et al. Arabidopsis WAT1 is a vacuolar auxin transport facilitator required for auxin homoeostasis. Nat. Commun. 2013, 4, 2625. [Google Scholar] [CrossRef] [PubMed]
  31. Zhang, H.; Xu, W.; Chen, H.; Chen, J.; Liu, X.; Chen, X.; Yang, S. Transcriptomic analysis of salt tolerance-associated genes and diversity analysis using indel markers in yardlong bean (Vigna unguiculata ssp. sesquipedialis). BMC Genom. Data 2021, 22, 34. [Google Scholar] [CrossRef] [PubMed]
  32. Carvalho da Silva, T.L.; Belo Silva, V.N.; Braga, Í.O.; Rodrigues Neto, J.C.; Leão, A.P.; Ribeiro, J.A.A.; Valadares, L.F.; Abdelnur, P.V.; de Sousa, C.A.F.; Souza, M.T., Jr. Integration of metabolomics and transcriptomics data to further characterize Gliricidia sepium (Jacq.) Kunth under high salinity stress. Plant Genome 2022, 15, e20182. [Google Scholar] [CrossRef] [PubMed]
  33. Irizarry, I.; White, J.F. Bacillus amyloliquefaciens alters gene expression, ROS production and lignin synthesis in cotton seedling roots. J. Appl. Microbiol. 2018, 124, 1589–1603. [Google Scholar] [CrossRef] [PubMed]
  34. Domec, J.C.; King, J.S.; Carmichael, M.J.; Overby, A.T.; Wortemann, R.; Smith, W.K.; Miao, G.; Noormets, A.; Johnson, D.M. Aquaporins, and not changes in root structure, provide new insights into physiological responses to drought, flooding, and salinity. J. Exp. Bot. 2021, 72, 4489–4501. [Google Scholar] [CrossRef] [PubMed]
  35. Gao, Z.; He, X.; Zhao, B.; Zhou, C.; Liang, Y.; Ge, R.; Shen, Y.; Huang, Z. Overexpressing a putative aquaporin gene from wheat, TaNIP, enhances salt tolerance in transgenic Arabidopsis. Plant Cell Physiol. 2010, 51, 767–775. [Google Scholar] [CrossRef] [PubMed]
  36. Hu, W.; Yuan, Q.; Wang, Y.; Cai, R.; Deng, X.; Wang, J.; Zhou, S.; Chen, M.; Chen, L.; Huang, C.; et al. Overexpression of a wheat aquaporin gene, TaAQP8, enhances salt stress tolerance in transgenic tobacco. Plant Cell Physiol. 2012, 53, 2127–2141. [Google Scholar] [CrossRef] [PubMed]
  37. Lu, Y.; Fricke, W. Changes in root hydraulic conductivity in wheat (Triticum aestivum L.) in response to salt stress and day/night can best be explained through altered activity of aquaporins. Plant Cell Environ. 2023, 46, 747–763. [Google Scholar] [CrossRef]
  38. Mukhopadhyay, A.; Vij, S.; Tyagi, A.K. Overexpression of a zinc-finger protein gene from rice confers tolerance to cold, dehydration, and salt stress in transgenic tobacco. Proc. Natl. Acad. Sci. USA 2004, 101, 6309–6314. [Google Scholar] [CrossRef]
  39. Sakamoto, H.; Maruyama, K.; Sakuma, Y.; Meshi, T.; Iwabuchi, M.; Shinozaki, K.; Yamaguchi-Shinozaki, K. Arabidopsis Cys2/His2-type zinc-finger proteins function as transcription repressors under drought, cold, and high-salinity stress conditions. Plant Physiol. 2004, 136, 2734–2746. [Google Scholar] [CrossRef]
  40. Li, Y.; Chu, Z.; Luo, J.; Zhou, Y.; Cai, Y.; Lu, Y.; Xia, J.; Kuang, H.; Ye, Z.; Ouyang, B. The C2H2 zinc-finger protein SlZF3 regulates AsA synthesis and salt tolerance by interacting with CSN5B. Plant Biotechnol. J. 2018, 16, 1201–1213. [Google Scholar] [CrossRef]
  41. Li, C.; Lv, J.; Zhao, X.; Ai, X.; Zhu, X.; Wang, M.; Zhao, S.; Xia, G. TaCHP: A wheat zinc finger protein gene down-regulated by abscisic acid and salinity stress plays a positive role in stress tolerance. Plant Physiol. 2010, 154, 211–221. [Google Scholar] [CrossRef]
  42. Light, G.G.; Mahan, J.R.; Roxas, V.P.; Allen, R.D. Transgenic cotton (Gossypium hirsutum L.) seedlings expressing a tobacco glutathione S-transferase fail to provide improved stress tolerance. Planta 2005, 222, 346–354. [Google Scholar] [CrossRef]
  43. Dong, Y.; Li, C.; Zhang, Y.; He, Q.; Daud, M.K.; Chen, J.; Zhu, S. Glutathione S-transferase gene family in Gossypium raimondii and G. arboreum: Comparative genomic study and their expression under salt stress. Front. Plant Sci. 2016, 7, 139. [Google Scholar] [CrossRef]
  44. Li, X.; Pang, Y.; Zhong, Y.; Cai, Z.; Ma, Q.; Wen, K.; Nian, H. GmGSTU23 encoding a Tau class glutathione S-transferase protein enhances the salt tolerance of soybean (Glycine max L.). Int. J. Mol. Sci. 2023, 24, 5547. [Google Scholar] [CrossRef] [PubMed]
  45. Le Martret, B.; Poage, M.; Shiel, K.; Nugent, G.D.; Dix, P.J. Tobacco chloroplast transformants expressing genes encoding dehydroascorbate reductase, glutathione reductase, and glutathione-S-transferase, exhibit altered anti-oxidant metabolism and improved abiotic stress tolerance. Plant Biotechnol. J. 2011, 9, 661–673. [Google Scholar] [CrossRef]
  46. Yin, X.; Xia, Y.; Xie, Q.; Cao, Y.; Wang, Z.; Hao, G.; Song, J.; Zhou, Y.; Jiang, X. The protein kinase complex CBL10-CIPK8-SOS1 functions in Arabidopsis to regulate salt tolerance. J. Exp. Bot. 2020, 71, 1801–1814. [Google Scholar] [CrossRef]
  47. Chen, X.; Ding, Y.; Yang, Y.; Song, C.; Wang, B.; Yang, S.; Guo, Y.; Gong, Z. Protein kinases in plant responses to drought, salt, and cold stress. J. Integr. Plant Biol. 2021, 63, 53–78. [Google Scholar] [CrossRef] [PubMed]
  48. Yang, L.; Han, H.; Liu, M.; Zuo, Z.; Zhou, K.; Lü, J.; Zhu, Y.; Bai, Y.; Wang, Y. Overexpression of the Arabidopsis photorespiratory pathway gene, serine: Glyoxylate aminotransferase (AtAGT1), leads to salt stress tolerance in transgenic duckweed (Lemna minor). Plant Cell Tissue Organ Cult. 2023, 113, 407–416. [Google Scholar] [CrossRef]
  49. Guo, Y.; Song, Y.; Zheng, H.; Zhang, Y.; Guo, J.; Sui, N. NADP-malate dehydrogenase of sweet sorghum improves salt tolerance of Arabidopsis thaliana. J. Agric. Food Chem. 2018, 66, 5992–6002. [Google Scholar] [CrossRef]
  50. Xu, Z.S.; Xia, L.Q.; Chen, M.; Cheng, X.G.; Zhang, R.Y.; Li, L.C.; Zhao, Y.X.; Lu, Y.; Ni, Z.Y.; Liu, L.; et al. Isolation and molecular characterization of the Triticum aestivum L. ethylene-responsive factor 1 (TaERF1) that increases multiple stress tolerance. Plant Mol. Biol. 2007, 65, 719–732. [Google Scholar] [CrossRef] [PubMed]
  51. Rong, W.; Qi, L.; Wang, A.; Ye, X.; Du, L.; Liang, H.; Xin, Z.; Zhang, Z. The ERF transcription factor TaERF3 promotes tolerance to salt and drought stresses in wheat. Plant Biotechnol. J. 2014, 12, 468–479. [Google Scholar] [CrossRef]
  52. Dong, W.; Ai, X.; Xu, F.; Quan, T.; Liu, S.; Xia, G. Isolation and characterization of a bread wheat salinity responsive ERF transcription factor. Gene 2012, 511, 38–45. [Google Scholar] [CrossRef]
  53. Gaxiola, R.A.; Rao, R.; Sherman, A.; Grisafi, P.; Alper, S.L.; Fink, G.R. The Arabidopsis thaliana proton transporters, AtNhx1 and Avp1, can function in cation detoxification in yeast. Proc. Natl. Acad. Sci. USA 1999, 96, 1480–1485. [Google Scholar] [CrossRef] [PubMed]
  54. Tsugane, K.; Kobayashi, K.; Niwa, Y.; Ohba, Y.; Wada, K.; Kobayashi, H. A recessive Arabidopsis mutant that grows photoautotrophically under salt stress shows enhanced active oxygen detoxification. Plant Cell 1999, 11, 1195–1206. [Google Scholar] [CrossRef] [PubMed]
  55. Anjum, N.A.; Gill, R.; Kaushik, M.; Hasanuzzaman, M.; Pereira, E.; Ahmad, I.; Tuteja, N.; Gill, S.S. ATP-sulfurylase, sulfur-compounds, and plant stress tolerance. Front. Plant Sci. 2015, 6, 210. [Google Scholar] [CrossRef] [PubMed]
  56. Li, P.; Li, Y.J.; Zhang, F.J.; Zhang, G.Z.; Jiang, X.Y.; Yu, H.M.; Hou, B.K. The Arabidopsis UDP-glycosyltransferases UGT79B2 and UGT79B3, contribute to cold, salt and drought stress tolerance via modulating anthocyanin accumulation. Plant J. 2017, 89, 85–103. [Google Scholar] [CrossRef]
  57. Wan, X.; Peng, L.; Xiong, J.; Li, X.; Wang, J.; Li, X.; Yang, Y. AtSIBP1, a novel BTB domain-containing protein, positively regulates salt signaling in Arabidopsis thaliana. Plants 2019, 8, 573. [Google Scholar] [CrossRef] [PubMed]
  58. Wang, T.; Ma, Y.; Huang, X.; Mu, T.; Li, Y.; Li, X.; Liu, X.; Hou, B. Overexpression of OsUGT3 enhances drought and salt tolerance through modulating ABA synthesis and scavenging ROS in rice. Environ. Exp. Bot. 2021, 192, 104653. [Google Scholar] [CrossRef]
  59. Huang, R.; Jiang, S.; Dai, M.; Shi, H.; Zhu, H.; Guo, Z. Zinc finger transcription factor MtZPT2-2 negatively regulates salt tolerance in Medicago truncatula. Plant Physiol. 2024, 194, 564–577. [Google Scholar] [CrossRef] [PubMed]
  60. Kodaira, K.S.; Qin, F.; Tran, L.S.; Maruyama, K.; Kidokoro, S.; Fujita, Y.; Shinozaki, K.; Yamaguchi-Shinozaki, K. Arabidopsis Cys2/His2 zinc-finger proteins AZF1 and AZF2 negatively regulate abscisic acid-repressive and auxin-inducible genes under abiotic stress conditions. Plant Physiol. 2011, 157, 742–756. [Google Scholar] [CrossRef]
  61. Huang, X.Y.; Chao, D.Y.; Gao, J.P.; Zhu, M.Z.; Shi, M.; Lin, H.X. A previously unknown zinc finger protein, DST, regulates drought and salt tolerance in rice via stomatal aperture control. Genes Dev. 2009, 23, 1805–1817. [Google Scholar] [CrossRef]
  62. Zhang, Y.; Lan, H.; Shao, Q.; Wang, R.; Chen, H.; Tang, H.; Zhang, H.; Huang, J. An A20/AN1-type zinc finger protein modulates gibberellins and abscisic acid contents and increases sensitivity to abiotic stress in rice (Oryza sativa). J. Exp. Bot. 2016, 67, 315–326. [Google Scholar] [CrossRef] [PubMed]
  63. Chen, J.H.; Jiang, H.W.; Hsieh, E.J.; Chen, H.Y.; Chien, C.T.; Hsieh, H.L.; Lin, T.P. Drought and salt stress tolerance of an Arabidopsis glutathione S-transferase U17 knockout mutant are attributed to the combined effect of glutathione and abscisic acid. Plant Physiol. 2012, 158, 340–351. [Google Scholar] [CrossRef] [PubMed]
  64. Love, M.I.; Huber, W.; Anders, S. Moderated estimation of fold change and dispersion for RNA-seq data with DESeq2. Genome Biol. 2014, 15, 550. [Google Scholar] [CrossRef] [PubMed]
Figure 1. Overview of differentially expressed genes (DEGs). (a) Number of DEGs in each pair. Red, upregulated DEGs; blue, downregulated DEGs. (b) Venn diagram of the DEGs before and after NaCl treatment. Green, 0 h vs. 1 h; blue, 0 h vs. 6 h; red, 0 h vs. 24 h; yellow, 0 h vs. 48 h.
Plants 13 00274 g001
Figure 2. Weighted gene co-expression network analysis (WGCNA) in salt-stress response of wheat roots. (a) Cluster dendrogram and module colors of 4202 DEGs. (b) Heatmap for the relationships of modules and time courses. Each cell contains the corresponding correlation and p-value in parentheses. * indicates p < 0.05, and ** indicates p < 0.01.
Plants 13 00274 g002
Figure 3. Gene ontology (GO) enrichment analysis of DEGs in the blue-module. The brown and black GO terms belong to the categories of biological process and cellular components, respectively.
Plants 13 00274 g003
Figure 4. Manhattan plots for association analysis of DEGs and root salt-tolerant phenotypes in 114 wheat accessions. (a) Relative salt-injury rate (RSIR) for total root length (RtL). (b) RSIR for root tip number (RT). (c) RSIR for total surface area (RsA). (d) RSIR for average diameter (RD). (e) RSIR for total volume (RV). (f) RSIR for root branching number (RF).
Plants 13 00274 g004
Figure 5. Significant differences analysis in genotypes of high-confidence SNPs from four candidate genes. (a,b) Differences in RSIR-RtL and -RsA corresponding to genotypes of 1A337654393(A/G) of TaGST. (cf) Differences in RSIR-RtL, -RsA, -RT, and -RV corresponding to genotypes of 3A7437277(C/T) of TaWAT. (g) Differences in RSIR-RV corresponding to genotypes of 5B91533091(A/G) of TaZFP. (h) Differences in RSIR-RV corresponding to genotypes of 6B708989259(G/C) of TaAQP. Red and blue represent base allele variations of SNP. ** indicates p < 0.01, *** indicates p < 0.001, and **** indicates p < 0.0001.
Plants 13 00274 g005
Figure 6. Co-expression network for four hub genes and 20 DEGs with the highest edge weight values from selected terms in the blue module. The red, green, and blue circles represent hub-genes, regulatory genes, and structural genes, respectively. Arrows indicate the direction of interaction.
Plants 13 00274 g006
Figure 7. Heatmap of genes in the co-expression network at 0, 1, 6, 24, and 48 h after salt stress in wheat root. The red, green, and blue genes represent hub-genes, regulatory genes, and structural genes, respectively, and the gene annotations based on Chinese Spring RefSeq v1.1 are listed in parentheses.
Plants 13 00274 g007
Disclaimer/Publisher’s Note: The statements, opinions and data contained in all publications are solely those of the individual author(s) and contributor(s) and not of MDPI and/or the editor(s). MDPI and/or the editor(s) disclaim responsibility for any injury to people or property resulting from any ideas, methods, instructions or products referred to in the content.

