Article

Potential Response Patterns of Endogenous Hormones in Cliff Species Opisthopappus taihangensis and Opisthopappus longilobus under Salt Stress

1
School of Life Sciences, Shanxi Normal University, Taiyuan 030031, China
2
Department of Botany, Saint Mary’s University, Halifax, NS B3H 3C3, Canada
*
Authors to whom correspondence should be addressed.
These authors contributed equally to this work.
Plants 2024, 13(4), 557; https://doi.org/10.3390/plants13040557
Submission received: 18 December 2023 / Revised: 8 February 2024 / Accepted: 15 February 2024 / Published: 19 February 2024

Abstract

:
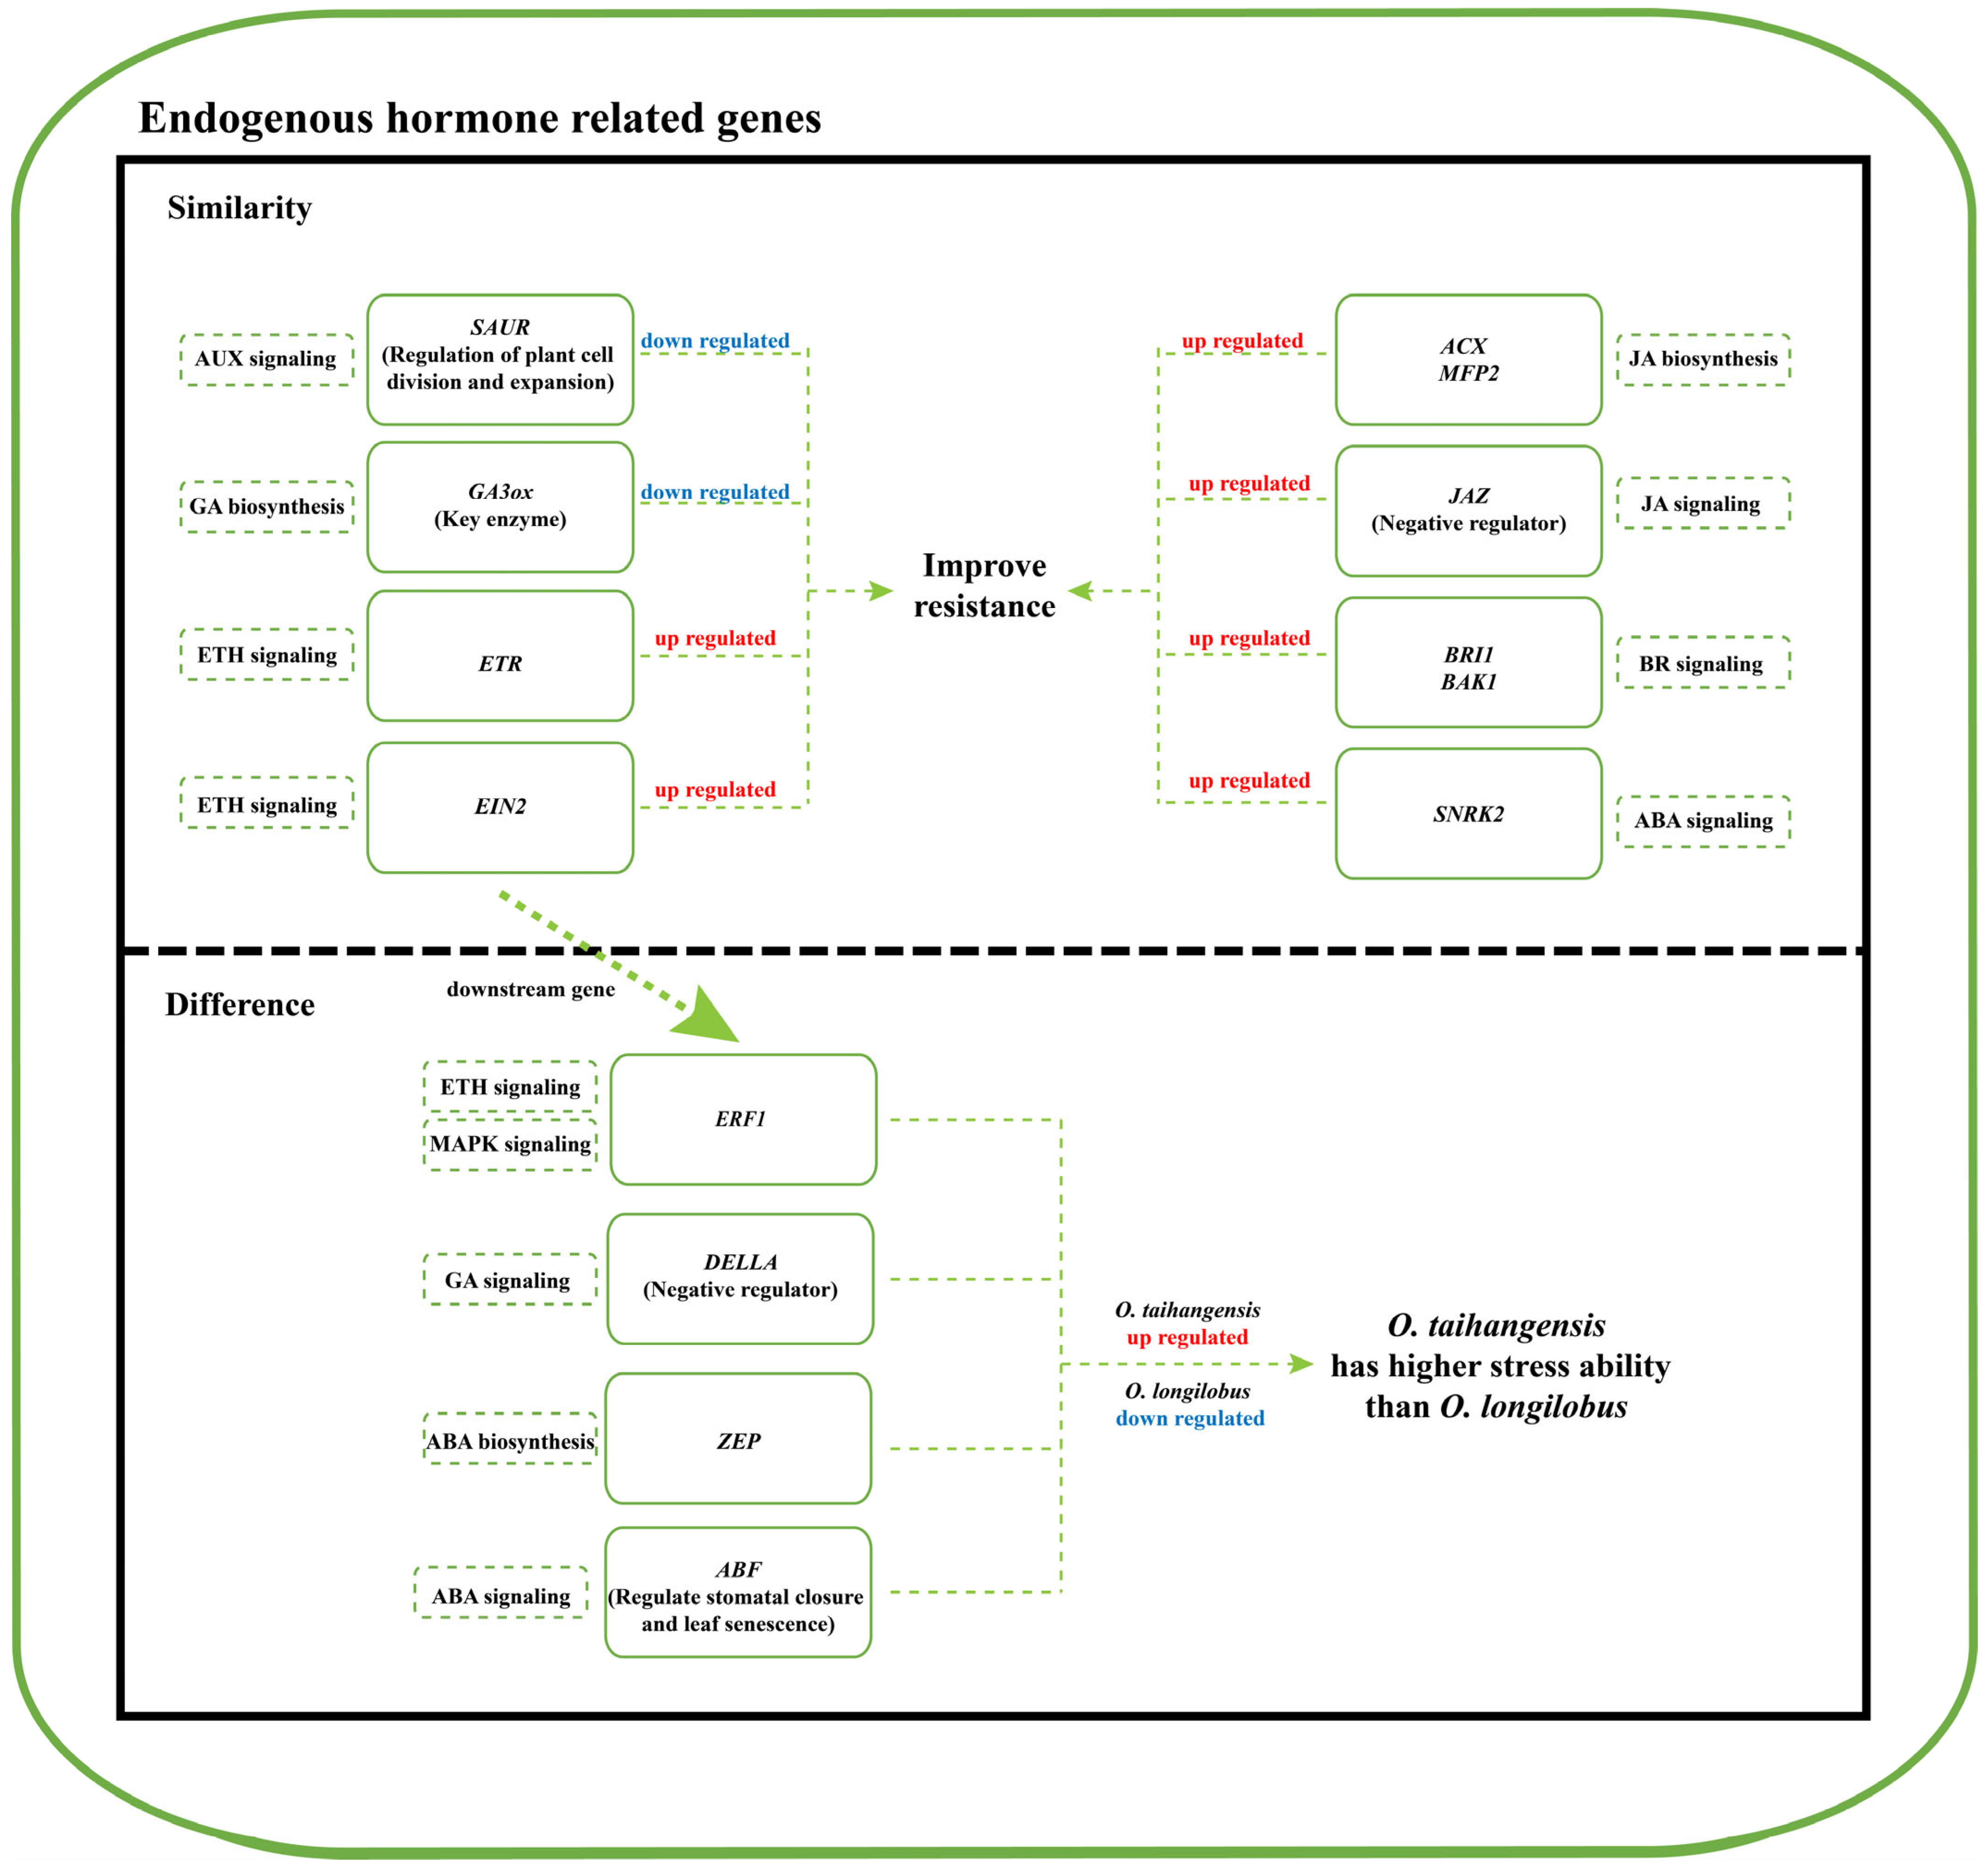
When plants are exposed to salt stress, endogenous hormones are essential for their responses through biosynthesis and signal transduction pathways. However, the roles of endogenous hormones in two cliff species (Opisthopappus taihangensis and Opisthopappus longilobus (Opisthopappus genus)) in the Taihang Mountains under salt stress have not been investigated to date. Following different time treatments under 500 mM salt concentrations, 239 differentially expressed gene (DEG)-related endogenous hormones were identified that exhibited four change trends, which in Profile 47 were upregulated in both species. The C-DEG genes of AUX, GA, JA, BR, ETH, and ABA endogenous hormones were significantly enriched in Opisthopappus taihangensis (O. taihangensis) and Opisthopappus longilobus (O. longilobus). During the responsive process, mainly AUX, GA, and JA biosynthesis and signal transduction were triggered in the two species. Subsequently, crosstalk further influenced BR, EHT, ABA, and MAPK signal transduction pathways to improve the salt resistance of the two species. Within the protein–protein interactions (PPI), seven proteins exhibited the highest interactions, which primarily involved two downregulated genes (SAUR and GA3ox) and eight upregulated genes (ACX, MFP2, JAZ, BRI1, BAK1, ETR, EIN2, and SNRK2) of the above pathways. The more upregulated expression of ZEP (in the ABA biosynthesis pathway), DELLA (in the GA signaling pathway), ABF (in the ABA signaling pathway), and ERF1 (in the ETH signaling pathway) in O. taihangensis revealed that it had a relatively higher salt resistance than O. longilobus. This revealed that the responsive patterns to salt stress between the two species had both similarities and differences. The results of this investigation shed light on the potential adaptive mechanisms of O. taihangensis and O. longilobus under cliff environments, while laying a foundation for the study of other cliff species in the Taihang Mountains.

1. Introduction

With the rapidly changing climate, soil salinization has emerged as a global scale environmental issue [1]. More than 900 million hectares of land are currently affected by excessive salt worldwide, a problem exacerbated by global warming and anthropogenic activities [2], and further aggravated through the deterioration of the natural environment overall [3].
As is well known, salinity is a common abiotic stress for organisms. The impacts of salinity are increasing rapidly on a global scale, which severely limits plant growth, productivity, and geographical distribution. To facilitate their survival and development, plants typically retain an array of mechanisms to mitigate salt stress, which encompass hormonal stimulation, ion exchange, antioxidant enzymes, and the activation of signaling cascades on their metabolic and genetic frontiers [4].
Among these specific processes, endogenous hormones, which are substances that serve as signaling molecules in response to environmental stress, play key roles in the salt tolerance of plants [5]. During stress responses, hormones including auxin (AUX), abscisic acid (ABA), cytokinin (CK), ethylene (ETH), gibberellin (GA), salicylic acid (SA), jasmonic acid (JA), and brassinolide (BR) take on various functions at different growth stages under diverse conditions [6]. These endogenous hormones regulate the adaptability of plant growth by adjusting saline signals, whereafter plants develop their defense strategies by directing the synthesis, signal transduction, and metabolism of various hormones.
For AUX, it plays pivotal roles in various biological processes, including apical dominance, embryonic development, adventitious root formation of lateral roots, and vascular tissue differentiation [7]. Upon sensing AUX, the receptors initiate the formation of SKP1, Cullin, and F-box (SCF) complexes. These complexes bind to AUX/IAA inhibitors, which leads to ubiquitination and subsequent proteasome-mediated degradation of AUX/IAA. AUX/IAA degradation results in the release of AUX response factors (ARF) and the activation of AUX-induced gene expression. In Arabidopsis, mutants lacking AUX receptors exhibit heightened sensitivity to salt stress, accompanied by the downregulation of AUX receptor genes (TIR1 and AFB2). This suggests that Arabidopsis mitigates its growth rate to improve salt tolerance by sustaining a diminished AUX signal response [8,9].
GA can promote stem elongation and regulates the development of meristems, biotic, and abiotic stresses [10,11]. It associates with the GOD1 receptor to induce conformational changes. Subsequently, they bind with the DELLA protein, resulting in the formation of a GA-GID1-DELLA complex, which facilitates the degradation of the DELLA protein through the 26S proteasome, thereby activating the downstream response genes [12,13]. Reduced GA levels induce slower growth and assists with improving the stress resistance of plants [14].
ABA synthesis primarily occurs in vascular tissues, and subsequently translocated to guard cells where it modulates responses to osmotic and salt stress, mainly by regulating plant stomata [15]. As a primary mediator, ABA enhances plant survival under salt stress through the activation of plasma membrane-bound channels or by interacting with Ca2+ [16]. PYR/PYL is an ABA signaling complex receptor and its overexpression can suppress PP2Cs, which releases SNRK2s from the inhibition of PP2Cs to subsequently activate its downstream target (ABRE-binding factor) [17,18].
Furthermore, ETH is involved not only with an array of physiological and developmental processes (from the regulation of organ growth to inducing fruit ripening), but also multiple stress responses [19]. Also, CK, SA, JA, and BR mediate stress adaptation responses in plants. For example, CK regulates cell proliferation, differentiation, leaf aging, and leaf complexity. JA and SA are often considered as resistant to related endogenous hormones in that they have key advantages for plant responses to various stresses. BR is a sterol compound that can regulate plant seed germination, flowering, senescence, tropism, photosynthesis, and stress resistance, which is closely related to other signaling molecules [20].
Opisthopappus genus is a perennial herb that general grows on the cliffs of the Taihang Mountains in China. Within Opisthopappus genus are two species (Opisthopappus taihangensis (O. taihangensis) and Opisthopappus longilobus (O. longilobus)). As a typical cliff plant both of these species exhibit good cold and drought resistance and are considered an important wild germplasm of Asteraceae [21,22,23].
When we inadvertently planted O. taihangensis and O. longilobus plants into the salt alkaline soil of our university, it was observed that both species grew well and exhibited good salt resistance; thus, we pondered what the underlying mechanism might be. Consequently, salt stress treatments for O. taihangensis and O. longilobus were conducted in the laboratory. Firstly, the concentration gradients of mixed salt solutions were set to 0, 100, 300, 500, and 700 mM. The chlorophyll, peroxidase (POD), catalase (CAT), superoxide dismutase (SOD), soluble protein (SP), and malondialdehyde (MDA) contents were then measured following the treatments. The results revealed that a salt concentration of 500 mM was a critical value for O. taihangensis and O. longilobus. Thus, we selected 500 mM as the salt concentration for the time gradient treatments of O. taihangensis and O. longilobus.
After the treatments, the transcriptomic data of O. taihangensis and O. longilobus under salt stress with different time gradients was sequenced. Based on the outcomes, we aimed to address the following issues: (1) determine the expression trends of differentially expressed genes (DEGs) related to endogenous hormones under salt stress; (2) analyze the biosynthesis and signal transduction pathways of the endogenous hormones under salt stress; (3) explore the similarities and differences of the endogenous hormone responses to salt stress between O. taihangensis and O. longilobus. The results would provide a reference for exploring the salt tolerance mechanisms of O. taihangensis and O. longilobus, while laying a foundation for the study of the responses of endogenous hormones in other cliff plants.

2. Results

2.1. DEGs Related to Endogenous Opisthopappus Hormones

A total of 152.43 Gb of clean data was obtained after sequencing, with 77.06 Gb of clean data for O. taihangensis and 73.37 Gb of clean data for O. longilobuss. For each sample, >96.57% of the bases had scores of Q30 or above, which indicated that the sequencing results could be used for subsequent analysis (Table A1).
Based on the above results, the DEGs correlated with endogenous hormone biosynthesis and signal transduction pathways were screened. There were 239 DEGs between the O. taihangensis and O. longilobus obtained between 0 h vs. 6 h. Furthermore, 239 DEGs and 239 DEGs between 6 h vs. 24 h and 24 h vs. 48 h, respectively, were also obtained (Figure 1A). Thus, these DEGs were considered as common (C-DEGs).
The expression of 239 C-DEGs in O. taihangensis presented four change trends under different time gradient treatments. These change trends included Profile1, Profile 35, Profile 47, and Profile 48, respectively, in which Profile 47 was significantly upregulated and Profile 1 was significantly downregulated (Figure 1B–E).
For O. longilobus the expression of 239 C-DEGs also had four change trends, which were Profile 44, Profile 45, Profile 46, and Profile 47, respectively. Among these four profiles, only Profile 47 was upregulated (Figure 1F–I).
According to the above, the O. taihangensis genes in Profile 1 and Profile 47, and the O. longilobus genes in Profile 47 might play critical roles in the responses to salt stress.

2.2. KEGG of DEGs

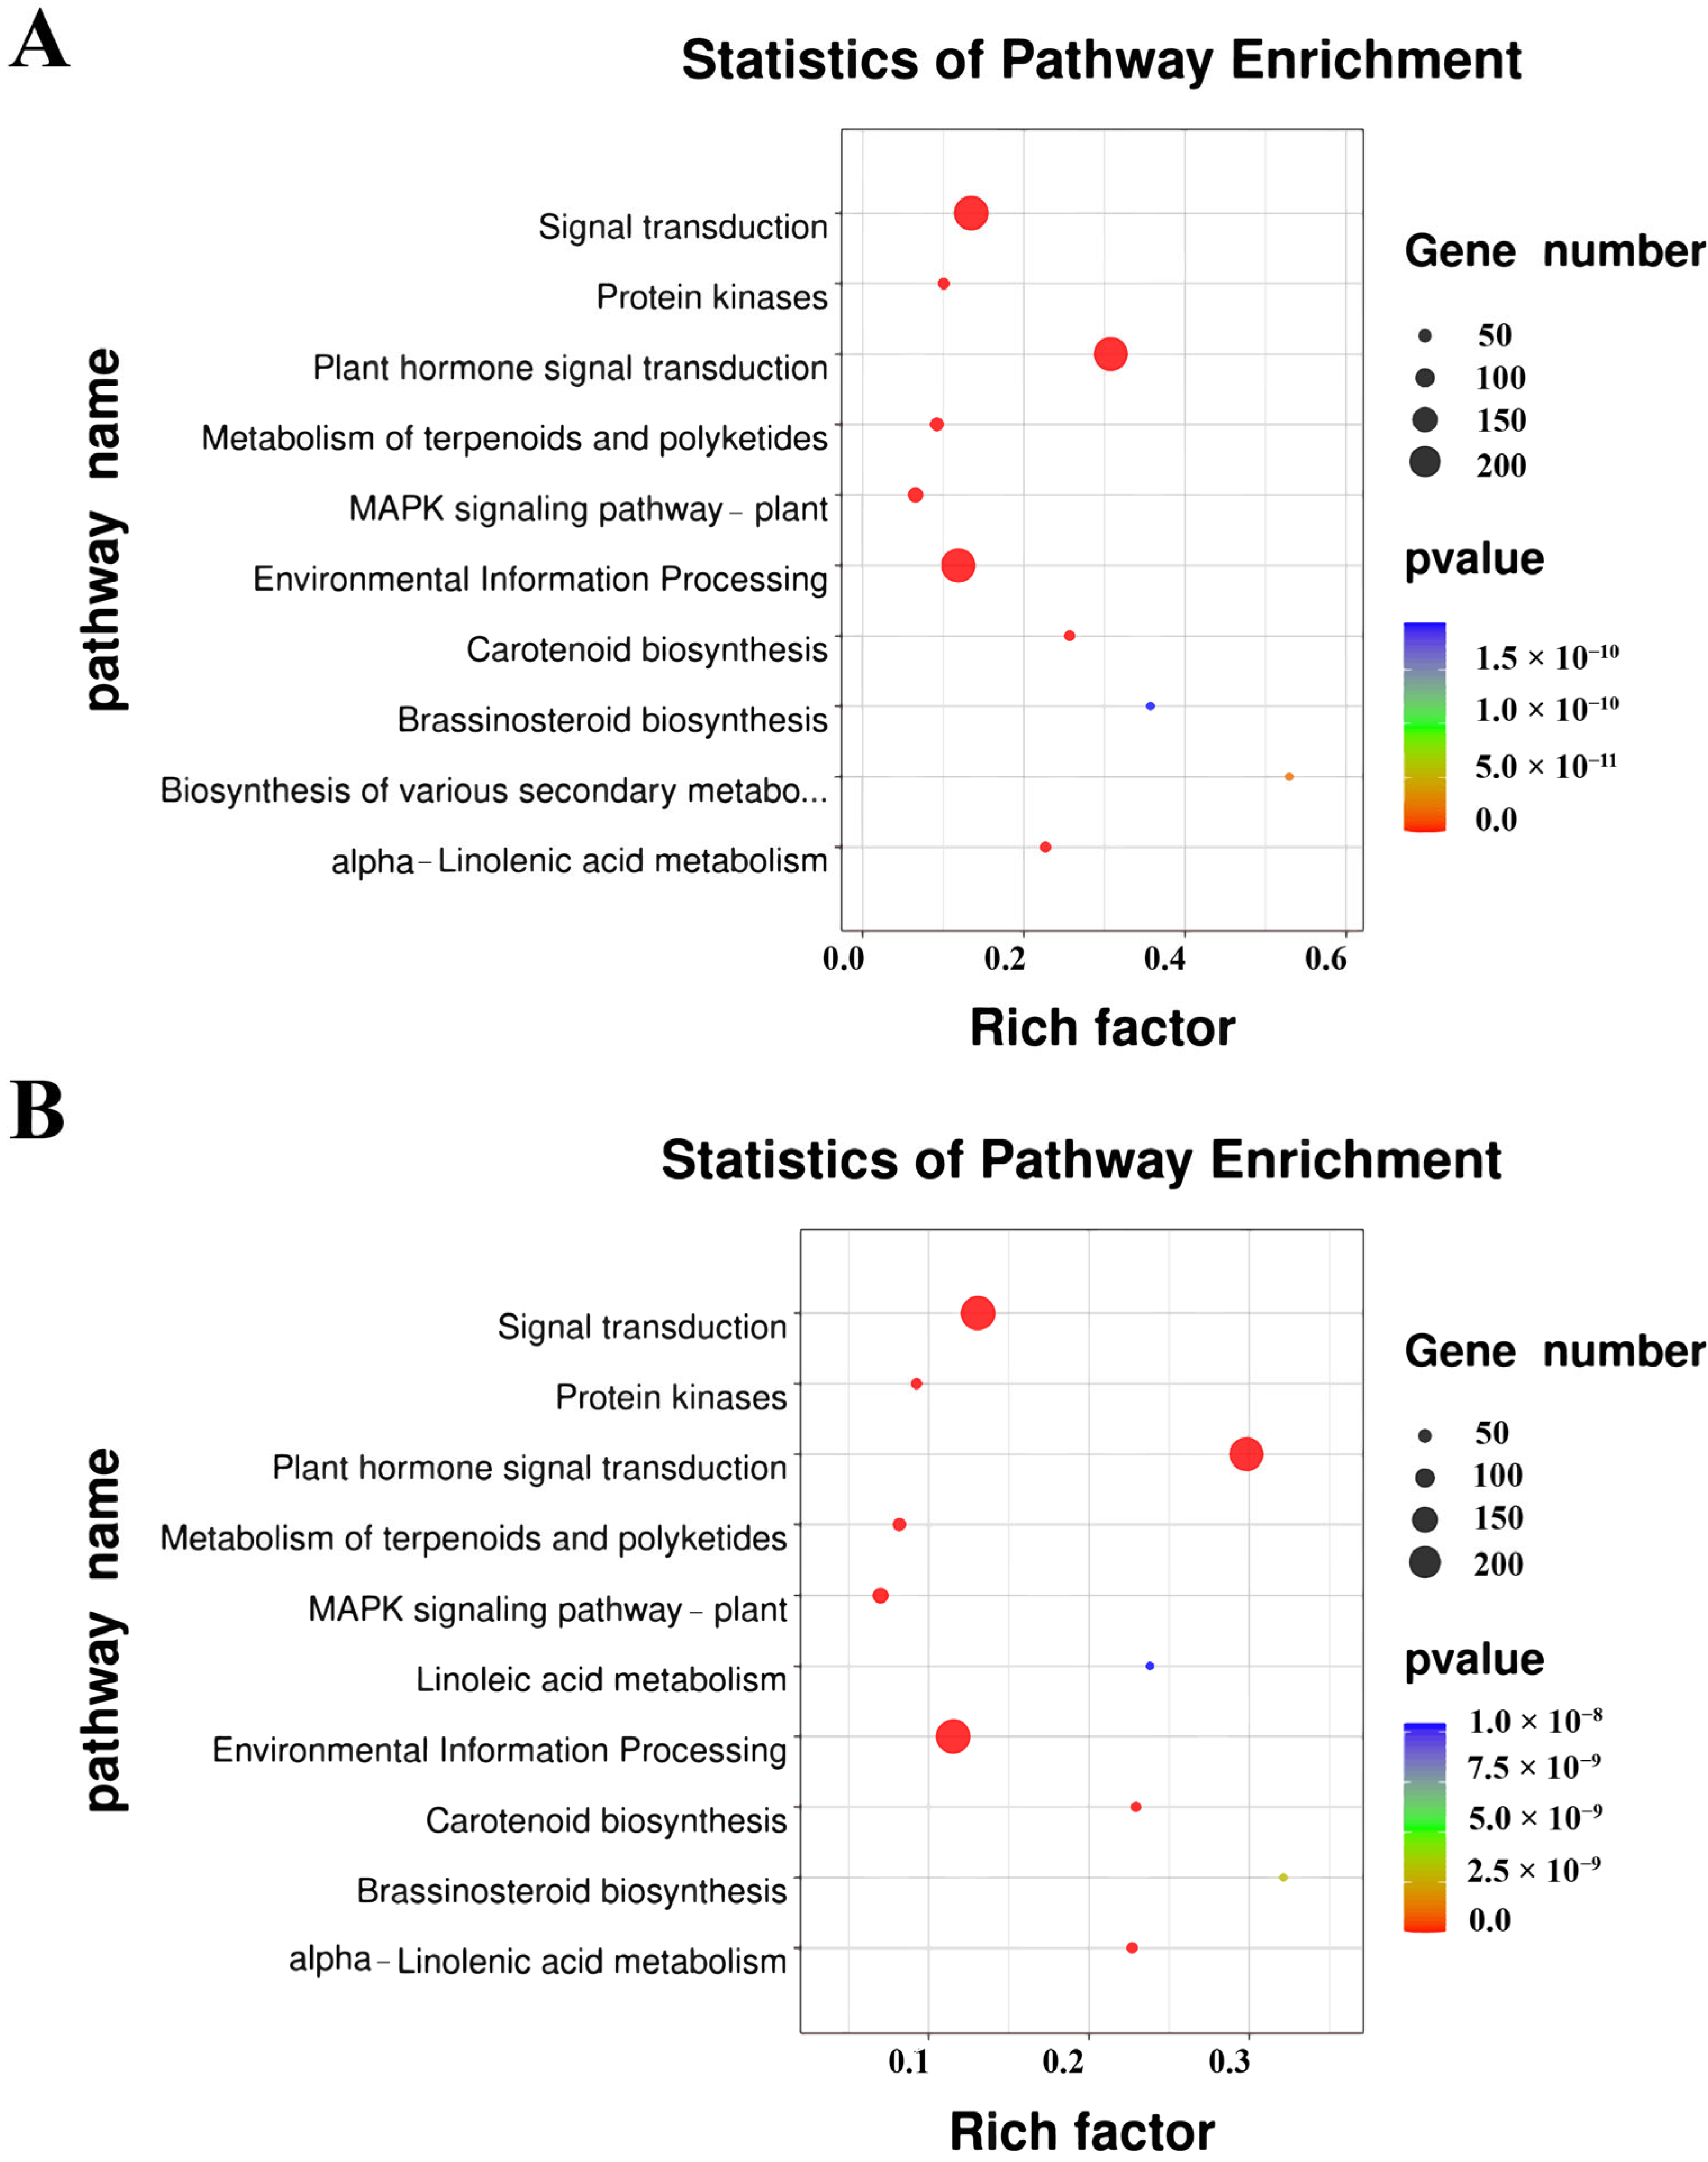
KEGG revealed that the DEGs were primarily enriched in 10 pathways. Nine pathways were essentially same between O. taihangensis and O. longilobus (signal transduction, protein kinases, plant hormone signal transduction, metabolism of terpenoids and polyketides, MAPK signaling pathway–plant, environmental information processing, brassinosteroid biosynthesis, carotenoid biosynthesis, and alpha-Linolenic acid metabolism). Among these similar pathways, plant hormone signal transduction was the most significant between O. taihangensis and O. longilobus (Figure 2).
The remaining pathway (biosynthesis of various secondary metabolites—part 3) uniquely occurred in O. taihangensis, while linoleic acid metabolism was unique in O. longilobus. However, the significance of both these pathways was low.
Accordingly, the DEGs annotated in the plant hormone signal transduction and biosynthetic pathways of O. taihangensis and O. longilobus were further analyzed.

2.3. Biosynthesis and Signal Transduction Pathways of Endogenous Hormones

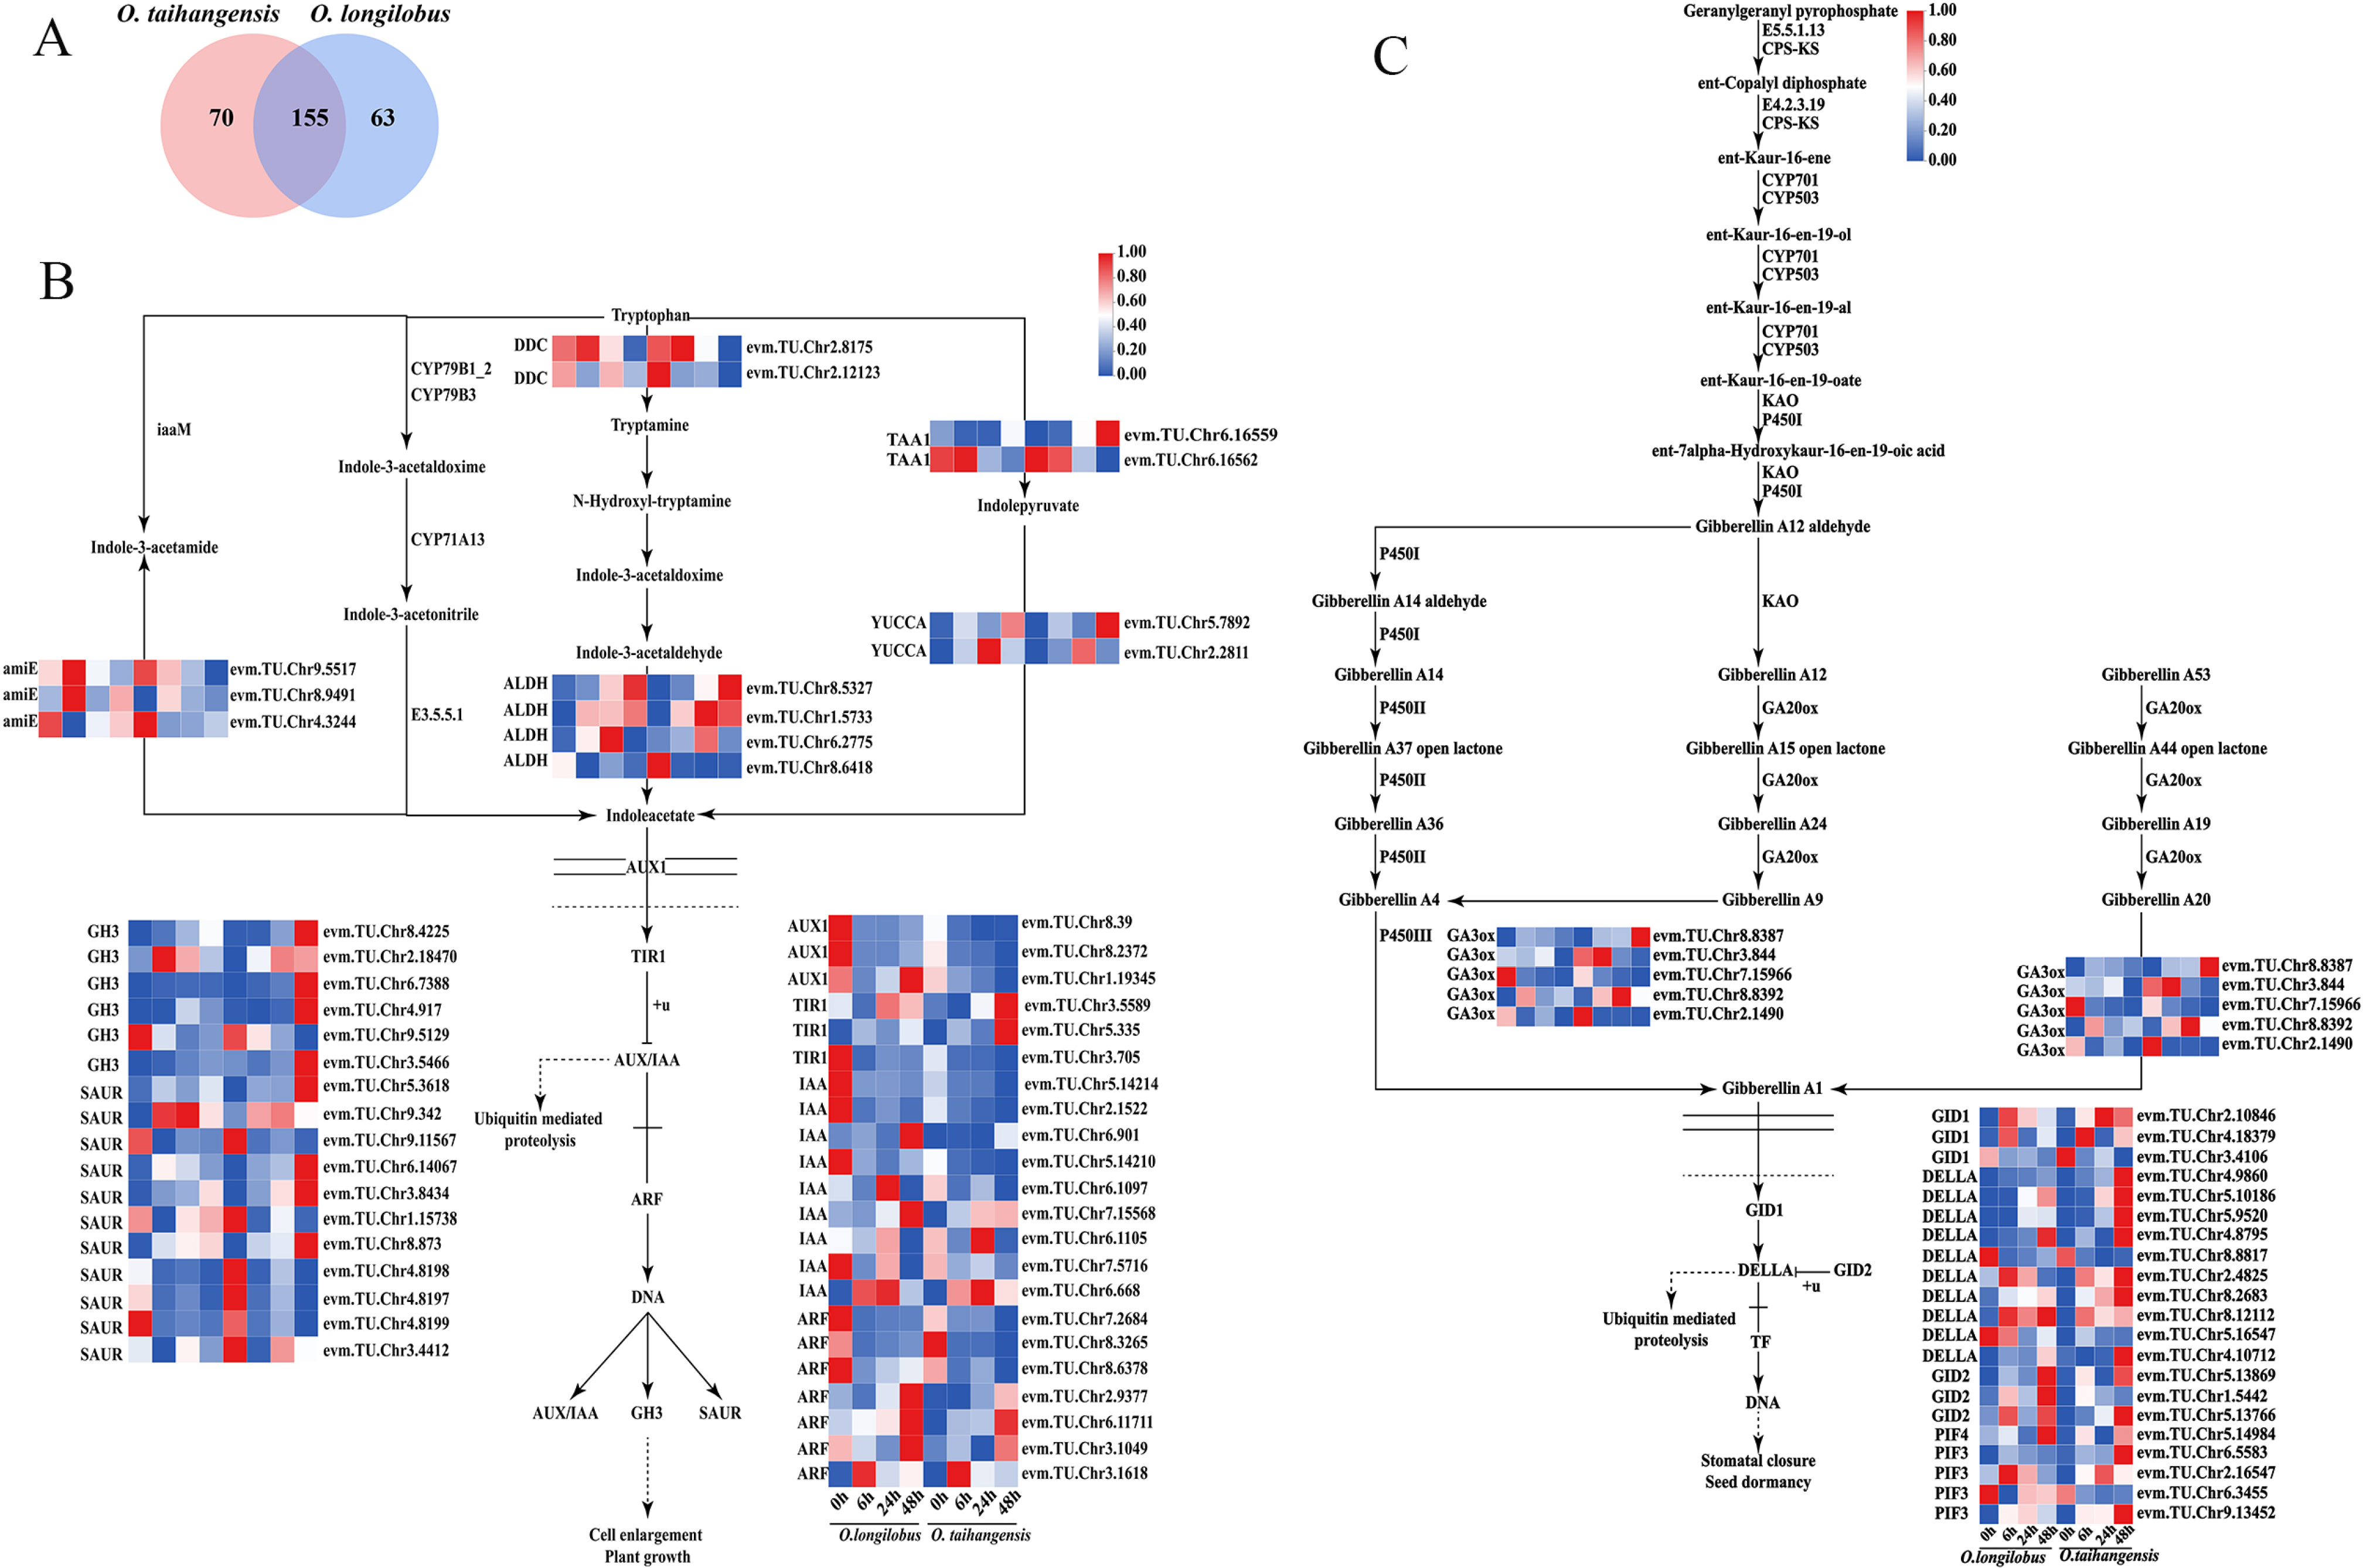
A total of 155 C-DEGs were discovered in the plant hormone signal transduction pathway (Figure 3A). This pathway mainly involved the signal transduction of AUX, CK, GA, ABA, ETH, BR, JA, and SA.

2.3.1. AUX and GA Biosynthesis and Signal Transduction

Within the AUX biosynthesis pathway 13 C-DEGs were involved, having two L-tryptophan–pyruvate aminotransferase genes (TAA1s), two indole-3-pyruvate monooxygenase genes (YUCCAs), two aromatic-L-amino-acid/L-tryptophan decarboxylase genes (DDCs), four aldehyde dehydrogenase genes (ALDHs), and three amidase genes (amiEs). The expressions of these genes were basically the same between O. taihangensis and O. longilobus.
Meanwhile, a total of thrity-nine C-DEGs were involved in AUX signal transduction, including three auxin influx carrier genes (AUX1s), three transport inhibitor response 1 genes (TIR1s), nine auxin-responsive protein IAA genes (IAAs), seven auxin response factor genes (ARFs), six auxin-responsive GH3 gene family genes (GH3s), and eleven SAUR family protein genes (SAURs).
The expression levels of most AUX1s and IAAs presented peaks at 0 h in O. longilobus, while they appeared as low points for O. taihangensis. At 48 h, the expression of TIR1s in O. taihangensis was significantly higher than that in O. longilobus, while the expression of GH3s exhibited a similar trend, reaching its peak at 48 h in O. taihangensis. Nevertheless, the expression of ARFs was essentially identical for O. taihangensis and O. longilobus. Interestingly, the expression of six SAURs from O. longilobus, and five SAURs from O. taihangensis were downregulated at all time points under the salt stress treatments (Figure 3B).
Five C-DEGs encoding for gibberellin 3beta-dioxygenase genes (GA3ox) were found to be involved in GA synthesis in the diterpenoid biosynthesis pathway. Notably, some of these genes exhibited low expression levels at 6, 24, and 48 h in O. taihangensis and O. longilobus.
Further, 21 C-DEGs associated with GA signal transduction were detected, which included three gibberellin receptor GID1 genes (GID1s), 10 DELLA protein genes (DELLAs), three F-box protein GID2 genes (GID2s), one phytochrome-interacting factor 4 gene (PIF4), and four phytochrome-interacting factor 3 genes (PIF3s).
GID1s was upregulated at 0, 6, 24, and 48 h in O. taihangensis, while it was downregulated at 48 h in O. longilobus. Most DELLAs exhibited upregulation at 48 h and reached their peak expression levels in O. taihangensis. A few DELLAs exhibited upregulation at 48 h in O. longilobus. Moreover, a significant difference was observed in the expression levels of GlD2s between O. longilobus and O. taihangensis at 48 h, with a higher expression in O. longilobus. Similarly, the expression levels of PIF3s at 48 h were notably lower in O. longilobus compared with O. taihangensis (Figure 3C).

2.3.2. JA and BR Biosynthesis and Signal Transduction

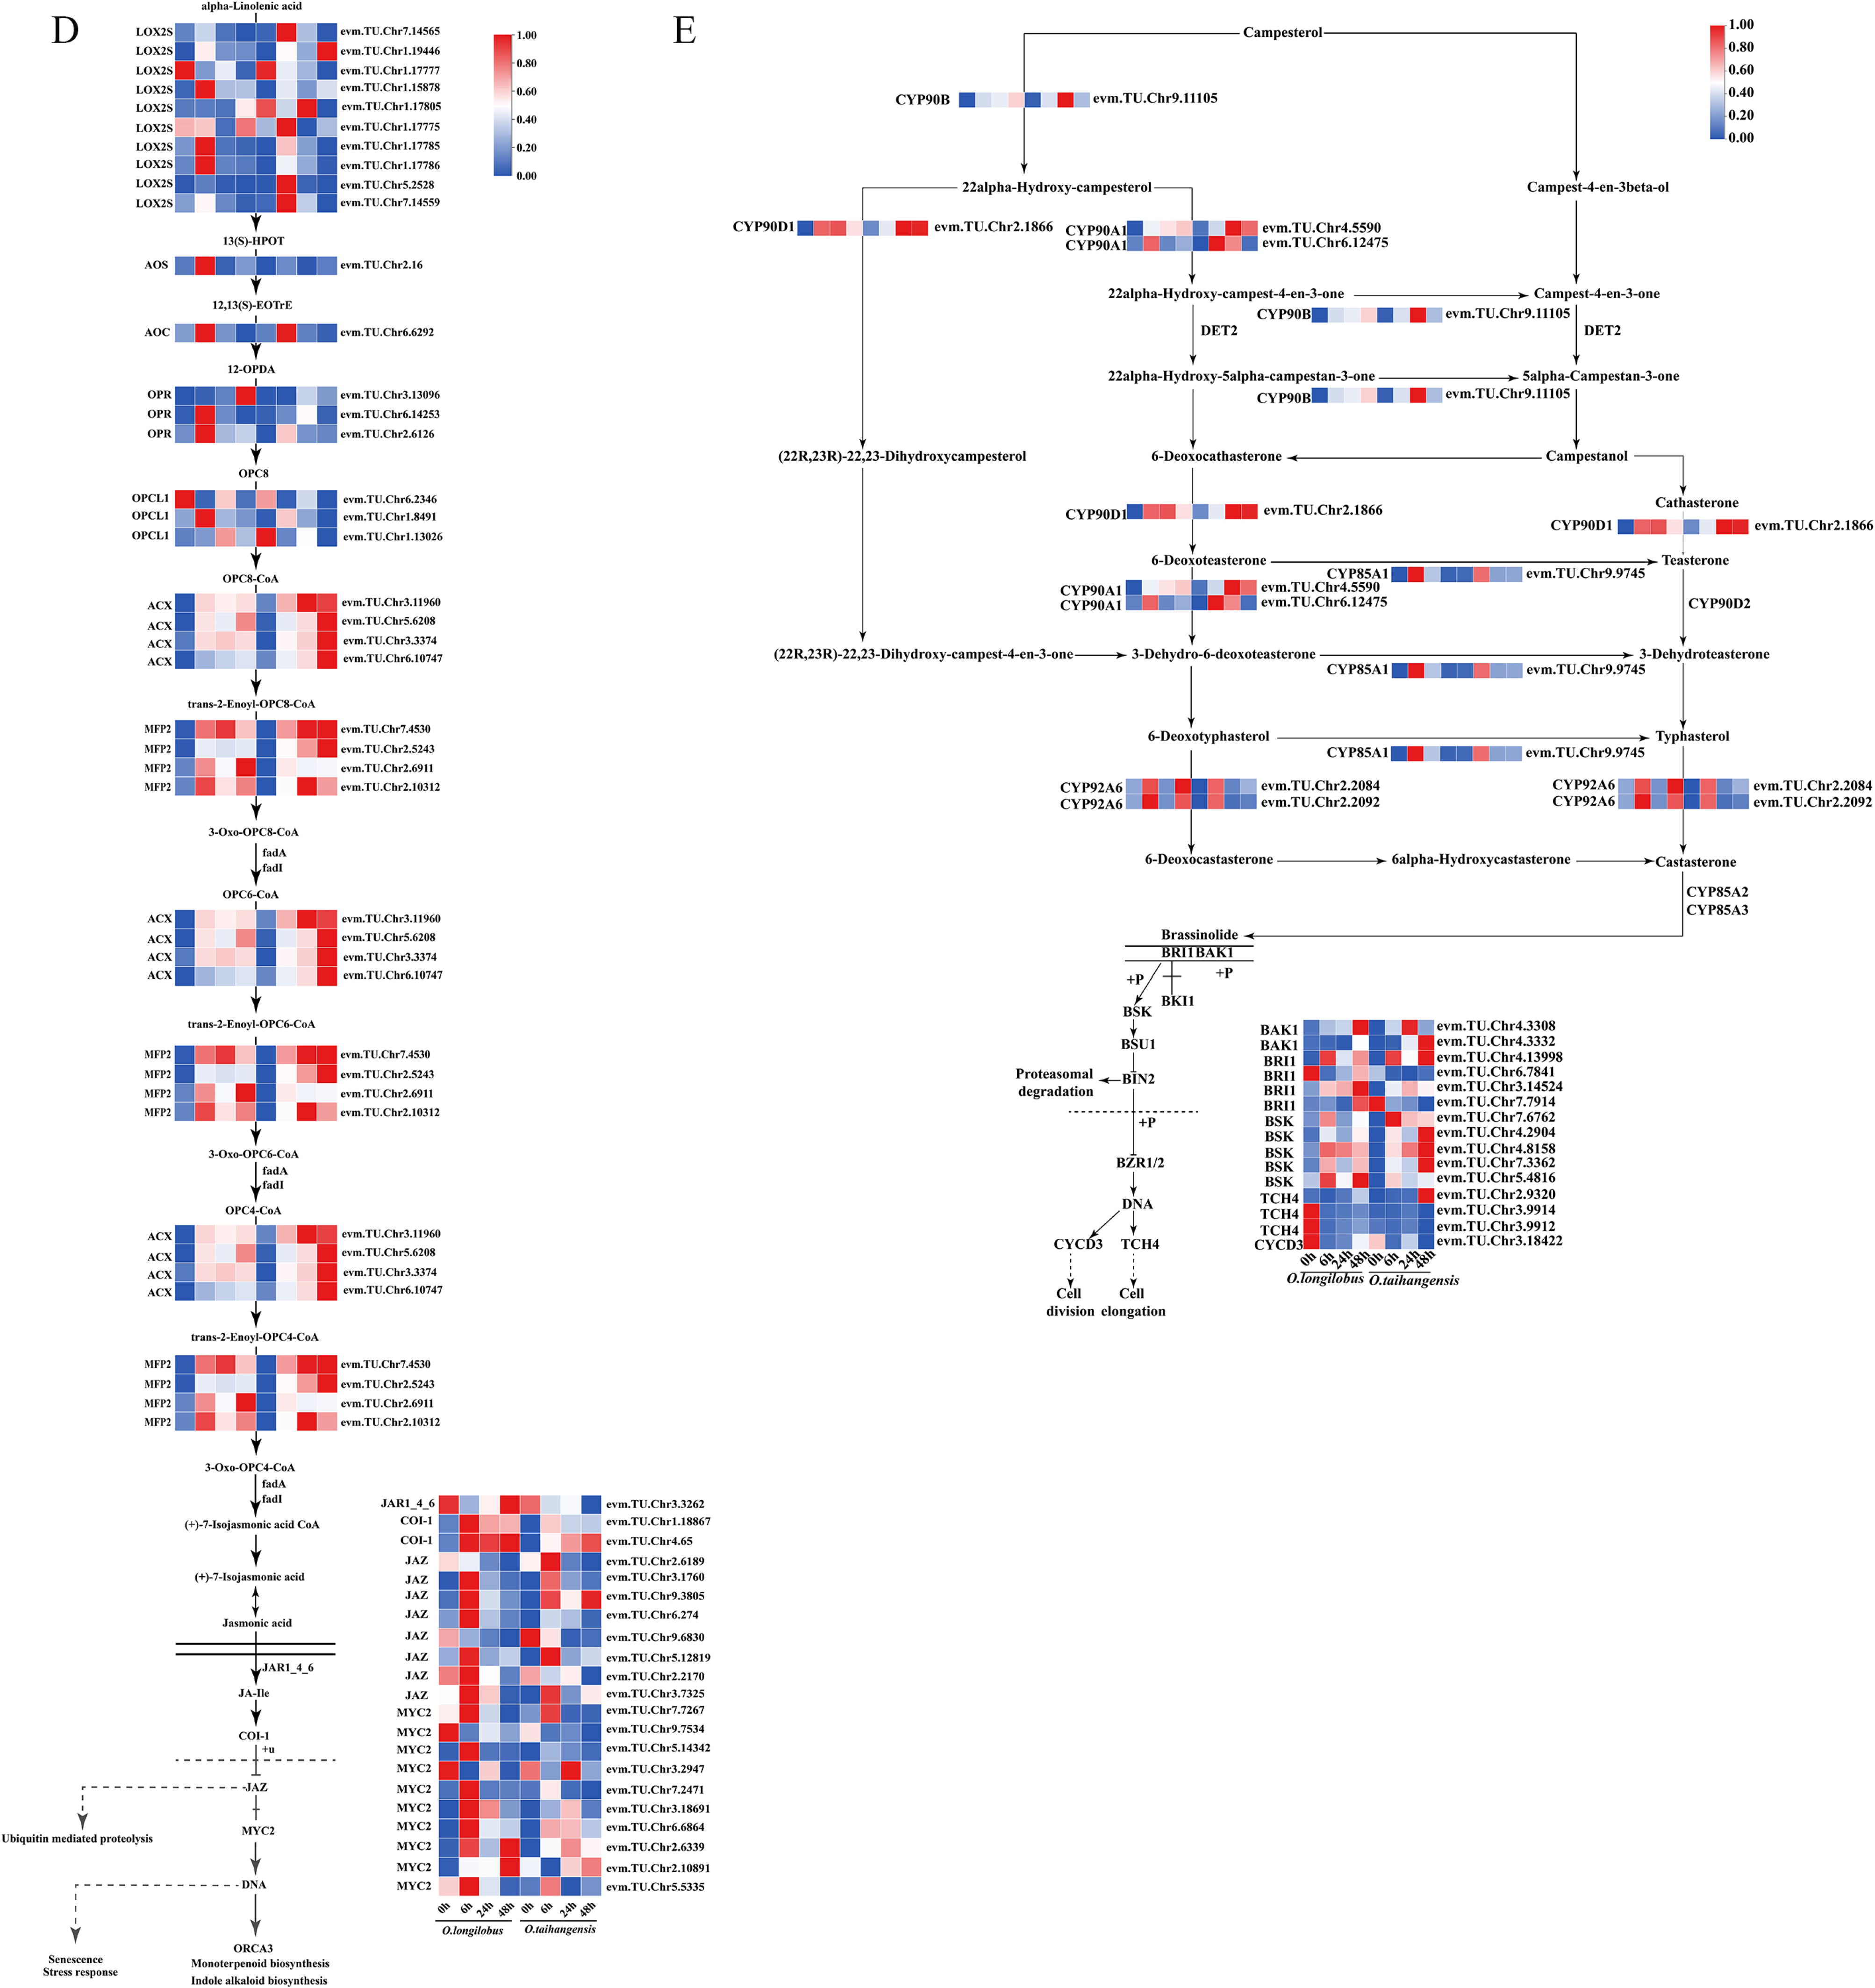
There were a total of 26 C-DEGs in the JA biosynthesis pathway, including 10 lipoxygenase genes (LOX2Ss), 1 hydroperoxide dehydratase gene (AOS), 1 allene oxide cyclase gene (AOC), 3 12-oxophytodienoic acid reductase genes (OPRs), 3 OPC-8:0 CoA ligase 1 genes (OPCL1s), 4 acyl-CoA oxidase genes (ACXs), and 4 enoyl-CoA hydratase/3-hydroxyacyl-CoA dehydrogenase genes (MFP2s). Among the above, the expressions of ACXs and MFP2s in O. taihangensis and O. longilobus were upregulated at 6, 24, and 48 h.
A total of 21 C-DEGs were observed in JA signal transduction, namely 1 jasmonic acid-amino synthetase gene (JAR1_4_6s), 2 coronatine-insensitive protein 1 genes (COI-1s), 8 jasmonate ZIM domain-containing protein genes (JAZs), and 10 transcription factor MYC2 genes (MYC2s).
The JAR1_4_6s expression was upregulated at 0 and 48 h in O. longilobus, while upregulated at 0 h and downregulated at 48 h in O. taihangensis. The expression of COI-1s was upregulated at 6, 24, and 48 h in O. longilobus, while that of COI-1s in O. taihangensis was significantly lower than in O. longilobus. For O. taihangensis and O. longilobus the expression of JAZs was upregulated at 6 h. MYC2s reached its peak at 6 h, and two MYC2s were upregulated at 48 h in O. longilobus. At 6 and 48 h, the expression of MYC2s in O. taihangensis was significantly lower than that in O. longilobus (Figure 3D).
There were seven C-DEGs involved in BR biosynthesis pathway, including one steroid 22S-hydroxylase gene (CYP90B), one 3-epi-6-deoxocathasterone 23-monooxygenase gene (CYP90D1), two 3beta,22 alpha-dihydroxysteroid 3-dehydrogenase genes (CYP90A1s), two typhasterol/6-deoxotyphasterol 2alpha-hydroxylase genes (CYP92A6s), and one brassinosteroid 6-oxygenase gene (CYP85A1).
The expression of CYP90D1 was upregulated at 6 and 24 h in O. longilobus, as well as at 24 and 48 h in O. taihangensis. In O. taihangensis, the expression of CYP90A1s was upregulated at 6, 24, and 48 h. The expression of CYP92A6s was upregulated at 6 and 48 h in O. longilobus, while it was upregulated at 6 h in O. taihangensis.
In addition, 15 C-DEGs involved in BR signal transduction were found, namely 2 brassinosteroid-insensitive 1-associated receptor kinase 1 genes (BAK1s), 4 protein brassinosteroid-insensitive 1 genes (BRI1s), five BR-signaling kinase genes (BSKs), 3 xyloglucan:xyloglucosyl transferase TCH4 genes (TCH4s), and 1 cyclin D3 gene (CYCD3). Four BRI1s from O. longilobus and one BRI1 from O. taihangens were upregulated after 48 h. The expression of BSKs at 6, 24, and 48 h in O. taihangensis was higher than that in O. longilobus. Most TCH4s and CYCD3 reached their expression peaks at 0 h in O. longilobus; however, they were downregulated in O. taihangensis (Figure 3E).

2.3.3. ABA and ETH Biosynthesis and Signal Transduction

A total of 20 C-DEGs were found to be involved in the ABA biosynthesis pathway, including 1 beta-carotene 3-hydroxylase gene (crtZ), 1 beta-ring hydroxylase gene (LUT5), 3 zeaxanthin epoxidase genes (ZEPs), 3 9-cis-epoxycarotenoid dioxygenase genes (NCEDs), 11 xanthoxin dehydrogenase genes (ABA2s), and 1 abscisic-aldehyde oxidase gene (AAO3), among which 1 ZEP in O. taihangensis was significantly higher than that of O. longilobus at 48 h.
There were 24 C-DEGs involved in ABA signal transduction, namely 1 abscisic acid receptor PYR/PYL family gene (PYR/PYL), 9 protein phosphatase 2C genes (PP2Cs), 9 serine/threonine-protein kinase SRK2 genes (SNRK2s), and 5 ABA responsive element binding factor genes (ABFs). In O. longilobus, the expression of PYL was upregulated at 0 h, which was downregulated in O. taihangensis. Most PP2Cs exhibited upregulated expression at 6 and 24 h and reached their peaks at 24 h in O. longilobus. In contrast, the expression of PP2Cs peaked in O. taihangensis at 48 h. Most of the SNRK2 genes peaked in both species at 6 h. Meanwhile, the downstream ABFs of PP2C genes reached their peaks at 24 h and began to downregulate at 48 h in O. longilobus. For O. taihangensis, ABFs continued to increase and reached their peak at 48 h (Figure 4A).
A total of 13 C-DEGs were involved in ETH biosynthesis pathway, having 7 S-adenosylmethionine synthetase genes (metKs), 3 1-aminocyclopropane-1-carboxylate synthase 1/2/6 genes (ACS1_2_6s), 1 1-aminocyclopropane-1-carboxylate synthase gene (ACS), and 2 aminocyclopropanecarboxylate oxidase genes (E1.14.17.4s). The expression of metKs was upregulated at 6 h in O. longilobus, whereas E1.14.17.4s was upregulated at 6, 24, and 48 h in O. longilobus.
Meanwhile, 13 C-DEGs were involved in ETH signal transduction, including 4 ethylene receptor genes (ETRs), 1 serine/threonine-protein kinase CTR1 gene (CTR1), 1 mitogen-activated protein kinase kinase 4/5 gene (MKK4_5), 2 ethylene-insensitive protein 2 genes (EIN2s), 2 ethylene-insensitive protein 3 genes (EIN3s), 2 EIN3-binding F-box protein genes (EBF1_2s), and 1 ethylene-responsive transcription factor 1 gene (ERF1). Among them, the expression of ETRs was upregulated at 48 h in both O. taihangensis and O. longilobus, as were CTR1, MKK4_5, and EIN2s. The expression of one EIN3 was highest at 0 h in O. longilobus, while the expression of another EIN3 was the highest at 48 h in O. taihangensis. EBF1_2s were upregulated at 6 h in O. longilobus, whereas only one was upregulated at 48 h in O. taihangensis. The expression of ERF1 was downregulated at 48 h for O. longilobus; however, it was upregulated at 24 and 48 h in O. taihangensis (Figure 4B).

2.3.4. CK and SA Biosynthesis and Signal Transduction

Unfortunately, no C-DEGs were observed in the CK and SA biosynthesis pathways. However, 16 C-DEGs were found to be involved in CK signal transduction, including 2 arabidopsis histidine kinase 2/3/4 genes (AHK2_3_4s), 12 two-component response regulator ARR-B family genes (ARR-Bs), and 2 two-component response regulator ARR-A family genes (ARR-As). Among them, the expression of ARR-Bs was upregulated at 48 h in O. taihangensis, while it was downregulated at the same time in O. longilobus (Figure 4C).
A total of six C-DEGs were involved in SA signal transduction, including one regulatory protein NPR1 gene (NPR1), two transcription factor TGA genes (TGAs), and three pathogenesis-related protein 1 genes (PR-1s). Meanwhile the expression of PR-1s was upregulated at 48 h in O. longilobus (Figure 4D).

2.4. MAPK Signaling Pathway

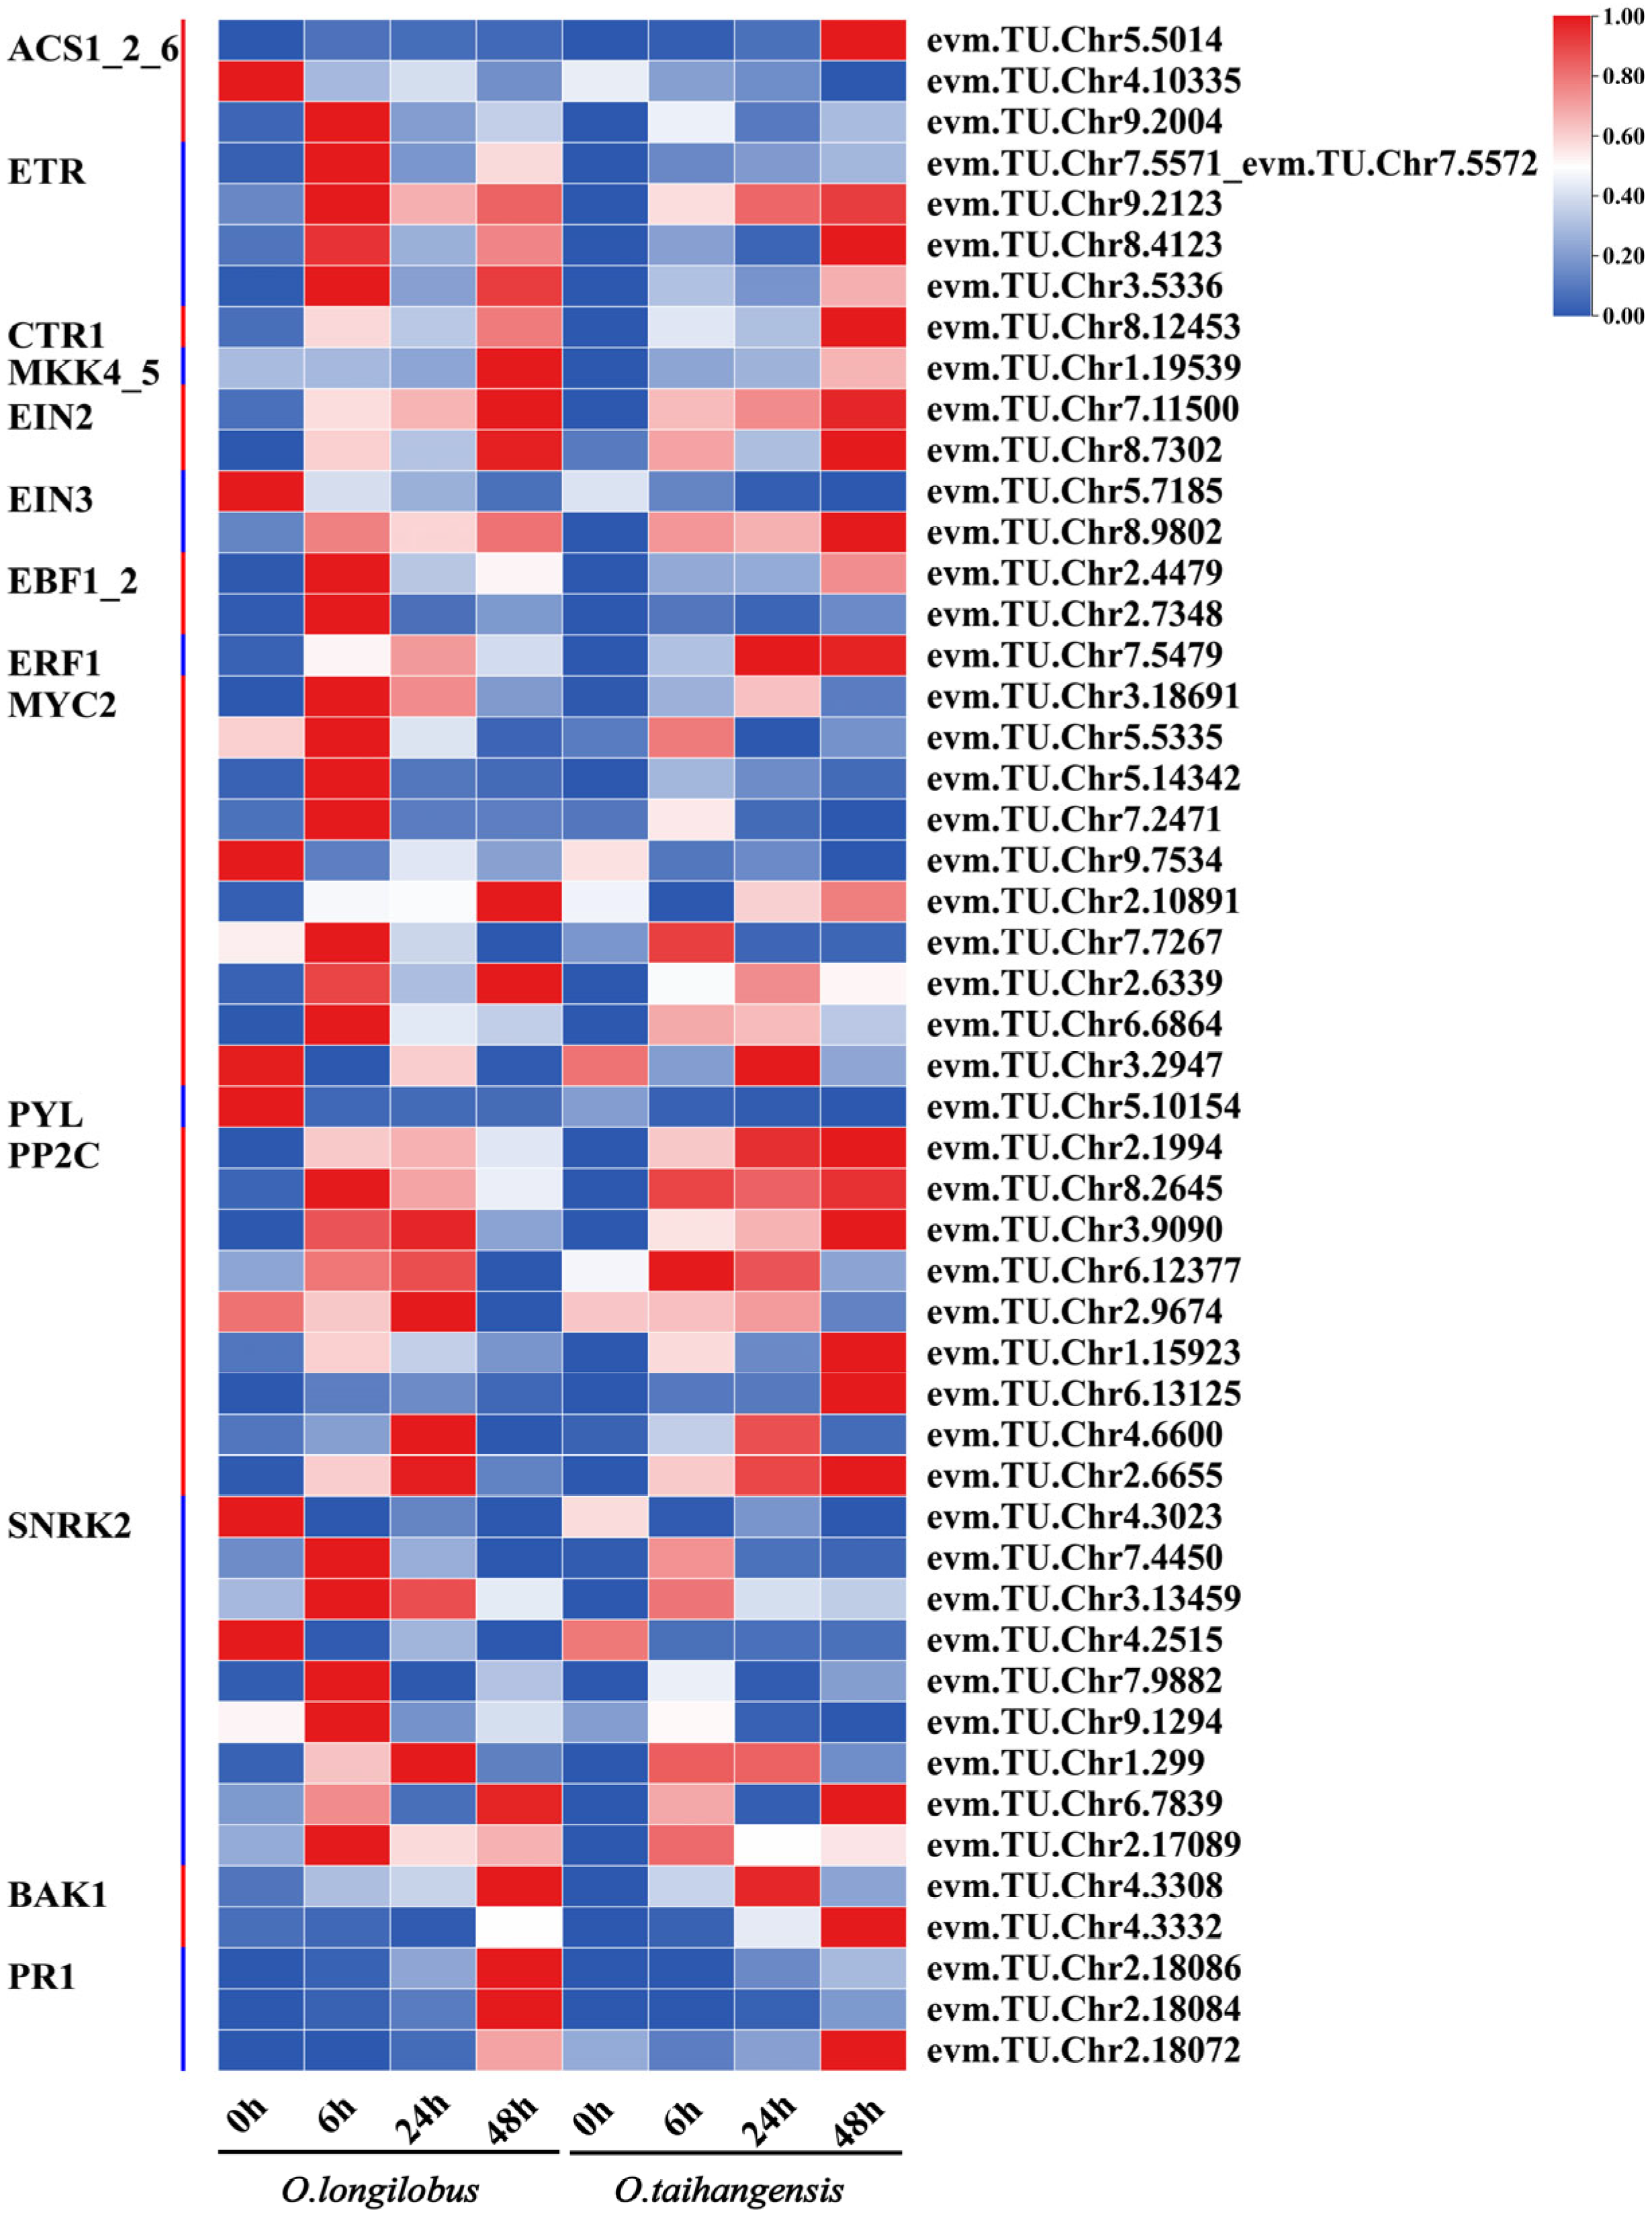
The MAPK signaling pathway in this study was also significantly enriched, and 50 C-DEGs were found, which were consistent with the above signaling pathways of ETH, ABA, JA, BR, and SA.
A total of 16 C-DEGs were identified in the ETH signaling pathway, including 3 ACS1-2-6s, 4 ETRs, 1 CTR1, 1 MKK4_5, 2 EIN2s, 2 EIN3s, 2 EBF1_2s, and 1 ERF1.
A total of 10 MYC2s were found in the JA signaling pathway. The expressions of CTR1, MKK4_5, and EIN2s were upregulated at 48 h in both in O. taihangensis and O. longilobus. ERF1 in O. taihangensis had a significantly higher expression level than that in O. longilobus at 24 and 48 h, respectively.
Nineteen C-DEGs were involved in the ABA signaling pathway, including one PYL, nine PP2Cs, and nine SNRK2s. Among them, PP2Cs were upregulated in O. taihangensis and O. longilobus at both 6 and 24 h. However, it was noteworthy that PP2Cs were continuously upregulated in O. taihangensis and downregulated in O. longilobus at 48 h.
Two BAK1s were found in the BR signaling pathway, while three PR1s were observed in the SA signaling pathway (Figure 5).

2.5. Interactive Network Analysis

A total of 65 protein–protein interaction (PPI) IDs were uploaded from the Sting online database. These proteins were primarily involved in the biosynthesis of plant hormones and signal transduction pathways (Figure 6). They revealed that 29 proteins formed an interactive network. Furthermore, the highest interactions of proteins included BRI1, AUX1, EIN2, BAK1, EIN3, ABA2, and GA3OX1, respectively.

2.6. qRT-PCR Quantitative Verification

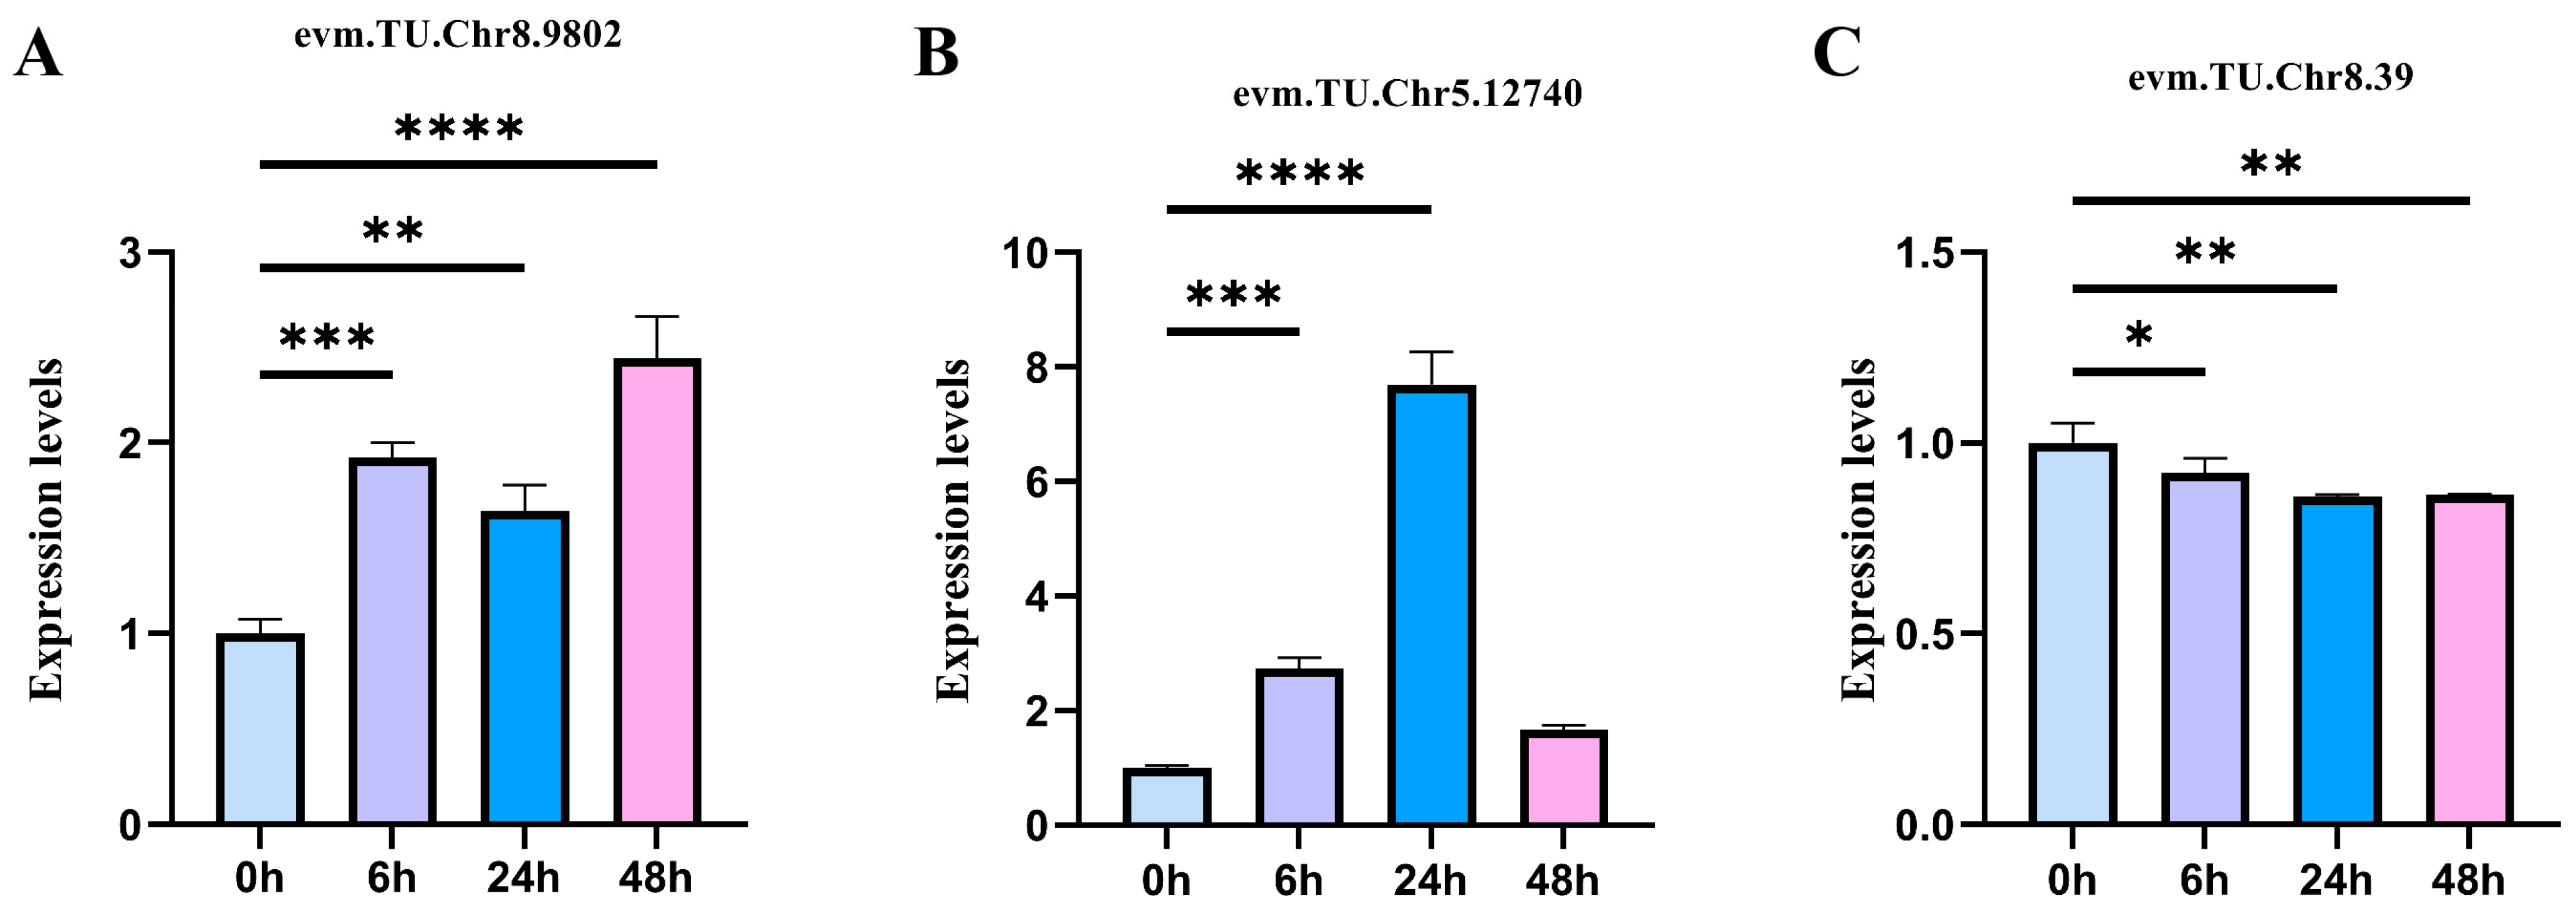
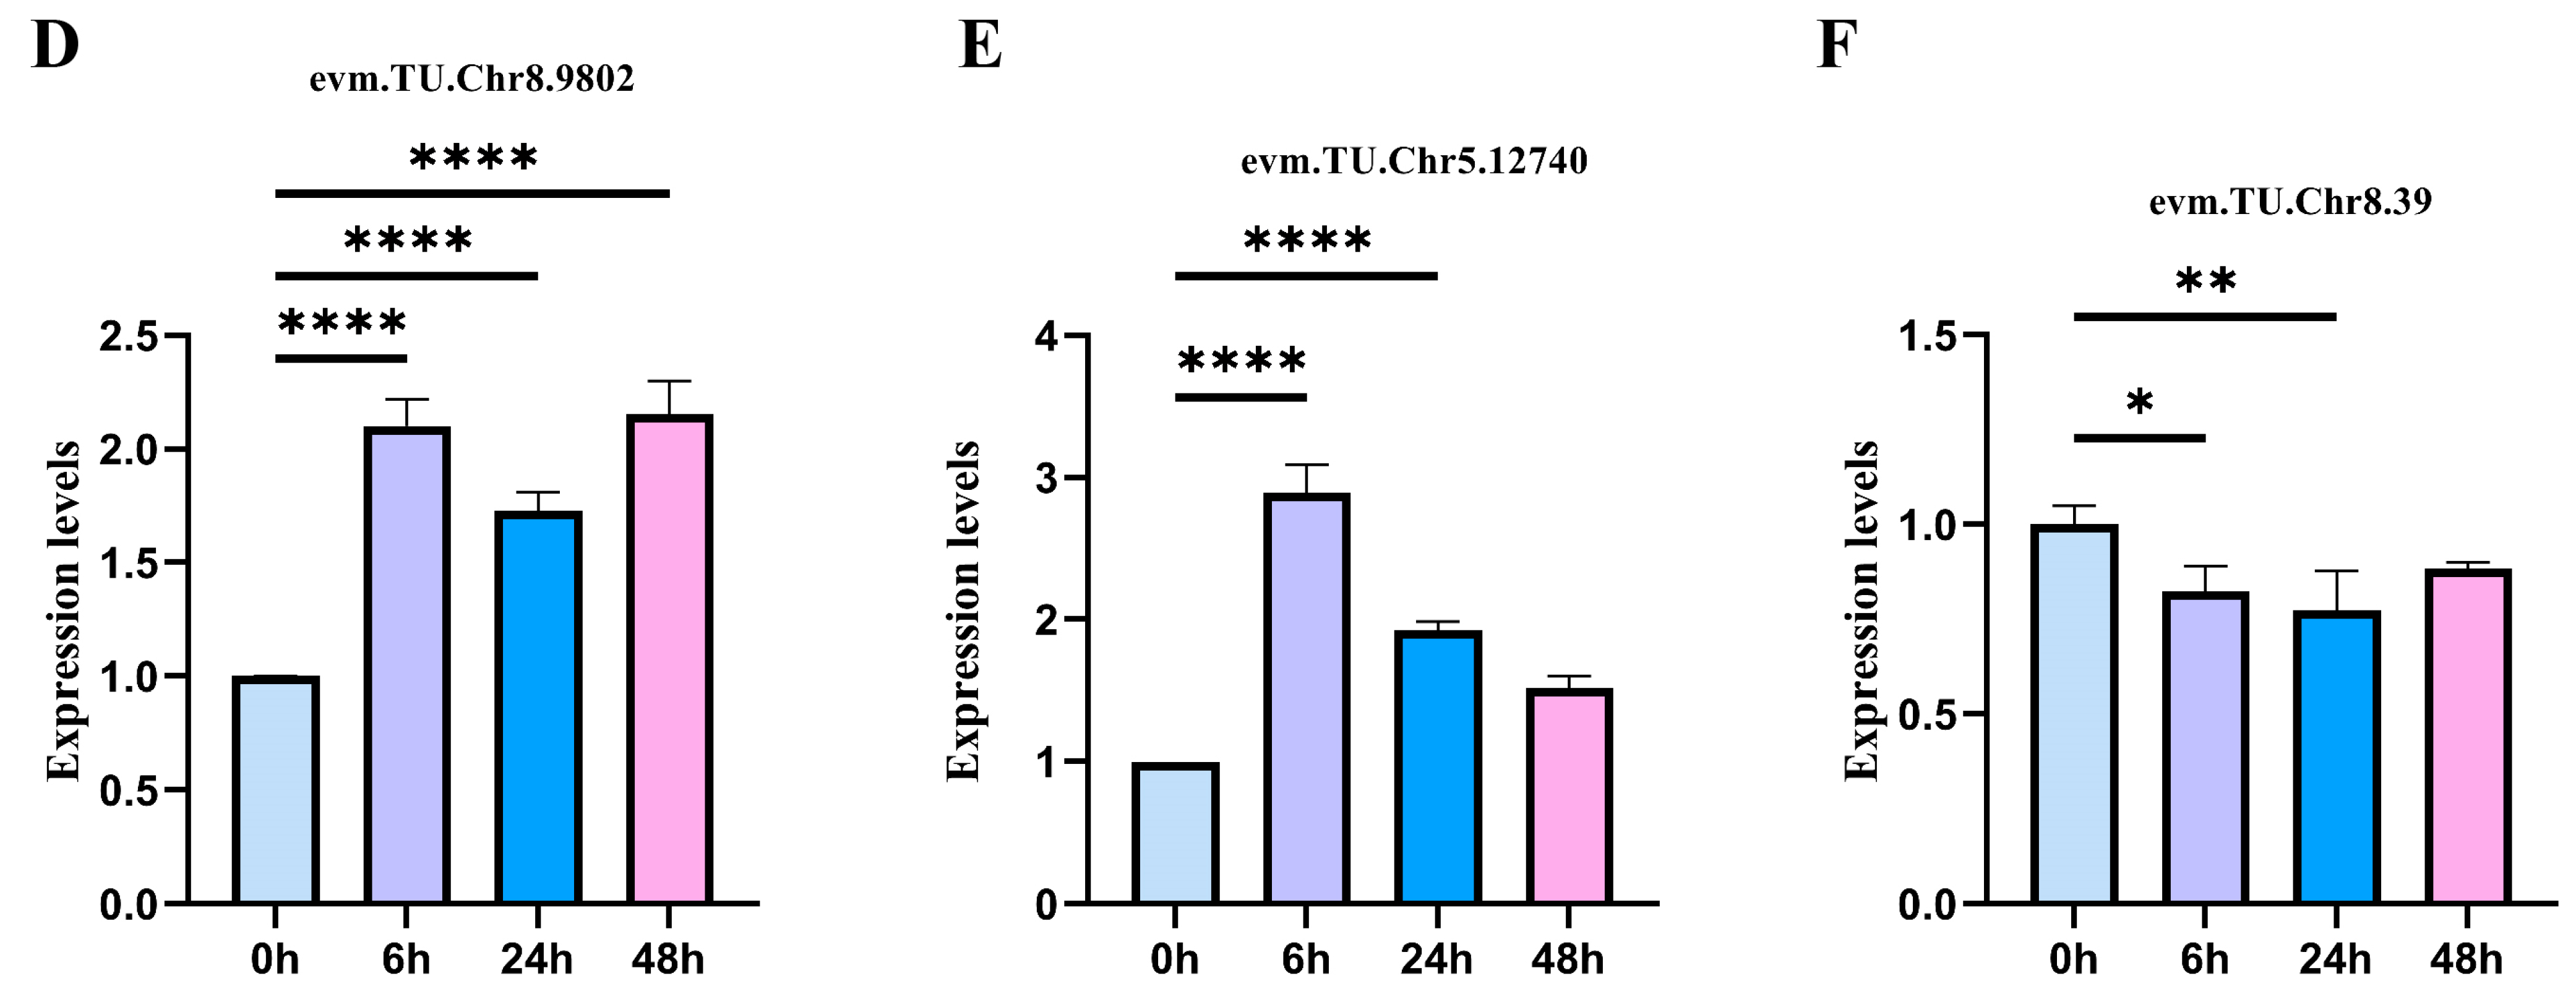
To verify the accuracy of the sequencing data, three C-DEGs were selected for expression verification by qRT-PCR. These genes were involved in the biosynthesis and signal transduction of AUX, ETH, and ABA. Based on the qRT-PCR, the relative expression levels of three C-DEGs revealed a consistent trend with the above results, which confirmed the accuracy of the sequencing data (Figure 7).

3. Discussion

Endogenous hormones can lead to rapid and sustained changes in gene regulation when plants respond to salt stress and play important roles in plant growth and development, as well as the mitigation of salt stress [5]. This study identified 239 C-DEG-related endogenous hormones that were significantly enriched in AUX, GA, JA, BR, EHT, ABA, and MAPK signal transduction pathways in O. taihangensis and O. longilobus under salt stress. A total of 29 proteins having the highest interactions were found in the PPI network and involved in these pathways, which implied crosstalk between the above hormones.
AUX regulates plant morphogenesis under salt stress, including vegetative growth and reproduction [7]. AUXIN1/LIKE-AUX1 (AUX1/LAX) family members are the major auxin influx carriers implicated in regulating key processes including root and lateral root development, root gravitropism, root hair development, vascular patterning, seed germination, apical hook formation, leaf morphogenesis, phyllotactic patterning, female gametophyte development, and embryo development [24]. Recently, AUX1 (Auxin transporter protein 1, encoded by AUX1 gene) was also implicated in the regulation of plant responses to abiotic stresses [25]. Our results showed that AUX1 possessed the highest PPI interactivity (Figure 6). Moreover, there was no difference in the AUX1 expression between the two species under salt stress (Figure 3B).
Furthermore, six SAURs of AUX from O. longilobus, and five SAURs from O. taihangensis were inhibited at all time points under the salt stress treatments (Figure 3B). Auxin, TIR1, and ABF combined to form a complex that led to the ubiquitination and degradation of AUX/IAA, inhibited the functions of auxin response factors (ARFs), and negatively affected the expression of downstream transcription factor small auxin-upregulated RNAs (SAUR) [26]. SAURs can regulate the division and expansion of plant cells related to plant morphogenesis. The overexpression of SAUR in A. thaliana can result in cell elongation [27], whereas in Benincasahispida it has been found to be associated with longer floral organs and wavy stems [28]. Thus, the inhibition of SAURs in O. taihangensis and O. longilobus might delay morphogenesis under salt stress, serving as a survival strategy for these two species.
GA3ox is encoded by GA3ox gene, which is a key enzyme in the final step of the GA biosynthesis pathway [29]. The reduced accumulation of GA can slow growth and increase the contents of soluble sugar and chlorophyll, which can enhance the salt tolerance of plants [30]. It was found that the expressions of GA biosynthesis genes were downregulated in O. taihangensis and O. longilobus (Figure 3C). This suggested that under salt stress the reduction of GA biosynthesis retarded the growth of O. taihangensis and O. longilobus.
DELLA is a negative regulator of the GA signal transduction pathway [29], and studies indicated that its accumulation could stimulate defenses against biotic and abiotic stressors, while repressing cell division and expansion in angiosperms [31]. The expression of DELLA was upregulated in both O. taihangensis and O. longilobus; however, its expression in O. taihangensis was significantly higher than that in O. longilobus at 48 h under salt stress (Figure 3C). The higher expression of GA negative regulatory factors in O. taihangensis indicated that this species might augment salt resistance by decelerating its growth.
In the JA biosynthesis pathway, the expression of both ACX and MFP2 were upregulated in O. taihangensis and O. longilobus. The increased JA biosynthesis in Arabidopsis and wheat improved their salt tolerance, while a reduction in JA production or accumulation translated to high salt sensitivity in tomatoes and rice [32,33]. JA-mediated growth inhibition may be an important adaptive strategy in saline environments.
Once JA is sensed by the COI1 receptor, it forms an SCFCOI1-E3 ligase complex with SKP1 and CULLIN1 [34]. This complex mediates the degradation of JAZ by the 26S proteasome and releases the inhibition of JA response genes (e.g., MYC), which then activates JA signaling [35]. JAZ proteins are the negative regulators of JA signaling, which play a critical role in the responses of plants to salt stress. Several JAZ homologous genes were observed to be upregulated under NaCl treatments in cotton, Arabidopsis roots, tomato, and wheat [35,36,37]. Moreover, the overexpression of OsJAZ9 in rice results in a higher tolerance to salt stress [38]. In this study, the expression of JAZ was upregulated at 6 h in O. taihangensis and O. longilobus (Figure 3D).
Generally, BR signaling initially begins with BRI1, which is a cell surface receptor kinase [39]. The extracellular BRI1 domain recognizes BRs that leads to heteromerization with BAK1, which is a member of the somatic embryogenesis receptor kinase (SERK) family of proteins. Subsequently, intracellular BRI1 and BAK1 kinase domains induce transphosphorylation, which triggers a downstream signaling cascade that eventually leads to the expression or suppression of downstream BRI1 and BAK1 gene overexpression, which are typically correlated with a tolerance for high salt stress [40]. Our results revealed that BAK1s were upregulated in O. taihangensis and O. longilobus after 48 h under the salt stress treatments. Four BRI1s from O. longilobus and one BRI1 from O. taihangens were also upregulated after 48 h. It was concluded that BR signal transduction may play a certain role in the salt tolerance of O. taihangensis and O. longilobus (Figure 3E).
ABA is defined as a stress hormone due to its rapid accumulation in response to stress, which can mediate multiple stress responses to assist with the survival of plants. ZEP is a key regulatory gene in the ABA biosynthesis pathway of plants [41]. Previous studies have indicated that ZEP overexpressing types in Arabidopsis thaliana exhibited more vigorous growth under high salt and drought treatments than wild types [42]. Simultaneously, one ZEP in O. taihangensis was significantly higher than that of O. longilobus at 48 h. In addition to ABF, it is considered to be a core factor involved in the ABA signaling pathway. ABFs/AREBs regulate stomatal closure and leaf senescence to response to abiotic stresses, such as salt, drought, heat and cold [43,44,45,46]. In this study, the expression of ABF was continuously upregulated in O. taihangensis at 6, 24, and 48 h, while it was upregulated only at 6 and 24 h in O. longilobus (Figure 4A). Additionally, ABFs play a certain role in O. taihangensis when faced to drought stress [23]. These results indicated that O. taihangensis and O. longilobus responded to abiotic stress via the accumulation of ABA. Further, O. taihangensis exhibited a higher salt tolerance than O. longilobus due to its capacity to accumulate additional ABA.
SNRK2 is encoded by the SNRK2 gene and plays essential roles in the abiotic stress responses of plants as a positive global regulator of abscisic acid signaling. The overexpression of SNRK2 in Arabidopsis thaliana maintained higher chlorophyll levels and longer root systems under salt stress, and its survival rate was significantly higher than that of the wild type [47]. In this study, most SNRK2 genes peaked at 6 h for both species (Figure 4A). This suggested that the reduction in ABA signal transduction under salt stress slowed the growth of O. taihangensis and O. longilobus.
The responses of ETH to salt stress varied significantly between various plants. For instance, ETH signal transduction was confirmed to promote salt tolerance in Arabidopsis; however, in rice the ETH signals negatively regulated salt tolerance. Several studies revealed that ETR mutants could enhance salt tolerance [48]. In this study, the expression of ETRs was upregulated at 48 h for O. taihangensis and O. longilobus (Figure 4B). The EIN2 nuclear protein, which has higher interactivities with other proteins (Figure 6), is a core component of the ETH signal transduction pathway in plants, which plays an important role in mediating crosslinks between hormone response pathways, such as ABA. EIN2 is required to induce developmental arrest during seed germination, seedling establishment, as well as subsequent vegetative growth, which then enables plants to survive and grow under adverse environmental conditions [49]. In O. taihangensis and O. longilobus, the expression of EIN2s was upregulated at 6, 24, and 48 h. Consequently, ETH signal transduction likely regulated salt tolerance in O. taihangensis and O. longilobus.
In PPI, ERF1 had fewer correlations with other genes; however, there was an interaction between EIN2 and ERF1 (Figure 6). ERF1 was the downstream gene of EIN2 in ETH signal transduction, which revealed significant differences in O. taihangensis and O. longilobus. Under salt stress the expression of ERF1 in O. taihangensis was significantly higher than that in O. longilobus at 24 and 48 h (Figure 4B). Many Arabidopsis ERFs can regulate genes under abiotic stresses. ERF1 and ESEs (ethylene-and salt-inducible ERF genes) in the ERF-IX group positively regulated plant salinity tolerance by promoting salt responsive gene expression [50]. Thus, it was inferred that higher ETH signal transduction in O. taihangensis conferred greater tolerance than in O. longilobus under long-term salt stress.
If MAPK signaling pathway is activated, it initiates the phosphorylation of downstream signaling targets and responds to diverse changes in the extracellular or intracellular environment. Subsequently the phosphorylated targets exert regulatory control over cellular, organ, or organismal metabolism [51]. Additionally, MAPK protein kinases exert influence over diverse intracellular responses and functions encompassing inflammation, cell-cycle regulation, differentiation, development, senescence, and death [52]. Based on our results, 50 C-DEGs were significantly enriched in the MAPK signaling pathway in O. taihangensis and O. longilobus under salt stress.
Recently, the crosstalk mechanisms between MAPK cascades and endogenous hormones, including AUX, ETH, ABA, JA, SA, and BR, were identified in plants, where the overexpression of ERFs (ETH signal transduction pathway) enhanced the resistance of salinity by activating the MAPK signaling cascade [50]. In this study, DEG-related ETH, ABA, SA, BR, and JA were identified in the MAPK signal pathway under salt stress. Further, the expression of ERF1 (ETH gene) in O. taihangensis was significantly higher than that in O. longilobus at 24 and 48 h. This implied that ETH-related genes enriched with MAPK signaling were engaged in resistance to salt stress (Figure 5).
In this work, comparative transcriptome analysis was performed on O. taihangensis and O. longilobus to explore the potential mechanisms behind their responses to salt stress. The results revealed that the two species responded to salt stress primarily through crosstalk between GA, JA biosynthesis, and signal transduction, ABA, ETH, AUX, and BR signal transduction pathways. Moreover, O. taihangensis exhibited a relatively higher salt tolerance than O. longilobus with the higher expression of some genes in the above pathways, such as ZEP, DELLA, ABF, and ERF1, which facilitated its good adaptation to the cliff environment of the Taihang Mountains (Figure 8).

4. Materials and Methods

4.1. Plant Materials and Salt Treatments

The O. taihangensis and O. longilobus seeds were collected in 2021 from the common garden of Shanxi Normal University (111°30′ W, 36°06′ N), in Shanxi Province, China. Healthy seeds were selected and germinated in Petri dishes in the laboratory at room temperature. After germination, the seeds with consistent growth were selected and transplanted into a seedling tray with a sterilized substrate for culturing. Three weeks later, the seedlings with strong growth were again transplanted into plastic pots and continued to grow at room temperature.
After six weeks of culturing, the healthy and consistently growing seedlings were selected for the salt stress treatments. Subsequently, fresh leaves from the same parts of each sampled individual were collected after 0, 6, 24, and 48 h of treatment at 500 mM salt concentrations. Three individuals sustained with distilled water were used as the control group, and each treatment was repeated three times.
Following the treatments, a total of 24 samples were frozen in liquid nitrogen, and transferred to Lc-Bio Technologies (Hangzhou, China) Co., Ltd. for transcriptome sequencing.

4.2. DEGs Related to Endogenous Hormones

The DEGs related to the endogenous hormones were initially derived and identified via the transcriptome data. Subsequently, the DEGs related to the biosynthesis and signal transduction pathways of AUX, CK, GA, ABA, ETH, BR, JA, and SA were screened from 0 h vs. 6 h. vs. 24 h vs. 48 h under the salt stress treatments. A Venn diagram was then employed to screen the common DEGs (C-DEGs) related to the endogenous hormones between O. taihangensis and O. longilobus.
Simultaneously, a STEM tool (Lianchuan Biological Cloud Platform, https://www.omicstudio.cn/index, accessed on 26 June 2023) was used to analyze the expression trends of the identified C-DEGs.

4.3. Enrichment Analysis

The Kyoto Encyclopedia of Genes and Genomes (KEGG) enrichment analyses of identified DEGs related to the endogenous hormones were performed using the TB-tools. The hypergeometric distribution principle was adopted in the enrichment analysis, and the identified DEG sets were employed through the analysis of significant expression differences. Subsequently, these DEGs were annotated to the KEGG database (https://www.genome.jp/kegg/pathway.html (accessed on 1 July 2023). The background genes were established; these consisted of all genes subjected to the significant difference analysis and annotated to the KEGG database. A KEGG enrichment map was then generated using the Lianchuan Biological Cloud Platform. The enriched pathways were classified and annotated, and those that were significantly enriched were selected for further analysis.

4.4. C-DEGs Analysis

Initially, the expression trends of the C-DEGs were identified by annotating to the endogenous hormone signaling pathway. The Fragments Per Kilo Base Per Million Mapped Reads (FPKM) values of the C-DEGs within the signaling pathways of AUX, CK, GA, ABA, ETH, BR, JA, and SA were evaluated to discern their expression patterns. Additionally, the C-DEGs linked to the hormone biosynthesis process were scrutinized. Since the MAPK signaling pathway had the capacity to modulate plant tolerance to salt stress by crossing other signaling pathways, the DEGs were also annotated in accordance with the MAPK signaling pathway.

4.5. PPI Network of DEGs

The network analysis of PPIs was performed to uncover plausible interactions between proteins with candidate genes involved in the endogenous hormone biosynthesis and signal transduction of AUX, CK, GA, ABA, ETH, BR, JA, and SA. The PPIs were analyzed using String (https://cn.string-db.org/) (accessed on 10 July 2023), Arabidopsis thaliana was used as the reference data, and the network was visualized using Cytoscape (3.9.0).

4.6. Quantitative Real-Time PCR (qRT-PCR)

To verify the credibility of the DEG trends in each signaling pathway, three C-DEGs genes (evm. TU. Chr8.9802, evm. TU. Chr5.12740, and evm. TU. Chr8.39) were randomly selected for quantitative qRT-PCR analysis. During the qRT-PCR, three biological and three technical replicates were adopted for each gene.
Using the Prime Script™ RT Reagent Kit (Takara, Japan), the RNA of the samples was initially reversed to cDNA, after which the synthesized cDNA was used as a template for quantitative qRT-PCR.
The qRT-PCR was performed under the following conditions: 95 °C for 3 min, followed by 40 cycles of 95 °C for 5 s, and at 60 °C for 20 s. For the PCR, actin (evm. TU. Chr8.13443) was selected as the internal control gene. Finally, the expression levels of the selected genes were calculated using the 2−ΔΔCt method.
The primers are presented in Table A2. Significant differences between the DEGs were elucidated using one-way analysis of variance (ANOVA). **** represents a significant difference of p < 0.0001; *** represents a significant difference of p < 0.001; ** represents a significant difference of p < 0.01; * represents a significant difference of p < 0.05. GraphPad Prism 9.5.1 and Microsoft Excel 2009 were used for data analyses.

Author Contributions

Conceptualization, G.S. and Y.W.; methodology, Y.Z. and Y.S. (Yuexin Shen); software, Y.S. (Yu Su) and X.F.; validation, Y.Z., Y.S. (Yuexin Shen) and M.H.; formal analysis, Y.Z. and Y.S. (Yuexin Shen); investigation, Y.S. (Yu Su), X.F., T.G., X.Z. and Q.W.; resources, G.S. and Y.W.; data curation, Y.Z., Y.S. (Yuexin Shen) and M.H.; writing—original draft preparation, Y.Z. and Y.S. (Yuexin Shen); writing—review and editing, G.S. and Y.W.; project administration, Y.W.; funding acquisition, Y.W. All authors have read and agreed to the published version of the manuscript.

Funding

This work was supported by the National Natural Science Foundation of China (31970358), the Research Project of Shanxi Scholarship Council (2020-090), Natural Science Foundation of Shanxi Province of China (20210302124501), the Innovation Project of Postgraduate Education of Shanxi Province (2022Y493) and the postgraduate innovation project of Shanxi Normal University (2022XSY001).

Data Availability Statement

Data are contained within the article.

Conflicts of Interest

The authors declare no conflicts of interest.

Appendix A

Table A1. Number and quality of RNA-seq reads produced in each sample.
SampleRaw DataValid DataValid Ratio (Reads)Q20%Q30%GC Content%
ReadBaseReadBase
L_0h_1371821865.58G363943485.46G97.8899.9897.5243
L_0h_2444148766.66G434977506.52G97.9499.9897.4543
L_0h_3442277786.63G433227126.50G97.9599.9897.2943
L_6h_1426273426.39G416627006.25G97.7499.9797.1742
L_6h_2464019506.96G454739266.82G9899.9797.0742
L_6h_3454388826.82G446396166.70G98.2499.9897.2142.5
L_24h_1431478006.47G421963886.33G97.7999.9797.142.5
L_24h_2440857746.61G431998646.48G97.9999.9797.2343
L_24h_3442950146.64G434891586.52G98.1899.9797.1743
L_48h_1344814285.17G339424305.09G98.4499.9796.8842
L_48h_2385973605.79G378963065.68G98.1899.9796.6542
L_48h_3476076627.14G467919907.02G98.2999.9796.8642
T_0h_1437423046.56G424791146.37G97.1199.9797.1843
T_0h_2375775385.64G369458865.54G98.3299.9897.5244
T_0h_3438423346.58G430693726.46G98.2499.9897.3744
T_6h_1444506606.67G432726806.49G97.3599.9797.0743
T_6h_2441656986.62G430408666.46G97.4599.9897.3443
T_6h_3437335786.56G425598046.38G97.3299.9797.2243
T_24h_1442395286.64G433049486.50G97.8999.9897.1945
T_24h_2478370727.18G463706986.96G96.9399.9797.1942
T_24h_3437051986.56G427823366.42G97.8999.9897.1442
T_48h_1441051066.62G435643986.53G98.7799.9796.5742
T_48h_2441987046.63G436652646.55G98.7999.9796.7142
T_48h_3432000346.48G426777006.40G98.7999.9796.6342
Note: T represents O. taihangensis, L represents O. longilobus.
Table A2. Primers for qRT-PCR validation.
Gene IDPrimers (5′ to 3′)
evm. TU. Chr8.9802F: GATGACCAGCAGCCACCAA
R: TGTTCCGCCACGATTGACTT
evm. TU. Chr5.12740F: GACGCTCGGACCACAAGATAT
R: GAGGACAGTATAGCCACCATCA
evm. TU. Chr8.39F: AGGTTGCCAGTTGTGATTCCA
R: GGCTTCTCCGCAGCATTCT
evm. TU. Chr8.13443 (Actin)F: CCTACAACGCCACACTCTCA
R: ACAGCAAGTTACACCACTCATG

References

  1. Yang, Y.; Guo, Y. Unraveling salt stress signaling in plants. J. Integr. Plant Biol. 2018, 60, 796–804. [Google Scholar] [CrossRef]
  2. Shahid, S.A.; Zaman, M.; Heng, L. Soil Salinity: Historical Perspectives and a World Overview of the Problem. In Guideline for Salinity Assessment, Mitigation and Adaptation Using Nuclear and Related Techniques; Springer: Cham, Switzerland, 2018; pp. 43–53. [Google Scholar]
  3. Shabala, S.; Bose, J.; Hedrich, R. Salt bladders: Do they matter? Trends Plant Sci. 2014, 19, 687–691. [Google Scholar] [CrossRef]
  4. Numan, M.; Bashir, S.; Khan, Y.; Mumtaz, R.; Shinwari, Z.K.; Khan, A.L.; Khan, A.; AL-Harrasi, A. Plant growth promoting bacteria as an alternative strategy for salt tolerance in plants: A review. Microbiol. Res. 2018, 209, 21–32. [Google Scholar] [CrossRef]
  5. Yu, Z.; Duan, X.; Luo, L.; Dai, S.; Ding, Z.; Xia, G. How Plant Hormones Mediate Salt Stress Responses. Trends Plant Sci. 2020, 25, 1117–1130. [Google Scholar] [CrossRef]
  6. Verma, V.; Ravindran, P.; Kumar, P.P. Plant hormone-mediated regulation of stress responses. BMC Plant Biol. 2016, 16, 86. [Google Scholar] [CrossRef] [PubMed]
  7. Ribba, T.; Garrido-Vargas, F.; O’Brien, J.A. Auxin-mediated responses under salt stress: From developmental regulation to biotechnological applications. J. Exp. Bot. 2020, 71, 3843–3853. [Google Scholar] [CrossRef] [PubMed]
  8. Iglesias, M.J.; Terrile, M.C.; Bartoli, C.G.; D’Ippólito, S.; Casalongué, C.A. Auxin signaling participates in the adaptative response against oxidative stress and salinity by interacting with redox metabolism in Arabidopsis. Plant Mol. Biol. 2010, 74, 215–222. [Google Scholar] [CrossRef] [PubMed]
  9. Iglesias, M.J.; Terrile, M.C.; Windels, D.; Lombardo, M.C.; Bartoli, C.G.; Vazquez, F.; Estelle, M.; Casalongué, C.A. MiR393 regulation of auxin signaling and redox-related components during acclimation to salinity in Arabidopsis. PLoS ONE 2014, 9, e107678. [Google Scholar] [CrossRef] [PubMed]
  10. Colebrook, E.H.; Thomas, S.G.; Phillips, A.L.; Hedden, P. The role of gibberellin signalling in plant responses to abiotic stress. J. Exp. Biol. 2014, 217, 67–75. [Google Scholar] [CrossRef] [PubMed]
  11. Davière, J.M.; Achard, P. Gibberellin signaling in plants. Development 2013, 140, 1147–1151. [Google Scholar] [CrossRef] [PubMed]
  12. Yuan, K.; Rashotte, A.M.; Wysocka-Diller, J.W. ABA and GA signaling pathways interact and regulate seed germination and seedling development under salt stress. Acta Physiol. Plant. 2011, 33, 261–271. [Google Scholar] [CrossRef]
  13. Bao, S.; Hua, C.; Shen, L.; Yu, H. New insights into gibberellin signaling in regulating flowering in Arabidopsis. J. Integr. Plant Biol. 2020, 62, 118–131. [Google Scholar] [CrossRef]
  14. Wang, J.; Qin, H.; Zhou, S.; Wei, P.; Zhang, H.; Zhou, Y.; Miao, Y.; Huang, R. The Ubiquitin-Binding Protein OsDSK2a Mediates Seedling Growth and Salt Responses by Regulating Gibberellin Metabolism in Rice. Plant Cell 2020, 32, 414–428. [Google Scholar] [CrossRef]
  15. Chen, K.; Li, G.J.; Bressan, R.A.; Song, C.P.; Zhu, J.K.; Zhao, Y. Abscisic acid dynamics, signaling, and functions in plants. J. Integr. Plant Biol. 2020, 62, 25–54. [Google Scholar] [CrossRef] [PubMed]
  16. Edel, K.H.; Kudla, J. Integration of calcium and ABA signaling. Curr. Opin. Plant Biol. 2016, 33, 83–91. [Google Scholar] [CrossRef] [PubMed]
  17. Zhao, Y.; Chan, Z.; Gao, J.; Xing, L.; Cao, M.; Yu, C.; Hu, Y.; You, J.; Shi, H.; Zhu, Y. ABA receptor PYL9 promotes drought resistance and leaf senescence. Proc. Natl. Acad. Sci. USA 2016, 113, 1949–1954. [Google Scholar] [CrossRef] [PubMed]
  18. Cai, S.; Chen, G.; Wang, Y.; Huang, Y.; Marchant, D.B.; Wang, Y.; Yang, Q.; Dai, F.; Hills, A.; Blatt, M.R. Evolutionary Conservation of ABA Signaling for Stomatal Closure. Plant Physiol. 2017, 174, 732–747. [Google Scholar] [CrossRef]
  19. Chen, H.; Bullock, D.A., Jr.; Alonso, J.M.; Stepanova, A.N. To Fight or to Grow: The Balancing Role of Ethylene in Plant Abiotic Stress Responses. Plants 2022, 11, 33. [Google Scholar] [CrossRef] [PubMed]
  20. Zhu, Y.; Wang, Q.; Gao, Z.; Wang, Y.; Liu, Y.; Ma, Z.; Chen, Y.; Zhang, Y.; Yan, F.; Li, J. Analysis of Phytohormone Signal Transduction in Sophora alopecuroides under Salt Stress. Int. J. Mol. Sci. 2021, 22, 7313. [Google Scholar] [CrossRef] [PubMed]
  21. Han, M.; Niu, M.; Gao, T.; Shen, Y.; Zhou, X.; Zhang, Y.; Liu, L.; Chai, M.; Sun, G.; Wang, Y. Responsive Alternative Splicing Events of Opisthopappus Species against Salt Stress. Int. J. Mol. Sci. 2024, 25, 1227. [Google Scholar] [CrossRef]
  22. Chen, N.; Zhang, H.; Zang, E.; Liu, Z.; Lan, Y.; Hao, W.; He, S.; Fan, X.; Sun, G.; Wang, Y. Adaptation insights from comparative transcriptome analysis of two Opisthopappus species in the Taihang mountains. BMC Genom. 2022, 23, 466. [Google Scholar] [CrossRef]
  23. Yang, Y.; Guo, Y.; Zhong, J.; Zhang, T.; Li, D.; Ba, T.; Xu, T.; Chang, L.; Zhang, Q.; Sun, M. Root Physiological Traits and Transcriptome Analyses Reveal that Root Zone Water Retention Confers Drought Tolerance to Opisthopappus taihangensis. Sci. Rep. 2020, 10, 2627. [Google Scholar] [CrossRef]
  24. Swarup, R.; Bhosale, R. Developmental Roles of AUX1/LAX Auxin Influx Carriers in Plants. Front. Plant Sci. 2019, 10, 1306. [Google Scholar] [CrossRef] [PubMed]
  25. Strader, L.C.; Zhao, Y. Auxin perception and downstream events. Curr. Opin. Plant Biol. 2016, 33, 8–14. [Google Scholar] [CrossRef] [PubMed]
  26. Ren, H.; Gray, W.M. SAUR proteins as effectors of hormonal and environmental signals in plant growth. Mol. Plant 2015, 8, 1153–1164. [Google Scholar] [CrossRef] [PubMed]
  27. Stortenbeker, N.; Bemer, M. The SAUR gene family: The plant’s toolbox for adaptation of growth and development. J. Exp. Bot. 2018, 70, 17–27. [Google Scholar] [CrossRef]
  28. Luo, C.; Yan, J.; He, C.; Liu, W.; Xie, D.; Jiang, B. Genome-Wide Identification of the SAUR Gene Family in Wax Gourd (Benincasa hispida) and Functional Characterization of BhSAUR60 during Fruit Development. Int. J. Mol. Sci. 2022, 23, 14021. [Google Scholar] [CrossRef] [PubMed]
  29. Murase, K.; Hirano, Y.; Sun, T.P.; Hakoshima, T. Gibberellin-induced DELLA recognition by the gibberellin receptor GID1. Nature 2008, 456, 459–463. [Google Scholar] [CrossRef] [PubMed]
  30. Zhou, J.; Li, Z.; Xiao, G.; Zhai, M.; Pan, X.; Huang, R.; Zhang, H. CYP71D8L is a key regulator involved in growth and stress responses by mediating gibberellin homeostasis in rice. J. Exp. Bot. 2020, 71, 1160–1170. [Google Scholar] [PubMed]
  31. Hernández-García, J.; Sun, R.; Serrano-Mislata, A.; Inoue, K.; Vargas-Chávez, C.; Esteve-Bruna, D.; Arbona, V.; Yamaoka, S.; Nishihama, R.; Kohchi, T.; et al. Coordination between growth and stress responses by DELLA in the liverwort Marchantia polymorpha. Curr. Biol. 2021, 31, 3678–3686.e11. [Google Scholar] [CrossRef]
  32. Zhao, Y.; Dong, W.; Zhang, N.; Ai, X.; Wang, M.; Huang, Z.; Xiao, L.; Xia, G. A wheat allene oxide cyclase gene enhances salinity tolerance via jasmonate signaling. Plant Physiol. 2014, 164, 1068–1076. [Google Scholar] [CrossRef]
  33. Garcia-Abellan, J.O.; Fernandez-Garcia, N.; Lopez-Berenguer, C.; Egea, I.; Flores, F.B.; Angosto, T.; Capel, J.; Lozano, R.; Pineda, B.; Moreno, V.; et al. The tomato res mutant which accumulates JA in roots in non-stressed conditions restores cell structure alterations under salinity. Physiol. Plant. 2015, 155, 296–314. [Google Scholar] [CrossRef]
  34. Wasternack, C.; Song, S. Jasmonates: Biosynthesis, metabolism, and signaling by proteins activating and repressing transcription. J. Exp. Bot. 2017, 68, 1303–1321. [Google Scholar] [CrossRef]
  35. Valenzuela, C.E.; Acevedo-Acevedo, O.; Miranda, G.S.; Vergara-Barros, P.; Holuigue, L.; Figueroa, C.R.; Figueroa, P.M. Salt stress response triggers activation of the jasmonate signaling pathway leading to inhibition of cell elongation in Arabidopsis primary root. J. Exp. Bot. 2016, 67, 4209–4220. [Google Scholar] [CrossRef]
  36. Yao, D.; Zhang, X.; Zhao, X.; Liu, C.; Wang, C.; Zhang, Z.; Zhang, C.; Wei, Q.; Wang, Q.; Yan, H. Transcriptome analysis reveals salt-stress-regulated biological processes and key pathways in roots of cotton (Gossypium hirsutum L.). Genomics 2011, 98, 47–55. [Google Scholar] [CrossRef]
  37. Chini, A.; Ben-Romdhane, W.; Hassairi, A.; Aboul-Soud, M.A. Identification of TIFY/JAZ family genes in Solanum lycopersicum and their regulation in response to abiotic stresses. PLoS ONE 2017, 12, e0177381. [Google Scholar] [CrossRef]
  38. Ebel, C.; BenFeki, A.; Hanin, M.; Solano, R.; Chini, A. Characterization of wheat (Triticum aestivum) TIFY family and role of Triticum Durum Td TIFY11a in salt stress tolerance. PLoS ONE 2018, 13, e0200566. [Google Scholar] [CrossRef] [PubMed]
  39. Mao, J.; Li, J. Regulation of Three Key Kinases of Brassinosteroid Signaling Pathway. Int. J. Mol. Sci. 2020, 21, 4340. [Google Scholar] [CrossRef] [PubMed]
  40. Nam, K.H.; Li, J. BRI1/BAK1, a receptor kinase pair mediating brassinosteroid signaling. Cell 2002, 110, 203–212. [Google Scholar] [CrossRef] [PubMed]
  41. Xiong, L.; Zhu, J.K. Regulation of abscisic acid biosynthesis. Plant Physiol. 2003, 133, 29–36. [Google Scholar] [CrossRef] [PubMed]
  42. Park, H.Y.; Seok, H.Y.; Park, B.K.; Kim, S.H.; Goh, C.H.; Lee, B.H.; Lee, C.H.; Moon, Y.H. Overexpression of Arabidopsis ZEP enhances tolerance to osmotic stress. Biophy. Res. 2008, 375, 80–85. [Google Scholar] [CrossRef] [PubMed]
  43. Choi, H.I.; Hong, J.H.; Ha, J.O.; Kang, J.Y.; Kim, S.Y. ABFs, a family of ABA-responsive element binding factors. J. Biol. Chem. 2000, 275, 1723–1730. [Google Scholar] [CrossRef]
  44. Fujita, Y.; Fujita, M.; Satoh, R.; Maruyama, K.; Parvez, M.M.; Seki, M.; Hiratsu, K.; Ohme-Takagi, M.; Shinozaki, K.; Yamaguchi-Shinozaki, K. AREB1 is a transcription activator of novel ABRE-dependent ABA signaling that enhances drought stress tolerance in Arabidopsis. Plant Cell 2005, 17, 3470–3488. [Google Scholar] [CrossRef] [PubMed]
  45. Abdeen, A.; Schnell, J.; Miki, B. Transcriptome analysis reveals absence of unintended effects in drought-tolerant transgenic plants overexpressing the transcription factor ABF3. BMC Genom. 2010, 11, 69. [Google Scholar] [CrossRef] [PubMed]
  46. Sharma, P.D.; Singh, N.; Ahuja, P.S.; Reddy, T.V. Abscisic acid response element binding factor 1 is required for establishment of Arabidopsis seedlings during winter. Mol. Biol. Rep. 2011, 38, 5147–5159. [Google Scholar] [CrossRef]
  47. Song, X.; Yu, X.; Hori, C.; Demura, T.; Ohtani, M.; Zhuge, Q. Heterologous Overexpression of Poplar SnRK2 Genes Enhanced Salt Stress Tolerance in Arabidopsis thaliana. Front. Plant Sci. 2016, 7, 612. [Google Scholar] [CrossRef]
  48. Cebrián, G.; Iglesias-Moya, J.; García, A.; Martínez, J.; Romero, J.; Regalado, J.J.; Martínez, C.; Valenzuela, J.L.; Jamilena, M. Involvement of ethylene receptors in the salt tolerance response of Cucurbita pepo. Hortic. Res. 2021, 8, 73. [Google Scholar] [CrossRef]
  49. Feng, G.; Liu, G.; Xiao, J. The Arabidopsis EIN2 restricts organ growth by retarding cell expansion. Plant Signal. Behav. 2015, 10, 5. [Google Scholar] [CrossRef]
  50. Xie, Z.; Nolan, T.M.; Jiang, H.; Yin, Y. AP2/ERF Transcription Factor Regulatory Networks in Hormone and Abiotic Stress Responses in Arabidopsis. Front. Plant Sci. 2019, 10, 228. [Google Scholar] [CrossRef]
  51. Gehart, H.; Kumpf, S.; Ittner, A.; Ricci, R. MAPK signalling in cellular metabolism: Stress or wellness. EMBO Rep. 2010, 11, 834–840. [Google Scholar] [CrossRef]
  52. Coulthard, L.R.; White, D.E.; Jones, D.L.; McDermott, M.F.; Burchill, S.A. p38MAPK: Stress responses from molecular mechanisms to therapeutics. Trends Mol. Med. 2009, 15, 369–379. [Google Scholar] [CrossRef] [PubMed]
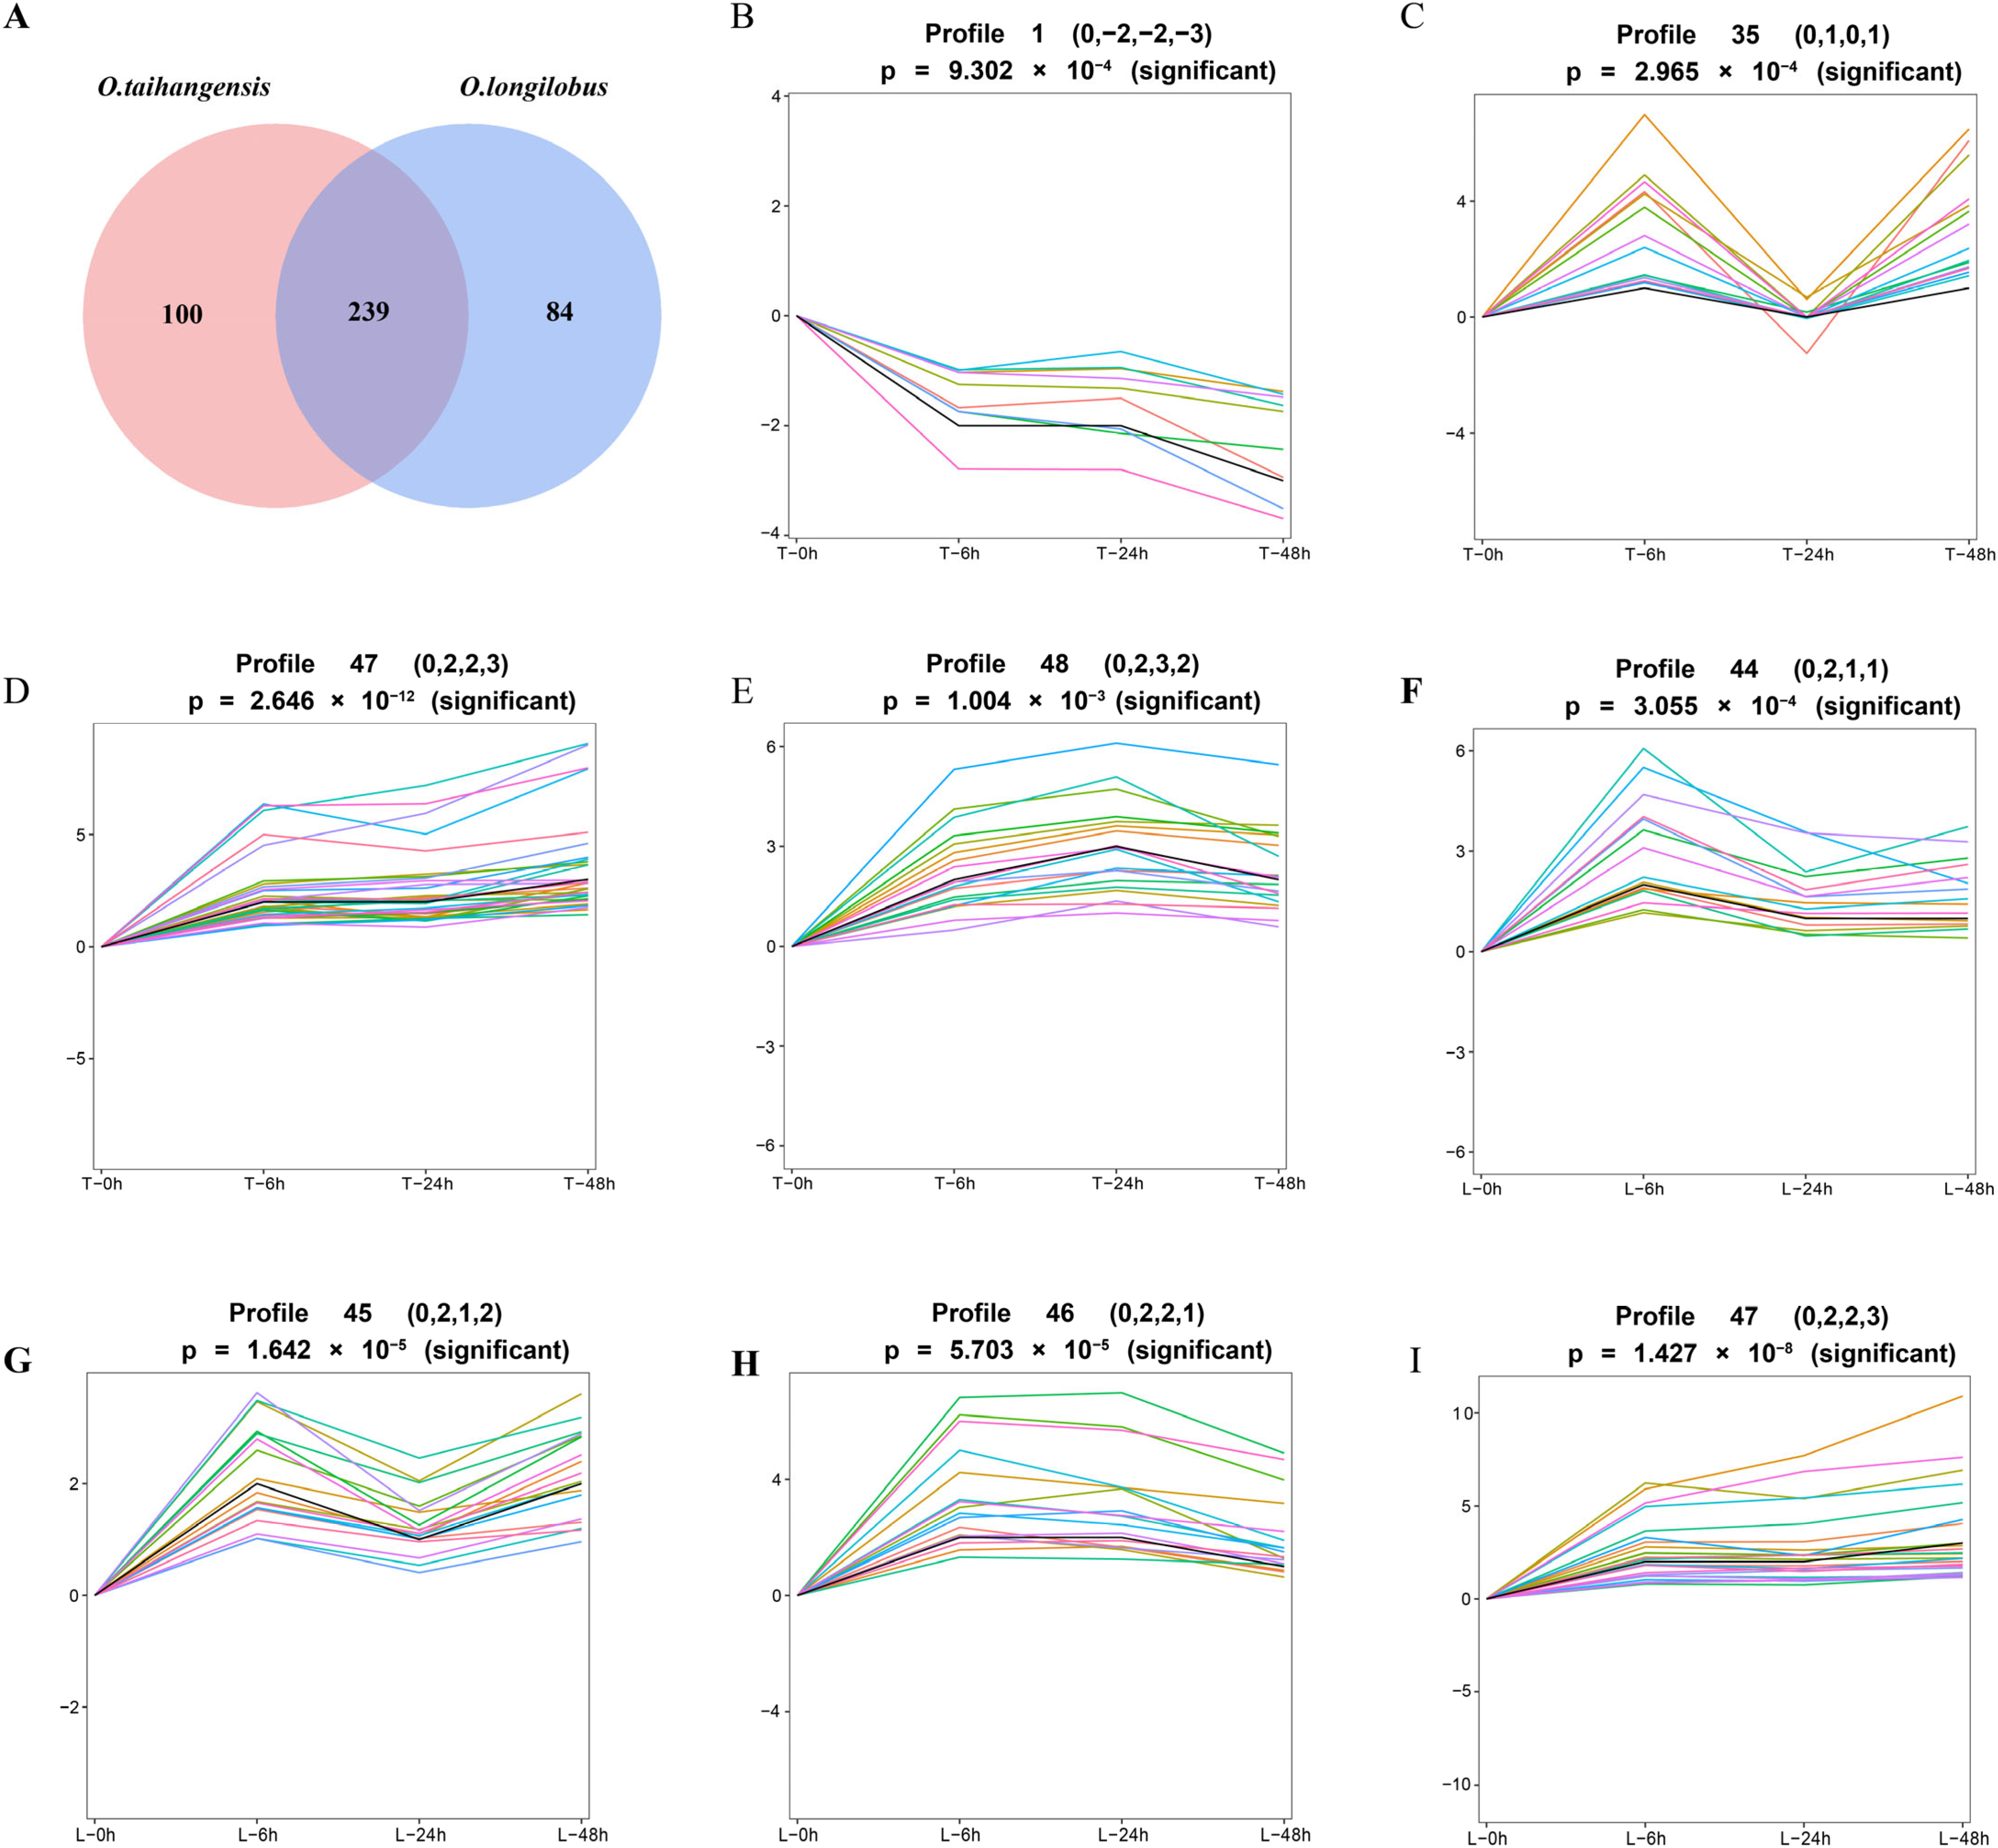
Figure 1. DEGs of Opisthopappus taihangensis (O. taihangensis) and Opisthopappus longilobus (O. longilobus) at different times under salt treatments. (A) Venn diagram of DEGs of O. taihangensis and O. longilobus for 0 h vs. 6 h. vs. 24 h vs. 48 h; (BE) expression trend of 239 C-DEGs related to endogenous hormones in O. taihangensis; (FI) expression trend analysis of 239 C-DEGs related to endogenous hormones in O. longilobus. Note: Horizontal axis represents the salt treatment time (0, 6, 24, and 48 h). T represents O. taihangensis, L represents O. longilobus.
Plants 13 00557 g001
Figure 2. KEGG of DEGs (A) in O. taihangensis; (B) in O. longilobus.
Plants 13 00557 g002
Figure 3. Different gene expression profiles of auxin, gibberellin, jasmonic acid, and brassinolide. (A) Venn diagram of DEGs of plant hormone signal transduction of O. taihangensis and O. longilobus in 0 h vs. 6 h. vs. 24 h vs. 48 h; (B) auxin; (C) gibberellin; (D) jasmonic acid; (E) brassinolide. Note: the red-blue schemes labelled on the right side of the heat map, and red to blue represent the expression levels from high to low.
Plants 13 00557 g003aPlants 13 00557 g003b
Figure 4. Differential gene expression profiles of abscisic acid, ethylene, cytokinin, and salicylic acid. (A) abscisic acid; (B) ethylene; (C) cytokinin; (D) salicylic acid. Note: the red-blue schemes are labelled on the right side of heat map, and red to blue represent the expression levels from high to low.
Plants 13 00557 g004
Figure 5. Heat maps of DEGs in the MAPK signaling pathway of O. taihangensis and O. longilobus. Note: Red-blue schemes are labelled on the right side of the heat map, and red to blue represents the expression levels from high to low.
Plants 13 00557 g005
Figure 6. Protein–protein interaction (PPI) network in biosynthesis of plant hormones and signal transduction pathways. Red nodes represent the top seven highest interactions.
Plants 13 00557 g006
Figure 7. qRT-PCR verification of differentially expressed genes (DEGs). Relative gene expression levels under a 500 mM salt concentration for different time treatments (0, 6, 24, and 48 h). Vertical bars indicate the mean ± SD calculated from three replicates. Statistical comparisons (one-way analysis of variance (ANOVA) are presented for each variable (**** p < 0.0001 *** p < 0.001 ** p < 0.01 * p < 0.05). (AC) O. taihangensis, (DF) O. longilobus.
Plants 13 00557 g007aPlants 13 00557 g007b
Figure 8. Summary of the responsive patterns of DEGs endogenous hormones between O. taihangensis and O. longilobus under salt stress.
Plants 13 00557 g008
Disclaimer/Publisher’s Note: The statements, opinions and data contained in all publications are solely those of the individual author(s) and contributor(s) and not of MDPI and/or the editor(s). MDPI and/or the editor(s) disclaim responsibility for any injury to people or property resulting from any ideas, methods, instructions or products referred to in the content.