
Interaction of Biochar Addition and Nitrogen Fertilizers on Wheat Production and Nutrient Status in Soil Profiles


Abstract
:1. Introduction
2. Results
2.1. Soil Properties
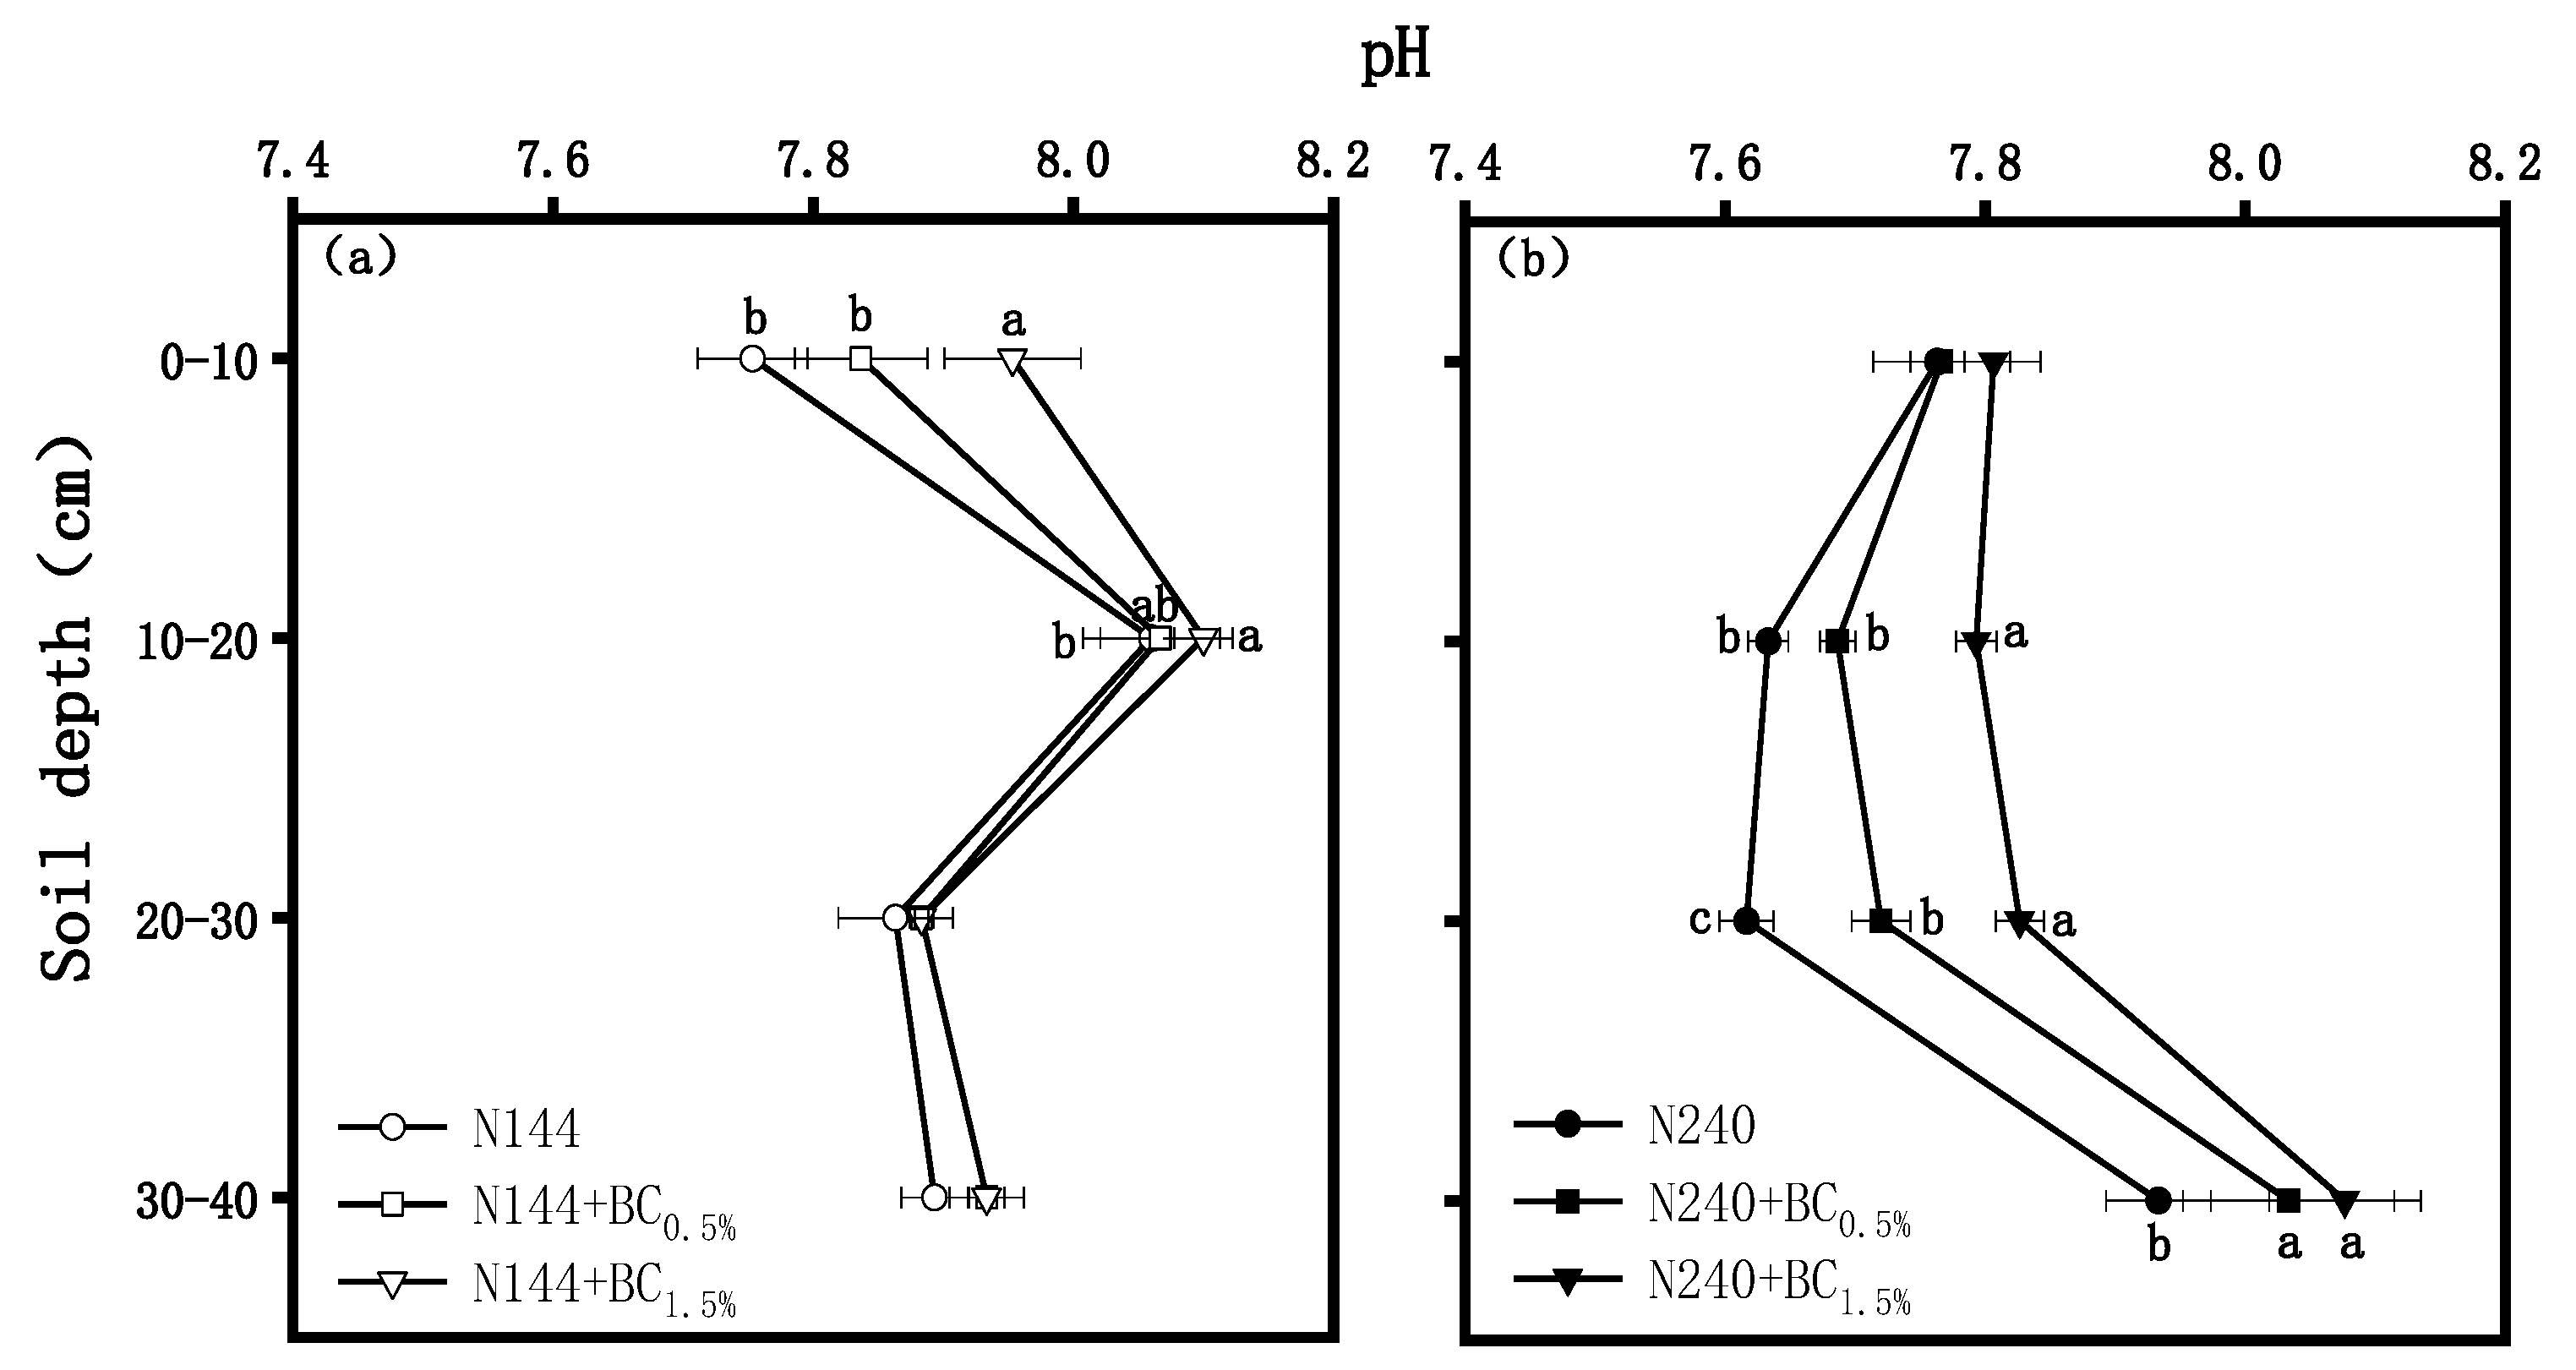
2.1.1. pH
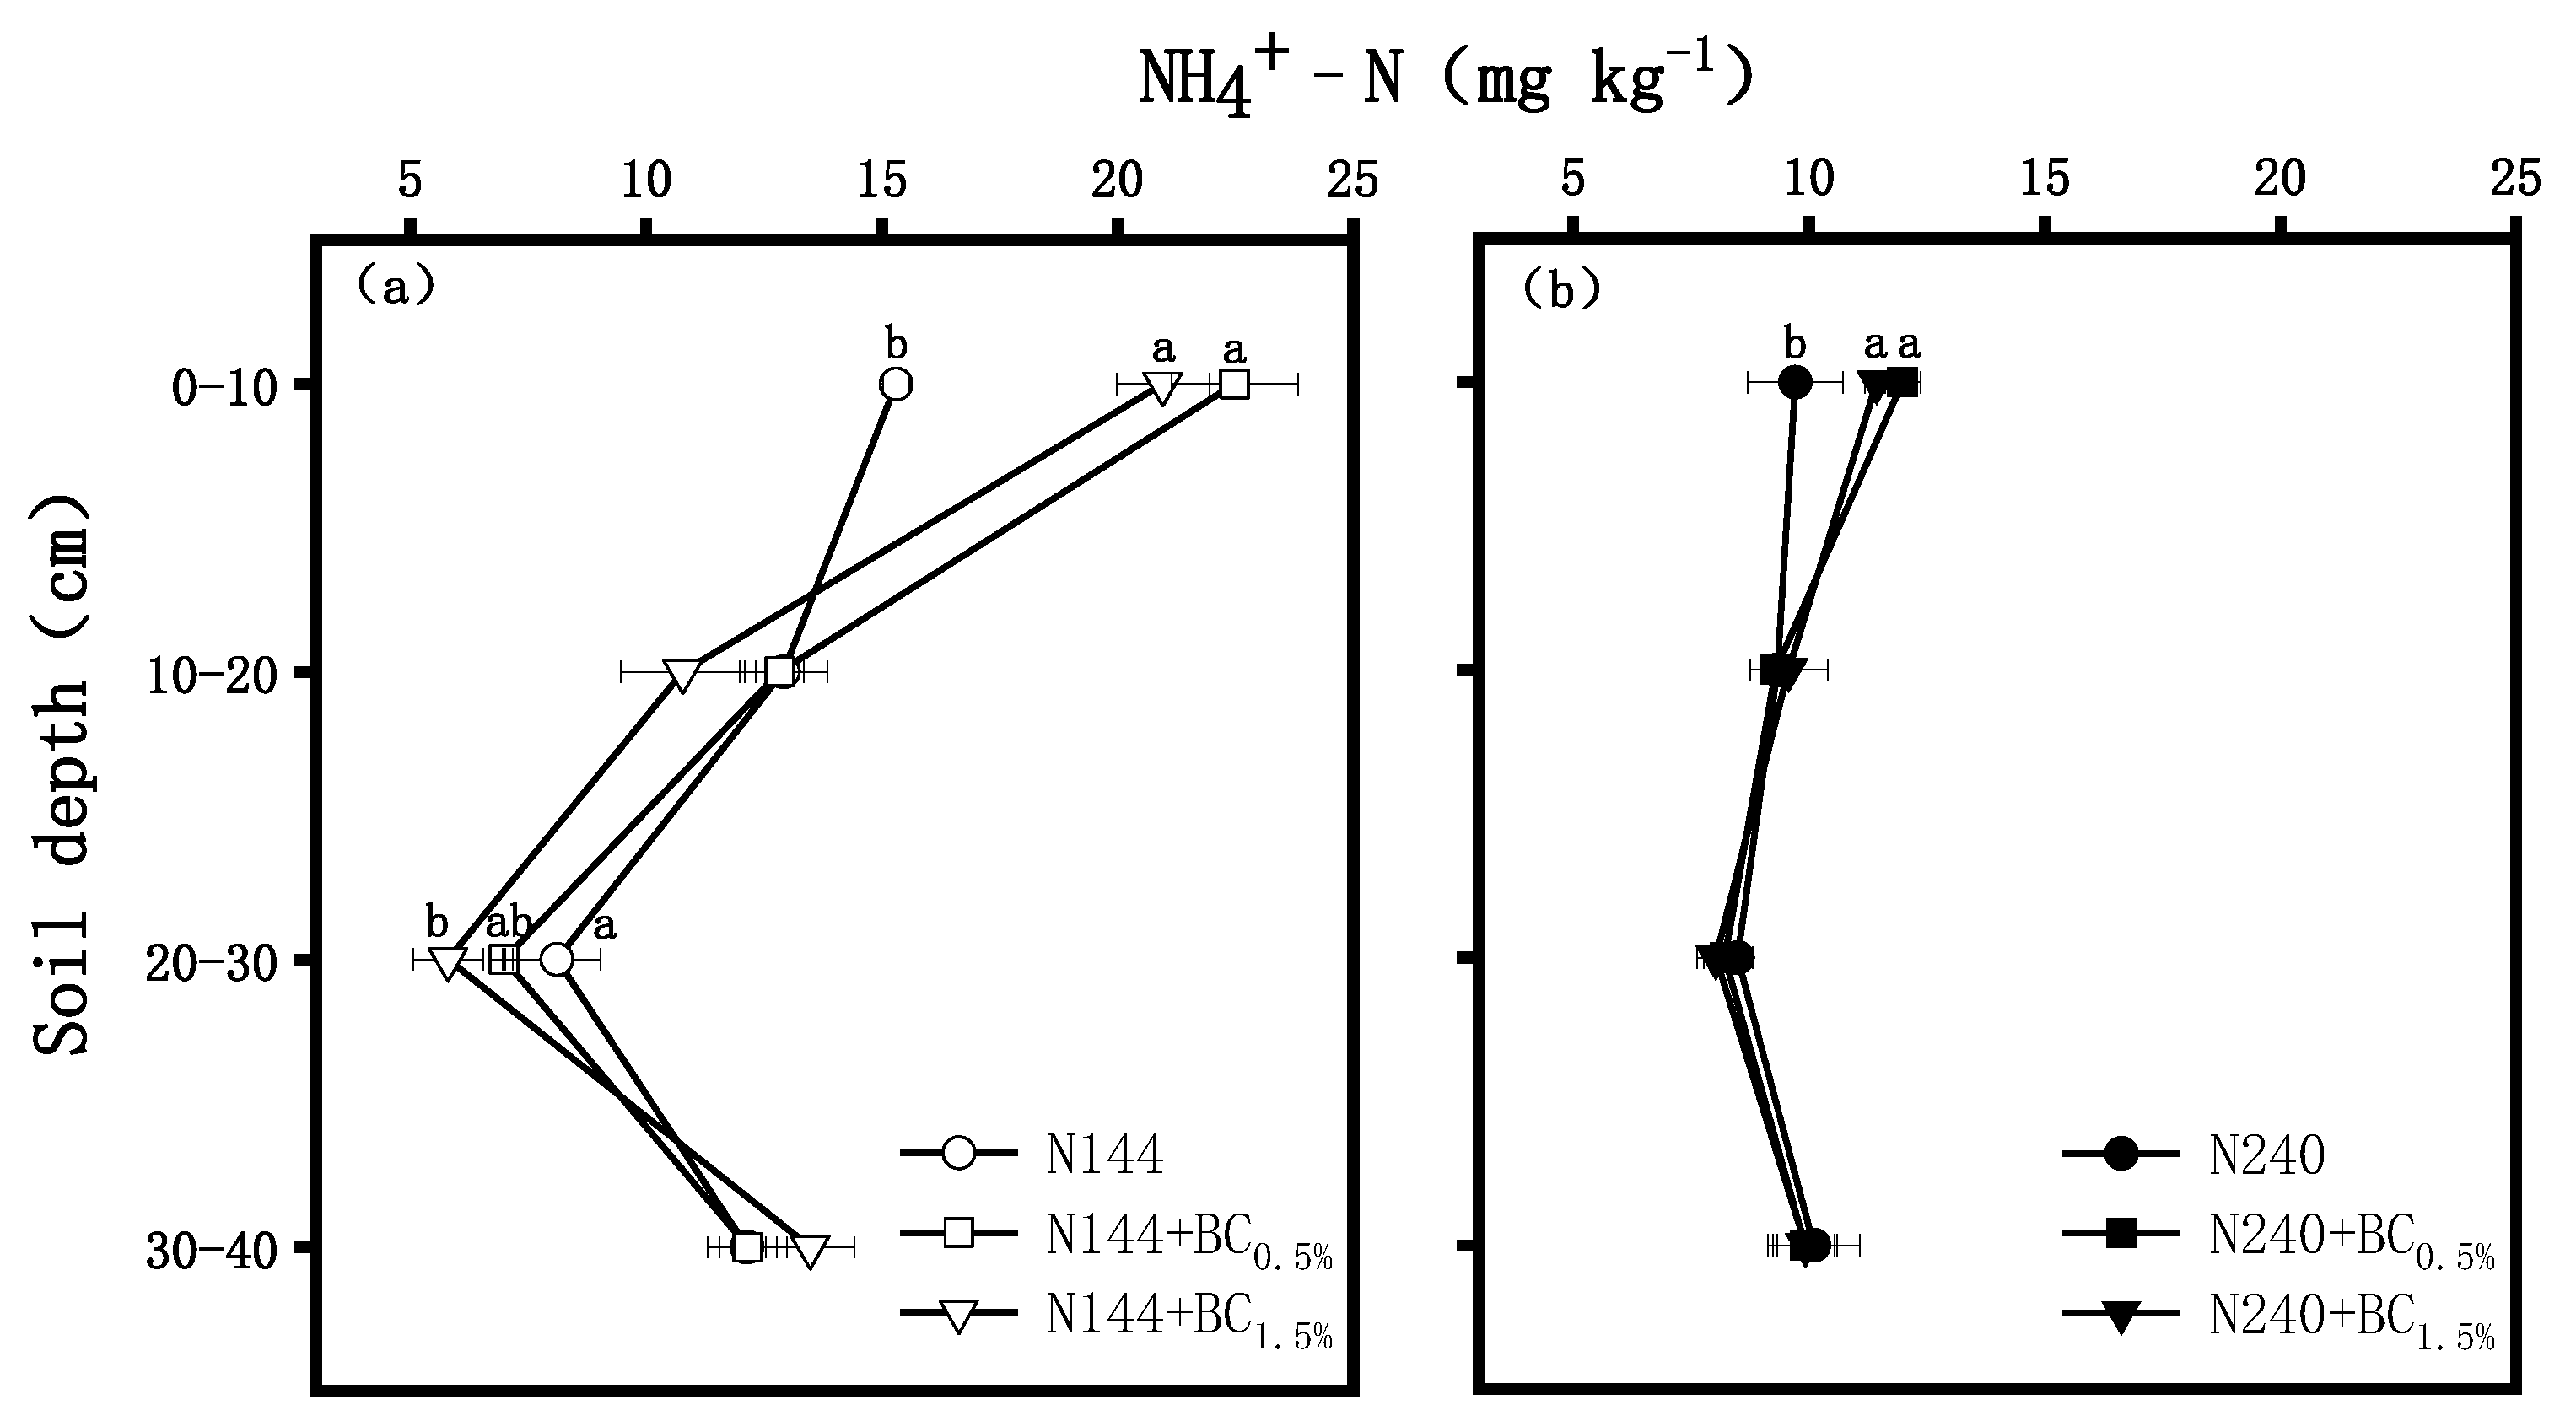
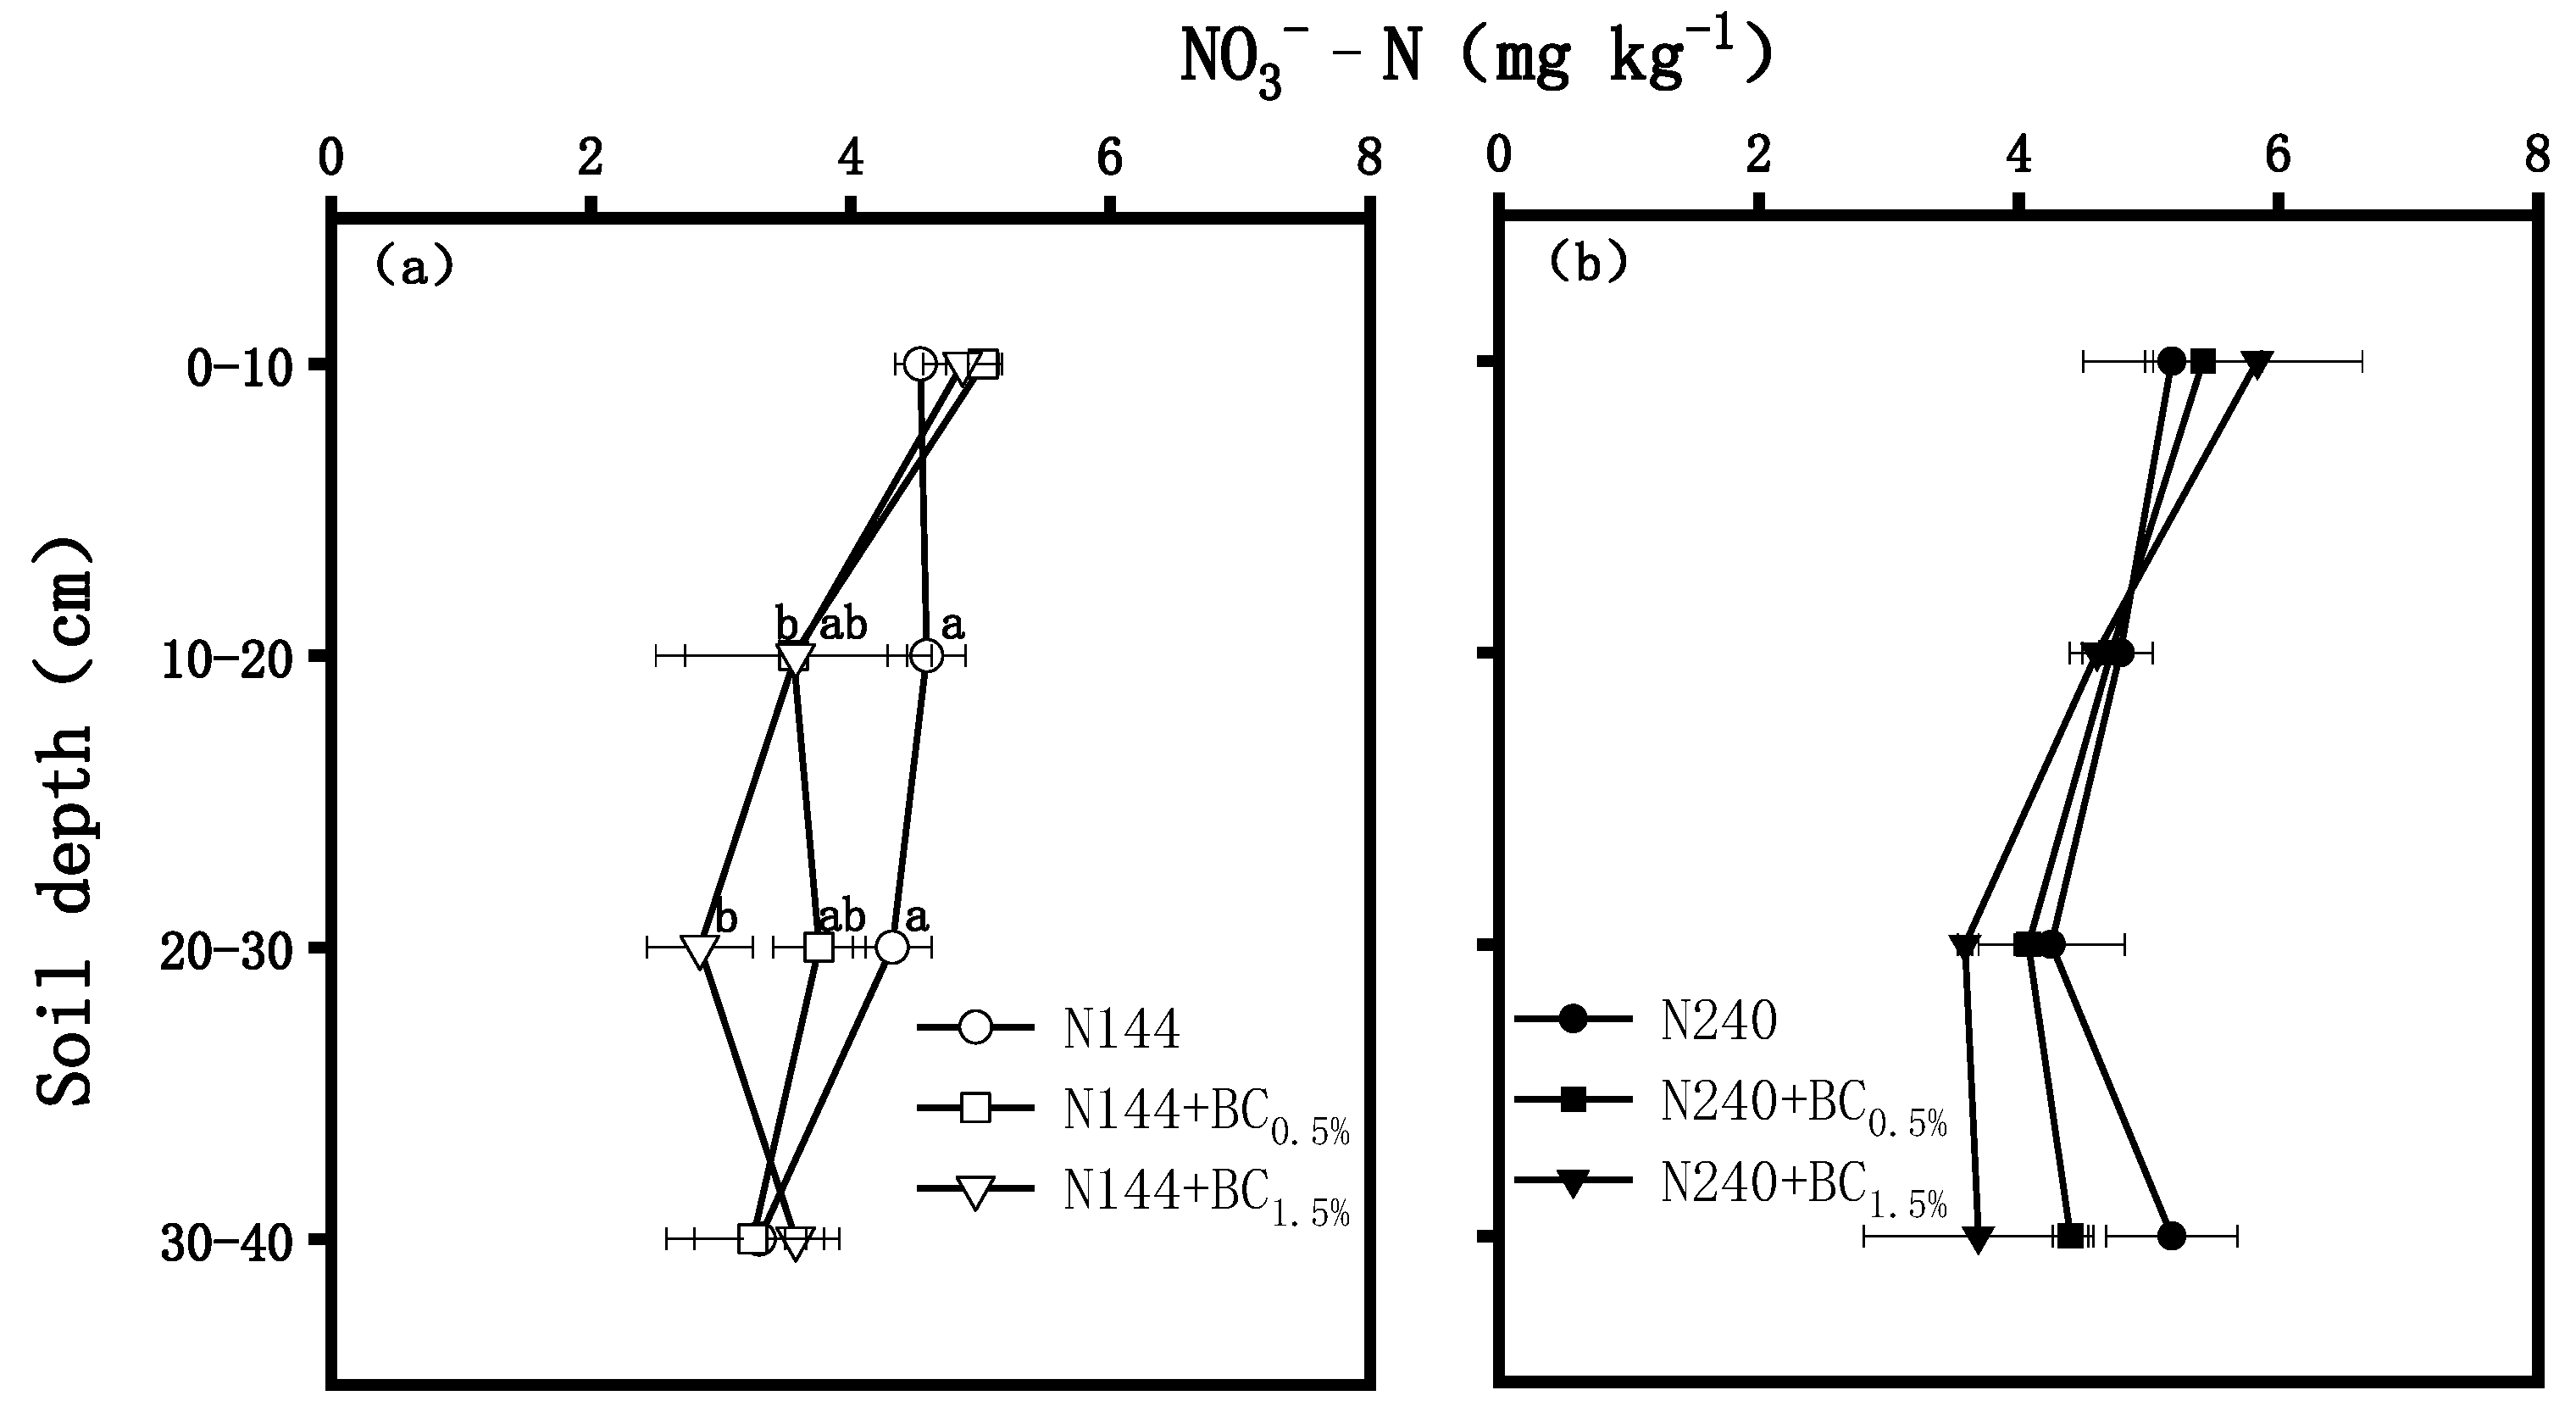
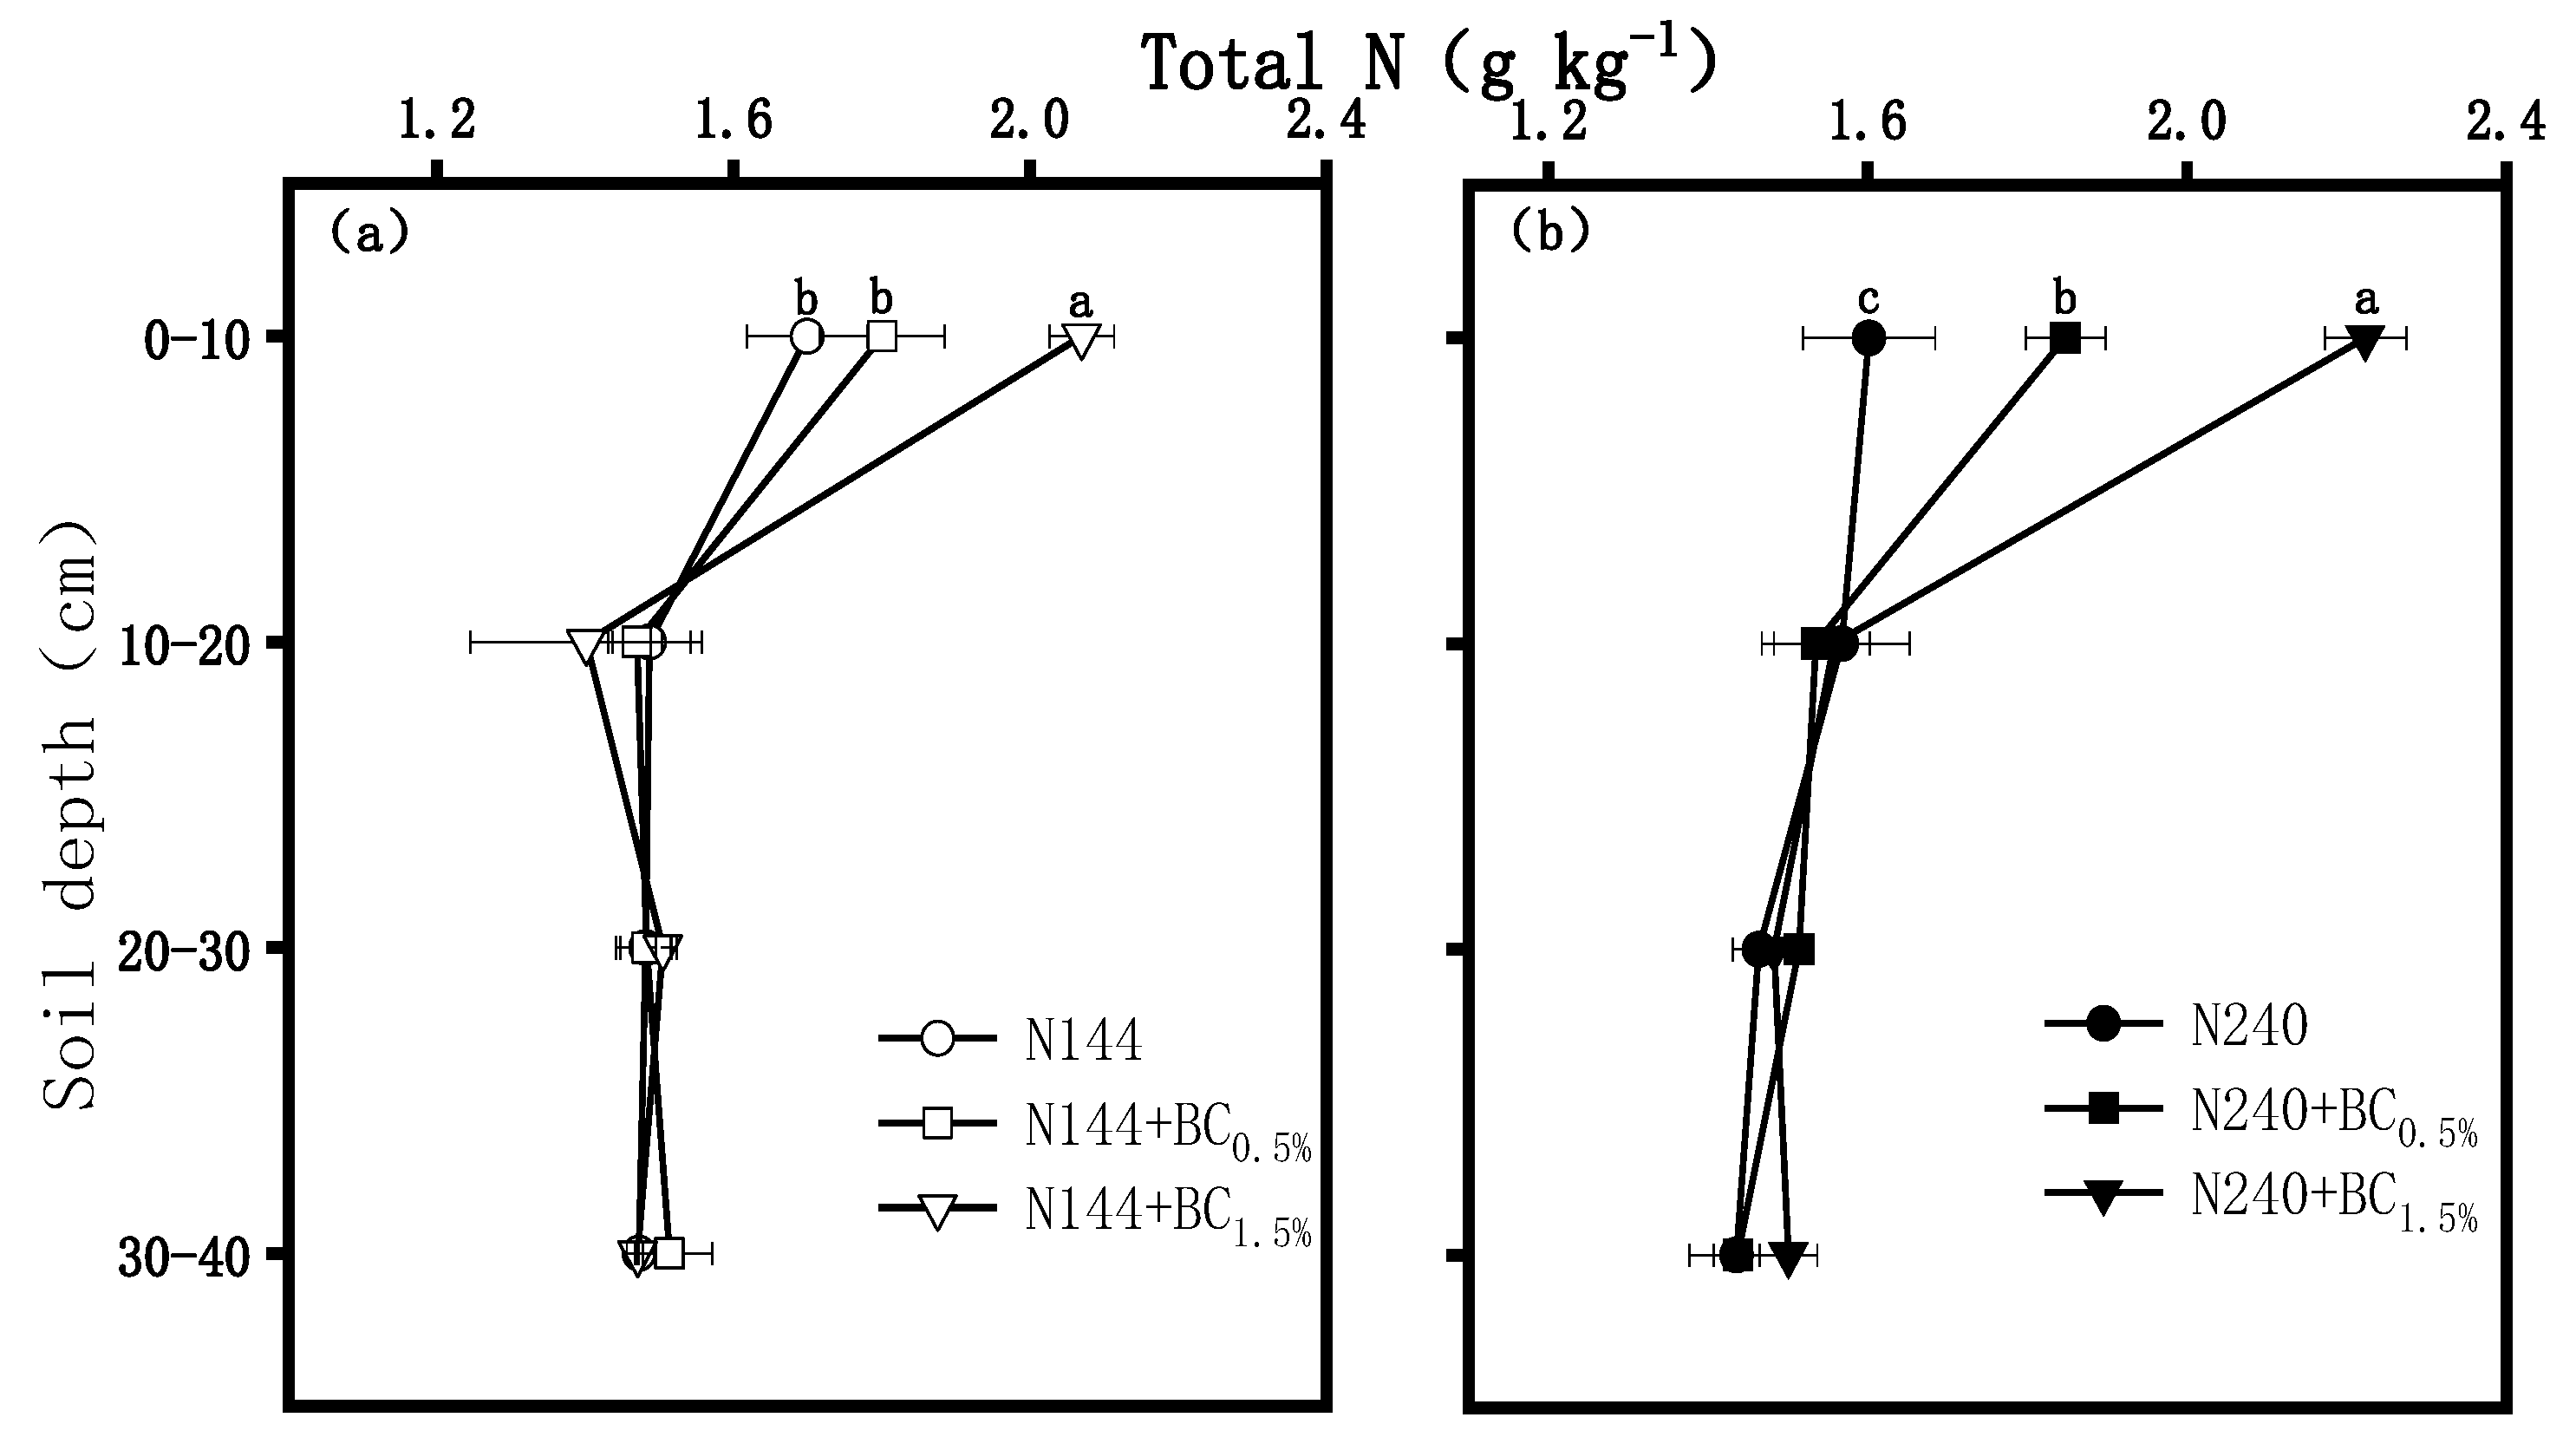
2.1.2. NH4+-N, NO3−-N, and Total N
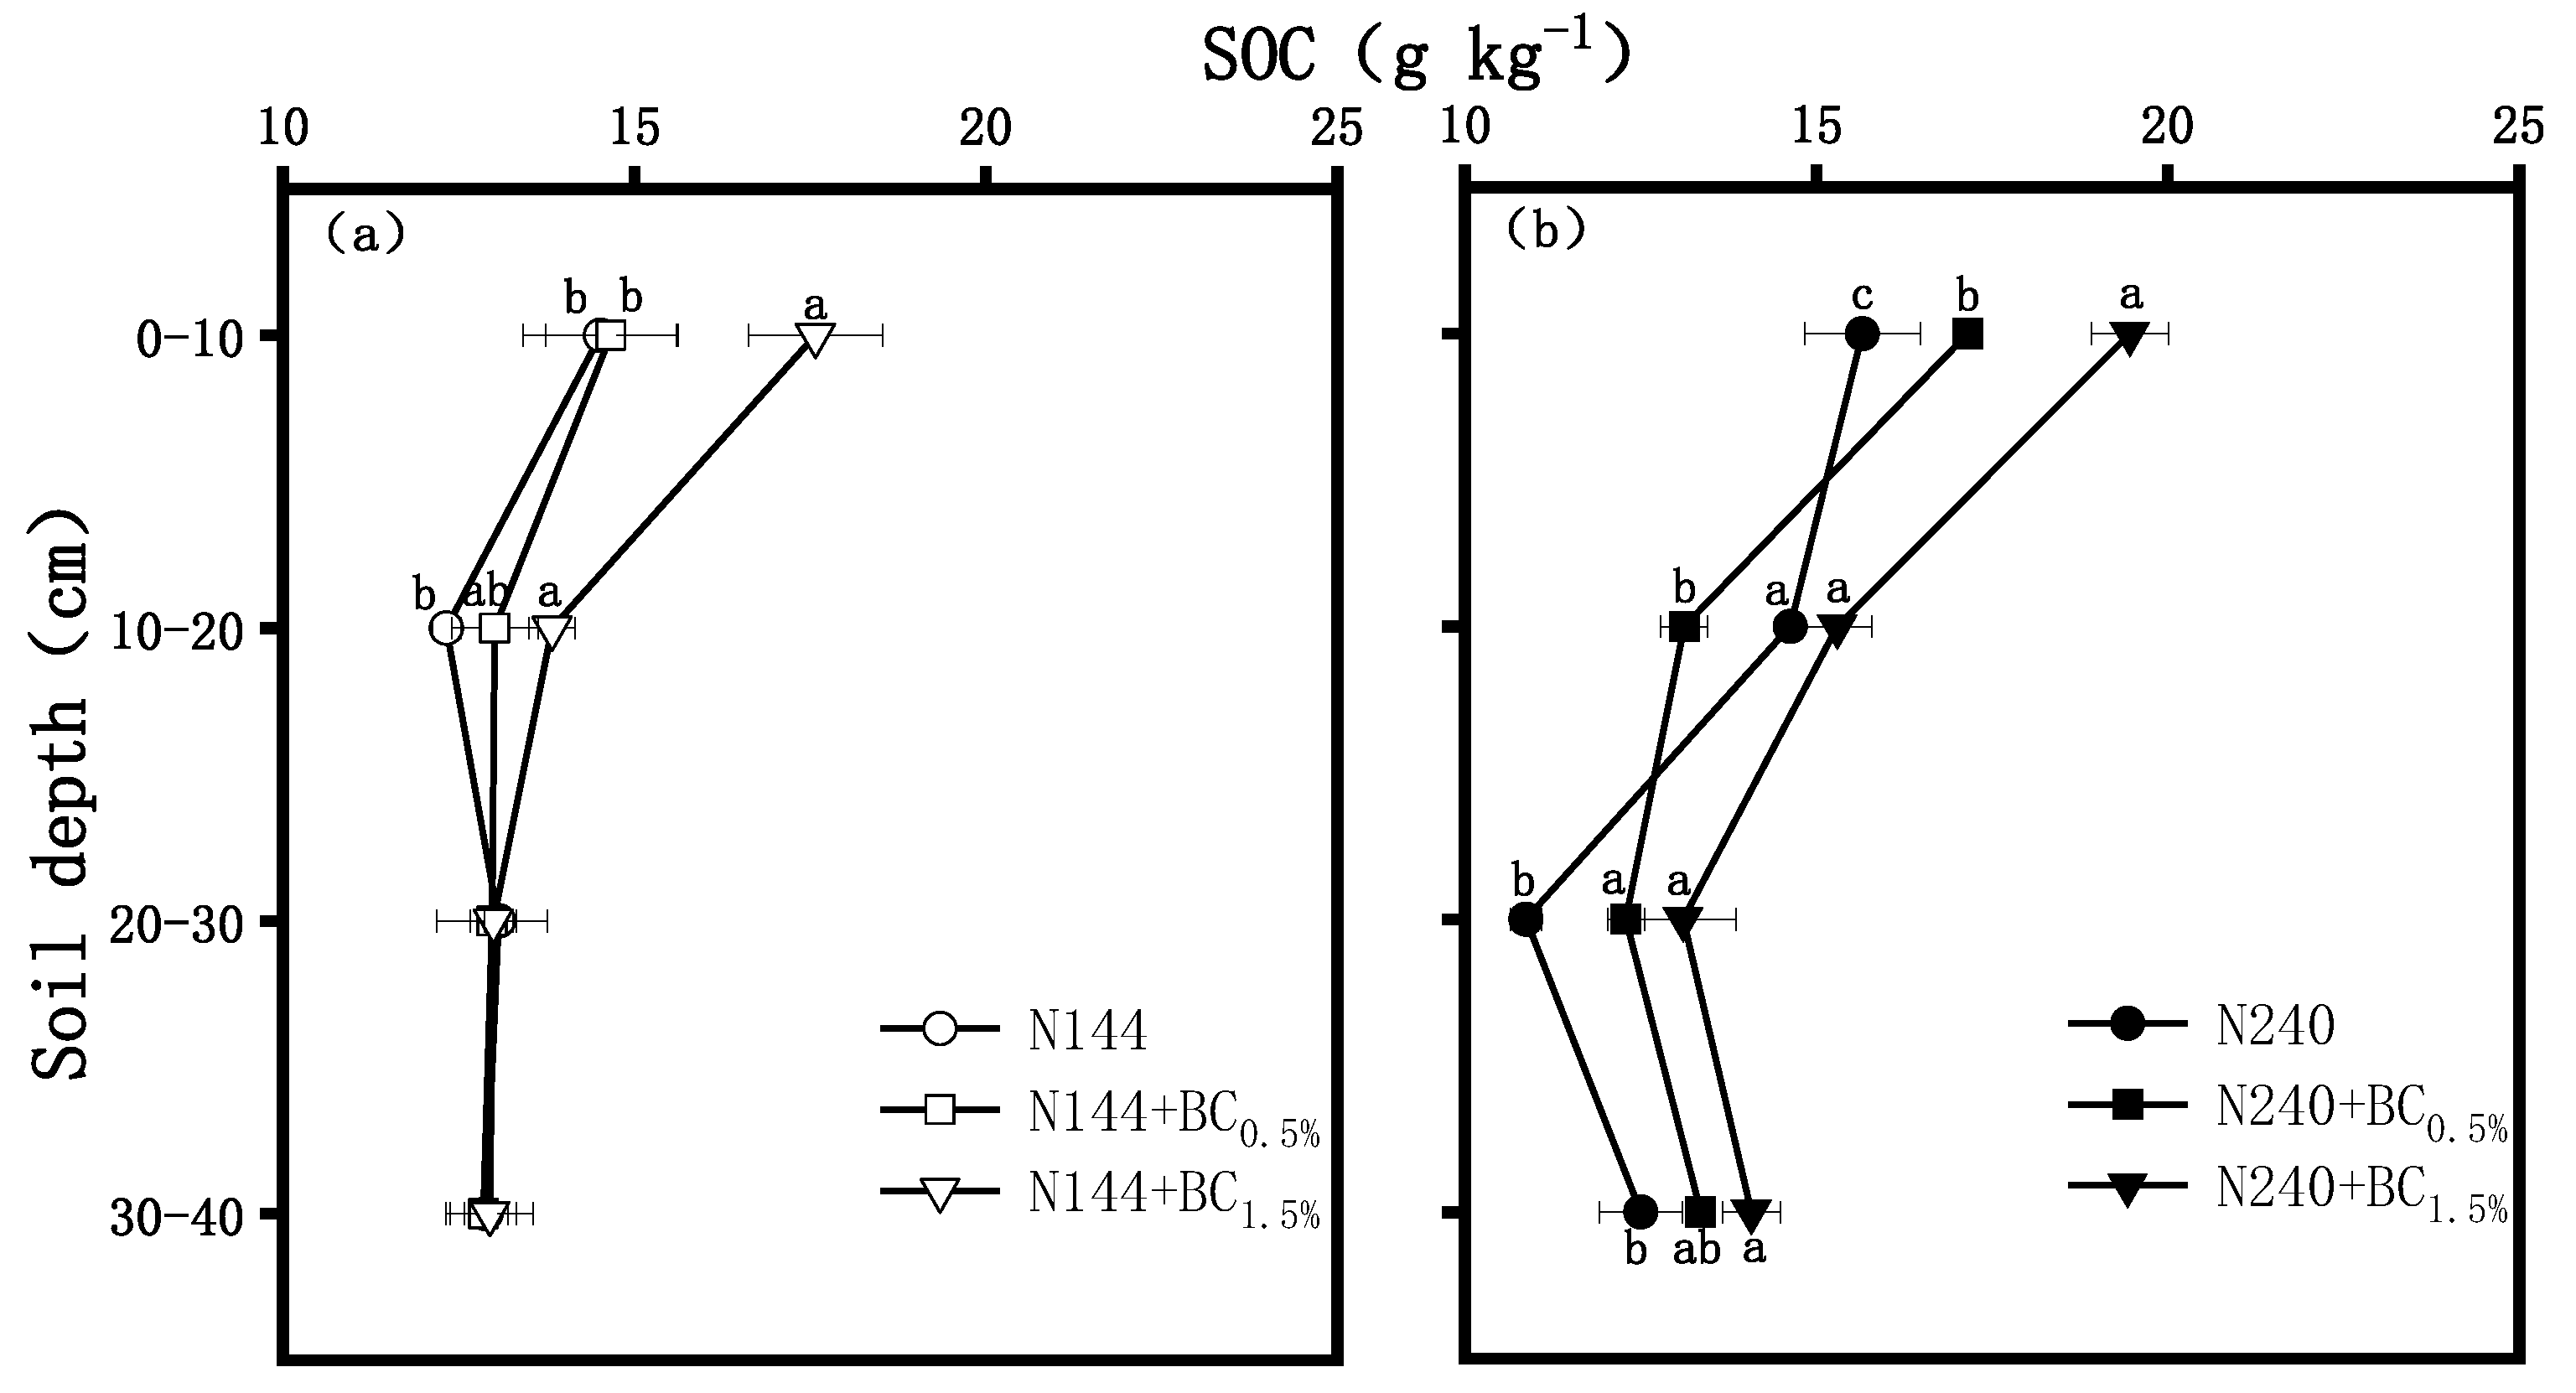
2.1.3. SOC
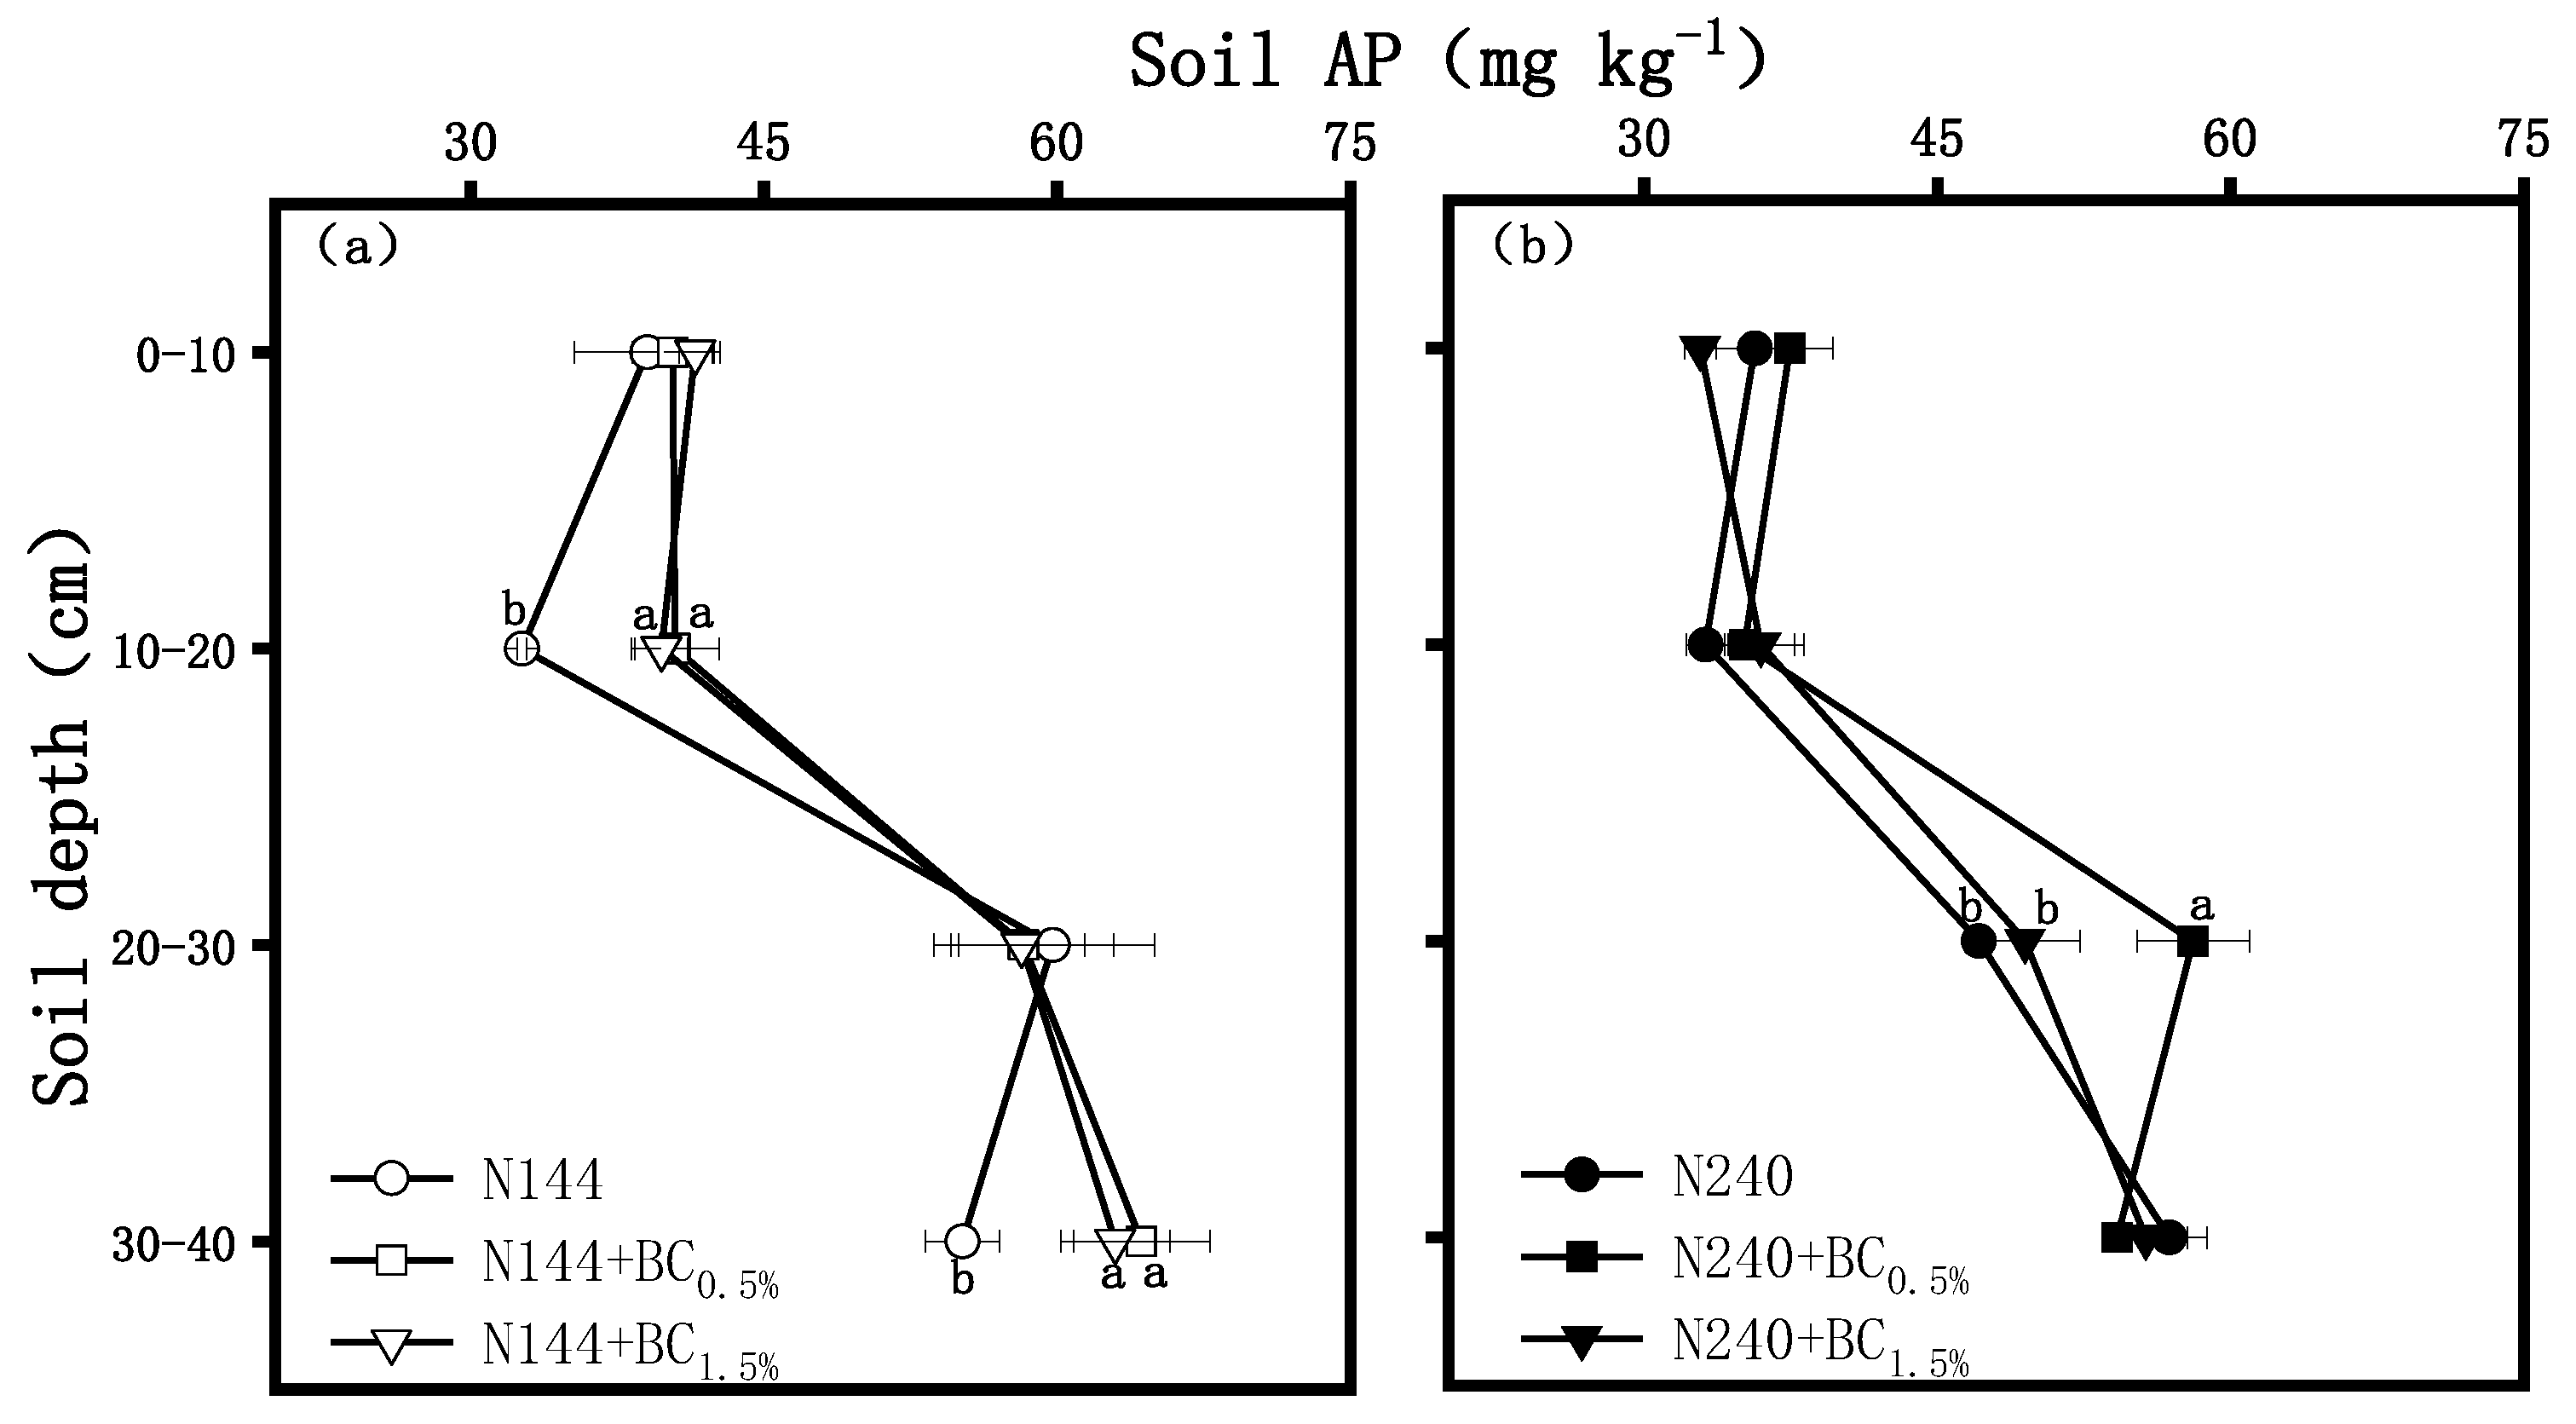
2.1.4. Soil-Available P (AP) and Potassium (AK)
2.2. Wheat Yield and the Related Agronomic Traits
3. Discussion
3.1. Soil Properties
3.2. Wheat Yield and NUE
4. Materials and Methods
4.1. Experiment Setup
4.1.1. Experimental Site and Soil and Biochar Properties
4.1.2. Experimental Design and Management
4.2. Sample Collection and Measurement
4.2.1. Soil Sampling
4.2.2. Wheat Yield and NUE
4.3. Statistical Analysis
5. Conclusions
Author Contributions
Funding
Data Availability Statement
Conflicts of Interest
References
- Zhang, X.B.; Pei, G.G.; Sun, J.F.; Huang, Y.X.; Huang, Q.Q.; Xie, H.X.; Mo, J.Y.; Zhao, M.J.; Hu, B.Q. Responses of soil nitrogen cycling to changes in aboveground plant litter inputs: A meta-analysis. Geoderma 2013, 439, 116678. [Google Scholar] [CrossRef]
- Zhou, J.Y.; Gu, B.J.; Schlesinger, W.H.; Ju, X.T. Significant accumulation of nitrate in Chinese semi-humid croplands. Sci. Rep. 2016, 6, 25088. [Google Scholar] [CrossRef]
- Reay, D.S.; Davidson, E.A.; Smith, K.A.; Smith, P.; Melillo, J.M.; Dentener, F.; Crutzen, P.J. Global agriculture and nitrous oxide emissions. Nat. Clim. Change 2012, 2, 410–416. [Google Scholar] [CrossRef]
- Robertson, G.P.; Bruulsema, T.W.; Gehl, R.J.; Kanter, D.; Mauzerall, D.L.; Rotz, C.A.; Williams, C.O. Nitrogen–climate interactions in US agriculture. Biogeochemistry 2013, 114, 41–70. [Google Scholar] [CrossRef]
- Yang, Y.Y.; Liu, L.; Zhang, F.; Zhang, X.Y.; Xu, W.; Liu, X.J.; Li, Y.; Wang, Z.; Xie, Y.W. Enhanced nitrous oxide emissions caused by atmospheric nitrogen deposition in agroecosystems over China. Environ. Sci. Pollut. Res. 2021, 28, 15350–15360. [Google Scholar] [CrossRef]
- Zhao, R.H.; Wang, B.; Theng, B.K.G.; Wu, P.; Liu, F.; Lee, X.Q.; Chen, M.; Sun, J. Fabrication and environmental applications of metal-containing solid waste/biochar composites: A review. Total Environ. 2021, 799, 149295. [Google Scholar] [CrossRef]
- An, X.F.; Wu, Z.S.; Shi, W.; Qi, H.H.; Zhang, L.H.; Xu, X.L.; Yu, B. Biochar for simultaneously enhancing the slow-release performance of fertilizers and minimizing the pollution of pesticides. J. Hazard. Mater. 2020, 407, 124865. [Google Scholar] [CrossRef]
- Glaser, B.; Lehmann, J.; Zech, W. Ameliorating physical and chemical properties of highly weathered soils in the tropics with charcoal: A review. Biol. Fertil. Soils 2002, 35, 219–230. [Google Scholar] [CrossRef]
- Bai, S.H.; Omidvar, N.; Gallart, M.; Kämper, W.; Tahmasbian, I.; Farrar, M.B.; Singh, K.; Zhou, G.Y.; Muqadass, B.; Xu, C.Y.; et al. Combined effects of biochar and fertilizer applications on yield: A review and meta-analysis. Sci. Total Environ. 2022, 808, 152073. [Google Scholar] [CrossRef]
- Gujre, N.; Soni, A.; Rangan, L.; Tsang, D.C.W.; Mitra, S. Sustainable improvement of soil health utilizing biochar and arbuscular mycorrhizal fungi: A review. Environ. Pollut. 2021, 268, 115549. [Google Scholar] [CrossRef]
- Ma, Y.C.; Kong, X.W.; Yang, B.; Zhang, X.L.; Yan, X.Y.; Yang, J.C.; Xiong, Z.Q. Net global warming potential and greenhouse gas intensity of annual rice-wheat rotations with integrated soil-crop system management. Agric. Ecosyst. Environ. 2013, 164, 209–219. [Google Scholar] [CrossRef]
- Zhang, J.; Zhang, Z.F.; Shen, G.M.; Wang, R.; Gao, L.; Kon, F.; Zhang, J.G. Growth Performance, Nutrient Absorption of Tobacco and Soil Fertility after Straw Biochar Application. Int. J. Agric. Biol. 2016, 18, 983. [Google Scholar]
- Uzoma, K.C.; Inoue, M.; Andry, H.; Fujimaki, H.; Zahoor, A.; Nishihara, E. Effect of cow manure biochar on maize productivity under sandy soil condition. Soil Use Manag. 2011, 27, 205–212. [Google Scholar] [CrossRef]
- Han, F.; Ren, L.; Zhang, X.C. Effect of biochar on the soil nutrients about different grasslands in the Loess Plateau. Catena 2016, 137, 554–562. [Google Scholar] [CrossRef]
- Arif, M.; Ilyas, M.; Riaz, M.; Ali, K.; Shah, K.; Haq, I.U.; Fahad, S. Biochar improves phosphorus use efficiency of organic-inorganic fertilizers, maize-wheat productivity and soil quality in a low fertility alkaline soil. Field Crops Res. 2017, 214, 25–37. [Google Scholar] [CrossRef]
- Heymann, K.; Lehmann, J.; Solomon, D.; Liang, B.; Neves, E.; Wirick, S. Can functional group composition of alkaline isolates from black carbon-rich soils be identified on a sub-100nm scale? Geoderma 2014, 235–236, 163–169. [Google Scholar] [CrossRef]
- Xue, P.; Hou, R.J.; Fu, Q.; Li, T.X.; Wan, J.W.; Zhou, W.Q.; Shen, W.Z.; Su, Z.B.; Wang, Y.J. Potentially migrating and residual components of biochar: Effects on phosphorus adsorption performance and storage capacity of black soil. Chemosphere 2023, 336, 139250. [Google Scholar] [CrossRef]
- Xia, H.; Riaz, M.; Zhang, M.Y.; Liu, B.; Li, Y.X.; El-Desouki, Z.; Jiang, C.C. Biochar-N fertilizer interaction increases N utilization efficiency by modifying soil C/N component under N fertilizer deep placement modes. Chemosphere 2022, 286, 131594. [Google Scholar] [CrossRef]
- Wang, Y.; Yin, Y.Y.; Joseph, S.; Flury, M.; Wang, X.; Tahery, S.; Li, B.G.; Shang, J.Y. Stabilization of organic carbon in top-and subsoil by biochar application into calcareous farmland. Sci. Total Environ. 2024, 907, 168046. [Google Scholar] [CrossRef]
- Xu, L.F.; Zhou, P.; Han, Q.F.; Li, Z.H.; Yang, B.P.; Nie, J.F. Spatial distribution of soil organic matter and nutrients in the pear orchard under clean and sod cultivation models. J. Integr. Agric. 2023, 12, 344–351. [Google Scholar] [CrossRef]
- Ferguson, R.B.; Hergert, G.W.; Schepers, J.S.; Gotway, C.A.; Cahoon, J.E.; Peterson, T.A. Site-specific nitrogen management of irrigated maize: Yield and soil residual nitrate effects. Soil Sci. Soc. Am. J. 2022, 66, 544–553. [Google Scholar] [CrossRef]
- Inagaki, T.M.; Possinger, A.R.; Schweizer, S.A.; Mueller, C.W.; Hoeschen, C.; Zachman, M.J.; Kourkoutis, L.F.; Lehmann, J. Microscale spatial distribution and soil organic matter persistence in top and subsoil. Soil Biol. Biochem. 2022, 178, 108921. [Google Scholar] [CrossRef]
- Chintala, R.; Schumacher, T.E.; McDonald, L.M.; Clay, D.E.; Malo, D.D.; Papiernik, S.K.; Clay, S.A.; Julson, J.L. Phosphorus sorption and availability from biochars and soil/biochar mixtures. Clean—Soil Air Water 2013, 42, 626–634. [Google Scholar] [CrossRef]
- Xu, W.H.; Wang, G.H.; Deng, F.F.; Zou, X.M.; Ruan, H.H.; Chen, H.Y.H. Responses of soil microbial biomass, diversity and metabolic activity to biochar applications in managed poplar plantations on reclaimed coastal saline soil. Soil Use Manag. 2018, 34, 597–605. [Google Scholar] [CrossRef]
- Caicedo, J.R.; Steen, N.P.V.D.; Arce, O.; Gijzen, H.J. Effect of total ammonia nitrogen concentration and pH on growth rate of duckweed (Spirodela polyrrhiza). Water Res. 2000, 34, 3829–3835. [Google Scholar] [CrossRef]
- Liang, H.; Lv, H.F.; Batchelor, W.D.; Lian, X.J.; Wang, Z.X.; Lin, S.; Hu, K. Simulating nitrate and DON leaching to optimize water and N management practices for greenhouse vegetable production systems. Agric. Water Manag. 2020, 241, 106377. [Google Scholar] [CrossRef]
- Zheng, W.B.; Wang, S.Q.; Liu, B.X.; Lei, Y.P.; Cao, J.S. Simulation of the migration and leaching of nitrate nitrogen in the farmland soil profile in a hilly area of Taihang Mountain with the RZWQM model. Environ. Sci. 2019, 40, 1770–1778. [Google Scholar]
- Ahmed, R.; Li, Y.Z.; Mao, L.L.; Xu, C.Y.; Lin, W.; Ahmed, S.; Ahmed, W. Biochar effects on mineral nitrogen leaching, moisture content, and evapotranspiration after 15N urea fertilization for vegetable crop. Agronomy 2019, 9, 331. [Google Scholar] [CrossRef]
- Zhang, M.; Liu, Y.L.; Wei, Q.Q.; Gou, J.L. Effects of short-term application of Moutai lees biochar on nutrients and fungal community structure in yellow soil of Guizhou. Environ. Sci. Pollut. Res. 2021, 28, 67404–67413. [Google Scholar] [CrossRef] [PubMed]
- Kameyama, K.; Miyamoto, T.; Shiono, T.; Shinogi, Y. Influence of sugarcane bagasse-derived biochar application on nitrate leaching in calcaric dark red soil. J. Environ. Qual. 2012, 41, 1131–1137. [Google Scholar] [CrossRef]
- Guan, F.Y.; Xia, M.P.; Tang, X.L.; Fan, S.H. Spatial variability of soil nitrogen, phosphorus and potassium contents in Mosobamboo forests in Yong’an City, China. Catena 2017, 150, 161–172. [Google Scholar] [CrossRef]
- Dong, D.; Feng, Q.B.; McGrouther, K.; Yang, M.; Wang, H.L.; Wu, W.X. Effects of biochar amendment on rice growth and nitrogen retention in a waterlogged paddy field. Soils Sediments 2015, 15, 153–162. [Google Scholar] [CrossRef]
- Yan, S.; Niu, Z.Y.; Yan, H.T.; Yun, F.; Peng, G.X.; Yang, Y.F.; Liu, G.S. Biochar application significantly affects the N pool and microbial community structure in purple and paddy soils. PeerJ 2019, 7, e7576. [Google Scholar] [CrossRef] [PubMed]
- Chen, P.F.; Liu, Y.Z.; Mo, C.Y.; Jiang, Z.H.; Yang, J.P.; Lin, J.D. Microbial mechanism of biochar addition on nitrogen leaching and retention in tea soils from different plantation ages. Total Environ. 2021, 757, 143817. [Google Scholar] [CrossRef] [PubMed]
- Zhang, M.; Liu, Y.L.; Wei, Q.Q.; Gou, J.L. Biochar enhances the retention capacity of nitrogen fertilizer and affects the diversity of nitrifying functional microbial communities in karst soil of southwest China. Ecotoxicol. Environ. Saf. 2021, 226, 112819. [Google Scholar] [CrossRef]
- Kimetua, J.; Lehmann, J. Stability and stabilisation of biochar and green manure in soil with different organic carbon contents. Soil Res. 2010, 48, 577–585. [Google Scholar] [CrossRef]
- Dai, W.; Gao, H.; Sha, Z.M.; Penttinen, P.; Fang, K.K.; Wang, J.; Cao, L.K. Changes in soil organic carbon fractions in response to wheat straw incorporation in a subtropical paddy field in China. J. Plant Nutr. Soil Sci. 2021, 184, 198–207. [Google Scholar] [CrossRef]
- Zhang, Q.F.; Wang, G.H. Research progress of physiochemical properties of biochar and its effects as soil amendments. Soil Crop 2012, 1, 219–226. [Google Scholar]
- Liang, B.Q.; Lehmann, J.; Sohi, S.P.; Thies, J.E.; O’Neill, B.; Trujillo, L.; Gaunt, J.; Solomon, D.; Grossman, J.; Neves, E.G.; et al. Black Carbon affects the cycling of non-black carbon in soil. Org. Geochem. 2010, 41, 206–213. [Google Scholar] [CrossRef]
- Laird, D.; Fleming, P.; Wang, B.Q.; Horton, R.; Karlen, D. Biochar impact on nutrient leaching from a Midwestern agricultural soil. Geoderma 2010, 158, 436–442. [Google Scholar] [CrossRef]
- Zhang, X.; Wang, D.; Jiang, C.C.; Zhu, P.; Lei, J.; Peng, S.A. Effect of biochar on physicochemical properties of red and yellow brown soils in the South China Region. Chin. J. Eco-Agric. 2013, 21, 979–984. [Google Scholar] [CrossRef]
- Zhang, K.K.; Song, X.; Guo, D.D.; Huang, S.M.; Yue, K.; Guo, T.F.; Zhang, S.Q.; Yue, Y.J. Effects of Biochar on Fertility and Nitrogen Utilization Efficiency in Fluvo-Aquic Soil. J. Henan Agric. Sci. 2022, 51, 73–80. [Google Scholar]
- Dai, J.; Wang, Z.H.; Li, Q.; Li, M.H.; Li, F.C. Effects of nitrogen application rate on winter wheat yield and soil nitrate nitrogen during summer fallow season on dryland. Acta Pedol. Sin. 2013, 50, 956–965. [Google Scholar]
- Yang, H.P.; Li, F.Y.; Suo, G.D.; Zhao, J.R.; Wang, J.F.; Ren, L.T. Effects of biochar combined with chemical fertilizers on soil properties, nitrogen use efficiency and maize yield. J. Anhui Sci. Technol. Univ. 2020, 34, 53–58. [Google Scholar]
- Zhao, R.F.; Chen, X.P.; Zhang, F.S.; Zhang, H.L.; Schroder, J.; Römheld, O. Fertilization and Nitrogen Balance in a Wheat–Maize Rotation System in North China. Agron. J. 2006, 98, 938–945. [Google Scholar] [CrossRef]
- Van, Z.L.; Kimber, S.; Morris, S.; Chan, K.Y.; Downie, A.; Rust, J.; Joseph, S.; Cowie, A. Effects of biochar from slow pyrolysis of papermill waste on agronomic performance and soil fertility. Plant Soil 2010, 327, 235–246. [Google Scholar]
- Laird, D.A.; Fleming, P.; Davis, D.D.; Horton, R.; Wang, B.Q.; Karlen, D.L. Impact of biochar amendments on the quality of a typical midwestern agricultural soil. Geoderma 2010, 158, 443–449. [Google Scholar] [CrossRef]
- Dong, Y.B.; Wu, Z.; Li, B.; Xiong, Z.Q. Effects of biochar reapplication on ammonia volatilization and nitrogen use efficiency during wheat season in a rice-wheat annual rotation system. J. Plant Nutr. Fertil. 2017, 23, 1258–1267. [Google Scholar]
- Sun, H.J.; Zhang, H.; Wu, J.; Jiang, P.; Shi, W. Laboratory lysimeter analysis of NH3 and N2O emissions and leaching losses of Nitrogen in a rice-wheat rotation system irrigated with nitrogen-rich wastewater. Soil Sci. 2013, 178, 316–323. [Google Scholar] [CrossRef]
- Chu, G.; Xu, R.; Chen, S.; Xu, C.M.; Wang, D.Y.; Zhang, X.F. Effects of controlled release urea side deep placement on yield formation and nitrogen use efficiency of mechanical precise hill-drop drilling rice. Crop Res. 2021, 35, 1–7. [Google Scholar]
- Bao, S.D. Soil and Agricultural Chemistry Analysis; China Agricultural Press: Beijing, China, 2000. [Google Scholar]
- Fan, Y.C.; Shi, Y.; Yu, Z.W.; Zhang, Y.L. Difference of nitrogen accumulation and translocation of wheat varieties with different yield potential. J. Triticeae Crops 2021, 41, 1496–1502. [Google Scholar]


| Treatment | Grain Number per Pot | 12-Average Plant Height (cm) | 1000 Grains’ Weigh (g) | Theoretical Yield (g pot−1) |
|---|---|---|---|---|
| CK | 142.33 ± 25.14 d | 45.4 ± 3.89 c | 67.58 ± 7.73 d | 284.33 ± 80.26 e |
| N144 | 433.33 ± 35.35 a | 69.2 ± 3.41 ab | 110.04 ± 16.6 c | 1561.26 ± 442.95 d |
| N144 + BC0.5% | 376 ± 17.25 bc | 70.1 ± 3.54 ab | 123.25 ± 6.36 bc | 1843.43 ± 209.13 abc |
| N144 + BC1.5% | 328.67 ± 9.97 c | 63.7 ± 3.67 ab | 141.91 ± 12.73 ab | 1751.87 ± 301.77 cd |
| N240 | 410 ± 30.09 ab | 68.7 ± 3.92 ab | 131.48 ± 4.84 ab | 2498.99 ± 427.63 ab |
| N240 + BC0.5% | 414 ± 15.72 ab | 65.6 ± 2.76 ab | 134.33 ± 2.51 ab | 2393.37 ± 180.23 abc |
| N240 + BC1.5% | 370.67 ± 13.03 bc | 71.6 ± 7.87 a | 147.81 ± 5.85 a | 2636.92 ± 357.70 a |
| Treatment | Grain N Uptake (g pot−1) | Straw N Uptake (g pot−1) | Total N Uptake (g pot−1) | NRE (%) | NUE (kg kg−1) |
|---|---|---|---|---|---|
| CK | 0.16 ± 0.04 e | 0.05 ± 0.02 d | 0.21 ± 0.03 d | - | - |
| N144 | 0.83 ± 0.09 cd | 0.26 ± 0.03 bc | 1.08 ± 0.11 bc | 58.8 ± 7.25 a | 0.74 ± 7.25 ab |
| N144 + BC0.5% | 0.81 ± 0.15 d | 0.22 ± 0.01 c | 1.03 ± 0.15 c | 55.7 ± 10.36 ab | 0.70 ± 10.36 abc |
| N144 + BC1.5% | 0.85 ± 0.12 bcd | 0.24 ± 0.01 ab | 1.09 ± 0.11 bc | 59.8 ± 7.36 a | 0.75 ± 7.36 a |
| N240 | 1.13 ± 0.13 a | 0.30 ± 0.06 ab | 1.43 ± 0.18 a | 49.8 ± 7.47 ab | 0.59 ± 7.47 bcd |
| N240 + BC0.5% | 1.07 ± 0.06 ab | 0.23 ± 0.01 c | 1.30 ± 0.07 ab | 44.3 ± 2.99 b | 0.53 ± 2.99 d |
| N240 + BC1.5% | 1.05 ± 0.03 abc | 0.34 ± 0.02 a | 1.39 ± 0.02 a | 48 ± 0.77 ab | 0.57 ± 0.77 cd |
Disclaimer/Publisher’s Note: The statements, opinions and data contained in all publications are solely those of the individual author(s) and contributor(s) and not of MDPI and/or the editor(s). MDPI and/or the editor(s) disclaim responsibility for any injury to people or property resulting from any ideas, methods, instructions or products referred to in the content. |
© 2024 by the authors. Licensee MDPI, Basel, Switzerland. This article is an open access article distributed under the terms and conditions of the Creative Commons Attribution (CC BY) license (https://creativecommons.org/licenses/by/4.0/).
Share and Cite
Liu, J.; Chen, Z.; Wu, S.; Sun, H.; Xing, J.; Zhang, Z. Interaction of Biochar Addition and Nitrogen Fertilizers on Wheat Production and Nutrient Status in Soil Profiles. Plants 2024, 13, 614. https://doi.org/10.3390/plants13050614
Liu J, Chen Z, Wu S, Sun H, Xing J, Zhang Z. Interaction of Biochar Addition and Nitrogen Fertilizers on Wheat Production and Nutrient Status in Soil Profiles. Plants. 2024; 13(5):614. https://doi.org/10.3390/plants13050614
Chicago/Turabian StyleLiu, Jiale, Zirui Chen, Si Wu, Haijun Sun, Jincheng Xing, and Zhenhua Zhang. 2024. "Interaction of Biochar Addition and Nitrogen Fertilizers on Wheat Production and Nutrient Status in Soil Profiles" Plants 13, no. 5: 614. https://doi.org/10.3390/plants13050614