Article

Responses of Three Pedicularis Species to Geological and Climatic Changes in the Qinling Mountains and Adjacent Areas in East Asia

Key Laboratory of Resource Biology and Biotechnology in Western China, Ministry of Education, College of Life Sciences, Northwest University, Xi’an 710069, China
*
Author to whom correspondence should be addressed.
These authors contributed equally to this work.
Plants 2024, 13(6), 765; https://doi.org/10.3390/plants13060765
Submission received: 29 January 2024 / Revised: 28 February 2024 / Accepted: 6 March 2024 / Published: 8 March 2024

Abstract

:
The Qinling Mountains in East Asia serve as the geographical boundary between the north and south of China and are also indicative of climatic differences, resulting in rich ecological and species diversity. However, few studies have focused on the responses of plants to geological and climatic changes in the Qinling Mountains and adjacent regions. Therefore, we investigated the evolutionary origins and phylogenetic relationships of three Pedicularis species in there to provide molecular evidence for the origin and evolution of plant species. Ecological niche modeling was used to predict the geographic distributions of three Pedicularis species during the last interglacial period, the last glacial maximum period, and current and future periods, respectively. Furthermore, the distribution patterns of climate fluctuations and the niche dynamics framework were used to assess the equivalence or difference of niches among three Pedicularis species. The results revealed that the divergence of three Pedicularis species took place in the Miocene and Holocene periods, which was significantly associated with the large-scale uplifts of the Qinling Mountains and adjacent regions. In addition, the geographic distributions of three Pedicularis species have undergone a northward migration from the past to the future. The most important environmental variables affecting the geographic distributions of species were the mean diurnal range and annual mean temperature range. The niche divergence analysis suggested that the three Pedicularis species have similar ecological niches. Among them, P. giraldiana showed the highest niche breadth, covering nearly all of the climatic niche spaces of P. dissecta and P. bicolor. In summary, this study provides novel insights into the divergence and origins of three Pedicularis species and their responses to climate and geological changes in the Qinling Mountains and adjacent regions. The findings have also provided new perspectives for the conservation and management of Pedicularis species.

1. Introduction

Climatic oscillations during the Quaternary have profoundly affected the geographic distribution, migration, and genetic structure of plants in both the Southern and Northern Hemispheres [1,2]. Although East Asia was not covered much by ice sheets during the last glacial period, climate oscillations during the late Quaternary strongly impacted the biological diversity and evolution of many extant species in the region [3,4]. Recent phylogeographic studies have shown that climatic changes and historical geological events were the primary drivers of population expansions/contractions and interspecific divergence in plants, which also constructed new ecological niches, leading to the origin and divergence of new species [5,6]. In addition, the combination of ecological niche modeling (ENM) and maternal inherited chloroplast DNA (cpDNA) markers were used to predict the geographic distribution changes of relict plant species and forest trees from East Asia [7,8]. Combining plant genetic information with niche models could help us investigate the effects of global climate change on the evolution of alpine plants since the Quaternary, as well as the factors involved in the origin and differentiation of species [9,10,11]. These studies provided novel insights into biodiversity conservation in the context of global climate.
Previous geological studies suggested that the Qinling Orogenic Belt in East Asia experienced a long evolutionary history and has a complicated composition and structure [12]. The rapid uplift of the Qinling Mountains since the late Cenozoic was influenced by changes in deep earth dynamic processes, which dominated the different climatic environments in mountainous areas and subsequently created the abundant biodiversity of the Qinling Mountains [13,14]. The Qinling Mountains are a unique biodiversity region in the world due to their distinctive geographic location, diverse habitats, and climate types, providing an ideal environment for studying species differentiation and response patterns of plant species to geological and climatic oscillations. Relevant studies have investigated the genetic divergence and evolutionary histories of three closely related tree peony species (Paeonia qiui Y. L. Pei and D. Y. Hong, Paeonia jishanensis T. Hong and W. Z. Zhao, and Paeonia rockii (S. G. Haw and Lauener) T. Hong and J. J. Li ex D. Y. Hong) in the Qinling–Daba Mountains [5] and also revealed the population genetic structure of P. rockii using nuclear gene markers and chloroplast DNAs [15]. These results demonstrated that the Qinling Mountains as a geographic barrier have profoundly impacted the population evolution of the endemic species in this region. However, the phylogeographic studies and population demographic history of endemic plants in the Qinling Mountains and adjacent areas need further exploration.
Pedicularis (Orobanchaceae) is a genus of hemiparasitic plants distributed throughout the Northern Hemisphere, mainly in high-latitude or montane habitats. The species richness and morphological diversity in Pedicularis is confined to a comparatively limited region of eastern Asia, with approximately 75% of species being endemic to the Himalaya-Hengduan areas [16,17]. The genus Pedicularis provides an exceptional model or case in this region for exploring how alpine plants respond to climatic fluctuations and geological events, as well as the associated interspecific evolutionary processes and population dynamics [18,19]. Recently, the evolutionary patterns of three single/low-copy nuclear genes (CRC, LFY-L, LFY-S) and two chloroplast genes (matK and ycf1) in sixty-five accessions of Pedicularis sect. Cyathophora from the Hengduan Mountains were investigated, which revealed that the uplift of the Qinghai–Tibet Plateau and climatic changes may have played crucial roles in the divergence and speciation of Pedicularis sect. Cyathophora [20]. Moreover, the effects of climatic oscillations on genetic diversity and phylogenetic relationships in Pedicularis sect. Cyathophora (Orobanchaceae) on the Qinghai–Tibet Plateau have been also researched [21,22]. Nevertheless, the evolutionary relationships and species divergence of Pedicularis species in the Qinling Mountains and adjacent areas are less well known. Therefore, we focus on three species of Pedicularis (Pedicularis bicolor Diels, Pedicularis dissecta (Bonati) Pennell and H. L. Li, Pedicularis giraldiana Diels ex Bonati) endemic to the Qinling Mountains [23]. P. bicolor has been recorded as a vulnerable (VU) species on the IUCN Red List [24]. P. giraldiana is distributed over most parts of the Qinling Mountains and extends southwestward in China ranging from 2900 to 3000 m, while P. dissecta is distributed in the Qinling Mountains of southern Shaanxi province, thriving on rocks at an altitude of 3000 m [23].
In this study, we analyzed phylogenetic relationships and divergence of three Pedicularis species (P. bicolor, P. giraldiana, and P. dissecta) using maternally inherited chloroplast DNA (cpDNA) sequences. Additionally, we examined niche divergences between the species through ecological niche modeling (ENM) and compared their spatial distributions during different historical times. The main objectives of this study were to (1) conduct phylogenetic analysis based on plastid genome data; (2) estimate divergence times and explore their relationships with geological events; (3) evaluate niche differences between species from both geographic and environmental perspectives; (4) investigate the impacts of global climate change on the three Pedicularis species in the Qinling Mountains since the last interglacial (LIG) period and explore their response to climate oscillations and geological events; and (5) provide references for protecting wild plant population resources.

2. Results

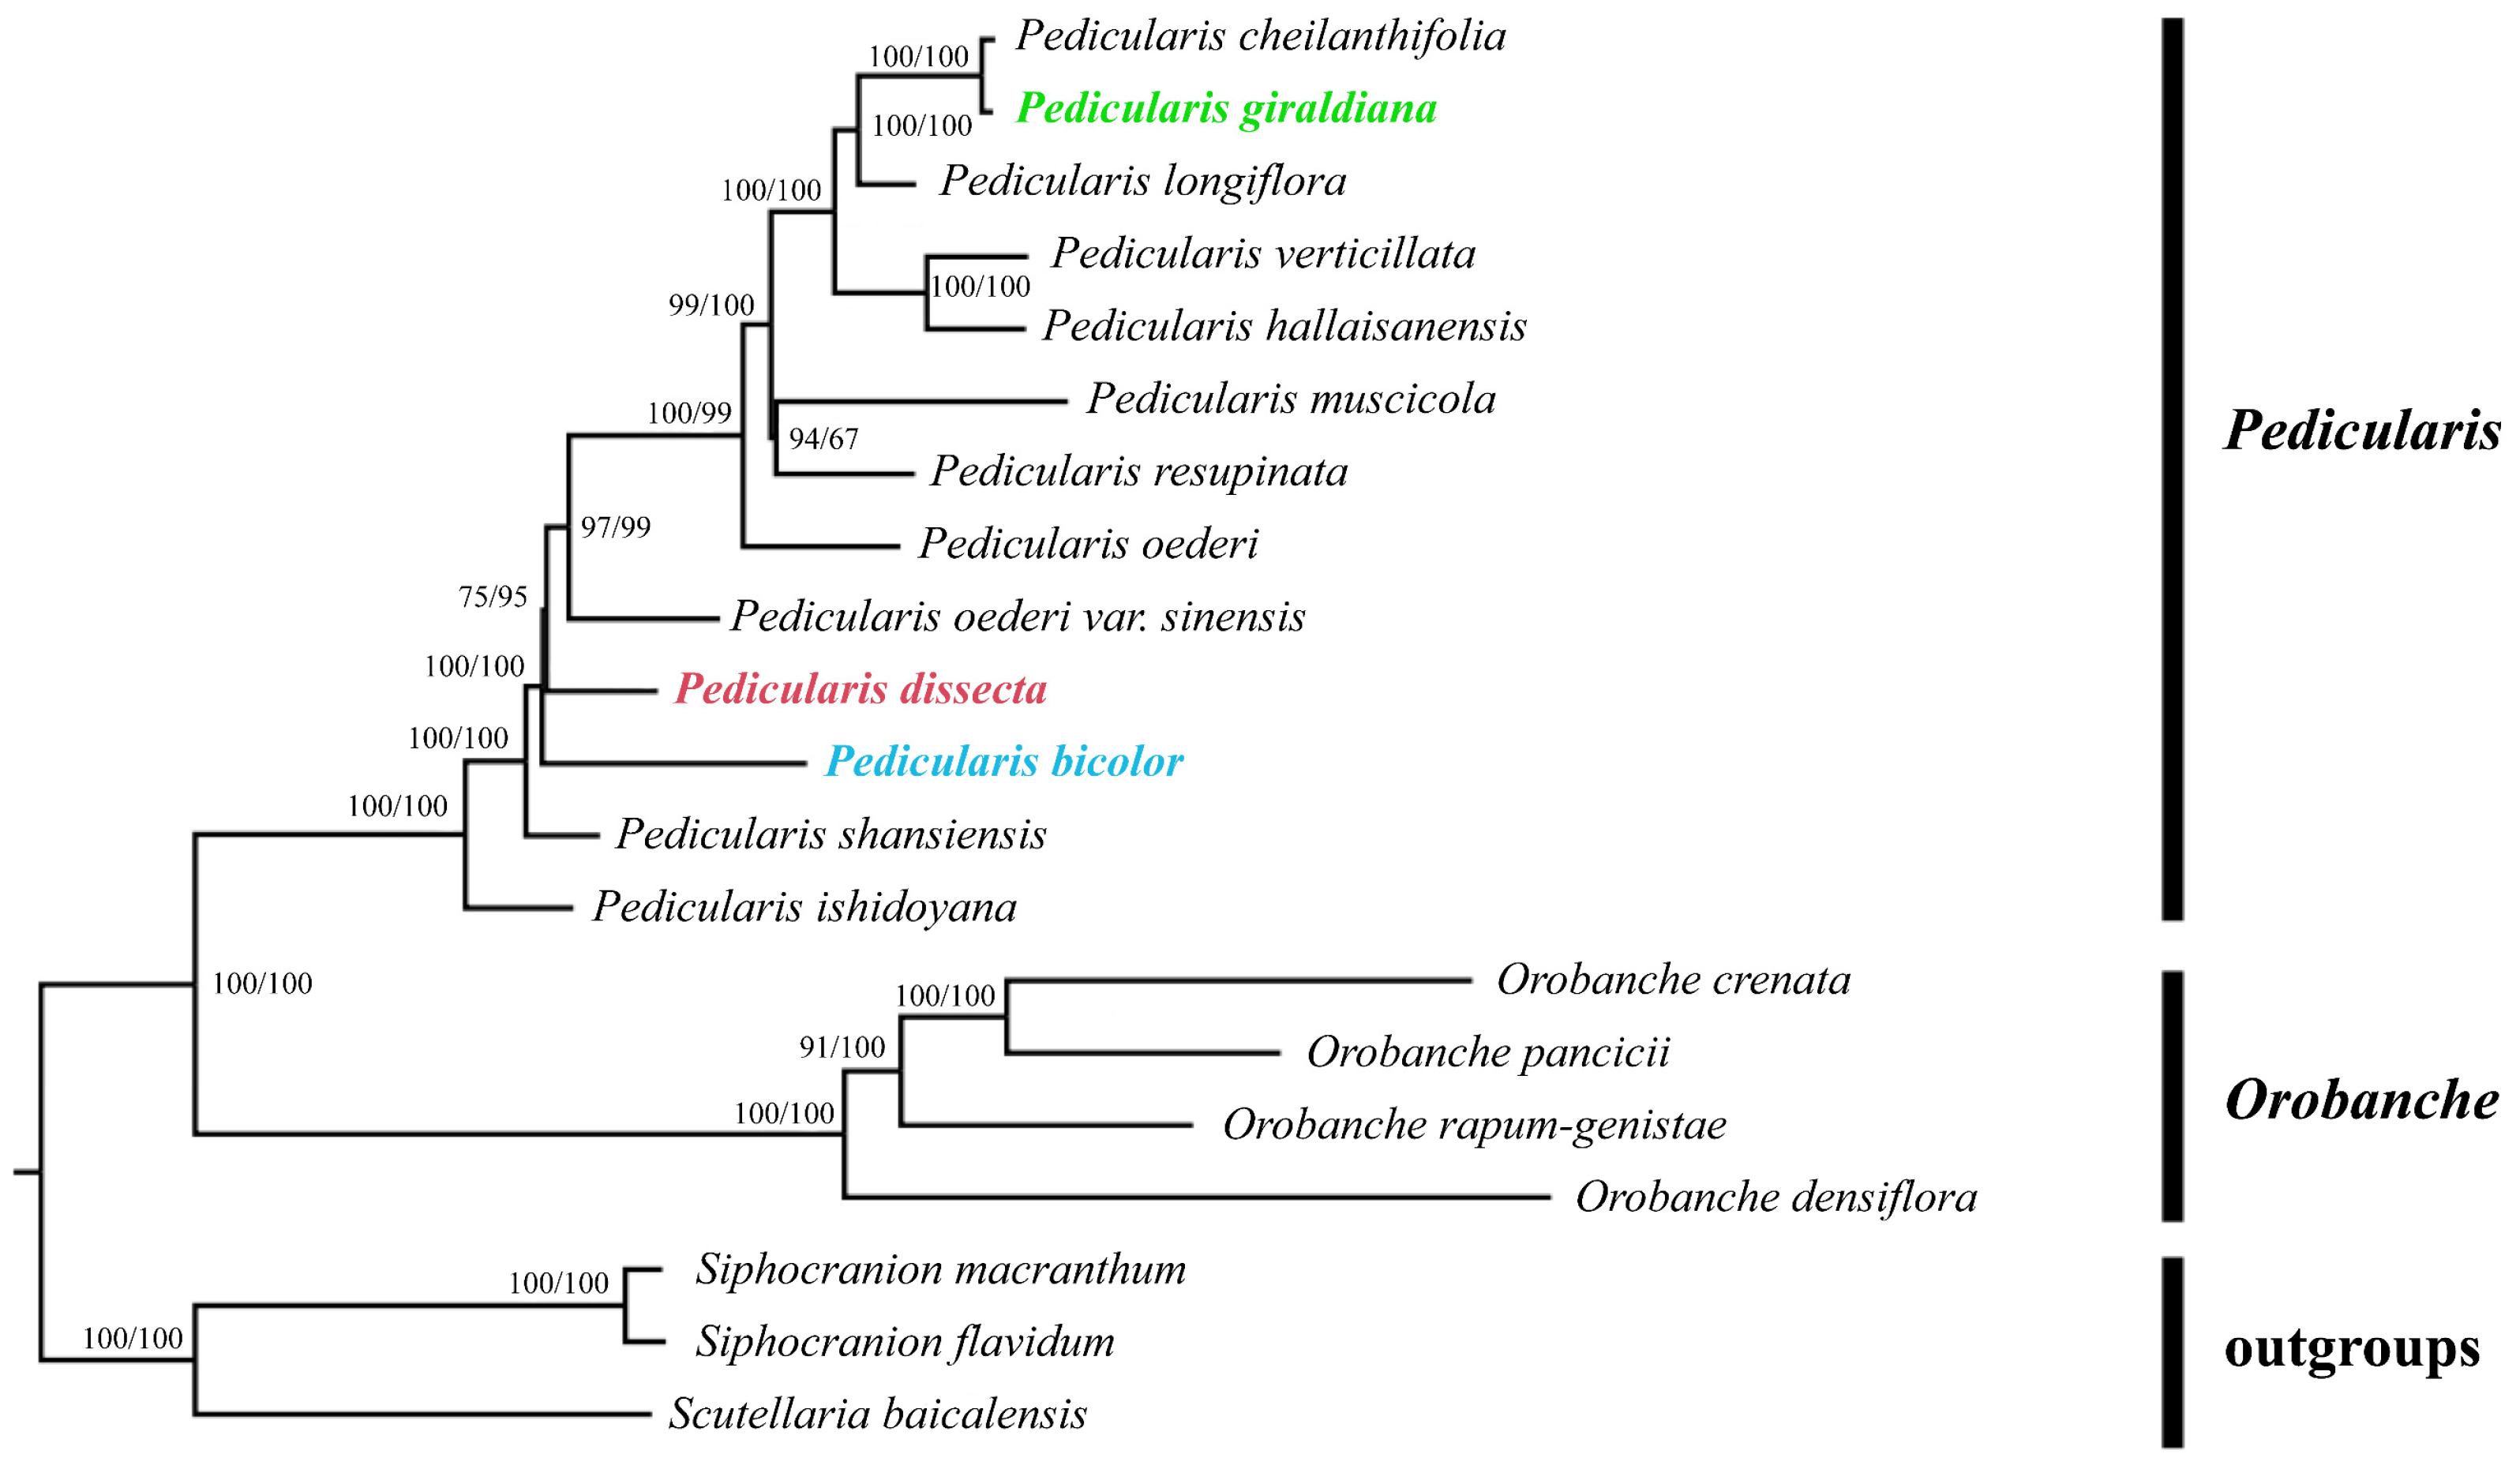
2.1. Phylogenetic Relationship

The phylogenetic relationship of Pedicularis species was reconstructed based on maximum likelihood (ML) and maximum parsimony (MP) analyses using the chloroplast genomes of seventeen Orobanchaceae and three Lamiaceae species. Overall, the topologies obtained using different methods (ML and MP analyses) were almost identical. It was shown that all examined Orobanchaceae species formed a monophyletic evolutionary clade with high bootstrap support (Figure 1). Within this major evolutionary clade, Pedicularis and Orobanche were found to cluster sister relationships. Each of the two clades formed a monophyletic branch with a 100% bootstrap value, respectively. P. dissecta and P. bicolor are both nested branches within Pedicularis; they have high support and are nested within the larger Pedicularis evolutionary branch. Pedicularis cheilanthifolia Schrenk and P. giraldiana are grouped together in a single branch with strong support from bootstrap values.

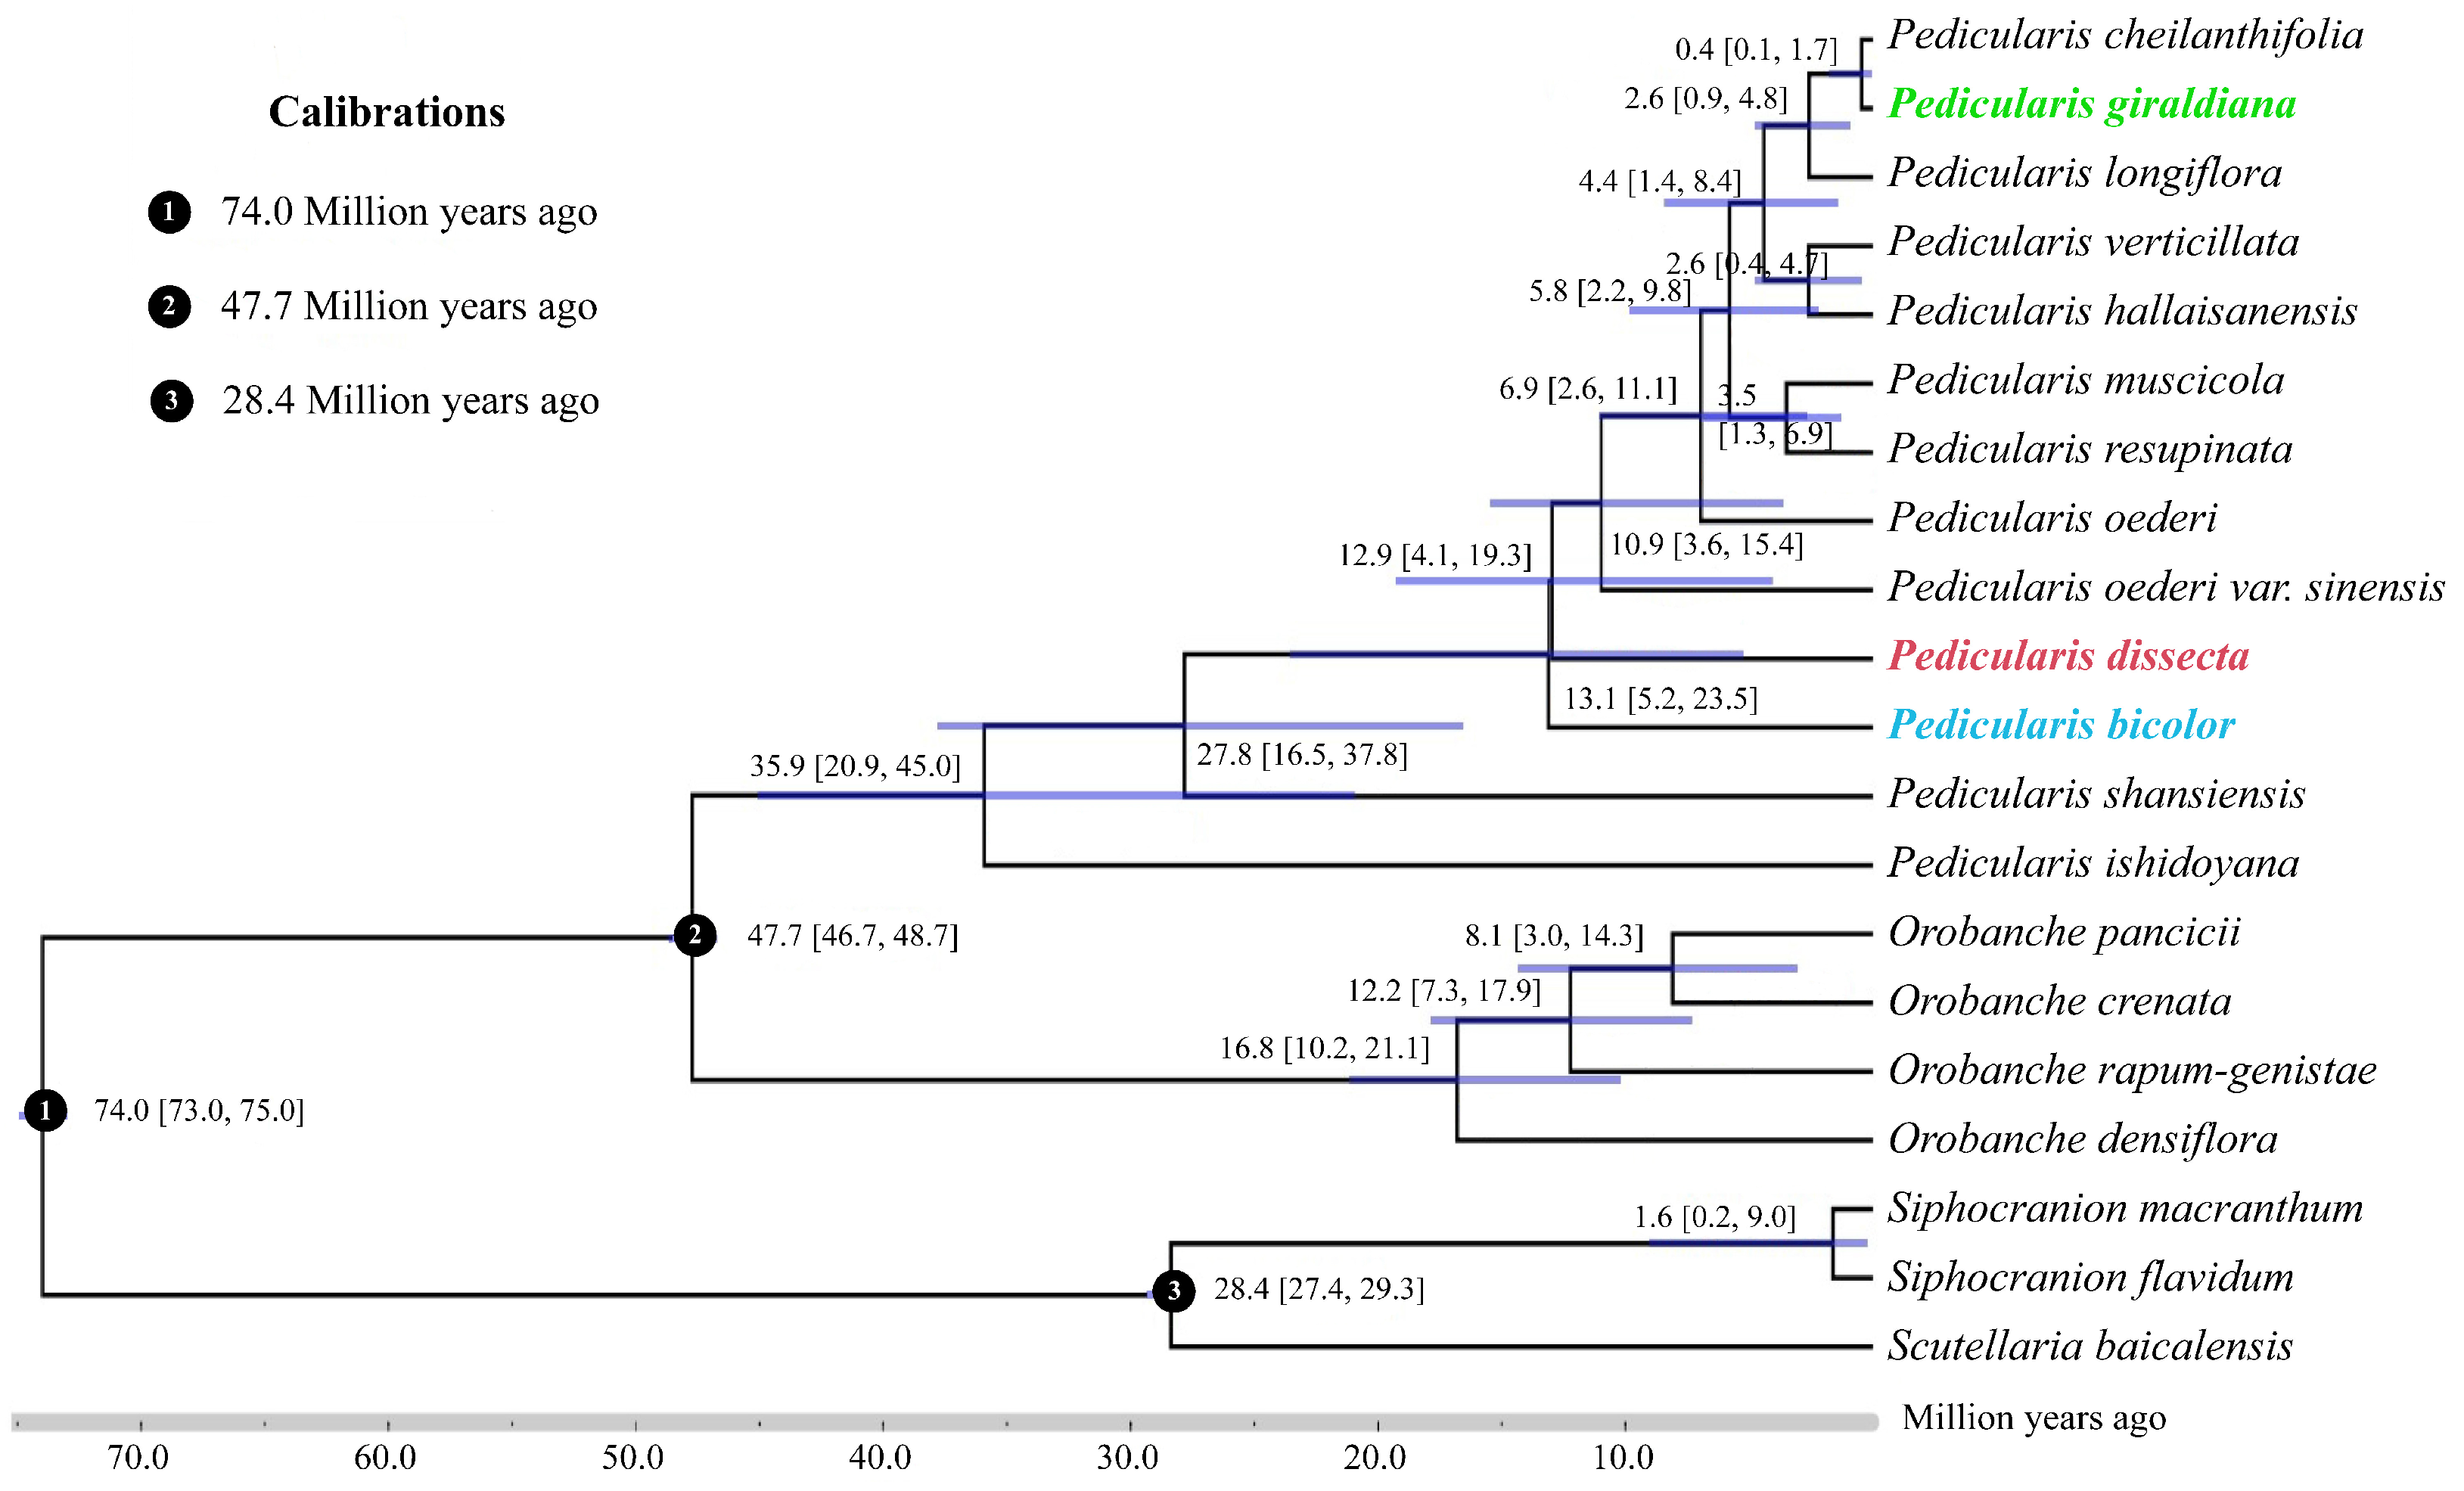
2.2. Divergence Time Estimation

Based on the chloroplast genomes, the divergence time estimation indicated that the two large clades, Pedicularis and Orobanche, diverged approximately 47.7 million years ago (Figure 2). According to the results, the crown age of the diversification of Pedicularis was estimated to be around 35.9 Ma (95% highest posterior density, HPD: 20.9–45.0 Ma). The two sister species in the genus Pedicularis comprising P. giraldiana and P. cheilanthifolia diverged by about 0.4 Ma (95% HPD: 0.1–1.7 Ma). The crown ages of P. bicolor and P. dissecta took place at approximately 13.1 Ma (95% HPD: 5.2–23.5 Ma) and 12.9 Ma (95% HPD: 4.1–19.3 Ma), respectively.

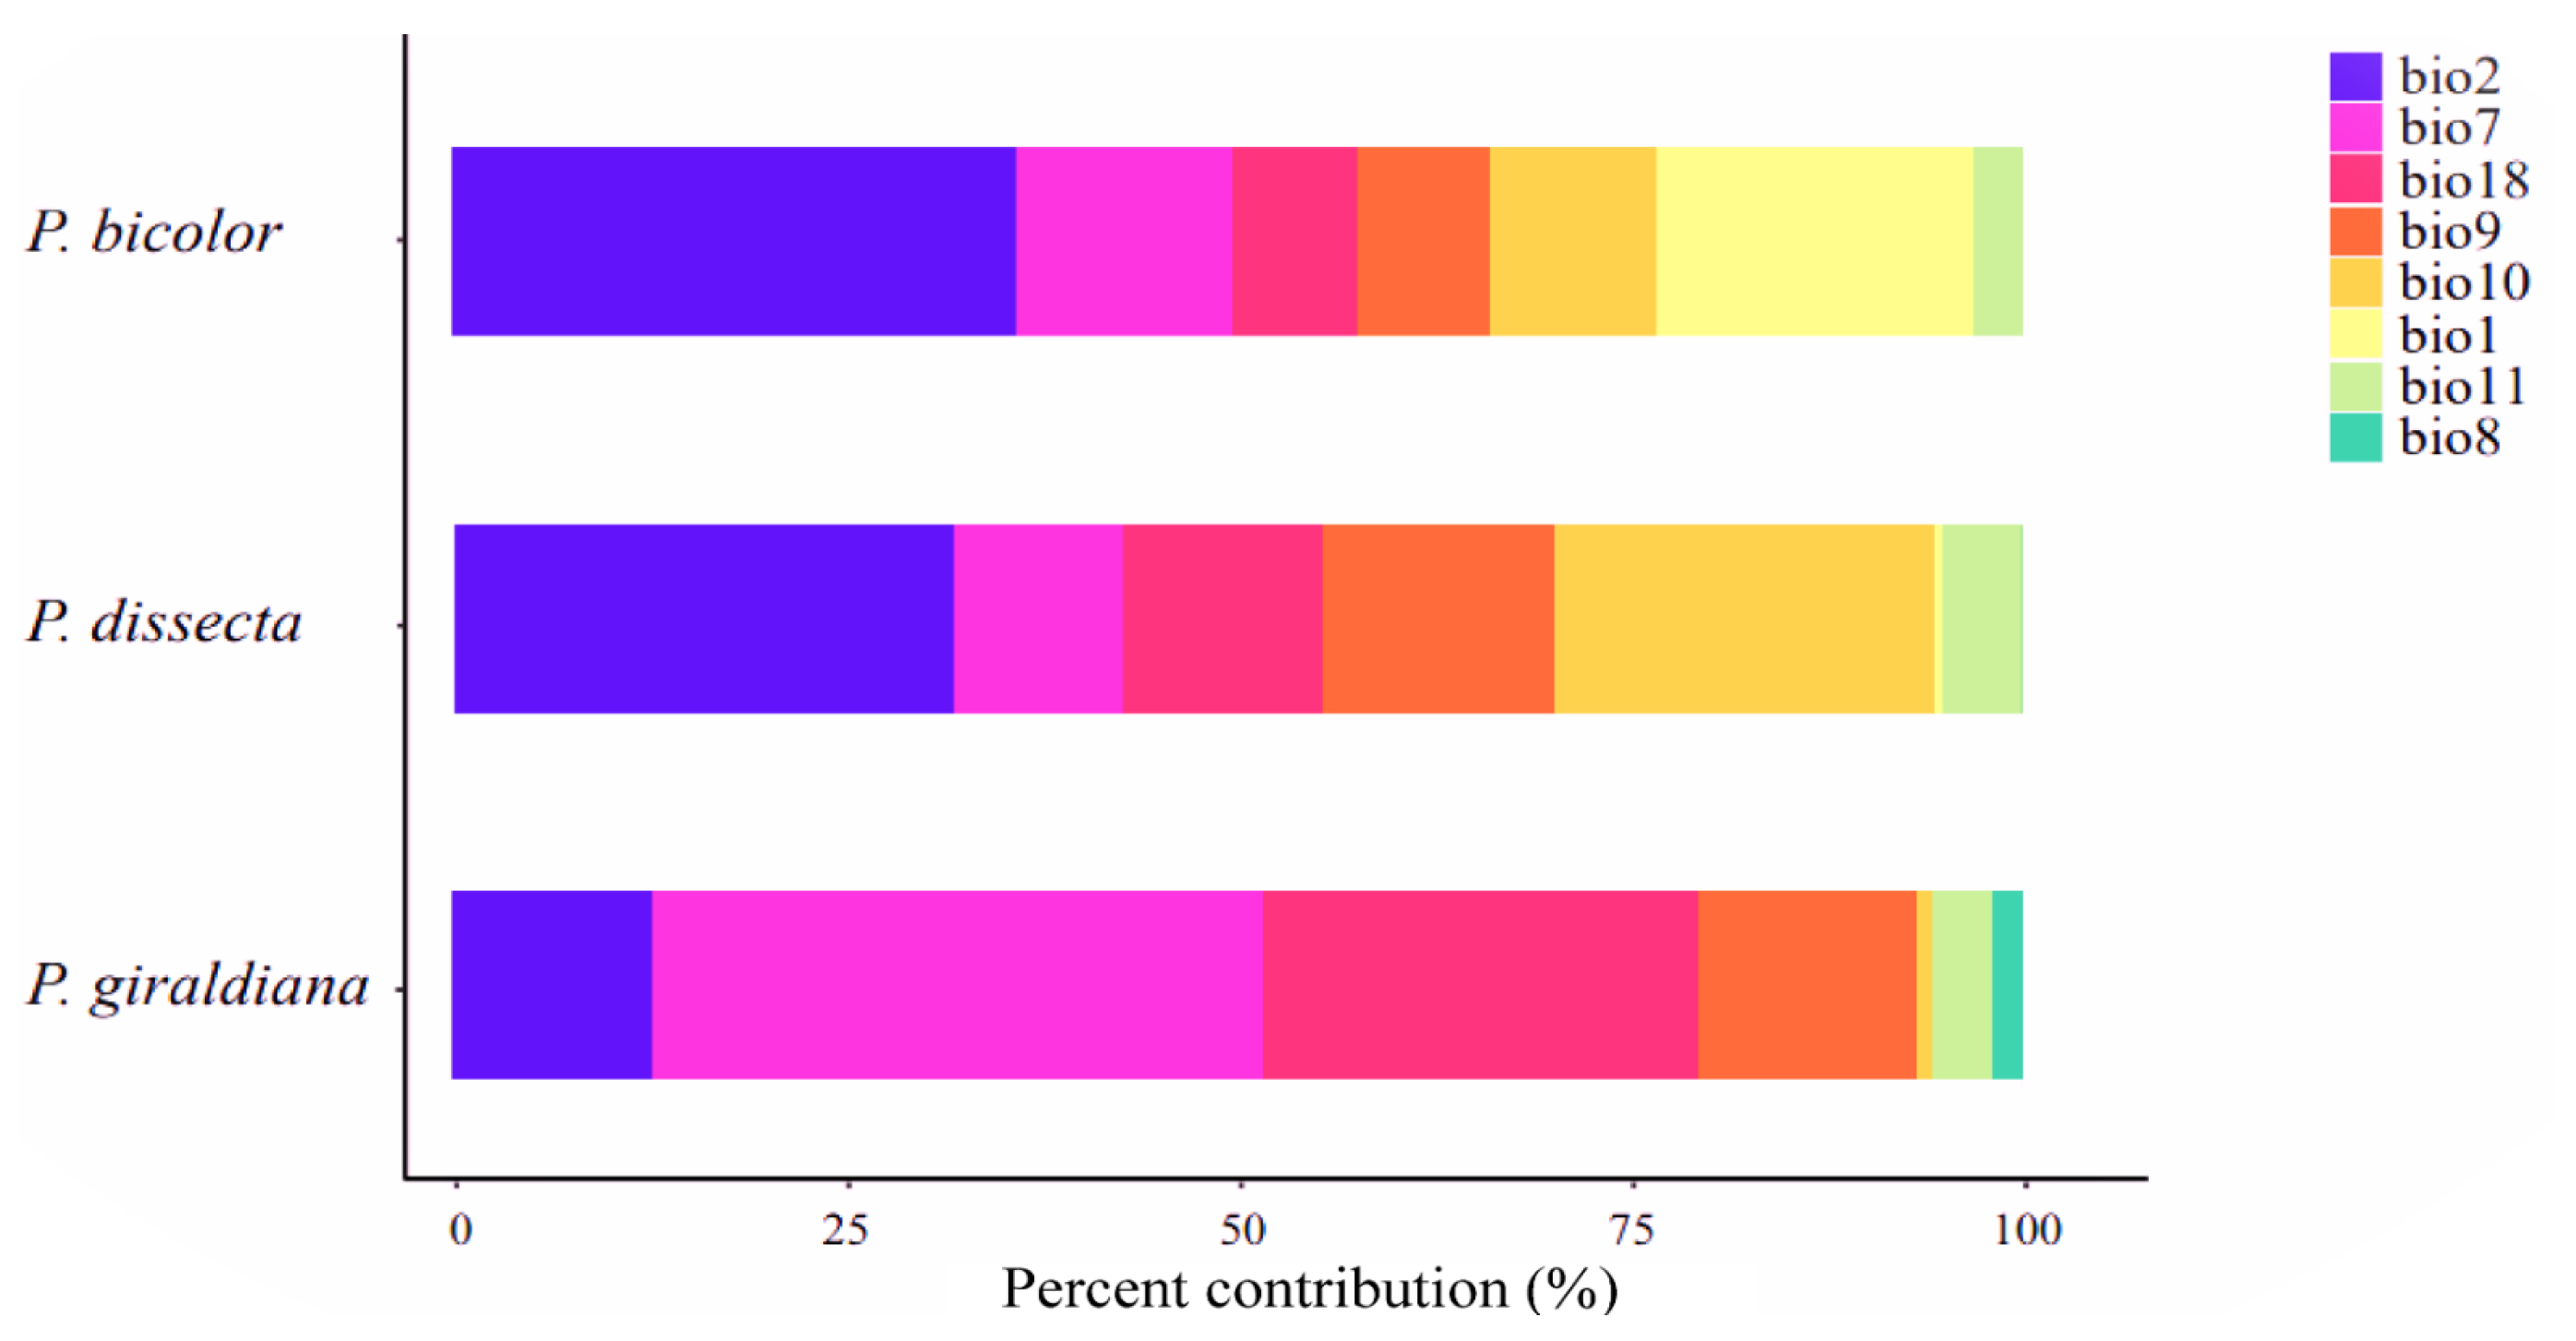
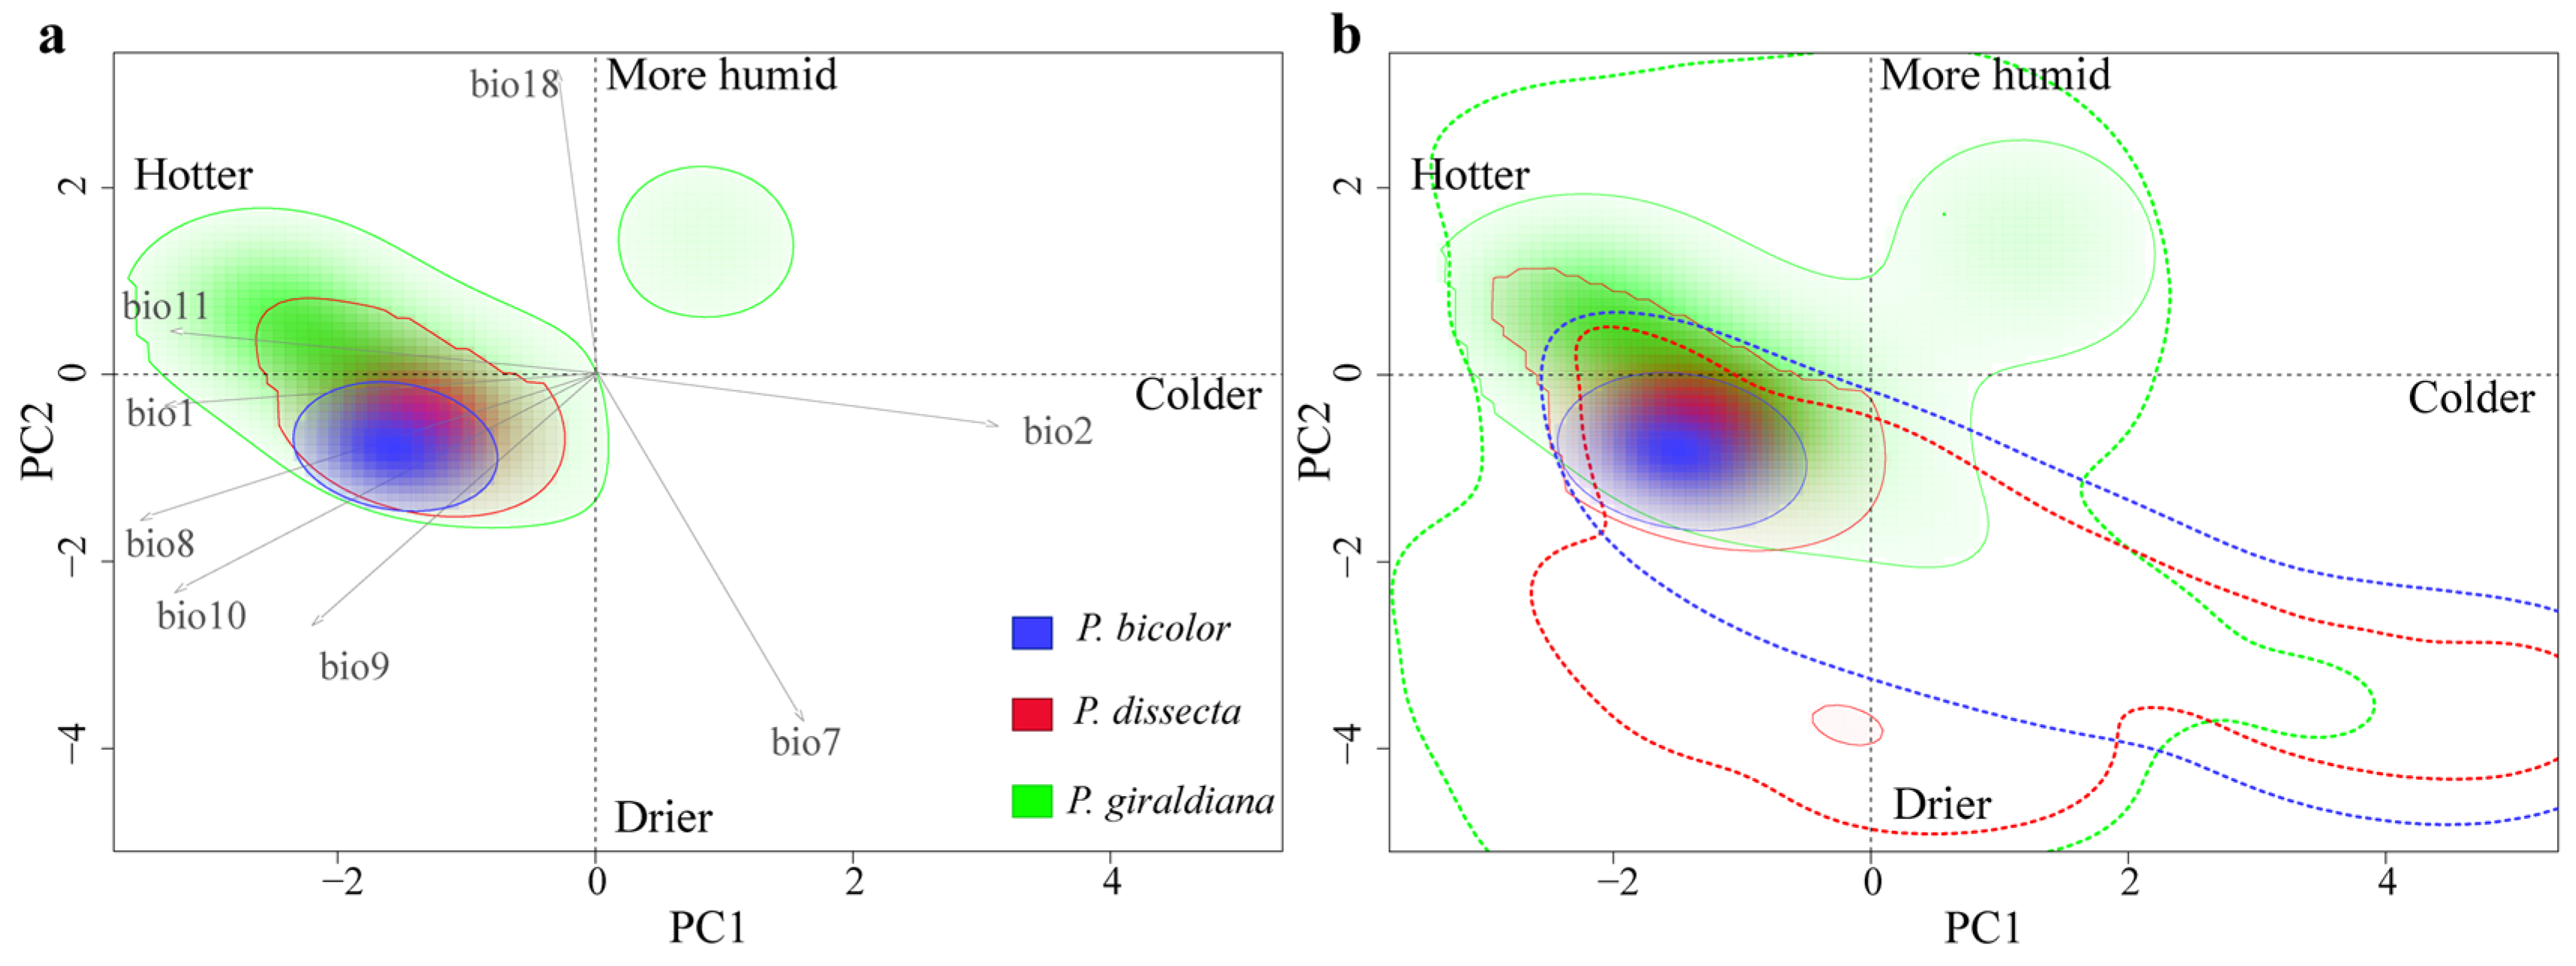
2.3. Environmental Variables Analysis

By correlating the factors and geographical data and combining the contribution amounts, eight climatic variables, including annual mean temperature (bio1), mean diurnal range (bio2), temperature annual range (bio7), mean temperature of the wettest quarter (bio8), mean temperature of the driest quarter (bio9), mean temperature of the warmest quarter (bio10), mean temperature of the coldest quarter (bio11), and precipitation of the warmest quarter (bio18), were finally selected for modeling in this study (Figure 3). The current potential distribution of P. bicolor is attributed to the bio1, bio2, and bio7 variables, which account for 20.3%, 35.9%, and 13.8%, respectively, resulting in a cumulative contribution percentage of over 60%. The three most significant contributors to the currently suitable habitats of P. dissecta are bio2, bio9, and bio10, accounting for 32%, 14.7%, and 24.3%, respectively, and representing 71% of the total. The contribution variables of P. giraldiana are bio2, bio7, and bio18, accounting for 37.9%, 13.9%, and 27.8%, respectively. These three environmental factors accounted for more than 70% of the total. In summary, the range of diurnal and annual temperature changes plays a crucial role in influencing the geographic distributions of three Pedicularis species.

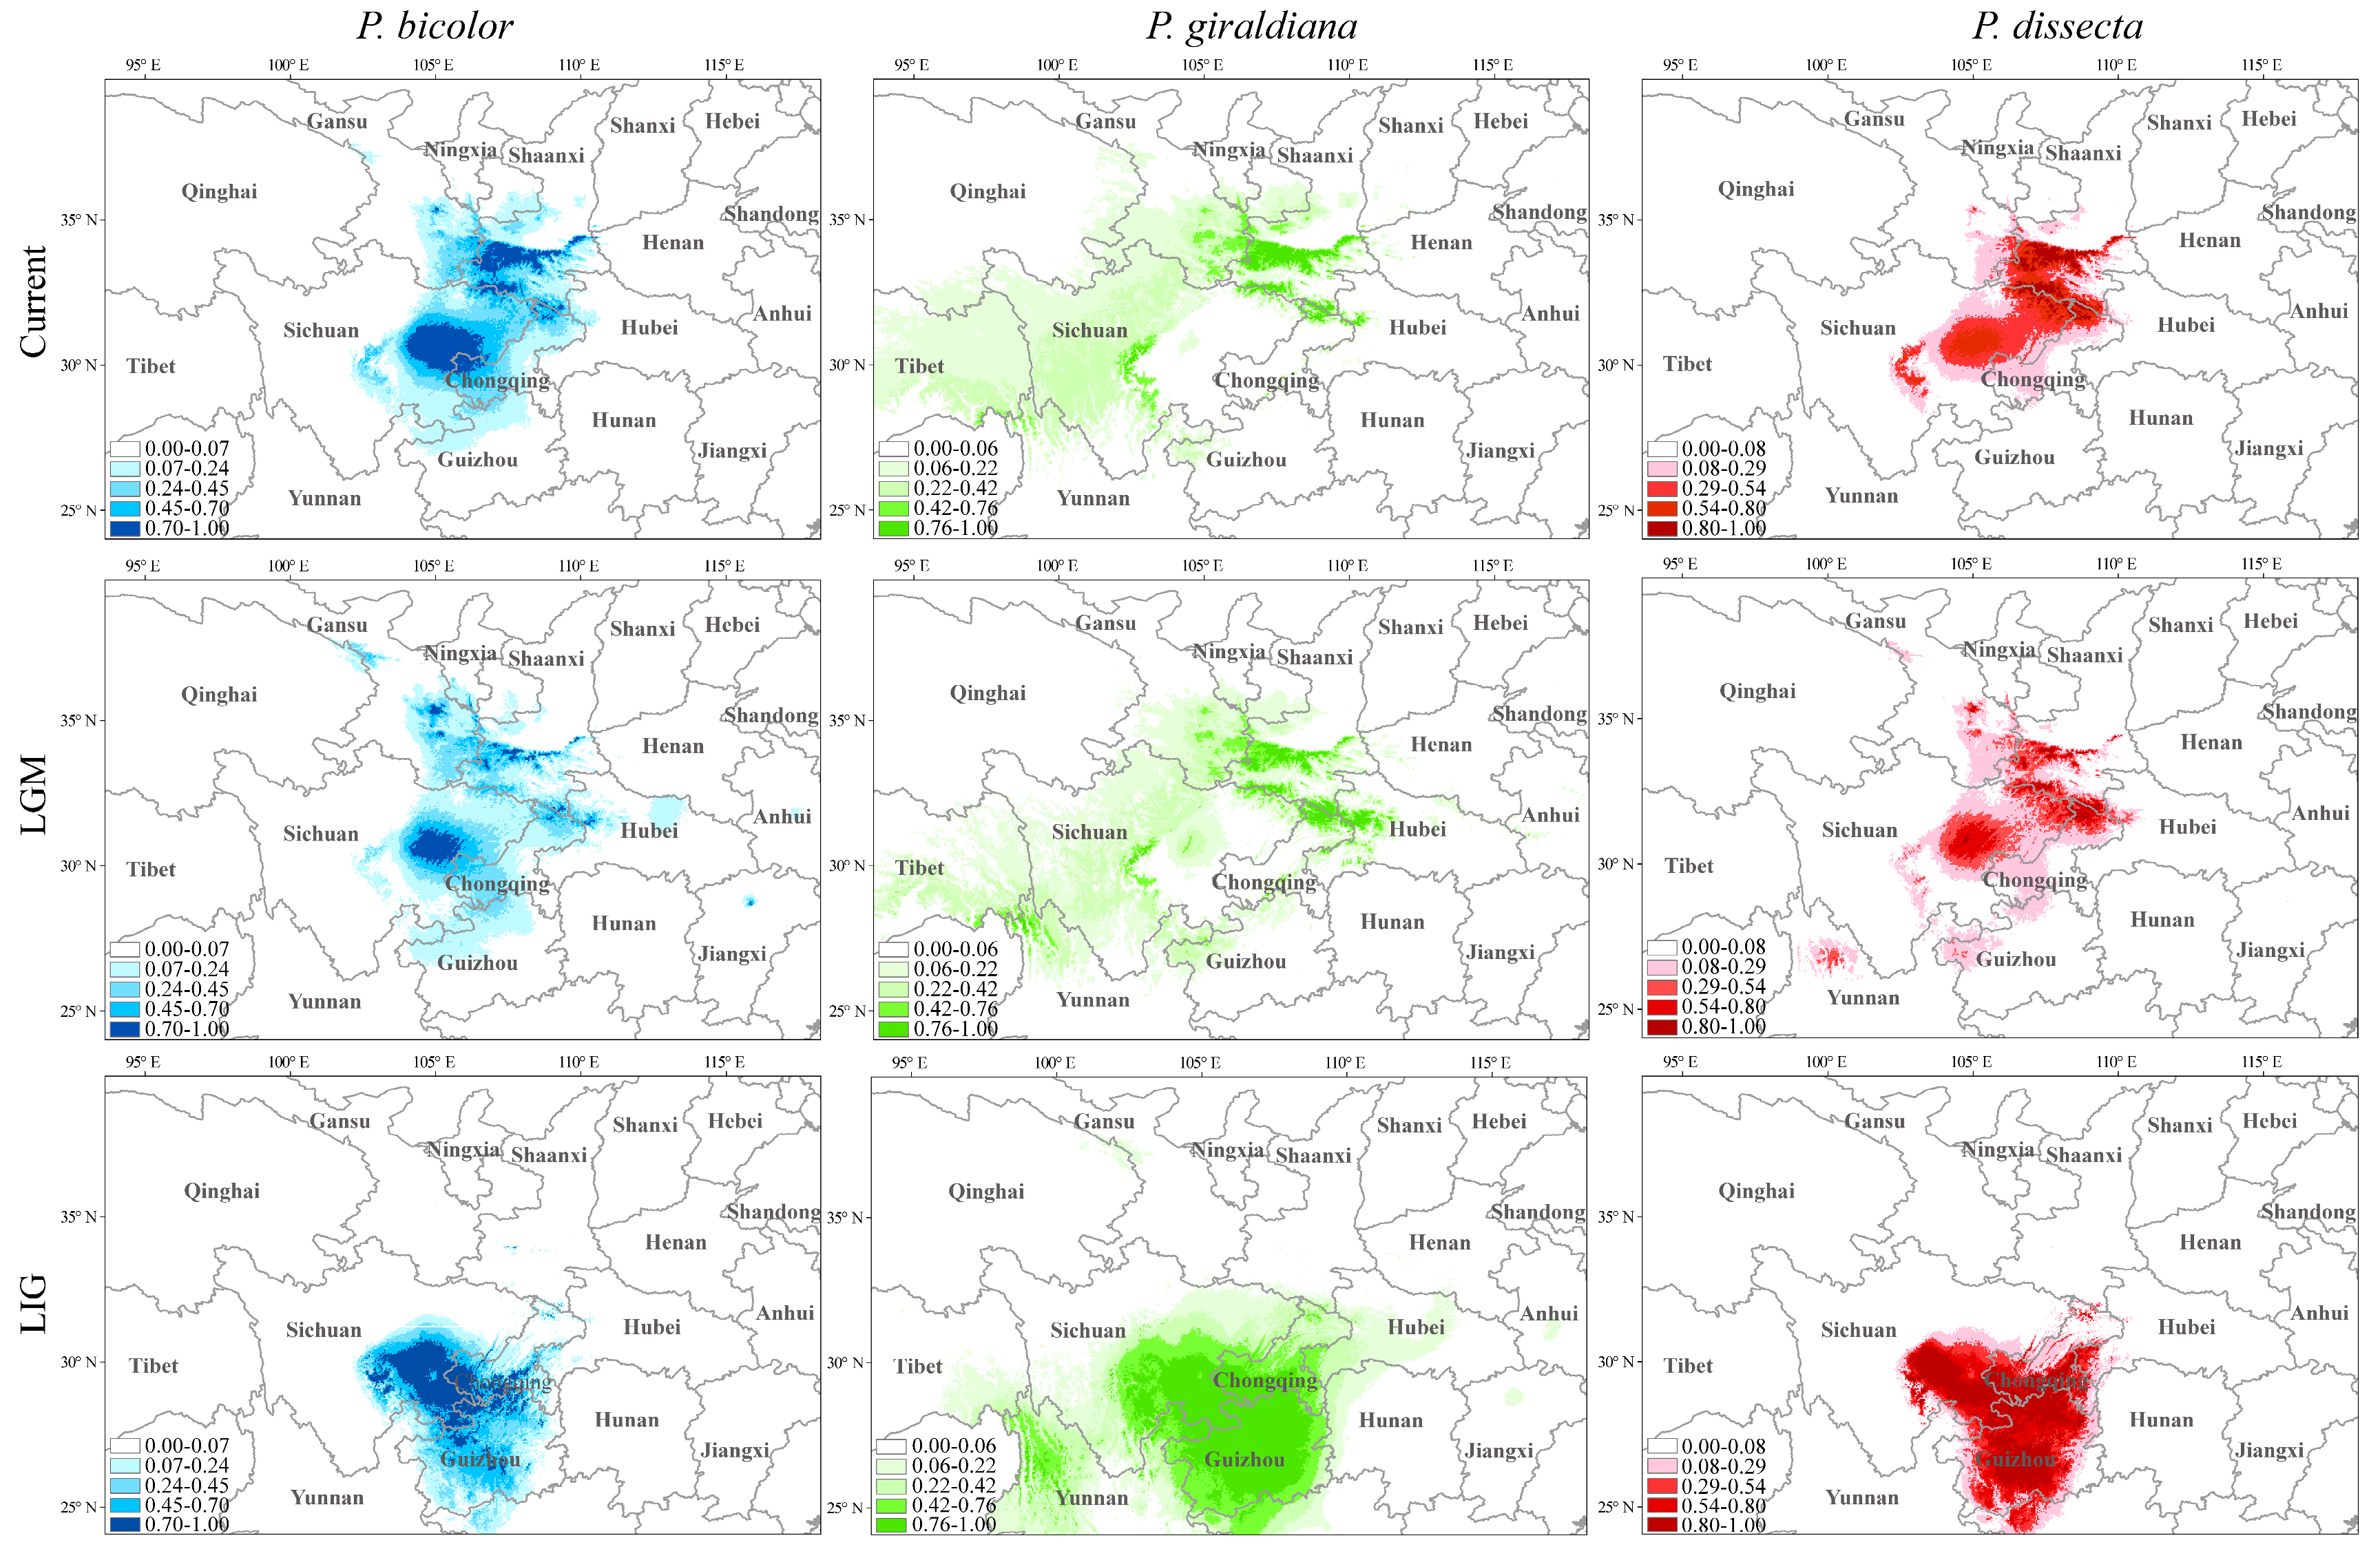
2.4. Dynamic Changes in Geographic Distribution from the Past to the Future

Based on the effective specimen site information, the ecological niche model was used to simulate the past, current, and future niche distributions of three Pedicularis species. The areas under curve (AUC) values of each species model test above 0.90, indicating that the prediction results of the potential distribution area of the species were credible. During the LIG, the three Pedicularis species occurred, mainly in southwest China (eastern Sichuan, southern Chongqing, Guizhou, and northern Guangxi) (Figure 4). In contrast to the LIG period, the potential distributional ranges of three Pedicularis species shrank to Shaanxi, Sichuan, and southeastern Gansu province during the last glacial maximum (LGM) period. From the LGM to the current period, the suitable habitat of three Pedicularis species has rapidly increased. It appeared that each species gradually migrated northward from the LIG to the current period.
The results of the future distributions (2070s) showed a significant reduction in suitable habitats for three Pedicularis species compared to the present times, especially highly suitable habitats, which will shrink to southern Shaanxi under the representative concentration pathway 2.6 (RCP 2.6) scenario. Additionally, it is worth noting that the distributional ranges of suitable habitats for P. bicolor and P. dissecta will decrease significantly from 2050 to 2070 under the RCP8.5 scenario (Figure S3).

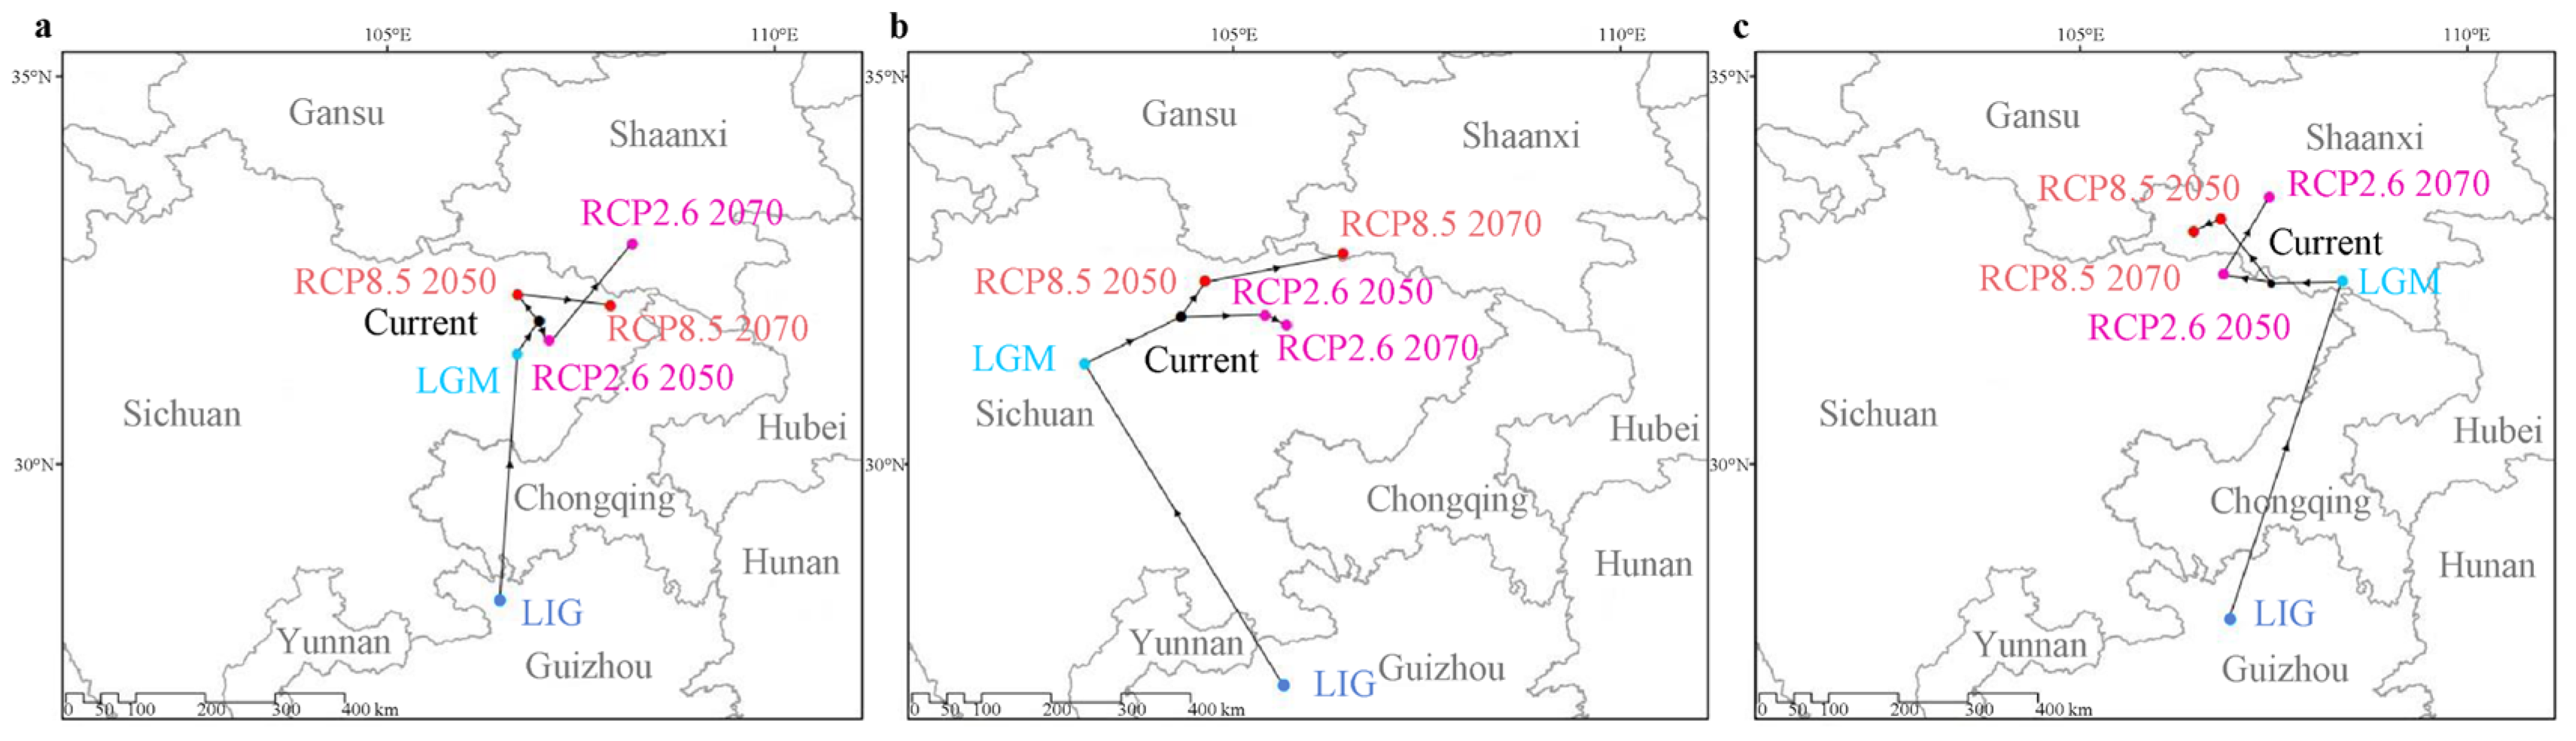
2.5. Migration Trends Based on the Centroid of Suitable Habitats
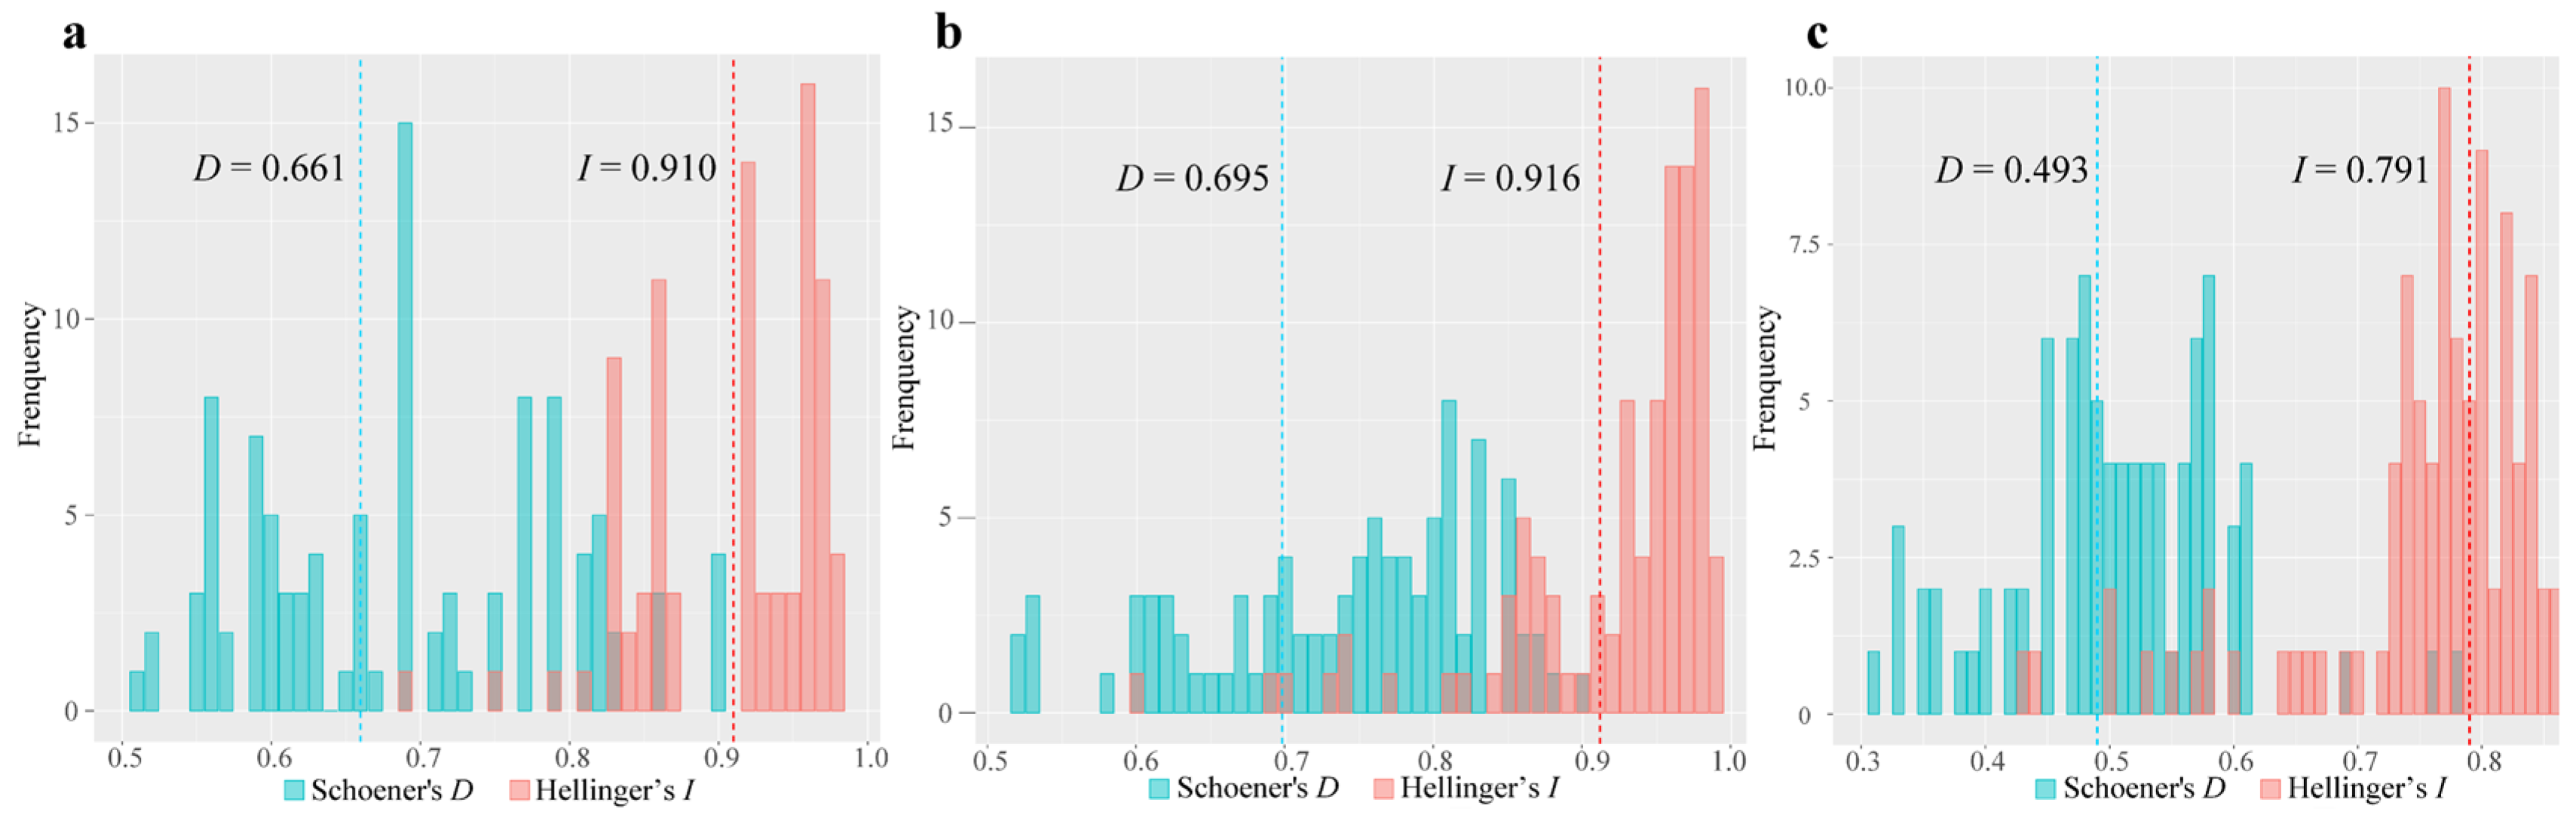
Under various climatic scenarios, the centroid of each species is predicted to migrate from the south (northern Guizhou) to the north of China (northern Sichuan and southern Shaanxi) (Figure 5). For instance, it was shown that the three Pedicularis species had undergone a northward migration from the LIG to LGM periods; while the two species of P. bicolor and P. dissecta have shifted to the northeast of China, the geographic ranges of P. giraldiana moved to the northwest of China. Under the RCP2.6 scenario, P. bicolor and P. dissecta initially migrated southeast and northwest of China for a short distance, respectively, and then both of them migrated northeast of China in 2070. In the RCP8.5 scenario, all three species will eventually migrate to the east or northeast of China over time.

2.6. Niche Analysis

In the niche comparison analysis, the first two axes explained 88.9% of the total variation of climatic conditions for the Pedicularis species ranges (PC1 = 70.3%, PC2 = 18.6%) (Figure 6). The multiple niche plot illustrating the 20% of occurrence density showed that the realized niche of P. bicolor and P. dissecta were the most closely related, whereas P. giraldiana was the most widely realized niche and contained both P. bicolor and P. dissecta. When 100% of the occurrence density was plotted in environmental space, a high degree of climatic spatial overlap was detected between the ranges. All pairwise ecological niche modeling comparisons produced high values for Hellinger’s I and Schoener’s D and displayed high degrees of geographic overlap (Figure 7).
Moreover, P. giraldiana showed a highest niche breadth, covering almost all climatic niche spaces of P. dissecta and P. bicolor. In the two multiple niche PCA-env plots, it is evidenced that P. bicolor had the smallest niche breadth compared to the other species. Additionally, P. bicolor and P. dissecta occupied the drier and colder climatic niches, while P. giraldiana occupied a warmer and wetter niche.
A pairwise comparison of the climatic niches of three species of Pedicularis showed that P. bicolor and P. giraldiana have the lowest environmental niche overlap, while P. dissecta and P. bicolor have the highest niche overlap. The climatic niche classification results indicated that the “Unfilling” ecological niche accounted for 0–0.126, the “Stability” niche accounted for 0.276–0.624, and the “Expansion” niche accounted for 0.376–0.724 (Table 1).

3. Discussion

3.1. Evolutionary Relationships

In recent years, an increasing number of studies have used chloroplast genome data for species phylogeny and interspecific differentiation studies to explore the origin and evolution of species [25]. The frequent parallel or convergent evolution of characters of corollas has resulted in the difficulties of the genus Pedicularis classification [26]. Traditionally, Pedicularis was placed in the Scrophulariaceae, but molecular evidence showed that this genus has been shifted to Orobanchaceae and found to be polyphyletic [27,28,29]. Furthermore, there was little consensus between the phylogenetic tree and conventional classification in Pedicularis [30]. Yu et al. (2015) constructed a backbone phylogeny of Pedicularis, with extensive species sampling from the Himalaya–Hengduan Mountains, using sequences of the nuclear ribosomal internal transcribed spacer (nrITS) and three plastid regions (matK, rbcL, and trnL-F) [31]. Liu et al. (2022) reconstructed evolutionary relationships of the Pedicularis siphonantha Don complex using nrITS and four plastid DNA loci (matK, rbcL, trnH-psbA, and trnL-F) to resolve taxonomic confusion [32].
Our results showed that two major evolutionary clades were identified comprising Pedicularis and Orobanche with high bootstrap values (Figure 1). In the first major clade, P. giraldiana was placed as a sister to P. cheilanthifolia with high bootstrap value support. The lack of consensus between the phylogenetic tree and previous studies may be explained by the small sample size of Pedicularis species in previous studies. In agreement with previous studies, Pedicularis verticillata L. and Pedicularis hallaisanensis Hurus. have clustered the sister evolutionary clades [33]. Another phylogenetic study showed that Pedicularis species clustered together and Pedicularis shansiensis P. C. Tsoong and P. dissecta formed a clade based on complete chloroplast genomes [34]. Additionally, some studies showed that P. dissecta and P. bicolor were more closely related to P. shansiensis. However, our study suggested that these two species formed nested relationships, possibly due to the differences in DNA molecular markers used in different studies. The intrageneric phylogenetic relationships of many studies were less consistent based on the different molecular markers, presumably related to pseudogenization and gene loss (accD and ccsA) in Pedicularis species [35]. In addition, Yang et al. (2007) detected an unusually high sequence divergence among congeners in a comparatively small geographical range, as well as frequent large deletions in the cpDNA trnT-trnF region of Pedicularis species [36]. To verify species relationships and interspecific divergence in Pedicularis, it will be crucial to collect more species samples in future research.

3.2. Species Divergence

It is well known that dated phylogeny is essential for the comprehension of speciation processes [37]. Our molecular dating results suggested that the crown age of the diversification of Pedicularis species was estimated to be around 35.9 Ma (Figure 2). This result was consistent with a recent study and was supported by the earliest pollen fossil record of Pedicularis from the Eocene in China [20,35,36,37,38,39,40,41]. According to our molecular dating analysis, P. dissecta and P. bicolor may have occurred during the late Miocene (approximately 13.1 Ma and 12.9 Ma, respectively). This timing is closely associated with the onset of a new period of tectonic thermal activity and uneven vertical uplift in the Qinling Mountains since the Miocene [12,42], which might have played crucial roles in the divergence of P. dissecta and P. bicolor.
Interestingly, the divergence of P. giraldiana and P. cheilanthifolia was dated approximately 0.4 Ma by secondary calibration. Yuan et al. (2011) have also investigated the population divergence of Paeonia rockii, a species endemic to the Qinling Mountains and the adjacent area, using cpDNA sequences [15]. The results showed that species divergence (0.4 to 1.6 Ma) was concurrent with the time scale of the latest rapid uplifts of the Qinling Mountains during the Pleistocene (approximately 0.7 Ma) [43,44]. Previous studies have shown that the diversification of Pedicularis cyathophylloides Limpr. during the middle Quaternary (0.4–2.5 Ma) was estimated by LFY-L nuclear genes [20]. Additionally, it was discovered that the section Cyathophora of Pedicularis, which was only found in the Sino–Himalayan regions, formed a well-supported monophyletic group. The species divergence of this section was largely associated with mountain uplifts and geological oscillations [36]. In summary, in order to further verify the affinities between species, more reliable fossils are required for phylogenetic studies, and data from multiple species samples are also necessary to elucidate the interspecific differentiation of Pedicularis species.

3.3. Population Dynamics Changes

The results of our study indicated that the main suitable habitat of Pedicularis is currently located in the Qinling Mountains and adjacent areas. Meanwhile, P. bicolor and P. dissecta have occurred mainly in eastern Sichuan, Guizhou, and Guangxi during the LIG. In addition, the geographic areas of P. giraldiana were also largely distributed in the Yunnan–Guizhou plateau, as previously studied by the transition patterns of the genus Notopterygium species [45]. The ENM revealed that three Pedicularis species reduced their geographic ranges to the Qinling Mountains and surrounding areas from the LIG to LGM, which coincided with the cooling climate [46,47]. Some other studies also showed that the geological and climatic changes have profoundly affected the geographic distributions and species shifts in the Qinling Mountains and adjacent areas. For example, Jiang et al. (2023) used species distribution modeling to investigate the geographic range changes of an endangered herb Primula filchnerae R. Knuth in the Qinling Mountains, and they found that the species range would migrate to the north of China in the future climatic scenario [48]. Meanwhile, Zhao et al. (2023) detected the geographic changes of a shrub species Bashania fargesii (E. G. Camus) P. C. Keng and T. P. Yi in the Qinling Mountains, and the authors have also concluded that the species would migrate to the north of China in the future [49]. Additionally, Zhao et al. (2016) detected the geographic shifts of an endangered alpine tree species Larix chinensis Beissn. on Taibai Mountain in the Qinling Mountains based on Maxent models, and the authors revealed that the suitable species habitat would move to higher elevations in the future [50].
The main climatic contributions of Pedicularis also demonstrated that temperature has a greater effect on the geographic distributions than the precipitation variable (Figure 6). The range shift remains comparatively stable after the glacial periods when the climate was sufficiently warm. When combined with the results of centroid changes, it was clear that three Pedicularis species migrated northward during the Quaternary (Figure 5). Generally, climate warming causes the distribution area of many plant species to shift northward in the Northern Hemisphere [51]. This pattern has also been observed in other plants, such as Roscoea humeana Balf. f. and W. W. Sm. [52], Panax notoginseng (Burkill) F. H. Chen ex C. H. Chow [53], and Ziziphus jujuba Mill. [54].

3.4. Climatic Niche Comparisons

Under the combined effects of orogenesis and climate changes, species formation and ecological niche differentiation are promoted [55]. The interplay of topographic uplift and climate change in the Himalaya–Hengduan Mountains played a key role in speciation and differentiation during the Quaternary [6]. For example, ecological speciation was demonstrated in two parapatric sister species, Roscoea cautleoides Gagnep. and R. humeana [56]. Additionally, the heat energy and water in Pinus yunnanensis Franch. in the mountain areas promoted intraspecific genetic divergence [57].
Our niche analysis of the environment variables suggested that the three species of Pedicularis might have occupied analogous climate niches, with some niche overlaps according to simulations with a 20% occurrence rate (Figure 6). Furthermore, P. bicolor and P. dissecta inhabited the drier and colder climatic niches, while P. giraldiana occupies a hotter and more humid ecological niche, which echoes the previous analysis of the contribution of ecological factors (Figure 3). Additionally, ecological factors, such as temperature and precipitation seasonality, have a significant impact on phenology, including flowering time and growing season [58]. Phenology may have caused gene flow and/or genetic exchange between populations, resulting in population differentiation [59]. Therefore, further research needs to combine population genetic data and environmental selection variables, which have important implications for genetic differentiation and origin between lineages or species, so as to better protect biodiversity in the context of global climate change.

4. Materials and Methods

4.1. Plant Materials, DNA Extraction, and Genome Assembly

The leaves of P. bicolor and P. giraldiana were collected from the Qinling Mountains (108°47′10.13″ N, 33°51′27.78″ E and 107°46′23.19″ N, 33°58′9.58″ E, respectively). The vouchers of plant materials were deposited in the herbarium of Northwest University (Xi’an, China). Total genomic DNA was extracted from silica-dried leaves using a modified cetyltrimethylammonium bromide (CTAB) protocol [60].
Paired-end libraries with a 500 bp insert size were constructed and PE150 sequencing was performed on the Illumina HiSeq 2500 platform. GetOrganelle v1.7.0 was used to assemble the chloroplast genomes [61]. The final assembly graph was visualized using Bandage v0.8.1 to authenticate the automatically generated chloroplast genome [62]. The chloroplast genomes were annotated by PGA v1.0 [63] and then manually revised using Geneious v8.1 [64]. The chloroplast genomes of P. bicolor and P. giraldiana were deposited in GenBank (accession numbers PP439988 and PP439989, respectively). In addition, the chloroplast genome sequence of P. dissecta with accession number NC_056312 in the National Center for Biotechnology Information (NCBI) database was downloaded for subsequent analyses.

4.2. Phylogenetic Analysis and Divergence Time Estimation

We constructed a phylogenetic tree to determine the evolutionary relationships of three Pedicularis species using eighteen complete chloroplast genome sequences from the NCBI database (Table S1). The general time reversible (GTR) + gamma model was selected based on jmodeltest v2.1.10 tests [65]. The maximum likelihood (ML) analysis was performed using RAxML v8.1.17 with Lamiaceae as the outgroup and 1000 bootstraps [66]. Maximum parsimony (MP) analysis was conducted in PAUP* v4.0 software according to a heuristic search and the tree bisection–reconnection (TBR) branch swapping option [67]. The robustness of inferences was assessed by bootstrap resampling 1000 random replicates.
In addition, BEAST v2.4.5 was used to estimate the node ages and topological structures for Pedicularis species [68]. Referring to a previous study, the crown age of Lamiales and Orobanchaceae was dated at 74 Ma and 47.7 Ma, respectively [38,39]. The earliest fossil records of Lamiaceae date back to the early–middle Oligocene around about 28.4 Ma [40]. We applied a GTR model for nucleotide substitution and the “yule process” prior model with three calibration points. The divergence time was estimated by Markov chain Monte Carlo analysis for 50,000,000 generations. TRACER v1.5 was used to analyze the output files to determine whether the effective sample sizes of all parameters were larger than 200. Chronograms with nodal heights and 95% highest posterior density intervals were generated with TreeAnotator v1.7.5 (the first 5000 trees were discarded as a burn-in) and displayed using FigTree v1.0.

4.3. Distribution Data Collection

The geographic distribution data of three species of Pedicularis were collected through our field surveys in the Qinling Mountains. In addition, we combined the Chinese Virtual Herbarium (https://www.cvh.ac.cn (accessed on 4 January 2024)), Chinese National Knowledge Infrastructure (CNKI, http://www.cnki.net/ (accessed on 4 January 2024)), National Specimen Information Infrastructure (NSII, http://www.nsii.org.cn accessed on 4 January 2024)), and Global Biodiversity Information Facility (GBIF, https://www.gbif.org/ (accessed on 4 January 2024)) to determine geographic coordinates. After removing redundant points, we obtained 55 distribution points for Pedicularis, including 11 points for P. bicolor, 21 points for P. giraldiana, and 23 points for P. dissecta (Figure S1).

4.4. Ecological Niche Modeling

Previous studies have suggested that in cases of multicollinearity among environmental variables, certain environmental gradients may have a more pronounced effect on the model outcomes, potentially resulting in greater uncertainty [69,70]. Therefore, environmental variables should be screened to reduce the influence of multicollinearity. The 19 climatic variables were downloaded from the WorldClim database (Table S2). We examined the correlation between all layers using ENMTools v1.3 [71]. Two variables were considered highly correlated when the correlation coefficient was above 0.8.
We used MaxEnt v3.3.3 to predict the current, last glacial maximum (LGM, 0.021–0.018 Ma), Last Interglacial (LIG, 0.140–0.120 Ma), and future (years 2050 and 2070) potential geographic distributions of three Pedicularis species [72]. For future climate variables, we used climate data in the 2050s and 2070s. Two representative concentration pathway scenarios (RCP 2.6 and RCP 8.5) developed by the Intergovernmental Panel on Climate Change (IPCC) were used in this study, with RCP 2.6 used as the minimum emission scenario and RCP 8.5 as the maximum emission scenario [73]. We used the default parameters for MaxEnt and employed the “subsample” method (setting the number of replicates to 20), with 75% of the species records for training and 25% for testing the model. The overall performance of the model was assessed by calculating the area under the curve (AUC). AUC scores range from 0.5 (indicating randomness) to 1 (indicating an exact match), with a value above 0.9 considered indicative of good model performance [74].

4.5. Niche Comparison Analyses

Niche comparison analysis was performed to test whether the selection of different types of climatic niches may have contributed to the divergence of three Pedicularis species. We assessed ENMs in a spatial environment using R packages ecospat v4.0 [75]. Furthermore, to measure niche differences between species, we used ENMTools v1.3 to calculate the niche overlap statistic Schoener’s D and standardized Hellinger’s I distance [76,77], where a value of 0 denotes no overlap and 1 indicates complete overlap. To test the null hypothesis that two species have identical ENMs, we used the niche identity test initially in ENMTools v1.3. This test compares the observed scores of niche overlap statistics D and I with their null distribution generated with 100 pseudo-replicates. Finally, niche overlaps between species were characterized by niche unfilling, niche stability, and niche expansion [78,79].

Supplementary Materials

The following supporting information can be downloaded at https://www.mdpi.com/article/10.3390/plants13060765/s1, Figure S1: Geographical distribution of the sampled populations of three Pedicularis species; Figure S2: Correlation analysis of various environmental factors. Figure S3: Prediction of potential geographical distributions of three Pedicularis species in different climatic scenarios in the future based on ecological niche modeling. Table S1: Taxa and GenBank accessions used in phylogeny and divergence time analysis; Table S2: Environmental variable information of distribution area prediction.

Author Contributions

Conceptualization, Z.L. (Zhonghu Li); methodology, Z.L. (Zhonghu Li), Z.L. (Zhaoping Lu) and Q.Z.; software, Z.L. (Zhaoping Lu) and Q.Z.; validation, Z.L. (Zhonghu Li); formal analysis, Z.L. (Zhaoping Lu) and Q.Z.; investigation, J.K., J.L., X.H., J.W., R.L. and J.D.; resources, Z.L. (Zhonghu Li); data curation, Z.L. (Zhaoping Lu), Q.Z. and M.G.; writing—original draft preparation, Z.L. (Zhaoping Lu) and Q.Z.; writing—review and editing, Z.L. (Zhonghu Li); visualization, Z.L. (Zhonghu Li) and Q.Z.; supervision, Z.L. (Zhonghu Li); project administration, Z.L. (Zhonghu Li); funding acquisition, Z.L. (Zhonghu Li). All authors have read and agreed to the published version of the manuscript.

Funding

This research was funded by the National Natural Science Foundation of China (31970359), the Key Program of Research and Development of Shaanxi Province (2022ZDLSF06–02), the Basic Research Project of Shaanxi Academy of Fundamental Science (22JHZ005) and the Undergraduate Talent Training and Construction Project of Northwest University (363062102018).

Institutional Review Board Statement

Not applicable.

Informed Consent Statement

Not applicable.

Data Availability Statement

The chloroplast genomes of P. bicolor and P. giraldiana were deposited in GenBank (accession numbers PP439988 and PP439989, respectively).

Conflicts of Interest

The authors declare no conflicts of interest.

References

  1. Hewitt, G.M. Genetic consequences of climatic oscillations in the Quaternary. Philos. Trans. R. Soc. B Biol. Sci. 2004, 359, 183–195. [Google Scholar] [CrossRef]
  2. Davis, M.B.; Shaw, R.G. Range shifts and adaptive responses to Quaternary climate change. Science 2001, 292, 673–679. [Google Scholar] [CrossRef]
  3. Sakaguchi, S.; Qiu, Y.X.; Liu, Y.H.; Qi, X.S.; Kim, S.H.; Han, J.; Takeuchi, Y.; Worth, J.R.P.; Yamasaki, M.; Sakurai, S.; et al. Climate oscillation during the Quaternary associated with landscape heterogeneity promoted allopatric lineage divergence of a temperate tree Kalopanax septemlobus (Araliaceae) in East Asia. Mol. Ecol. 2012, 21, 3823–3838. [Google Scholar] [CrossRef] [PubMed]
  4. Zhou, T.H.; Li, S.; Qian, Z.Q.; Su, H.L.; Huang, Z.H.; Guo, Z.G.; Dai, P.F.; Liu, Z.L.; Zhao, G.F. Strong phylogeographic pattern of cpDNA variation reveals multiple glacial refugia for Saruma henryi Oliv. (Aristolochiaceae), an endangered herb endemic to China. Mol. Phylogenet. Evol. 2010, 57, 176–188. [Google Scholar] [CrossRef]
  5. Xu, X.X.; Cheng, F.Y.; Peng, L.P.; Sun, Y.Q.; Hu, X.G.; Li, S.Y.; Xian, H.L.; Jia, K.H.; Abbott, R.J.; Mao, J.F. Late Pleistocene speciation of three closely related tree peonies endemic to the Qinling–Daba Mountains, a major glacial refugium in Central China. Ecol. Evol. 2019, 9, 7528–7548. [Google Scholar] [CrossRef]
  6. Liu, J.; Moller, M.; Provan, J.; Cao, L.M.; Poudel, R.C.; Li, D.Z. Geological and ecological factors drive cryptic speciation of yews in a biodiversity hotspot. New Phytol. 2013, 199, 1093–1108. [Google Scholar] [CrossRef] [PubMed]
  7. Tang, C.Q.; Matsui, T.; Ohashi, H.; Dong, Y.F.; Momohara, A.; Herrando-Moraira, S.; Qian, S.; Yang, Y.; Ohsawa, M.; Luu, H.T.; et al. Identifying long-term stable refugia for relict plant species in East Asia. Nat. Commun. 2018, 9, 4488. [Google Scholar] [CrossRef]
  8. Xu, J.; Deng, M.; Jiang, X.L.; Westwood, M.; Song, Y.G.; Turkington, R. Phylogeography of Quercus glauca (Fagaceae), a dominant tree of East Asian subtropical evergreen forests, based on three chloroplast DNA interspace sequences. Tree Genet. Genomes 2014, 11, 805. [Google Scholar] [CrossRef]
  9. Rana, H.K.; Rana, S.K.; Luo, D.; Sun, H. Existence of biogeographic barriers for the long-term Neogene–Quaternary divergence and differentiation of Koenigia forrestii in the Himalaya–Hengduan Mountains. Bot. J. Linn. Soc. 2023, 201, 230–253. [Google Scholar] [CrossRef]
  10. Guan, B.C.; Chen, W.; Gong, X.; Wu, T.; Cai, Q.Y.; Liu, Y.Z.; Ge, G. Landscape connectivity of Cercidiphyllum japonicum, an endangered species and its implications for conservation. Ecol. Inform. 2016, 33, 51–56. [Google Scholar] [CrossRef]
  11. Bai, W.N.; Wang, W.T.; Zhang, D.Y. Phylogeographic breaks within Asian butternuts indicate the existence of a phytogeographic divide in East Asia. New Phytol. 2016, 209, 1757–1772. [Google Scholar] [CrossRef]
  12. Dong, Y.P.; Shi, X.H.; Sun, S.S.; Sun, J.P.; Hui, B.; He, D.F.; Chong, F.B.; Yang, Z. Co-evolution of the Cenozoic tectonics, geomorphology, environment and ecosystem in the Qinling Mountains and adjacent areas, central China. Geosyst. Geoenviron. 2022, 1, 100032. [Google Scholar] [CrossRef]
  13. Yang, Z.; Shen, C.; Ratschbacher, L.; Enkelmann, E.; Jonckheere, R.; Wauschkuhn, B.; Dong, Y. Sichuan Basin and beyond: Eastward foreland growth of the Tibetan Plateau from an integration of Late Cretaceous-Cenozoic fission track and (U-Th)/He ages of the eastern Tibetan Plateau, Qinling, and Daba Shan. J. Geophys. Res. Solid Earth 2017, 122, 4712–4740. [Google Scholar] [CrossRef]
  14. Teng, Z.H.; Wang, X.H. Studies of the tectonic uplift at the Cenozoic era and the regionally environmental effects in the Qinling Orogenic Belt. Geol. Shaanxi 1996, 14, 33–42. [Google Scholar]
  15. Yuan, J.H.; Cheng, F.Y.; Zhou, S.L. The phylogeographic structure and conservation genetics of the endangered tree peony, Paeonia rockii (Paeoniaceae), inferred from chloroplast gene sequences. Conserv. Genet. 2011, 12, 1539–1549. [Google Scholar] [CrossRef]
  16. Ree, R.H. Phylogeny and the evolution of floral diversity in Pedicularis (Orobanchaceae). Int. J. Plant Sci. 2005, 166, 595–613. [Google Scholar] [CrossRef]
  17. Hong, D.Y. The distribution of Scrophulariaceae in the Holarctic with special reference to the floristic relationships between Eastern Asia and Eastern North America. Ann. Mo. Bot. Gard. 1983, 70, 701. [Google Scholar]
  18. Wang, G.; Baskin, C.C.; Baskin, J.M.; Yang, X.; Liu, G.; Ye, X.; Zhang, X.; Huang, Z. Effects of climate warming and prolonged snow cover on phenology of the early life history stages of four alpine herbs on the southeastern Tibetan Plateau. Am. J. Bot. 2018, 105, 967–976. [Google Scholar] [CrossRef] [PubMed]
  19. Tkach, N.; Ree, R.H.; Kuss, P.; Roser, M.; Hoffmann, M.H. High mountain origin, phylogenetics, evolution, and niche conservatism of arctic lineages in the hemiparasitic genus Pedicularis (Orobanchaceae). Mol. Phylogenet. Evol. 2014, 76, 75–92. [Google Scholar] [CrossRef] [PubMed]
  20. Wang, H.J.; Li, W.T.; Liu, Y.N.; Yang, F.S.; Wang, X.Q. Range-wide multilocus phylogenetic analyses of Pedicularis sect. Cyathophora (Orobanchaceae): Implications for species delimitation and speciation. Taxon 2015, 64, 959–974. [Google Scholar] [CrossRef]
  21. Yu, W.B.; Huang, P.H.; Li, D.Z.; Wang, H. Incongruence between Nuclear and Chloroplast DNA Phylogenies in Pedicularis Section Cyathophora (Orobanchaceae). PLoS ONE 2013, 8, e74828. [Google Scholar] [CrossRef]
  22. Wang, H.J.; Li, W.T.; Liu, Y.N.; Yang, F.S.; Wang, X.Q. Resolving interspecific relationships within evolutionarily young lineages using RNA-seq data: An example from Pedicularis section Cyathophora (Orobanchaceae). Mol. Phylogenet. Evol. 2017, 107, 345–355. [Google Scholar] [CrossRef]
  23. Yang, H.; Holmgren, N.H.; Mill, R.R. Pedicularis L. In Flora of China; Raven, P.H., Ed.; Science Press: Beijing, China, 1998; Volume 18, pp. 97–209. [Google Scholar]
  24. Qin, H.; Yang, Y.; Dong, S.; He, Q.; Jia, Y.; Zhao, L.; Yu, S.; Liu, H.; Liu, B.; Yan, Y. Threatened species list of China’s higher plants. Biodivers. Sci. 2017, 25, 744. [Google Scholar] [CrossRef]
  25. Fu, J.M.; Liu, H.M.; Hu, J.J.; Liang, Y.Q.; Liang, J.J.; Wu, T.N. Five complete chloroplast genome sequences from Diospyros: Genome organization and comparative analysis. PLoS ONE 2016, 11, e0159566. [Google Scholar] [CrossRef]
  26. Yang, F.; Wang, X.; Hong, D. Unexpected high divergence in nrDNA ITS and extensive parallelism in floral morphology of Pedicularis (Orobanchaceae). Plant Syst. Evol. 2003, 240, 91–105. [Google Scholar] [CrossRef]
  27. McNeal, J.R.; Bennett, J.R.; Wolfe, A.D.; Mathews, S. Phylogeny and origins of holoparasitism in Orobanchaceae. Am. J. Bot. 2013, 100, 971–983. [Google Scholar] [CrossRef]
  28. Scheunert, A.; Fleischmann, A.; Olano-Marín, C.; Bräuchler, C.; Heubl, G. Phylogeny of tribe Rhinantheae (Orobanchaceae) with a focus on biogeography, cytology and re-examination of generic concepts. Taxon 2012, 61, 1269–1285. [Google Scholar] [CrossRef]
  29. Bennett, J.; Mathews, S. Phylogeny of the parasitic plant family Orobanchaceae inferred from phytochrome A. Am. J. Bot. 2006, 93, 1039–1051. [Google Scholar] [CrossRef] [PubMed]
  30. Yu, W.B.; Wang, H.; Liu, M.L.; Grabovskaya-Borodina, A.E.; Li, D.Z. Phylogenetic approaches resolve taxonomical confusion in Pedicularis (Orobanchaceae): Reinstatement of Pedicularis delavayi and discovering a new species Pedicularis milliana. PLoS ONE 2018, 13, e0200372. [Google Scholar] [CrossRef]
  31. Yu, W.B.; Liu, M.L.; Wang, H.; Mill, R.R.; Ree, R.H.; Yang, J.B.; Li, D.Z. Towards a comprehensive phylogeny of the large temperate genus Pedicularis (Orobanchaceae), with an emphasis on species from the Himalaya-Hengduan Mountains. BMC Plant Biol. 2015, 15, 176. [Google Scholar] [CrossRef]
  32. Liu, R.; Wang, H.; Yang, J.B.; Corlett, R.T.; Randle, C.P.; Li, D.Z.; Yu, W.B. Cryptic species diversification of the Pedicularis siphonantha complex (Orobanchaceae) in the mountains of Southwest China since the Pliocene. Front Plant Sci. 2022, 13, 811206. [Google Scholar] [CrossRef] [PubMed]
  33. Cho, W.B.; Han, E.K.; Choi, H.J.; Lee, J.H. Complete chloroplast genome sequence of Pedicularis verticillata and chloroplast genome reconstruction of P. cheilanthifolia (Orobanchaceae). Mitochondrial DNA B 2020, 5, 1578–1579. [Google Scholar] [CrossRef]
  34. Wang, Q.; He, Z.; Zhang, R.; Dang, X.; Zhao, X. Characterization of the complete chloroplast genome of Pedicularis shansiensis (Orobanchaceae), an endemic species of China. Mitochondrial DNA B 2022, 7, 251–252. [Google Scholar] [CrossRef] [PubMed]
  35. Li, X.; Yang, J.B.; Wang, H.; Song, Y.; Yu, W.B. Plastid NDH pseudogenization and gene loss in a recently derived lineage from the largest hemiparasitic plant genus Pedicularis (Orobanchaceae). Plant Cell Physiol. 2021, 62, 971–984. [Google Scholar] [CrossRef] [PubMed]
  36. Yang, F.S.; Wang, X.Q. Extensive length variation in the cpDNA trnT-trnF region of hemiparasitic Pedicularis and its phylogenetic implications. Plant Syst. Evol. 2007, 264, 251–264. [Google Scholar] [CrossRef]
  37. Magallon, S.; Castillo, S. Angiosperm diversification through time. Am. J. Bot. 2009, 96, 349–365. [Google Scholar] [CrossRef]
  38. Bell, C.D.; Soltis, D.E.; Soltis, P.S. The age and diversification of the angiosperms re-revisited. Am. J. Bot. 2010, 97, 1296–1303. [Google Scholar] [CrossRef]
  39. Wolfe, A.D.; Randle, C.P.; Liu, L.; Steiner, K.E. Phylogeny and biogeography of Orobanchaceae. Folia Geobot. 2005, 40, 115–134. [Google Scholar] [CrossRef]
  40. Drew, B.T.; Sytsma, K.J. Phylogenetics, biogeography, and staminal evolution in the tribe Mentheae (Lamiaceae). Am. J. Bot. 2012, 99, 933–953. [Google Scholar] [CrossRef]
  41. Song, Z.C.; Wang, W.M.; Huang, F. Fossil pollen records of extant angiosperms in China. Bot. Rev. 2004, 70, 425–458. [Google Scholar]
  42. Dong, Y.P.; Santosh, M. Tectonic architecture and multiple orogeny of the Qinling Orogenic Belt, Central China. Gondwana Res. 2016, 29, 1–40. [Google Scholar] [CrossRef]
  43. Dong, Y.P.; Zhang, G.W.; Neubauer, F.; Liu, X.; Genser, J.; Hauzenberger, C. Tectonic evolution of the Qinling orogen, China: Review and synthesis. J. Asian Earth Sci. 2011, 41, 213–237. [Google Scholar] [CrossRef]
  44. Ying, T.S. An analysis of the flora of Qinling Mountain range: Its nature, characteristics and origins. Acta Phytotaxon. Sin. 1994, 32, 389–410. [Google Scholar]
  45. Liu, M.L.; He, Y.L.; López-Pujol, J.; Jia, Y.; Li, Z.H. Complex population evolutionary history of four cold-tolerant Notopterygium herb species in the Qinghai-Tibetan Plateau and adjacent areas. Heredity 2019, 123, 242–263. [Google Scholar] [CrossRef] [PubMed]
  46. Liu, L.; Zhang, H.J.; Zhang, W.; Chai, L. Global last glacial maximum climate inferred from reconstructing the Eryehai Valley, Mount Taibai, Qinling Mountains, eastern China. Palaeogeogr. Palaeoclimatol. Palaeoecol. 2022, 590, 110858. [Google Scholar] [CrossRef]
  47. Miao, Y.F.; Herrmann, M.; Wu, F.L.; Yan, X.L.; Yang, S.L. What controlled Mid-Late Miocene long-term aridification in Central Asia—Global cooling or Tibetan Plateau uplift: A review. Earth Sci. Rev. 2012, 112, 155–172. [Google Scholar] [CrossRef]
  48. Jiang, X.; Liu, W.J.; Zhu, Y.Z.; Cao, Y.T.; Yang, X.M.; Geng, Y.; Zhang, F.J.; Sun, R.Q.; Jia, R.W.; Yan, C.L.; et al. Impacts of Climate Changes on Geographic Distribution of Primula filchnerae, an Endangered Herb in China. Plants 2023, 12, 3561. [Google Scholar] [CrossRef]
  49. Zhao, H.R.; Yang, X.T.; Shi, S.Y.; Xu, Y.D.; Yu, X.P.; Ye, X.P. Climate-driven distribution changes for Bashania fargesii in the Qinling Mountains and its implication for panda conservation. Glob. Ecol. Conserv. 2023, 46, e02610. [Google Scholar] [CrossRef]
  50. Zhao, X.; Meng, H.; Wang, W.; Yan, B. Prediction of the Distribution of Alpine Tree Species Under Climate Change Scenarios: Larix chinensis Taibai Mountain (China). Pol. J. Ecol. 2016, 64, 200–212. [Google Scholar]
  51. Alsos, I.G.; Eidesen, P.B.; Ehrich, D.; Skrede, I.; Westergaard, K.; Jacobsen, G.H.; Landvik, J.Y.; Taberlet, P.; Brochmann, C. Frequent long-distance plant colonization in the changing Arctic. Science 2007, 316, 1606–1609. [Google Scholar] [CrossRef]
  52. Chu, X.; Gugger, P.F.; Li, L.; Zhao, J.L.; Li, Q.J. Responses of an endemic species (Roscoea humeana) in the Hengduan Mountains to climate change. Divers. Distrib. 2021, 27, 2231–2244. [Google Scholar] [CrossRef]
  53. Zhan, P.; Wang, F.Y.; Xia, P.G.; Zhao, G.H.; Wei, M.T.; Wei, F.G.; Han, R.L. Assessment of suitable cultivation region for Panax notoginseng under different climatic conditions using MaxEnt model and high-performance liquid chromatography in China. Ind. Crops Prod. 2022, 176, 114416. [Google Scholar] [CrossRef]
  54. Zhao, G.H.; Cui, X.Y.; Sun, J.J.; Li, T.T.; Wang, Q.; Ye, X.Z.; Fan, B.G. Analysis of the distribution pattern of Chinese Ziziphus jujuba under climate change based on optimized biomod2 and MaxEnt models. Ecol. Indic. 2021, 132, 108256. [Google Scholar] [CrossRef]
  55. Antonelli, A.; Kissling, W.D.; Flantua, S.G.A.; Bermúdez, M.A.; Mulch, A.; Muellner-Riehl, A.N.; Kreft, H.; Linder, H.P.; Badgley, C.; Fjeldså, J.; et al. Geological and climatic influences on mountain biodiversity. Nat. Geosci. 2018, 11, 718–725. [Google Scholar] [CrossRef]
  56. Zhao, J.L.; Gugger, P.F.; Xia, Y.M.; Li, Q.J. Ecological divergence of two closely related Roscoea species associated with late Quaternary climate change. J. Biogeogr. 2001, 43, 1990–2001. [Google Scholar] [CrossRef]
  57. Wang, B.; Mao, J.F.; Zhao, W.; Wang, X.R. Impact of geography and climate on the genetic differentiation of the subtropical pine Pinus yunnanensis. PLoS ONE 2013, 8, e67345. [Google Scholar] [CrossRef]
  58. Quintero, I.; González-Caro, S.; Zalamea, P.C.; Cadena, C.D. Asynchrony of seasons: Genetic differentiation associated with geographic variation in climatic seasonality and reproductive phenology. Am. Nat. 2014, 184, 352–363. [Google Scholar] [CrossRef]
  59. Chen, X.D.; Yang, J.; Guo, Y.F.; Zhao, Y.M.; Zhou, T.; Zhang, X.; Ju, M.M.; Li, Z.H.; Zhao, G.F. Spatial genetic structure and demographic history of the dominant forest oak Quercus fabri Hance in subtropical China. Front. Plant Sci. 2021, 11, 583284. [Google Scholar] [CrossRef] [PubMed]
  60. Doyle, J.J.; Dickson, E.E. Preservation of plant samples for DNA restriction endonuclease analysis. Taxon 1987, 36, 715–722. [Google Scholar] [CrossRef]
  61. Jin, J.J.; Yu, W.B.; Yang, J.B.; Song, Y.; dePamphilis, C.W.; Yi, T.S.; Li, D.Z. GetOrganelle: A fast and versatile toolkit for accurate de novo assembly of organelle genomes. Genome Biol. 2020, 21, 241. [Google Scholar] [CrossRef] [PubMed]
  62. Wick, R.R.; Schultz, M.B.; Zobel, J.; Holt, K.E. Bandage: Interactive visualization of de novo genome assemblies. Bioinformatics 2015, 31, 3350–3352. [Google Scholar] [CrossRef] [PubMed]
  63. Qu, X.J.; Moore, M.J.; Li, D.Z.; Yi, T.S. PGA: A software package for rapid, accurate, and flexible batch annotation of plastomes. Plant Methods 2019, 15, 50. [Google Scholar] [CrossRef] [PubMed]
  64. Kearse, M.; Moir, R.; Wilson, A.; Stones-Havas, S.; Cheung, M.; Sturrock, S.; Buxton, S.; Cooper, A.; Markowitz, S.; Duran, C.; et al. Geneious Basic: An integrated and extendable desktop software platform for the organization and analysis of sequence data. Bioinformatics 2012, 28, 1647–1649. [Google Scholar] [CrossRef] [PubMed]
  65. Darriba, D.; Taboada, G.; Doallo, R.; Posada, D. jModelTest 2: More models, new heuristics and parallel computing. Nat. Methods 2012, 9, 772. [Google Scholar] [CrossRef] [PubMed]
  66. Stamatakis, A. RAxML version 8: A tool for phylogenetic analysis and post-analysis of large phylogenies. Bioinformatics 2014, 30, 1312–1313. [Google Scholar] [CrossRef] [PubMed]
  67. Swofford, D.L. PAUP*. Phylogenetic Analysis Using Parsimony (and Other Methods), version 4; Sinauer Associates: Sunderland, MA, USA, 2003.
  68. Drummond, A.J.; Rambaut, A. BEAST: Bayesian evolutionary analysis by sampling trees. BMC Evol. Biol. 2007, 7, 214. [Google Scholar] [CrossRef] [PubMed]
  69. Guisan, A.; Petitpierre, B.; Broennimann, O.; Daehler, C.; Kueffer, C. Unifying niche shift studies: Insights from biological invasions. Trends Ecol. Evol. 2014, 29, 260–269. [Google Scholar] [CrossRef] [PubMed]
  70. Feng, P.; Wang, B.; Liu, D.L.; Waters, C.; Yu, Q. Incorporating machine learning with biophysical model can improve the evaluation of climate extremes impacts on wheat yield in south-eastern Australia. Agric. For. Meteorol. 2019, 275, 100–113. [Google Scholar] [CrossRef]
  71. Warren, D.L.; Glor, R.E.; Turelli, M. ENMTools: A toolbox for comparative studies of environmental niche models. Ecography 2010, 33, 607–611. [Google Scholar] [CrossRef]
  72. Phillips, S.J.; Dudík, M. Modeling of species distributions with Maxent: New extensions and a comprehensive evaluation. Ecography 2008, 31, 161–175. [Google Scholar] [CrossRef]
  73. van Vuuren, D.P.; Edmonds, J.; Kainuma, M.; Riahi, K.; Thomson, A.; Hibbard, K.; Hurtt, G.C.; Kram, T.; Krey, V.; Lamarque, J.-F.; et al. The Representative Concentration Pathways: An Overview. Clim. Chang. 2011, 109, 5. [Google Scholar] [CrossRef]
  74. Van Proosdij, A.S.J.; Sosef, M.S.M.; Wieringa, J.J.; Raes, N. Minimum required number of specimen records to develop accurate species distribution models. Ecography 2016, 39, 542–552. [Google Scholar] [CrossRef]
  75. Di Cola, V.; Broennimann, O.; Petitpierre, B.; Breiner, F.T.; D’Amen, M.; Randin, C.; Engler, R.; Pottier, J.; Pio, D.; Dubuis, A.; et al. Ecospat: An R package to support spatial analyses and modelling of species niches and distributions. Ecography 2017, 40, 774–787. [Google Scholar] [CrossRef]
  76. Schoener, T.W. The Anolis lizards of Bimini: Resource partitioning in a complex fauna. Ecology 1968, 49, 704–726. [Google Scholar] [CrossRef]
  77. Warren, D.L.; Glor, R.E.; Turelli, M. Environmental niche equivalency versus conservatism: Quantitative approaches to niche evolution. Evol. Int. J. Org. Evol. 2008, 62, 2868–2883. [Google Scholar] [CrossRef]
  78. Broennimann, O.; Fitzpatrick, M.C.; Pearman, P.B.; Petitpierre, B.; Pellissier, L.; Yoccoz, N.G.; Thuiller, W.; Fortin, M.J.; Randin, C.; Zimmermann, N.E.; et al. Measuring ecological niche overlap from occurrence and spatial environmental data. Glob. Ecol. Biogeogr. 2012, 21, 481–497. [Google Scholar] [CrossRef]
  79. Petitpierre, B.; Kueer, C.; Broennimann, O.; Randin, C.; Daehler, C.; Guisan, A. Climatic niche shifts are rare among terrestrial plant invaders. Science 2012, 335, 1344–1348. [Google Scholar] [CrossRef]
Figure 1. Phylogenetic tree based on chloroplast genomes of Pedicularis species. Numbers above the branches are bootstrap values according to maximum likelihood (left) and maximum parsimony (right) analyses. The three colorful species are main objects of this study.
Plants 13 00765 g001
Figure 2. Divergence times based on chloroplast genomes. Blue bars and the numbers below the bars indicate 95% highest posterior densities of divergence times (million years ago). The three colorful species are main objects of this study.
Plants 13 00765 g002
Figure 3. Environmental variable contributions of the ecological niche model for three Pedicularis species. Bio1, annual mean temperature; bio2, mean diurnal range; bio7, temperature annual range; bio8, mean temperature of the wettest quarter; bio9, mean temperature of the driest quarter; bio10, mean temperature of the warmest quarter; bio11, mean temperature of the coldest quarter; bio18, precipitation of the warmest quarter.
Plants 13 00765 g003
Figure 4. Distribution of three Pedicularis species at present, last glacial maximum (LGM), and last interglacial (LIG) based on ecological niche modeling. The light to dark colors and small to large numbers of the small squares in the legend correspond to the low to high suitability of the species for the potential geographic ranges.
Plants 13 00765 g004
Figure 5. Migration of the center of suitable habitat for three Pedicularis species. (a) P. bicolor; (b) P. giraldiana; (c) P. dissecta. LGM, last glacial maximum; LIG, last interglacial; RCP, representative concentration pathway scenario. RCP2.6 and RCP8.5 are defined according to the radiative forcing target level from 2.6 W/m2 (low carbon emissions) to 8.5 W/m2 (high carbon emissions) for 2100.
Plants 13 00765 g005
Figure 6. Geographic location of the occurrence records and background areas used for the climatic niche comparison in the e-space of three Pedicularis species: P. bicolor (blue), P. dissecta (red), and P. giraldiana (green). (a,b) represent climatic space through the environmental principal components analysis (PCA-env) (explaining PC1 = 70.3% and PC2 = 18.6% of the total climatic variation). In (a), the solid lines delimit the 20% of occurrence density of the current occupied niches by the species. Gray arrows outline the direction of the variables’ contribution to the PCA-env. In (b), the solid and dashed lines illustrate the 100% occurrence density and the 100% available background climates, respectively. Bio1, annual mean temperature; bio2, mean diurnal range; bio7, temperature annual range; bio8, mean temperature of the wettest quarter; bio9, mean temperature of the driest quarter; bio10, mean temperature of the warmest quarter; bio11, mean temperature of the coldest quarter; bio18, precipitation of the warmest quarter.
Plants 13 00765 g006
Figure 7. Niche identity test for each comparison based on Schoener’s D statistic and Hellinger’s I statistic. (ac) represent the comparison results between P. bicolor vs. P. dissecta, P. dissecta vs. P. giraldiana, and P. giraldiana vs. P. bicolor, respectively. Bars indicate the null distributions of D and I.
Plants 13 00765 g007
Table 1. Comparisons of the current occupied climatic niches between Pedicularis species.
Niche OverlapNiche UnfillingNiche StabilityNiche Expansion
P. bicolor—P. dissecta0.4630.0360.6240.376
P. dissecta—P. giraldiana0.2040.1260.4270.573
P. giraldiana—P. bicolor0.1220.0000.2760.724
Disclaimer/Publisher’s Note: The statements, opinions and data contained in all publications are solely those of the individual author(s) and contributor(s) and not of MDPI and/or the editor(s). MDPI and/or the editor(s) disclaim responsibility for any injury to people or property resulting from any ideas, methods, instructions or products referred to in the content.

