
Estimating the Amount of the Wild Artemisia annua in China Based on the MaxEnt Model and Spatio-Temporal Kriging Interpolation

Abstract
1. Introduction
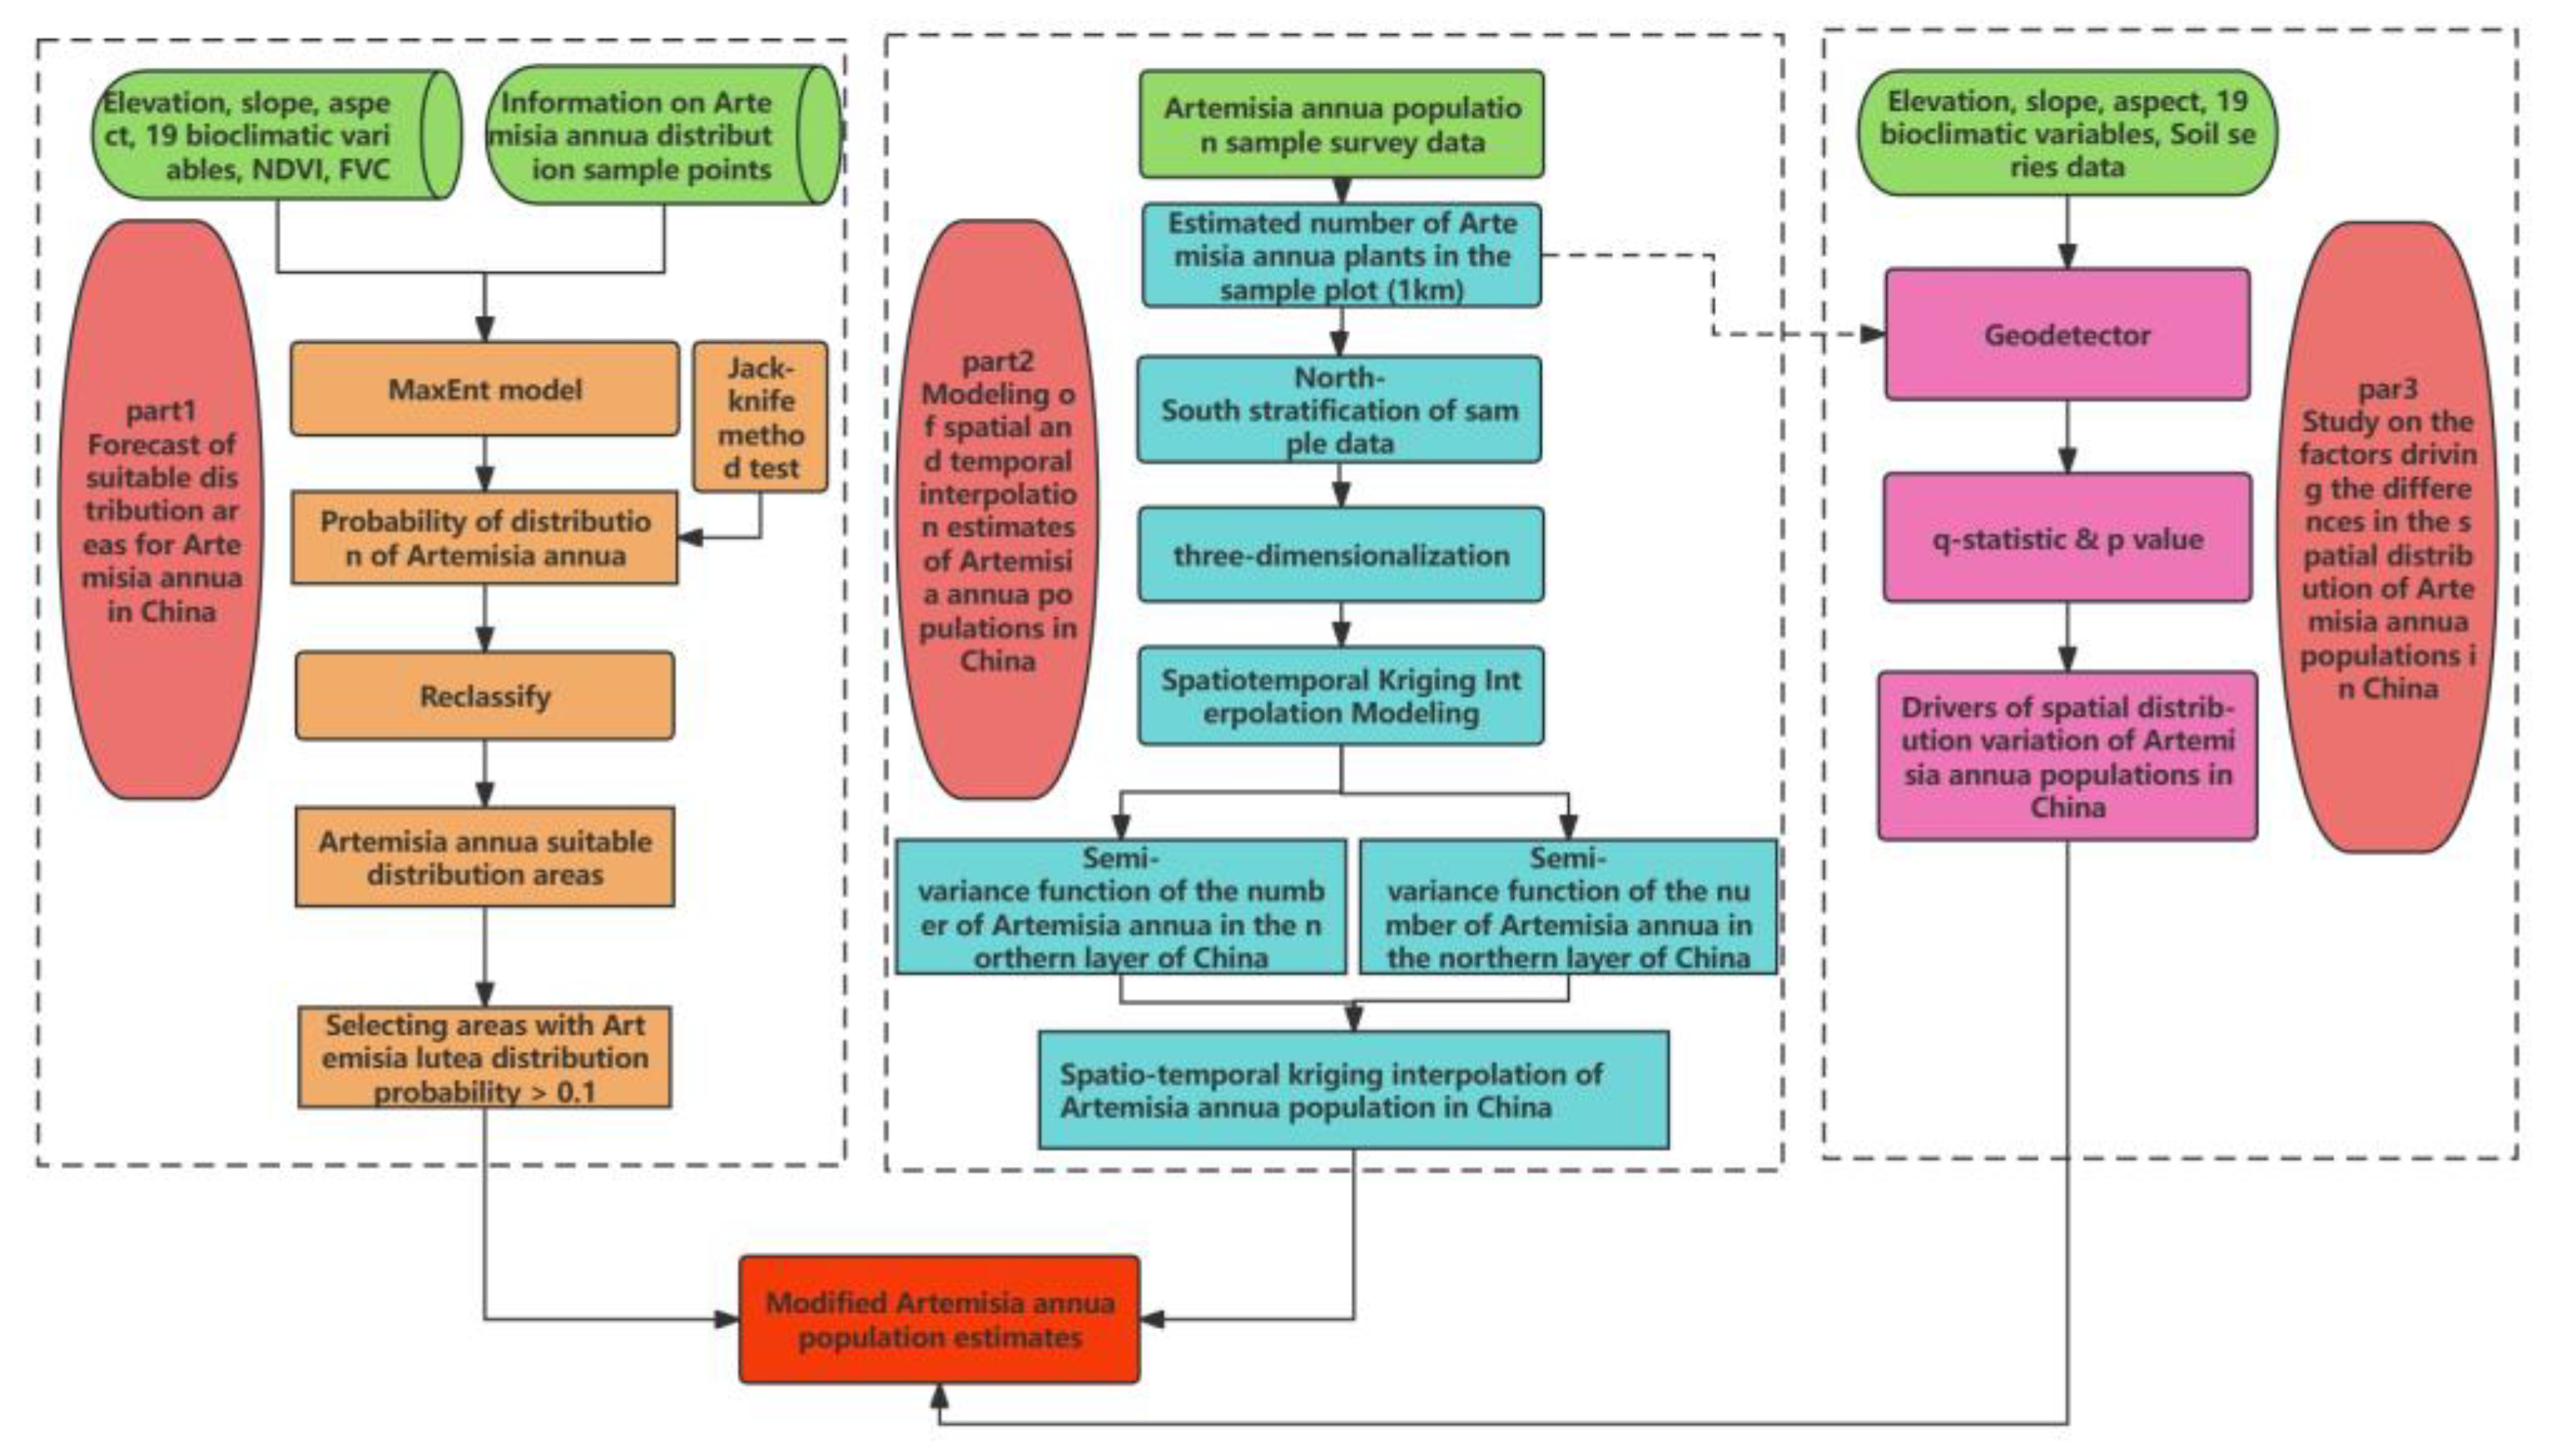
2. Results
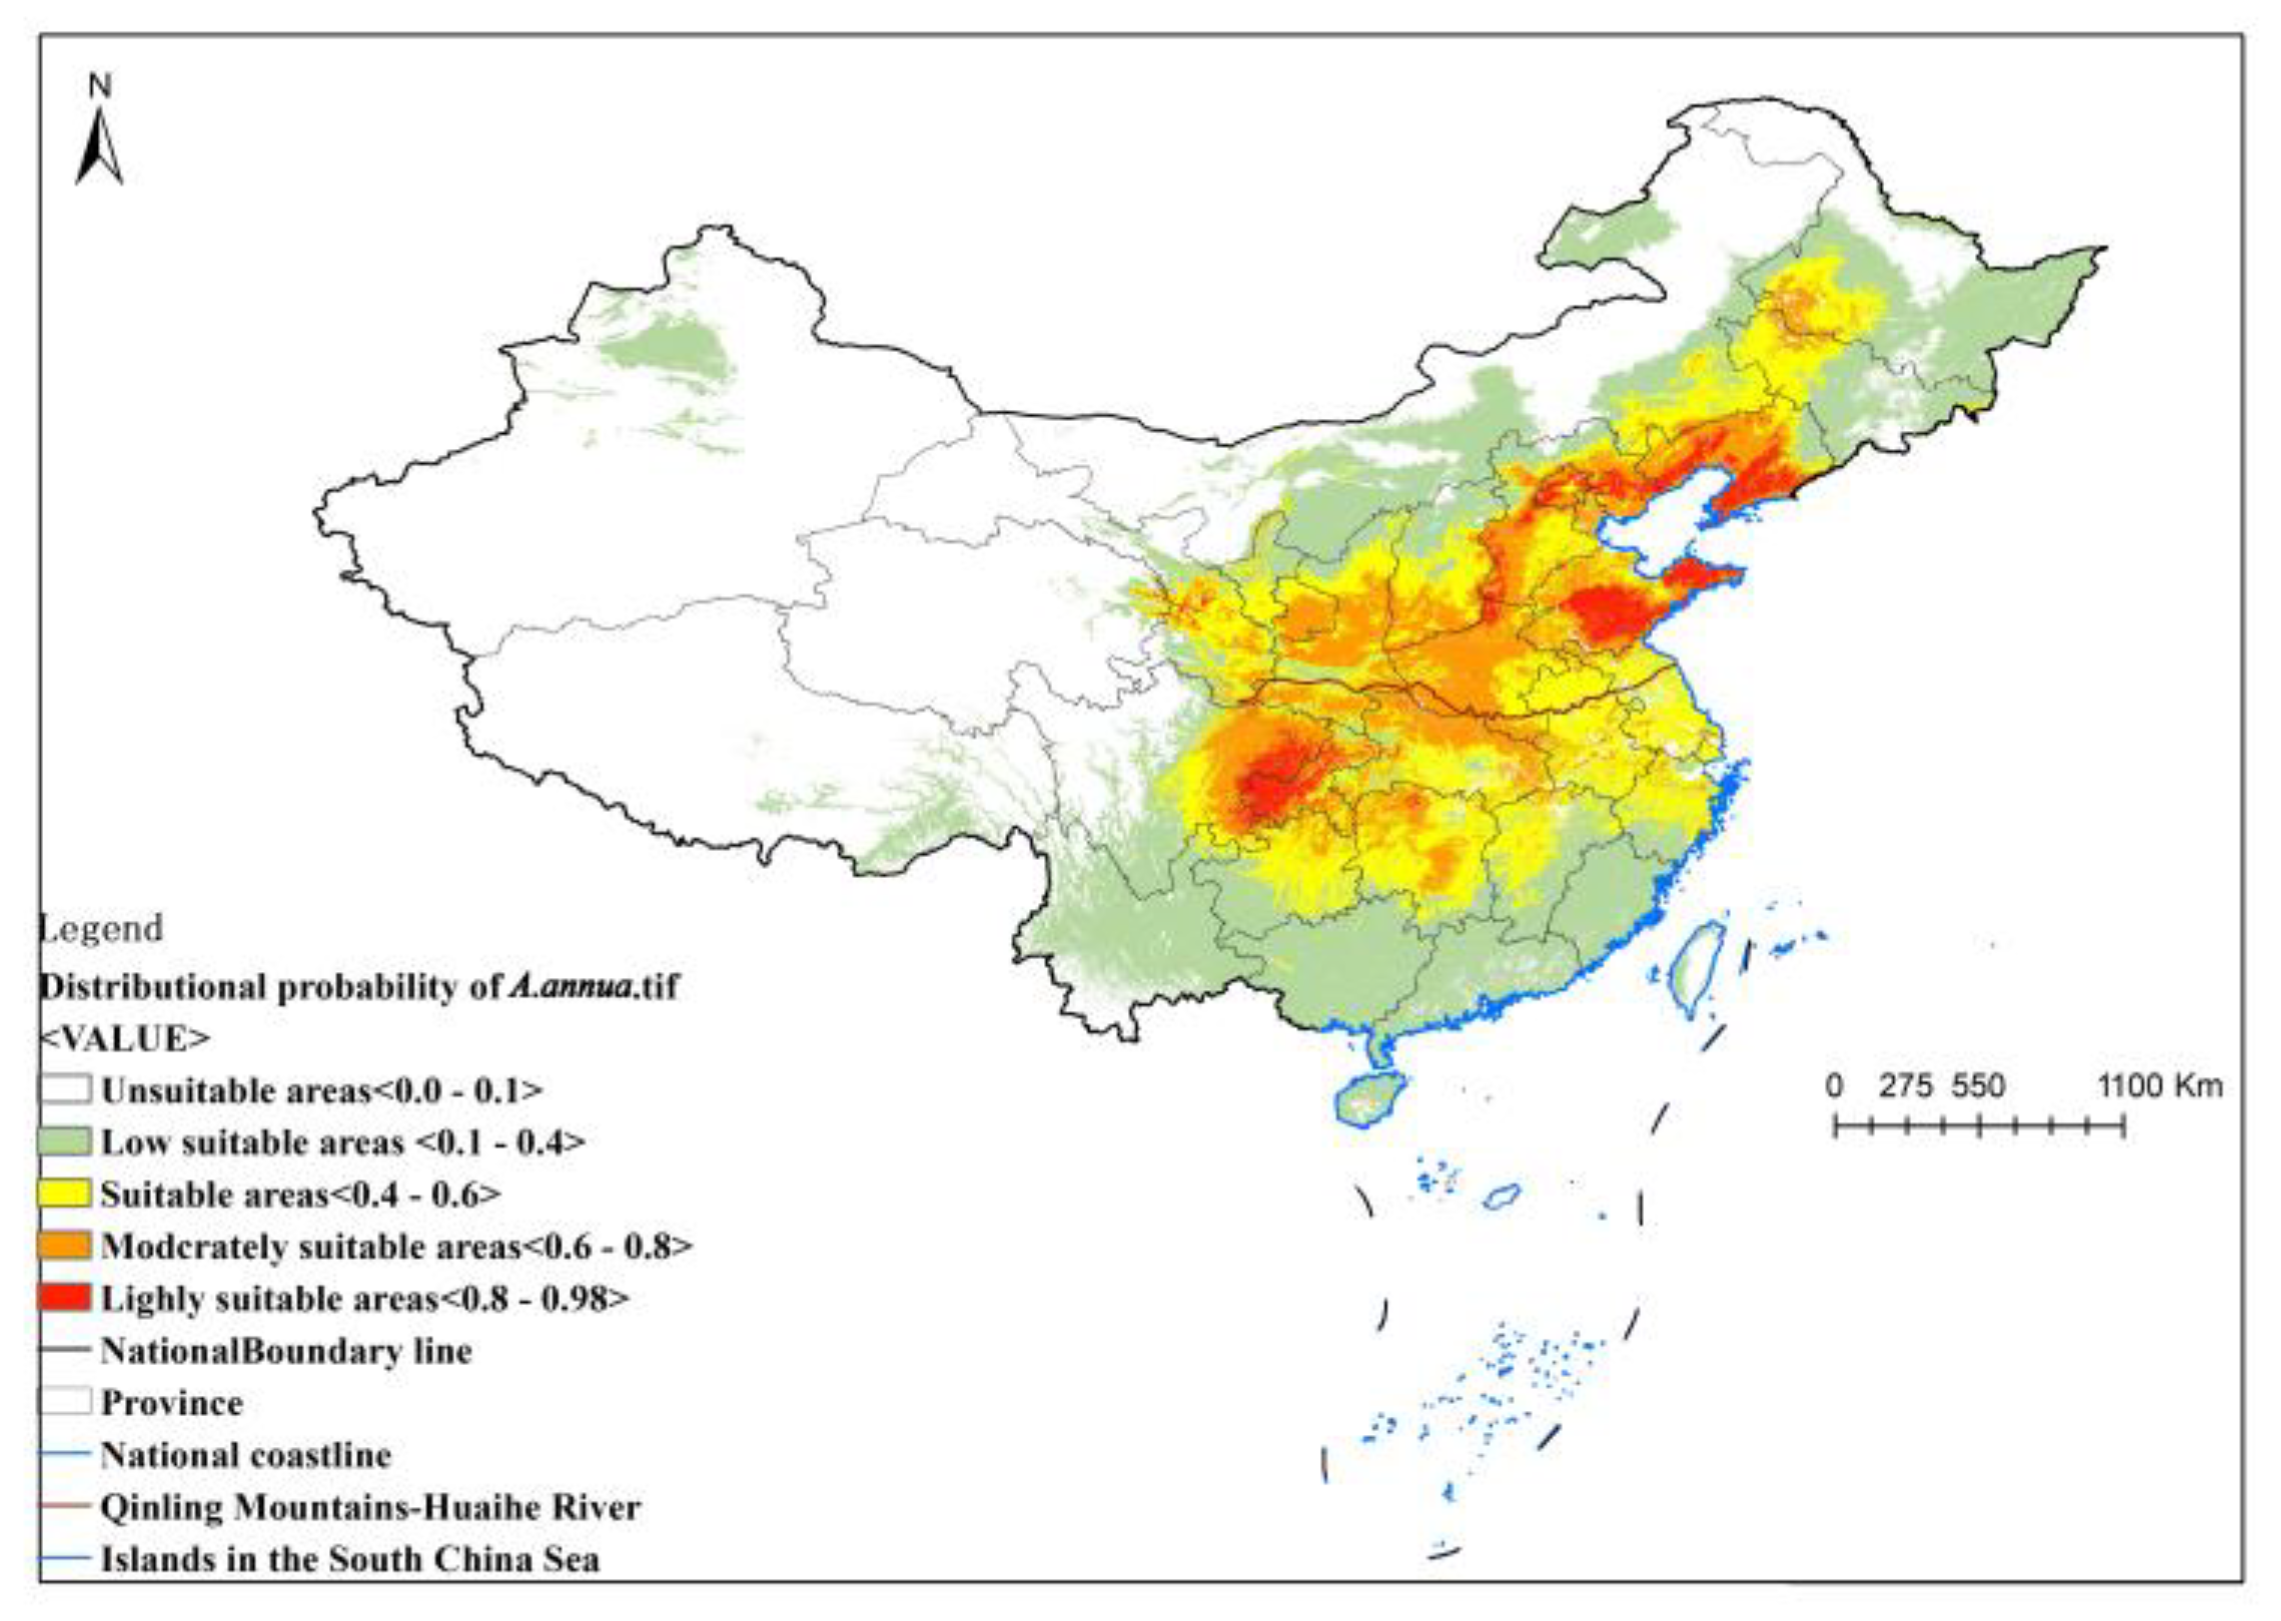
2.1. Results of MaxEnt Model of A. annua’s Ecologically Suitable Areas
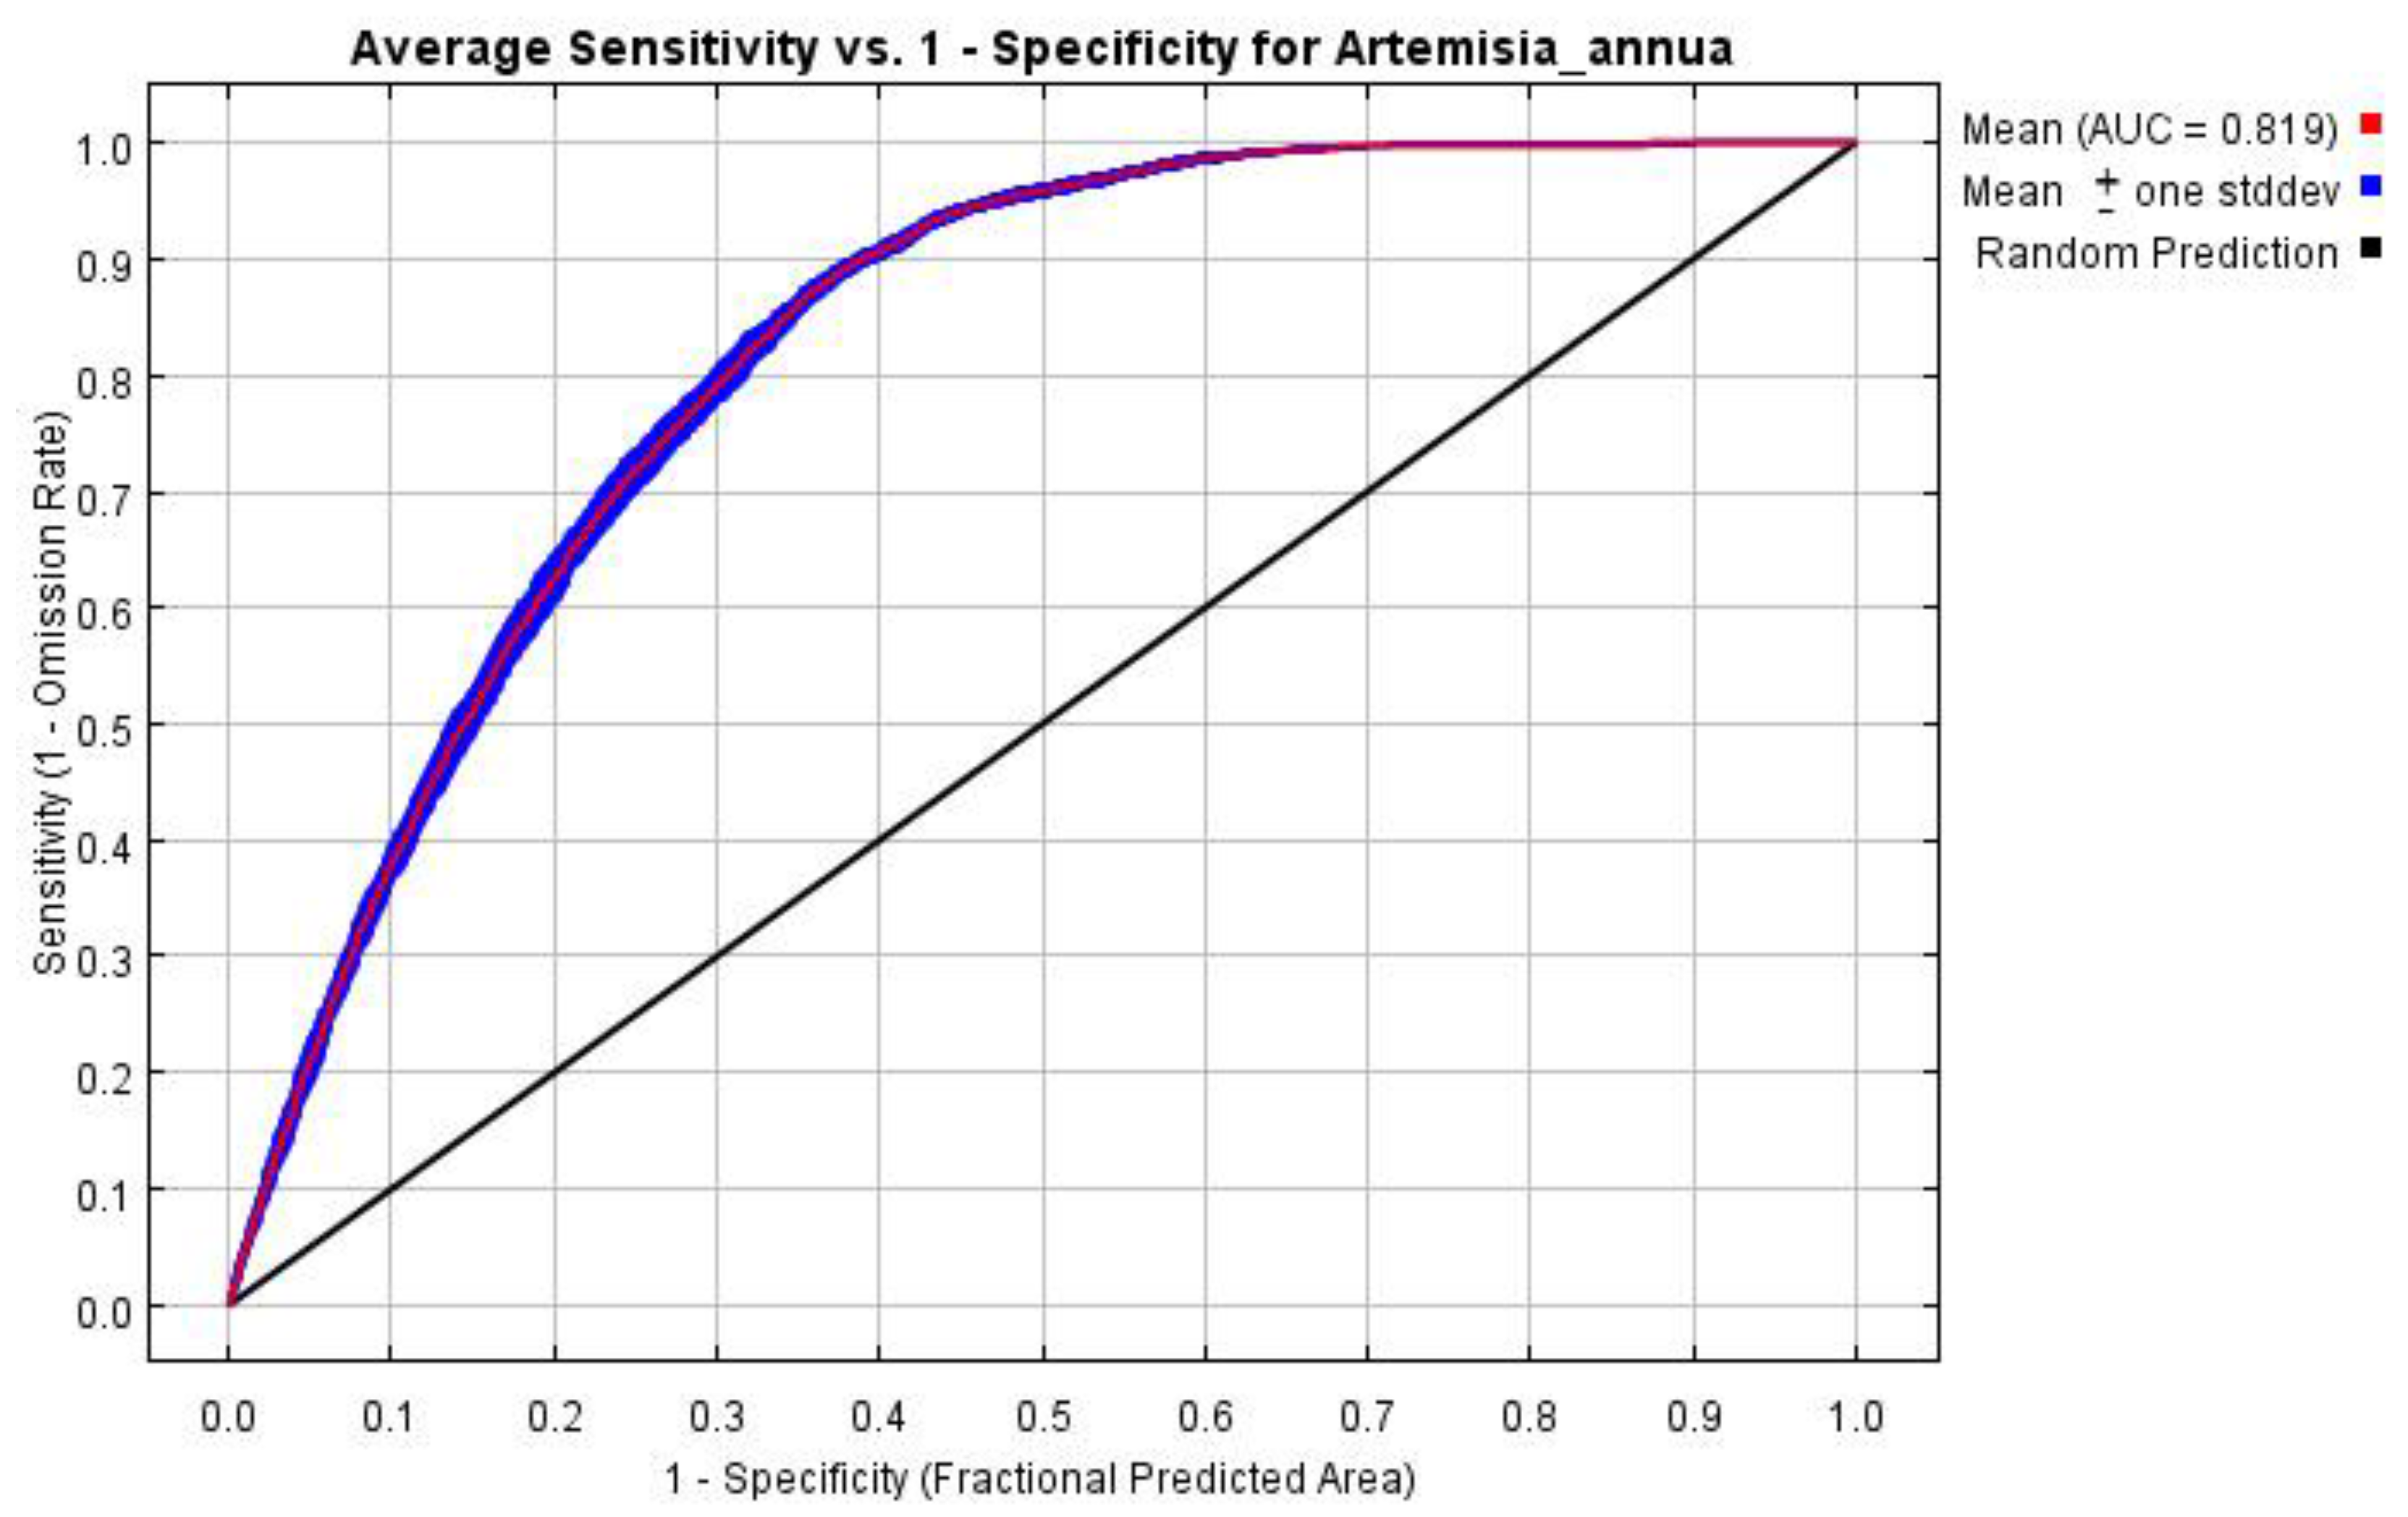
Accuracy Evaluation of the Results
2.2. Spatio-Temporal Kriging Modeling Results for Estimating the Amount of A. annua
2.2.1. Results of Sample Stratification
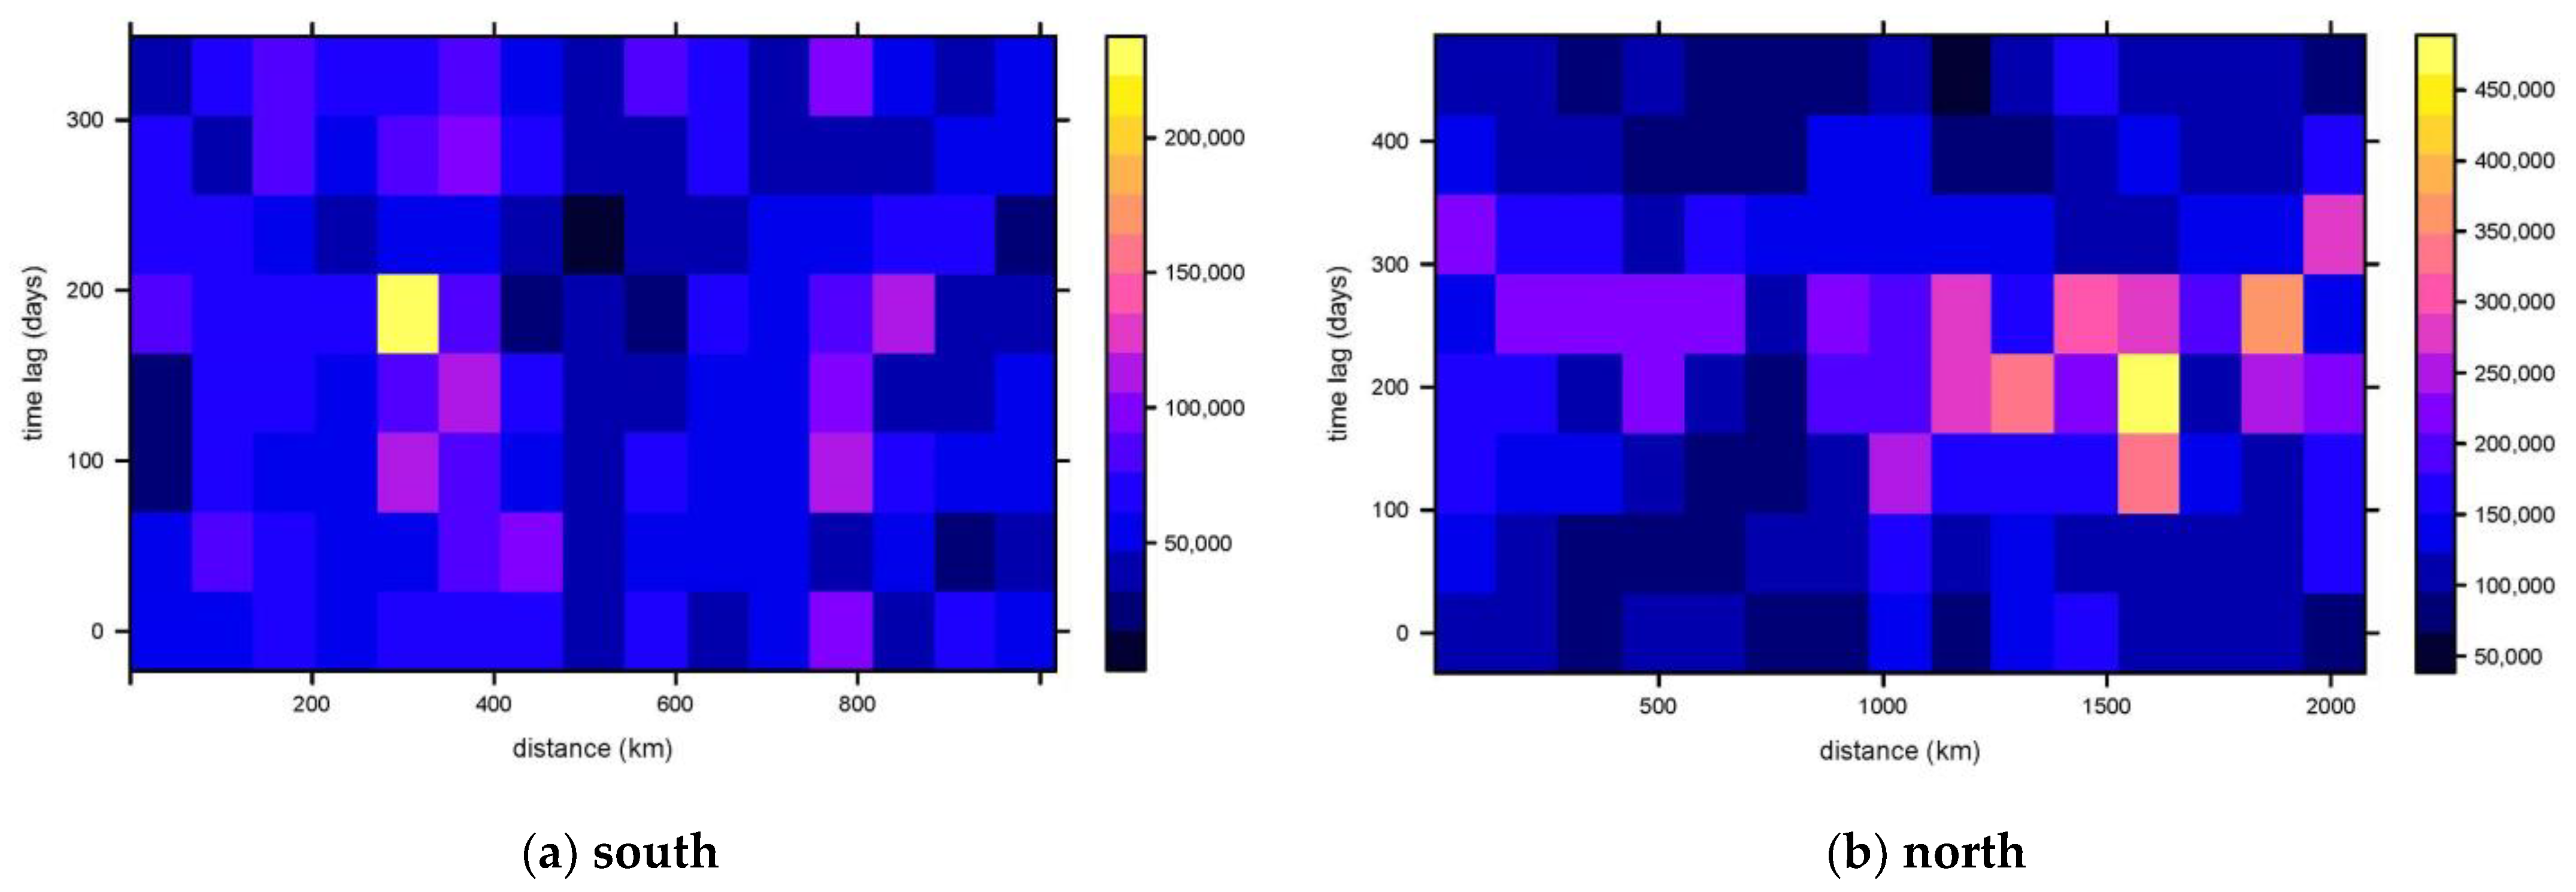
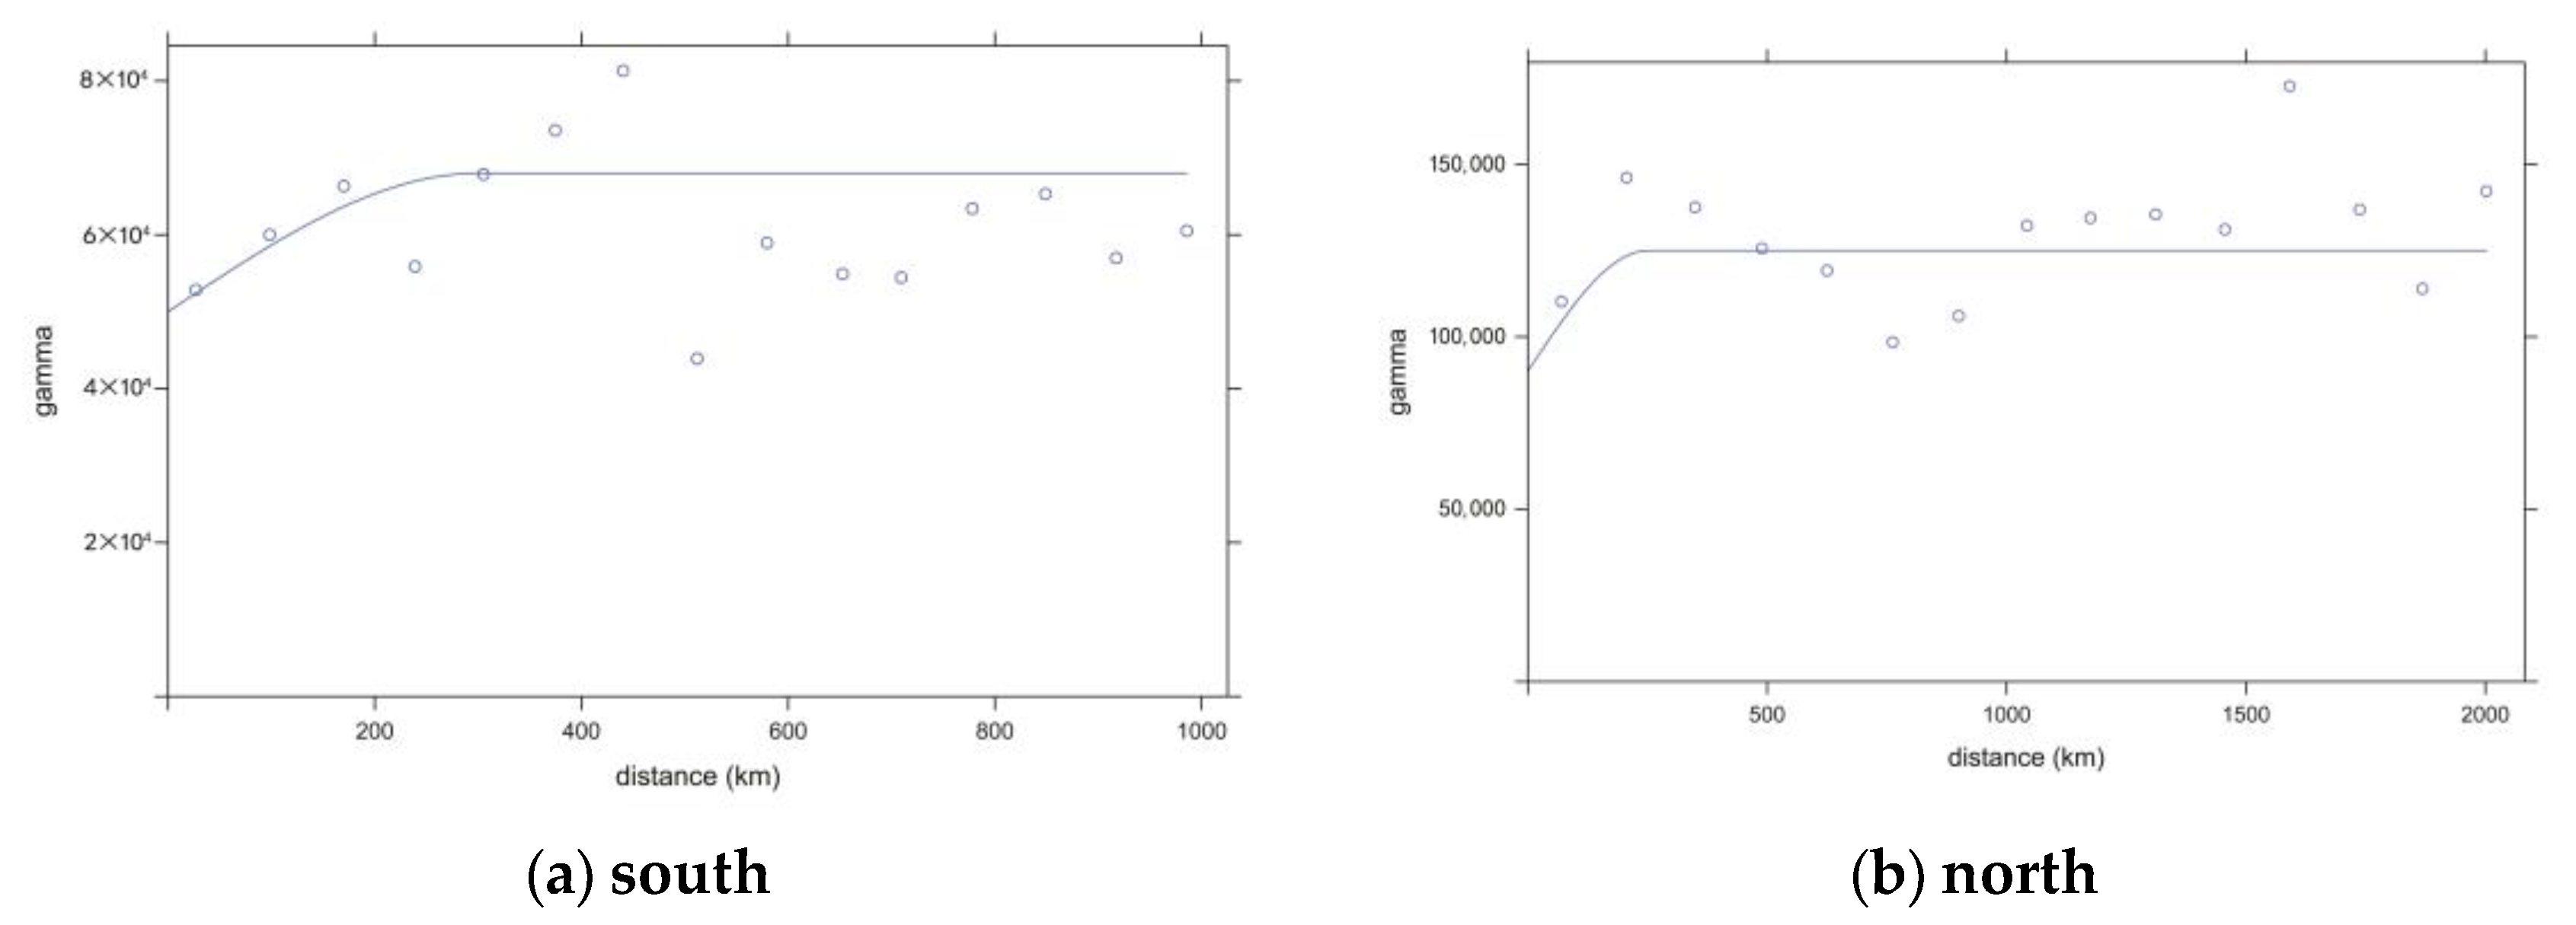
2.2.2. Results of the Semi-Variate Function Study
2.2.3. Model Accuracy Validation Results
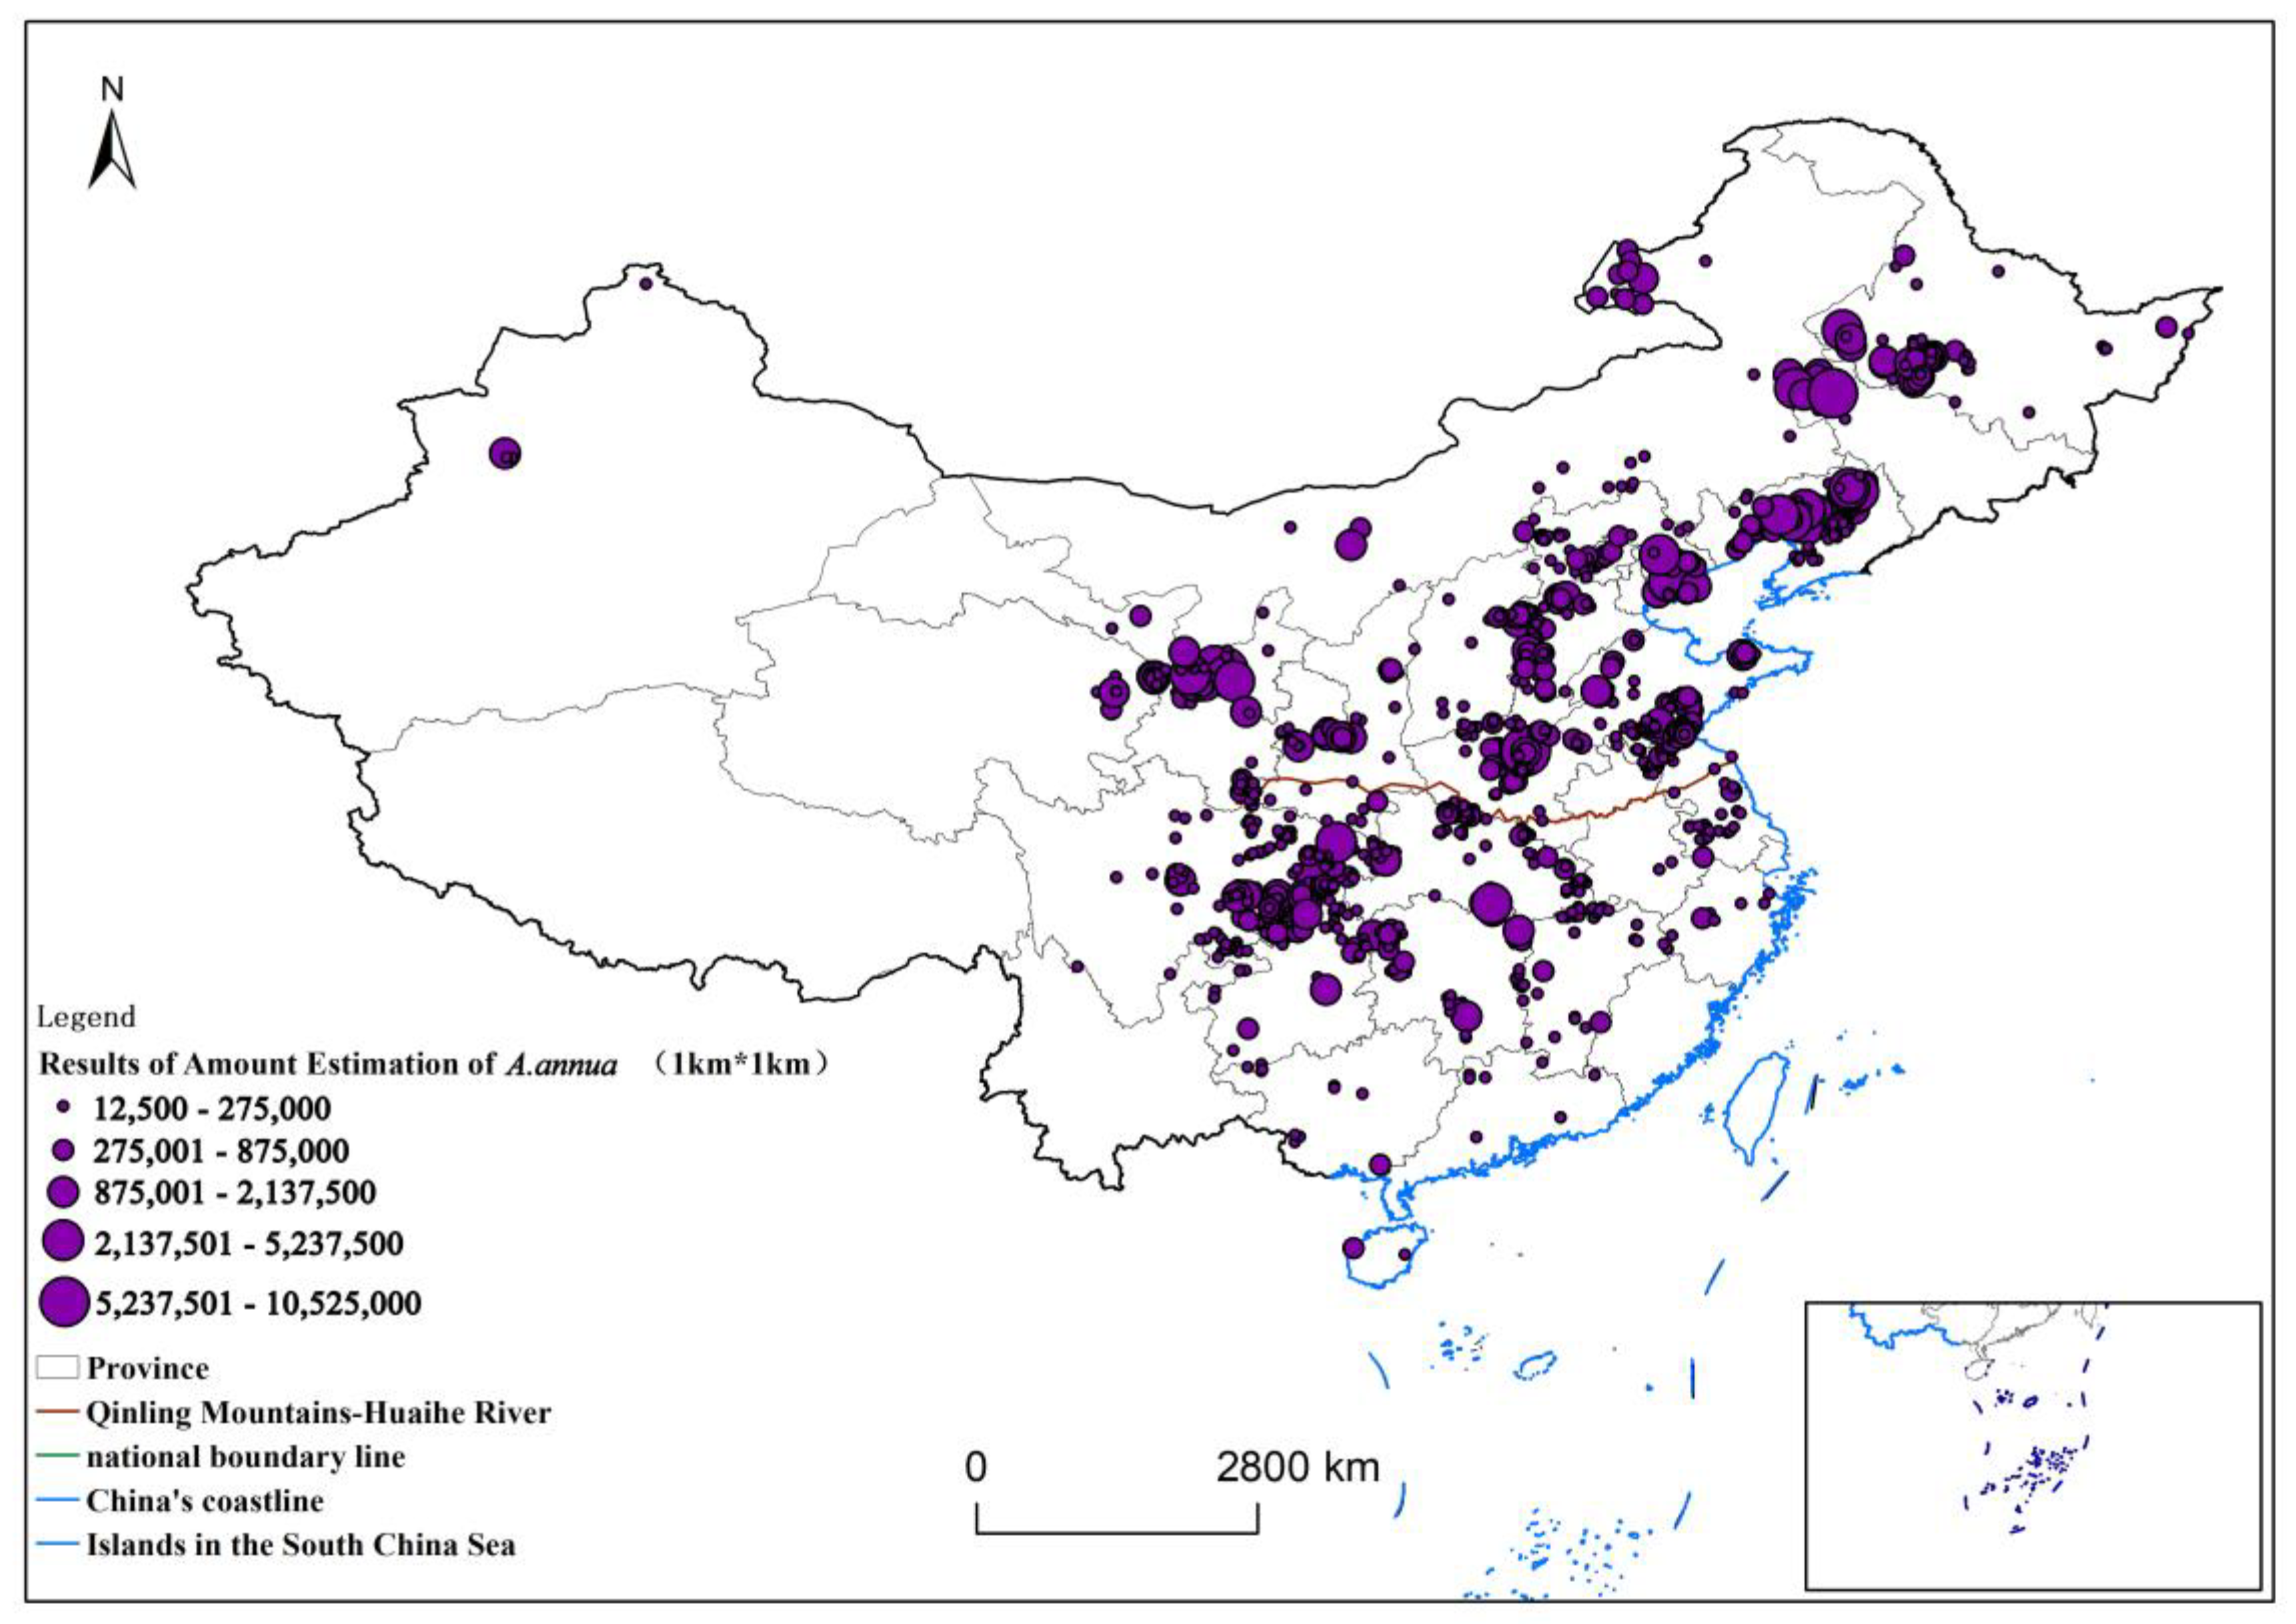
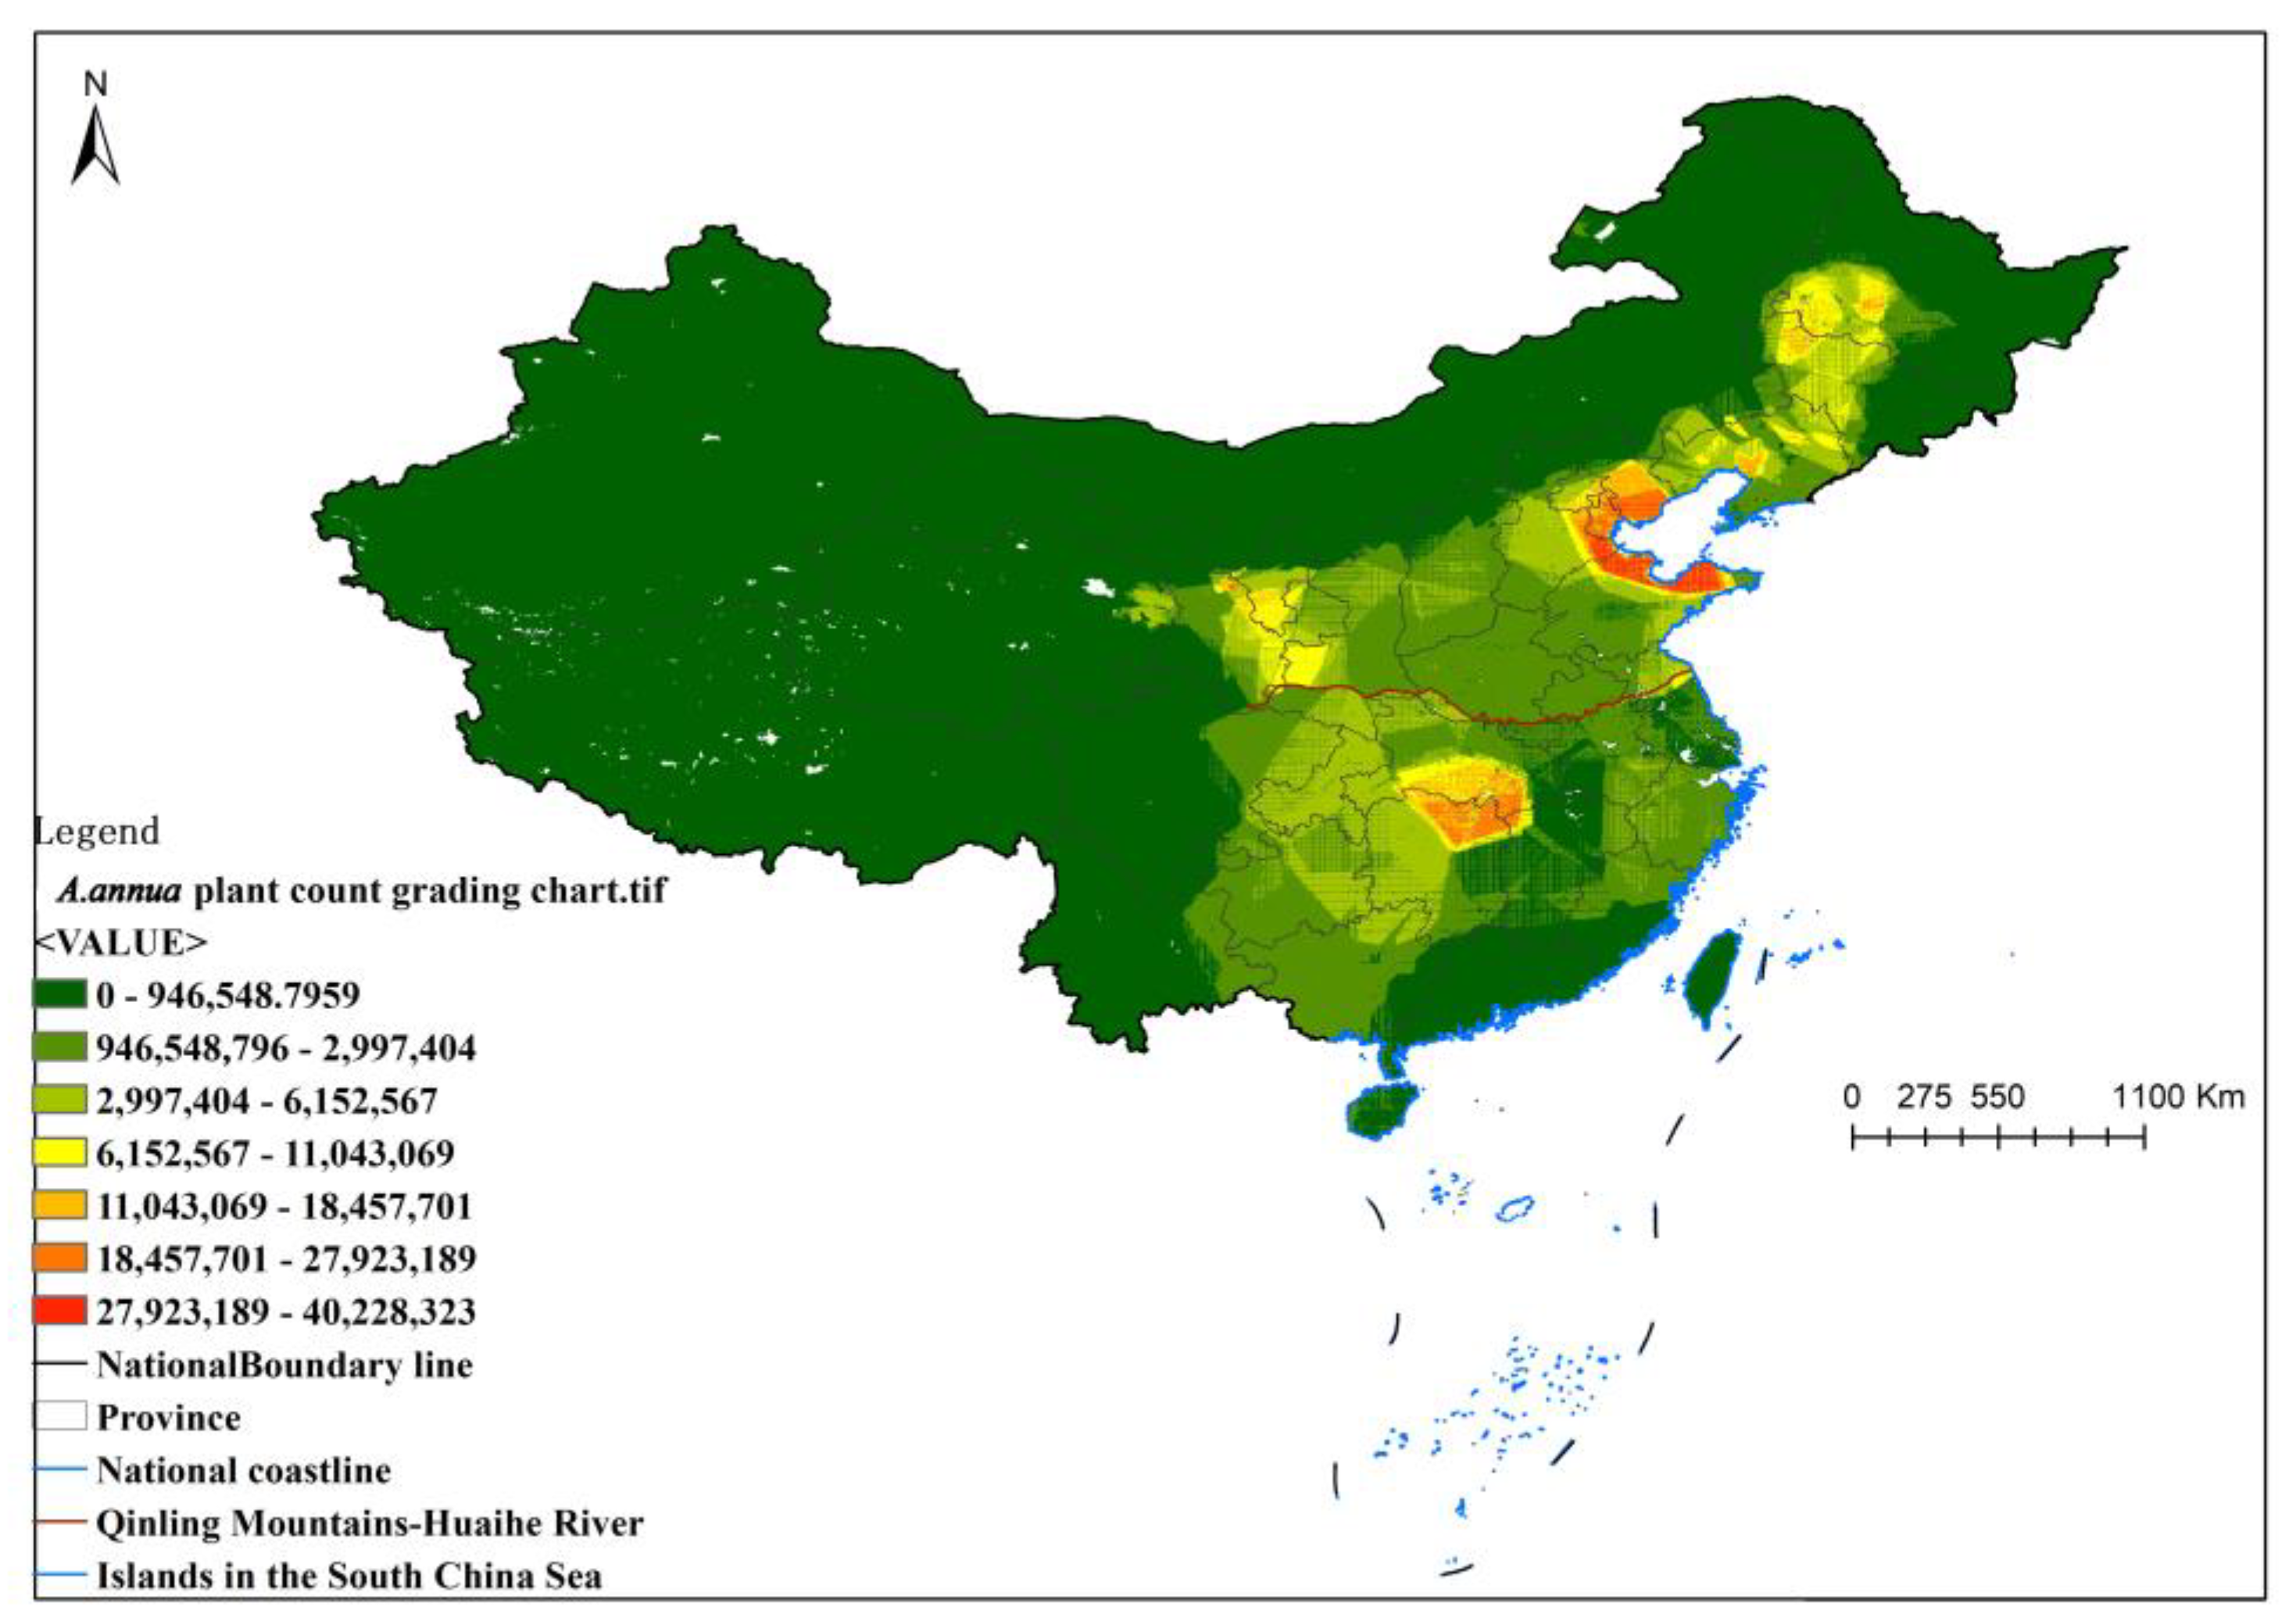
2.2.4. Number of A. annua Based on the Distribution of Suitable Areas
2.3. Analysis of the Drivers of Spatial Variation in the Distribution of the A. annua
3. Discussion
4. Materials and Methods
4.1. Materials
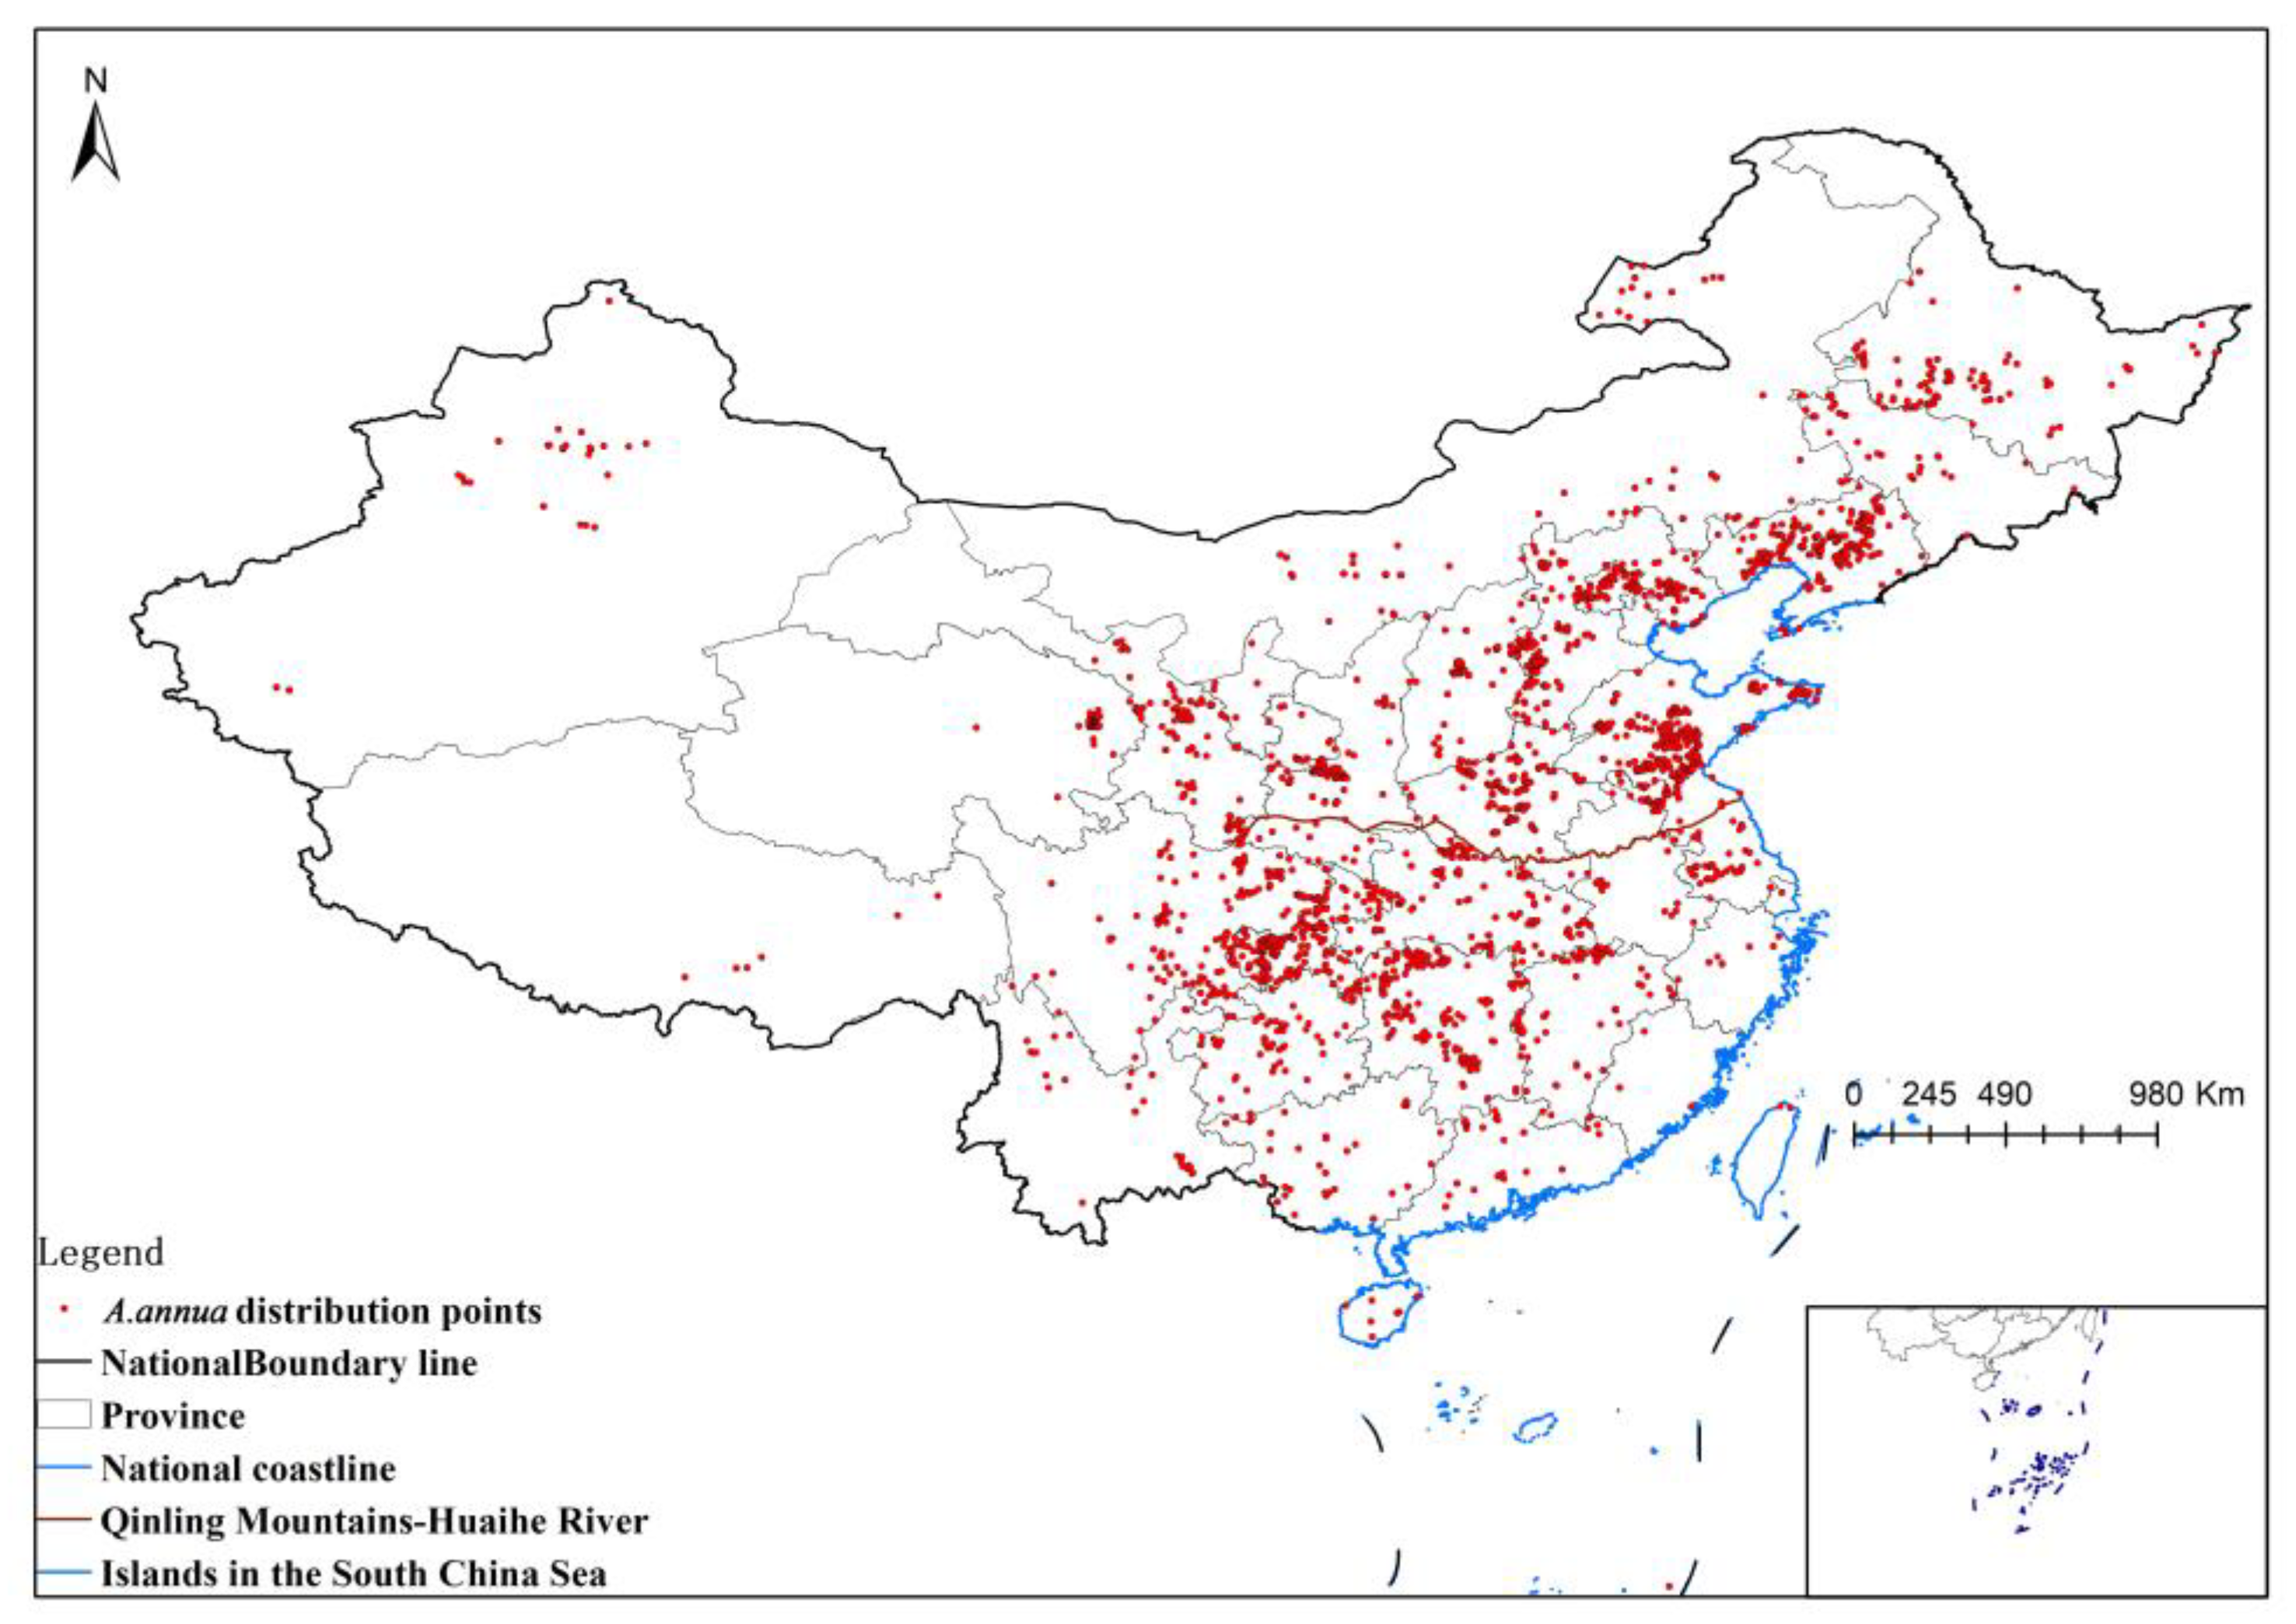
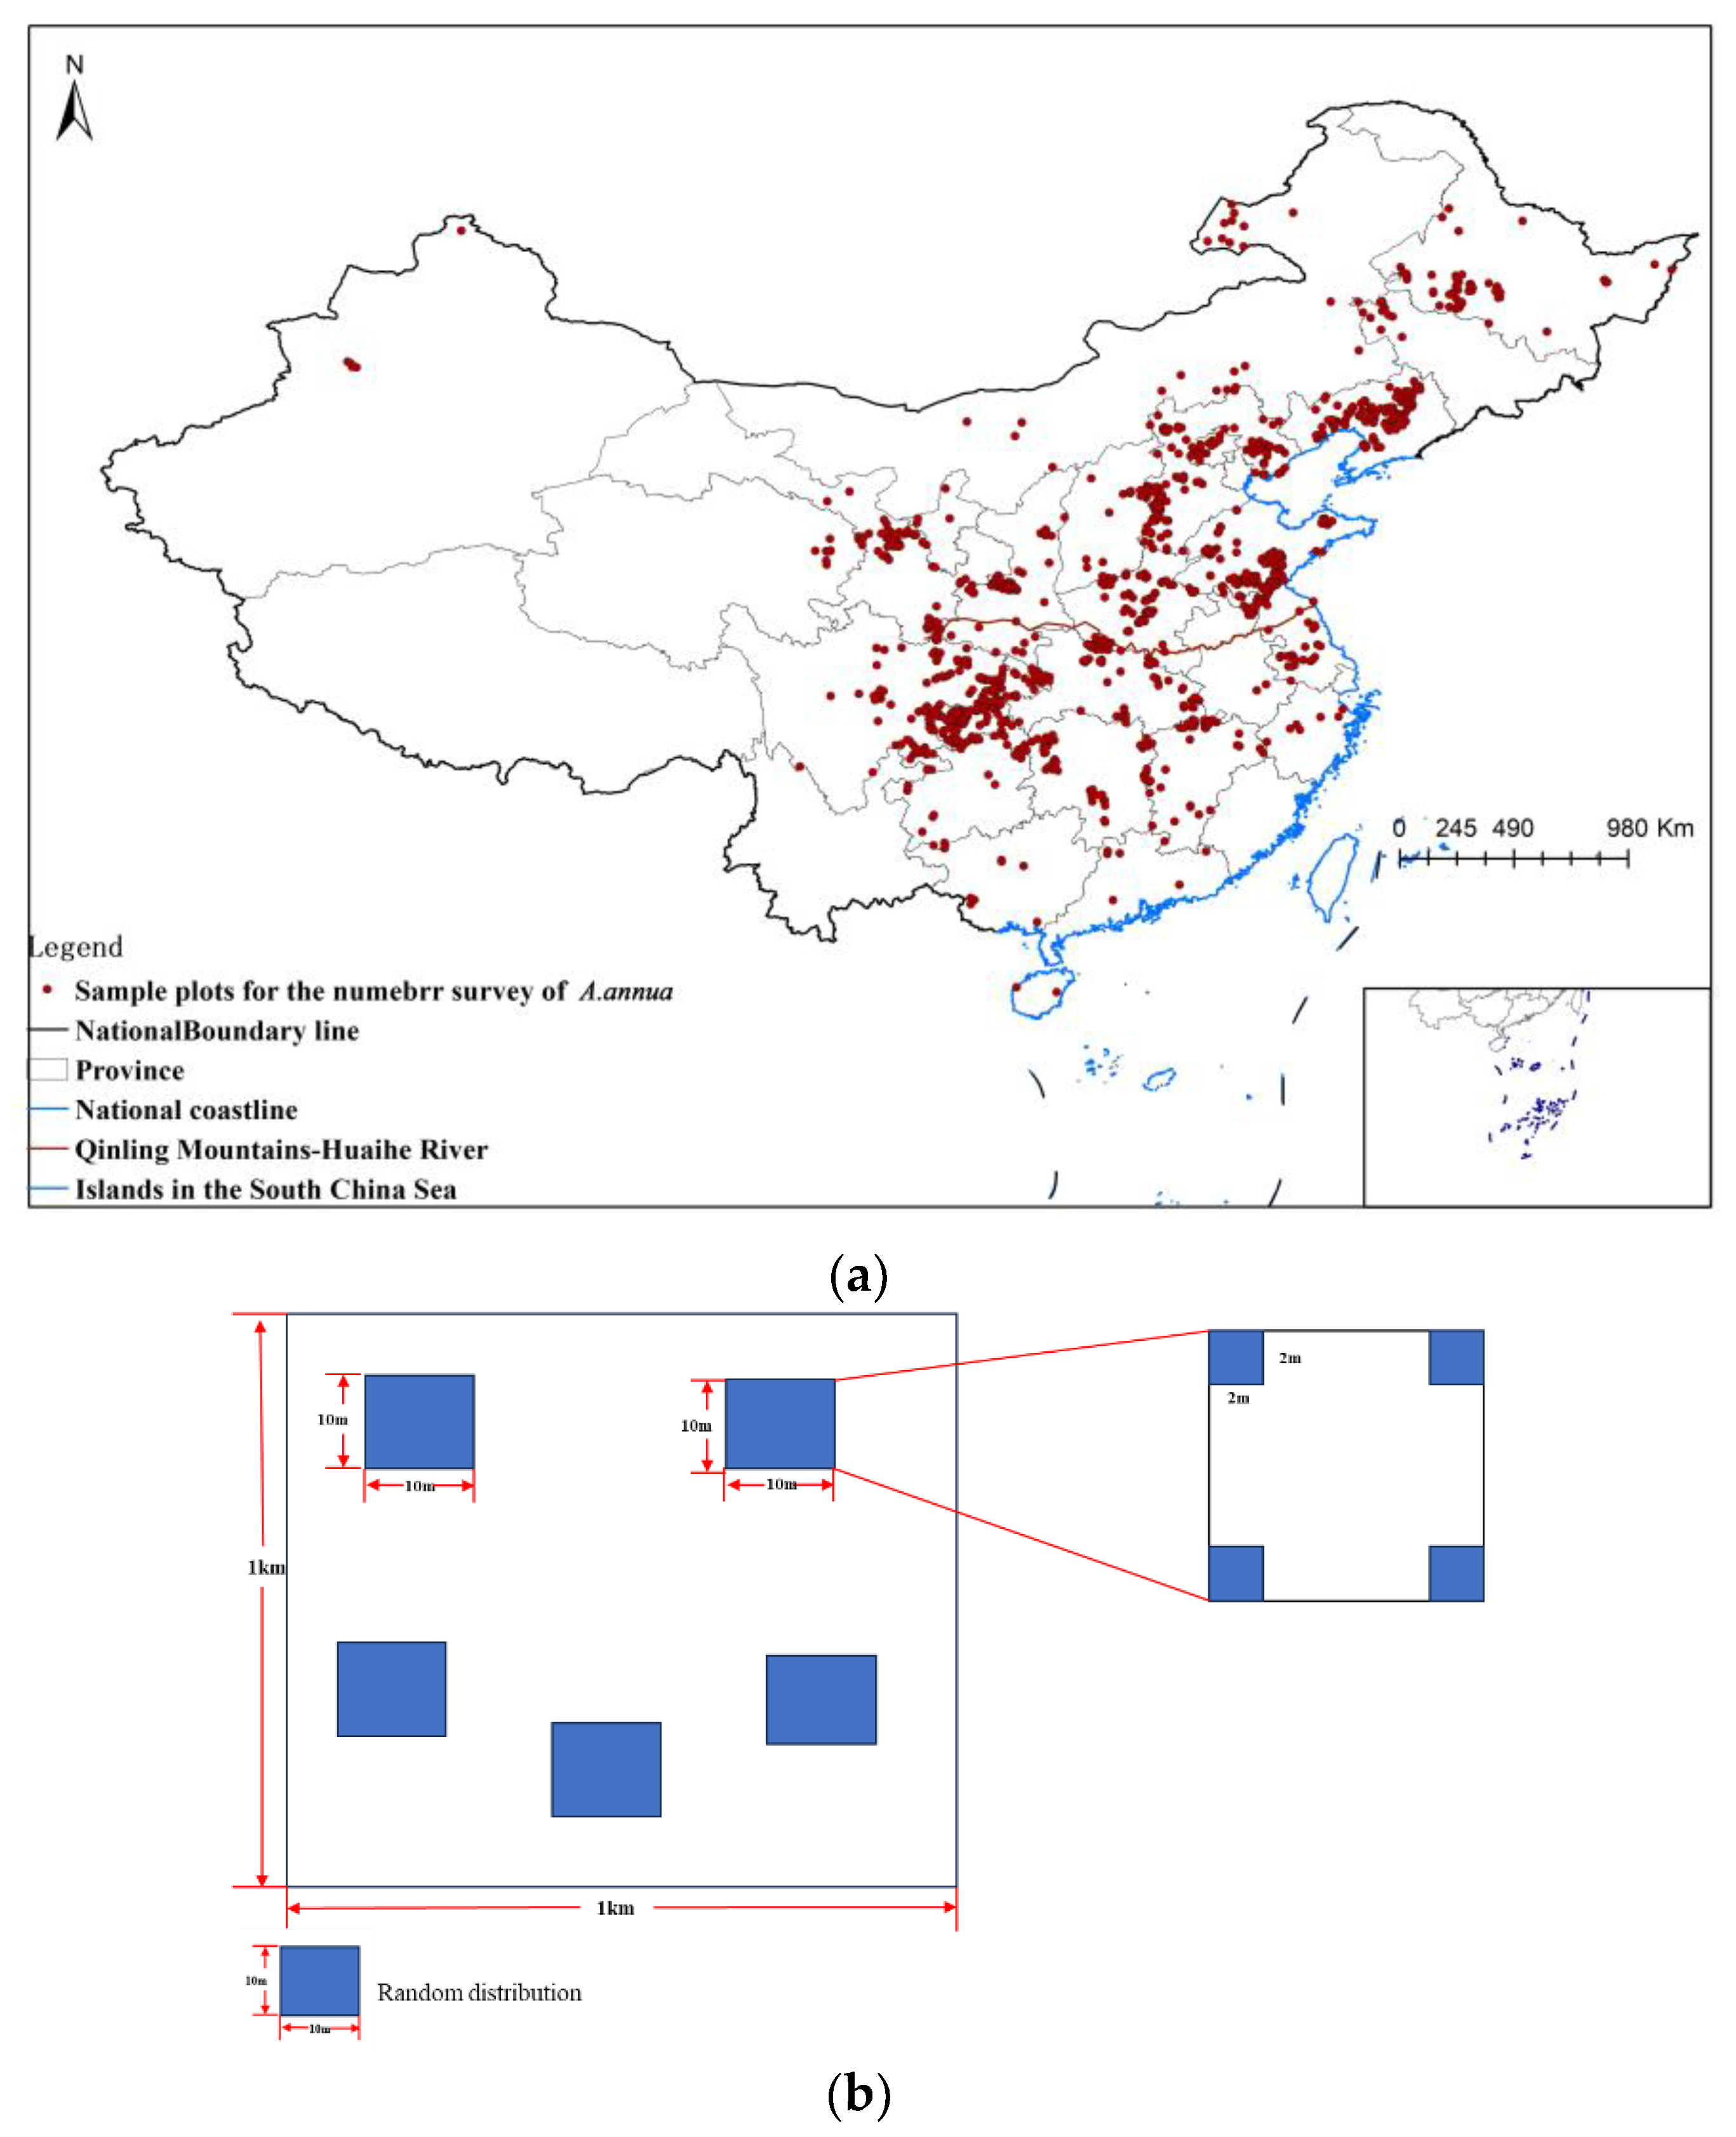
4.1.1. Study Scope and Species Distribution Points
4.1.2. Estimation of the Number of A. annua 1 km Survey Plots
4.1.3. Selection and Preprocessing of Explanatory Variables
4.2. Methods
4.2.1. Method for Studying the Ecologically Suitable Areas of A. annua in China
4.2.2. Method for Estimating the of Amount A. annua in China
5. Conclusions
Author Contributions
Funding
Data Availability Statement
Acknowledgments
Conflicts of Interest
References
- National Pharmacopoeia Commission. Pharmacopoeia of People’s Republic of China. Part I; China Medical Science and Technology Press: Beijing, China, 2020; p. 207. [Google Scholar]
- Rosemary, A.; DeJesus, K.J.; Samjhana, P.; Pashikanti, S.; Mateen, S.; Sharma, K. Extraction, Isolation and Characterization of Bioactive Compounds from Artemisia and Their Biological Significance: A Review. Molecules 2021, 26, 6995. [Google Scholar] [CrossRef] [PubMed]
- Yuan, Y.N.; Jiang, T.L.; Zhou, X.; Liu, Y. Discovery and development of artemisinin. Chin. Sci. Bull. 2017, 62, 1914–1927. (In Chinese) [Google Scholar] [CrossRef]
- Ranjana, S.; Gauri, S.; Pradipto, M.; Gupta, V. A concise review on Artemisia annua L. A major source of diverse medicinal compounds. Ind. Crops Prod. 2022, 184, 115072. [Google Scholar]
- Long, J.H.; Xiong, S.; Liu, S.Q.; Xiao, W.J. Advances in Artemisia annua artemisinin research. Hunan Agric. Sci. 2015, 06, 145–147. [Google Scholar]
- Ferreira, F.J.; Luthria, L.D.; Sasaki, T.; Heyerick, A. Flavonoids from Artemisia annua L. as Antioxidants and Their Potential Synergism with Artemisinin against Malaria and Cancer. Molecules 2010, 15, 3135. [Google Scholar] [CrossRef] [PubMed]
- Ding, F.; Ma, T.; Hao, M.; Wang, Q.; Chen, S.; Wang, D.; Huang, L.; Zhang, X.; Jiang, D. Mapping Worldwide Environmental Suitability for Artemisia annua L. Sustainability 2020, 12, 1309. [Google Scholar] [CrossRef]
- Wang, D.; Shi, C.; Alamgir, K.; Kwon, S.; Pan, L.; Zhu, Y.; Yang, X. Global assessment of the distribution and conservation status of a key medicinal plant (Artemisia annua L.): The roles of climate and anthropogenic activities. Sci. Total Environ. 2022, 821, 153378. [Google Scholar] [CrossRef] [PubMed]
- Qin, Z.; Jian, W.; Jie, G.; Cheng Zhong, S.; Cai Xiang, C. Production regionalization of Artemisia annua. Plant Prot. J. 2018, 45, 503–510. [Google Scholar]
- Huang, L.; Xie, C.; Duan, B.; Chen, S. Mapping the potential distribution of high artemisinin-yielding Artemisia annua L. (Qinghao) in China with a geographic information system. Chin. Med. 2010, 5, 18. [Google Scholar] [CrossRef] [PubMed]
- Fan, Z.T.; Ma, X.J.; Feng, S.X.; Zhang, M.Q.; Zhang, L.; Li, Z.T. Regional planning of the ecological and cliamtic feasibility for Artemisia annua L. in Guangxi Zhuang Autonomous Region. J. Cap. Norm. Univ. (Nat. Sci. Ed.) 2009, 30, 91–96. (In Chinese) [Google Scholar]
- Zhang, X.B.; Guo, L.P.; Huang, L.Q. Climate suitable rank distribution of artemisinin content of Artemisia annua in China. Acta Pharm. Sin. 2011, 4, 472–478. (In Chinese) [Google Scholar]
- Merow, C.; Smith, M.J.; Silander, J.A., Jr. A practical guide to MaxEnt for modeling species distributions: What it does, and why inputs and settings matter. Ecography 2013, 36, 1058–1069. [Google Scholar] [CrossRef]
- Kumar, S.; Stohlgren, T.J. MaxEnt modeling for predicting suitable habitat for threatened and endangered tree Canacomyrica monticola in New Caledonia. J. Ecol. Nat. Environ. 2009, 1, 94–98. [Google Scholar]
- Phillips, S.J.; Dudik, M. Modeling of species distributions with MaxEnt: New extensions and a comprehensive evaluation. Ecography 2010, 31, 161–175. [Google Scholar] [CrossRef]
- Verbruggen, H.; Tyberghein, L.; Belton, G.S.; Mineur, F.; Jueterbock, A.; Hoarau, G.; Gurgel, C.F.D.; De Clerck, O. Improving transferability of introduced species’ distribution models: New tools to forecast the spread of a highly invasive seaweed. PLoS ONE 2013, 8, e68337. [Google Scholar] [CrossRef] [PubMed]
- Chan, L.M.; Brown, J.L.; Yoder, A.D. Integrating statistical genetic and geospatial methods brings new power to phylogeography. Mol. Phylogenet. Evol. 2011, 59, 523537. [Google Scholar] [CrossRef] [PubMed]
- Zuo, D.; Wu, C.; Zheng, Y.; Chen, X.; Wang, L. Climate change and human activity impacts on future flood risk in the Pearl River Delta based on the MaxEnt model. Front. Earth Sci. 2023, 10, 1053829. [Google Scholar] [CrossRef]
- Xu, M.; Xing, T.; Han, M. Spatial-temporal Data Interpolation Based on Spatial-temporal Kriging Method. Acta Autom. Sin. 2020, 46, 1681–1688. [Google Scholar]
- Zeng, Z.C.; Lei, L.P.; Hou, S.S.; Ru, F.; Guan, X.H.; Zhang, B. A regional gap-filling method based on spatiotemporal variogram model of CO, columns. IEEE Trans. Geosci. Remote Sens. 2014, 52, 3594–3603. [Google Scholar] [CrossRef]
- McDaniel, M.D.; Simpson, R.G.; Malone, B.P.; McBratney, A.B.; Minasny, B.; Adams, M.A. Quantifying and predicting spatio-temporal variability of soil CH4 and N2O fluxes from a seemingly homogeneous Australian agricultural field. Agric. Ecosyst. Environ. 2017, 240, 182–193. [Google Scholar] [CrossRef]
- Li, S.; Shu, H.; Xu, Z.-Q. Study on spatial temporal Kriging interpolation of monthly precipitation in three provinces of northeast China. J. China Hydrol. 2011, 31, 31–35. [Google Scholar]
- Du, Z.; Wu, S.; Kwan, M.P.; Zhang, C.; Zhang, F.; Liu, R. A spatiotemporal regression-kriging model for space-time interpolation: A case study of chlorophyll-a prediction in the coastal areas of Zhejiang, China. Int. J. Geogr. Inf. Sci. 2018, 32, 1927–1947. [Google Scholar] [CrossRef]
- Fang, S.; Giudice, D.D.; Scavia, D.; Binding, C.E.; Bridgeman, T.B.; Chaffin, J.D.; Evans, M.A.; Guinness, J.; Johengen, T.H.; Obenour, D.R. A space-time geostatistical model for probabilistic estimation of harmful algal bloom biomass and areal extent. Sci. Total Environ. 2019, 695, 133776. [Google Scholar] [CrossRef] [PubMed]
- Wang, J.; Xu, C. Geographical detectors: Principles and prospects. Acta Geogr. Sin. 2017, 72, 116–134. [Google Scholar]
- Qin, M.; Xu, H.; Huang, J. Investigating the Impact of Streetscape and Land Surface Temperature on Cycling Behavior. Sustainability 2024, 16, 1990. [Google Scholar] [CrossRef]
- Wang, J.F.; Li, X.H.; Christakos, G.; Liao, Y.; Zhang, T.; Gu, X.; Zheng, X. Geographical detectors-based health risk assessment and its application in the neural tube defects study of the He shun region, China. Int. J. Geogr. Inf. Sci. 2010, 24, 107–127. [Google Scholar] [CrossRef]
- Deng, X.; Hu, S.; Zhan, C. Attribution of vegetation coverage change to climate change and human activities based on the geographic detectors in the yellow river basin, China. Environ. Sci. Pollut. Res. 2022, 29, 44693–44708. [Google Scholar] [CrossRef] [PubMed]
- Wu, J.; Li, X.; Li, S.; Liu, C.; Yi, T.; Zhao, Y. Spatial heterogeneity and attribution analysis of urban thermal comfort in China from 2000 to 2020. Int. J. Environ. Res. Public Health 2022, 19, 5683. [Google Scholar] [CrossRef] [PubMed]
- Zhu, Z.; Dai, Z.; Li, S.; Feng, Y. Spatiotemporal Evolution of Non-Grain Production of Cultivated Land and Its Underlying Factors in China. Int. J. Environ. Res. Public Health 2022, 19, 8210. [Google Scholar] [CrossRef] [PubMed]
- Phillips, S.J.; Anderson, R.P.; Schapire, R.E. Maximum entropy modeling of species geographic distributions. Ecol. Model. 2006, 190, 231–259. [Google Scholar] [CrossRef]
- Ahmed, S.E.; McInerny, G.; O’Hara, K.; Harper, R.; Salido, L.; Emmott, S.; Joppa, L.N. Scientists and software surveying the species distribution modelling community. Divers. Distrib. 2015, 21, 258–267. [Google Scholar] [CrossRef]
- Barbosa, G.F.; Schneck, F. Characteristics of the top-cited papers in species distribution predictive models. Ecol. Model. 2015, 313, 77–83. [Google Scholar] [CrossRef]
- Fu, X. Biological characteristics of Artemisia annua in Xining area. J. Qinghai Univ. (Nat. Sci. Ed.) 2007, 04, 74–75. [Google Scholar]
- Ranc, N.; Santini, L.; Rondinini, C.; Boitani, L.; Poitevin, F.; Angerbjörn, A.; Maiorano, L. Performance tradeoffs in target-group bias correction for species distribution models. Ecography 2017, 40, 1076–1087. [Google Scholar] [CrossRef]
- Sekuli, A.; Kilibarda, M.; Proti, D.; Perčec Tadić, M. Spatio-temporal regression kriging model of mean daily temperature for Croatia. Theor. Appl. Climatol. 2020, 140, 101–114. [Google Scholar] [CrossRef]
- Peng, S.; Ding, Y.; Liu, W.; Li, Z. 1 km monthly temperature and precipitation dataset for China from 1901 to 2017. Earth Syst. Sci. Data 2019, 11, 1931–1946. [Google Scholar] [CrossRef]
- Editorial Committee of Flora of China, Chinese Academy of Sciences. Flora of China; Science Press: Beijing, China, 1993; Volume 76, pp. 62–65. [Google Scholar]
- Gao, J.; Shi, Y.; Zhang, H.; Chen, X.; Zhang, W.; Shen, W.; Xiao, T.; Zhang, Y.; China Regional 250 m Normalized Difference Vegetation Index Data Set (2000–2022). National Tibetan Plateau Third Pole Environment Data Center. 2023. Available online: https://data.tpdc.ac.cn/en/data/10535b0b-8502-4465-bc53-78bcf24387b3 (accessed on 3 March 2023).
- Gao, J.; Shi, Y.; Zhang, H.; Chen, X.; Zhang, W.; Shen, W.; Xiao, T.; Zhang, Y.; China Regional 250 m Fractional Vegetation Cover Data Set (2000–2022). National Tibetan Plateau Third Pole Environment Data Center. 2022. Available online: https://data.tpdc.ac.cn/zh-hans/data/f3bae344-9d4b-4df6-82a0-81499c0f90f7 (accessed on 3 March 2023).
- Zhang, H.; Zhao, H.X.; Wang, H. Potential geographical distribution of Populus euphratica in China under future climate change scenarios based on Maxent model. Acta Ecol. Sin. 2020, 40, 6552–6563. [Google Scholar]
- Graham, C.H.; Ferrier, S.; Huettman, F. New developments inmuseum-based informatics and applications in biodiversity analysis. Trends Ecol. Evol. 2004, 19, 497–503. [Google Scholar] [CrossRef] [PubMed]
- Zhang, L.; Wang, L.; Liu, S.; Sun, P.; Yu, Z.; Huang, S.; Zhang, X. Comparative evaluation of four threshold selection methods in the process of converting habitat probability prediction value to binary value: A case study of habitat prediction of Davidia involucrata and Chinese fir. Chin. J. Plant Ecol. 2017, 41, 387–395. [Google Scholar]
- Wang, J.; Zhang, T.; Fu, B. A measure of spatial stratified heterogeneity. Ecol. Indic. 2016, 67, 250–256. [Google Scholar] [CrossRef]
- Yang, L.; Li, S.; Gu, A.; Li, L.; Wang, X.; Yang, B.; Yan, S. Preliminary study on reproductive biology of Artemisia annua. Southwest Agric. J. 2008, 4, 1036–1039. [Google Scholar]
- Gelfand, A.E.; Dey, D.K. Bayesian Model Choice: Asymptotics and Exact Calculations. J. R. Stat. Soc. Ser. B (Methodol.) 1994, 56, 501–514. [Google Scholar] [CrossRef]
- Qin, Q.; Wang, H.; Lei, X.; Li, X.; Xie, Y.; Zheng, Y. Spatial variability in the amount of forest litter at the local scale in northeastern China: Kriging and cokriging approaches to interpolation. Ecol. Evol. 2020, 10, 778–790. [Google Scholar] [CrossRef] [PubMed]


| Variable | Percent Contribution | Permutation Importance |
|---|---|---|
| FVC | 28.1 | 13.0 |
| Bio 10 | 7.9 | 1.1 |
| Bio 03 | 7.5 | 3.4 |
| Bio 16 | 7.3 | 0.0 |
| Bio 01 | 6.9 | 0.1 |
| Bio 11 | 6.8 | 15.4 |
| Bio 04 | 6.1 | 10.4 |
| Bio 19 | 4.4 | 8.2 |
| Elev | 4.0 | 7.0 |
| Bio 09 | 2.8 | 5.2 |
| Bio 02 | 2.7 | 13.6 |
| Bio 13 | 2.1 | 3.4 |
| NDVI | 1.6 | 1.0 |
| tmx_2019_9 | 1.6 | 1.1 |
| Bio 07 | 1.5 | 1.4 |
| Bio 14 | 1.4 | 2.0 |
| Slope | 1.3 | 1.0 |
| Bio 18 | 1.2 | 5.3 |
| Bio 06 | 1.1 | 0.1 |
| Bio 12 | 1.0 | 1.2 |
| Bio 08 | 0.8 | 1.0 |
| tmn_2019_9 | 0.6 | 0.9 |
| Bio 15 | 0.4 | 0.6 |
| tmp_2019_9 | 0.3 | 0 |
| Bio 05 | 0.3 | 1.5 |
| 2019_9_pre | 0.3 | 2.0 |
| Aspect | 0.1 | 0.2 |
| Bio 17 | 0.0 | 0.1 |
| Different Stratification | q | p |
|---|---|---|
| Northern and southern stratification of China | 0.02 | 0.000 |
| Stratification by season | 0.01 | 0.030 |
| Stratification by month | 0.001 | 0.616 |
| Title 1 | MAE | RMSE |
|---|---|---|
| North | 293,000 | 713,000 |
| South | 142,000 | 302,000 |
| Total | 233,000 | 585,000 |
| Variable | q Statistic | p Value |
|---|---|---|
| BIO 16 | 0.09 | 0.000 |
| BIO 18 | 0.08 | 0.000 |
| BIO 12 | 0.08 | 0.000 |
| BIO 11 | 0.08 | 0.000 |
| BIO 9 | 0.08 | 0.000 |
| BIO 17 | 0.07 | 0.000 |
| BIO 7 | 0.07 | 0.000 |
| BIO 19 | 0.07 | 0.000 |
| BIO 1 | 0.07 | 0.000 |
| Type of vegetation | 0.07 | 0.000 |
| BIO 8 | 0.07 | 0.000 |
| BIO 6 | 0.06 | 0.000 |
| BIO 4 | 0.06 | 0.000 |
| BIO 10 | 0.06 | 0.000 |
| BIO 13 | 0.06 | 0.000 |
| BIO 14 | 0.06 | 0.000 |
| Type of soil | 0.05 | 0.000 |
| BIO 5 | 0.05 | 0.000 |
| Organic carbon content | 0.04 | 0.000 |
| BIO 15 | 0.04 | 0.000 |
| pH value of soil | 0.04 | 0.000 |
| BIO 2 | 0.04 | 0.000 |
| Slope | 0.03 | 0.000 |
| BIO 3 | 0.03 | 0.000 |
| Clay content of soil | 0.02 | 0.000 |
| elevation | 0.02 | 0.000 |
| Sand content of the soil | 0.02 | 0.000 |
| aspect | 0.00 | 0.250 |
| Effective water content of soil | 0.00 | 0.640 |
| Year | Sample Sites | Number of A. annua Specimens (Millions) |
|---|---|---|
| 2012 | 166 | 44.225 |
| 2013 | 222 | 49.6375 |
| 2014 | 159 | 46.95 |
| 2015 | 132 | 27.7875 |
| 2016 | 15 | 14.7375 |
| 2017 | 39 | 7.4125 |
| 2018 | 347 | 109.125 |
| 2019 | 472 | 128.9 |
| 2020 | 27 | 12.325 |
| Variables | Description |
|---|---|
| BIO1 | Annual Mean Temperature |
| BIO2 | Mean Diurnal Range (Mean of monthly temperature (max temp–min temp)) |
| BIO3 | Isothermality (BIO2/BIO7) (×100) |
| BIO4 | Temperature Seasonality (standard deviation × 100) |
| BIO5 | Max Temperature of Warmest Month |
| BIO6 | Min Temperature of Coldest Month |
| BIO7 | Temperature Annual Range (BIO5–BIO6) |
| BIO8 | Mean Temperature of Wettest Quarter |
| BIO9 | Mean Temperature of Driest Quarter |
| BIO10 | Mean Temperature of Warmest Quarter |
| BIO11 | Mean Temperature of Coldest Quarter |
| BIO12 | Annual Precipitation |
| BIO13 | Precipitation of Wettest Month |
| BIO14 | Precipitation of Driest Month |
| BIO15 | Precipitation Seasonality (Coefficient of Variation) |
| BIO16 | Precipitation of Wettest Quarter |
| BIO17 | Precipitation of Driest Quarter |
| BIO18 | Precipitation of Warmest Quarter |
| BIO19 | Precipitation of Coldest Quarter |
| elev | Elevation |
| Per | Precipitation |
| tmin | Monthly Minimum Temperature |
| tmax | Monthly Maximum Temperature |
| NDVI | Normalized Difference Vegetation Index |
| FVC | Fraction Vegetation Coverage |
Disclaimer/Publisher’s Note: The statements, opinions and data contained in all publications are solely those of the individual author(s) and contributor(s) and not of MDPI and/or the editor(s). MDPI and/or the editor(s) disclaim responsibility for any injury to people or property resulting from any ideas, methods, instructions or products referred to in the content. |
© 2024 by the authors. Licensee MDPI, Basel, Switzerland. This article is an open access article distributed under the terms and conditions of the Creative Commons Attribution (CC BY) license (https://creativecommons.org/licenses/by/4.0/).
Share and Cite
Wang, J.; Shi, T.; Wang, H.; Li, M.; Zhang, X.; Huang, L. Estimating the Amount of the Wild Artemisia annua in China Based on the MaxEnt Model and Spatio-Temporal Kriging Interpolation. Plants 2024, 13, 1050. https://doi.org/10.3390/plants13071050
Wang J, Shi T, Wang H, Li M, Zhang X, Huang L. Estimating the Amount of the Wild Artemisia annua in China Based on the MaxEnt Model and Spatio-Temporal Kriging Interpolation. Plants. 2024; 13(7):1050. https://doi.org/10.3390/plants13071050
Chicago/Turabian StyleWang, Juan, Tingting Shi, Hui Wang, Meng Li, Xiaobo Zhang, and Luqi Huang. 2024. "Estimating the Amount of the Wild Artemisia annua in China Based on the MaxEnt Model and Spatio-Temporal Kriging Interpolation" Plants 13, no. 7: 1050. https://doi.org/10.3390/plants13071050
APA StyleWang, J., Shi, T., Wang, H., Li, M., Zhang, X., & Huang, L. (2024). Estimating the Amount of the Wild Artemisia annua in China Based on the MaxEnt Model and Spatio-Temporal Kriging Interpolation. Plants, 13(7), 1050. https://doi.org/10.3390/plants13071050