Article

Population Structures and Dynamics of Rhododendron Communities with Different Stages of Succession in Northwest Guizhou, China

1
College of Animal Science, Guizhou University, Guiyang 550025, China
2
College of Data Science and Information Engineering, Guizhou Minzu University, Guiyang 550025, China
3
Institute of Agro-Bioengineering, Guizhou University, Guiyang 550025, China
4
Institute of Azalea, Baili Azalea Management Committee, Bijie 551614, China
*
Author to whom correspondence should be addressed.
Plants 2024, 13(7), 946; https://doi.org/10.3390/plants13070946
Submission received: 25 February 2024 / Revised: 21 March 2024 / Accepted: 22 March 2024 / Published: 25 March 2024
(This article belongs to the Section Plant Ecology)

Abstract

:
To explore the population structures and dynamics of Rhododendron shrub communities at different stages of succession in northwest Guizhou, China, this study examined the populations of Rhododendron annae and Rhododendron irroratum shrub with two different stages. A space-for-time substitution was employed to establish the diameter class/height structures, static life tables, and survival/mortality rate/disappearance rate curves of both Rhododendron populations with different orders of succession. Their structural and quantitative dynamics were analyzed, and their development trends were predicted. The results showed that, quantitatively, the populations of R. annae and R. irroratum in the two Rhododendron communities with different orders of succession were dominated by age classes one, two, and three as well as height classes i, ii, and iii. The number of Rhododendron plants at the three age classes and the three height classes accounted for 97.61–100% of the total. The quantitative dynamic indices of R. annae and R. irroratum were both greater than 0, with and without considering external interference. In terms of age class and height structures, both Rhododendron populations were expanding populations, presenting “inverted-J-shaped” and irregular pyramid patterns. There was a sufficient number of young individuals, but few or no old individuals. Both survival curves of the populations of R. annae and R. irroratum in the two Rhododendron communities with different orders of succession belonged to the Deevy-II type. In the late stage of succession, the mortality curves and disappearance curves of both Rhododendron populations in these communities presented a trend of increasing first and then decreasing with increasing age class. This result indicates that at each age class, R. annae and R. irroratum showed a trend of gradual increase after two, four, and six years. In brief, the populations of R. annae and R. irroratum have rich reserves of seedlings and saplings, but high mortality and disappearance rates. In this context, it is necessary to reduce human interference and implement targeted conservation measures to promote the natural renewal of Rhododendron populations.

1. Introduction

A population is the sum of individuals of the same species that occupy a certain space within a certain period. It reflects a link among individuals, communities, and ecosystems, and a fundamental component of communities [1]. The biological and ecological characteristics of plant populations are the result of long-term adaptation to and selection of environmental conditions. The dynamic changes in the size or quantity of a population on the spatiotemporal scale reflect the composition and development trends of the population; they also reflect the interactive relationship between the population and the environment and its position and role in the community [2,3]. The dynamics of population structure and quantity, which are among the core contents of ecological research, cover diameter class, height class, age class, and other items. Changes in these items directly affect community characteristics and objectively characterize the development and evolution trends of communities [1,4]. By examining the structure of a population using methods such as static life tables, survival curves, and survival analyses, it is possible to disclose the survival status of the population and the fitness and interactions of plants with the environment in the community [5,6,7]. Succession—the process of one community being replaced by another—is the most important characteristic of the dynamics of plant communities, an important pathway for ecological restoration and reconstruction, and the foundation for maintaining community dynamics stability and sustainable development [8,9]. In this sense, analyzing the structures and dynamics of plant populations is of great importance for elucidating the succession routes of plant communities.
Rhododendron (Ericaceae) is one of the largest genera of angiosperms, with important ornamental, cultural, scientific, economic, and medicinal values. There are over 1200 species of Rhododendron worldwide, over 900 of which are distributed in Asia and more than half of them in southwest China, which is the distribution and evolution center of Rhododendron plants in modern times [10,11,12,13,14]. Guizhou is located at the edge of the center and the transition zone of its eastward spread and is home to more than 110 naturally distributed Rhododendron species, second only to Yunnan, Sichuan, and Tibet [15,16]. Northwest Guizhou is the most important region in the distribution of the Rhododendron taxa in Guizhou, with a total of six subgenera and more than 50 species, accounting for about half of the Rhododendron plants in Guizhou. In this regard, the Baili Azalea Nature Reserve, located at the junction of Qianxi County and Dafang County, is the most representative and important habitat [17,18]. It is also a typical representative of the world’s largest and continuously distributed natural wild Rhododendron communities in middle-to-low-altitude mountainous areas [19]. In this region, Rhododendron shrub-based communities with different orders of succession cover grass rangelands, rose shrubs, Rhododendron shrubs, oak shrubs, and oak evergreen forests. However, the position, competitiveness, and stability of Rhododendron shrubs in these communities remain unclear.
Many scholars have conducted preliminary research and analyses on the Rhododendron shrubs in northwest Guizhou, China, from the perspectives of germplasm resources, community characteristics, and interference effects of Rhododendron plants [20,21,22]. However, these studies rarely touch upon the population structures or dynamics of Rhododendron in natural Rhododendron shrub communities at different stages of succession. This study takes the successional communities of Rhododendron annae and Rhododendron irroratum—two Rhododendron populations widely distributed throughout northwest Guizhou—as research objects. By analyzing the population structures and dynamics of R. annae and R. irroratum in two Rhododendron communities with different orders of succession, a theoretical basis is provided for the scientific protection, tourism development, and sustainable development of Rhododendron plants in northwest Guizhou.
The present study was conducted to achieve the following objectives: (1) to characterize the population structures or dynamics of Rhododendron in natural Rhododendron shrub communities at different stages of succession, (2) to explore the growth status of two Rhododendron species in communities at different successional stages, (3) to assess the self-renewal ability of the Rhododendron populations under natural conditions.

2. Results

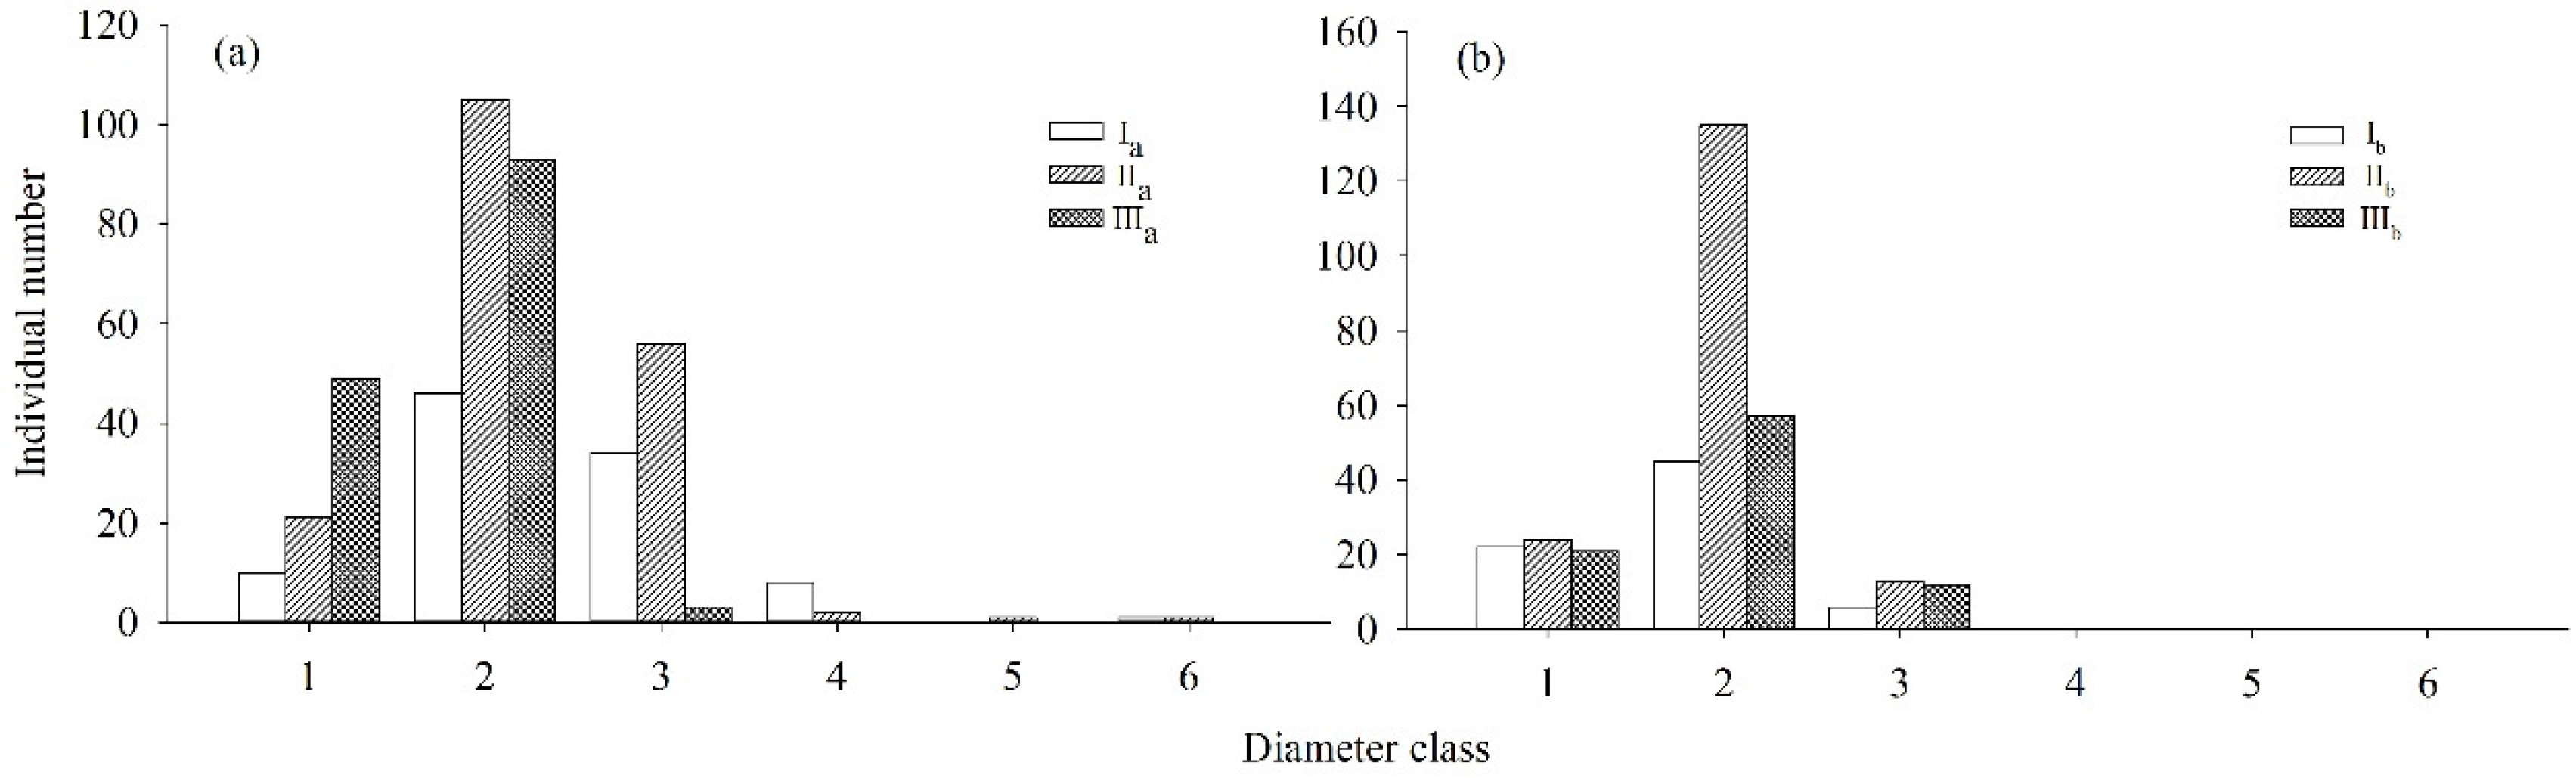
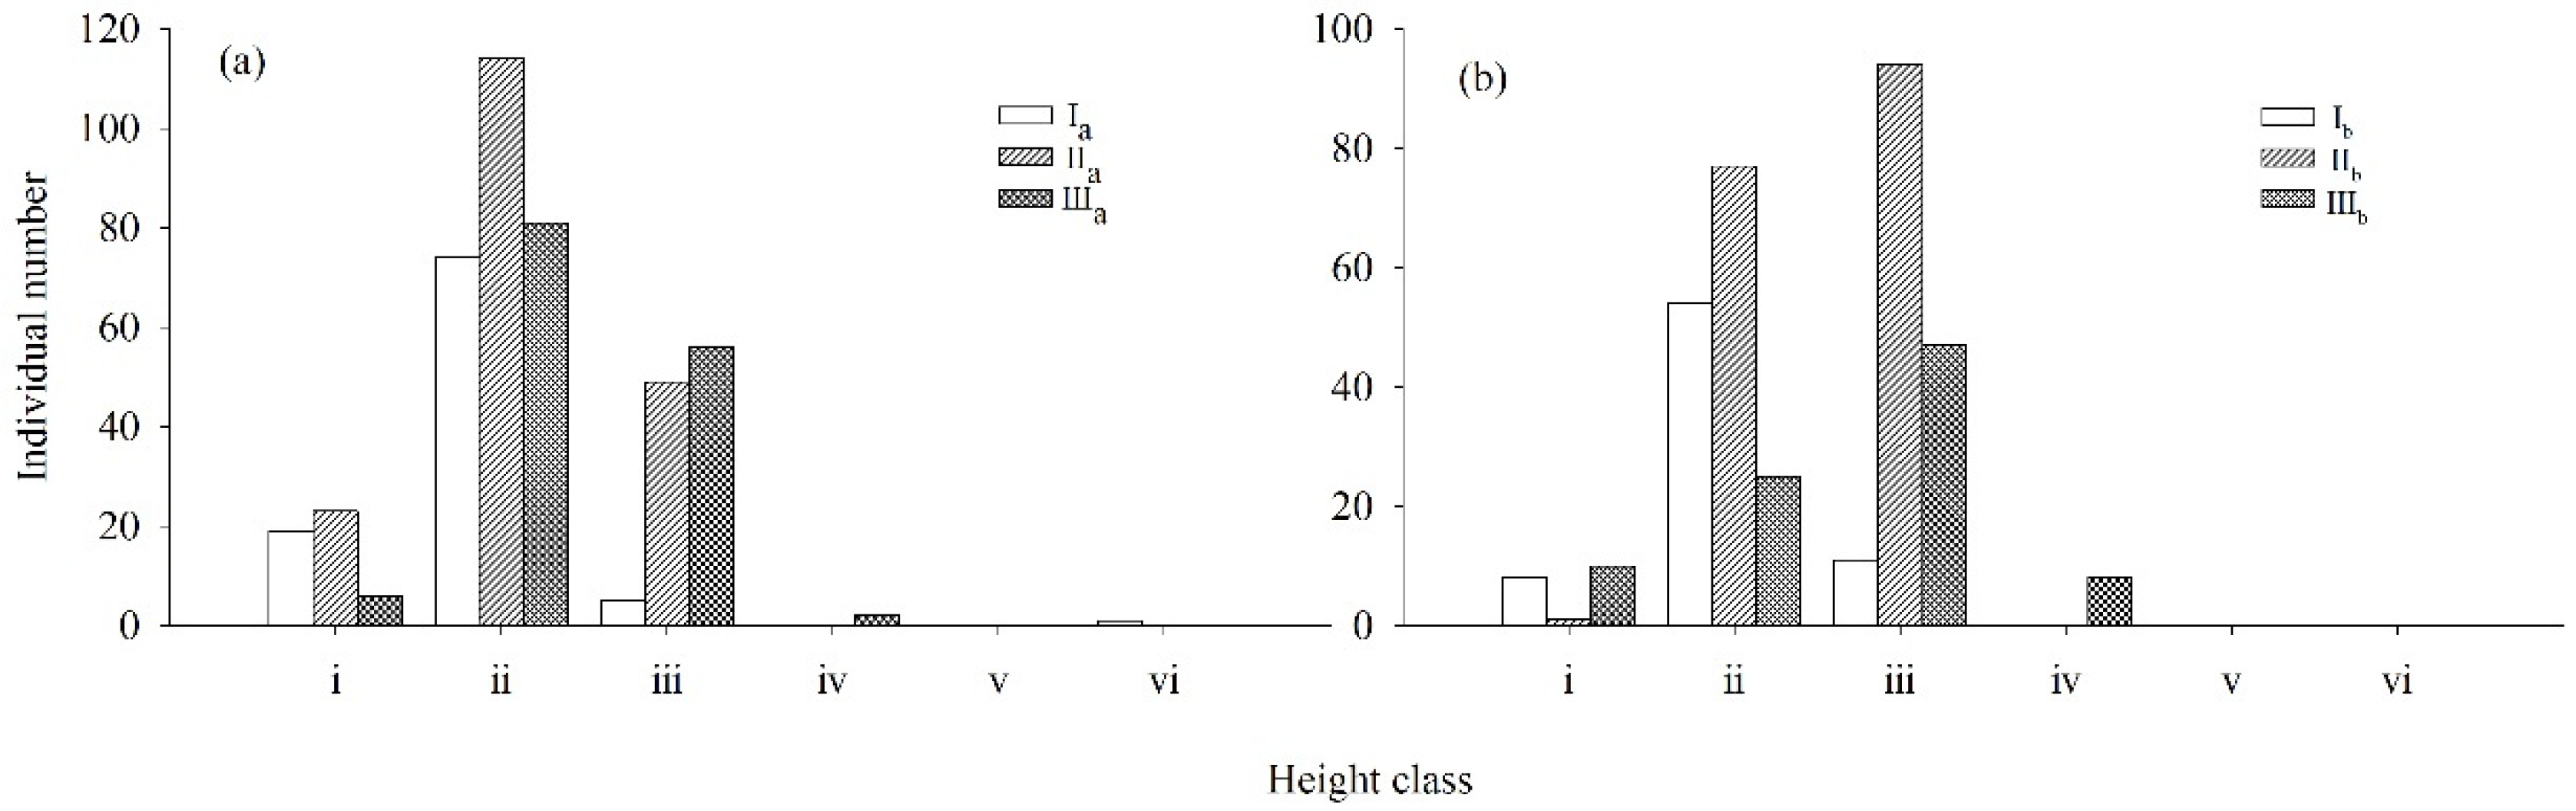
2.1. Quantification of Densities, Diameter Class/Height Structures, and Dynamics of Both Rhododendron Populations

The results of this survey found that a total of 765 Rhododendron plants were examined for the two orders of succession. To be specific, there were 430 R. annae plants (99, 186, and 145 in communities Ia, IIa, and IIIa, respectively) and 335 R. irroratum plants (73, 172, and 90 in communities Ib, IIb, and IIIb, respectively). The quantity of R. annae was 128.36% of that of R. irroratum (Figure 1).
R. annae (communities Ia, IIa, and IIIa) and R. irroratum (communities Ib, IIb, and IIIb) were both dominated by age classes one, two, and three. The total quantities of R. annae and R. irroratum for these three age classes accounted for 96.98% and 100.00% of the total quantity of Rhododendron plants, respectively. There were few Rhododendron plants in age class 4, 5, or 6, except for 12 R. annae plants. In terms of age structure, the two Rhododendron populations in each stage of succession were both expanding populations (Figure 2).
The dynamic changes in quantity between different age groups of R. annae and R. irroratum populations between age classes at different stages of succession are presented. In community Ia, the quantitative dynamic indices of R. annae at age classes one and five (V1 and V5) indicated an increase in population size, whereas the quantitative dynamic indices at other age classes (V2, V3, V4, and V6) indicated a decrease in population size. In community IIa, the quantitative dynamic indices of R. annae at all age classes (except age class 5; i.e., V1, V2, V3, V4, and V6) were greater than 0. Notably, V5 was equal to 0. In community IIIa, only the quantitative dynamic index of R. annae at age class 1 (V1) was less than 0, whereas those at age classes two and three (i.e., V2 and V3) were both greater than 0. The quantitative dynamic indices of R. annae with and without considering external interference (Vpi and V′pi) were both greater than 0, with variation ranges of 39.57–48.15% and 2.67–7.90%, respectively. In communities Ib, IIb, and IIIb, the quantitative dynamic index of R. irroratum at age class one (V1) was uniformly less than 0, whereas those at age classes two and three (i.e., V2 and V3) were both greater than 0. The quantitative dynamic indices of R. irroratum with and without considering external interference (Vpi and V′pi) were both greater than 0 as well, with variation ranges of 46.24–67.02% and 0.76–1.28%, respectively (Table 1).
R. annae (communities Ia, IIa, and IIIa) and R. irroratum (communities Ib, IIb, and IIIb) were both dominated by height classes i, ii, and iii. The total quantities of R. annae and R. irroratum at these three height classes accounted for 99.53% and 97.61% of the total quantity of Rhododendron plants, respectively. There were few Rhododendron plants at height class iv, v, or vi, except for twelve R. annae plants and eight R. irroratum plants. The individual numbers of R. annae (communities Ia, IIa, and IIIa) and R. irroratum (communities Ib, IIb, and IIIb) both presented a trend of increasing first and then decreasing with increasing height. The plant numbers of R. annae at height classes i and ii presented a trend of increasing first and then decreasing with orders of succession. There were 19, 23, and 6 R. annae plants at height class i, as well as 74, 114, and 81 R. annae plants at height class ii, respectively. The plant number of R. annae at height class iii exhibited a gradually increasing trend with orders of succession. There were 5, 114, and 81 R. annae plants at height class iii, respectively. At height classes iv and vi, communities IIIa and Ia each contained one R. annae plant. The height structures of R. annae in the three communities with different orders of succession both represented the expanding type (Figure 3).
In communities Ib, IIb, and IIIb, the plant numbers of R. irroratum at height class i presented a trend of decreasing first and then increasing with orders of succession. There were eight, one, and ten R. irroratum plants at height class i, respectively. The plant numbers of R. irroratum at height classes ii and iii presented a trend of increasing first and then decreasing with orders of succession. There were 54, 77, and 25 R. annae plants at height class ii, as well as 11, 94, and 47 R. annae plants at height class iii, respectively. At height class iv, there were only eight R. irroratum plants in the community Ib. The height structures of R. irroratum in the three communities with different orders of succession were also both of the expanding type (Figure 3b).

2.2. Static Life Tables and Survival Rate Curves of Both Rhododendron Populations in Communities at Different Stages of Succession

There were many young individuals (age classes 1–2) of R. annae in communities Ia, IIa, and IIIa. The survival numbers (ax) of R. annae in these three communities presented a trend of increasing first and then decreasing with increasing age class and all peaked at age class two, reaching 46, 105, and 93, respectively. The life expectancies (ex) of R. annae in communities Ia and IIa showed a trend of decreasing first, then increasing, and finally decreasing again with increasing age class, and peaked at age class four (Ia) and age class one (IIa), reaching 2.50 and 1.60, respectively. The life expectancy (ex) of R. annae in community IIIa displayed a trend of gradual decrease with increasing age class, dropping from 1.35 at age class one to 0 at age classes four, five, and six. There were also many young individuals (age classes 1–2) of R. irroratum in communities Ib, IIb, and IIIb. With increasing age class, the survival numbers (ax) of R. irroratum in the three communities presented the same trend as those of R. annae, and also peaked at age class two, reaching 61, 135, and 57, respectively. The life expectancy (ex) of R. irroratum in community Ib showed a trend of decreasing first, then increasing, and finally decreasing again with increasing age class, and peaked at age class four, reaching 2.50. The life expectancies (ex) of R. irroratum in communities IIb and IIIb displayed a trend of gradual decrease with increasing age class, dropping from 1.24 and 1.50 at age class one to 0 at age classes four, five, and six (Table 2).
The survival, mortality, and disappearance curves of R. annae in communities with different orders of succession are shown in Figure 4. The logarithmic standardized survival numbers (lnlx) of R. annae in communities Ia, IIa, and IIIa gradually decreased with increasing age class, and its survival curves all fell between Deevey-II and Deevey-III. The survival curves of R. annae in communities Ia, IIa, and IIIa were tested using both exponential and power function models. As shown in Table 3, the R2 of the exponential function model was uniformly greater than that of the power function model; therefore, the survival curves of R. annae in communities Ia, IIa, and IIIa tended to be closer to Deevey-II. The mortality rate and disappearance rate curves of R. annae in communities Ia, IIa, and IIIa presented a consistent trend with increasing age class (Figure 4b,c). Specifically, both the mortality rate and disappearance rate curves of R. annae in communities Ia and IIa showed a trend of increasing first, then decreasing, and finally increasing again with increasing age class, and peaked at age classes three and six. The mortality rate and disappearance rate curves of R. annae in community IIIa exhibited a trend of increasing first and then decreasing and peaked at age class three.
The logarithmic standardized survival numbers (lnlx) of R. irroratum in communities Ib, IIb, and IIIb also gradually decreased with increasing age class, and all survival curves fell between Deevey-II and Deevey-III. As shown by the model tests in Table 3, the R2 of the exponential function model for R. irroratum in communities Ib, IIb, and IIIb was uniformly greater than that of the power function model; therefore, the survival curves of R. irroratum in communities Ib, IIb, and IIIb tended to be closer to Deevey-II. The mortality rate and disappearance rate curves of R. irroratum in communities Ib, IIb, and IIIb both showed a trend of increasing first, then decreasing, and finally increasing again with increasing age class, and peaked at age classes three or four.

2.3. Time Sequence Analysis of the Two Rhododendron Populations in Communities at Different Stages of Succession

According to the population dynamics prediction of R. annae (Table 4), the population sizes of R. annae in communities Ia, IIa, and IIIa will decrease from their current values of 99, 186, and 145 plants to 15, 27, and 14 plants in six years. The quantities of R. annae in communities Ia, IIa, and IIIa all showed a trend of gradual increase after two, four, and six years at each age class, except for age class ii. The quantities at lower age classes always exceeded those at higher age classes. Specifically, the quantity of R. annae at age class two decreased by 39.13%, 40.00%, and 23.66%, respectively; that of R. annae at age class three increased by 17.65%, 44.64%, and 1500.00%, respectively. The quantities of R. annae in age classes four, five, and six also exhibited a gradually increasing trend.
According to the population dynamics prediction of R. irroratum (Table 4), the population sizes of R. irroratum in communities Ib, IIb, and IIIb will decrease from the current numbers of 126, 172, and 90 plants to 12, 21, and 10 plants in six years. Similarly, the quantities of R. irroratum in communities Ib, IIb, and IIIb all showed a trend of gradual increase after two, four, and six years at each age class, except for age class ii. Specifically, the quantity of R. irroratum at age class two decreased by 6.56%, 40.74%, and 31.58%, respectively, whereas that of R. irroratum at age class three increased by 227.27%, 469.23%, and 191.67%, respectively. The quantities of R. irroratum in age classes four, five, and six also exhibited a gradually increasing trend.

3. Discussion

3.1. Population Structures and Types

Population structures and dynamic features provide an important foundation for a better understanding of the survival status and dynamic development laws of populations [23]. The age class and height structures of a population can not only disclose the developmental stage of its individuals, but also elucidate the interactions between the biological characteristics of a species and its living environment [24]. The findings of this study indicate that the individual numbers of both Rhododendron communities with different orders of succession presented a trend of increasing first and then decreasing with the direction of succession. That is, communities IIa and IIb had the highest number of individuals (186 and 172, respectively). This is due to differences in competitiveness and status of the two Rhododendron populations in communities with different orders of succession. Both populations had large individual numbers in age classes 1–2, but the number of individuals at age class one was far lower than that at age class two. This may be because Rhododendron plants mostly reproduce asexually through basal germination [25], but radial growth is slow. Additionally, the natural regeneration of seeds in Rhododendron plants requires extremely strict habitat conditions, and site conditions often limit their seed germination and seedling survival [26]. The survival rate of seedlings at age class one is lower than that at age class two, resulting in far lower individual numbers at age class one than at age class two.
The two Rhododendron populations in communities with different orders of succession were both expanding populations; however, they differed in age and height structures. The age structures of R. annae in communities Ia and IIa presented an “inverted-J-shaped” pattern, whereas the age structure of R. annae in community IIIa and the age structures of R. irroratum in all three communities showed an irregular pyramid pattern. Similarly, the height structures of R. annae in the three communities and those of R. irroratum in communities Ib and IIIb showed an irregular pyramid pattern, whereas the height structure of R. irroratum in community IIb presented a “J-shaped” pattern. Because of differences in micro-environmental factors (such as light, nutrients, and survival space) between the two communities with different orders of succession, varying competition intensity within and between species further resulted in differences in population size. As a result, certain differences were found in age and height structures between the two Rhododendron populations. Both Rhododendron populations in communities with different orders of succession—characterized by large numbers of saplings, high survival rate at low age classes, and low survival rate at middle and high age classes—were classified as expanding populations. This classification was similar to those of Yang et al. [27]. Perhaps because young individuals only require few environmental resources for growth and development and only face mild interspecific and intraspecific competition, the presence of a large number of young individuals can be maintained. With increasing tree age, the individual numbers of the two Rhododendron populations decrease rapidly, mainly because of resource limitations as well as self-thinning and allelopathic effects [26,28,29]. Faced with intensified interspecific and intraspecific competition, the individual numbers of both populations experience a gradual decline. This observation explains why both Rhododendron populations had many young and middle-aged individuals but few old individuals. To sum up, the proportion of seedlings and young trees in two Rhododendron populations was large, and although the mortality rate of young individuals was relatively high, the period was still critical and sensitive. Therefore, further efforts should be made to protect Rhododendron shrubs and scientific measures should be taken to avoid human interference and prevent population reduction.

3.2. Population Dynamics and Development

The quantitative dynamics of a population reflect the interaction between its individual survivability and the environment, which is substantially influenced by the external environment. Time sequence analysis can predict the dynamics of plant populations to a certain extent [30]. This study showed that the quantitative dynamic indices of both Rhododendron populations with different orders of succession (Vpi and V′pi) were both greater than 0. The V′pi of R. annae in community IIa was much greater than that in communities Ia and IIIa, and the V′pi of R. irroratum in communities IIb and IIIb was much greater than that in community Ib. This clarified that both Rhododendron populations held dominant positions and grew rapidly in the two Rhododendron communities with different orders of succession. The V′pi of R. annae was much greater than that of R. irroratum, and R. annae had few surviving individuals in both age classes five and six. This result suggests that although R. annae and R. irroratum are both expanding populations, R. irroratum grows slower and is more sensitive to the external environment. The survival, mortality rate, and disappearance rate curves of a population can be used to analyze its quantitative dynamics and gauge its development trends, thereby explaining the interactions between plant populations and the environment [6,7]. As indicated by the static life tables of the populations of R. annae and R. irroratum, with increasing age class, the mortality and disappearance rates of both populations gradually increased. This may be because, as they age, Rhododendron populations experience increasing demands for resources. In particular, Rhododendron individuals entering the overstory face intensified competition in terms of nutrients, light, moisture, and other resources with increasing crown breadth. By contrast, old Rhododendron individuals are in the stage of physiological aging, which encompasses a sharp weakening of competitiveness and the occurrence of mass mortality.
The largest quantities of R. annae were observed at age class six in communities Ia and IIa and at age class three in community IIIa; the largest quantities of R. irroratum were observed at age class six in community Ib and at age class three in communities Ib and IIb. This result indicated that the mortality and disappearance rates of both populations gradually increased over their succession and peaked at age class three. Because the largest quantity of Rhododendron individuals was found at age class three, a self-thinning effect resulted under the combined action of density constraints and competition. At higher age classes, the quantity declined because of physiological decline. The life expectancies and survival rates of R. annae and R. irroratum were consistent with their mortality and disappearance rate trends. In the two orders of succession, the life expectancies of the Rhododendron populations at age classes one and two were significantly higher than those at other age classes. To reduce intraspecific competition among Rhododendron seedlings, relieve the self-thinning of seedlings and saplings caused by density constraints, and improve the efficiency of population supplementation from low to high age classes [31], the recommendation is to appropriately reduce the seedling numbers of both Rhododendron populations, thereby raising the early survival rate of Rhododendron individuals. Both quantities of R. annae and R. irroratum showed a trend of gradual increase after two, four, and six years at each age class, indicating that both Rhododendron populations were expanding populations. The survival curve test showed that both Rhododendron populations belonged to the Deevey-II type in communities with different orders of succession and were both stable populations. Although R. annae and R. irroratum had large population sizes in communities IIa, IIIa, and IIb, their individual numbers were small in communities Ia and Ib, especially at high age classes. In this context, if the survival rate of younger individuals cannot be improved, the old individuals in these communities will not be effectively supplemented, thus potentially causing the population to decline or even disappear [27].
The populations of R. annae and R. irroratum in northwest Guizhou have rich reserves of seedlings and saplings; therefore, they are expanding populations. Without human interference, Rhododendron populations can naturally reproduce and realize self-renewal and rejuvenation. However, considering the poor environmental adaptability and low survival rate of young Rhododendron individuals, protective measures should be implemented. The goal of these measures should be to increase both the quantity and survival rate of Rhododendron seedlings and saplings and promote the natural renewal of Rhododendron populations. At the same time, the on-site protection of existing Rhododendron populations should be strengthened to reduce human interference and protect plants from further damage. To effectively protect the germplasm resources of Rhododendron, efforts should also be made to conduct breeding, cultivation, and management of Rhododendron populations. Moreover, breeding and protection bases for them should be established, their quantities should be increased, and their spatial distribution should be expanded.

4. Materials and Methods

4.1. Overview of the Study Area

The study area is located in Xingxiu Township, Dafang County, Guizhou Province, China (27°23′ N, 105°51′ E), which is a transition zone from the highest plateau surface to the central plateau surface in northwest Guizhou. Its terrain is low in the north and south and high in the middle (Figure 5). It has a typical karst peak-cluster mid-slotted trough valley topography, with an altitude of 1730–1820 m, and a subtropical monsoon humid climate. The annual average temperature is 11.8 °C, and the average annual precipitation is 1150.4 mm. The frost-free period is 257 d, and the annual sunshine duration is 1335.5 h. The zonal vegetation is a mountain evergreen broad-leaved forest, and the existing vegetation is dominated by Rhododendron shrubs, with important successional and transitional characteristics [32,33]. The major dominant species include R. annae, R. irroratum, R. maculiferum, R. lilacinum, R. maculatum, and Lyonia ovalifolia. Most of the dominant species belong to the Rhododendron genus including shrubs or trees. Their leaves are evergreen or deciduous, semi deciduous, alternate, entire, rare and have inconspicuous small teeth. Their flower buds are mostly characterized by bud scales with varying shapes and sizes. The flowers are prominent, small to large in shape, and are usually arranged in umbrella-shaped or short racemes, with sparse single flowers, which are usually terminal and rarely axillary, corolla funnel shaped, bell shaped, tubular, or high-footed disc shaped, neat or slightly symmetrical, with lobes covered in tiles within the bud. The appearance of two types of Rhododendron is shown in Figure 6. The dominant soil type is yellow soil, with a pH value of 4.61–5.32 [22].

4.2. Sample Plot Setting and Survey Methods

In March 2019, a survey was conducted on two orders of succession of the communities of R. annae and R. irroratum in the Baili Azalea Nature Reserve. To be specific, the orders of succession of R. annae included the three successional communities of R. annae + Lyonia ovalifolia shrubs (Ia), R. annae shrubs (IIa), and R. annae + evergreen forest (IIIa). The successional communities of R. irroratum also included three successional communities, namely, R. irroratum + Lyonia ovalifolia shrubs (Ib), R. irroratum shrubs (IIb), and R. irroratum + evergreen forest (IIIb) (Figure 5). Both orders of succession showed an alternation from southeast to northwest. The basic characteristics of all six communities are provided in Table 5. The constructive species of the R. annae succession changed from Lyonia ovalifolia to R. annae, and R. irroratum succession changed from Lyonia ovalifolia to R. annae.
A 20 m × 20 m quadrat was set up in each of the six Rhododendron shrub communities mentioned above, with six such quadrats in total. The longitude, latitude, and altitude of the center point of each quadrat were recorded. In April, July, and August 2019, the types, stem base diameters, heights, crown breadths, and cluster numbers of all shrubs with a stem base diameter (trunk diameter 5 cm above ground) of >1 cm in each quadrat were examined.

4.3. Research Indicators and Data Analysis

4.3.1. Quantification of Population Dynamics

The analysis method of replacing age structure with diameter class structure [34] was adopted to divide R. annae and R. irroratum in the above quadrats into six age classes and six height classes according to their stem base diameter and height, respectively. To be specific, the age classes included age class i of <2 cm (ii, 2–4 cm; iii, 4–6 cm; iv, 6–8 cm; v, 8–10 cm; vi, >10 cm). The height classes included height class i of <1 m (ii, 1–2 m; iii, 2–3 m; iv, 3–4 m; v, 4–5 m; vi, >6 m).
A quantitative method was employed to analyze the dynamics of the individual number between adjacent diameter classes for the populations of R. annae and R. irroratum in the two Rhododendron communities with different orders of succession [35]. The formula is as follows:
V n = S n S n + 1 max S n , S n + 1 × 100 %
V p i = 1 n = 1 k 1 S n × n = 1 k 1 S n × V n
where Vn is the dynamics of individual number for a population from diameter class n to n + 1; Vpi is the quantitative dynamic index of the entire population structure; k is the diameter class number of the population; Sn and Sn+1 are the individual numbers of the population at diameter classes n and n + 1, respectively. When external interference is considered,
V p i = 1 n = 1 k 1 ( S n × V n ) k × min S 1 , S 2 , S 3 , , S k × n = 1 k 1 S n .
The positive, negative, and zero values of Vpi and Vn reflect the growth, decline, and stability of the individual number for the population or between adjacent age classes.

4.3.2. Static Life Tables and Survival Curves

Static life tables were used to analyze the dynamic changes among both Rhododendron populations [3,36]. The “smoothing technique” was applied for data processing. To create static life tables, ax was replaced by a′x [37]. A static life table includes the following parameters: ax: existing individual number within age class x; a′x: existing individual number within age class x after the application of the “smoothing technique”; lx: standardized survival number at the beginning of age class x (generally converted to 1000); lnlx: logarithmic standardized survival number; dx: standardized death number within the interval from age class x to x + 1; qx: mortality rate; Lx: average survival number within the interval from age class x to x + 1; Tx: total survival number from age class x and beyond; ex: life expectancy of individuals entering age class x; Sx: survival rate; Kx: disappearance rate of the population. The formulae are as follows:
l x = a x a 0 × 1000
q x = d x l x
L x = l x + l x + 1 2
T x = L x
e x = T x l x
S x = l x + 1 l x
K x = l n l x l n l x + 1
To test whether the survival status of a population conforms to a Deevey-type II or Deevey-type III curve, this study adopted an exponential equation (y = a · ebx, where a and b are constants) and a power function equation (y = a · xb, where a and b are constants) to test the survival curves of the populations of R. annae and R. irroratum in communities at different stages of succession [38].

4.3.3. Time Sequence Prediction

The renewal ability of Rhododendron populations was simulated and predicted using the moving average method [39]. The formula is as follows:
M t ( 1 ) = 1 n × k = t n + 1 t x k
where n is the future period to be predicted; Mt(1) is the size of the population at diameter class t in the future n years; xk is the current size of the population at diameter class k.

4.4. Data Processing and Statistical Analysis

The data were processed using Microsoft Office Excel 2016. The diameter class/height structure differences, survival statuses, and time sequence predictions of populations in communities at different stages of succession were analyzed using SPSS 26.0 and SigmaPlot 14.0 software was used to draw plots.

Author Contributions

Conceptualization, Y.Z., X.Z. and J.W. (Jianli Wang); Methodology, X.W., B.J. and C.C.; Formal analysis, J.W. (Jianli Wang), L.W. and L.J.; Investigation, Y.Z., Y.W. and Z.N.; Resources, X.Z., B.J. and C.C.; Data curation, J.W. (Junpeng Wei).; Writing (original draft preparation and review and editing), Y.Z. and X.Z.; Visualisation, B.J.; Supervision, C.C.; Project administration, X.Z.; Funding acquisition, X.Z.; All authors contributed to manuscript revision, read, and approved the submitted version. All authors have read and agreed to the published version of the manuscript.

Funding

This research was funded by the Science and Technology Department of Guizhou Province (Qian Ke He Zhicheng [2021] Yiban503, QKHPTRC-CXTD [2022]011) and National Guidance Foundation for Local Science and Technology Development of China (2023-009).

Data Availability Statement

The original contributions presented in the study are included in the article, further inquiries can be directed to the corresponding author.

Acknowledgments

We acknowledge the Baili Rhododendron National Nature Reserve and laboratory of the Department of Grassland Science, Guizhou University. We thank Xiaolong Tian, Qian Zhang, Zhaoyi Wang and Honggang Shuai for their valuable suggestions and help with the laboratory analysis.

Conflicts of Interest

The authors declare that the research was conducted in the absence of any commercial or financial relationships that could be construed as a potential conflict of interest.

References

  1. Harper, J.L. Population Biology of Plant; Oxford University Press: London, UK, 1977; pp. 2–15. [Google Scholar]
  2. Galal, T.M. Size structure and dynamics of some woody perennials along elevation gradient in Wadi Gimal, Red Sea coast of Egypt. Flora 2011, 206, 638–645. [Google Scholar] [CrossRef]
  3. Li, W.; Zhang, G.F. Population structure and spatial pattern of the endemic and endangered subtropical tree Parrotia subaequalis (Hamamelidaceae). Flora 2015, 212, 10–18. [Google Scholar] [CrossRef]
  4. Holeksa, J.; Saniga, M.; Szwagrzyk, J.; Dziedzic, T.; Ferenc, S.; Wodka, M. Altitudinal variability of stand structure and regeneration in the subalpine spruce forests of the Pol’ana biosphere reserve, Central Slovakia. Eur. J. For. Res. 2007, 126, 303–313. [Google Scholar] [CrossRef]
  5. Druckenbrod, D.; Shugart, H.; Davies, I. Spatial pattern and process in forest stands within the Virginia piedmont. J. Veg. Sci. 2009, 16, 37–48. [Google Scholar] [CrossRef]
  6. Wu, J.X.; Zhang, X.M.; Deng, C.Z.; Liu, G.J. Structure and dynamic of Populus euphratica population along Tarim River. Pak. J. Bot. 2012, 44, 1651–1656. [Google Scholar]
  7. Omelko, A.; Ukhvatkina, O.; Zhmerenetsky, A.; Sibirina, L.; Petrenko, T.; Bobrovsky, M. From young to adult trees: How spatial patterns of plants with different life strategies change during age development in an old-growth Korean pine-broadleaved forest. For. Ecol. Manag. 2018, 411, 46–66. [Google Scholar] [CrossRef]
  8. Wen, L.; Song, T.S.; Du, H.M.; Wang, K.L. The succession characteristics and its driving mechanism of plant community in karst region, Southwest China. Acta Ecol. Sin. 2015, 35, 5822–5833. [Google Scholar] [CrossRef]
  9. Zeng, Q.C.; An, S.S.; Liu, Y. Soil bacterial community response to vegetation succession after fencing in the grassland of China. Sci. Total Environ. 2017, 609, 2–10. [Google Scholar] [CrossRef]
  10. Chamberlain, D.; Hyam, R.; Argent, G.; Fairweather, G.; Walter, K. The Genus Rhododendron: Its Classification and Synonymy; Royal Botanic Garden Edinburgh: Edinburgh, UK, 1996. [Google Scholar]
  11. Mackay, M.; Gardner, S. Geographic analysis of Red List Rhododendron (Ericaceae) taxa by country of origin identifies priorities for ex situ conservation. Blumea 2017, 62, 103–120. [Google Scholar] [CrossRef]
  12. Li, T.Q.; Liu, X.F.; Li, Z.G.; Ma, H.; Wan, Y.M.; Liu, X.X.; Fu, L.Y. Study on reproductive biology of Rhododendron longipedicellatum: A newly discovered and special threatened plant surviving in limestone habitat in southeast Yunnan China. Front. Plant Sci. 2018, 9, 33. [Google Scholar] [CrossRef]
  13. Ahmad, P.I.; Puni, L.; Pandey, R.; Pala, N.A.; Rather, M.M.; Rashid, M.; Malik, A.R. Influence of different treatments and techniques on rooting behavior of Rhododendron arboreum Sm. in Indian Himalayas. Acta Ecol. Sin. 2021, 41, 332–335. [Google Scholar] [CrossRef]
  14. Yu, F.Y.; Skidmore, A.K.; Wang, T.J.; Huang, J.H. Low-elevation endemic Rhododendrons in China are highly vulnerable to climate and land use change. Ecol. Indic. 2021, 126, 107699. [Google Scholar] [CrossRef]
  15. Min, T.L.; Fang, R.Z. On the origin and geographic distribution of genus Rhododendron L. Plant Divers. 1979, 1, 19–30. [Google Scholar]
  16. Berg, W. Rhododendron Exploration in Tibet; Digital Library and Archives of the Virginia Tech University Libraries: Blacksburg, VA, USA, 1987. [Google Scholar]
  17. Wang, Z.C.; Chen, X.; Ren, Z.M.; Hu, C.X.; Zhao, C.Y.; Bo, L.; Shen, S.K. Population structure and dynamic characteristies of an endangered and endemic species Rhododendron rex subsp. rex in Southwest, China. Seeds 2010, 29, 72–76. [Google Scholar]
  18. Chen, X.; Huang, J.Y.; Huang, C.L.; Chen, X. Study on the macromorphological characters of Rhododendron (Ericaceae) in Northwestern Guizhou. Seeds 2013, 32, 51–55. [Google Scholar]
  19. Rong, L.; Chen, X.; Wang, X.C. Leaf Anatomical Characters and Its Ecological Adaptation of 13 Species of Rhododendron in Baili Azalea Area. J. Anhui Agric. Sci. 2009, 37, 1084–1088. [Google Scholar] [CrossRef]
  20. Mayr, S.; Beikircher, B.; Obkircher, M.A.; Schmid, P. Hydraulic plasticity and limitations of alpine Rhododendron species. Oecologia 2010, 164, 321–330. [Google Scholar] [CrossRef]
  21. Jia, Z.Z.; Li, W.J.; Tian, A.; Wang, J.G. Ecological influence of tourism disturbance on the characteristics of different communities in Baili Rhododendron forest. Acta Ecol. Sin. 2021, 41, 4641–4649. [Google Scholar]
  22. Wang, Z.Y.; Wang, L.J.; Tian, X.L.; Zhang, Q.; Wang, J.G.; Shuai, H.G.; Chen, F.; Liu, M.; Jin, B.C.; Zhao, X.C. Characteristies and species diversity of different Rhododendron shrub communities in northwest Guizhou. Acta Ecol. Sin. 2023, 43, 693–701. [Google Scholar] [CrossRef]
  23. Masaki, T.; Ota, T.; Sugita, H.; Oohara, H.; Otani, T.; Nagaike, T.; Nakamura, S. Structure and dynamics of tree populations within unsuccessful conifer plantations near the Shirakami Mountains, a snowy region of Japan. For. Ecol. Manag. 2004, 194, 389–401. [Google Scholar] [CrossRef]
  24. Svensson, J.S.; Jeglum, J.K. Structure and dynamics of an undisturbed old-growth Norway spruce forest on the rising Bothnian coastline. For. Ecol. Manag. 2001, 151, 67–79. [Google Scholar] [CrossRef]
  25. Zhang, Y.Y.; Zhao, X.C.; Wang, L.J.; Wang, Z.Y.; Shuai, H.G.; Wang, Y.F.; Jin, B.C.; Chen, C. Effects of clearcutting on species composition and community renewal of Rhododendron shrubs in northwest Guizhou Province, China. Front. Ecol. Evol. 2023, 11, 1225466. [Google Scholar] [CrossRef]
  26. Mao, A.A.; Kaliamoorthy, S.; Ranyaphi, R.A.; Das, J.; Gupta, S.; Athili, J.; Yumnam, J.Y.; Chanu, L.I. In vitro micropropagation of three rare, endangered, and endemic Rhododendron species of Northeast India. In Vitro Cell. Dev. Biol.-Plant. 2011, 47, 674–681. [Google Scholar] [CrossRef]
  27. Yang, H.Q.; Liu, Y.H.; Liu, F.L.; Hu, C.X.; Zhao, C.Y.; Long, B.; Shen, S.K. population structure and dynamic characteristies of an endangered and endemic species Rhododendron rex subsp. rex in Southwest, China. Acta Bot. Boreali-Occident. Sin. 2020, 40, 2148–2156. [Google Scholar] [CrossRef]
  28. Lorenzo, P.; Palomera-Pérez, A.; Reigosa, M.J.; González, L. Allelopathic interference of invasive Acacia dealbata Link on the physiological parameters of native understory species. Plant Ecol. 2011, 212, 403–412. [Google Scholar] [CrossRef]
  29. Xu, W.B.; Zhao, M.; Waleta; Shi, Y.; Hu, T.H.; Yu, Y.W. Quantitative traits, age structure and self-thining rule of three shrubs on northest edge of Qinghai-Tibet plateau. Pratac. Sci. 2019, 36, 1207–1214. [Google Scholar]
  30. Bierzychudek, P. Plant Biodiversity and Population Dynamics. In Ecology and the Environment; Springer: New York, NY, USA, 2014; p. 2965. [Google Scholar] [CrossRef]
  31. Comita, L.S.; Hubbell, S.P. Local neighborhood and species’ shade tolerance influence survival in a diverse seedling bank. Ecololy 2009, 90, 328–334. [Google Scholar] [CrossRef] [PubMed]
  32. Li, W.J.; Chen, X.A. Preliminary study on structure and regeneration of Rhododendron delavayi population in Baili Azalea Forest Park. Guizhou Sci. 2005, 23, 46–49. [Google Scholar] [CrossRef]
  33. Jiang, H.; He, B.; Luo, Q. A study of the relationship between the distribution of bryophytes and the environmental factors in Baili Azalea National Forest Park. Ecol. Sci. 2015, 34, 31–36. [Google Scholar] [CrossRef]
  34. Wu, J.X.; Zhang, X.M.; Deng, C.Z.; Liu, G.J.; Li, H. Characteristics and dynamics analysis of Populus euphratica populations in the middle reaches of Tarim River. J. Arid Land 2010, 2, 250–256. [Google Scholar] [CrossRef]
  35. Chen, X.D. A study on the method of quantitative analysis for plant population and community structural dynamics. Acta Ecol. Sin. 1998, 2, 104–107. [Google Scholar]
  36. Bisht, V.K.; Kuniyal, C.P.; Nautiyal, B.P.; Prasad, P. Spatial distribution and regeneration of Quercus semecarpifolia and Quercus floribunda in a subalpine forest of western Himalaya, India. Physiol. Mol. Biol. Plants 2013, 19, 443–448. [Google Scholar] [CrossRef]
  37. Long, T.; Wu, X.L.; Wang, Y.; Chen, J. The population status and threats of Taxus cuspidate, a plant species with extremely small populations in China. Glob. Ecol. Conserv. 2021, 26, e01495. [Google Scholar] [CrossRef]
  38. Hett, J.M.; Loucks, O.L. Age structure models of balsam fir and eastern hemlock. J. Ecol. 1976, 64, 1029–1044. [Google Scholar] [CrossRef]
  39. Xiao, Y.A.; He, P.; Li, X.H.; Deng, H.P. Study on numeric dynamics of natural populations of the endangered species Disanthus cercidifolius var. longipes. Chin. J. Plant Ecol. 2004, 28, 252–257. [Google Scholar] [CrossRef]
Figure 1. Quantities of Rhododendron plants in the quadrats. Note: (a), the individual quantity of R.annae in different communities; (b), the individual quantity of R. irroratum in different communities; Ia, R. annae + Lyonia ovalifolia shrubs; IIa, R. annae shrubs; IIIa, R. annae + broad-leaved forest; Ib, R. irroratum + Lyonia ovalifolia shrubs; IIb, R. irroratum shrubs; IIIb, R. irroratum + broad-leaved forest.
Plants 13 00946 g001
Figure 2. Age structures of R. annae and R. irroratum in different communities. Note: (a), age structures of R. annae in different communities; (b), age structures of R. irroratum in different communities. Note: Ia, R. annae + Lyonia ovalifolia shrubs; IIa, R. annae shrubs; IIIa, R. annae + broad-leaved forest; Ib, R. irroratum + Lyonia ovalifolia shrubs; IIb, R. irroratum shrubs; IIIb, R. irroratum + broad-leaved forest.
Plants 13 00946 g002
Figure 3. Height structures of R. annae and R. irroratum in different communities. Note: (a), height structures of R. annae in different communities; (b), height structures of R. irroratum in different communities. Note: Ia, R. annae + Lyonia ovalifolia shrubs; IIa, R. annae shrubs; IIIa, R. annae + broad-leaved forest; Ib, R. irroratum + Lyonia ovalifolia shrubs; IIb, R. irroratum shrubs; IIIb, R. irroratum + broad-leaved forest.
Plants 13 00946 g003
Figure 4. Survival, mortality rate (qx), and disappearance rate (Kx) curves of R. annae and R. irroratum in different communities. Note: (a), survival curves of R. annae in different communities; (b), mortality rate curves of R. annae in different communities; (c), disappearance rate curves of R. annae in different communities; (d), survival curves of R. irroratum in different communities; (e), mortality rate of R. irroratum in different communities; mortality rate of R. irroratum in different communities; (f), disappearance rate of R. irroratum in different communities; Ia, R. annae + Lyonia ovalifolia shrubs; IIa, R. annae shrubs; IIIa, R. annae + broad-leaved forest; Ib, R. irroratum + Lyonia ovalifolia shrubs; IIb, R. irroratum shrubs; IIIb, R. irroratum + broad-leaved forest.
Plants 13 00946 g004
Figure 5. Location of the study area. Note: Ia, R. annae + Lyonia ovalifolia shrubs; IIa, R. annae shrubs; IIIa, R. annae + broad-leaved forest; Ib, R. irroratum + Lyonia ovalifolia shrubs; IIb, R. irroratum shrubs; IIIb, R. irroratum + broad-leaved forest.
Plants 13 00946 g005
Figure 6. Photographs of R. annae (a) and R. irroratum (b).
Plants 13 00946 g006
Table 1. Dynamic indices for the age structures of Rhododendron plants.
Index (%)Community
IaIIaIIIaIbIIbIIIb
V1−78.2680.00−47.31−51.11−82.22−63.16
V226.0146.6796.7786.6790.3778.95
V376.4796.43100.00100.00100.00100.00
V4100.0050.00
V5−100.000.00
V6100.00100.00
Vpi39.5747.4248.1546.2467.0248.60
V′pi6.597.902.671.280.860.76
Note: Ia, R. annae + Lyonia ovalifolia shrubs; IIa, R. annae shrubs; IIIa, R. annae + broad-leaved forest; Ib, R. irroratum + Lyonia ovalifolia shrubs; IIb, R. irroratum shrubs; IIIb, R. irroratum + broad-leaved forest. Vn: quantitative dynamic index between age classes n and n + 1; Vpi: quantitative dynamic index of the population without considering external interferences; V′pi: quantitative dynamic index of the population considering external interferences.
Table 2. Static life tables of R. annae and R. irroratum in different communities.
SpeciesIndexCommunityAge Class
123456
R. annaeax (plant)Ia104634801
IIa2110556211
IIIa49933000
a′x (plant)Ia423028111
IIa896133211
IIIa784818000
lx (plant)Ia1000714667242424
IIa1000685371221111
IIIa1000615231
lnlxIa6.916.576.53.173.173.17
IIa6.916.535.923.112.422.42
IIIa6.916.425.44
dx (plant)Ia286486430024
IIa31531534811011
IIIa385385231
qx (%)Ia28.576.6796.4300100
IIa31.4645.993.94500100
IIIa38.4662.5100
Lx (plant)Ia857690345242412
IIa84352819717116
IIIa808423115
Tx (plant)Ia19521095405603612
IIa160175823034176
IIIa1346538115
ex (year)Ia1.951.530.612.51.50.5
IIa1.61.110.621.51.50.5
IIIa1.350.880.5
Kx (%)Ia0.340.073.33003.17
IIa0.380.612.80.6902.42
IIIa0.490.985.44
R. irroratumax (plant)Ib536111100
IIb2413513000
IIIb215712000
a′x (plant)Ib594225111
IIb985716000
IIIb453015000
lx (plant)Ib1000712424171717
IIb1000582163
IIIb1000667333
lnlxIb6.916.576.052.832.832.83
IIb6.916.375.1
IIIb6.916.55.81
dx (plant)Ib2882884070017
IIb418418163
IIIb333333333
qx (%)Ib28.8140.489600100
IIb41.8471.93100
IIIb33.3350100
Lx (plant)Ib85656822017178
IIb79137282
IIIb833500167
Tx (plant)Ib168683126342258
IIb124545482
IIIb1500667167
ex (year)Ib1.691.170.622.51.50.5
IIb1.240.780.5
IIIb1.510.5
Kx (%)Ib0.340.523.22002.83
IIb0.541.275.1
IIIb0.410.695.81
Note: Ia, R. annae + Lyonia ovalifolia shrubs; IIa, R. annae shrubs; IIIa, R. annae + broad-leaved forest; Ib, R. irroratum + Lyonia ovalifolia shrubs; IIb, R. irroratum shrubs; IIIb, R. irroratum + broad-leaved forest. ax: plant number within age class x; a′x: plant number within age class x after smoothing; lx: standardized survival number; lnlx: logarithmic standardized survival number; dx: death number; qx: mortality rate; Lx: survival number within the interval from age class x to x + 1; Tx: total survival number; ex: life expectancy; Kx: disappearance rate.
Table 3. Function models for R. annae and R. irroratum in different communities.
CommunityExponential Function ModelR2Power Function ModelR2
Iay = 9.948e−0.235x0.664 **y = 7.831x−0.4380.501 **
IIay = 10.733e−0.284x0.879 **y = 8.445x−0.6400.720 **
IIIay = 7.908e−0.120x0.953 **y = 7.040x−0.2060.870 **
Iby = 10.529e−0.276x0.722 **y = 7.980x−0.5200.555 **
IIby = 8.234e−0.152x0.933 **y = 7.096x−0.2590.840 **
IIIby = 7.600e−0.087x0.972 **y = 6.991x−0.1500.902 **
Note: “**” indicates a significant correlation at the 0.01 level. Ia, R. annae + Lyonia ovalifolia shrubs; IIa, R. annae shrubs; IIIa, R. annae + broad-leaved forest; Ib, R. irroratum + Lyonia ovalifolia shrubs; IIb, R. irroratum shrubs; IIIb, R. irroratum + broad-leaved forest.
Table 4. Time sequence analysis of population dynamics of R. annae and R. irroratum in different communities.
SpeciesAge classPrimary DataM2(1)M4(1)M6(1)
IaIIaIIIaIaIIaIIIaIaIIaIIIaIaIIaIIIa
R. annae1102149
24610593286371
334563408148
482021292305840
5010420223717
61101109110152714
Total99186145941761216110657152714
SpeciesAge classPrimary DataM2(1)M4(1)M6(1)
IbIIbIIIbIbIIbIIIbIbIIbIIIbIbIIbIIIb
R. irroratum1532421
26113557578039
3111312367435
4100676335427
5000100142714
6000000220122110
Total1261729010016180498341122110
Note: Ia, R. annae + Lyonia ovalifolia shrubs; IIa, R. annae shrubs; IIIa, R. annae + broad-leaved forest; Ib, R. irroratum + Lyonia ovalifolia shrubs; IIb, R. irroratum shrubs; IIIb, R. irroratum + broad-leaved forest. M2(1), M4(1), M6(1) is a prediction of the population after the time of age class 2, 4 and 6, respectively.
Table 5. Basic situation of different Rhododendron shrub communities.
Community TypeMarkAltitude (m)Longitude and LatitudeRhododendron Important ValueConstructive Species
R. annae + Lyonia ovalifolia shrubsIa1807E 105°51′03.52″
N 27°24′5.53″
0.453Lyonia ovalifolia
R. annae
R. annae shrubsIIa1825E 105°51′58.12″
N 27°23′20.93″
0.595R. annae
R. annae + broad-leaved forestIIIa1783E 105°51′52.23″
N 27°23′23.94″
0.485R. annae
R. irroratum + Lyonia ovalifolia shrubsIb1803E 105°52′58.88″
N 27°23′25.34″
0.417R. irroratum
Lyonia ovalifolia
R. irroratum shrubsIIb1804E 105°51′57.49″
N 27°23′24.64″
0.656R. irroratum
R. irroratum + broad-leaved forestIIIb1811E 105°51′52.78″
N 27°23′22.93″
0.556R. irroratum
Disclaimer/Publisher’s Note: The statements, opinions and data contained in all publications are solely those of the individual author(s) and contributor(s) and not of MDPI and/or the editor(s). MDPI and/or the editor(s) disclaim responsibility for any injury to people or property resulting from any ideas, methods, instructions or products referred to in the content.

