Article

Controlled-Release Fertilizer Improving Paddy Yield and Nitrogen Use Efficiency by Reducing Soil Residual Nitrogen and Leaching Losses in the Yellow River Irrigation Area

1
School of Agriculture, Ningxia University, Yinchuan 750021, China
2
Institute of Agricultural Resources and Environment, Ningxia Academy of Agro-Forestry Science, Yinchuan 750002, China
3
Ningxia Agricultural Environmental Protection Monitoring Station, Yinchuan 750002, China
4
National Agricultural Environment Yinchuan Observation and Experiment Station, Ningxia Academy of Agro-Forestry Science, Yinchuan 750002, China
5
College of Economics and Management, China Jiliang University, Hangzhou 310018, China
*
Authors to whom correspondence should be addressed.
Plants 2025, 14(3), 408; https://doi.org/10.3390/plants14030408
Submission received: 6 January 2025 / Revised: 27 January 2025 / Accepted: 28 January 2025 / Published: 30 January 2025
(This article belongs to the Special Issue Water and Nitrogen Management in the Soil–Crop System (3rd Edition))

Abstract

:
The unreasonable application of nitrogen (N) fertilizer leads to high nutrient losses and severe potential of agricultural non-point source contamination, which threatens water quality in the upper Yellow River Basin. Therefore, the aim of this study is to explore the effects of N application rates and various control measures on rice yield and N leaching in paddy fields in the Yellow River irrigation area. Four treatments were employed in this study, CK (no N fertilizer application, 0 kg N∙ha−1), CRU (controlled-release urea application, 180 kg N∙ha−1), OPT (optimal N fertilizer application, 210 kg N∙ha−1), and FP (N fertilizer application based on farmer experience, 240 kg N∙ha−1), to examine paddy yield, N use efficiency (NUE), N concentrations in leaching water at various soil depths, and N contents along the 0–100 cm depth of the soil profile. The results indicated that the amount of TN leached was 25.14–48.04 kg∙ha−1 after different N applications, and the TN leaching coefficients of FP, OPT, and CRU were 10.88%, 11.27%, and 7.07%. Compared to FP and OPT, the CRU significantly reduced the concentrations of TN, ammonium N (NH4+-N), and nitrate N (NO3-N) in the surface and soil water, with average TN leaching decreasing by 31.55% and 27.35% in the years 2022 and 2023, respectively. NO3-N was identified as the primary form of N leached from the paddy fields. Compared to FP and OPT treatments, the CRU treatment increased the average paddy yield by 19.99–20.66% and improved the average NUE by 19.04–16.38%. This study revealed that the application of high amounts of N positively affected soil N leaching, and controlled-release urea demonstrates superior efficacy compared to conventional fertilization. The application of controlled-release urea at a rate of 180 kg N∙ha−1 not only ensures a good paddy yield but also reduce N losses, which should be recommended to local farmers.

1. Introduction

Nitrogen (N) fertilizer plays a key role in enhancing both the yield and quality of paddy crops, with N accounting for over 60% of the total chemical fertilizers applied in paddy cultivation [1,2]. However, the inappropriate application of N fertilizer has resulted in a surplus of N in the soil. A significant proportion of the applied N is not absorbed by crops and is instead lost through processes such as runoff, leaching, and volatilization as ammonia [3]. Research indicated that the N use efficiency (NUE) in China is only 30–35%, which is 15–25 percentage points lower than that observed in developed countries [4,5]. Ammonia volatilization constitutes 68.98–75.27% of N loss in paddy fields, followed by runoff (16.43–23.07%) and leaching (7.67–8.86%) [6]. In single-season paddy fields within the Yangtze River Basin, N runoff losses reached a rate of 10.4 kg∙ha−1 [7]. In the Taihu Lake region, ammonia volatilization accounted for approximately 29–35% of the total N applied [8]. When the TN concentration in leaching water exceeds 10 mg∙L−1, it can lead to pollution of surface and ground water in paddy fields [9]. In the Ningxia irrigation area, ammonia volatilization represents 45–49% of total N loss, while N leaching accounts for 30–33% [10]. The application of controlled-release N fertilizers has been shown to significantly reduce N loss. Compared to conventional N fertilizers, the NUE increased by 17.7–35.1%, and N runoff loss decreased by 47.8–72.5% when controlled-release N fertilizers were applied [11]. Under the same N application rate, N loss from paddies using controlled-release N fertilizers was lower than that from conventional urea applications [12]. Controlled-release fertilizers not only mitigate environmental N loss but also enhance paddy yield and apparent N recovery [13].
The Ningxia Yellow River irrigation area is one of the four oldest irrigation regions in China and serves as a significant grain production base [14]. Historically, paddy has been a representative crop in this region. Characterized by a typical mid-temperate arid climate, over 85% of agricultural water in this area is sourced from the Yellow River [15,16]. The extensive use of water and fertilizers in paddy cultivation has resulted in severe N leaching during periods of farmland water withdrawal. Consequently, it is crucial to mitigate N input through the application of controlled-release N fertilizers and optimal N application practices to prevent and control non-point source contamination in the Yellow River irrigation area. Total N loss in this irrigation area was 887.51 t, to which maize, wheat, and paddy contributed 25%, 8%, and 67%, respectively, and there was an average N loss coefficient of 1.99% [17]. The total N emissions in the basin account for 52%, with nitrate N comprising 34% and ammonia N 12%. This indicates that non-point source contamination resulting from the excessive application of N fertilizers in the basin remains a significant issue [18]. Therefore, the aims of this study are to (1) explore the effects of optimal N application and controlled-release N fertilizer on N uptake and leaching loss in paddies within the Yellow River irrigation area and to (2) determine reasonable N regulation strategies and provide a basis for the efficient utilization of N fertilizers while controlling non-point source contamination in the Ningxia Yellow River irrigation area.

2. Results

2.1. Yield of Paddy

The N application rate of N is the primary factor influencing paddy yield. Results from a two-year experiment (Table 1) demonstrated a significant improvement in paddy yield with the application of N fertilizer, with yields increasing progressively alongside higher N application rates across the treatments. Data from 2022 indicated that paddy yield did not increase significantly when the N application rate exceeded 210 kg∙ha−1, suggesting that excessive N fertilizer application does not result in a sustained yield increase. Compared to the CK treatment, the average paddy yield in the FP treatment over the two years increased by 2963.85 kg∙ha−1, reflecting an impressive yield increase rate of 87.86%. The average paddy yield in the OPT treatment over the two years was 6301.92 kg∙ha−1, which was not significantly different from that in conventional N fertilizer application. This indicates that optimal N fertilizer application can maintain yield levels while reducing the overall N application rate. Notably, the average paddy yield in the CRU treatment was the highest, reaching 7604.02 kg∙ha−1, which was 20.66% and 19.99% higher than that in the optimal N fertilizer and conventional N fertilizer treatments, respectively. This finding underscores that the application of controlled-release urea can significantly enhance paddy yield.

2.2. Nitrogen Uptake and N Use Efficiency of Paddy

Nitrogen use efficiency is a crucial metric for assessing N uptake and utilization in paddy fields. As illustrated in Table 2, total N uptake in each N treatment significantly exceeded that of the CK. In 2022 and 2023, total N uptake in each N treatment increased by 64.12–104.93% and 68.50–110.02%, respectively, compared to CK. Among the various fertilization treatments, the controlled-release urea (CRU) treatment exhibited the highest total N uptake and NUE, following the order: CRU > OPT > FP. The average total N uptake for the FP and OPT treatments over the two years was 104.19 kg∙ha−1 and 104.46 kg∙ha−1, respectively, with average N use efficiencies of 17.71% and 20.37%. This indicates that the total N uptake and NUE for optimal N fertilizer application were not significantly lower than those for conventional N fertilizer application. Compared to the FP treatment, total N uptake in the CRU treatment increased by 21.08% and 24.64% in 2022 and 2023, respectively, while NUE improved by 19.9% and 18.17%. These results demonstrate that the application of controlled-release urea significantly enhances N absorption and utilization in paddy fields, thereby improving NUE. Furthermore, both NAE and NPP also exhibited improvements.

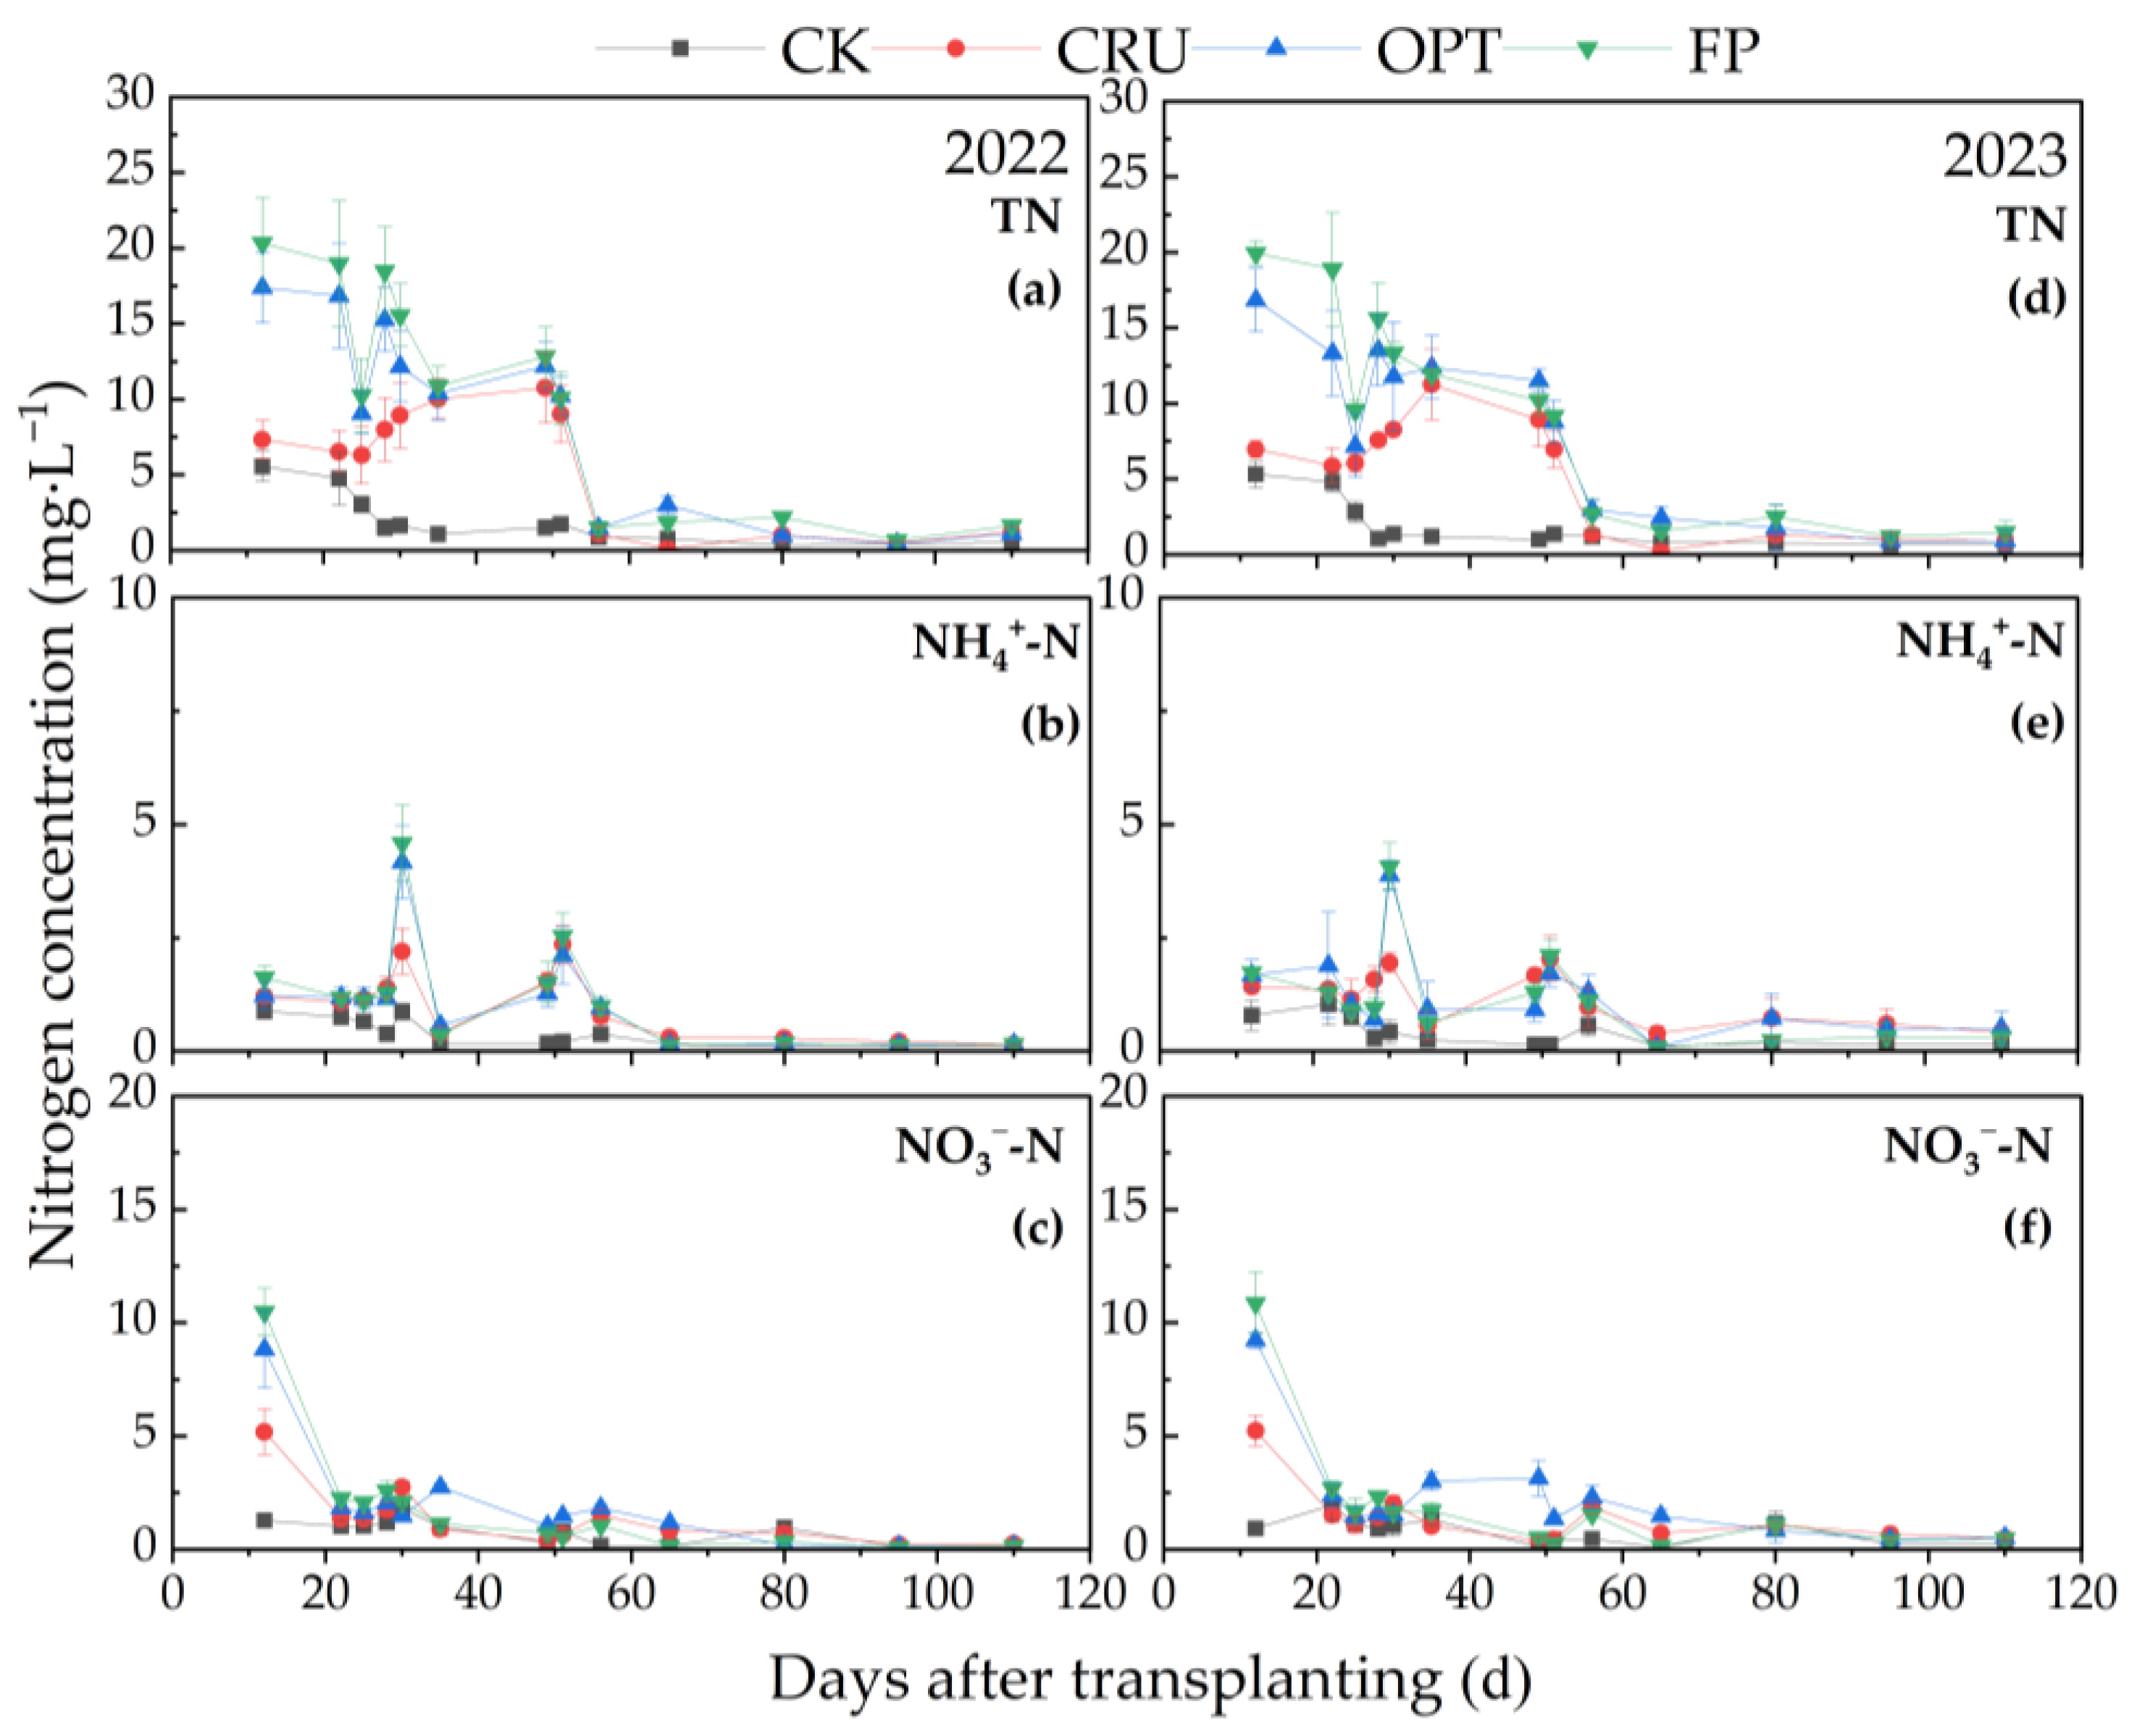
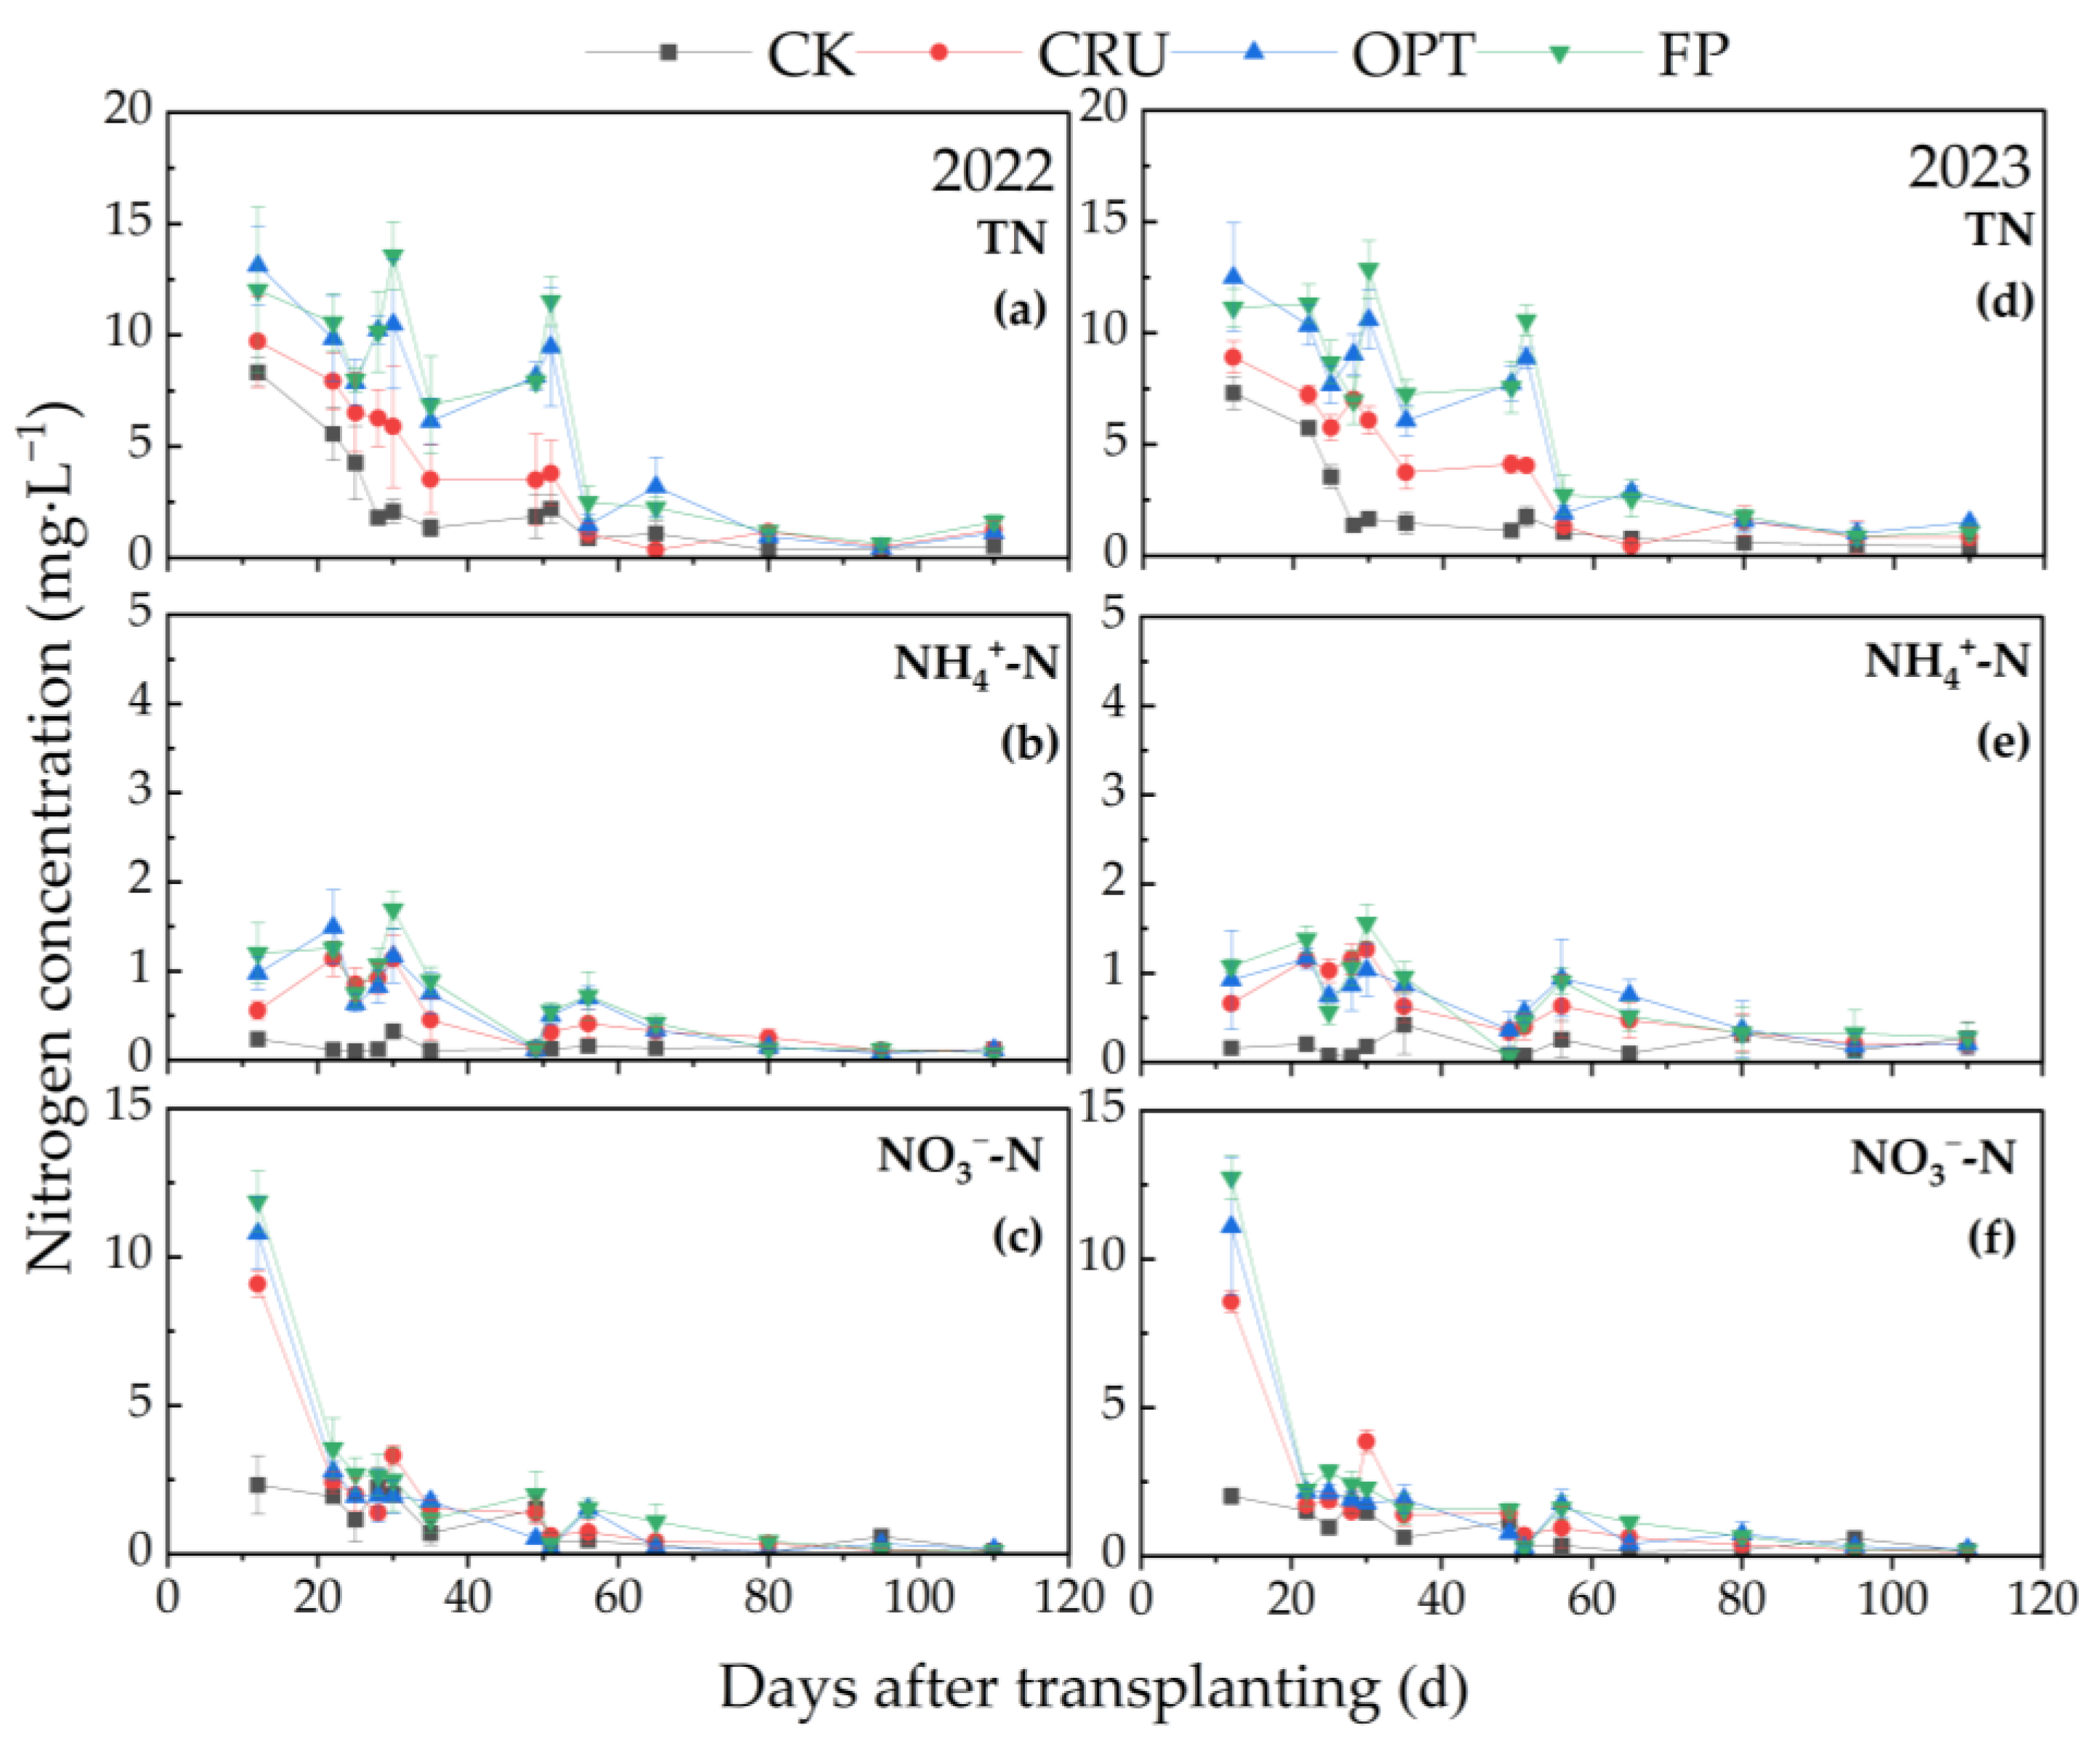
2.3. Nitrogen Concentration in the Surface and Leaching Water

The TN concentration in the leaching water at the various soil depths increased progressively with higher N application rates. As illustrated in Figure 1, the peak TN concentrations in the surface water for the FP and OPT treatments were 29.27 mg·L−1 and 22.39 mg·L−1, respectively, both of which were significantly greater than those observed the CRU treatment. Following topdressing at the tillering stage, the TN concentration in the surface water for the FP and OPT treatments peaked approximately 30 days after sowing and subsequently declined, reaching a low level five days post-peak. In contrast, the TN concentration in the CRU treatment reached a peak value approximately 51 days after sowing, at only 9.55 mg·L−1, which was 67.36% lower than the peak in the FP treatment. In line with the TN concentration dynamics, the peak concentrations of NH4+-N and NO3-N in the CRU treatment were only 9.01 mg·L−1 and 3.27 mg·L−1, respectively. Conversely, the peak NH4+-N concentrations in the FP and OPT treatments were 14.55 mg·L−1 and 12.88 mg·L−1, respectively, while the peak NO3-N concentrations were 8.56 mg·L−1 and 7.81 mg·L−1, respectively.
As illustrated in Figure 2, the trends in TN concentration in the leaching water at a soil depth of 20 cm were comparable to those observed in the surface water. The peak TN concentration for each N treatment occurred between the 12th and 30th days after sowing, followed by a rapid decline to a lower level by the 56th day. Notably, the NH4+-N concentration in the leaching water at 20 cm significantly decreased, with peak values for each N treatment (0.89–4.33 mg·L−1) being 38.62–54.66% lower than those in the surface water (1.45–9.55 mg·L−1). In contrast, NO3-N concentration peaked approximately 10 days after sowing and then gradually declined to a lower level throughout the paddy growth period.
As shown in Figure 3, the concentrations of N in various forms within the leaching water at a soil depth of 60 cm exhibited a gradual decrease with increasing depth. From the 12th to the 65th day after sowing, the TN concentration in the FP and OPT treatments was higher than that in the CRU treatment and tended to plateau after the 65th day, showing no significant changes thereafter. The peak concentrations of NH4+-N for each treatment occurred between the 22nd and 30th days post-sowing, with the NH4+-N concentration in the CRU treatment (1.20 mg·L−1) being significantly lower (25.93%) than that in the FP treatment (1.62 mg·L−1). Furthermore, the NO3-N concentration in the leaching water at 60 cm was comparable to that at 20 cm, rapidly decreasing to a lower level approximately 10 days after sowing.

2.4. Amount of N Leached Amount and Leaching Coefficient of Paddy
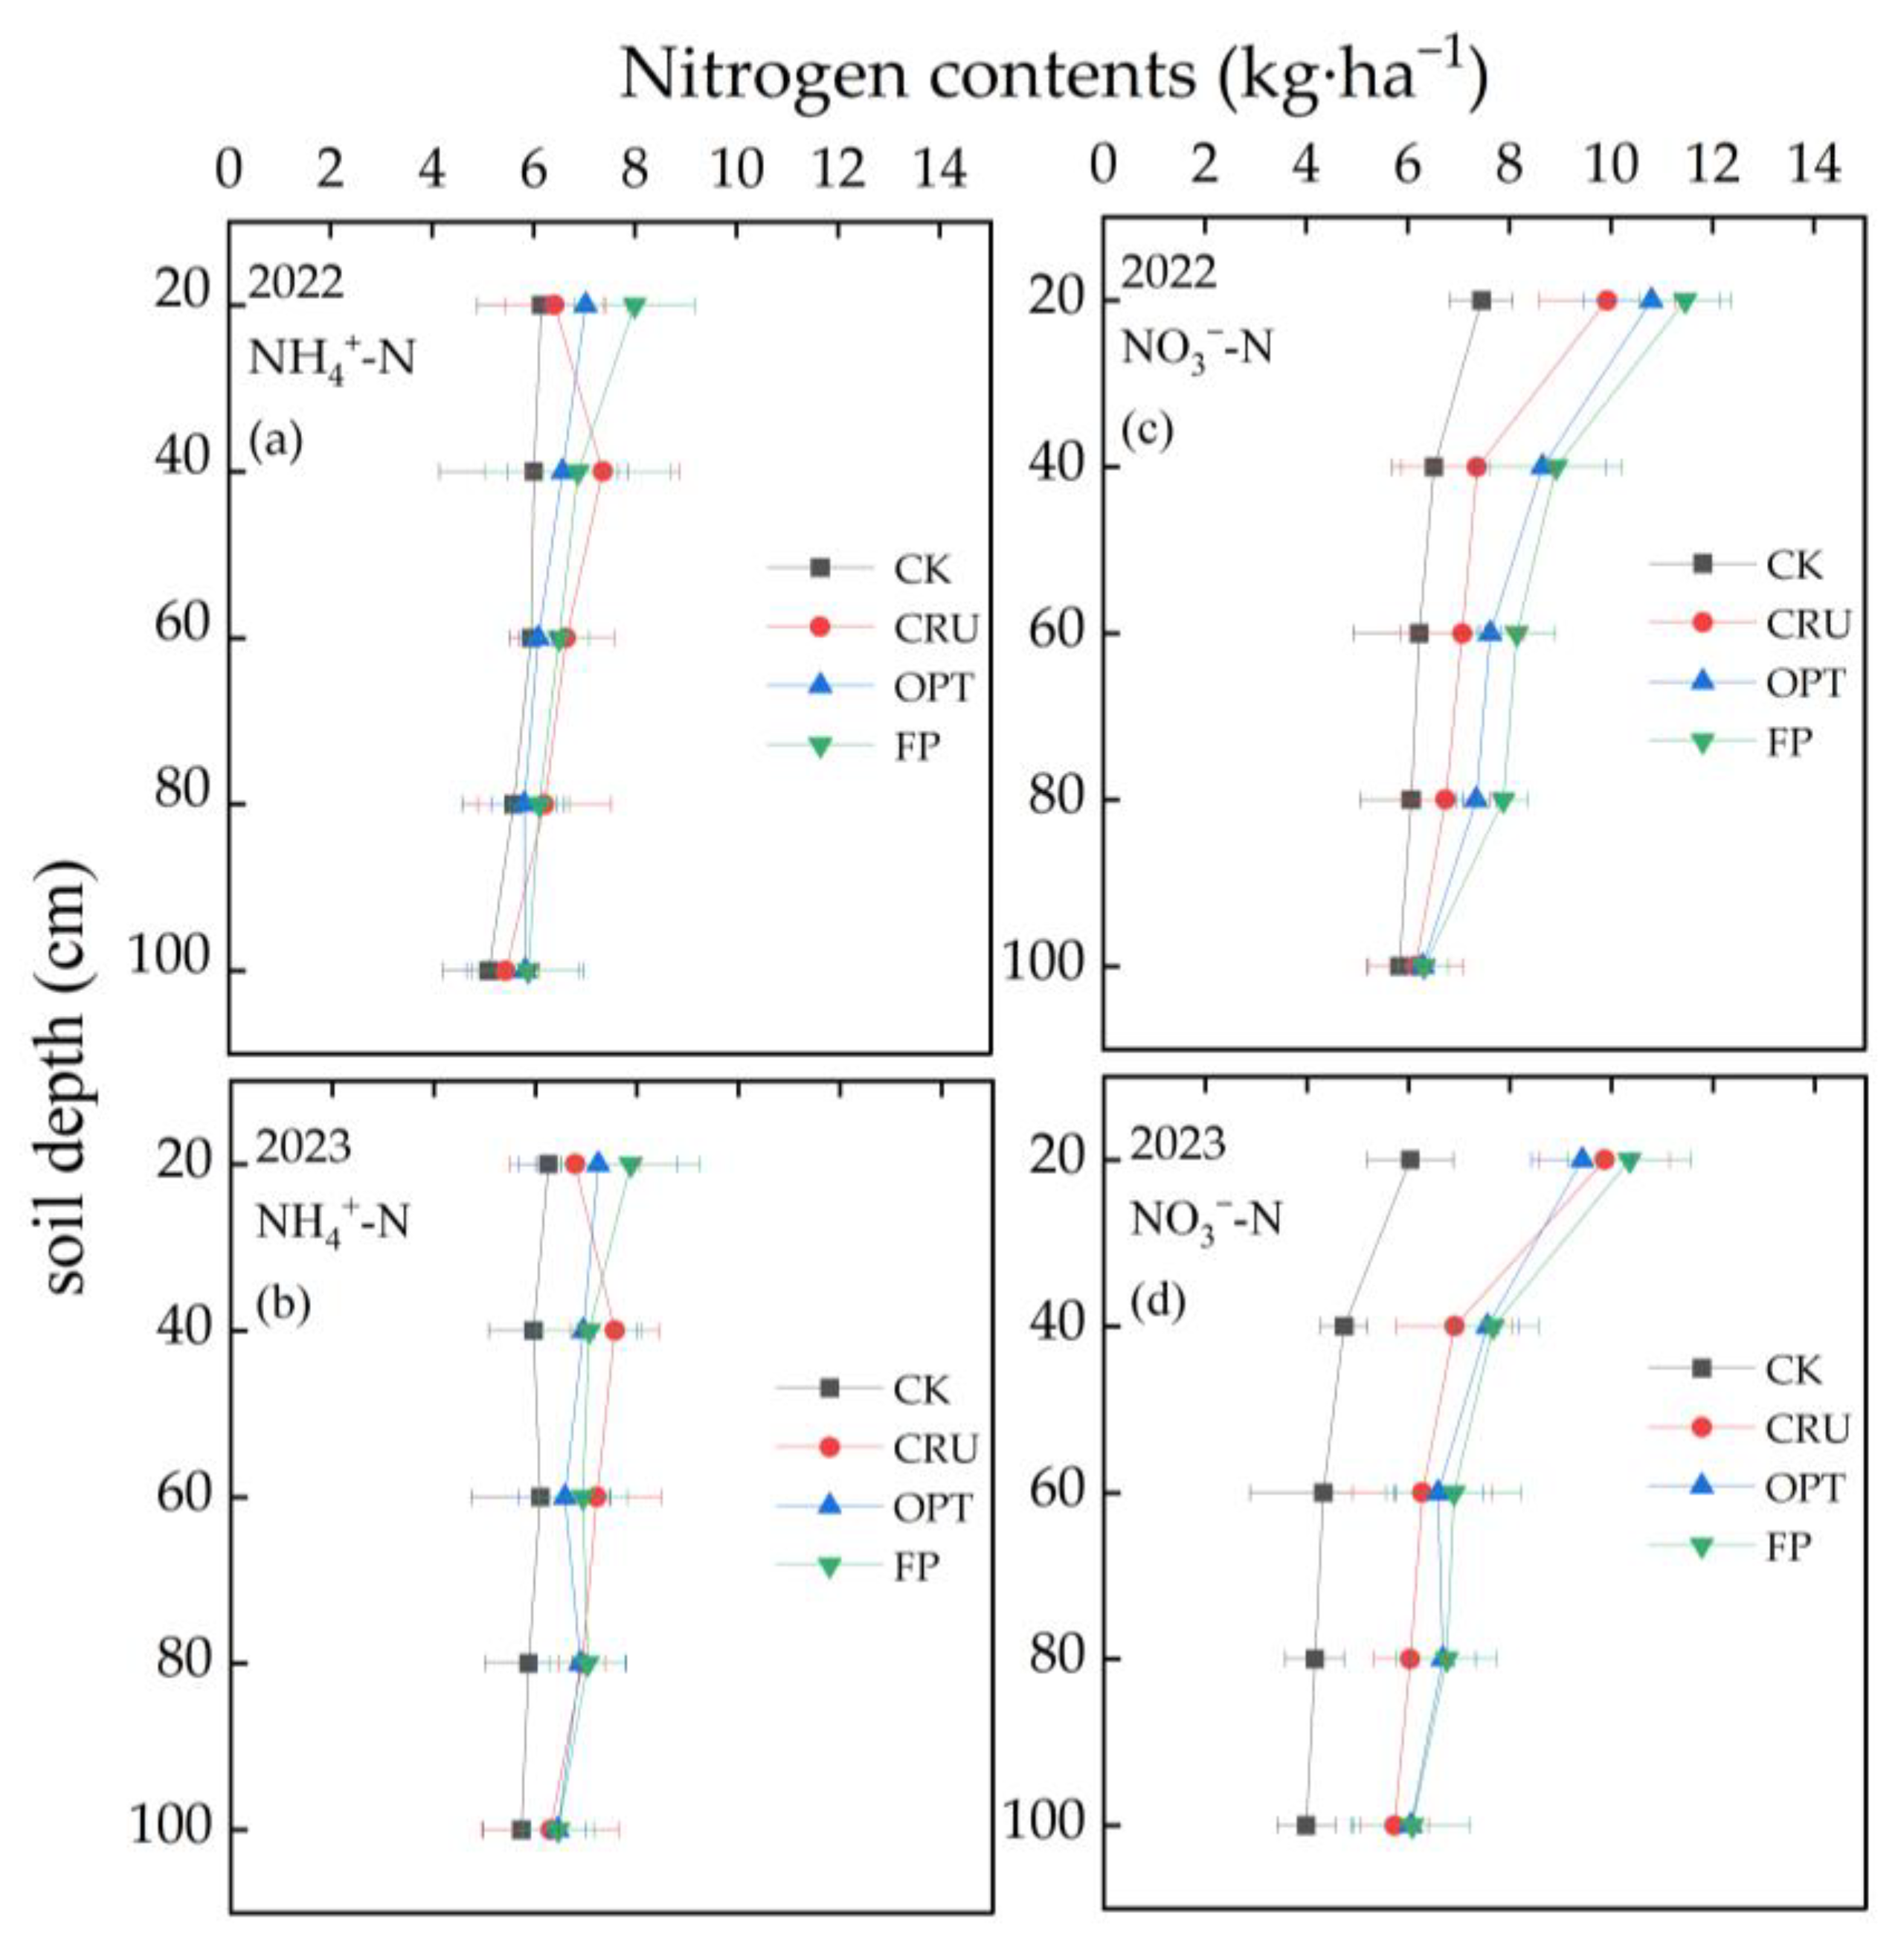
According to Table 3, the TN leached in the CK treatment was 20.30 kg∙ha−1 in 2022 and 12.30 kg∙ha−1 in 2023, with the amount in 2023 being significantly lower than that in 2022. Under no N application, the annual leaching of N decreased. In the FP treatment, the amount of TN leached reached 42.41 kg∙ha−1, accounting for 17.67% of the N fertilization amount. The TN leached in the OPT and CRU treatments was 39.96 kg∙ha−1 and 29.03 kg∙ha−1, respectively, representing reductions of 6.13% and 31.55% compared to the FP treatment, thereby significantly decreasing N leaching loss. Over the two years, the amounts of NH4+-N leached in the OPT treatment were 2.10 kg∙ha−1 and 2.23 kg∙ha−1, corresponding to reductions of 39.83% and 31.80% compared to the FP treatment. In the CRU treatment, the NO3-N leaching amounts over the two years were 17.05 kg∙ha−1 and 14.98 kg∙ha−1, which were 43.37% and 45.59% lower than those in the FP treatment. The results of the two-year experiment indicated that the average TN leaching coefficients were 10.88% and 11.27% for the FP and OPT treatments, respectively, while the CRU treatment had a significantly lower coefficient of only 7.07%.
NO3-N was the predominant form of N leached from the paddy fields, accounting for 25.13–57.29% of TN leaching, whereas NH4+-N leaching losses represented only 4.77–8.99% of the TN. In 2022, no significant differences were observed in the TN leaching coefficient among the various N treatments. In comparison to the CK treatment, the quantity of N leached in different forms increased with higher N application rates, with the FP treatment resulting in greater leaching than the other treatments. Over two consecutive years, the CRU treatment consistently reduced TN leaching by 25.22–31.63%, NH4+-N leaching by 15.19–22.94%, and NO3-N leaching by 33.4–45.59% when compared to the other N treatments. Therefore, the CRU treatment significantly mitigated N leaching and diminished the risk of agricultural non-point source pollution.

2.5. Residual NH4+-N and NO3-N Contents in the Soil Profile

Soil inorganic N is the primary form of N absorbed by crops, and its migration within the soil profile is significantly influenced by the levels of N fertilizer application and the extent of irrigation. According to Figure 4, within the 0–100 cm soil profile, the NH4+-N content in each treatment remained relatively consistent at various soil depths. In contrast, the NO3-N content was markedly higher than the NH4+-N content and exhibited a clear decline with increasing soil depth. At the 0–20 cm soil depth, the NH4+-N and NO3-N contents in the FP treatment were the highest, measuring 7.93 kg∙ha−1 and 10.91 kg∙ha−1, respectively, while those in the CK treatment were the lowest, at only 6.20 kg∙ha−1 and 6.74 kg∙ha−1, respectively. At the 20–40 cm soil depth, the NH4+-N content in the CK treatment was significantly lower than that in the other N fertilizer treatments. The order of NO3-N content was observed as FP > OPT > CRU > CK. At the 60–100 cm soil depth, there were no significant differences in NH4+-N content among the treatments; however, the NO3-N content decreased gradually with increasing soil depth.
During the two-year study, the highest NO3-N content was observed at the 0–20 cm soil depth. Over the growing period, the NO3-N content in the CK treatment gradually decreased with increasing soil depth, while the NO3-N content in the CRU treatment was lower than that in the FP treatment. At the 20–40 cm soil depth, the NO3-N content in the CRU treatment was 7.13 kg∙ha−1, which was 13.99% and 8.59% lower than that in the FP and OPT treatments, respectively, indicating a reduction in the leaching of NO3-N into deeper soil layers. At the 0–20 cm soil depth, the NH4+-N content in the CRU treatment was 6.60 kg∙ha−1, which was 16.77% and 7.43% lower than that in the FP and OPT treatments, respectively. Compared to conventional N fertilizer application, the residual NH4+-N and NO3-N contents along the soil profile decreased by 6.88% and 4.54%, respectively, under controlled-release urea application and optimal N fertilizer application, thereby reducing the risk of N leaching loss.

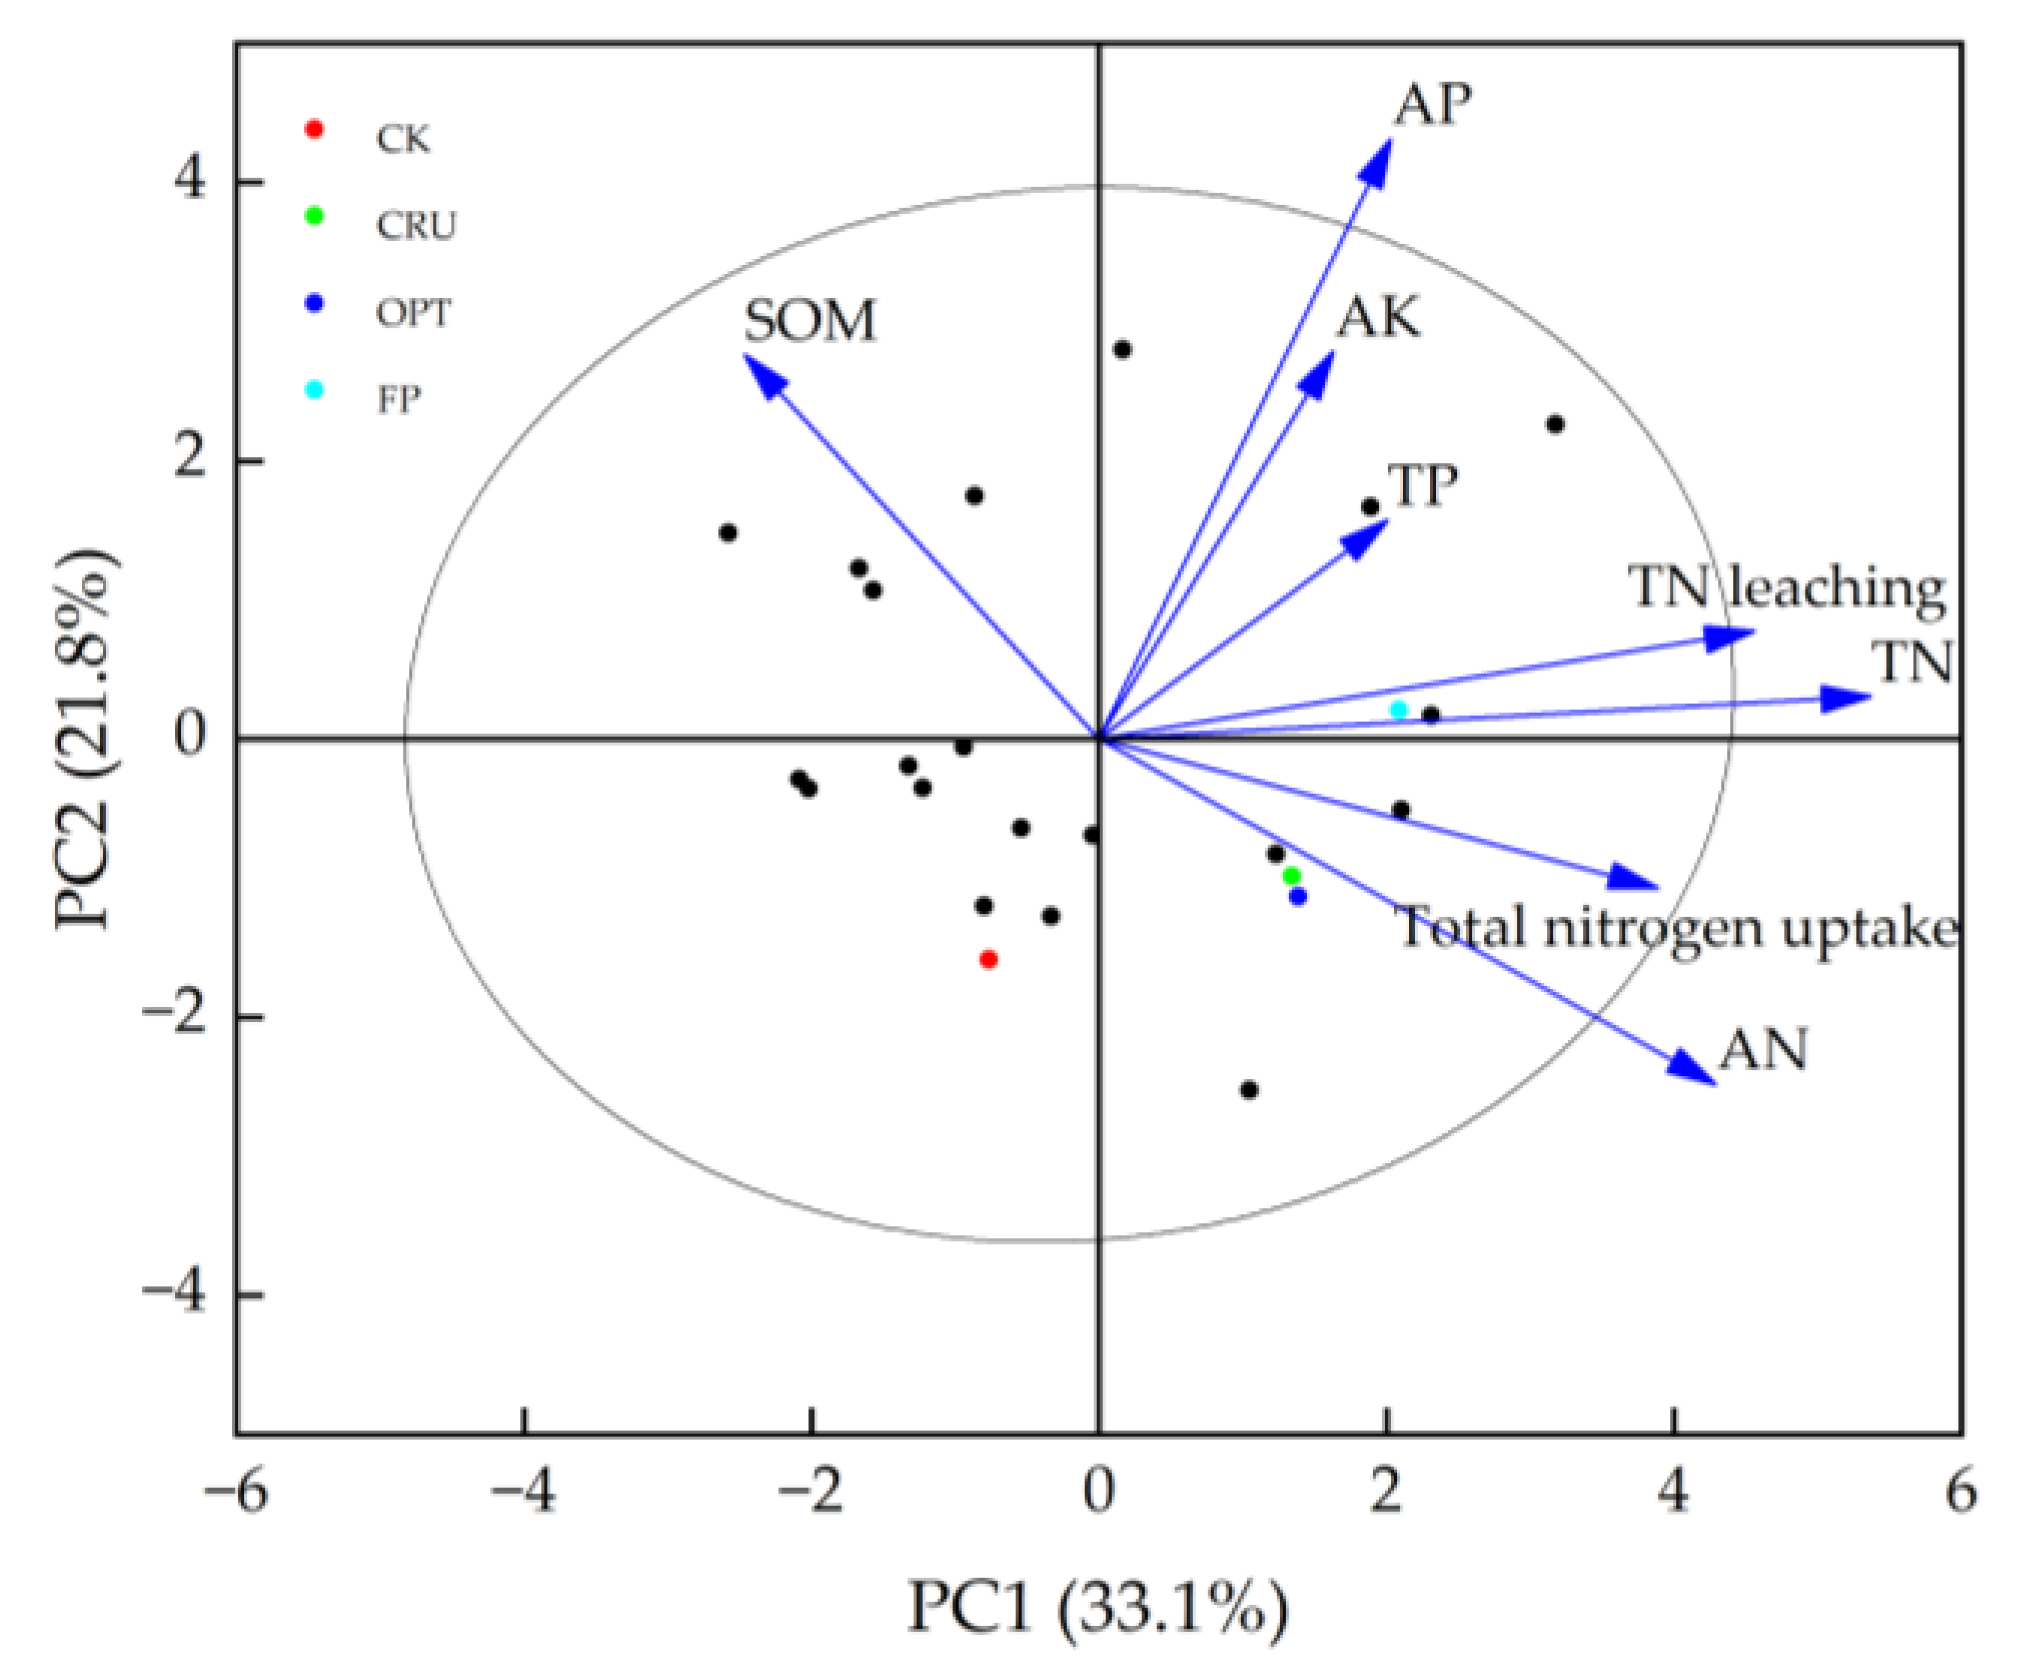
2.6. Relationships Between N Leaching and the Physical–Chemical Properties of Soil

The overall effects of N application at varying rates on N leaching and soil factors were analyzed using principal component analysis (PCA). The first two axes accounted for 54.9% of the variation in TN leaching and soil factors, indicating that these factors significantly influenced N uptake and N leaching. The PCA results (Figure 5) demonstrated a strong correlation between TN content in the soil and TN leaching, suggesting that TN is the primary factor affecting N leaching. Furthermore, this study found that TN leaching increased with higher N application rates. Additionally, available N, total phosphorus, available potassium, and available phosphorus all exhibited positive correlations with TN leaching.

3. Discussion

3.1. Effects of Optimal N Application on Paddy Yield

N fertilizer plays a vital role in paddy production. Appropriate application of N fertilizer can enhance the uptake and utilization of N by crops, ensuring both high quality and high yield [19,20]. However, excessive N fertilizer application not only reduces paddy yields but also leads to potential risk of non-point source contamination [21]. Controlled-release urea has been shown to effectively reduce N loss and mitigate non-point source contamination. The findings of this study indicate that, compared to the CRU treatment, the FP treatment did not result in increased paddy yield despite a 33.33% increase in the N application rate, corroborating the findings of Dong et al. [22]. A single application of controlled-release N fertilizer during the growing season significantly enhanced the availability of N in the soil, improved paddy growth, and resulted in higher paddy yields with reduced N application, as reported by Yang et al. [23]. In this study, the paddy yield under the controlled-release N fertilizer treatment was significantly higher than that under optimal and conventional fertilization methods, demonstrating that controlled-release N fertilizer can effectively satisfy the N nutritional requirements of paddy plants throughout the cultivation period, thereby promoting growth and increasing yields.

3.2. Effects of Optimal N Application on N Leaching Loss

The long-term and large-scale application of N fertilizer results in the accumulation of N in the soil from year to year, leading to the leaching of significant amounts of N in various forms. Reducing N application can effectively decrease N leaching [24]. NO3-N is the primary form of N leached from paddy fields. This is because the existence of a large number of nitrifying bacteria leads to extensive nitrification in soil. Research conducted by Chen et al. revealed that NH4+-N and NO3-N were the main components of TN in both surface water and leaching water, accounting for 77.1% and 83.6% of the TN, respectively [25]. As soil depth increases, the concentration of NH4+-N in the leaching water clearly decreases, as NH4+-N typically remains in the upper soil layers where it is readily absorbed by paddy plants and soil particles. In contrast, NO3-N contributes to nitrate pollution through the process of nitrification [26,27]. Compared to conventional fertilization methods, the application of controlled-release N fertilizer reduces N output from paddy fields to the environment by 36.3 kg ha−1 [6]. The peak of N leaching occurs during the initial stage of fertilization, which is a critical period for controlling N loss. The coating applied to controlled-release N fertilizer effectively prevents the rapid decomposition of N and facilitates a gradual release of nutrients in accordance with the N demands of paddy plants at various growth stages. This approach enhances N absorption and utilization while reducing the risk of N leaching loss [28].
The TN concentration peaked during the early stages of paddy growth in both years before declining rapidly. N leaching in paddy fields primarily occurs during this early growth phase due to the presence of residual N in the soil, the application of a substantial base fertilizer, and significant initial drainage, according to Cao et al. [29,30]. In comparison to other N fertilizer treatments, the leached N concentrations and TN leaching in the FP treatment were notably higher. Optimal N fertilization can minimize fertilizer waste and N loss while ensuring good paddy yield and NUE [31]. In this study, when conventional urea was utilized as the N source, the average leaching coefficients of TN in the FP and OPT treatments were 10.88% and 11.27%, respectively, whereas the average leaching coefficient of TN in the CRU treatment was only 7.07%, aligning with the findings of previous research [23]. The N concentrations in both surface water and leaching water in the OPT treatment were significantly lower than those in the FP treatment. Additionally, the peak N concentration in the surface water and leaching water of the CRU treatment was markedly lower than that of the other treatments, and the peak occurred later. Compared to FP and OPT, the amount of TN leached from the controlled-release N fertilizer decreased by 31.55% and 27.35%, respectively, corroborating the results of Peng et al. [32]. Consequently, reducing N input and employing controlled-release N fertilizer can effectively decrease N loss in paddy fields.
In addition, PCA showed the correlation between soil nutrients and TN leaching. Organic acids and other substances produced by organic matter decomposition can promote the release of insoluble nitrogen in soil. A proper amount of phosphorus can promote the development of the rice root system, but excessive accumulation of phosphorus can change soil physical and chemical properties, affect soil structures, and change soil permeability [33,34]. When the K+ concentration is high, the ion exchange between K+ and NH4+ leads to an increase in NH4+ concentration in soil and thus leaching with water.

3.3. Effects of Optimal N Application on N Use Efficiency

Currently, the NUE of paddy in China is only 30–35%. Excessive N application results in increased residues of ammonium N and nitrate N in the surface soil of paddy fields. In comparison to FP, the NUE under optimal fertilization improved by an average of 16.07% over two years, while the residual ammonium N and nitrate N decreased by 4.80% and 4.35%, respectively. Additionally, controlled-release urea has been shown to enhance NUE by more than 10 percentage points compared to conventional urea, subsequently increasing the NAE by 24.97–54.02%, as reported by Chen Kun et al. [35]. This study found that NUE was highest with controlled-release N fertilizer, which increased by an average of 19.04 percentage points compared to FP. Controlled-release fertilizer, which caters to the N nutritional requirements of paddy at various growth stages, can significantly improve NUE, according to Sun Ting et al. [36,37]. In this study, the two-year average NUE was found to be 36.74%, with an NAE of 23.5 kg∙kg−1 and NPP of 42.24 kg∙kg−1 in the CRU treatment. These findings align with the results reported by Dobermann et al. [38]. Compared to conventional N fertilizer application, the use of controlled-release N fertilizers significantly enhances aboveground N accumulation in paddy plants, with NUE increasing by 17.10–34.11%, as reported by Li Yunchun et al. [39]. This improvement can be attributed to the slower N release rate of controlled-release urea compared to conventional urea, which enables vegetative organs, such as the stems and leaves of paddy plants, to grow more vigorously and absorb more N. Following the booting stage, the increased production of photosynthetic substances can be effectively transferred to paddy grains, further enhancing NUE [40]. Therefore, optimizing N application practices and utilizing controlled-release N fertilizers can promote N uptake and improve NUE.

4. Materials and Methods

4.1. Experimental Site

The experiment commenced in 2020, utilizing experimental data collected from 2022 to 2023. The experimental site is located in Wanghong Town, Yongning County, which serves as the experimental station of the Ningxia Academy of Agriculture and Forestry Sciences (106°12′55″ E, 38°13′3″ N). This site is situated within the critical zone of the Ningxia Yellow River irrigation area, characterized by a typical mid-temperate arid climate. The average annual sunshine duration ranges from 2868 h to 3060 h, while the average annual temperature varies between 8.5 °C and 9.2 °C. Annual precipitation averages between 180 mm and 200 mm, and annual pan evaporation is estimated at 1600 mm to 2000 mm. The value of pH is 8.21 in 0–20 cm soil depth. The basic soil properties at a depth of 0–100 cm prior to the experiment are detailed in Table 4, indicating a moderate level of soil fertility. The growth periods of the tested paddy spanned from 9 May 2022, to 17 October 2022, and from 4 May 2023, to 8 October 2023. The rice of Fuyuan 4 was used as the test material in this study.

4.2. Experimental Design

Four treatments were employed in this experiment: CK (no N fertilizer application, 0 kg∙ha−1), CRU (controlled-release urea application, 180 kg∙ha−1), OPT (optimal N fertilizer application, 210 kg∙ha−1), and FP (N fertilizer application based on farmer experience, 240 kg∙ha−1). Three replicate plots were set for each treatment and randomly arranged in blocks, with each plot covering an area of 60 m2 (6 m × 10 m). The same amounts of phosphate fertilizer (P2O5, 90 kg∙ha−1) and potassium fertilizer (K2O, 45 kg∙ha−1) were utilized across all treatments, applied once as base fertilizers.
The controlled-release urea was provided by Shandong Yantai Agricultural Capital Sun Fertilizer Company (Yantai, Shandong Province, China), containing a total N content of 44%. Meanwhile, the conventional urea was employed for the OPT and FP treatments, and it was provided by Sinopec Group (China Petrochemical Corporation, Beijing, China), containing a total N content of 46%. All phosphate and potassium fertilizers were applied once before sowing as base fertilizers, specifically superphosphate (P2O5 content of 46%) for phosphate and potassium chloride (K2O content of 60%) for potassium. In the CRU treatment, polymer-coated urea was utilized as the N source, while conventional urea was employed for the OPT and FP treatments. The polymer-coated urea was applied once as a base fertilizer in the CRU treatment, whereas in the OPT and FP treatments, 60%, 20%, and 20% of the conventional urea were applied before sowing, during the tillering stage, and during the booting stage, respectively. Irrigation schedules were determined based on the arrival date of water in the Yellow River irrigation area and the water requirements of the paddies. Figure 6 illustrates the specific irrigation and precipitation amounts during the paddy growth period.

4.3. Sampling and Measurements

Plant sample analysis: At the time of harvest, paddy plant samples were collected from 1 m of each plot. After 20 min in an oven at 70 °C, the samples were dried at 105 °C to a constant weight; the dried materials were used to determine the total N content of both the paddy grain and straw, which were digested with H2SO4-H2O2 and analyzed with an automatic semi-micro Kjeldahl N analyzer.
Collection and analysis of leaching water: A sampling device for leaching water was installed in each plot, designed by our team and protected by intellectual property rights [41]. This device facilitated the collection of soil water samples from depths of 20 cm and 60 cm. Concurrently, field surface water samples were randomly collected at three points and mixed with a syringe. These samples were later analyzed in the laboratory for total N (TN), ammonium N (NH4+-N), and nitrate N (NO3-N) contents. The total N content was determined by potassium persulfate oxidation–ultraviolet spectrophotometry, while ammonium N and nitrate N contents were determined by flow injection analysis.
Soil samples were collected from depths of 0–20 cm, 20–40 cm, 40–60 cm, 60–80 cm, and 80–100 cm during the harvest stage. Soil samples were also obtained from 3 points within each plot and combined. Fresh soil samples were frozen in sealed bags and extracted with KCl (1 mol), after which the contents of nitrate N and ammonium N in the soil were determined by flow injection analysis. Meanwhile, total phosphorus was determined by the alkali fusion-Mo-Sb Anti spectrophotometric method and available phosphorus was determined by the Sodium hydrogen carbonate solution-Mo-Sb Anti spectrophotometric method [42].

4.4. Calculations

The N agronomic efficiency (NAE) was calculated with the following equation [43]:
NAE (kg·kg−1) = (YxY0)/Nf,
where Yx is the paddy grain yield in N fertilizer application treatments (kg∙ha−1), Y0 is the yield with no N fertilizer (kg∙ha−1), and Nf is the amount of N fertilizer input (kg∙ha−1).
N partial productivity (NPP) was calculated with the following equation [44]:
NPP (kg·kg−1) = Yx/Nf,
where Yx is the paddy grain yield in N fertilizer application treatments (kg∙ha−1) and Nf is the amount of N fertilizer input (kg∙ha−1).
N use efficiency (NUE) was calculated with the following equation [45]:
NUE (%) = (NtNc)/Nf × 100,
where Nt is the total N uptake in the fertilized plot (kg∙ha−1), Nc is the CK plot (kg∙ha−1), and Nf is the amount of N fertilizer input (kg∙ha−1).
N leaching loss (P) was calculated using the following equation:
P = i = 1 n C i × V i
where Ci is the concentration of N in the ith leached water (mg·L−1), and Vi is the volume of leached water at the ith time (L).

4.5. Statistical Analysis

Microsoft Excel 2016 and Origin 2024b were used for principal component analysis (PCA) and one-way analysis of variance (ANOVA). The least significant difference (LSD) test was used to compare the means with a 5% threshold of significance.

5. Conclusions

Compared to other N application treatments, CRU significantly reduced N concentration and N leaching in both surface water and leaching water. The results from the PCA indicated that total N was the most critical factor influencing TN leaching. The CRU treatment also led to a notable increase in yield compared to the FP and OPT treatments. Furthermore, N uptake and NUE in the CRU treatment were significantly higher than those in the other treatments. Specifically, NUE in the CRU treatment increased by 19.04% and 16.38% compared to the FP and OPT treatments, respectively, while NAE increased by 11.01 kg∙kg−1 and 9.56 kg∙kg−1, respectively. No significant difference was found between the FP and OPT treatments. Notably, the average yield in the OPT treatment decreased by 35.33 kg∙ha−1 compared to the FP treatment. Although the OPT treatment positively impacted the farmland environment, the N application rate was deemed unsuitable. To enhance paddy yield, improve NUE, and minimize N loss, the application of controlled-release urea (180 kg∙ha−1) is recommended as the optimal treatment. This study accurately quantified the effects of various N application rates on soil N balance and revealed the quantitative relationships between N application rates and the transformation, accumulation, and loss of soil N. Additionally, the primary factors influencing TN leaching were clarified. The findings of this study are crucial for advancing N fertilizer management and establishing appropriate fertilization strategies in paddy cultivation in northwest China. In addition, attention should be given to the interplay between irrigation and fertilization levels to achieve a better balance in N fertilizer management for paddy fields.

Author Contributions

J.H.: investigation, methodology, sample analysis, and writing—original draft; Y.W., H.L., J.M., X.Y., X.L., Y.H. and F.W.: experimental design and sample analysis. C.H. and R.L.: methodology, writing—review and editing. All authors have read and agreed to the published version of the manuscript.

Funding

The National Natural Science Foundation of China (32460324, U23A20158), the Natural Science Foundation of Ningxia Project (2023AAC03433), the National Social Science Fund of China (20BJY085), the Ningxia Key R&D Program (2022BEG02007), and the Ningxia Agricultural High-quality Development and Ecological Protection Technology Innovation Demonstration Project (NGSB-2021-11).

Data Availability Statement

The original contributions presented in this study are included in the article.

Acknowledgments

We express our gratitude to Jiansen Ma, Xinping Mao, Hongbo Li and Kelin Hu for their assistance during the English writing and their valuable comments on this manuscript.

Conflicts of Interest

The authors declare that the research was conducted in the absence of any commercial or financial relationships that could be construed as potential conflicts of interest.

References

  1. Lei, R.S. Effects of nitrogen application rate on rice yield and nitrogen fertilizer use efficiency. Fujian Agric. Sci. Technol. 2023, 54, 56–60. [Google Scholar]
  2. Li, H.; Hu, B.; Chu, C. Nitrogen use efficiency in crops: Lessons from Arabidopsis and rice. J. Exp. Bot. 2017, 68, 2477–2488. [Google Scholar] [CrossRef] [PubMed]
  3. Zhang, Z.L.; Liu, F.; Hou, T.-Y. Current status of nitrogen and phosphorus losses and related factors in Chinese paddy fields: A review. Chin. J. Appl. Ecol. 2019, 30, 3292–3302. [Google Scholar]
  4. Wang, Y.; Xian, Y.; Zhao, C.; Wang, W.; Huo, Z. Research progress and prospect of slow and controlled release fertilizer application technology in rice. China Rice 2023, 29, 20–26. [Google Scholar]
  5. Liu, X.; Wang, H.; Zhou, J.; Hu, F.; Zhu, D.; Chen, Z.; Liu, Y. Effect of N fertilization pattern on rice yield, N use efficiency and fertilizer–N fate in the Yangtze River Basin, China. PLoS ONE 2016, 11, e0166002. [Google Scholar] [CrossRef] [PubMed]
  6. Chen, L.; Liu, X.; Hua, Z.; Xue, H.; Mei, S.; Wang, P.; Wang, S. Comparison of nitrogen loss weight in ammonia volatilization, runoff, and leaching between common and slow-release fertilizer in paddy field. Water Air Soil Pollut. 2021, 232, 1–11. [Google Scholar] [CrossRef]
  7. Wang, G.; Cui, Z.; Chen, X.; Zhang, F.; Zhang, J.; Wang, S. Reactive nitrogen loss pathways and their effective factors in paddy field in southern China. Chin. J. Appl. Ecol. 2015, 26, 2337–2345. [Google Scholar]
  8. Xue, L.-H.; Yu, Y.-L.; Yang, L.-Z. Nitrogen balance and environmental impact of paddy field under different N management methods in Taihu Lake region. Environ. Sci. 2011, 32, 1133–1138. [Google Scholar]
  9. Liu, Q.; Ma, H.; Lin, X.; Zhou, X.; Zhao, Q. Effects of different types of fertilizers application on rice grain quality. Chil. J. Agric. Res. 2019, 79, 202–209. [Google Scholar] [CrossRef]
  10. Xiaoying, Z.; Qingwen, Z.; Hui, Z.; Hussain, H.A.; Shaaban, M.; Zhengli, Y. Pathways of nitrogen loss and optimized nitrogen management for a rice cropping system in arid irrigation region, northwest China. J. Environ. Manag. 2020, 268, 110702. [Google Scholar] [CrossRef] [PubMed]
  11. Yang, S.; Peng, S.; Xu, J.; He, Y.; Wang, Y. Effects of water saving irrigation and controlled release nitrogen fertilizer managements on nitrogen losses from paddy fields. Paddy Water Environ. 2015, 13, 71–80. [Google Scholar] [CrossRef]
  12. Qiao, Y.; Zhu, J.; Wu, Q.; Xie, C.; Li, M.; Huang, S. Nitrogen loss from surface runoff and ammonia volatilization from paddy field as impacted by different fertilizers and planting methods. J. Irrig. Drain. 2021, 40, 32–41. [Google Scholar]
  13. Li, P.; Lu, J.; Hou, W.; Pan, Y.; Wang, Y.; Khan, M.R.; Ren, T.; Cong, R.; Li, X. Reducing nitrogen losses through ammonia volatilization and surface runoff to improve apparent nitrogen recovery of double cropping of late rice using controlled release urea. Environ. Sci. Pollut. Res. 2017, 24, 11722–11733. [Google Scholar] [CrossRef] [PubMed]
  14. Liu, R.; Li, Y.; Zhang, A.; Wang, F.; Zhao, T.; Chen, C.; Hong, Y.; Yang, Z. Effect of postponing N application on rice yield and N losses in Yellow River irrigation area. J. Soil Water Conserv. 2012, 26, 16–20. [Google Scholar]
  15. Zhang, A.P.; Yang, S.Q.; YI, J.; Yang, Z.L. Analysis on current situation of water pollution and pollutant sources in Ningxia Yellow River irrigation region. Chin. J. Eco-Agric. 2010, 18, 1295–1301. [Google Scholar] [CrossRef]
  16. Chen, W.; Li, Q.; Hu, Y. Experimental research on variation feature of three kinds of nitrogen from paddy field in Qingtongxia irrigation area. J. Agro-Environ. Sci. 2010, 29, 790–794. [Google Scholar]
  17. She, D.; Hu, L.; Xia, Y.; Liu, W.; Li, H.; Ma, J.; Ma, K. Simulation of non-point source pollution losses from farmland in Yellow River irrigation area of Ningxia. J. Agro-Environ. Sci. 2022, 41, 2371–2381. [Google Scholar]
  18. Zhang, S.; Zhang, L.; Meng, Q.; Wang, C.; Ma, J.; Li, H.; Ma, K. Evaluating agricultural non-point source pollution with high-resolution remote sensing technology and SWAT model: A case study in Ningxia Yellow River Irrigation District, China. Ecol. Indic. 2024, 166, 112578. [Google Scholar] [CrossRef]
  19. Wang, W.; Lu, J.; Ren, T.; Li, X.; Su, W.; Lu, M. Evaluating regional mean optimal nitrogen rates in combination with indigenous nitrogen supply for rice production. Field Crops Res. 2012, 137, 37–48. [Google Scholar] [CrossRef]
  20. Staugaitis, G.; Viškelis, P.; Rimantas Venskutonis, P. Optimization of application of nitrogen fertilizers to increase the yield and improve the quality of Chinese cabbage heads. Acta Agric. Scand. Sect. B-Soil Plant Sci. 2008, 58, 176–181. [Google Scholar] [CrossRef]
  21. Xiaojie, W.; Jiarong, L.; Ruolin, L.; Shichen, W.; Jing, M.; Zhenke, Z.; Guangbin, Z.; Hua, X. The impact of nitrogen application rate on rice yield and greenhouse gas emissions of ratoon rice in the Taihu Lake region. Chin. J. Eco-Agric. 2024, 32, 1–11. [Google Scholar]
  22. Dong, Z.; Wu, L.; Chai, J.; Zhu, Y.; Chen, Y.; Zhu, Y. Effects of nitrogen application rates on rice grain yield, nitrogen-use efficiency, and water quality in paddy field. Commun. Soil Sci. Plant Anal. 2015, 46, 1579–1594. [Google Scholar] [CrossRef]
  23. Yang, Y.; Zhang, M.; Li, Y.; Fan, X.; Geng, Y. Controlled release urea improved nitrogen use efficiency, activities of leaf enzymes, and rice yield. Soil Sci. Soc. Am. J. 2012, 76, 2307–2317. [Google Scholar] [CrossRef]
  24. Choudhury, A.; Kennedy, I. Nitrogen fertilizer losses from rice soils and control of environmental pollution problems. Commun. Soil Sci. Plant Anal. 2005, 36, 1625–1639. [Google Scholar] [CrossRef]
  25. Chen, K.; Yu, S.e.; Ma, T.; Ding, J.; He, P.; Dai, Y.; Zeng, G. Effects of water and nitrogen management on water productivity, nitrogen use efficiency and leaching loss in rice paddies. Water 2022, 14, 1596. [Google Scholar] [CrossRef]
  26. Zhang, A.; Liu, R.; Gao, J.; Yang, S.; Chen, Z. Regulating N Application for Rice Yield and Sustainable Eco-Agro Development in the Upper Reaches of Yellow River Basin, China. Sci. World J. 2014, 2014, 239279. [Google Scholar] [CrossRef] [PubMed]
  27. Tan, X.; Shao, D.; Gu, W.; Liu, H. Field analysis of water and nitrogen fate in lowland paddy fields under different water managements using HYDRUS-1D. Agric. Water Manag. 2015, 150, 67–80. [Google Scholar] [CrossRef]
  28. Su, N.; Ronga, X.; Xie, G.; Chang, T.; Zhang, Y.; Peng, J.; Luo, G. Effectiveness of a 10-year continuous reduction of controlled-release nitrogen fertilizer on production, nitrogen loss and utilization of double-cropping rice. Sci. Total Environ. 2024, 912, 168857. [Google Scholar] [CrossRef]
  29. Cao, Y.; Tian, Y.; Yin, B.; Zhu, Z. Improving agronomic practices to reduce nitrate leaching from the rice–wheat rotation system. Agric. Ecosyst. Environ. 2014, 195, 61–67. [Google Scholar] [CrossRef]
  30. Qiao, J.; Yang, L.; Yan, T.; Xue, F.; Zhao, D. Rice dry matter and nitrogen accumulation, soil mineral N around root and N leaching, with increasing application rates of fertilizer. Eur. J. Agron. 2013, 49, 93–103. [Google Scholar] [CrossRef]
  31. Liu, R.; Wang, Y.; Hong, Y.; Wang, F.; Mao, X.; Yi, J. Controlled-release urea application and optimized nitrogen applied strategy reduced nitrogen leaching and maintained grain yield of paddy fields in Northwest China. Front. Plant Sci. 2023, 14, 1033506. [Google Scholar] [CrossRef] [PubMed]
  32. Peng, S.Z.; Yang, S.H.; Xu, J.Z.; Luo, Y.F.; Hou, H.J. Nitrogen and phosphorus leaching losses from paddy fields with different water and nitrogen managements. Paddy Water Environ. 2011, 9, 333–342. [Google Scholar] [CrossRef]
  33. Hu, Y.T.; Liao, Q.J.H.; Wang, S.W. Statistical analysis and estimation of N leaching from agricultural fields in China. Soils 2011, 43, 19–25. [Google Scholar]
  34. Luo, X.S.; Kou, C.L.; Wang, H.J. Effects of decreasing nitrogen and phosphorus fertilizers on nitrogen and phosphorus leaching and vegetable yield in field. Chin. J. Soil Sci. 2020, 51, 436–441. [Google Scholar]
  35. Chen, C.K.; Sheng, Q.Y.; Yu, H.; Zhu, F.H.; Zhong, Z.X.; Fa, S.X.; Hua, T.S.; Hui, C.G.; Fa, L.Y.; De, Z.X. Effects of controlled-release urea on yield of one season middle rice and nitrogen use efficiency. Southwest China J. Agric. Sci. 2018, 31, 507–512. [Google Scholar]
  36. Sun, T.; Wang, M.-L.; Wang, B.-C.; Li, Y.-D.; Wang, S.-Q. Effects of a single basal application of polymer-coated urea to a wheat field on crop yield, nitrogen use efficiency and NH3 and N2O emissions in eastern China. J. Agro-Environ. Sci. 2021, 40, 1115–1123. [Google Scholar]
  37. Yang, X.; Geng, J.; Liu, Q.; Zhang, H.; Hao, X.; Sun, Y.; Lu, X. Controlled-release urea improved rice yields by providing nitrogen in synchrony with the nitrogen requirements of plants. J. Sci. Food Agric. 2021, 101, 4183–4192. [Google Scholar] [CrossRef] [PubMed]
  38. Dobermann, A.R. Nitrogen use efficiency-state of the art. Agron.-Fac. Publ. 2005, 6, 316. [Google Scholar]
  39. Li, Y.C.; Li, X.K.; Lu, J.W.; Xu, W.M.; Yang, Y.Q.; Lu, J.M. Effects of controlled-release urea on yield, nutrient uptaking and nitrogen use efficiency of rice. J. Huazhong Agric. Univ. 2014, 33, 46–51. [Google Scholar]
  40. Li, P.; Lu, J.; Wang, Y.; Wang, S.; Hussain, S.; Ren, T.; Cong, R.; Li, X. Nitrogen losses, use efficiency, and productivity of early rice under controlled-release urea. Agric. Ecosyst. Environ. 2018, 251, 78–87. [Google Scholar] [CrossRef]
  41. Liu, R.; Zhang, A.; Li, Y.; Wang, F.; Zhao, T.; Chen, C.; Hong, Y. Rice yield, nitrogen use efficiency (NUE) and nitrogen leaching losses as affected by long-term combined applications of manure and chemical fertilizers in yellow river irrigated region of ningxia. China. J. Agro-Environ. Sci. 2015, 34, 947–954. [Google Scholar]
  42. Bao, S.D. Soil and Agricultural Chemistry Analysis; China Agriculture Press: Beijing, China, 2000; pp. 22–100. [Google Scholar]
  43. Fageria, N.K.; Santos, A.B.d.; Baligar, V.C. Phosphorus soil test calibration for lowland rice on an Inceptisol. Agron. J. 1997, 89, 737–742. [Google Scholar] [CrossRef]
  44. Timsina, J.; Singh, U.; Badaruddin, M.; Meisner, C.; Amin, M. Cultivar, nitrogen, and water effects on productivity, and nitrogen-use efficiency and balance for rice–wheat sequences of Bangladesh. Field Crops Res. 2001, 72, 143–161. [Google Scholar] [CrossRef]
  45. Cassman, K.; Gines, G.; Dizon, M.; Samson, M.; Alcantara, J. Nitrogen-use efficiency in tropical lowland rice systems: Contributions from indigenous and applied nitrogen. Field Crops Res. 1996, 47, 1–12. [Google Scholar] [CrossRef]
Figure 1. Trends in the TN, NH4+-N, and NO3-N concentrations of surface water in paddy fields under different N fertilizer treatments for two years. Dynamics of TN (a), NH4+-N (b), and NO3-N (c) concentrations of surface water in 2022; dynamics of TN (d), NH4+-N (e), and NO3-N (f) concentrations of surface water in 2023.
Plants 14 00408 g001
Figure 2. Trends in the TN, NH4+-N, and NO3-N concentrations of the leaching water at the 20 cm soil depth in paddy fields under different N fertilizer treatments for two years. Dynamics of TN (a), NH4+-N (b), and NO3-N (c) concentrations of the leaching water at the 20 cm soil depth in 2022; dynamics of TN (d), NH4+-N (e), and NO3-N (f) concentrations of surface water in 2023.
Plants 14 00408 g002
Figure 3. Trends in the TN, NH4+-N, and NO3-N concentrations of the leaching water at the 60 cm soil depth in paddy fields under different N fertilizer treatments for two years. Dynamics of TN (a), NH4+-N (b), and NO3-N (c) concentrations of the leaching water at the 60 cm soil depth in 2022; dynamics of TN (d), NH4+-N (e), and NO3-N (f) concentrations of surface water in 2023.
Plants 14 00408 g003
Figure 4. Vertical distributions of NH4+-N (a) and NO3-N (c) contents in 2022 along the 0~100 cm depth soil profile after paddy harvest. Vertical distributions of NH4+-N (b) and NO3-N (d) contents in 2023 along the 0~100 cm depth soil profile after paddy harvest. The horizontal bars mean standard deviations of the means CK, CRU, OPT, and FP.
Plants 14 00408 g004
Figure 5. Principal component analysis (PCA1, PCA2) showing trait vectors (soil organic matter, available phosphorus, available potassium, available N, total N, total N leaching, total N uptake) of N leaching and physical–chemical properties of the soil.
Plants 14 00408 g005
Figure 6. Irrigation and precipitation during the paddy growth period. The amount of irrigation water applied was determined via an electromagnetic flowmeter, and the precipitation data were obtained from the China Meteorological Network.
Plants 14 00408 g006
Table 1. Paddy yield under different N fertilizer treatments after harvest.
TreatmentYield in 2022
(t∙ha−1)
Yield in 2023
(t∙ha−1)
Average Yield
(t∙ha−1)
Ratio of Yield Increase
(%)
CK3.8 ± 0.2 c3.0 ± 0.5 b3.4 ± 0.2 c
CRU8.5 ± 0.6 a6.7 ± 0.6 a7.6 ± 0.2 a125.4 ± 6.1 a
OPT6.9 ± 0.6 b5.7 ± 0.7 a6.3 ± 0.5 b86.8 ± 15.5 b
FP7.0 ± 0.3 b5.7 ± 0.6 a6.3 ± 0.4 b87.9 ± 12.7 b
CK, no N fertilizer application; CRU, controlled-release urea application; OPT, optimal N fertilizer application; FP, N fertilizer application based on farmer experience. The values before and after the “±” indicate the average value and standard deviation, respectively. The letters following the values represent significant differences at p < 0.05.
Table 2. Nitrogen uptake, N use efficiency (NUE), N agronomic efficiency (NAE), N partial productivity (NPP) under different N fertilizer treatments during the paddy growing season.
YearTreatmentN Uptake by Paddy Straw (kg∙ha−1)N Uptake by Paddy Grain (kg∙ha−1)Total N Uptake
(kg∙ha−1)
NUE
(%)
NAE
(kg∙kg−1)
NPP
(kg∙kg−1)
2022CK22.36 ± 6.19 c45.23 ± 4.82 c67.60 ± 7.56 c
CRU40.53 ± 4.89 a98.00 ± 6.97 a138.53 ± 3.50 a39.41 ± 1.94 a26.45 ± 3.40 a47.36 ± 3.40 a
OPT30.66 ± 2.52 ab80.29 ± 5.59 b110.95 ± 4.05 b20.64 ± 1.93 b14.87 ± 2.72 b32.80 ± 2.72 b
FP32.03 ± 0.73 b81.38 ± 8.22 b114.41 ± 7.54 b19.51 ± 3.14 b13.45 ± 1.31 b29.13 ± 1.31 b
2023CK20.53 ± 6.06 b35.23 ± 6.32 b55.76 ± 11.93 b
CRU34.12 ± 1.82 a82.99 ± 13.77 a117.11 ± 15.20 a34.08 ± 8.45 a20.56 ± 3.39 a37.13 ± 3.39 a
OPT29.87 ± 0.69 ab68.10 ± 8.05 a97.97 ± 7.82 a20.10 ± 3.72 b13.02 ± 3.34 b27.22 ± 3.34 b
FP29.01 ± 9.78 ab64.95 ± 15.53 a93.96 ± 17.11 a15.91 ± 7.13 b11.25 ± 2.29 b23.68 ± 2.29 b
CK, no N fertilizer application; CRU, controlled-release urea application; OPT, optimal N fertilizer application; FP, N fertilizer application based on farmer experience. The values before and after the “±” indicate the average value and standard deviation, respectively. The letters following the values represent significant differences at p < 0.05.
Table 3. The amounts of TN, NH4+-N, and NO3-N leaching and their leaching coefficients in paddy fields under different N fertilizer treatments.
YearTreatmentTN Leaching
(kg∙ha−1)
TN Leaching
Coefficient
(%)
NH4+-N Leaching
(kg∙ha−1)
NH4+-N Leaching Coefficient
(%)
NO3-N Leaching
(kg∙ha−1)
NO3-N Leaching Coefficient
(%)
2022CK20.30 ± 2.58 e 1.31 ± 0.10 d 8.67 ± 1.54 c
CRU32.91 ± 3.76 cd7.01 ± 2.09 b2.96 ± 0.55 bc0.92 ± 2.25 b17.05 ± 1.82 b4.66 ± 2.16 ab
OPT44.01 ± 3.76 bc11.29 ± 1.79 b2.10 ± 0.09 cd0.38 ± 2.19 a25.60 ± 4.18 b8.06 ± 1.96 b
FP48.04 ± 4.17 ab11.56 ± 1.74 b3.49 ± 0.44 b0.91 ± 1.68 ab30.11 ± 3.84 ab8.93 ± 1.96 b
2023CK12.30 ± 2.11 d 1.09 ± 0.26 c 6.33 ± 1.12 b
CRU25.14 ± 2.22 c7.13 ± 1.24 b2.52 ± 0.35 b0.79 ± 1.09 a14.98 ± 1.55 bc4.81 ± 1.46 a
OPT35.90 ± 4.81 b11.24 ± 2.29 a2.23 ± 1.04 b0.54 ± 1.83 ab23.36 ± 3.27 c8.11 ± 1.11 a
FP36.77 ± 2.75 b10.20 ± 1.15 ab3.27 ± 0.43 bc0.91 ± 1.21 a27.53 ± 2.19 b8.83 ± 0.94 a
CK, no N fertilizer application; CRU, controlled-release urea application; OPT, optimal N fertilizer application; FP, N fertilizer application based on farmer experience. The values before and after the “±” indicate the average value and standard deviation, respectively. The letters following the values represent significant differences at p < 0.05.
Table 4. The basic soil properties at 0~100 cm in the study area.
Soil Depth
(cm)
Bulk Density
(g·cm−3)
Total Porosity
(%)
Total Salt
(g·kg−1)
Organic Matter
(g·kg−1)
Total N
(g·kg−1)
Available N
(mg·kg−1)
0~201.3648.70.4910.741.0138.66
20~401.3648.80.408.710.8526.98
40~601.5342.30.395.260.4025.12
60~801.6439.00.354.410.3124.31
80~1001.4445.40.313.150.2923.58
Disclaimer/Publisher’s Note: The statements, opinions and data contained in all publications are solely those of the individual author(s) and contributor(s) and not of MDPI and/or the editor(s). MDPI and/or the editor(s) disclaim responsibility for any injury to people or property resulting from any ideas, methods, instructions or products referred to in the content.

