
Widely Targeted Metabolomics Analyses Provide Insights into the Transformation of Active Ingredients During Drying and the Mechanisms of Color Change for Forest Ginseng (Panax ginseng C. A. Mey. cv. Sativi-nemoralis)


Abstract
:1. Introduction
2. Materials and Methods
2.1. Raw Materials
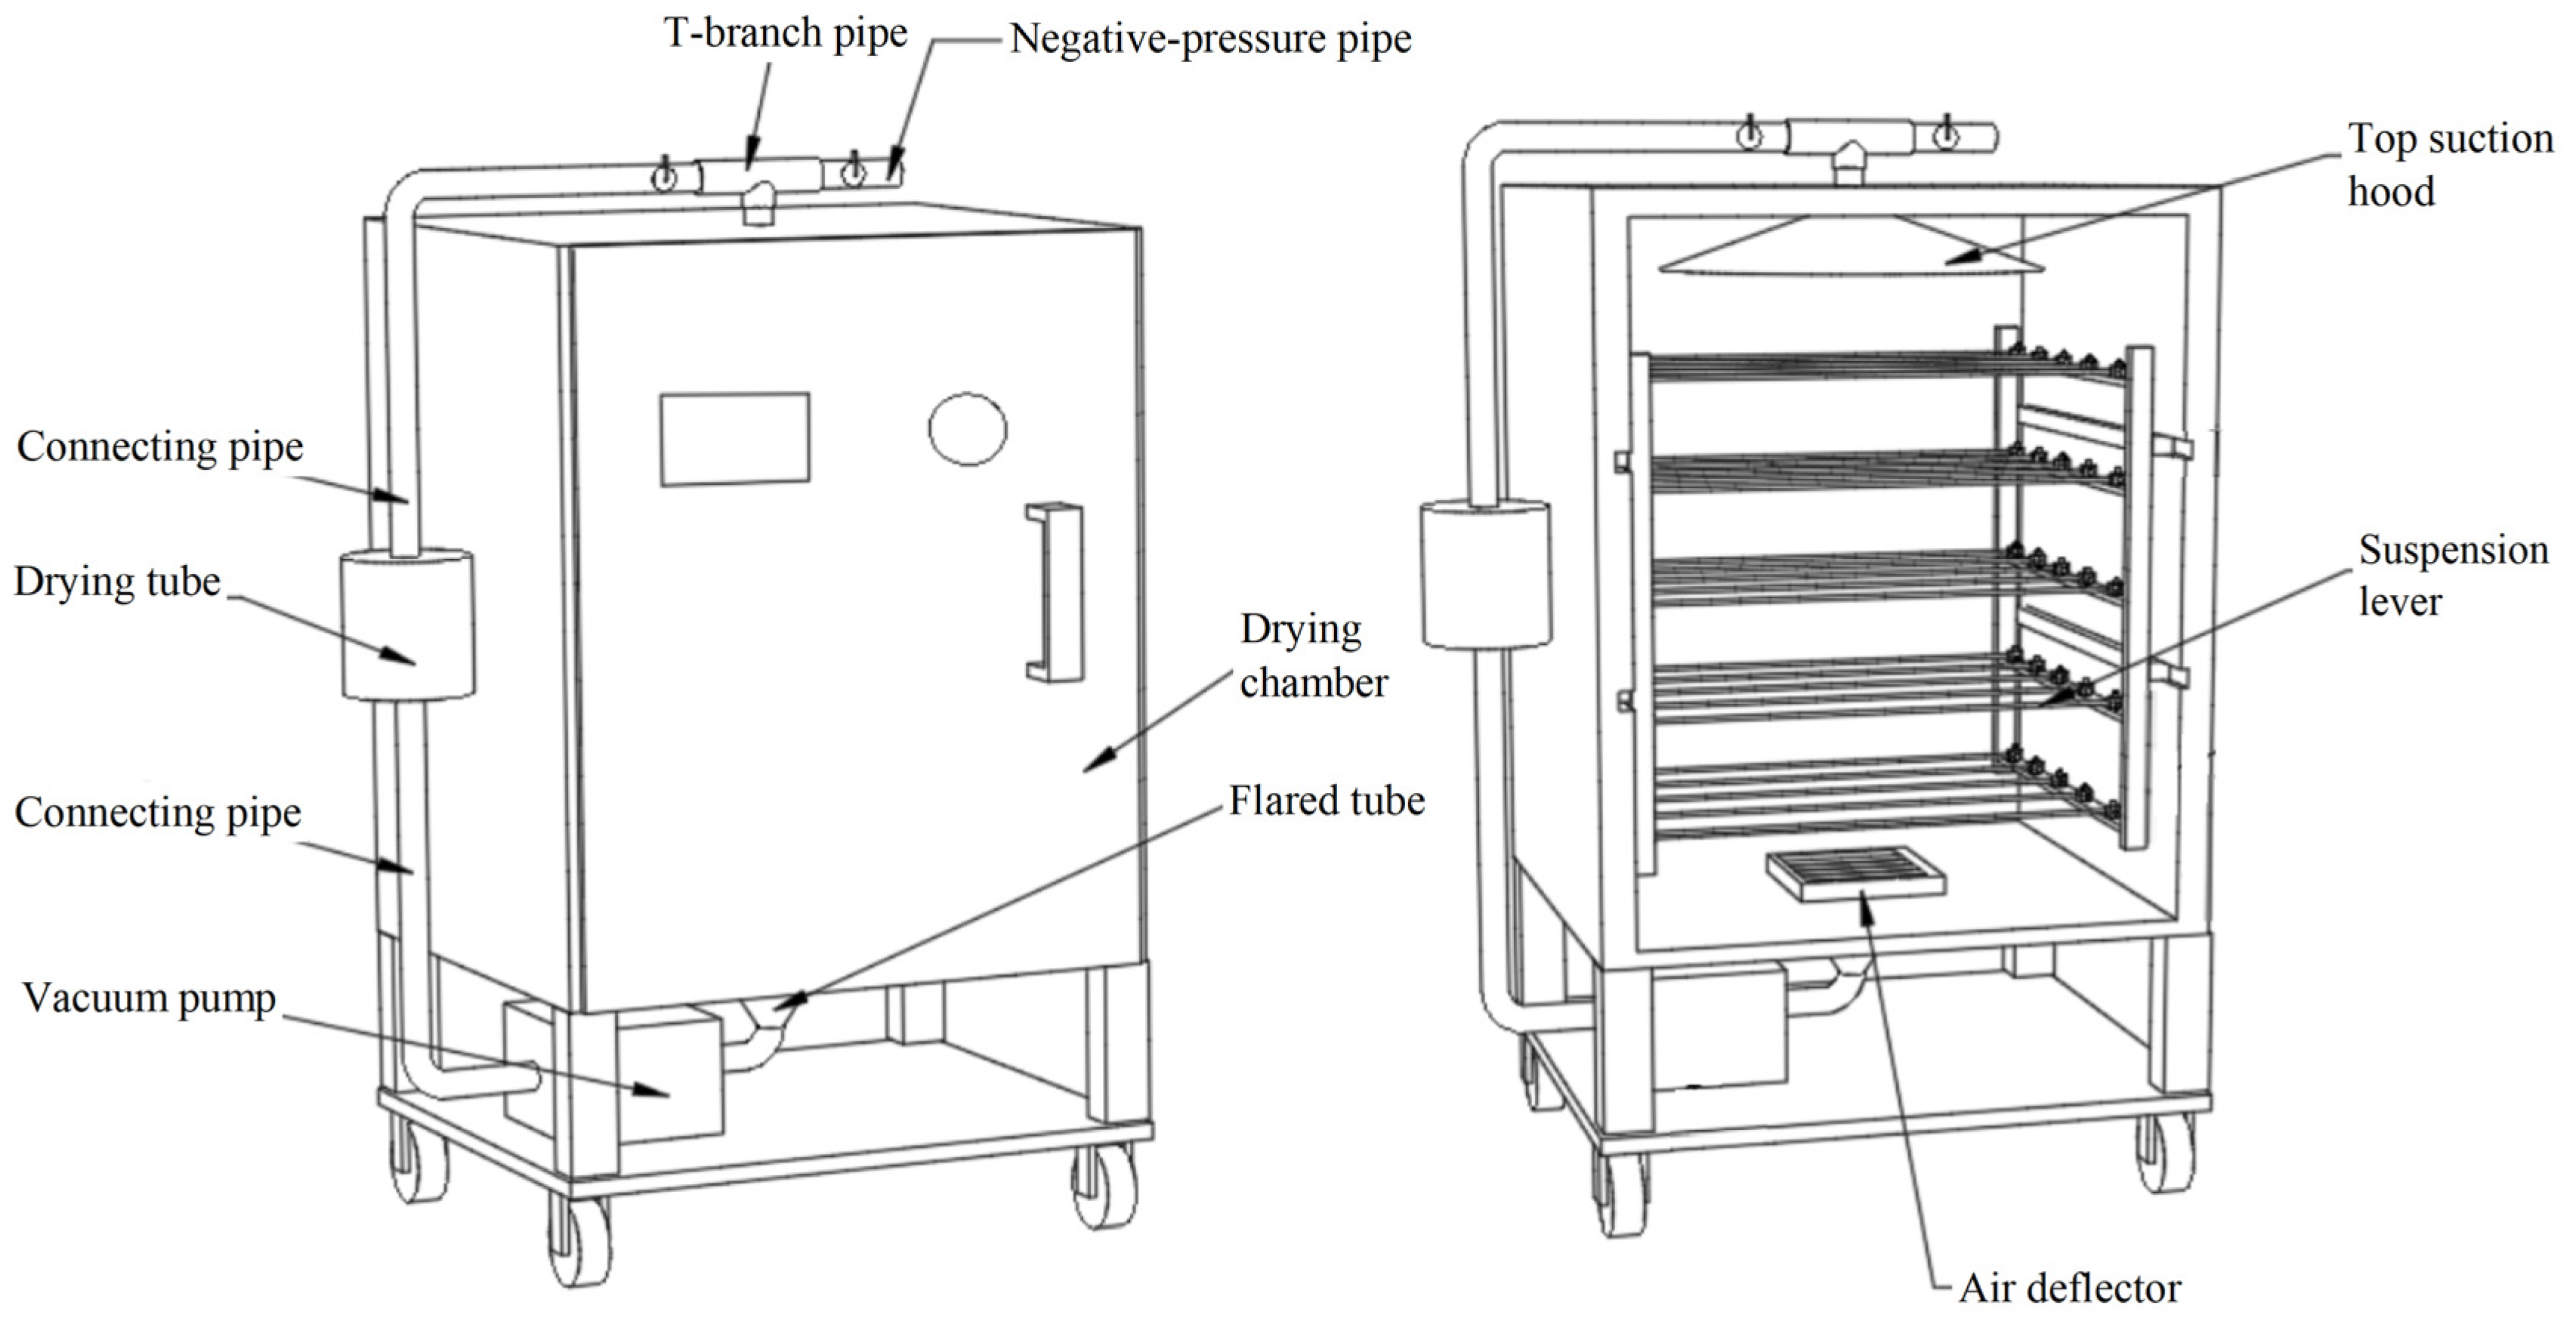
2.2. Drying Method
2.3. Color
2.4. Enzyme Activity Analyses
2.4.1. Antioxidant Enzyme Activity
2.4.2. Activities of Terpenoid Biosynthesis-Related Enzymes
2.5. Metabolomic Analysis [17]
2.5.1. Metabolite Extraction/Dry Sample Extraction
2.5.2. UPLC-MS/MS
2.5.3. Qualitative and Quantitative Determination of Metabolites
2.6. Data Analysis
3. Results
3.1. Color Attributes
3.2. Activities of Enzymes
3.3. Metabolome Analysis of Dried FG
3.3.1. Metabolite Overview of Dried FG
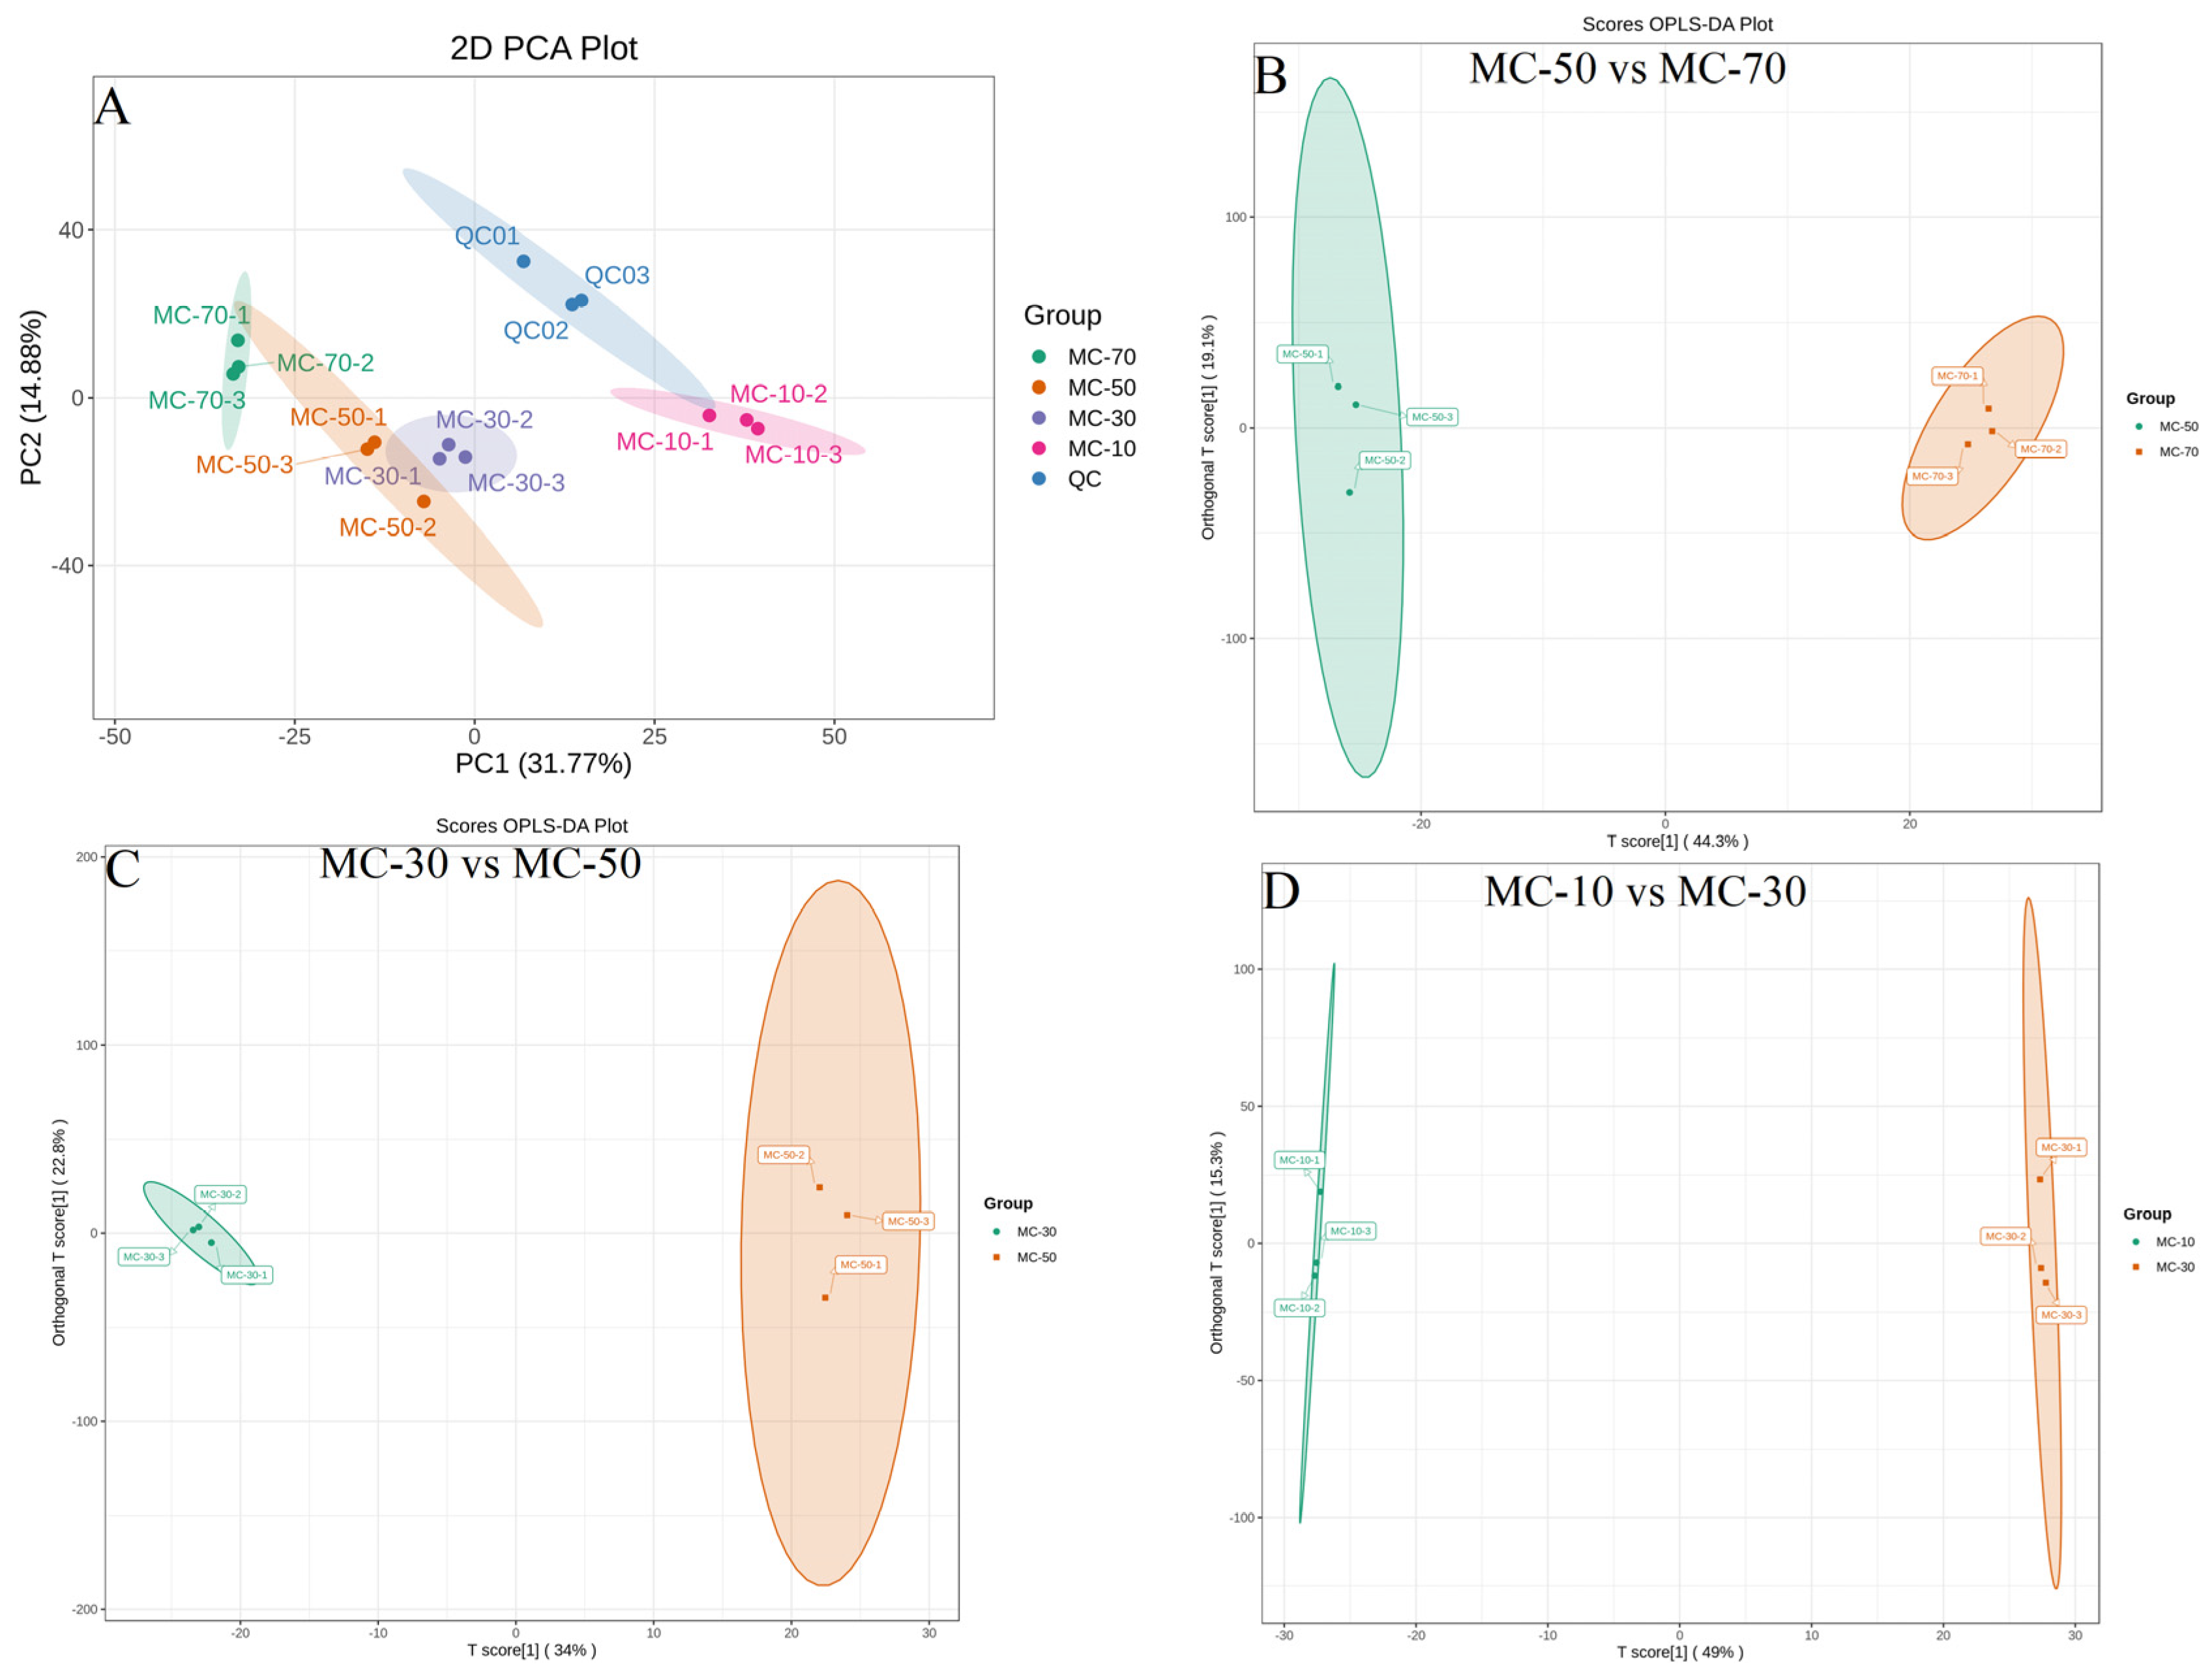
3.3.2. PCA and OPLS-DA
3.3.3. Differentially Abundant Metabolites (DAMs)
3.3.4. Metabolic Pathway Analysis
4. Discussion
5. Conclusions
Supplementary Materials
Author Contributions
Funding
Data Availability Statement
Conflicts of Interest
References
- Lee, Y.M.; Yoon, H.; Park, H.M.; Song, C.B.; Yeum, K.J. Implications of red Panax ginseng in oxidative stress associated chronic diseases. J. Ginseng Res. 2016, 41, 113–119. [Google Scholar] [CrossRef] [PubMed]
- Li, S.; Wang, P.; Yang, W.; Zhao, C.; Zhang, L.; Zhang, J.; Qin, Y.; Xu, H.; Huang, L. Characterization of the components and pharmacological effects of mountain-cultivated ginseng and garden ginseng based on the integrative pharmacology strategy. Front. Pharmacol. 2021, 12, 659954. [Google Scholar] [CrossRef] [PubMed]
- Ratan, Z.A.; Haidere, M.F.; Hong, Y.H.; Park, S.H.; Lee, J.O.; Lee, J.; Cho, J.Y. Pharmacological potential of ginseng and its major component ginsenosides. J. Ginseng Res. 2021, 45, 199–210. [Google Scholar] [CrossRef] [PubMed]
- Lai, W.; Yang, L.M.; Han, J.H.; Liu, F.F.; Ma, J.X.; Cai, E.B.; Han, M. Effects of different drying methods on the quality of ginseng in forest. Chin. Wild Plant Res. 2023, 42, 62–68. [Google Scholar]
- Bruni, R.; Sacchetti, G. Factors affecting polyphenol biosynthesis in wild and field grown St. John’s wort (Hypericum perforatum L. Hypericaceae/Guttiferae). Molecules 2009, 4, 682–725. [Google Scholar] [CrossRef]
- Yabar, E.; Pedreschi, R.; Chirinos, R.; Campos, D. Glucosinolate content and myrosinase activity evolution in three maca (Lepidium meyenii Walp.) ecotypes during preharvest, harvest and postharvest drying. Food Chem. 2011, 127, 1576–1583. [Google Scholar] [CrossRef]
- Cai, E.B.; Zhang, L.X.; Yang, L.M.; Han, J.H.; Han., M.; Fei, S.L. A Negative Pressure Circulation Drying System for Underforest Ginseng. China Patent ZL 202222387915.5, 23 May 2023. [Google Scholar]
- Zhou, C.; Zhu, C.; Li, X.; Chen, L.; Xie, S.; Chen, G.; Zhang, H.; Lai, Z.; Lin, Y.; Guo, Y. Transcriptome and phytochemical analyses reveal the roles of characteristic metabolites in the taste formation of white tea during the withering process. J. Integr. Agric. 2022, 21, 862–877. [Google Scholar] [CrossRef]
- Xu, P.; Su, H.; Zhao, S.; Jin, R.; Cheng, H.; Xu, A.; Lai, W.; Yin, X.; Wang, Y. Transcriptome and phytochemical analysis reveals the alteration of plant hormones, characteristic metabolites, and related gene expression in tea (Camellia sinensis L.) laves during withering. Plants 2020, 9, 204. [Google Scholar] [CrossRef]
- Yu, P.C.; Zhang, W.; Liu, W.F.; Wang, L.Y.; Meng, Z.P.; Liu, X.B.; Cao, L.; Meng, X.C. Impact and mechanism of ginseng rusty root symptoms on ginsenoside content. Mod. Chin. Med. 2024, 26, 1745–1753. [Google Scholar]
- Wang, W.Y.; Bi, J.F.; Hu, J.X.; Li, X. Metabolomics comparison of four varieties apple with different browning characters in response to pretreatment during pulp processing. Food Res. Int. 2024, 190, 114600. [Google Scholar] [CrossRef]
- Zheng, J.; Wu, Z.; Yang, N.; Zhou, K.; Hu, W.; Ou, S.; Liu, P. Widely targeted UHPLC-MS/MS metabolomic analysis on the chemical variation in blueberry-filled pastries during processing. Front. Nutr. 2020, 7, 569172. [Google Scholar] [CrossRef] [PubMed]
- Koistinen, V.M.; Da, S.A.B.; Abrankó, L.; Low, D.; Villalba, R.G.; Barberán, F.T.; Landberg, R.; Savolainen, O.; Alvarez-Acero, I.; Pascual-Teresa, D.S.; et al. Interlaboratory coverage test on plant food bioactive compounds and their metabolites by mass spectrometry-based untargeted metabolomics. Metabolites 2018, 8, 46. [Google Scholar] [CrossRef] [PubMed]
- Cai, E.B.; Du, R.; Han, J.H.; Dang, W.Y.; Zhao, Y.; Li, X. A Kind of Negative Pressure Dry Processing Internal Circulation System. Chinese Patent ZL 202420876517.6, 6 December 2024. [Google Scholar]
- Shen, N. Effect of drying on composition change and hepatoprotective activity of active substances in Rheum palmatum L. PhD Thesis, Gansu Agricultural University, Lanzhou, China, 2023. [Google Scholar]
- Ma, R.; Yang, P.; Jing, C.; Fu, B.; Teng, X.; Zhao, D.; Sun, L. Comparison of the metabolomic and proteomic profiles associated with triterpene and phytosterol accumulation between wild and cultivated ginseng. Plant Physiol. Bioch. 2023, 195, 288–299. [Google Scholar] [CrossRef] [PubMed]
- Li, Q.Y.; Mo, R.H.; Shen, D.Y.; Sun, S.M.; Tang, F.B.; Guo, Y.R.; Liu, Y.H. External browning mechanism in walnut kernel pellicles under different drying conditions based on the combination of widely-targeted and anthocyanin-targeted metabolomic. Food Chem. 2024, 460, 140440. [Google Scholar] [CrossRef] [PubMed]
- Fraga, C.G.; Galleano, M.; Verstraeten, S.V.; Oteiza, P.I. Basic biochemical mechanisms behind the health benefits of polyphenols. Mol. Asp. Med. 2010, 31, 435–445. [Google Scholar] [CrossRef]
- Song, Y.; Yao, Y.; Zhai, H.; Du, Y.; Chen, F.; Wei, S. Polyphenolic compound and the degree of browning in processing apple varieties. Agric. Sci. China 2007, 6, 607–612. [Google Scholar] [CrossRef]
- Ma, A.M.; Qi, X.Q. Mining plant metabolomes: Methods, applications, and perspectives. Plant Commun. 2021, 2, 100238. [Google Scholar] [CrossRef]
- Li, S.N. Quality Evaluation of Different Angelica Varieties by Metabonomics, Drying Mechanism of Balanced Dehydrationand Technology and Its Optimization for Angelica. PhD Thesis, Gansu University Of Chinese Medicine, Lanzhou, China, 2020. [Google Scholar]
- Cano, M.P.; de Ancos, B.; Lobo, M.G.; Santos, M. Improvement of frozen banana (Musa cavendishii, cv Enana) colour by blanching: Relationship between browning, phenols and polyphenol oxidase and peroxidase activities. Eur. Food Res. Technol. 1997, 204, 60–65. [Google Scholar] [CrossRef]
- Li, Z.; Zhang, Y.; Ge, H. The membrane may be an important factor in browning of fresh-cut pear. Food Chem. 2017, 230, 265–270. [Google Scholar] [CrossRef]
- Huang, C.; Li, Y.; Wang, K.; Xi, J.; Xu, Y.; Si, X.; Huang, J. Analysis of lipidomics profile of Carya cathayensis nuts and lipid dynamic changes during embryonic development. Food Chem. 2022, 370, 130975. [Google Scholar] [CrossRef]
- Zhang, M. Studies on the Molecular Ecological Mechanism of the Morphogenesis of Taproot and Rhizome in Panax ginseng. PhD Thesis, Jilin Agricultural University, Changchun, China, 2024. [Google Scholar]
- Liu, X.; Xiao, K.; Zhang, A.; Zhu, W.; Zhang, H.; Tan, F.; Huang, Q.; Wu, X.; Zha, D. Metabolomic analysis, combined with enzymatic and transcriptome assays, to reveal the browning resistance mechanism of fresh-cut eggplant. Foods 2022, 11, 1174. [Google Scholar] [CrossRef] [PubMed]
- Li, D.; Zhang, X.; Li, L.; Aghdam, M.S.; Wei, X.; Liu, J.; Xu, Y.; Luo., Z. Elevated CO2 delayed the chlorophyll degradation and anthocyanin accumulation in postharvest strawberry fruit. Food Chem. 2019, 285, 163–170. [Google Scholar] [CrossRef] [PubMed]
- Li, T.; Shi, D.; Wu, Q.; Zhang, Z.; Qu, H.; Jiang, Y. Sodium para-aminosalicylate delays pericarp browning of litchi fruit by inhibiting ROS-mediated senescence during postharvest storage. Food Chem. 2019, 278, 552–559. [Google Scholar] [CrossRef] [PubMed]
- Zeng, L.; Fu, Y.Q.; Gao, Y.; Wang, F.; Liang, S.; Yin, J.F.; Fauconnier, M.L.; Ke, L.J.; Xu, Y.Q. Dynamic changes of key metabolites in Longjing green tea during processing revealed by widely targeted metabolomic profiling and sensory experiments. Food Chem. 2024, 450, 139373. [Google Scholar] [CrossRef] [PubMed]
- Zrenner, R.; Stitt, M.; Sonnewald, U.; Boldt, R. Pyrimidine and purine biosynthesis and degradation in plants. Annu. Rev. Plant Biol. 2006, 57, 805–836. [Google Scholar] [CrossRef] [PubMed]
- Sukrong, S.; Yun, K.Y.; Stadler, P.; Kumar, C.; Facciuolo, T.; Moffatt, B.A.; Falcone, D.L. Improved growth and stress tolerance in the Arabidopsis oxt1 mutant triggered by altered adenine metabolism. Mol. Plant 2012, 5, 1310–1332. [Google Scholar] [CrossRef]
- Wang, W.; Bi, J.; Chen, W.; Li, X. Metabolomic analysis of the browning and browning inhibition pulp of Fuji apple at different ripening stages. Food Biosci. 2024, 62, 105323. [Google Scholar] [CrossRef]
- Gupta, R.; Min, C.W.; Kim, S.W.; Wang, Y.; Agrawal, G.K.; Rakwal, R.; Kim, S.G.; Lee, B.W.; Ko, J.M.; Baek, I.Y.; et al. Comparative investigation of seed coats of brown- vs. yellow-colored soybean seeds using an integrated proteomics and metabolomics approach. Proteomics 2015, 15, 1706–1716. [Google Scholar] [CrossRef]
- Ommisso, M.; Toffali, K.; Strazzer, P.; Stocchero, M.; Ceoldo, S.; Baldan, B.; Levi, M.; Guzzo, F. Impact of phenylpropanoid compounds on heat stress tolerance in carrot cell cultures. Front. Plant Sci. 2016, 7, 1439. [Google Scholar]
- Jia, X.; Sun, C.; Li, G.; Li, G.; Chen, G. Effects of progressive drought stress on the physiology, antioxidative enzymes and secondary metabolites of Radix Astragali. Acta Physiol. Plant. 2015, 37, 262. [Google Scholar] [CrossRef]
- Paupière, M.J.; Müller, F.; Li, H.; Rieu, I.; Tikunov, Y.M.; Visser, R.G.F.; Bovy, A.G. Untargeted metabolomic analysis of tomato pollen development and heat stress response. Plant Reprod. 2017, 30, 81–94. [Google Scholar] [CrossRef]
- Wu, X.; Yuan, J.; Luo, A.; Chen, Y.; Fan, Y. Drought stress and re-watering increase secondary metabolites and enzyme activity in dendrobium moniliforme. Ind. Crop. Prod. 2016, 94, 385–393. [Google Scholar] [CrossRef]
- Wang, Y.; Ren, W.; Li, Y.; Xu, Y.; Teng, Y.; Christie, P.; Luo, Y. Nontargeted metabolomic analysis to unravel the impact of di (2-ethylhexyl) phthalate stress on root exudates of alfalfa (Medicago sativa). Sci. Total Environ. 2019, 646, 212–219. [Google Scholar] [CrossRef] [PubMed]
- Barreca, D.; Mandalari, G.; Calderaro, A.; Smeriglio, A.; Trombetta, D.; Felice, M.R.; Gattuso, G. Citru Flavones: An update on sources, biological functions, and health promoting properties. Plants 2020, 9, 288. [Google Scholar] [CrossRef] [PubMed]
- Docimo, T.; Francese, G.; Palma, D.M.; Mennella, D.; Toppino, L.; Scalzo, L.R.; Mennella, G.; Tucci, M. Insights in the fruit flesh browning mechanisms in Solanum melongena genetic lines with opposite postcut behavior. J. Agric. Food Chem. 2016, 64, 4675–4685. [Google Scholar] [CrossRef] [PubMed]
- Yang, X.; Xu, Q.; Le, L.; Zhou, T.; Yu, W.; Wang, G.; Fu, F.F.; Cao, F. Comparative histology, transcriptome, and metabolite profiling unravel the browning mechanisms of calli derived from ginkgo (Ginkgo biloba L.). J. For. Res. 2023, 34, 677–691. [Google Scholar] [CrossRef]
- Zhu, L.; Hu, W.; Murtaza, A.; Iqbal, A.; Kong, M.; Zhang, J.; Li, J.; Xu, X.; Pan, S. Browning inhibition in fresh-cut Chinese water chestnut under high pressure CO2 treatment: Regulation of reactive oxygen species and membrane lipid metabolism. Food Chem. 2023, 427, 136586. [Google Scholar] [CrossRef]
- Guo, F.; Liu, H.H.; Qiu, Z.D.; Wang, W.N. Advances in enzymatic transformation of rare ginsenosides. Curr. Biotechnol 2017, 7, 279–283. [Google Scholar]
- Boncan, D.A.T.; Tsang, S.S.K.; Li, C.; Lee, I.H.T.; Lam, H.M.; Chan, T.F.; Hui, J.H.L. Terpenes and terpenoids in plants: Interactions with environment and insects. Int. J. Mol. Sci. 2020, 21, 7382. [Google Scholar] [CrossRef]


Disclaimer/Publisher’s Note: The statements, opinions and data contained in all publications are solely those of the individual author(s) and contributor(s) and not of MDPI and/or the editor(s). MDPI and/or the editor(s) disclaim responsibility for any injury to people or property resulting from any ideas, methods, instructions or products referred to in the content. |
© 2025 by the authors. Licensee MDPI, Basel, Switzerland. This article is an open access article distributed under the terms and conditions of the Creative Commons Attribution (CC BY) license (https://creativecommons.org/licenses/by/4.0/).
Share and Cite
Xing, J.; Yang, L.; Zhang, L.; Han, J.; Cai, E. Widely Targeted Metabolomics Analyses Provide Insights into the Transformation of Active Ingredients During Drying and the Mechanisms of Color Change for Forest Ginseng (Panax ginseng C. A. Mey. cv. Sativi-nemoralis). Plants 2025, 14, 494. https://doi.org/10.3390/plants14030494
Xing J, Yang L, Zhang L, Han J, Cai E. Widely Targeted Metabolomics Analyses Provide Insights into the Transformation of Active Ingredients During Drying and the Mechanisms of Color Change for Forest Ginseng (Panax ginseng C. A. Mey. cv. Sativi-nemoralis). Plants. 2025; 14(3):494. https://doi.org/10.3390/plants14030494
Chicago/Turabian StyleXing, Junjia, Limin Yang, Lianxue Zhang, Jiahong Han, and Enbo Cai. 2025. "Widely Targeted Metabolomics Analyses Provide Insights into the Transformation of Active Ingredients During Drying and the Mechanisms of Color Change for Forest Ginseng (Panax ginseng C. A. Mey. cv. Sativi-nemoralis)" Plants 14, no. 3: 494. https://doi.org/10.3390/plants14030494
APA StyleXing, J., Yang, L., Zhang, L., Han, J., & Cai, E. (2025). Widely Targeted Metabolomics Analyses Provide Insights into the Transformation of Active Ingredients During Drying and the Mechanisms of Color Change for Forest Ginseng (Panax ginseng C. A. Mey. cv. Sativi-nemoralis). Plants, 14(3), 494. https://doi.org/10.3390/plants14030494