Abstract
R. platypodum (Rhododendron platypodum) is an endangered alpine species with a highly restricted distribution in the southwestern region of China, which possesses significant ornamental and horticultural value. In this study, the high-quality genome assembly of R. platypodum at the chromosomal level is reported. The total genome size was determined to be 642.25 Mb, with a contig N50 of 25.64 Mb, and it contains 36,522 predicted genes. Comparative genomic analysis between R. platypodum and other species revealed the expansion of gene families, such as those related to transition metal ion binding and sodium ion transport, as well as the contraction of gene families involved in the recognition of pollen and pollen–pistil interaction. These findings might explain the adaptation of R. platypodum to rocky habitats and contribute to its endangered status. Furthermore, a heat stress experiment was conducted on R. platypodum, followed by transcriptome sequencing and physiological co-analysis to construct a co-expression network. This analysis identified the candidate gene TAR1-A and other transcription factors exhibiting differential expression under heat stress. The whole-genome sequencing, transcriptome analysis, and physiological co-analysis of R. platypodum provide valuable resources for its conservation and offer insights into its mechanisms of heat stress.
1. Introduction
Rhododendrons are important horticultural and ornamental plants worldwide, valued for their large, vibrant flowers and graceful forms [1,2,3]. The genus Rhododendron encompasses 600 confirmed species, making it the genus with the highest number of woody plant species in China [4]. Taxonomists have classified the genus into eight subgenera based on morphological characteristics, with Hymenanthes recognized as being widely distributed in high-altitude areas [5]. However, urban development and global climate change have significantly impacted high-altitude habitats, placing Hymenanthes species at risk of extinction [4,6]. R. platypodum, a typical representative of this group, is an evergreen shrub, primarily found in rocky and forested areas at altitudes of 1800–2100 m [7]. Due to factors such as human activities and its low adaptability, the habitat of R. platypodum has been severely reduced, with its distribution now confined to a small area on steep slopes and rocks in southeast Chongqing and the Mao’er Mountains in Guangxi, China. As a result, it has been included in the Red List of Rhododendrons [8] and highlighted by the International Union for Conservation of Nature (IUCN) [9]. Despite its high ornamental value, attributed to its large, variably colored flowers (white, pink, and purple) and elegant form, research on R. platypodum remains limited. Current studies primarily focus on its genetic diversity, phenotypic diversity, and chloroplast genome [7,9]. Further research is necessary to promote its conservation and enhance its ornamental utilization.
With the advancement of sequencing technologies, over 10 species within the genus Rhododendron have undergone complete genome assembly, including species from subgenera such as Hymenanthes, Pentanthera, Tsutsusi, and Azaleastrum [10,11,12,13]. Species with high environmental adaptability, such as Rhododendron simsii (R. simsii) and Rhododendron ovatum (R. ovatum) [10,11], and those with more restricted distributions, such as Rhododendron henanense (R. henanense) and Rhododendron griersonianum (R. griersonianum), have also been sequenced [1,4]. Despite these advancements, genomic research remains limited, considering the 600 confirmed species within the genus. The genomic study of R. platypodum could provide a more comprehensive genomic resource, benefiting both the conservation and development of Rhododendrons.
Species within the subgenus Hymenanthes are predominantly distributed in high-altitude regions and typically exhibit poor heat tolerance [14]. In the context of global warming, current research on the heat tolerance of Rhododendrons mainly focuses on other subgenera or widespread species capable of withstanding high temperatures [10,15]. Studies have examined physiological [16,17], biochemical [15], and transcriptomic [14,18,19] changes and response mechanisms to heat stress. Yet there is limited research linking physiological and transcriptomic data through co-expression network analysis. Weighted correlation network analysis (WGCNA), a statistical and bioinformatic method, can help elucidate the molecular mechanisms underlying heat stress in plants and provide candidate genes for the breeding of heat-tolerant varieties [20,21].
In this study, we report the high-quality genome assembly of R. platypodum and construct a phylogenetic tree by comparing it with other species. This comparison reveals genomic changes throughout its evolutionary process. Furthermore, we integrate physiological and transcriptomic analyses to assess the adaptive mechanisms of R. platypodum under high-temperature conditions. This study will lay the foundation for the future conservation, low-altitude introduction, and domestication of R. platypodum.
2. Results
2.1. Genome Assembly and Assessment
The genome assembly of R. platypodum was generated from fresh leaf tissues of a diploid individual collected from Jinfoshan Mountains, Chongqing (107°11.38′ E, 29°02.42′ N). High-molecular-weight DNA was extracted using an optimized CTAB method and sequenced with PacBio Revio HiFi (long-read, 31.8× coverage) and BGI Illumina (short-read, 150.3× coverage) platforms. De novo assembly was performed using HiFiasm v0.16.1, followed by Hi-C scaffolding to cluster contigs into chromosome-scale scaffolds.
K-mer analysis estimated the genome size to be 630.6 Mb (Figure S1). The final assembly spanned 642.3 Mb (contig N50: 25.6 Mb) with 98.8% core eudicot BUSCO completeness (93.2% single-copy, 5.6% duplicated; Table S1), surpassing existing Rhododendron genomes (Table 1). HiFi and Illumina read mapping rates reached 99.8% and 98.9%, respectively, with coverage rates >99.8% (BWA/Minimap2). The assembly quality (QV: 65.2) and LAI score (21.1, “golden” level) further validated its integrity. The Hi-C sequencing (Figure S2; Table S2) supported a near-chromosome-level assembly, with 13 chromosome-scale scaffolds (636.9 Mb, 99.2% of total length; scaffold N50: 493.6 Mb) matching the expected diploid karyotype (2n = 26).

Table 1.
Comparison of assembly and annotation across 11 different Rhododendron genomes.
2.2. Genome Annotation of R. platypodum
A comprehensive comparison across multiple databases resulted in the annotation of a total of 36,522 genes in the R. platypodum genome, of which 35,679 genes (97.7%) were successfully annotated (Table S3). Following genome annotation, the average gene length was determined to be 6460 bp, with an average coding sequence length of 1132 bp, an average exon length of 367 bp, and an average intron length of 1194 bp (Table 1 and Table S4, Figure S3). Non-coding RNAs were also annotated, revealing 87 miRNAs, 649 tRNAs, 1964 rRNAs, and 480 snRNAs, which together accounted for 1.33% of the total genome (Table S5).
Notably, a comparison with the genomes of 10 other R. species (Table 1) revealed that R. platypodum has the highest average gene length (6460 bp), indicating a higher level of genomic complexity. And R. platypodum exhibited the highest percentage of repeat sequences among the genus Rhododendron species (69.6%). R. platypodum demonstrated a high proportion of LTR retrotransposons (47.7%), second only to R. henanense (50.8%). This might be related to its relatively long average genome length and the presence of gene duplication sequences.
2.3. Phylogenetic and Gene Family Expansion and Contraction Analysis
The genome of R. platypodum was compared with those of 16 other plant species, all of which were classified under the ARP III classification system. These species were selected based on different subgenera of the Rhododendron genus, different genera within the Ericaceae family, and different families within the Ericales order. An outgroup, Vitis vinifera (V. vinifera), was also included (Table S6). A total of 19,122 gene families were identified in R. platypodum, of which 101 were unique to this species (Figure 1a; Table S7). R. platypodum shared more specific gene families with R. griersonianum (615) than with more distantly related species such as R. henanense (322) and Rhododendron delavayi (R. delavayi) (194) (Figure 1a,b).
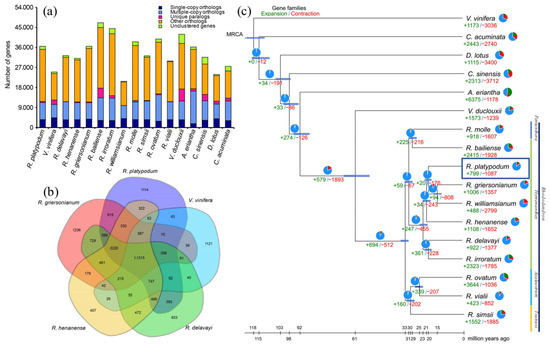
Figure 1.
(a) Bar graph showing the species-specific or nonspecific properties of all genes in 17 species. (b) The Venn diagram shows the distribution of shared or unique orthogroups among five Rhododendron species. (c) Phylogenetic tree showing the topology and divergence times for 19 plant species. Divergence times are indicated by light blue bars at the internodes. The range of the light blue bars indicates the 95% highest posterior density of the divergence time. Numbers in green and red at branches indicate the expansion and contraction of gene families, respectively. The pie chart colors represent the changes in gene families (blue—no significant change; orange—expanded or contracted; green—expanded; red—contracted); each color sector illustrates the proportion of each type of gene family change. Note: refer to Table S6 for the standardized abbreviations of plant species names.
According to the phylogenetic tree, the evolutionary history of R. platypodum could be traced (Figure 1c). The divergence of the families Diospyros (Diospyros kaki), Theaceae (Camellia sinensis), and Actinidiaceae (Actinidia eriantha) within the order Ericales occurred at 102.4 Ma, 97.6 Ma, and 91.8 Ma, respectively. In the Ericaceae family, the divergence between the genera Vaccinium (Vaccinium duclouxii) and Rhododendron occurred at 60.7 Ma, accompanied by the significant expansion and contraction of gene families (+597 and −1893, respectively). Within the genus Rhododendron, gene families underwent intense expansion and contraction (+694 and −512, respectively) at 32.4 Ma, leading to differentiation into evergreen and deciduous rhododendrons (subgenus Azaleastrum and subgenus Tsutsusi). Rhododendron platypodum (R. platypodum) belongs to the subgenus Hymenanthes, diverging at 21.8 Ma from R. delavayi and Rhododendron irroratum (R. irroratum), and at 18.8 Ma from R. griersonianum and Rhododendron williamsianum (R. williamsianum). Notably, R. platypodum exhibited fewer gene family expansions and contractions compared to other subgenus Hymenanthes species (+799 and −1087, respectively).
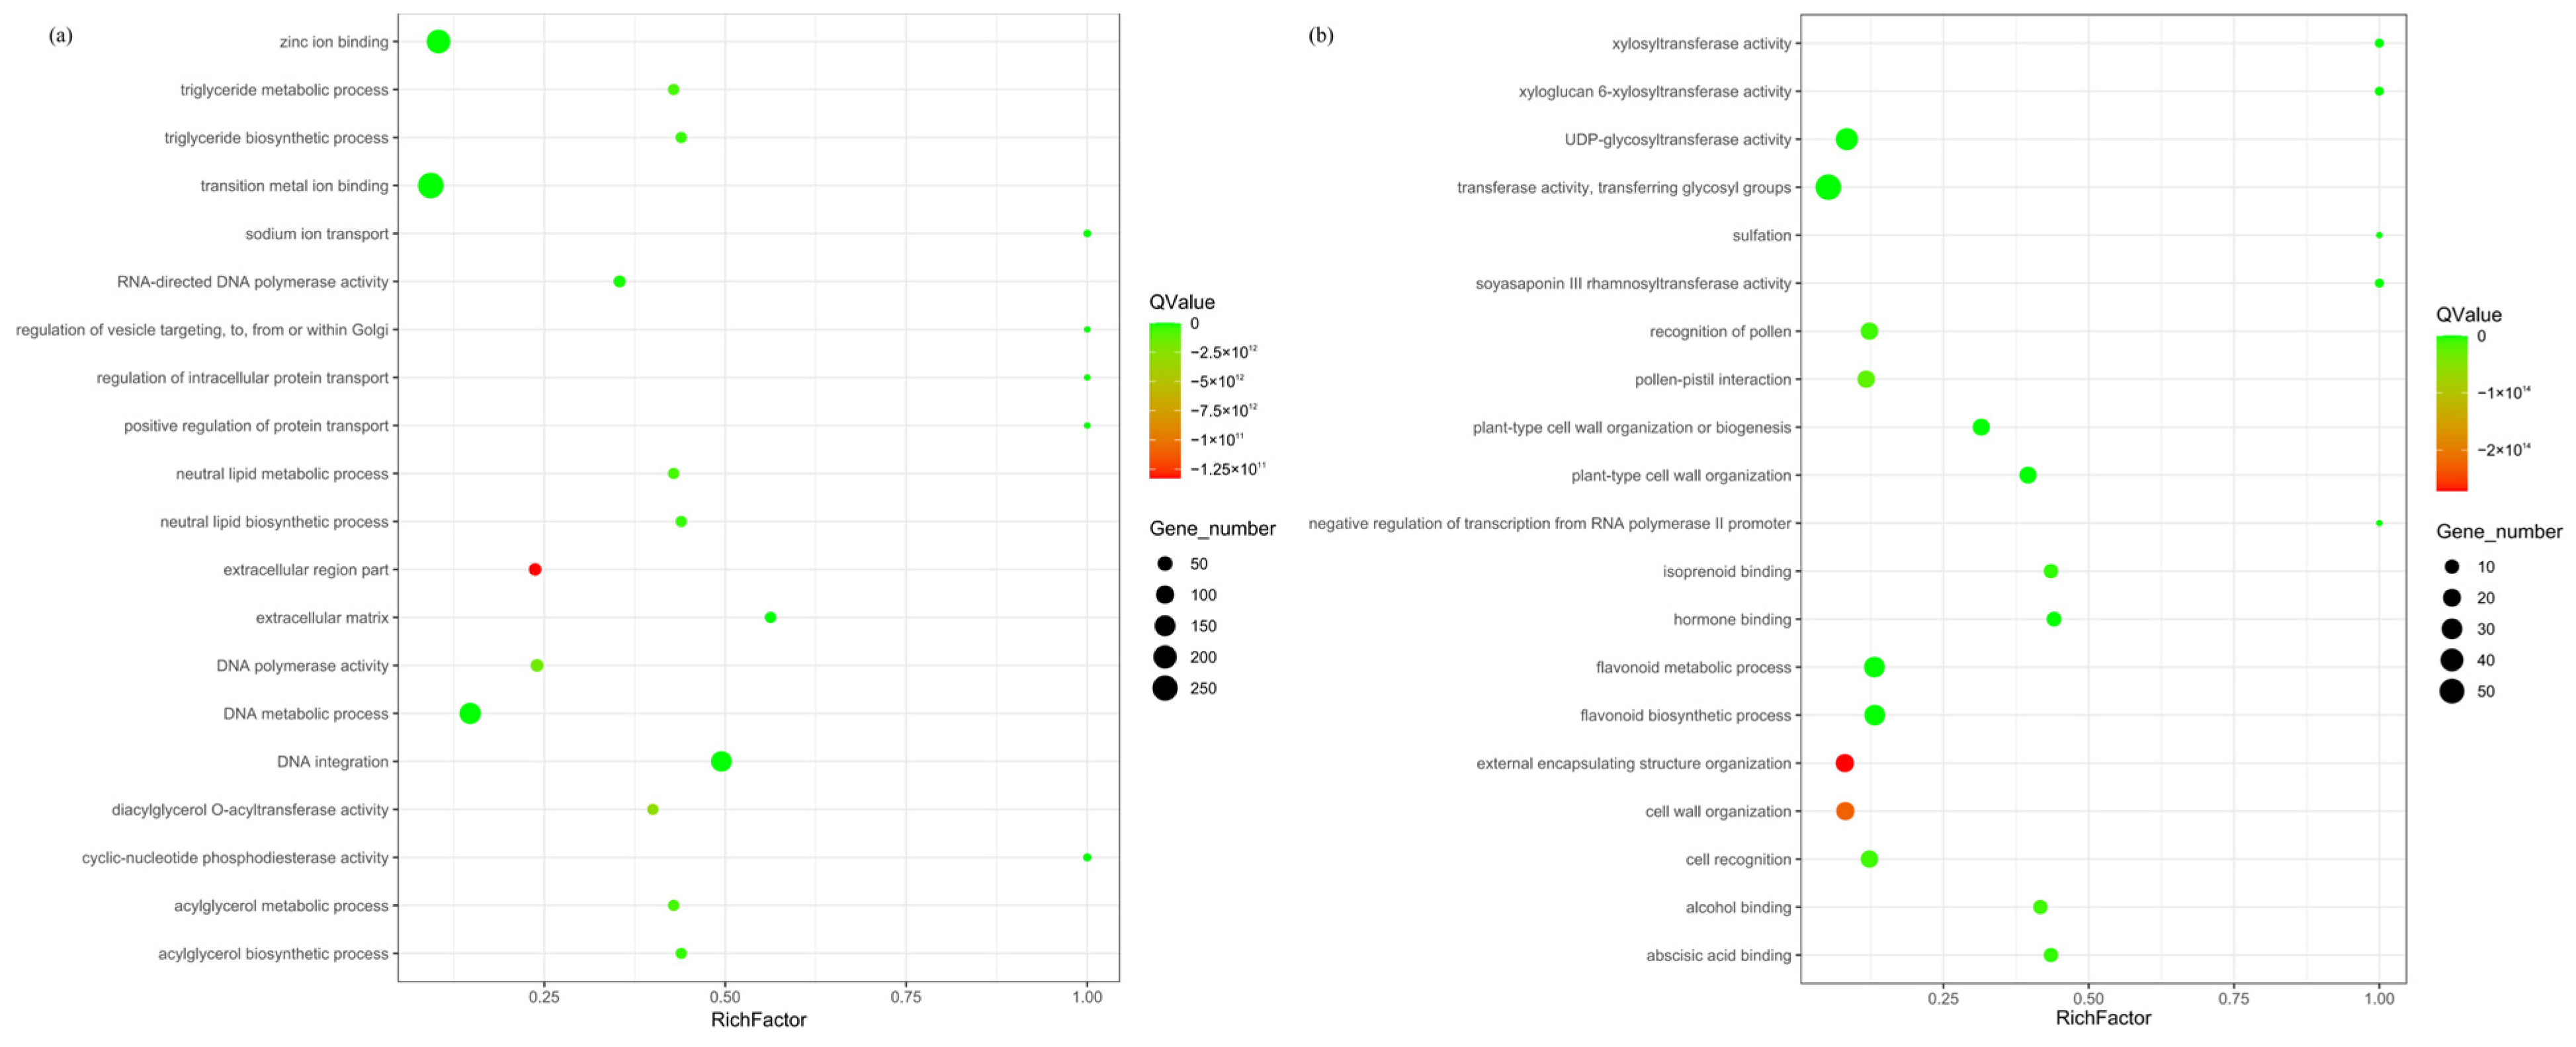
The expanded and contracted gene families of R. platypodum were annotated by Gene Ontology (GO). Among the expanded gene families (Figure 2a), the most enriched categories in the molecular function category were binding (839) and catalytic activity (804) (Figure S4a). The most abundant terms included transition metal ion binding, zinc ion binding, DNA metabolic process, and DNA integration (p < 0.05). Within the contracted gene families (Figure 2b), the molecular function category showed the highest enrichment for catalytic activity (171), and the Cellular Component category showed the highest enrichment for membrane (141) (Figure S4b). The most significant terms included flavonoid metabolic process, flavonoid biosynthetic process, transferase activity, transferring glycosyl groups, and UDP-glycosyltransferase activity.
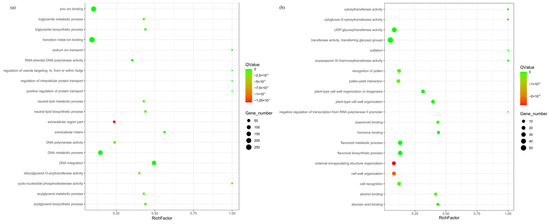
Figure 2.
Enrichment analysis of expanded (a) and contracted (b) gene families in R. platypodum.
2.4. Differential Expression of Physicochemical Properties and Genes in R. platypodum Under Heat Stress
Leaf samples from three-year-old Rhododendron platypodum plants exposed to 36 °C/28 °C (day/night) heat stress for 0 (CK), 1, 2, 4, and 6 days were subjected to RNA-Seq and an analysis of physicochemical properties. Due to the thick leaf cuticular wax of R. platypodum, no significant wilting was observed during heat stress, and only noticeable curling was observed (Figure S5). After the onset of heat stress, the stomatal W/L ratio and size of R. platypodum significantly increased at 1d (Figure S6a,b). After stabilizing for a period, both parameters increased significantly again at 6d. Fv/Fm and relative conductivity exhibited a continuous decline during heat stress, but the changes were not significant (Figure S6c,d).
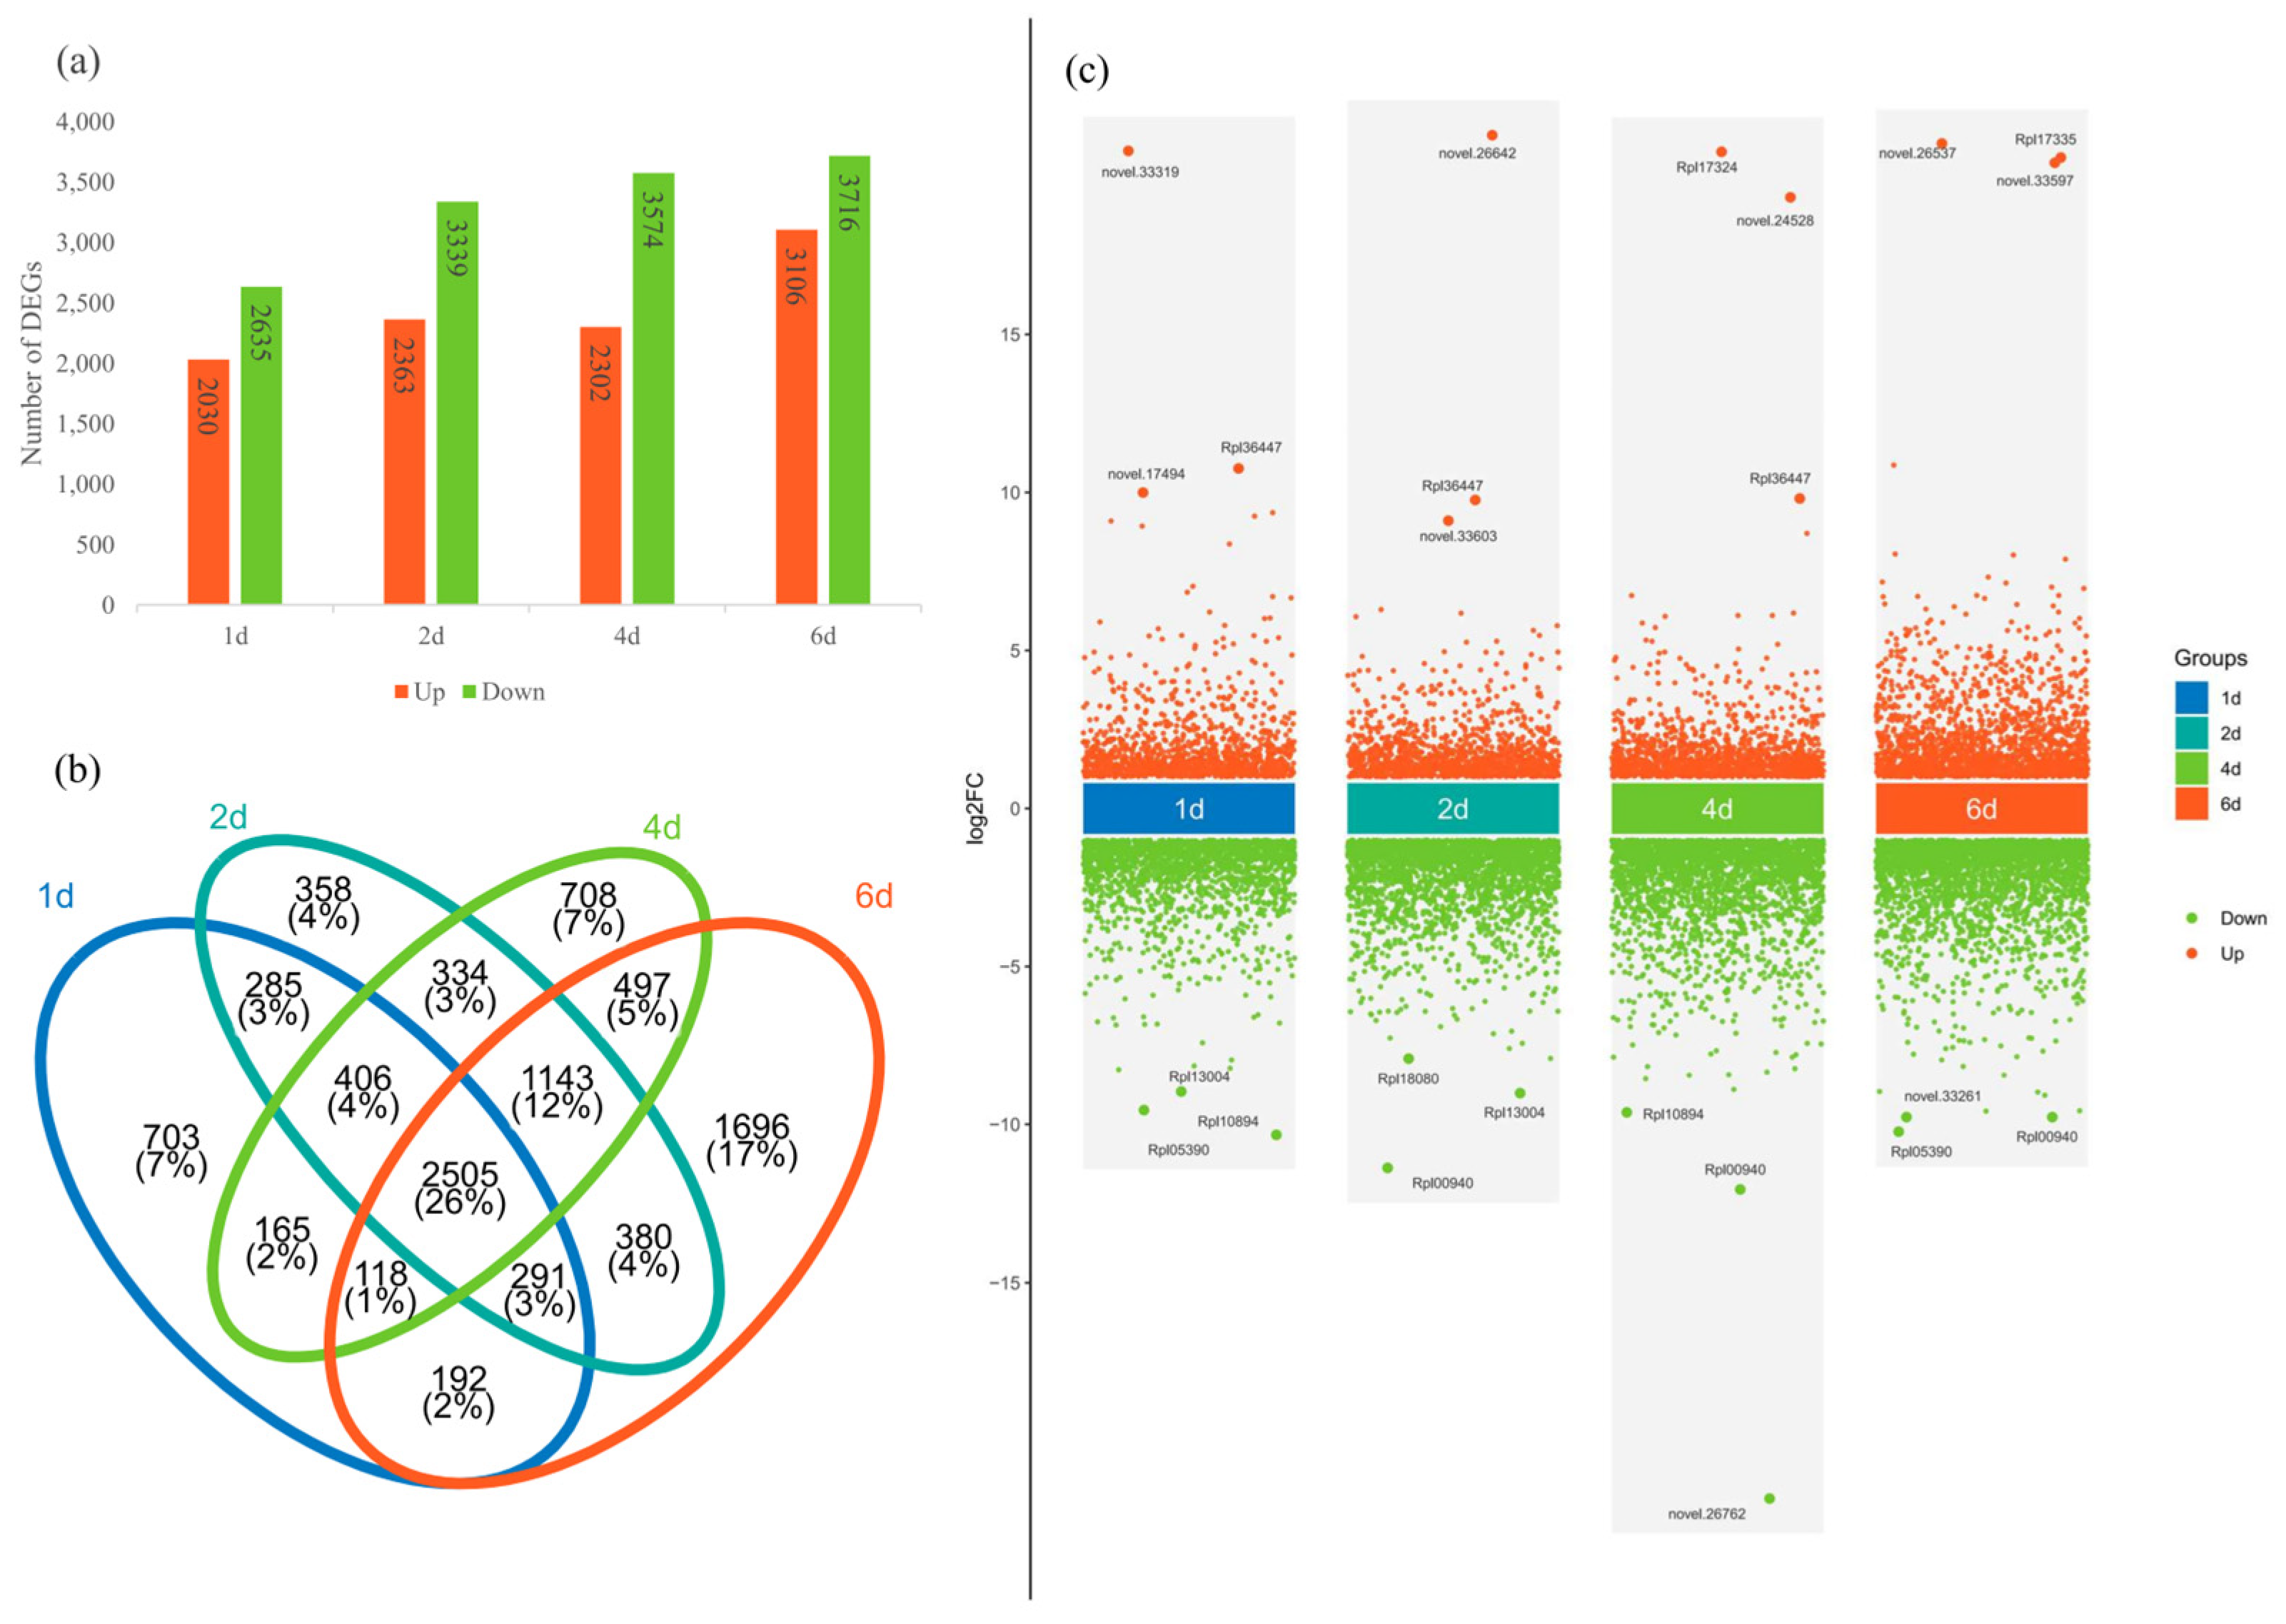
Total RNA was extracted from three biological replicates per treatment and sequenced on the BGI PE150 platform. After the filtering of low-quality reads and adapters, clean reads were mapped to the R. platypodum genome, and the number of FPKM was calculated for each gene. Principal Component Analysis (PCA) was performed to analyze the control group (0d) and treatment groups (1d, 2d, 4d, and 6d) (Figure S7). The results indicated that the samples within each group clustered effectively, and there was a significant difference between the control and treatment groups. The 1d, 2d, and 4d groups showed relatively tight clustering, while the 6d group was more distinct, similar to the physiological response of R. platypodum (Figure S6). In a comparison of multiple treatment groups with the control group, 4655 differentially expressed genes (DEGs) were found in the 1d vs. 0d comparison (2030 upregulated and 2635 downregulated), 5702 DEGs in the 2d vs. 0d comparison (2365 upregulated and 3339 downregulated), 5876 DEGs in the 4d vs. 0d comparison (2302 upregulated and 3574 downregulated), and 6822 DEGs in the 6d vs. 0d comparison (3106 upregulated and 3716 downregulated) (Figure 3a). A total of 2505 DEGs (26%) were common across all comparisons, with the 6d vs. 0d comparison having the largest number of unique DEGs (1696) (Figure 3b). We found that the three most upregulated DEGs at each time point included eight genes annotated as TAR1-A genes (novel.33319, Rpl36447, novel.17494, novel.26642, Rpl36447, novel.33603, Rpl17324, Rpl36447, Rpl17335, novel.26537, novel.33597) (Figure 3c). A functional enrichment analysis of the DEGs in the four treatment groups revealed several common enriched pathways, including environmental response signaling pathways (ligand-gated ion channel activity and signaling receptor activity) and enzyme-related metabolic pathways (protein kinase activity and protein serine kinase activity) (Figure S8).
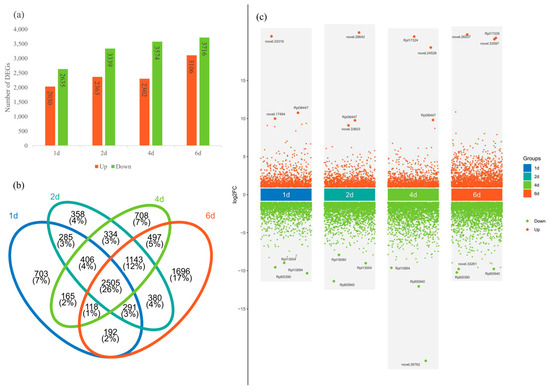
Figure 3.
(a) The number of upregulated or downregulated DEGs in different treatment groups in R. platypodum. (b) The number of shared or unique DEGs across different treatment groups. (c) Volcano plots of DEGs in treatment groups.
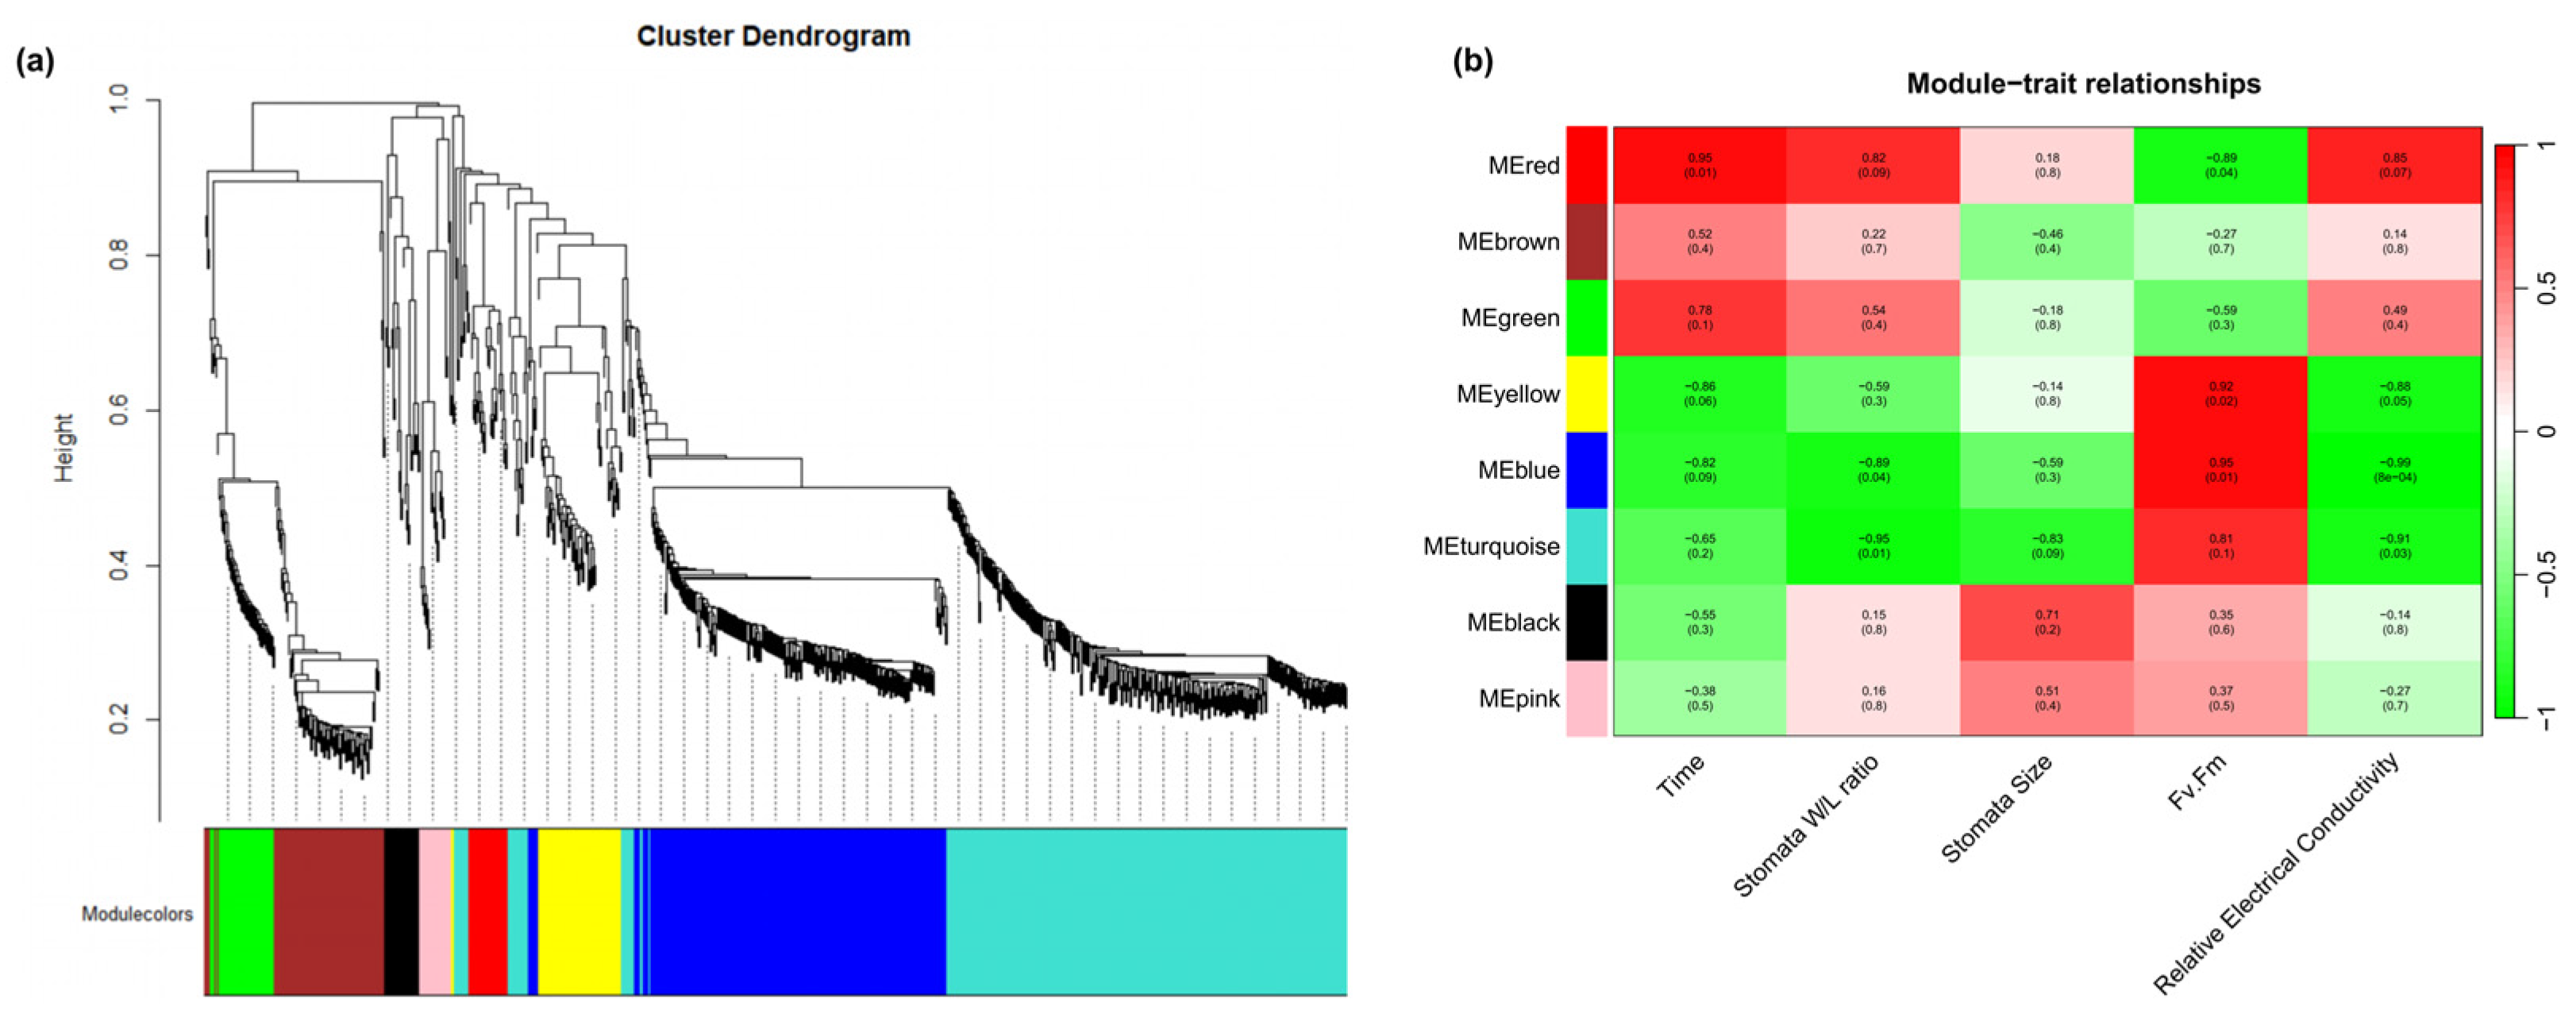
To further investigate the regulatory mechanisms underlying the physiological changes in R. platypodum during heat stress, weighted gene co-expression network analysis (WGCNA) was performed. A total of eight co-expression modules were identified (Figure 4a). The turquoise module exhibited correlation with the stomata W/L ratio, stomata size, and relative conductivity, while the blue module showed correlation with the stress time, stomata W/L ratio, Fv/Fm, and relative conductivity. These two modules might be involved in the physiological changes in R. platypodum under heat stress (Figure 4b). An enrichment analysis of the genes in the blue and turquoise modules revealed that the most significant terms were response to stress, response to stimulus, and response to chemical, further supporting the association of these modules with heat stress (Figure S9).

Figure 4.
Transcriptomic correlation analysis across physiological index and heat stress time in R. platypodum. (a) Dendrogram showing co-expression modules (clusters) identified by weighted correlation network analysis (WGCNA) across physiological index and heat stress time. The major tree branches constitute 8 modules labeled with different colors. (b) The heat map shows the correlation between physiological index and modules. Red color indicates a positive correlation between the cluster and the tissue. Green color indicates a negative correlation.
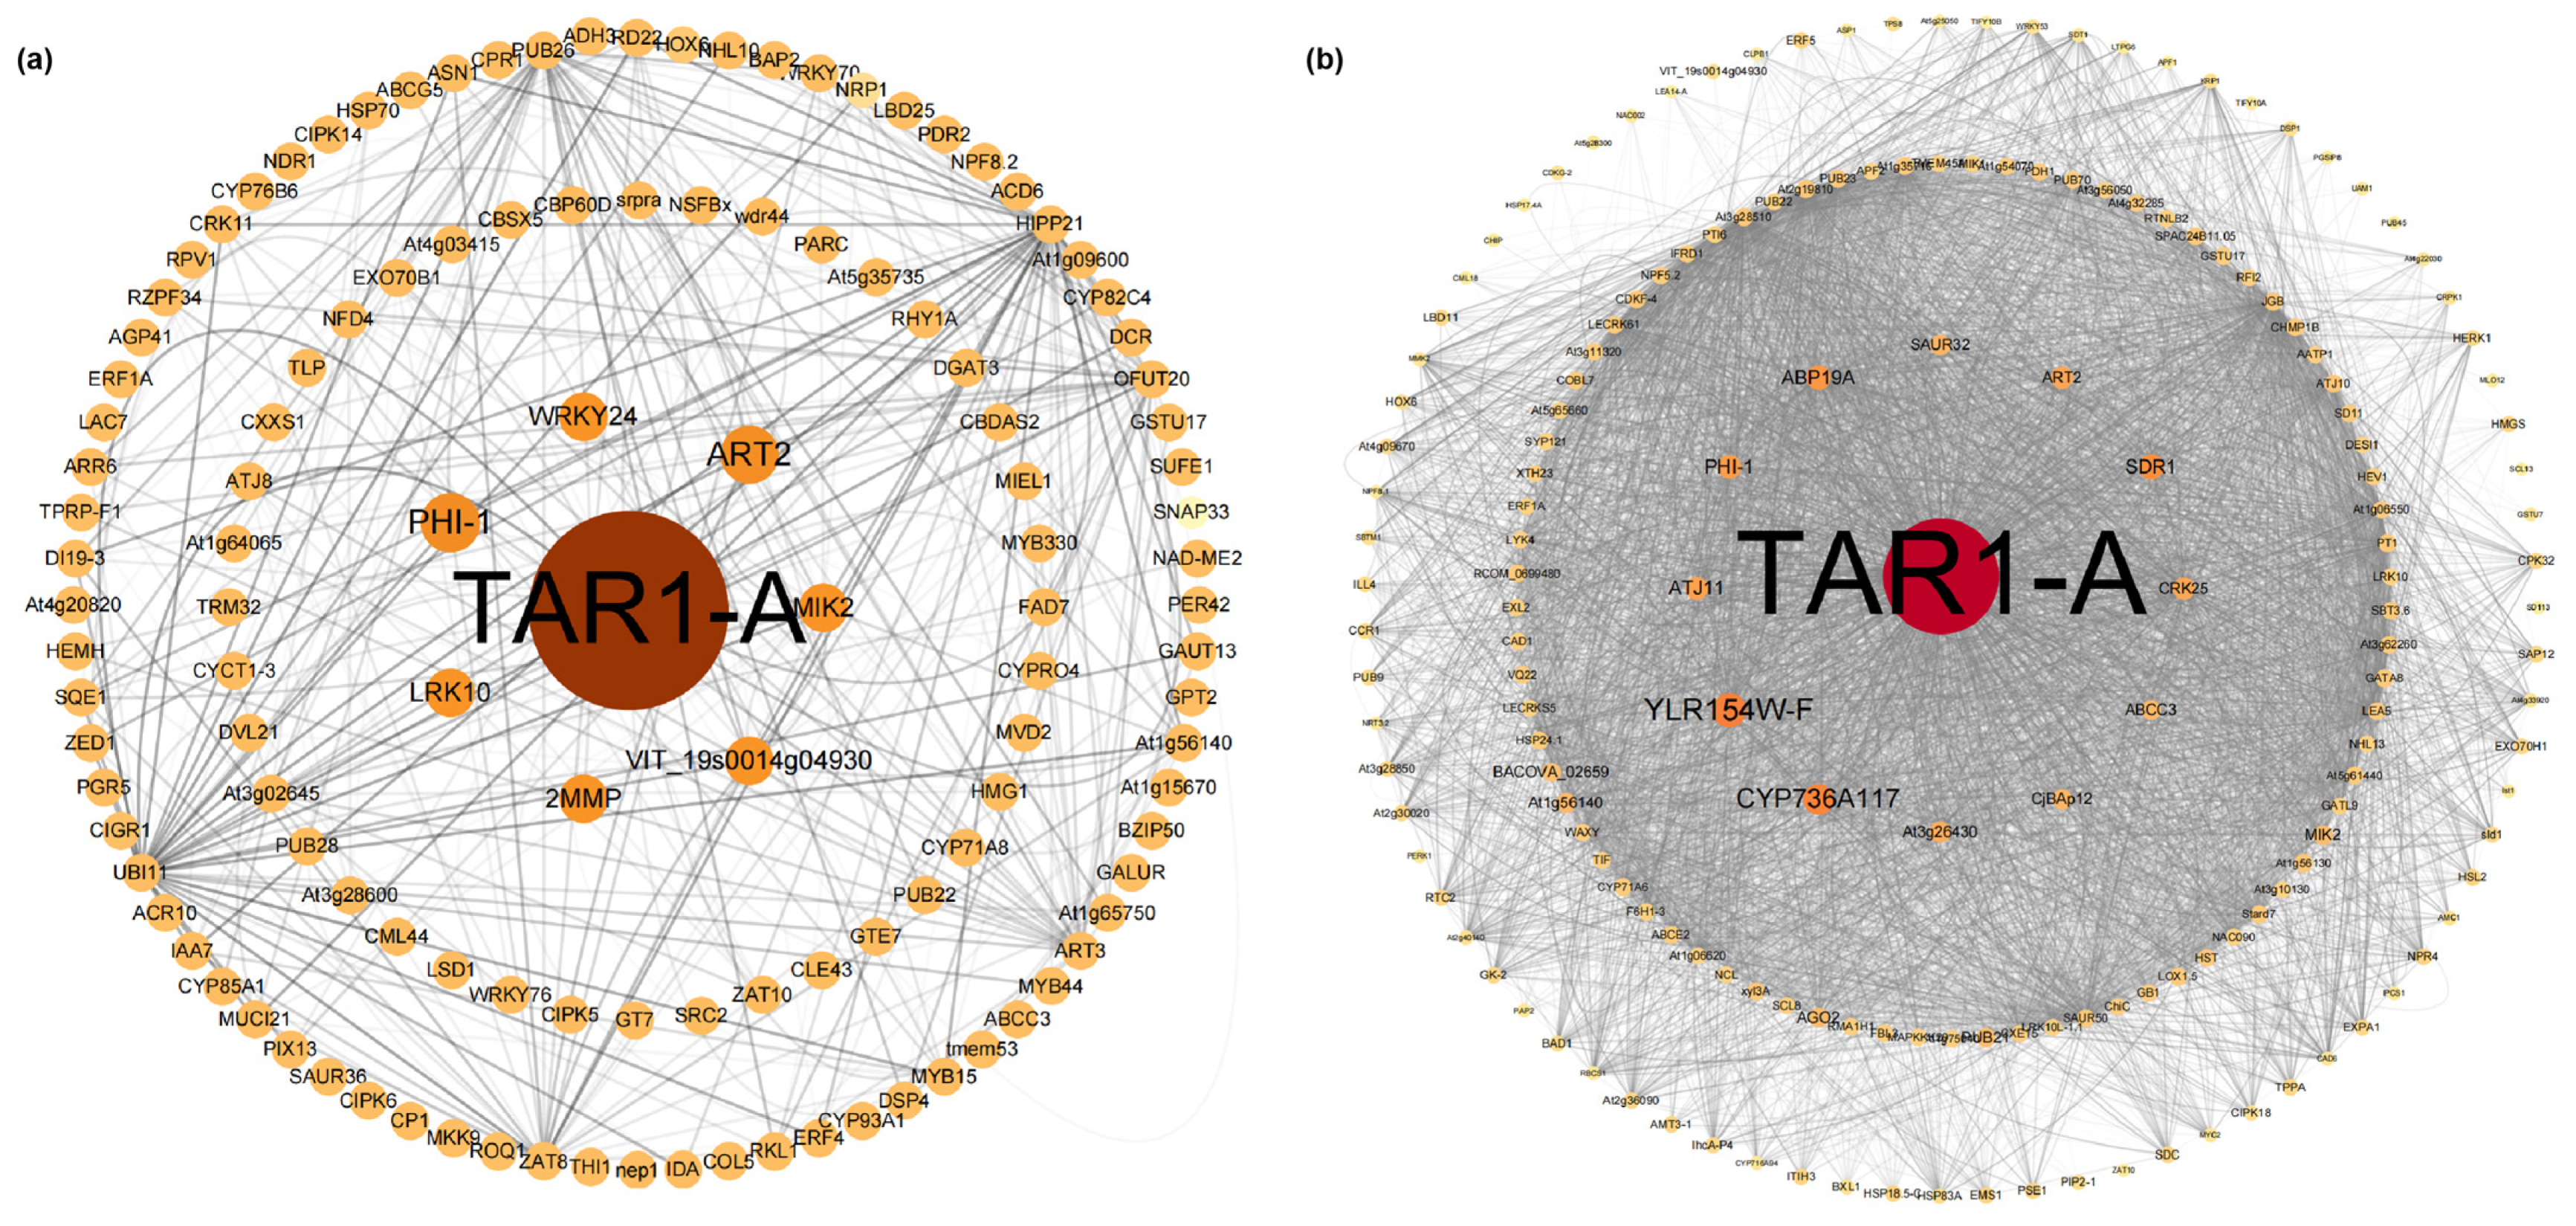
The blue and turquoise modules were selected to construct a visual network in Cytoscape (Figure 5). Similarly to the results from DEG analysis (Figure 3b), TAR1-A also played a dominant role in the co-expression network, with its expression showing a trend of downregulation followed by upregulation (Table S8). In the hub genes of both modules, we identified genes related to ABA biosynthesis and signaling pathways (PHI-1, SDR1, CRK25, LRK10), transcription factors associated with ABA biosynthesis and signaling (WRKY24), and genes involved in biotic and abiotic stress (MIK2, ABCC3, CJBAP12). These genes generally exhibited a downregulation trend (Table S8). Genes related to auxin biosynthesis, such as ABP19A and SAUR32, showed upregulation and downregulation trends, respectively.
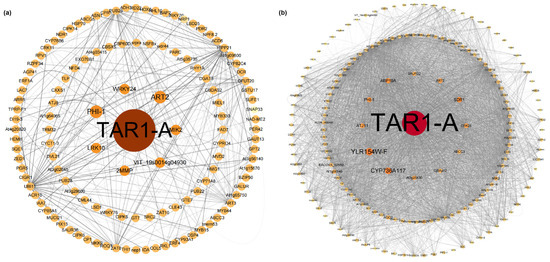
Figure 5.
(a) Blue module co-expression network; (b) turquoise module co-expression network.
2.5. Transcription Factor Expression Analysis
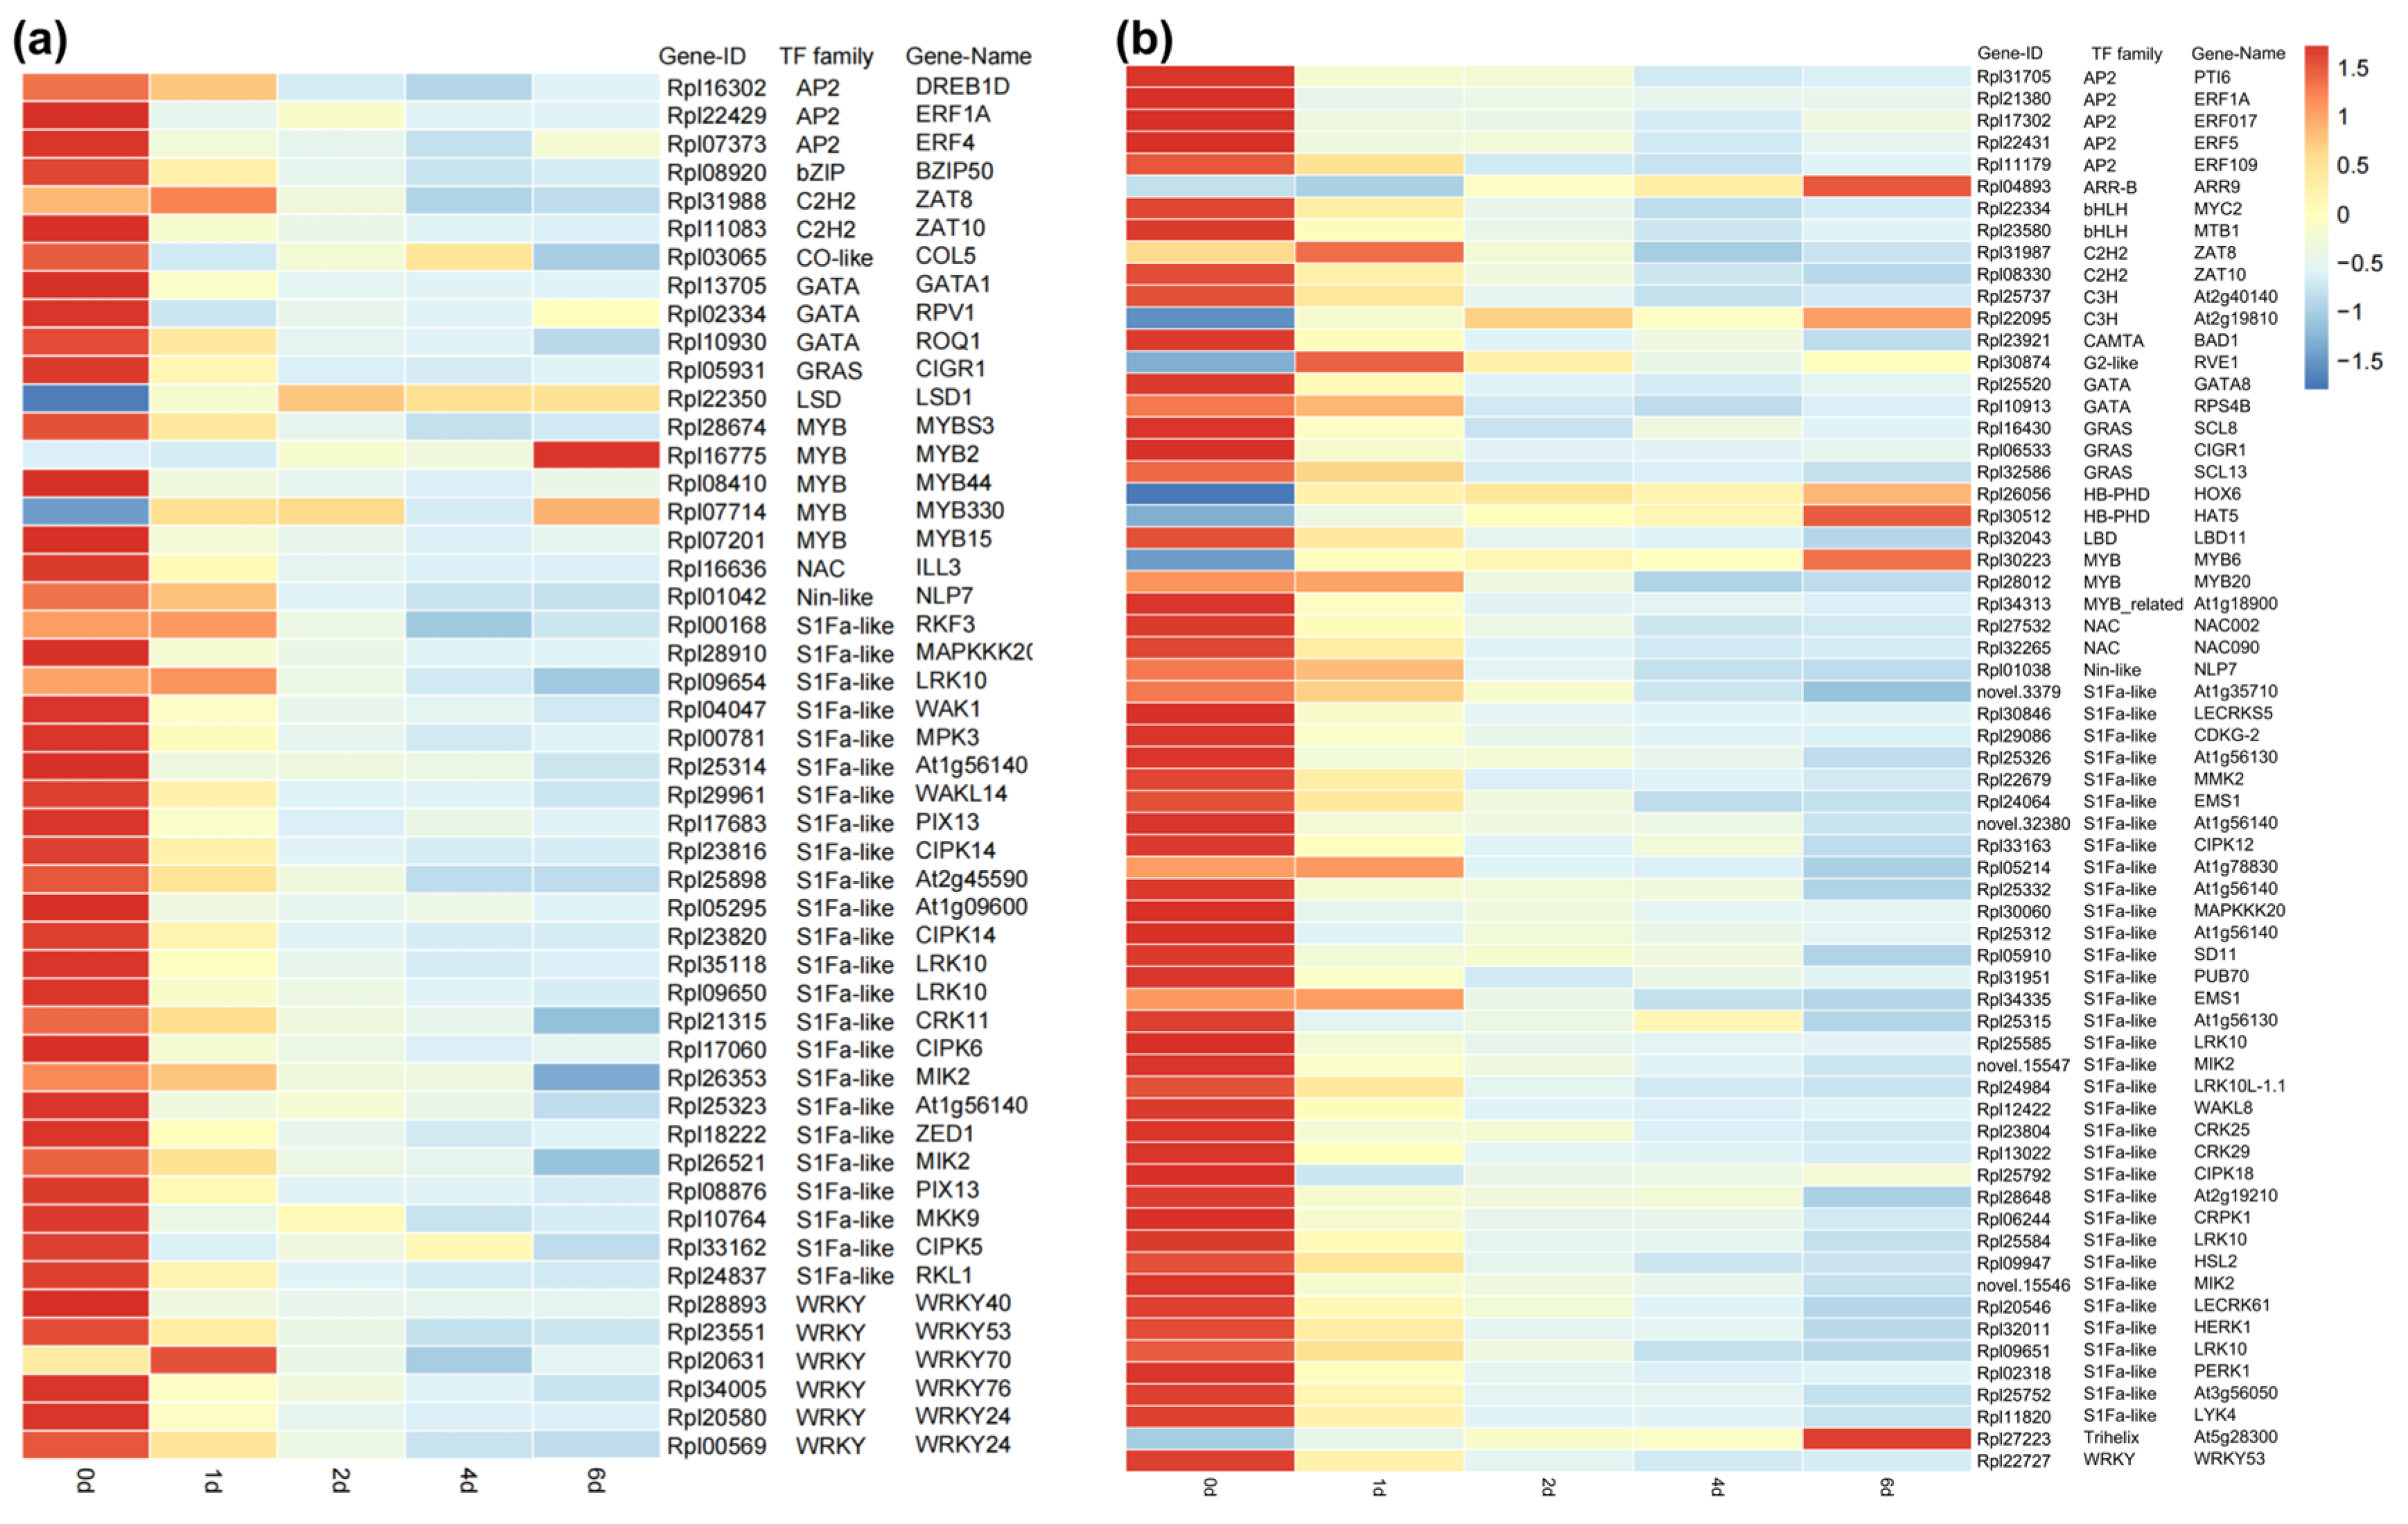
In the blue module, a total of 49 transcription factors (TFs) were identified, while 64 TFs were identified in the turquoise module. These TFs belonged to families such as S1Fa-like, WRKY, MYB, and GATA (Figure 6). Gene expression patterns of differentially expressed TFs were visualized using a heatmap, which revealed that most genes exhibited the highest expression at day 0 and showed a continuous downregulation trend. Genes such as ZAT8, RKF3, LRK10, WRKY70, RVE1, LBD11, MYB20, At1g78830, and EMS1 showed significant upregulation at day 1, but subsequently displayed a decline. Only a few genes, including ARR9, At2g19810, HOX6, HAT5, MYB6, MYB2, At5g28300, and LSD1, demonstrated a sustained upregulation trend.
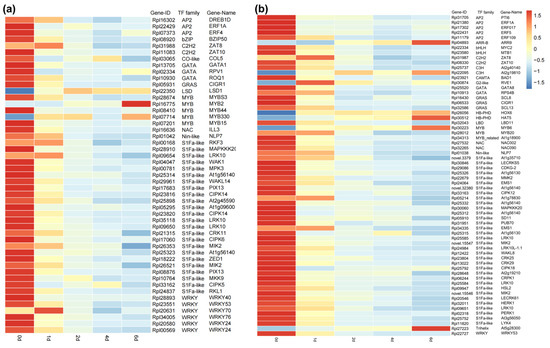
Figure 6.
The expression levels of transcription factors and their corresponding gene families in the two modules. (a) Blue module; (b) turquoise module.
3. Discussion
In this study, we presented a high-quality, chromosome-level whole-genome assembly of R. platypodum. The LAI value and the complete BUSCOs were among the highest reported in recent Rhododendron genome studies (Table 1), providing a genetic foundation for the conservation and future utilization of this rare species. Additionally, a heat stress experiment was conducted on R. platypodum, and candidate genes involved in its heat stress response were identified through weighted gene co-expression network analysis (WGCNA). These findings offer valuable insights into the potential mechanisms of heat tolerance in R. platypodum.
3.1. Unique Genetic Features of R. platypodum
The genomic repeat sequences in R. platypodum were larger than those found in any previously studied Rhododendron genome, comprising 69.63% of its total genome. The average gene length was also longer, measuring 6459.24 bp, primarily due to the high presence of transposable element (TE) sequences, with LTR retrotransposons (LTR-RTs) constituting a significant portion (Table 1). The elevated TE content might be linked to extensive hybridization events in the subgenus Hymenanthes in the southwestern region [26], which could have activated the activity of LTR-RTs [22,27]. These genomic features were similar to those observed in R. henanense, and might be related to their unique adaptability. It is precisely this uniqueness that has led to their limited distribution range and endangered status [1].
In our study, we focused on assembling and analyzing the nuclear genome of R. platypodum. The chloroplast genome of this species has been previously published [9]. However, the mitochondrial genome has not yet been characterized. Plant mitochondrial genomes are known for their considerable variability in size and structure, posing significant challenges for assembly and analysis. Additionally, distinguishing mitochondrial sequences from potential bacterial contaminants can be difficult [28]. Future studies employing advanced sequencing technologies and specialized assembly tools will be necessary to elucidate the mitochondrial genome of R. platypodum, thereby enhancing our understanding of its genetic makeup and evolutionary adaptations.
3.2. Unique Evolutionary Characteristics of R. platypodum
In the subgenus Hymenanthes, R. platypodum exhibited the least gene family expansion and contraction (Figure 1c), which might be attributed to its stable and specific habitat, resulting in a highly conserved and stable genome [29]. Previous studies have also shown that the expansion of specific functions in Rhododendrons is induced by environmental factors [10,22]. The expansion and contraction of gene families in R. platypodum are relatively unique. Compared to other species, R. platypodum showed gene family expansions in categories such as zinc ion binding, transition metal ion binding, and sodium ion transport. This might be linked to its distribution in the karst regions of southwestern China, where soils and rocks typically contain high levels of heavy metals, particularly zinc [30,31]. These gene family expansions could facilitate the adaptation of R. platypodum to heavy metal-rich rocky habitats (Figure 2a) [7]. And significant reductions in gene families related to pollen recognition and pollen–pistil interactions were observed in R. platypodum (Figure 3b). This contraction might be induced by the heavy metal-rich habitat [32] and could contribute to its endangered status [33]. Furthermore, several gene families involved in glycosyltransferase activities were annotated (e.g., xylosyltransferase activity, XYLOGlucan 6-xylosyltransferase activity, UDP-glycosyltransferase activity, transferase activity, transferring glycosyl groups), which could reduce the diversity of small molecules in R. platypodum. These effects might negatively impact processes such as seed germination, growth, flowering, and fruiting [34,35].
3.3. Coordinated Analysis of Physiology and Transcriptome in R. platypodum Under Heat Stress
The leaves of plants could indirectly reflect their ability to cope with heat stress [36]. In our study, as the duration of heat stress increased, the relative conductivity, Fv/Fm, stomata W/L ratio, and stomata size consistently exhibited upregulation or downregulation (Figure S6), indicating a significant response of R. platypodum to heat stress. Similar responses have been reported in other Rhododendrons [16]. R. platypodum did not exhibit significant yellowing or scorching during prolonged heat stress but showed noticeable leaf curling (Figure S5). This might be linked to sustained stomatal expansion (Figure S6a,b), which facilitated cooling through continuous transpiration [37]. The reduction in water content and the resulting accumulation led to leaf curling [38,39].
Subsequently, we employed weighted gene co-expression network analysis (WGCNA) to identify candidate genes associated with heat stress. After annotating the genes in the two identified modules, we found correlations with terms such as response to stress, response to stimulus, and response to chemical, confirming the association of these modules with heat stress (Figure S9). Both differentially expressed genes (DEGs) and WGCNA revealed that the TAR1-A gene played a dominant role (Figure 3c and Figure 4). In Arabidopsis thaliana and Artemisia caruifolia, the TAR1-A gene has been shown to increase cuticular wax thickness and regulate trichome development [40]. In our study, the expression of TAR1-A exhibited a characteristic pattern of first decreasing and then increasing under heat stress (Table S7). It is hypothesized that it might initially reduce the accumulation of leaf cuticle thickness and enhance stomatal conductivity to facilitate heat dissipation [41], reflected in the significant increase in stomatal aperture and area on day 1 (Figure S6a,b). Furthermore, we identified genes related to abscisic acid (ABA) synthesis and signaling pathways in the co-expression network (PHI-1, SDR1, CRK25, LRK10), which showed continuous downregulation during heat stress (Table S7). These genes likely cooperate to maintain stomatal opening [42,43]. As heat stress progressed and the leaves continued to lose water and curl, the expression of TAR1-A was upregulated on day 6, possibly reducing non-stomatal water loss by decreasing the cuticular wax [44,45]. In conclusion, TAR1-A might play a crucial role in the heat tolerance of R. platypodum, but further studies are needed to elucidate its genetic function and underlying mechanism.
3.4. Transcription Factors in R. platypodum Under Heat Stress
To further investigate the role of transcription factors in R. platypodum heat stress responses, we identified the transcription factors of genes from two modules. The major transcription factor families identified include S1Fa-like, WRKY, MYB, and GATA (Figure 6). The S1Fa-like family was the most abundant and exhibited a consistent decline, which aligns with the response of cotton to various abiotic stresses [46]. However, research on this family is still limited and requires further exploration. Among the hub genes in the blue co-expression network, we identified a consistently downregulated transcription factor, WRKY24 (Figure 5a and Figure 6a). Previous studies have shown that the transient silencing of WRKY24 can increase wheat’s sensitivity to drought stress [47], and WRKY24 expression is also downregulated in rice under drought and salt stress [48]. This transcription factor might contribute to the heat sensitivity of R. platypodum. Among the upregulated transcription factors, we identified two MYB family genes (MYB2 and MYB6). Previous reports indicate that the upregulation of MYB6 and MYB2 has been shown to enhance the expression of flavonoid biosynthesis genes in Populus and Dendrobium bigibbum, leading to the significant accumulation of anthocyanins and proanthocyanidins [49,50]. This phenylpropanoid biosynthesis is considered crucial in stress responses [51], and these MYB genes might serve as candidate genes for future studies on heat tolerance in rhododendrons. These findings provide valuable candidate genes for further research on heat tolerance in R. platypodum.
4. Material and Methods
4.1. Plant Samples, Sequencing Process, and Assembly
Fresh, clean R. platypodum leaves were collected from Jinfoshan Mountains, Chongqing (107°11.384413′ E, 29°02.429537′ N). After washing, the leaves were immediately frozen in liquid nitrogen and stored at −80 °C until DNA extraction. High-quality genomic DNA was extracted from the tissue using a modified CTAB method [52].
Approximately 15 μg of genomic DNA was sheared into 15 kb fragments using the Covaris g-TUBE (Covaris LLC, Woburn, MA, USA), and fragment size was assessed using the Femto Pulse system (Agilent Technologies, Santa Clara, CA, USA). Size selection was performed on the SMRT Bell template with the BluePippin system (Sage Science, Beverly, MA, USA), enriching for fragments larger than 15 kb. The quality and quantity of the library were evaluated using the Femto Pulse system (Agilent, Santa Clara, CA, USA) and the Qubit fluorometer (Thermo Fisher Scientific, Waltham, MA, USA). Sequencing was performed on the PacBio Revio platform (Pacific Biosciences of California, Menlo Park, CA, USA), generating 20.44 Gb (31.8×) of highly accurate (>99%) HiFi read data for genome assembly. The draft genome assembly was performed using HiFiasm (v0.16.1, default parameters) [53], and gfatools (https://github.com/lh3/gfatools, accessed on 22 September 2025) was used to convert sequence graphs in GFA to FASTA format. An Illumina library (insert fragment size: 350 bp) was also constructed and sequenced on the BGI platform (BGI Group, Shenzhen, China), generating 96.55 Gb (150.3×) of raw sequence data.
The Hi-C sequencing produced 76.48 Gb of read data (119.1×). Then, high-quality paired-end Hi-C reads were processed with Trimmomatic (v0.40) [54] to remove low-quality bases and adapter contaminants (using parameters LEADING:3, TRAILING:3, SLIDINGWINDOW:4:15, MINLEN:15). The resulting clean reads were then aligned to the pre-assembled contigs using the Juicer pipeline (v3; https://github.com/aidenlab/juicer, accessed on 27 September 2025) [55] to generate a contact frequency map. Next, two rounds of misjoin correction were carried out with 3D-DNA (v180922) [56] using default settings (–r2) to construct an initial scaffold layout. The oriented scaffolds were further processed by generating interaction matrices with Juicer and manually curated using Juicebox Assembly Tools (v1.11.08) [55]. Through the manual curation of the assembly results, we achieved a high-quality, near-chromosome-level assembly comprising 13 chromosome-scale scaffolds (consistent with the expected karyotype of R. platypodum, 2n = 26), totaling 636.89 Mb and accounting for 99.17% of the total assembly length, with a scaffold N50 of 493.61 Mb (Table S8).
4.2. Assembly Quality Assessment
A comprehensive assessment of the R. platypodum genome was conducted. First, the completeness of the genome assembly was evaluated using Benchmarking Universal Single-Copy Orthologs (BUSCO, v3.0.2) [57], which assesses the presence of conserved core plant genes in the R. platypodum genome. The remapping rate and coverage were evaluated using both Illumina and long reads. Illumina short reads were aligned using BWA MEM (v0.7.17) software, while long reads were aligned with Minimap2 (v2.24) [58], utilizing the “-ax map-ont/map-hifi” parameter. To assess complex repetitive sequences, the Long Terminal Repeat (LTR) Assembly Index (LAI) [59] was calculated, and the LAI value for LTR elements was estimated. Additionally, k-mer-based quality assessment was performed using the Merqury pipeline (v1.3) [60] and HiFi reads (k = 19 bp).
4.3. Repeat Annotation
Repetitive sequences, including tandem repeats and transposable elements (TEs), were annotated using Tandem Repeats Finder (TRF, v4.09.1) with the following parameters: 2 7 7 80 10 50 2000 [61]. TEs were annotated using a combination of de novo and homology-based methods. LTR_FINDER (v1.0.7) was used to identify LTR retrotransposons (LTR-RTs) [62], and RepeatModeler (v2.0.1) was used to build a de novo repeat library [63]. RepeatMasker (v4.1.2) was then used to search known TEs in the Repbase library and the de novo library [64,65,66]. RepeatProteinMask (within the RepeatMasker package) was used to search TE proteins at the protein level using the WU-BLASTX engine (v2.0).
4.4. Gene Annotation
Gene structure was predicted using homologous, ab initio, and transcriptome-assisted annotation. Tblastn (v2.11.0+) was used for homologous alignment to related species, and Exonerate (v2.4.0) was used for precise alignment [67,68]. Augustus (v3.4.0) and GlimmerHMM (v3.0.4) were used for de novo gene annotation [69,70,71]. All transcriptome data after heat stress within this study were used as RNA-seq data, and both genome-guided and de novo transcriptome assemblies were performed using HiSat2 (v2.2.1) for alignment and Stringtie (v2.1.7) and Trinity (v2.8.5) for transcript assembly [72,73,74]. The integrated transcriptome was built using the PASA (v2.4.1) pipeline with RNA-seq data. Finally, the gene set was refined and integrated using Maker (v3.01.03) and PASA for UTR and alternative splicing isoform annotation [75,76].
4.5. Functional Annotation, Non-Coding RNA Annotation, and Gene Family Identification
Gene functions were inferred by aligning sequences to databases such as National Center for Biotechnology Information Non-Redundant (NCBI NR), Kyoto Encyclopedia of Genes and Genomes (KEGG), Gene Ontology (GO), TrEMBL, and Swiss-Prot using Diamond BLASTP (v2.0.7) (E-value threshold 1 × 10⁻⁵) [77]. Protein domains were annotated using InterProScan (v5.50-84.0) based on the InterPro database [78,79].
Non-coding RNAs were annotated using several tools: tRNAscan-SE (v2.0.9) for tRNA [80], RNAmmer (v1.2) for Rrna [81], and Infernal (v1.1.2) against the Rfam (v14.6) database for miRNA and snRNA identification [82,83].
To identify protein-coding gene families, we used OrthoFinder (v2.5.4) [84] to cluster proteins from R. platypodum and 16 other species (Table S1) using the “-M msa-S diamond” parameters.
4.6. Phylogenetic Analysis
Single-copy orthologs were selected to construct a phylogenetic tree. Protein sequences were aligned with MUSCLE (v3.8.31) [85], and the corresponding coding sequences were aligned and concatenated based on protein alignments. The phylogenetic tree was built using the maximum likelihood method in RAxML (v8.2.12) [86]. Divergence times were obtained from TimeTree (http://www.timetree.org/, accessed on 29 September 2025) [87], and time corrections were applied using R8S (v1.81) [88]. Divergence times were further estimated with MCMCTree in PAML (v4.10.7) [89].
4.7. Gene Family Expansion and Contraction Analysis
Gene family expansion and contraction were analyzed using CAFÉ [90], based on the identified gene families and the phylogenetic tree with estimated divergence times. A random birth–death model was applied to calculate conditional p-values for each gene family. Families with a p-value < 0.05 were considered to have significant gene gain or loss rates. The expanded and contracted gene families were subjected to GO and KEGG enrichment analysis, using a hypergeometric test with FDR-adjusted p-values (Q-value) < 0.05.
4.8. RNA Sequencing, Gene Expression Analysis, and Physiological Measurements
Three-year-old R. platypodum plants, propagated from a uniform batch, were selected as experimental materials. After transplantation into a controlled environment chamber, the plants were subjected to heat stress at 36 °C/28 °C (day/night) for 0 (CK), 1, 2, 4, and 6 days. Leaf samples were collected for RNA sequencing and physiological measurements. Three biological replicates were used for each treatment. RNA was extracted and subjected to BGI PE 150 sequencing. Following sequencing, SOAPnuke (v2.1.0) was used to remove low-quality reads, N bases, and adapters to obtain clean reads [91]. HISAT2 was used for read mapping with default settings [92], and StringTie was used for transcript assembly [93]. Functional annotation was performed using multiple databases, including Nr (NCBI non-redundant protein sequences), Nt (NCBI non-redundant nucleotide sequences), Pfam (Protein family), KOG/COG (Clusters of Orthologous Groups of proteins), Swiss-Prot (manually annotated and reviewed protein sequence database), KO (KEGG Ortholog database), and GO (Gene Ontology). StringTie was also used for quantifying gene expression, using fragments per kilobase of exon per million fragments mapped (FPKM). Differentially expressed genes (DEGs) were identified using DESeq2 (v3.11) with a false discovery rate (FDR) < 0.01 and fold change (FC) ≥ 2 [94]. In addition, chlorophyll fluorescence (Fv/Fm) and relative conductivity were measured. For each biological replicate, three random fields were selected to measure the stomata width-to-length ratio (stomata W/L ratio) and stomata size. Data were analyzed using one-way analysis of variance (ANOVA) in R (v4.3.2) [95].
4.9. Weighted Correlation Network Analysis and Gene Network Visualization
Differentially expressed genes (DEGs) with a coefficient of variation (CV) > 0.5 were used to generate co-expression network modules through weighted gene co-expression network analysis (WGCNA) in R [20]. The co-expression modules were identified using the automatic network construction function (blockwiseModules) with default parameters, except for a soft threshold power of 18, TOMtype set to “signed”, mergeCutHeight set to 0.25, and minModuleSize set to 100 [96]. Initial clusters were merged based on eigengenes. The eigengene value for each module was calculated and used to explore associations with the heat stress time, stomatal W/L ratio, stomatal size, Fv/Fm, and relative conductivity. The networks were visualized using Cytoscape (v.3.7.2, USA) [97].
5. Conclusions
In summary, we present a high-quality chromosome-level reference genome for the endangered R. platypodum, offering new insights into its rocky habitat-related characteristics and the factors contributing to its endangered status. This valuable resource enhances our understanding of rhododendron evolution and supports the conservation of wild species. Additionally, we conducted heat stress experiments on R. platypodum, measuring both transcriptomic and physiological responses. Through WGCNA, we identified candidate genes potentially associated with heat stress. These genes hold promise for future applications in the introduction and acclimatization of alpine rhododendrons to lowland environments.
Supplementary Materials
The following supporting information can be downloaded at https://www.mdpi.com/article/10.3390/plants14081233/s1, Figure S1: K-mer frequency distribution.; Figure S2: Rhododendron platypodum genome-wide all-by-all Hi-C interaction heatmap; Figure S3: Characteristics of the predicted genes in the genomes of Rhododendron platypodum compared with Rhododendron molle, Rhododendron simsii, and Rhododendron williamsianum; Figure S4: Bar plot of gene family enrichment analysis for expansion (a) and contraction (b) in R. platypodum, classified by biological process; Figure S5: Appearance of R. platypodum at different time points after high-temperature stress; Figure S6: Physiological responses of R. platypodum after heat stress; Figure S7: PCA of the control group (0d) and experimental groups (1d, 2d, 4d, 6d); Figure S8: GO enrichment analysis of DEGs in 4 treatment groups. (a) 1d vs. 0d, (b) 2d vs. 0d, (c) 4d vs. 0d, (d) 6d vs. 0d; Figure S9: GO enrichment analysis of the blue (a) and turquoise (b) modules; Table S1: Overview of BUSCO assessment; Table S2: Assembly statistics and validation with Hi-C; Table S3: Overview of functional gene annotation statistics; Table S4: Overview of gene annotation; Table S5: Statistics of non-coding RNAs within the Rhododendron platypodum genome; Table S6: Comparative genomics of species selection and classification; Table S7: Comparisons of genes and gene families among 16 plant species; Table S8: Expression levels of key genes in two modules based on heat stress duration.
Author Contributions
Conceptualization, Z.W. and H.W.; methodology, Z.W., K.Q. and H.W.; software, Z.W.; investigation, Z.W., K.Q. and W.C.; data curation, W.C. and Y.Z.; writing—original draft preparation, Z.W.; writing—review and editing, Z.W., G.M. and H.W.; supervision, H.Z. and H.W.; funding acquisition, H.Z. and H.W. All authors have read and agreed to the published version of the manuscript.
Funding
This research was funded by Chongqing science and technology forest research projects, grant number 2023-2, and Technological innovation and application development of Chongqing, grant number CSTB2023TIAD-KPX0039.
Data Availability Statement
The genome assembly, gene annotations, and raw sequencing data of this study have been deposited in the China National Center for Bioinformation (https://ngdc.cncb.ac.cn) with the BioProject number PRJCA038553.
Conflicts of Interest
The authors declare no conflicts of interest.
References
- Zhou, X.-J.; Li, J.-T.; Wang, H.-L.; Han, J.-W.; Zhang, K.; Dong, S.-W.; Zhang, Y.-Z.; Ya, H.-Y.; Cheng, Y.-W.; Sun, S.-S. The Chromosome-Scale Genome Assembly, Annotation and Evolution of Rhododendron henanense Subsp. Lingbaoense. Mol. Ecol. Resour. 2022, 22, 988–1001. [Google Scholar] [CrossRef] [PubMed]
- Väinölä, A. Polyploidization and Early Screening of Rhododendron Hybrids. Euphytica 2000, 112, 239–244. [Google Scholar] [CrossRef]
- Shen, S.-K.; Wu, F.-Q.; Yang, G.-S.; Wang, Y.-H.; Sun, W.-B. Seed Germination and Seedling Emergence in the Extremely Endangered Species Rhododendron protistum Var. Giganteum-the World’s Largest Rhododendron. Flora 2015, 216, 65–70. [Google Scholar] [CrossRef]
- Ma, H.; Liu, Y.; Liu, D.; Sun, W.; Liu, X.; Wan, Y.; Zhang, X.; Zhang, R.; Yun, Q.; Wang, J.; et al. Chromosome-Level Genome Assembly and Population Genetic Analysis of a Critically Endangered Rhododendron Provide Insights into Its Conservation. Plant J. 2021, 107, 1533–1545. [Google Scholar] [CrossRef]
- Choudhary, S.; Thakur, S.; Majeed, A.; Bhardwaj, P. Adaptability of Rhododendrons in High Altitude Habitats. J. For. Res. 2021, 32, 449–460. [Google Scholar] [CrossRef]
- Ma, Y.; Nielsen, J.; Chamberlain, D.F.; Li, X.; Sun, W. The Conservation of Rhododendrons Is of Greater Urgency than Has Been Previously Acknowledged in China. Biodivers. Conserv. 2014, 23, 3149–3154. [Google Scholar] [CrossRef]
- Ma, L.; Li, L.; Fang, W.; Dong, Z.; Liu, Y.; Wang, C.; Xie, Y.; Li, M.; Arif, M.; Wang, H. Genetic Variability and Population Divergence of Rhododendron platypodum Diels in China in the Context of Conservation. Front. For. Glob. Change 2024, 7, 1320995. [Google Scholar] [CrossRef]
- Gibbs, D.; Chamberlain, D.; Argent, G. The Red List of Rhododendrons; Botanic Garderns Conservation International: Richmond, UK, 2011; ISBN 1-905164-35-1. [Google Scholar]
- Ma, L.-H.; Zhu, H.-X.; Wang, C.-Y.; Li, M.-Y.; Wang, H.-Y. The Complete Chloroplast Genome of Rhododendron platypodum (Ericaceae): An Endemic and Endangered Species from China. Mitochondrial DNA Part B Resour. 2021, 6, 196–197. [Google Scholar] [CrossRef]
- Wang, X.; Gao, Y.; Wu, X.; Wen, X.; Li, D.; Zhou, H.; Li, Z.; Liu, B.; Wei, J.; Chen, F.; et al. High-Quality Evergreen Azalea Genome Reveals Tandem Duplication-Facilitated Low-Altitude Adaptability and Floral Scent Evolution. Plant Biotechnol. J. 2021, 19, 2544–2560. [Google Scholar] [CrossRef]
- Yang, F.-S.; Nie, S.; Liu, H.; Shi, T.-L.; Tian, X.-C.; Zhou, S.-S.; Bao, Y.-T.; Jia, K.-H.; Guo, J.-F.; Zhao, W.; et al. Chromosome-Level Genome Assembly of a Parent Species of Widely Cultivated Azaleas. Nat. Commun. 2020, 11, 5269. [Google Scholar] [CrossRef]
- Nie, S.; Zhao, S.-W.; Shi, T.-L.; Zhao, W.; Zhang, R.-G.; Tian, X.-C.; Guo, J.-F.; Yan, X.-M.; Bao, Y.-T.; Li, Z.-C.; et al. Gapless Genome Assembly of Azalea and Multi-Omics Investigation into Divergence between Two Species with Distinct Flower Color. Hortic. Res. 2023, 10, uhac241. [Google Scholar] [CrossRef] [PubMed]
- Zhang, L.; Xu, P.; Cai, Y.; Ma, L.; Li, S.; Li, S.; Xie, W.; Song, J.; Peng, L.; Yan, H.; et al. The Draft Genome Assembly of Rhododendron delavayi Franch. Var. Delavayi. GigaScience 2017, 6, gix076. [Google Scholar] [CrossRef] [PubMed]
- Xu, S.; Geng, X.; Mao, L.; Yi, Y.; Gong, J.; Xu, X. Transcriptome Analysis and Identification of the Genes Associated with the Heat Stress Response in Four Rhododendron Species. Sci. Hortic. 2022, 303, 111176. [Google Scholar] [CrossRef]
- Zhao, Y.; Yu, W.; Hu, X.; Shi, Y.; Liu, Y.; Zhong, Y.; Wang, P.; Deng, S.; Niu, J.; Yu, X. Physiological and Transcriptomic Analysis Revealed the Involvement of Crucial Factors in Heat Stress Response of Rhododendron hainanense. Gene 2018, 660, 109–119. [Google Scholar] [CrossRef]
- Oba, E.G.; Hu, J.; Zhang, Z.; Li, S.; Peng, L.; Wang, J.; Xie, W. Physiological Response of Three Micropropagated Plantlets of Rhododendron Hybrids for Heat Stress. Eur. J. Hortic. Sci. 2021, 86, 300–307. [Google Scholar] [CrossRef]
- Ma, W.; Liang, W.; Zhao, B. Effect of Relative Air Humidity and High Temperature on the Physiological and Anatomical Responses of Two Rhododendron Cultivars. Hortscience 2019, 54, 1115–1123. [Google Scholar] [CrossRef]
- Cheng, H.; Wan, Z.; Xu, Y.; Shen, J.; Li, X.; Jin, S. Transcriptome and Photosynthetic Analyses Provide New Insight into the Molecular Mechanisms Underlying Heat Stress Tolerance in Rhododendron × Pulchrum Sweet. Tree Physiol. 2024, 44, tpad133. [Google Scholar] [CrossRef]
- Wu, L.; Liu, Y.; Liu, X.; Li, Q.; Yi, X.; Chen, C.; Wang, L.; Liao, J. Transcriptome Analysis Reveals Key Genes in Response to High-Temperature Stress in Rhododendron Molle. BioResources 2024, 19, 8238–8256. [Google Scholar] [CrossRef]
- Langfelder, P.; Horvath, S. WGCNA: An R Package for Weighted Correlation Network Analysis. BMC Bioinform. 2008, 9, 559. [Google Scholar] [CrossRef]
- Wu, J.; Zhang, F.; Liu, G.; Abudureheman, R.; Bai, S.; Wu, X.; Zhang, C.; Ma, Y.; Wang, X.; Zha, Q.; et al. Transcriptome and Coexpression Network Analysis Reveals Properties and Candidate Genes Associated with Grape (Vitis vinifera L.) Heat Tolerance. Front. Plant Sci. 2023, 14, 1270933. [Google Scholar] [CrossRef]
- Wen, S.; Cai, X.; Yang, K.; Hong, Y.; Fan, F.; Wang, Q.; Zhang, B.; Hou, Q.; Leng, Y.; Qiao, G.; et al. Chromosome-Level Genome Assembly of a Rare Karst-Growing Rhododendron Species Provides Insights into Its Evolution and Environmental Adaptation. J. Syst. Evol. 2024, 63, 245–267. [Google Scholar] [CrossRef]
- Wu, X.; Zhang, L.; Wang, X.; Zhang, R.; Jin, G.; Hu, Y.; Yang, H.; Wu, Z.; Ma, Y.; Zhang, C.; et al. Evolutionary History of Two Evergreen Rhododendron Species as Revealed by Chromosome-Level Genome Assembly. Front. Plant Sci. 2023, 14, 1123707. [Google Scholar] [CrossRef] [PubMed]
- Chang, Y.; Zhang, R.; Ma, Y.; Sun, W. A Haplotype-Resolved Genome Assembly of Rhododendron vialii Based on PacBio HiFi Reads and Hi-C Data. Sci. Data 2023, 10, 451. [Google Scholar] [CrossRef] [PubMed]
- Soza, V.L.; Lindsley, D.; Waalkes, A.; Ramage, E.; Patwardhan, R.P.; Burton, J.N.; Adey, A.; Kumar, A.; Qiu, R.; Shendure, J.; et al. The Rhododendron Genome and Chromosomal Organization Provide Insight into SharedWhole-Genome Duplications across the Heath Family (Ericaceae). Genome Biol. Evol. 2019, 11, 3353–3371. [Google Scholar] [CrossRef]
- Mao, X.; Wang, J.; Zhang, L.; Jiang, Y.; Geng, Y.; Ma, T.; Cai, L.; Huang, S.; Hollingsworth, P.; Mao, K.; et al. Pervasive Hybridization during Evolutionary Radiation of Rhododendron Subgenus Hymenanthes in Mountains of Southwest China. Natl. Sci. Rev. 2022, 9, nwac276. [Google Scholar] [CrossRef]
- Gantuz, M.; Morales, A.; Bertoldi, M.V.; Ibañez, V.N.; Duarte, P.F.; Marfil, C.F.; Masuelli, R.W. Hybridization and Polyploidization Effects on LTR-Retrotransposon Activation in Potato Genome. J. Plant. Res. 2022, 135, 81–92. [Google Scholar] [CrossRef]
- Storchova, H.; Kruger, M. Methods for Assembling Complex Mitochondrial Genomes in Land Plants. J. Exp. Bot. 2024, 75, 5169–5174. [Google Scholar] [CrossRef]
- Zhang, J.; Dong, K.-L.; Ren, M.-Z.; Wang, Z.-W.; Li, J.-H.; Sun, W.-J.; Zhao, X.; Fu, X.-X.; Ye, J.-F.; Liu, B.; et al. Coping with Alpine Habitats: Genomic Insights into the Adaptation Strategies of Triplostegia Glandulifera (Caprifoliaceae). Hortic. Res. Engl. 2024, 11, uhae077. [Google Scholar] [CrossRef]
- Li, W.; Zhu, T.; Yang, H.; Zhang, C.; Zou, X. Distribution Characteristics and Risk Assessment of Heavy Metals in Soils of the Typical Karst and Non-Karst Areas. Land 2022, 11, 1346. [Google Scholar] [CrossRef]
- Ji, W.; Yang, Z.; Yu, T.; Yang, Q.; Wen, Y.; Wu, T. Potential Ecological Risk Assessment of Heavy Metals in the Fe-Mn Nodules in the Karst Area of Guangxi, Southwest China. Bull. Environ. Contam. Toxicol. 2021, 106, 51–56. [Google Scholar] [CrossRef]
- Aloisi, I.; Piccini, C.; Cai, G.; Del Duca, S. Male Fertility under Environmental Stress: Do Polyamines Act as Pollen Tube Growth Protectants? Int. J. Mol. Sci. 2022, 23, 1874. [Google Scholar] [CrossRef] [PubMed]
- Ramasubbu, R.; Sreekala, A.K.; Pandurangan, A.G.; Kulloli, S.K. Reproductive Ecology of Impatiens Platyadena Fischer, a Critically Endangered Balsam of Western Ghats. Curr. Sci. 2011, 100, 1550–1554. [Google Scholar]
- Wu, B.; Liu, X.; Xu, K.; Zhang, B. Genome-Wide Characterization, Evolution and Expression Profiling of UDP-Glycosyltransferase Family in Pomelo (Citrus grandis) Fruit. BMC Plant Biol. 2020, 20, 459. [Google Scholar] [CrossRef]
- Li, Y.; Liu, F.; Li, P.; Wang, T.; Zheng, C.; Hou, B. An Arabidopsis Cytokinin-Modifying Glycosyltransferase UGT76C2 Improves Drought and Salt Tolerance in Rice. Front. Plant Sci. 2020, 11, 560696. [Google Scholar] [CrossRef]
- Zoong Lwe, Z.; Sah, S.; Persaud, L.; Li, J.; Gao, W.; Raja Reddy, K.; Narayanan, S. Alterations in the Leaf Lipidome of Brassica Carinata under High-Temperature Stress. BMC Plant Biol. 2021, 21, 404. [Google Scholar] [CrossRef]
- Moore, C.E.; Meacham-Hensold, K.; Lemonnier, P.; Slattery, R.A.; Benjamin, C.; Bernacchi, C.J.; Lawson, T.; Cavanagh, A.P. The Effect of Increasing Temperature on Crop Photosynthesis: From Enzymes to Ecosystems. J. Exp. Bot. 2021, 72, 2822–2844. [Google Scholar] [CrossRef]
- Hasanuzzaman, M.; Nahar, K.; Alam, M.M.; Roychowdhury, R.; Fujita, M. Physiological, Biochemical, and Molecular Mechanisms of Heat Stress Tolerance in Plants. Int. J. Mol. Sci. 2013, 14, 9643–9684. [Google Scholar] [CrossRef]
- Sadok, W.; Lopez, J.R.; Smith, K.P. Transpiration Increases under High-Temperature Stress: Potential Mechanisms, Trade-Offs and Prospects for Crop Resilience in a Warming World. Plant Cell Environ. 2021, 44, 2102–2116. [Google Scholar] [CrossRef]
- Tan, H.; Xiao, L.; Gao, S.; Li, Q.; Chen, J.; Xiao, Y.; Ji, Q.; Chen, R.; Chen, W.; Zhang, L. TRICHOME AND ARTEMISININ REGULATOR 1 Is Required for Trichome Development and Artemisinin Biosynthesis in Artemisia annua. Mol. Plant. 2015, 8, 1396–1411. [Google Scholar] [CrossRef]
- Huggins, T.D.; Mohammed, S.; Sengodon, P.; Ibrahim, A.M.H.; Tilley, M.; Hays, D.B. Changes in Leaf Epicuticular Wax Load and Its Effect on Leaf Temperature and Physiological Traits in Wheat Cultivars (Triticum aestivum L.) Exposed to High Temperatures during Anthesis. J. Agron. Crop Sci. 2018, 204, 49–61. [Google Scholar] [CrossRef]
- Jensen, N.B.; Ottosen, C.-O.; Zhou, R. Exogenous Melatonin Alters Stomatal Regulation in Tomato Seedlings Subjected to Combined Heat and Drought Stress through Mechanisms Distinct from ABA Signaling. Plants 2023, 12, 1156. [Google Scholar] [CrossRef] [PubMed]
- Acharya, B.R.; Assmann, S.M. Hormone Interactions in Stomatal Function. Plant Mol.Biol. 2009, 69, 451–462. [Google Scholar] [CrossRef] [PubMed]
- Fang, Y.; Xiong, L. General Mechanisms of Drought Response and Their Application in Drought Resistance Improvement in Plants. Cell. Mol. Life Sci. 2015, 72, 673–689. [Google Scholar] [CrossRef] [PubMed]
- Tomasi, P.; Luo, Z.; Abdel-Haleem, H. Drought and High Heat Stresses Modify Brassica napus L. Leaf Cuticular Wax. Plant Stress 2024, 13, 100513. [Google Scholar] [CrossRef]
- Tahmasebi, A.; Ashrafi-Dehkordi, E.; Shahriari, A.G.; Mazloomi, S.M.; Ebrahimie, E. Integrative Meta-Analysis of Transcriptomic Responses to Abiotic Stress in Cotton. Prog. Biophys. Mol. Biol. 2019, 146, 112–122. [Google Scholar] [CrossRef]
- Li, G.-Z.; Liu, J.; Wang, Y.-Y.; Han, A.-Q.; Liu, H.-T.; Guo, T.-C.; Han, Q.-X.; Kang, G.-Z. TaWRKY24-1D, Interacts with TaERFL1a, Regulates DHAR-Mediated ASA-GSH Biosynthesis to Enhance Drought Tolerance in Wheat. Plant Growth Regul. 2024, 104, 713–725. [Google Scholar] [CrossRef]
- Li, J.; Chen, Y.; Zhang, R.; Wu, B.; Xiao, G. Expression Identification of Three OsWRKY Genes in Response to Abiotic Stress and Hormone Treatments in Rice. Plant Signal. Behav. 2023, 18, 2292844. [Google Scholar] [CrossRef]
- Wang, L.; Lu, W.; Ran, L.; Dou, L.; Yao, S.; Hu, J.; Fan, D.; Li, C.; Luo, K. R2R3-MYB Transcription Factor MYB6 Promotes Anthocyanin and Proanthocyanidin Biosynthesis but Inhibits Secondary Cell Wall Formation in Populus Tomentosa. Plant J. 2019, 99, 733–751. [Google Scholar] [CrossRef]
- Lim, G.-H.; Kim, S.W.; Ryu, J.; Kang, S.-Y.; Kim, J.-B.; Kim, S.H. Upregulation of the MYB2 Transcription Factor Is Associated with Increased Accumulation of Anthocyanin in the Leaves of Dendrobium bigibbum. Int. J. Mol. Sci. 2020, 21, 5653. [Google Scholar] [CrossRef]
- Pratyusha, D.S.; Sarada, D.V.L. MYB Transcription Factors-Master Regulators of Phenylpropanoid Biosynthesis and Diverse Developmental and Stress Responses. Plant Cell Rep. 2022, 41, 2245–2260. [Google Scholar] [CrossRef]
- Rogers, S.O.; Bendich, A.J. Extraction of DNA from Plant Tissues. In Plant Molecular Biology Manual; Gelvin, S.B., Schilperoort, R.A., Verma, D.P.S., Eds.; Springer Netherlands: Dordrecht, The Netherlands, 1989; pp. 73–83. ISBN 978-94-010-6918-2. [Google Scholar]
- Cheng, H.; Jarvis, E.D.; Fedrigo, O.; Koepfli, K.-P.; Urban, L.; Gemmell, N.J.; Li, H. Haplotype-Resolved Assembly of Diploid Genomes without Parental Data. Nat. Biotechnol. 2022, 40, 1332–1335. [Google Scholar] [CrossRef] [PubMed]
- Bolger, A.M.; Lohse, M.; Usadel, B. Trimmomatic: A Flexible Trimmer for Illumina Sequence Data. Bioinformatics 2014, 30, 2114–2120. [Google Scholar] [CrossRef] [PubMed]
- Durand, N.C.; Shamim, M.S.; Machol, I.; Rao, S.S.P.; Huntley, M.H.; Lander, E.S.; Aiden, E.L. Juicer Provides a One-Click System for Analyzing Loop-Resolution Hi-C Experiments. Cell Syst. 2016, 3, 95–98. [Google Scholar] [CrossRef]
- Dudchenko, O.; Batra, S.S.; Omer, A.D.; Nyquist, S.K.; Hoeger, M.; Durand, N.C.; Shamim, M.S.; Machol, I.; Lander, E.S.; Aiden, A.P.; et al. De Novo Assembly of the Aedes aegypti Genome Using Hi-C Yields Chromosome-Length Scaffolds. Science 2017, 356, 92–95. [Google Scholar] [CrossRef]
- Simao, F.A.; Waterhouse, R.M.; Ioannidis, P.; Kriventseva, E.V.; Zdobnov, E.M. BUSCO: Assessing Genome Assembly and Annotation Completeness with Single-Copy Orthologs. Bioinformatics 2015, 31, 3210–3212. [Google Scholar] [CrossRef]
- Li, H. Minimap2: Pairwise Alignment for Nucleotide Sequences. Bioinformatics 2018, 34, 3094–3100. [Google Scholar] [CrossRef]
- Ou, S.; Chen, J.; Jiang, N. Assessing Genome Assembly Quality Using the LTR Assembly Index (LAI). Nucleic Acids Res. 2018, 46, e126. [Google Scholar] [CrossRef]
- Rhie, A.; Walenz, B.P.; Koren, S.; Phillippy, A.M. Merqury: Reference-Free Quality, Completeness, and Phasing Assessment for Genome Assemblies. Genome Biol. 2020, 21, 245. [Google Scholar] [CrossRef]
- Benson, G. Tandem Repeats Finder: A Program to Analyze DNA Sequences. Nucleic Acids Res. 1999, 27, 573–580. [Google Scholar] [CrossRef]
- Xu, Z.; Wang, H. LTR_FINDER: An Efficient Tool for the Prediction of Full-Length LTR Retrotransposons. Nucleic Acids Res. 2007, 35, W265–W268. [Google Scholar] [CrossRef]
- Flynn, J.M.; Hubley, R.; Goubert, C.; Rosen, J.; Clark, A.G.; Feschotte, C.; Smit, A.F. RepeatModeler2 for Automated Genomic Discovery of Transposable Element Families. Proc. Natl. Acad. Sci. USA 2020, 117, 9451–9457. [Google Scholar] [CrossRef] [PubMed]
- Chen, N. Using RepeatMasker to Identify Repetitive Elements in Genomic Sequences. Curr. Protoc. Bioinform. 2004, 4, 4–10. [Google Scholar] [CrossRef] [PubMed]
- Jurka, J. Repbase Update—A Database and an Electronic Journal of Repetitive Elements. Trends Genet. 2000, 16, 418–420. [Google Scholar] [CrossRef] [PubMed]
- Bao, W.; Kojima, K.K.; Kohany, O. Repbase Update, a Database of Repetitive Elements in Eukaryotic Genomes. Mob. DNA 2015, 6, 11. [Google Scholar] [CrossRef]
- Gertz, E.M.; Yu, Y.-K.; Agarwala, R.; Schaffer, A.A.; Altschul, S.F. Composition-Based Statistics and Translated Nucleotide Searches:: Improving the TBLASTN Module of BLAST. BMC Biol. 2006, 4, 4. [Google Scholar] [CrossRef]
- Slater, G.S.; Birney, E. Automated Generation of Heuristics for Biological Sequence Comparison. BMC Bioinform. 2005, 6, 31. [Google Scholar] [CrossRef]
- Stanke, M.; Steinkamp, R.; Waack, S.; Morgenstern, B. AUGUSTUS: A Web Server for Gene Finding in Eukaryotes. Nucleic Acids Res. 2004, 32, W309–W312. [Google Scholar] [CrossRef]
- Stanke, M.; Morgenstern, B. AUGUSTUS: A Web Server for Gene Prediction in Eukaryotes That Allows User-Defined Constraints. Nucleic Acids Res. 2005, 33, W465–W467. [Google Scholar] [CrossRef]
- Stanke, M.; Keller, O.; Gunduz, I.; Hayes, A.; Waack, S.; Morgenstern, B. AUGUSTUS: Ab Initio Prediction of Alternative Transcripts. Nucleic Acids Res. 2006, 34, W435–W439. [Google Scholar] [CrossRef]
- Kim, D.; Paggi, J.M.; Park, C.; Bennett, C.; Salzberg, S.L. Graph-Based Genome Alignment and Genotyping with HISAT2 and HISAT-Genotype. Nat. Biotechnol. 2019, 37, 907–915. [Google Scholar] [CrossRef]
- Kovaka, S.; Zimin, A.; Pertea, G.M.; Razaghi, R.; Salzberg, S.L.; Pertea, M. Transcriptome Assembly from Long-Read RNA-Seq Alignments with StringTie2. Genome Biol. 2019, 20, 278. [Google Scholar] [CrossRef] [PubMed]
- Grabherr, M.G.; Haas, B.J.; Yassour, M.; Levin, J.Z.; Thompson, D.A.; Amit, I.; Adiconis, X.; Fan, L.; Raychowdhury, R.; Zeng, Q.; et al. Full-Length Transcriptome Assembly from RNA-Seq Data without a Reference Genome. Nat. Biotechnol. 2011, 29, 644–652. [Google Scholar] [CrossRef] [PubMed]
- Haas, B.J.; Delcher, A.L.; Mount, S.M.; Wortman, J.R.; Smith, R.K.; Hannick, L.I.; Maiti, R.; Ronning, C.M.; Rusch, D.B.; Town, C.D.; et al. Improving the Arabidopsis Genome Annotation Using Maximal Transcript Alignment Assemblies. Nucleic Acids Res. 2003, 31, 5654–5666. [Google Scholar] [CrossRef]
- Cantarel, B.L.; Korf, I.; Robb, S.M.C.; Parra, G.; Ross, E.; Moore, B.; Holt, C.; Alvarado, A.S.; Yandell, M. MAKER: An Easy-to-Use Annotation Pipeline Designed for Emerging Model Organism Genomes. Genome Res. 2008, 18, 188–196. [Google Scholar] [CrossRef]
- Buchfink, B.; Reuter, K.; Drost, H.-G. Sensitive Protein Alignments at Tree-of-Life Scale Using DIAMOND. Nat. Methods 2021, 18, 366–368. [Google Scholar] [CrossRef]
- Jones, P.; Binns, D.; Chang, H.-Y.; Fraser, M.; Li, W.; McAnulla, C.; McWilliam, H.; Maslen, J.; Mitchell, A.; Nuka, G.; et al. InterProScan 5: Genome-Scale Protein Function Classification. Bioinformatics 2014, 30, 1236–1240. [Google Scholar] [CrossRef]
- Mitchell, A.; Chang, H.-Y.; Daugherty, L.; Fraser, M.; Hunter, S.; Lopez, R.; McAnulla, C.; McMenamin, C.; Nuka, G.; Pesseat, S.; et al. The InterPro Protein Families Database: The Classification Resource after 15 Years. Nucleic Acids Res. 2015, 43, D213–D221. [Google Scholar] [CrossRef]
- Lowe, T.M.; Eddy, S.R. tRNAscan-SE: A Program for Improved Detection of Transfer RNA Genes in Genomic Sequence. Nucleic Acids Res. 1997, 25, 955–964. [Google Scholar] [CrossRef]
- Lagesen, K.; Hallin, P.; Rodland, E.A.; Stærfeldt, H.-H.; Rognes, T.; Ussery, D.W. RNAmmer:: Consistent and Rapid Annotation of Ribosomal RNA Genes. Nucleic Acids Res. 2007, 35, 3100–3108. [Google Scholar] [CrossRef]
- Nawrocki, E.P.; Kolbe, D.L.; Eddy, S.R. Infernal 1.0: Inference of RNA Alignments. Bioinformatics 2009, 25, 1335–1337. [Google Scholar] [CrossRef]
- Kalvari, I.; Nawrocki, E.P.; Ontiveros-Palacios, N.; Argasinska, J.; Lamkiewicz, K.; Marz, M.; Griffiths-Jones, S.; Toffano-Nioche, C.; Gautheret, D.; Weinberg, Z.; et al. Rfam 14: Expanded Coverage of Metagenomic, Viral and microRNA Families. Nucleic Acids Res. 2021, 49, D192–D200. [Google Scholar] [CrossRef] [PubMed]
- Emms, D.M.; Kelly, S. OrthoFinder: Phylogenetic Orthology Inference for Comparative Genomics. Genome Biol. 2019, 20, 238. [Google Scholar] [CrossRef] [PubMed]
- Edgar, R.C. MUSCLE: Multiple Sequence Alignment with High Accuracy and High Throughput. Nucleic Acids Res. 2004, 32, 1792–1797. [Google Scholar] [CrossRef] [PubMed]
- Stamatakis, A. RAxML Version 8: A Tool for Phylogenetic Analysis and Post-Analysis of Large Phylogenies. Bioinformatics 2014, 30, 1312–1313. [Google Scholar] [CrossRef]
- Kumar, S.; Suleski, M.; Craig, J.M.; Kasprowicz, A.E.; Sanderford, M.; Li, M.; Stecher, G.; Hedges, S.B. TimeTree 5: An Expanded Resource for Species Divergence Times. Mol. Biol. Evol. 2022, 39, msac174. [Google Scholar] [CrossRef]
- Sanderson, M.J. R8s: Inferring Absolute Rates of Molecular Evolution and Divergence Times in the Absence of a Molecular Clock. Bioinformatics 2003, 19, 301–302. [Google Scholar] [CrossRef]
- Yang, Z. PAML 4: Phylogenetic Analysis by Maximum Likelihood. Mol. Biol. Evol. 2007, 24, 1586–1591. [Google Scholar] [CrossRef]
- De Bie, T.; Cristianini, N.; Demuth, J.P.; Hahn, M.W. CAFE: A Computational Tool for the Study of Gene Family Evolution. Bioinformatics 2006, 22, 1269–1271. [Google Scholar] [CrossRef]
- Chen, Y.; Chen, Y.; Shi, C.; Huang, Z.; Zhang, Y.; Li, S.; Li, Y.; Ye, J.; Yu, C.; Li, Z.; et al. SOAPnuke: A MapReduce Acceleration-Supported Software for Integrated Quality Control and Preprocessing of High-Throughput Sequencing Data. GigaScience 2017, 7, gix120. [Google Scholar] [CrossRef]
- Kim, D.; Langmead, B.; Salzberg, S.L. HISAT: A Fast Spliced Aligner with Low Memory Requirements. Nat. Methods 2015, 12, 357–360. [Google Scholar] [CrossRef]
- Pertea, M.; Pertea, G.M.; Antonescu, C.M.; Chang, T.-C.; Mendell, J.T.; Salzberg, S.L. StringTie Enables Improved Reconstruction of a Transcriptome from RNA-Seq Reads. Nat. Biotechnol. 2015, 33, 290–295. [Google Scholar] [CrossRef] [PubMed]
- Love, M.I.; Huber, W.; Anders, S. Moderated Estimation of Fold Change and Dispersion for RNA-Seq Data with DESeq2. Genome Biol. 2014, 15, 550. [Google Scholar] [CrossRef] [PubMed]
- R Core Team. R: A Language and Environment for Statistical Computing; R Foundation for Statistical Computing: Vienna, Austria, 2023. [Google Scholar]
- Wang, R.; Shu, P.; Zhang, C.; Zhang, J.; Chen, Y.; Zhang, Y.; Du, K.; Xie, Y.; Li, M.; Ma, T.; et al. Integrative Analyses of Metabolome and Genome-Wide Transcriptome Reveal the Regulatory Network Governing Flavor Formation in Kiwifruit (Actinidia chinensis). New Phytol. 2022, 233, 373–389. [Google Scholar] [CrossRef] [PubMed]
- Kohl, M.; Wiese, S.; Warscheid, B. Cytoscape: Software for Visualization and Analysis of Biological Networks. In Data Mining in Proteomics: From Standards to Applications; Hamacher, M., Eisenacher, M., Stephan, C., Eds.; Humana Press: Totowa, NJ, USA, 2011; Volume 696, pp. 291–303. ISBN 1064-3745. [Google Scholar]

Disclaimer/Publisher’s Note: The statements, opinions and data contained in all publications are solely those of the individual author(s) and contributor(s) and not of MDPI and/or the editor(s). MDPI and/or the editor(s) disclaim responsibility for any injury to people or property resulting from any ideas, methods, instructions or products referred to in the content. |
© 2025 by the authors. Licensee MDPI, Basel, Switzerland. This article is an open access article distributed under the terms and conditions of the Creative Commons Attribution (CC BY) license (https://creativecommons.org/licenses/by/4.0/).