Article

Rice Phytochrome B (OsPhyB) Negatively Regulates Dark- and Starvation-Induced Leaf Senescence

Department of Plant Science, Plant Genomics and Breeding Institute, Research Institute of Agriculture and Life Sciences, Seoul National University, Seoul 151-921, Korea
*
Authors to whom correspondence should be addressed.
Plants 2015, 4(3), 644-663; https://doi.org/10.3390/plants4030644
Submission received: 26 June 2015 / Revised: 18 August 2015 / Accepted: 28 August 2015 / Published: 1 September 2015
(This article belongs to the Special Issue Plant Senescence)

Abstract

:
Light regulates leaf senescence and light deprivation causes large-scale transcriptional reprogramming to dismantle cellular components and remobilize nutrients to sink organs, such as seeds and storage tissue. We recently reported that in Arabidopsis (Arabidopsis thaliana), Phytochrome-Interacting Factor4 (PIF4) and PIF5 promote dark-induced senescence and natural senescence by directly activating the expression of typical senescence-associated genes (SAGs), including ORESARA1 (ORE1) and ETHYLENE INSENSITIVE3 (EIN3). In contrast, phytochrome B (PhyB) inhibits leaf senescence by repressing PIF4 and PIF5 at the post-translational level. Although we found how red light signaling represses leaf senescence in Arabidopsis, it remains unknown whether PhyB and/or PhyA are involved in leaf senescence in rice (Oryza sativa). Here we show that rice phyB knockout mutants (osphyB-1, -2, and -3) exhibited an early senescence phenotype during dark-induced senescence, but an osphyA knockout mutant (osphyA-3) senesced normally. The RT-qPCR analysis revealed that several senescence-associated genes, including OsORE1 and OsEIN3, were significantly up-regulated in osphyB-2 mutants, indicating that OsPhyB also inhibits leaf senescence, like Arabidopsis PhyB. We also found that leaf segments of osphyB-2 senesced faster even under light conditions. Supplementation with nitrogen compounds, such as KNO3 and NH4NO3, rescued the early senescence phenotype of osphyB-2, indicating that starvation is one of the major signaling factors in the OsPhyB-dependent leaf senescence pathway.

1. Introduction

In nature, the quality and quantity of sunlight vary depending on diurnal, seasonal, and local conditions. Thus, plants have evolved to use diverse sets of photoreceptors to perceive light of different wavelengths, enabling plants to fine-tune their growth and development over a large range of light conditions. Phytochromes (Phys), the photoreceptors that regulate the expression of large number of genes in a red/far-red (R/FR) light-dependent fashion, play a vital role in ensuring plants’ optimal acclimation to rapidly changing light conditions [1,2]. Phys are dimeric chromoproteins that exist in two different, stable conformations, depending on the wavelength of the incoming light [3]. The inactive Pr conformation can absorb red light and the active Pfr conformation can absorb far-red light [2]. The inactive Pr form localizes in the cytosol and the active Pfr form translocates into the nucleus to activate or repress its target genes [4], acting together with specific transcription factors (TFs) known as Phytochrome-Interacting Factors (PIFs; [5]).
The Arabidopsis (Arabidopsis thaliana) genome encodes five members of the Phy family (PhyA-PhyE); these proteins have a conserved N-terminal domain that functions in light perception and light signal transduction, and a C-terminal domain that is essential for dimerization and interaction with other proteins that function downstream of light signal transduction [4,6,7]. Among the five Phys, PhyA and PhyB regulate a wide range of light-dependent processes, such as seed germination, de-etiolation, hypocotyl elongation, shade avoidance, and flowering time [8].
In contrast to Arabidopsis, rice (Oryza sativa) has only three phys: OsPhyA, OsPhyB, and OsPhyC [9]. Knockout (KO) mutants of each rice Phy have been used to elucidate the physiological role of individual Phys [10,11]. The role of Phys in de-etiolation of Arabidopsis seedlings has been widely studied [12,13]. Similarly, OsPhyA and OsPhyB have important roles in de-etiolation of rice seedlings; thus, greening was strongly inhibited in osphyA osphyB double mutant seedlings under continuous red or far-red light [11]. OsPhys also contribute to rice architecture during development; for example, OsPhyA and OsPhyB regulate coleoptile elongation of young seedlings. The coleoptiles of osphyB mutant seedlings were significantly longer than those of wild-type (WT) seedlings under continuous red light conditions [11], and OsPhyB acts as a negative regulator in the brassinosteroid-regulated coleoptile elongation pathway [10]. In contrast, the coleoptiles of osphyA mutants were significantly longer than WT coleoptiles under far-red light conditions [11]. This difference between OsPhyA and OsPhyB is probably caused by the light specificity of each phytochrome and indicates that OsPhyA has a predominant role in perceiving FR light [14].
The osphy mutations also affect the angle of the leaf blade, a significant agronomic trait that alters planting density. The 2nd leaves in osphyB seedlings had a higher declination angle than the WT leaves. Although the osphyA seedlings had nearly the same angle as WT, the osphyA osphyB seedlings had a significantly greater declination angle than the osphyB seedlings [11], indicating that both OsPhyB and OsPhyA have important roles in leaf blade declination.
The OsPhys also affect floral induction; osphyB mutants flowered much earlier in both long-day (LD) and short-day (SD) conditions [11], like phyB mutants of other species, including Arabidopsis [15] and sorghum [16]. The osphyC null mutants also exhibited an early flowering phenotype under LD conditions, but flowered at approximately the same time as WT under SD conditions [11], indicating that OsPhyC has a photoperiod-dependent role in flowering time. In contrast with osphyB mutants, the osphyA mutants flowered at almost the same as WT under both LD and SD conditions. Notably, osphyA osphyB and osphyA osphyC double mutants flowered much earlier than osphyB and osphyC single mutants under LD conditions, respectively [11], indicating that OsPhyA contributes to OsPhyB and OsPhyC functions to suppress flowering in response to LD conditions.
Recently, we showed that Arabidopsis PhyB negatively regulates leaf senescence; phyB-KO mutants showed an early leaf senescence phenotype, while PhyB-overexpressing (PhyB-OX) plants showed delayed leaf yellowing during dark-induced senescence (DIS). However, KO mutants and OX plants of Arabidopsis PhyA did not show any senescence phenotype [17]. We also revealed that both PIF4 and PIF5 function as the central activators of DIS. It is well known that PhyB represses these two PIFs at the post-translational level during senescence [17]. PIF4 and PIF5 directly activate the expression of typical senescence-associated genes (SAGs), including ORESARA1 (ORE1; [18]), ETHYLENE INSENSITIVE3 (EIN3; [19]), and genes encoding abscisic acid (ABA)-responsive bZIP TFs, such as ABA INSENSITIVE5 (ABI5) and ENHANCED EM LEVEL (EEL; [20]). Furthermore, EIN3, ABI5, and EEL also directly activate ORE1 expression, forming multiple coherent feed-forward loops for the activation of leaf senescence in Arabidopsis [17]. At almost the same time, Song et al. (2014) reported that, in addition to PIF4 and PIF5, PIF3 is also involved in the promotion of leaf senescence [21], but the PIF3 regulatory cascade is not clear yet.
Here we show that the osphyB-2 mutants also exhibited an early senescence phenotype during DIS, similar to the Arabidopsis phyB mutants. Expression analysis revealed that rice homologs of ORE1, EIN3, ABI5, and EEL were significantly up-regulated in osphyB-2 mutants. We also found that detached leaf segments of osphyB-2 also showed an early senescence phenotype during light incubation. Furthermore, the early senescence phenotype of osphyB-2 was partially recovered by supplementation with nitrogen compounds, indicating that at least in part, starvation-responsive signaling controls the OsPhyB-dependent induction of senescence. We discussed the possible mechanism of OsPhyB-regulating senescence in rice leaves.

2. Results

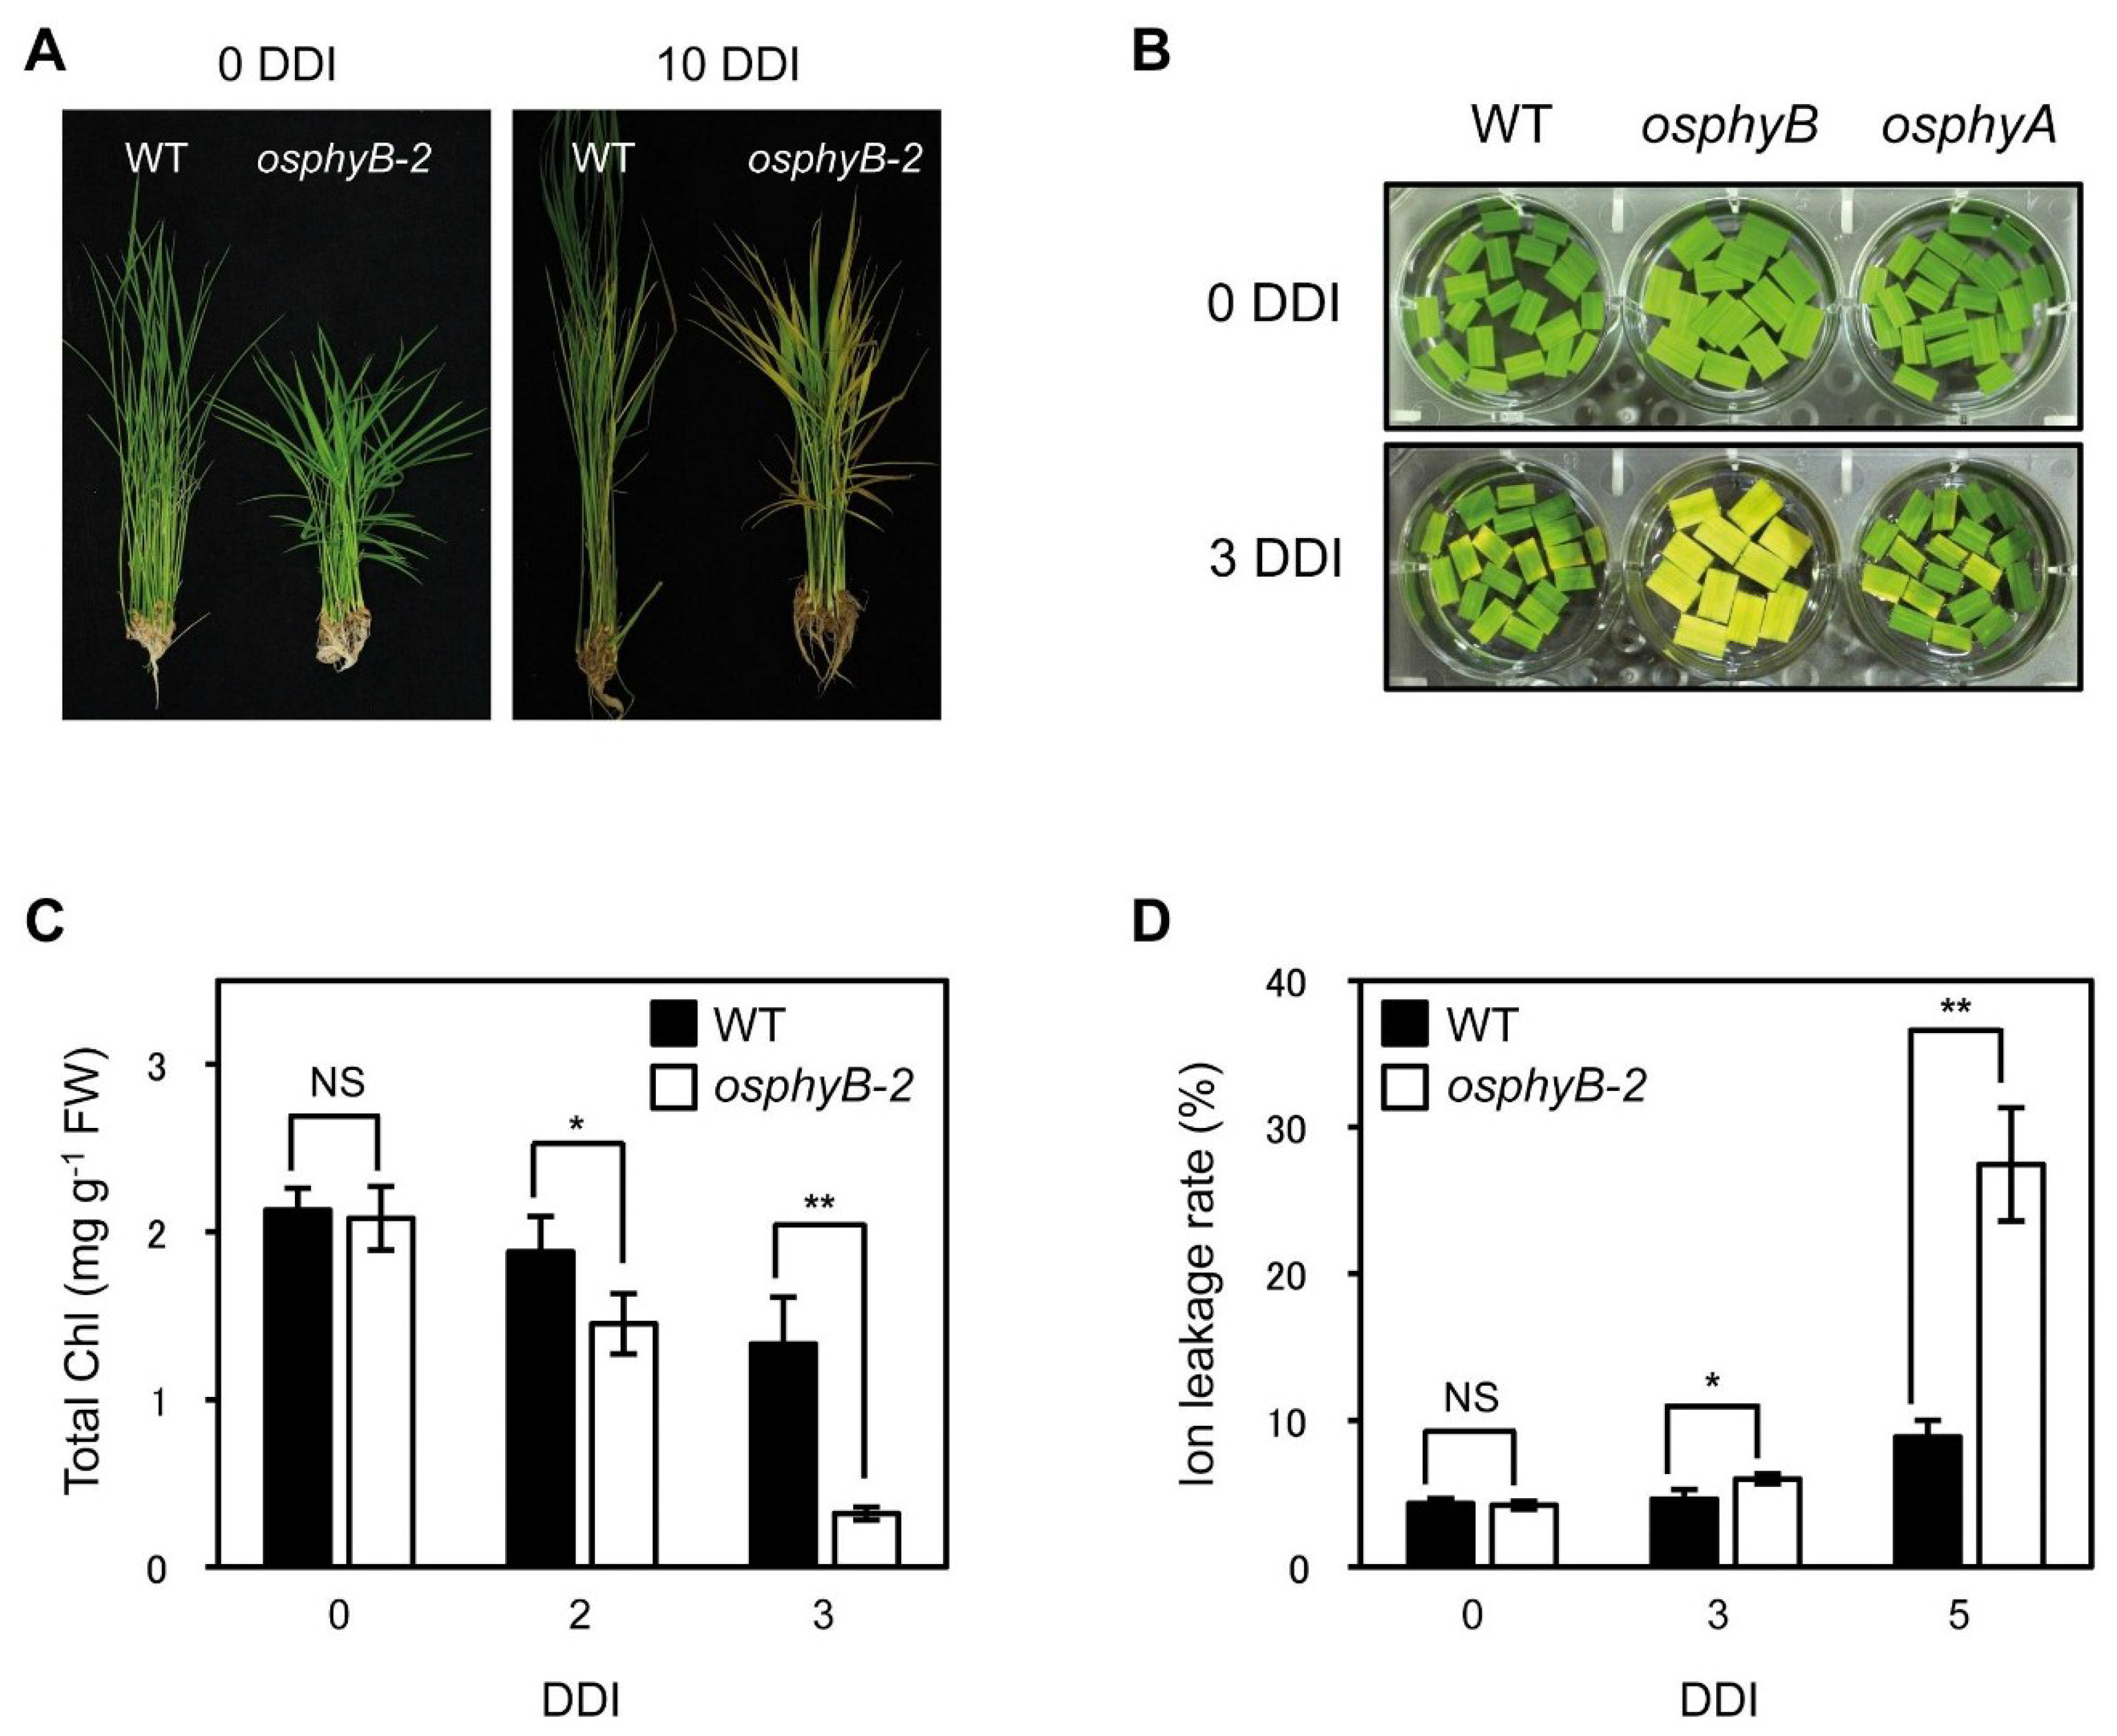
2.1. Leaf Blades of osphyB-2 Mutants Senesced Early during DIS

We previously reported that in Arabidopsis, phyB mutants senesced early and phyB-OX plants showed delayed leaf senescence during DIS [17], indicating that PhyB negatively regulates leaf senescence in Arabidopsis. Thus, OsPhyB likely also participates in the regulation of leaf senescence. To examine this, we obtained a T-DNA insertion mutant line (PFG_4A-02226.R) in which a single T-DNA fragment is inserted in the 3rd intron of OsPhyB (Supplemental Figure 1A), and the mutant leaves do not accumulate OsPhyB mRNA (Supplemental Figure 1B), indicating that this mutant (previously named osphyB-2) is an OsphyB-KO allele [10].
To compare this allele with other previously described osphyB mutants [11,22,23], we first measured the phenotypic characteristics of osphyB-2 mutants, such as leaf angle, plant height, heading date, and seed fertility. The one-month-old osphyB-2 mutants were shorter and had much wider leaf angles than the WT plants (Figure 1A, left panel; Supplemental Figure 2A,C), similar to other osphyB alleles [11]. For heading date and seed fertility of osphyB-2 in the paddy field, we found that the osphyB-2 mutants flowered much earlier (Supplemental Figure 3A), and had lower seed fertility than WT (Supplemental Figure 3B). Collectively, the phenotypic traits of osphyB-2 are consistent with the phenotypes of other osphyB alleles [11,23].
Figure 1. The osphyB-2 mutant exhibited an early senescence phenotype during DIS. (A) WT and osphyB-2 whole plants were grown for 1 month under LD (14-h light/day) conditions and then were transferred to darkness at 28 °C for 10 days (10 DDI); (B) The color change that occurs in leaf segments of WT, osphyB-2, and osphyA-3 during DIS; (C,D) The changes of total Chl level (C) and ion leakage rate (D) in the leaf segments of WT and osphyB-2 during DIS. They were incubated on 3 mM MES (pH 5.8) buffer with the abaxial side up at 28 °C in darkness. Mean and SD values in (C,D) were obtained from at least five biological replicates. Asterisks indicate significant difference between WT and osphyB-2 (Student’s t-test p values, *p < 0.05; **p < 0.01). NS, not significant; DDI, day(s) of dark incubation.
Plants 04 00644 g001
Next, we examined the phenotype of osphyB-2 mutants during DIS. The 4-week-old WT and osphyB-2 whole plants were transferred to complete darkness. After 10 days of dark incubation (10 DDI), many leaves of osphyB-2 became yellow, while most WT leaves retained their green color (Figure 1C). This early senescence phenotype of osphyB-2 mutant was also examined using detached leaf segments. Leaf segments from one-month-old WT and osphyB-2 were floated on MES buffer (pH 5.8), and incubated in darkness. The leaf segments of osphyB-2 yellowed much faster than those of WT, showing a striking difference at 4 DDI (Figure 1B), similar to whole plants. Consistent with the visible phenotype, osphyB-2 mutants had lower chlorophyll (Chl) levels (Figure 1C) and higher ion leakage rate, an indicator of membrane disintegration during senescence (Figure 1D). We also examined whether a different allele of osphyB showed the same early senescence phenotype, using the previously characterized allele osphyB-1 [10]. We found that osphyB-1 leaf segments also showed an early senescence phenotype during DIS (Supplemental Figure 4). These results indicate that OsPhyB is also involved in the repression of leaf senescence, like Arabidopsis PhyB [17].
We also obtained an osphyA mutant that has a single T-DNA fragment inserted in the 1st intron of OsPhyA (Supplemental Figure 5A; termed osphyA-3). This mutant did not accumulate OsPhyA transcripts in the leaves (Supplemental Figure 5B), indicating that it has a KO allele of OsPhyA. Unlike osphyB-2, however, osphyA-3 mutants did not exhibit an altered senescence phenotype during DIS (Figure 1B), similar to the Arabidopsis phyA mutant [17].

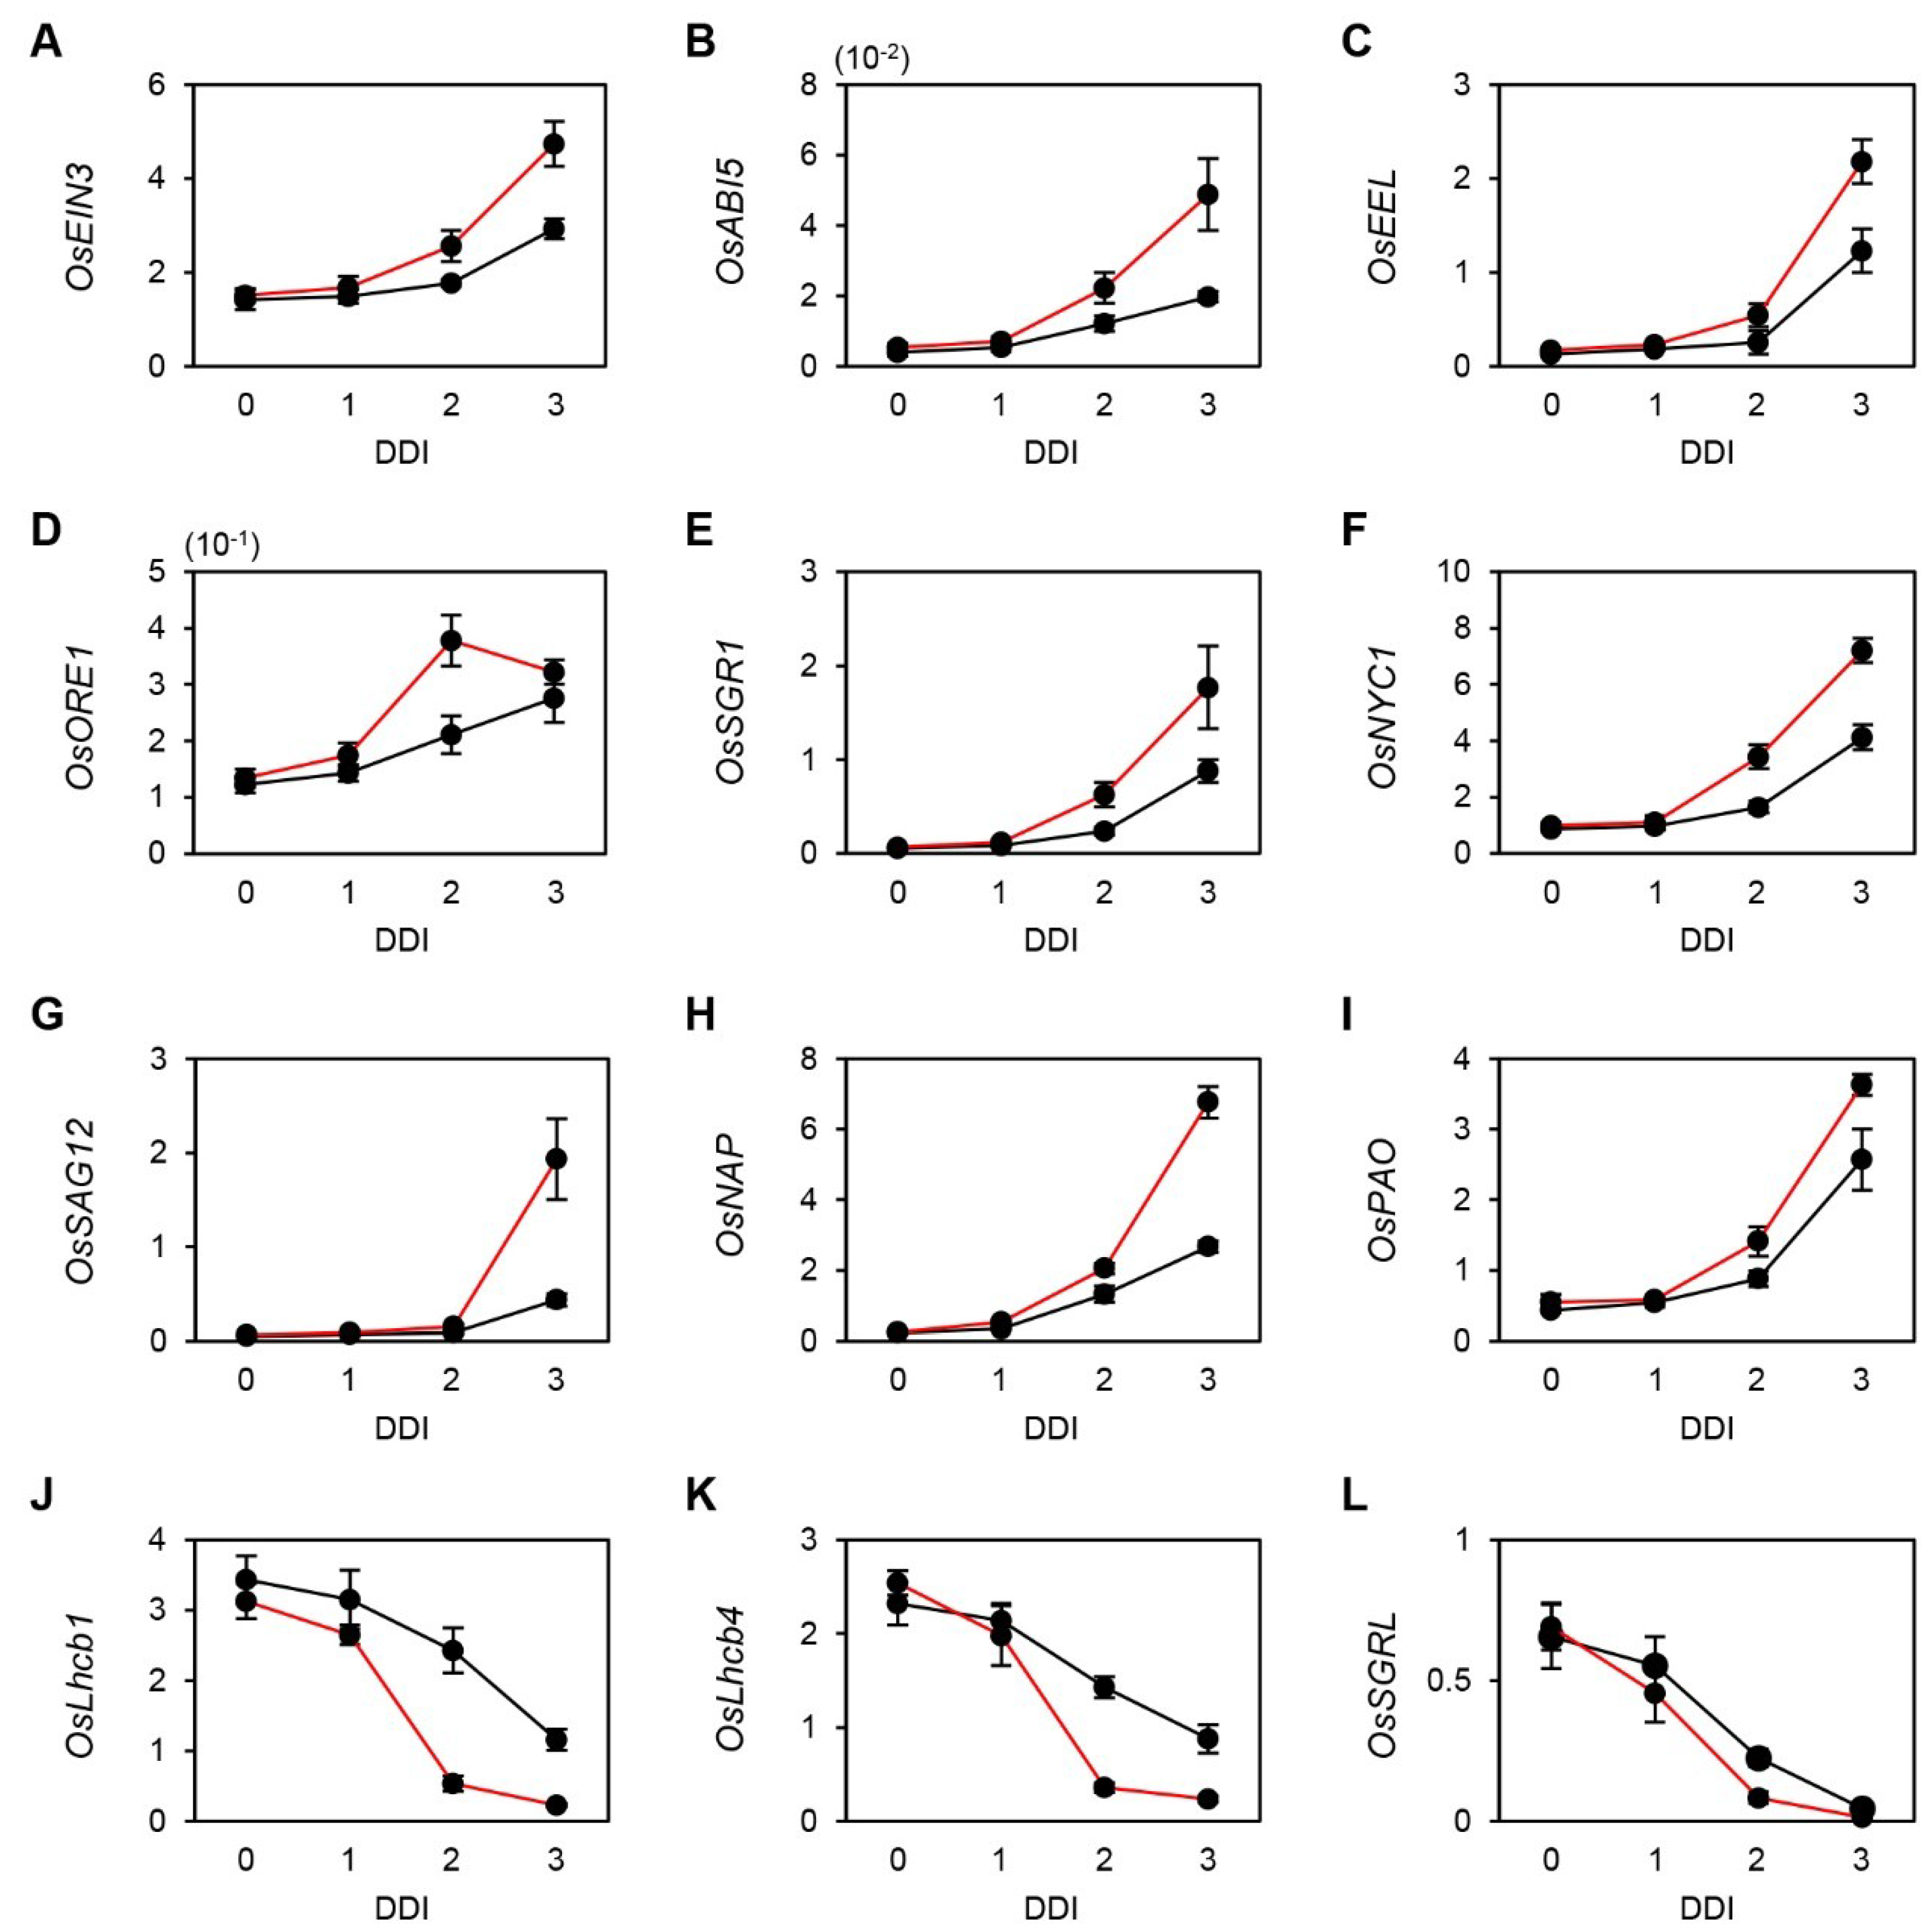
2.2. Altered Gene Expression in osphyB-2 Mutants during DIS

We previously reported that Arabidopsis PhyB represses PIF4 and PIF5 at the post-translational level to delay leaf senescence in the light. In the dark, however, PhyB becomes inactive and the PIFs directly activate several key SAGs to induce leaf senescence cascade [17]. Thus, it is also possible that the expression levels of the key SAGs are altered in osphyB-2 mutants during DIS.
To examine this possibility, we used reverse transcription-quantitative PCR (RT-qPCR) to measure the transcript levels of the key SAGs. In Arabidopsis, PIF4 and PIF5 directly activate ABI5, EEL, EIN3, and ORE1, and indirectly activate two Chl degradation-related genes, STAY-GREEN1 (SGR1; [24]) and NON-YELLOW COLORING1 (NYC1; [25]), during senescence [17]. Thus, we first checked the rice homologs of these six SAGs [26,27,28]. Before dark incubation (0 DDI), OsEIN3, OsABI5, OsEEL, OsORE1, OsSGR1, and OsNYC1 showed similar expression levels in osphyB-2 and WT plants. During dark incubation, however, the transcript levels of all six genes increased much faster in osphyB-2 mutants than in WT (Figure 2A–F), indicating that OsPhyB regulates the PIF-dependent leaf senescence cascade, similar to the Arabidopsis PhyB-PIF regulatory module. We also checked the expression levels of other typical SAGs, OsSAG12 [27], OsNAP [29], and OsPAO [30]. We found that these three genes were also significantly up-regulated in osphyB-2 mutants during DIS (Figure 2G–I). In contrast, expression levels of three senescence down-regulated genes (SDGs), OsLhcb1, OsLhcb4, and OsSGRL [31] decreased much faster in osphyB-2 mutants than in WT (Figure 2J–L). These results indicate that OsPhyB negatively regulates leaf senescence in the light by indirectly altering several SAGs and SDGs, similar to the Arabidopsis PhyB.
Figure 2. Expression of senescence-associated genes (SAGs) in WT and osphyB-2 during DIS. Detached leaf segments from one-month-old WT (black line) and osphyB-2 (red line) plants grown under LD conditions were incubated on 3 mM MES (pH 5.8) buffer with the abaxial side up at 28 °C in darkness, and were sampled at 0, 1, 2, and 3 DDI for RT-qPCR. RT-qPCR analysis was used to measure the relative transcript levels of OsEIN3 (A), OsABI5 (B); OsEEL (C); OsORE1 (D); OsSGR1 (E); OsNYC1 (F); OsSAG12 (G); OsNAP (H); OsPAO (I); OsLhcb1 (J); OsLhcb4 (K) and OsSGRL (L) and transcript levels were normalized to the transcript levels of OsUBQ5. Mean and SD values were obtained from more than three biological replicates. These experiments were repeated twice with similar results. DDI, day(s) of dark incubation.
Plants 04 00644 g002

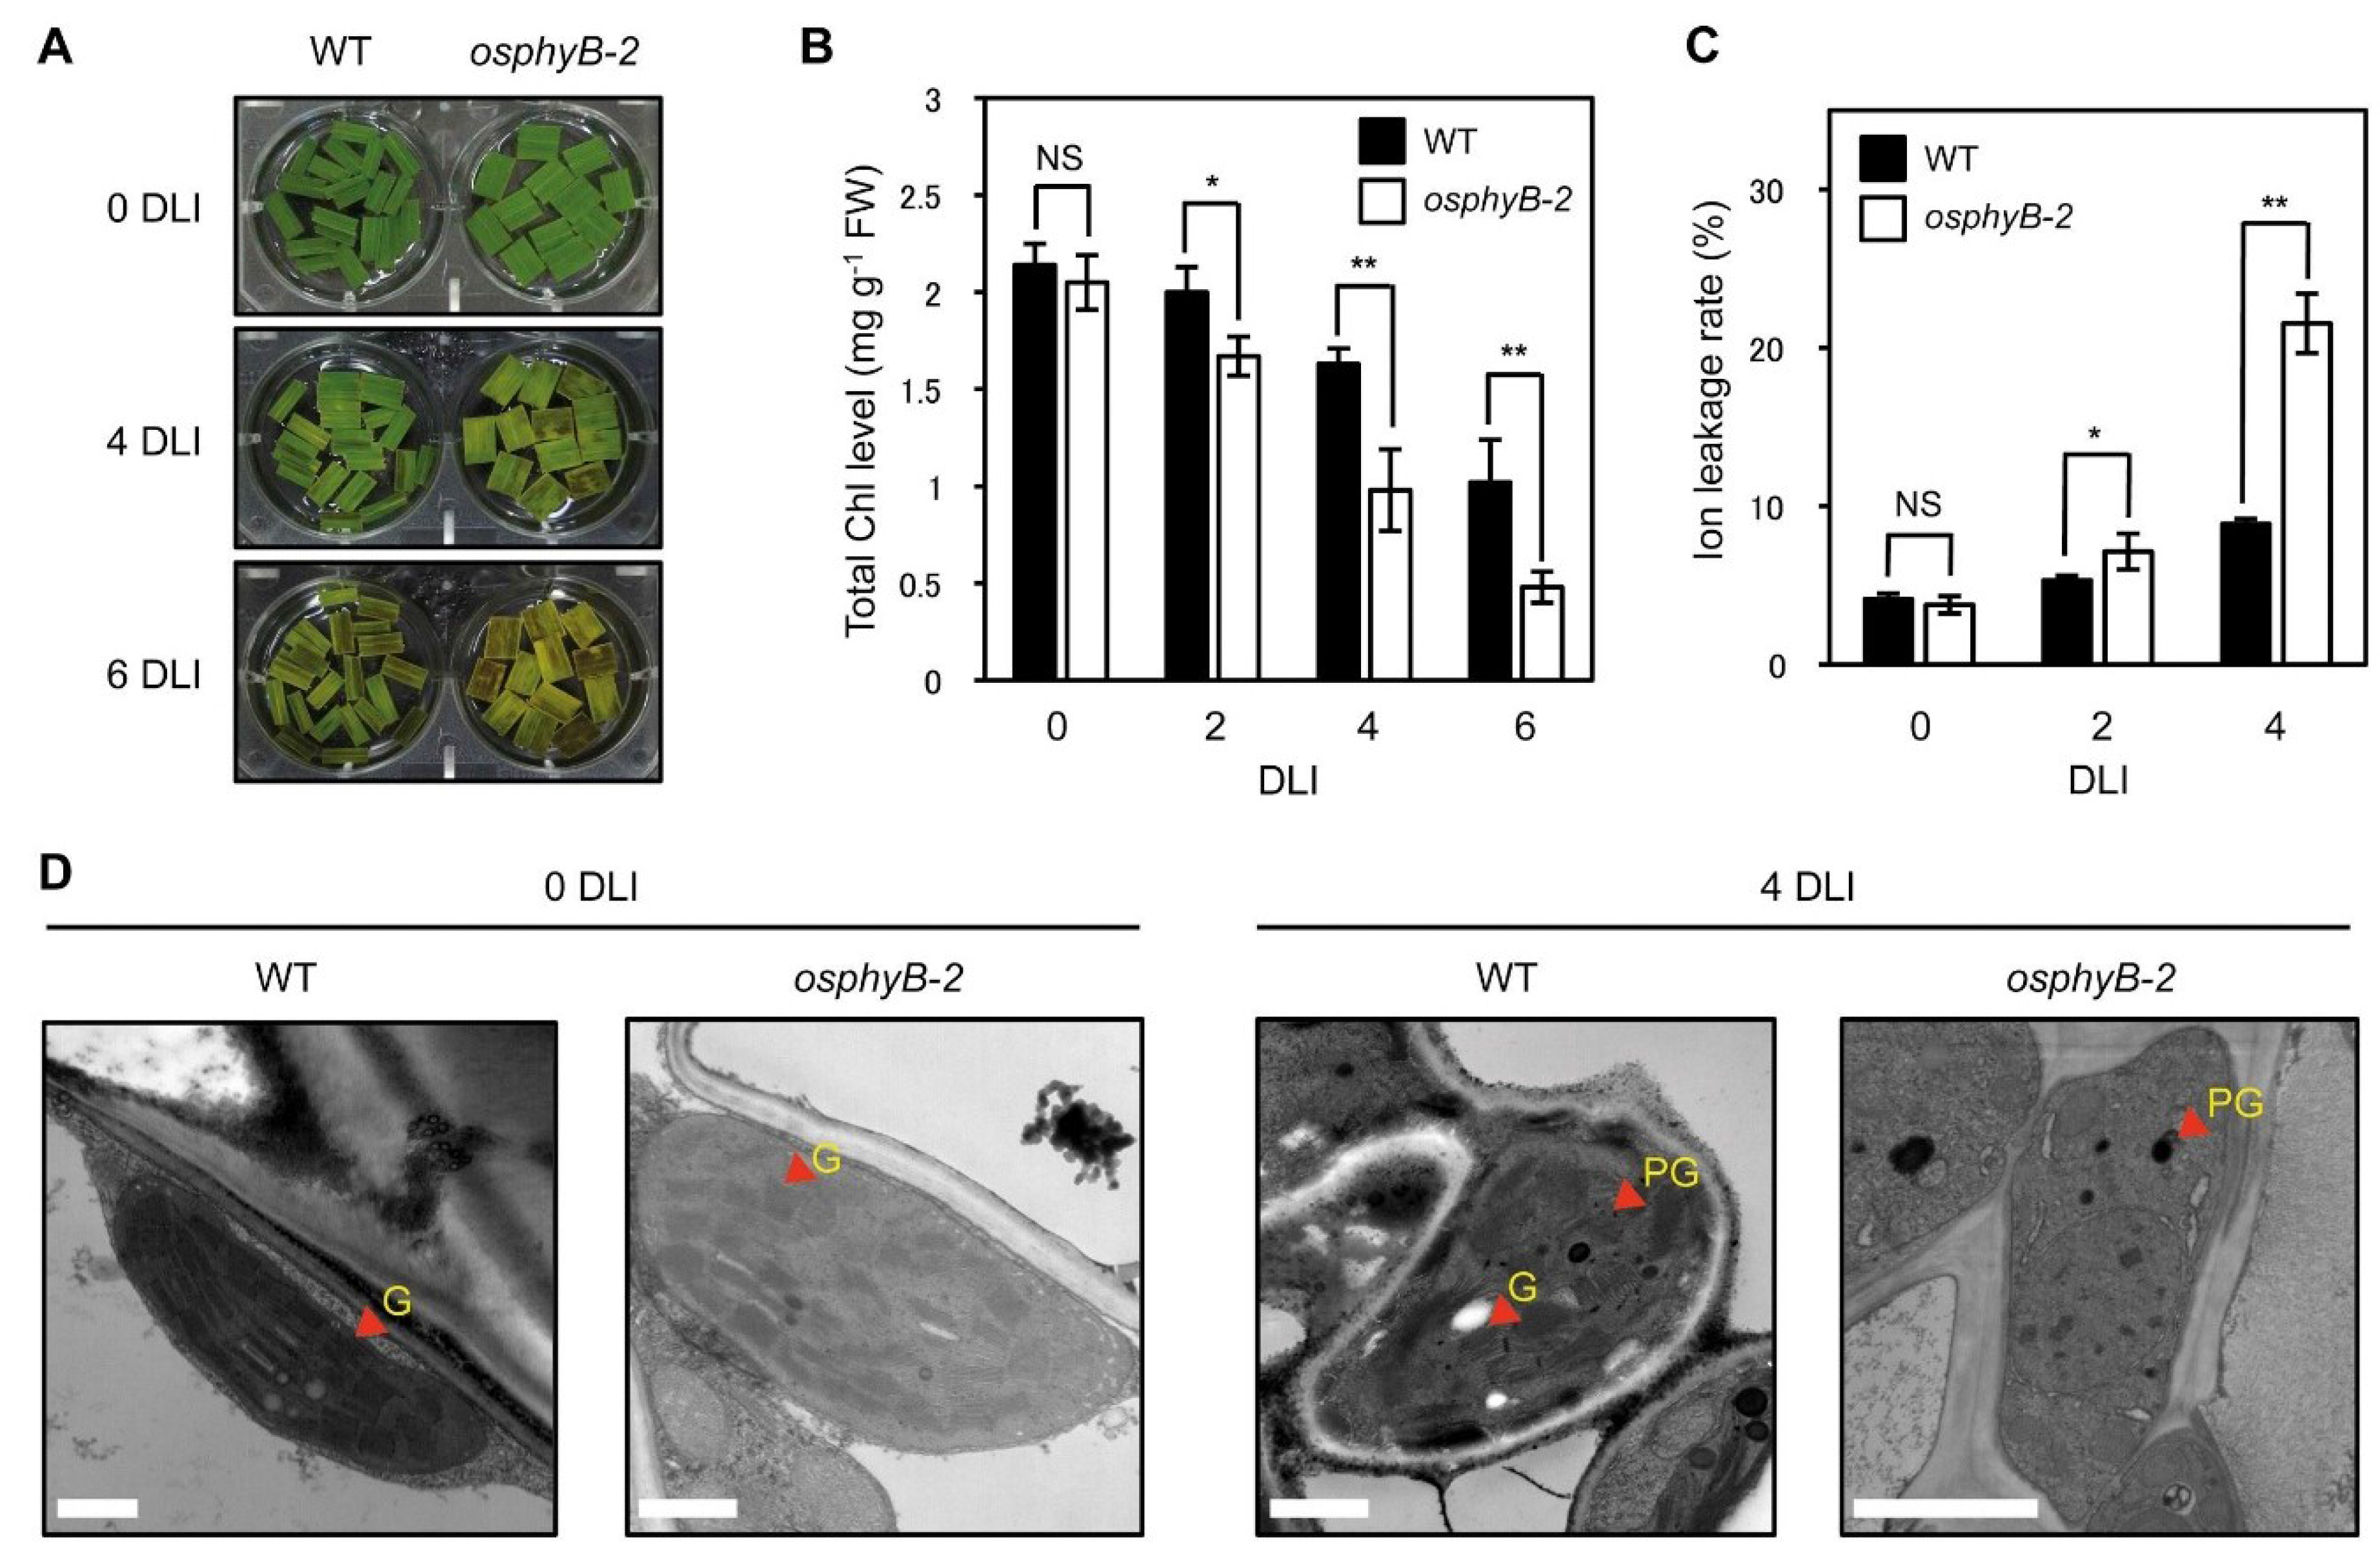
2.3. osphyB-2 Mutants Exhibited an Early Senescence Phenotype in the Light

During DIS, detached leaves senesce much faster than attached leaves on whole plants [17,32], because the detached leaves are more susceptible to starvation. Thus, in addition to examining DIS, premature senescence is sometimes assessed in detached leaves incubated in the light [33]. Thus, we examined the senescence phenotype of osphyB-2 in light conditions. Leaf segments from one-month-old WT and osphyB-2 plants were floated on MES buffer (pH 5.8) and incubated under 7 days of light incubation (7 DLI). During incubation, yellowing of osphyB-2 leaf segments began much faster (Figure 3A), with drastic decreases of Chl (Figure 3B), similar to the phenotype during DIS (Figure 1). The ion leakage rate in osphyB-2 leaf segments was also higher than that of WT (Figure 3C). We also compared chloroplast structure of the WT and osphyB-2 leaves at 0 and 7 DT. Transmission electron microscopy revealed that the WT and osphyB-2 leaves had very similar chloroplast structures before light incubation (0 DT). At 7 DT, however, grana thylakoid structure in chloroplasts was hardly detectable in the osphyB-2 leaves, but still remained intact in the WT leaves (Figure 3D). Together, these results indicate that OsPhyB is also involved in the regulation of starvation-induced leaf senescence under light conditions.
Figure 3. The osphyB-2 mutants senesced early even in light conditions. The changes of phenotype (A); total Chl level (B); ion leakage rate (C); and chloroplast structure (observed by transmission electron microscopy) (D) in WT and osphyB-2 during starvation-induced senescence. Detached leaf segments from one-month-old WT and osphyB-2 grown under LD conditions were incubated on 3 mM MES (pH 5.8) buffer with the abaxial side up at 28 °C under continuous light conditions, and were sampled at 0, 2, 4, and/or 6 DT for each experiment. (B,C) Mean and SD values were obtained from more than five biological replicates. Asterisks indicate significant difference between WT and osphyB-2 (Student’s t-test p values, * p < 0.05; ** p < 0.01). (D) G, grana thylakoid; PG, plastoglobule. Scale bars = 1 μm. NS, not significant; DLI, day(s) of light incubation.
Plants 04 00644 g003

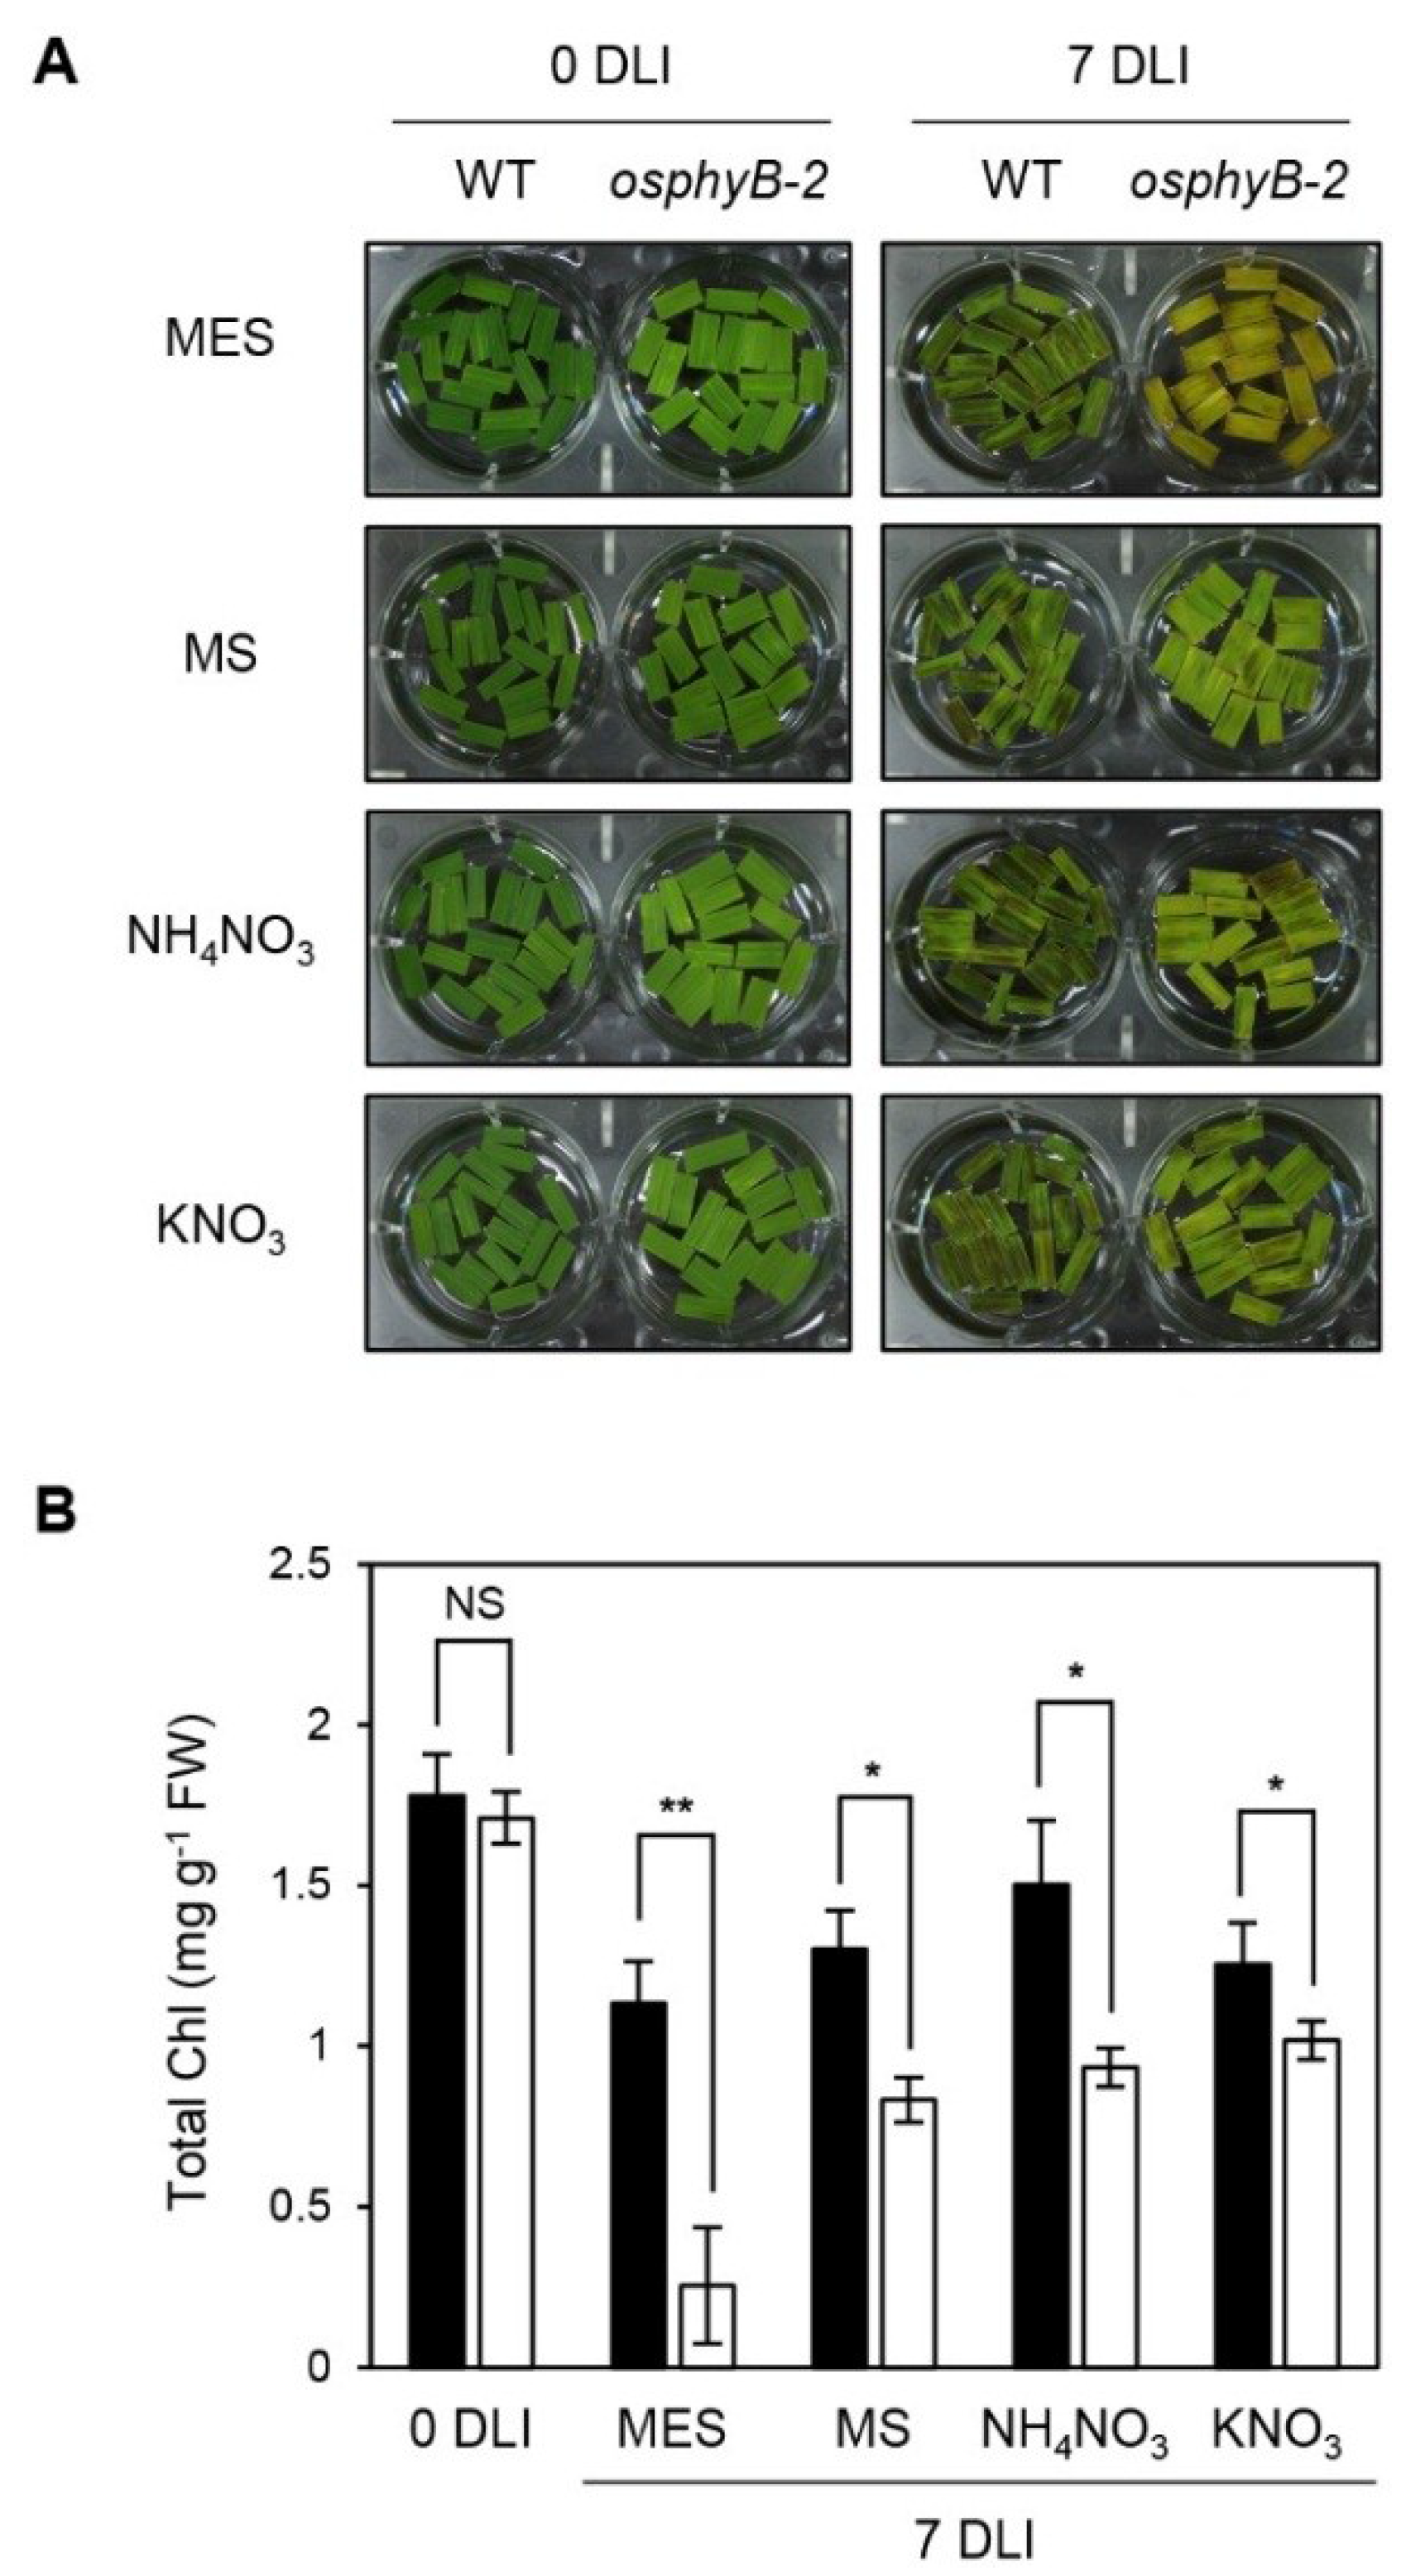
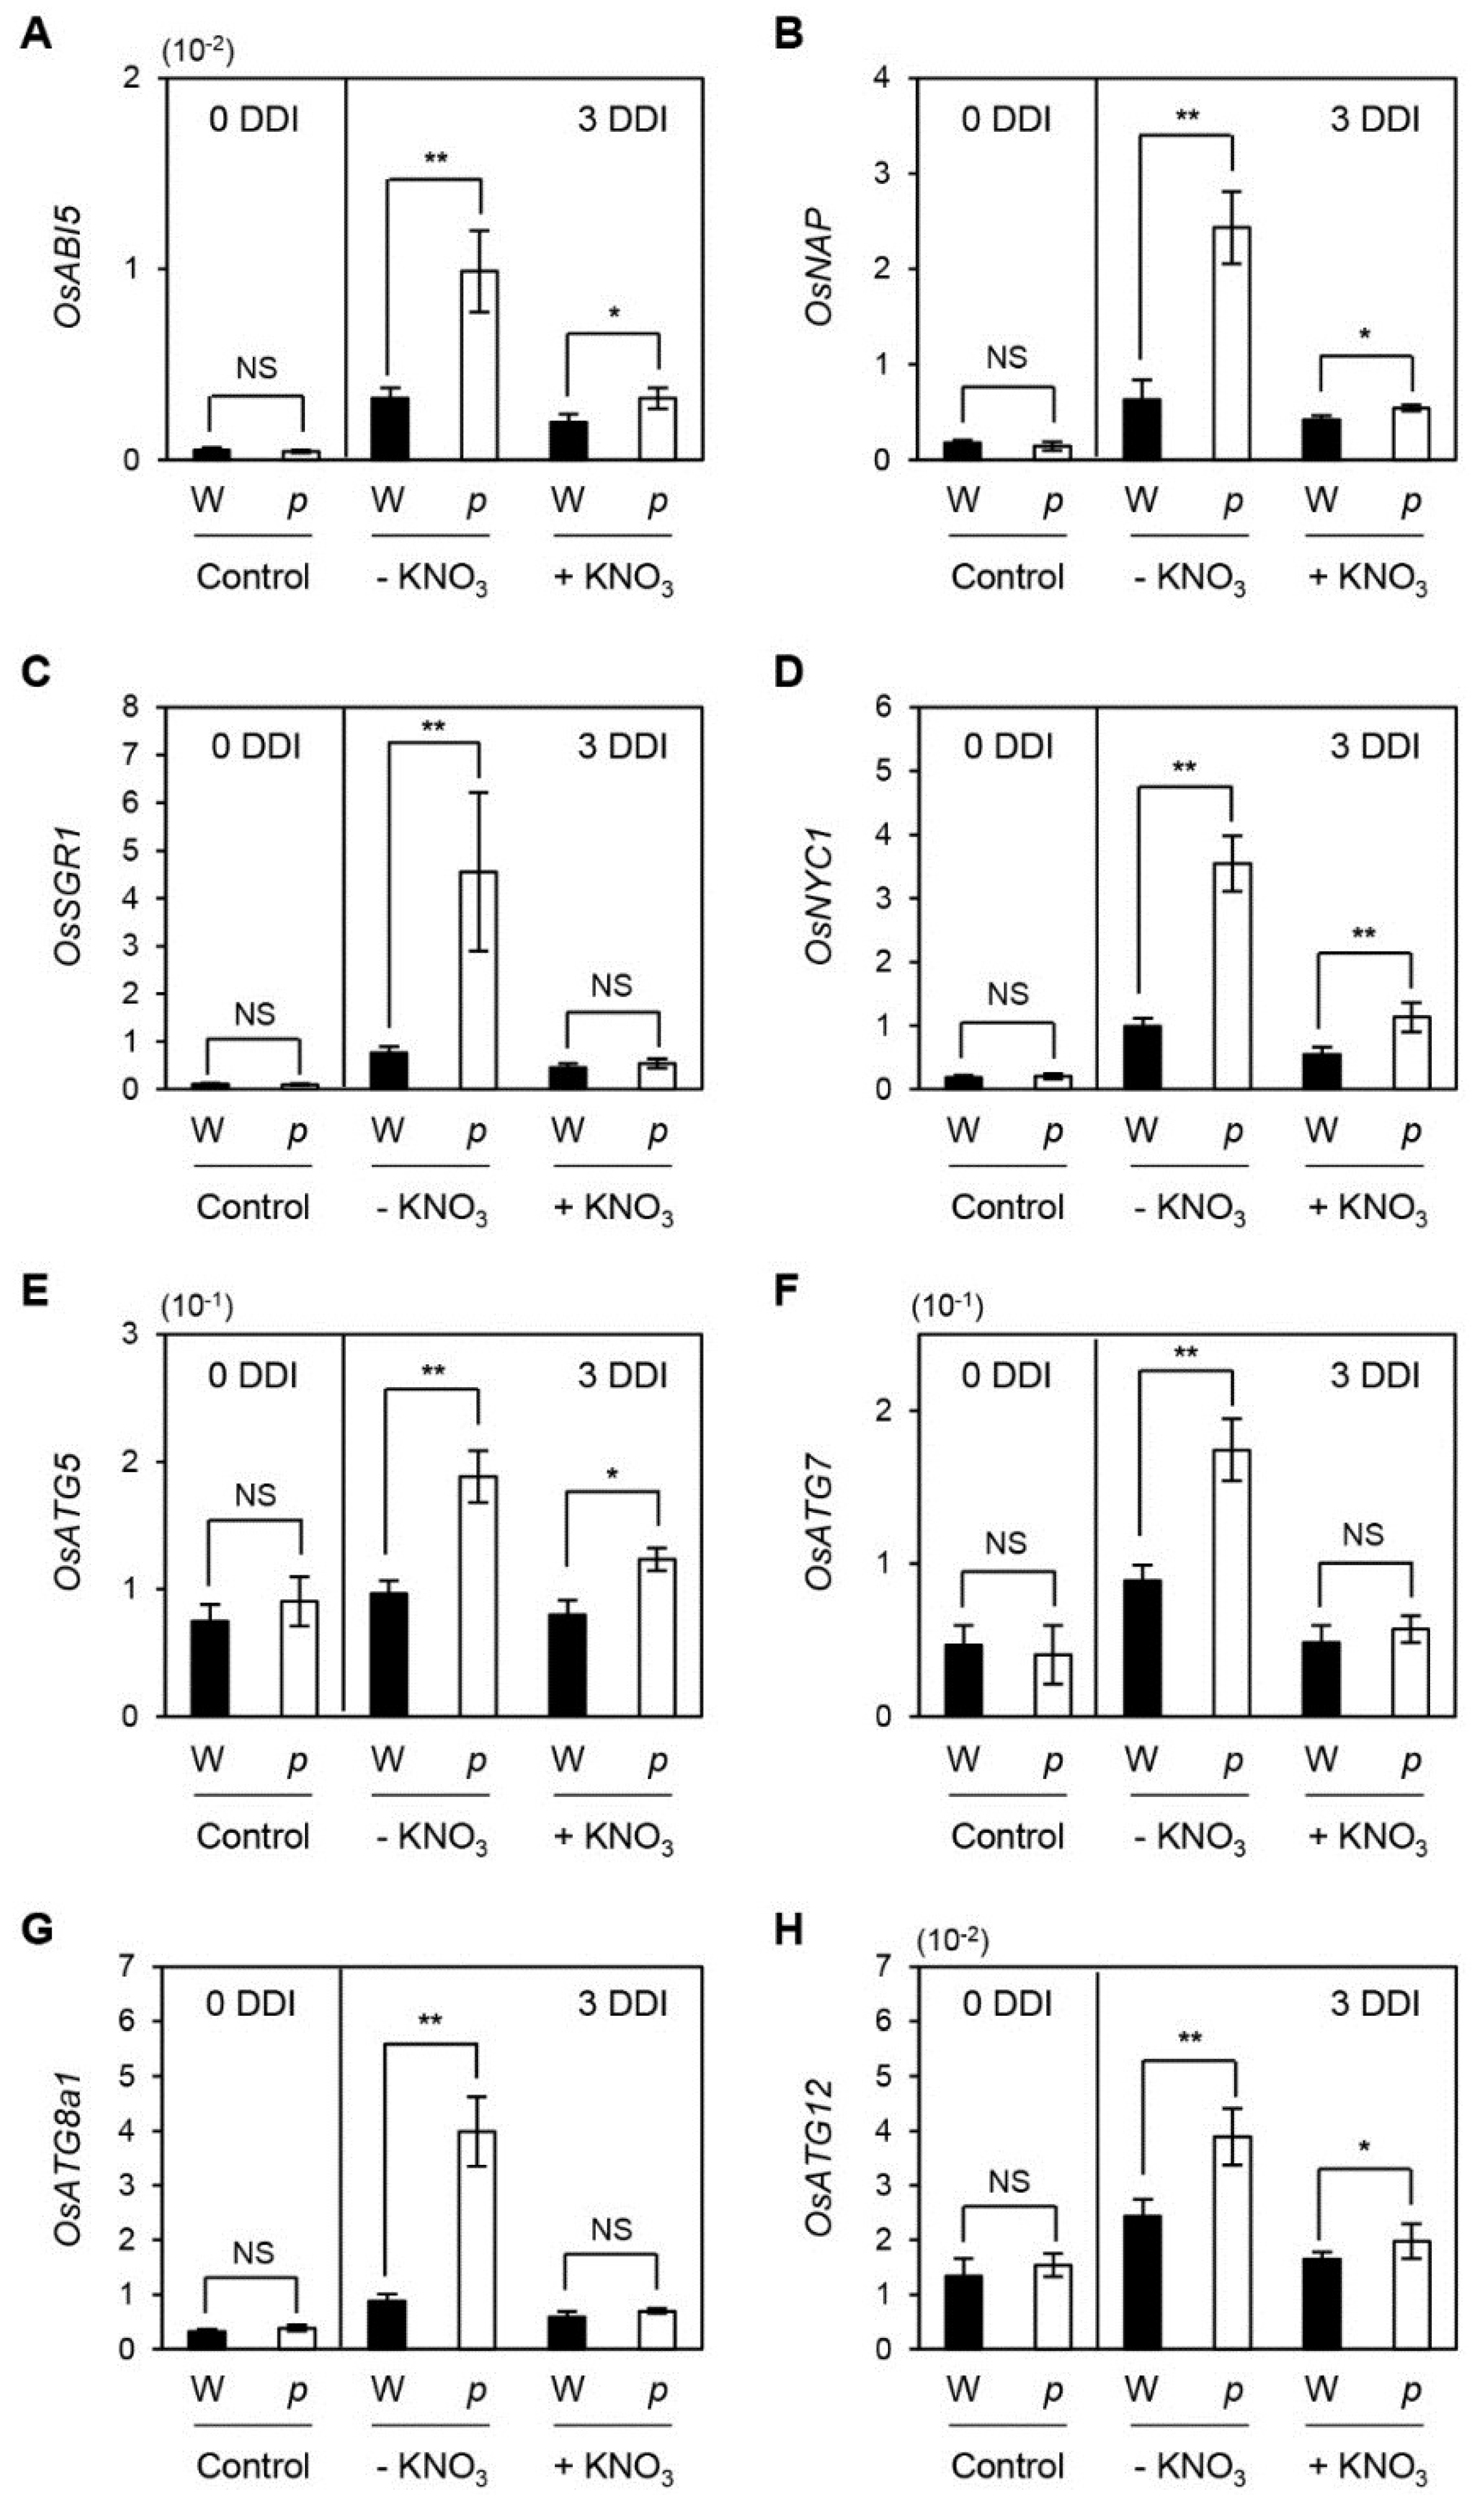
2.4. The Early Senescence Phenotype of osphyB-2 Mutants Was Recovered by Supplementation with Nitrogen Compounds

Starvation appears to be closely related to the early senescence phenotype of osphyB-2 mutants (Figure 3). To examine this possibility, we looked at the senescence phenotype of detached leaf segments of WT and osphyB-2 plants in 3 mM MES buffer supplemented with Murashige-Skoog (MS) medium (2.3 g/L), a mixture of nutrients that are essential for plant growth [34]. As we expected, incubation in MS medium rescued the early senescence phenotype and low Chl levels of osphyB-2 leaves in the light (Figure 4A,B).
Figure 4. Early senescence phenotype of osphyB-2 was rescued by supplementation with nitrogen compounds. Detached leaf segments from one-month-old WT and osphyB-2 plants grown under LD conditions were transferred to the 3 mM MES (pH 5.8) buffer only or supplemented with MS (2.3 g/L), NH4KO3 (1.65 g/L), or KNO3 (1.9 g/L), and incubated with the abaxial side up at 28 °C under continuous light for 7 days. The changes of phenotype (A) and total Chl level (B) in the leaf segments of WT and osphyB-2 in each condition was observed and compared with the MES control; (B) Black and white bars indicate WT and osphyB-2, respectively. Mean and SD values were obtained from more than five biological replicates. Asterisks indicate significant difference between WT and osphyB-2 (Student’s t-test p values, * p < 0.05; ** p < 0.01). NS, not significant; DLI, day(s) of light incubation.
Plants 04 00644 g004
MS medium contains a variety of essential nutrients for plant tissue culture, including the macronutrients nitrogen (NH4NO3 and KNO3), calcium (CaCl2), magnesium (MgSO4), and phosphorous (KH2PO4), and the micronutrients boron (H3BO3), cobalt (CoCl), copper (CuSO4), iron (FeSO4), manganese (MnSO4), iodine (KI), molybdenum (Na2MoO4), and zinc (ZnSO4), as well as the vitamins and organics i-inositol, niacin, pyridoxine, glycine, and thiamine [34]. To determine which component of MS medium causes the recovery of the early senescence phenotype of osphyB-2, we checked the senescence phenotype of osphyB-2 leaves in 3 mM MES buffer containing each component under light conditions. We found that, among these components, the early senescence phenotype of osphyB-2 was considerably recovered by supplementation with the two nitrogen compounds, KNO3 and NH4NO3 (Figure 4A,B, Supplemental Figure 6), but the phenotype was not recovered by supplementation with other important nutrients, such as i-Inositol or glycine [34]. In addition, we also confirmed the recovery of the early senescence phenotype of osphyB-2 by the supplementation with KNO3 during DIS (Supplemental Figure 7), indicating that the signaling of nitrogen nutritional status has an important role in the regulation of OsPhyB-dependent leaf senescence.
We subsequently examined whether the up-regulation of SAGs in osphyB-2 leaves during senescence is recovered by supplementation with nitrogen compounds. Consistent with the results of Figure 2, four SAGs (OsNAP, OsABI5, OsSGR1, and OsNYC1) were significantly up-regulated in osphyB-2 leaves during dark incubation, but this increase of SAG mRNA levels was suppressed by supplementation with KNO3 (Figure 5A–D). We also checked the transcript levels of genes associated with autophagy, which is considered to function independently from the SGR-dependent Chl and chloroplast degradation pathways [35]. The expression levels of rice AUTOPHAGY5 (OsATG5), OsATG7, OsATG8a, and OsATG12 drastically increased in osphyB-2 mutants during dark incubation without nitrogen supplementation (Figure 5E–H), indicating that OsPhyB regulates several key genes in the leaf senescence cascade, including Chl degradation and autophagy, and that nitrogen deficiency signaling partially overrules OsPhyB-dependent leaf senescence.

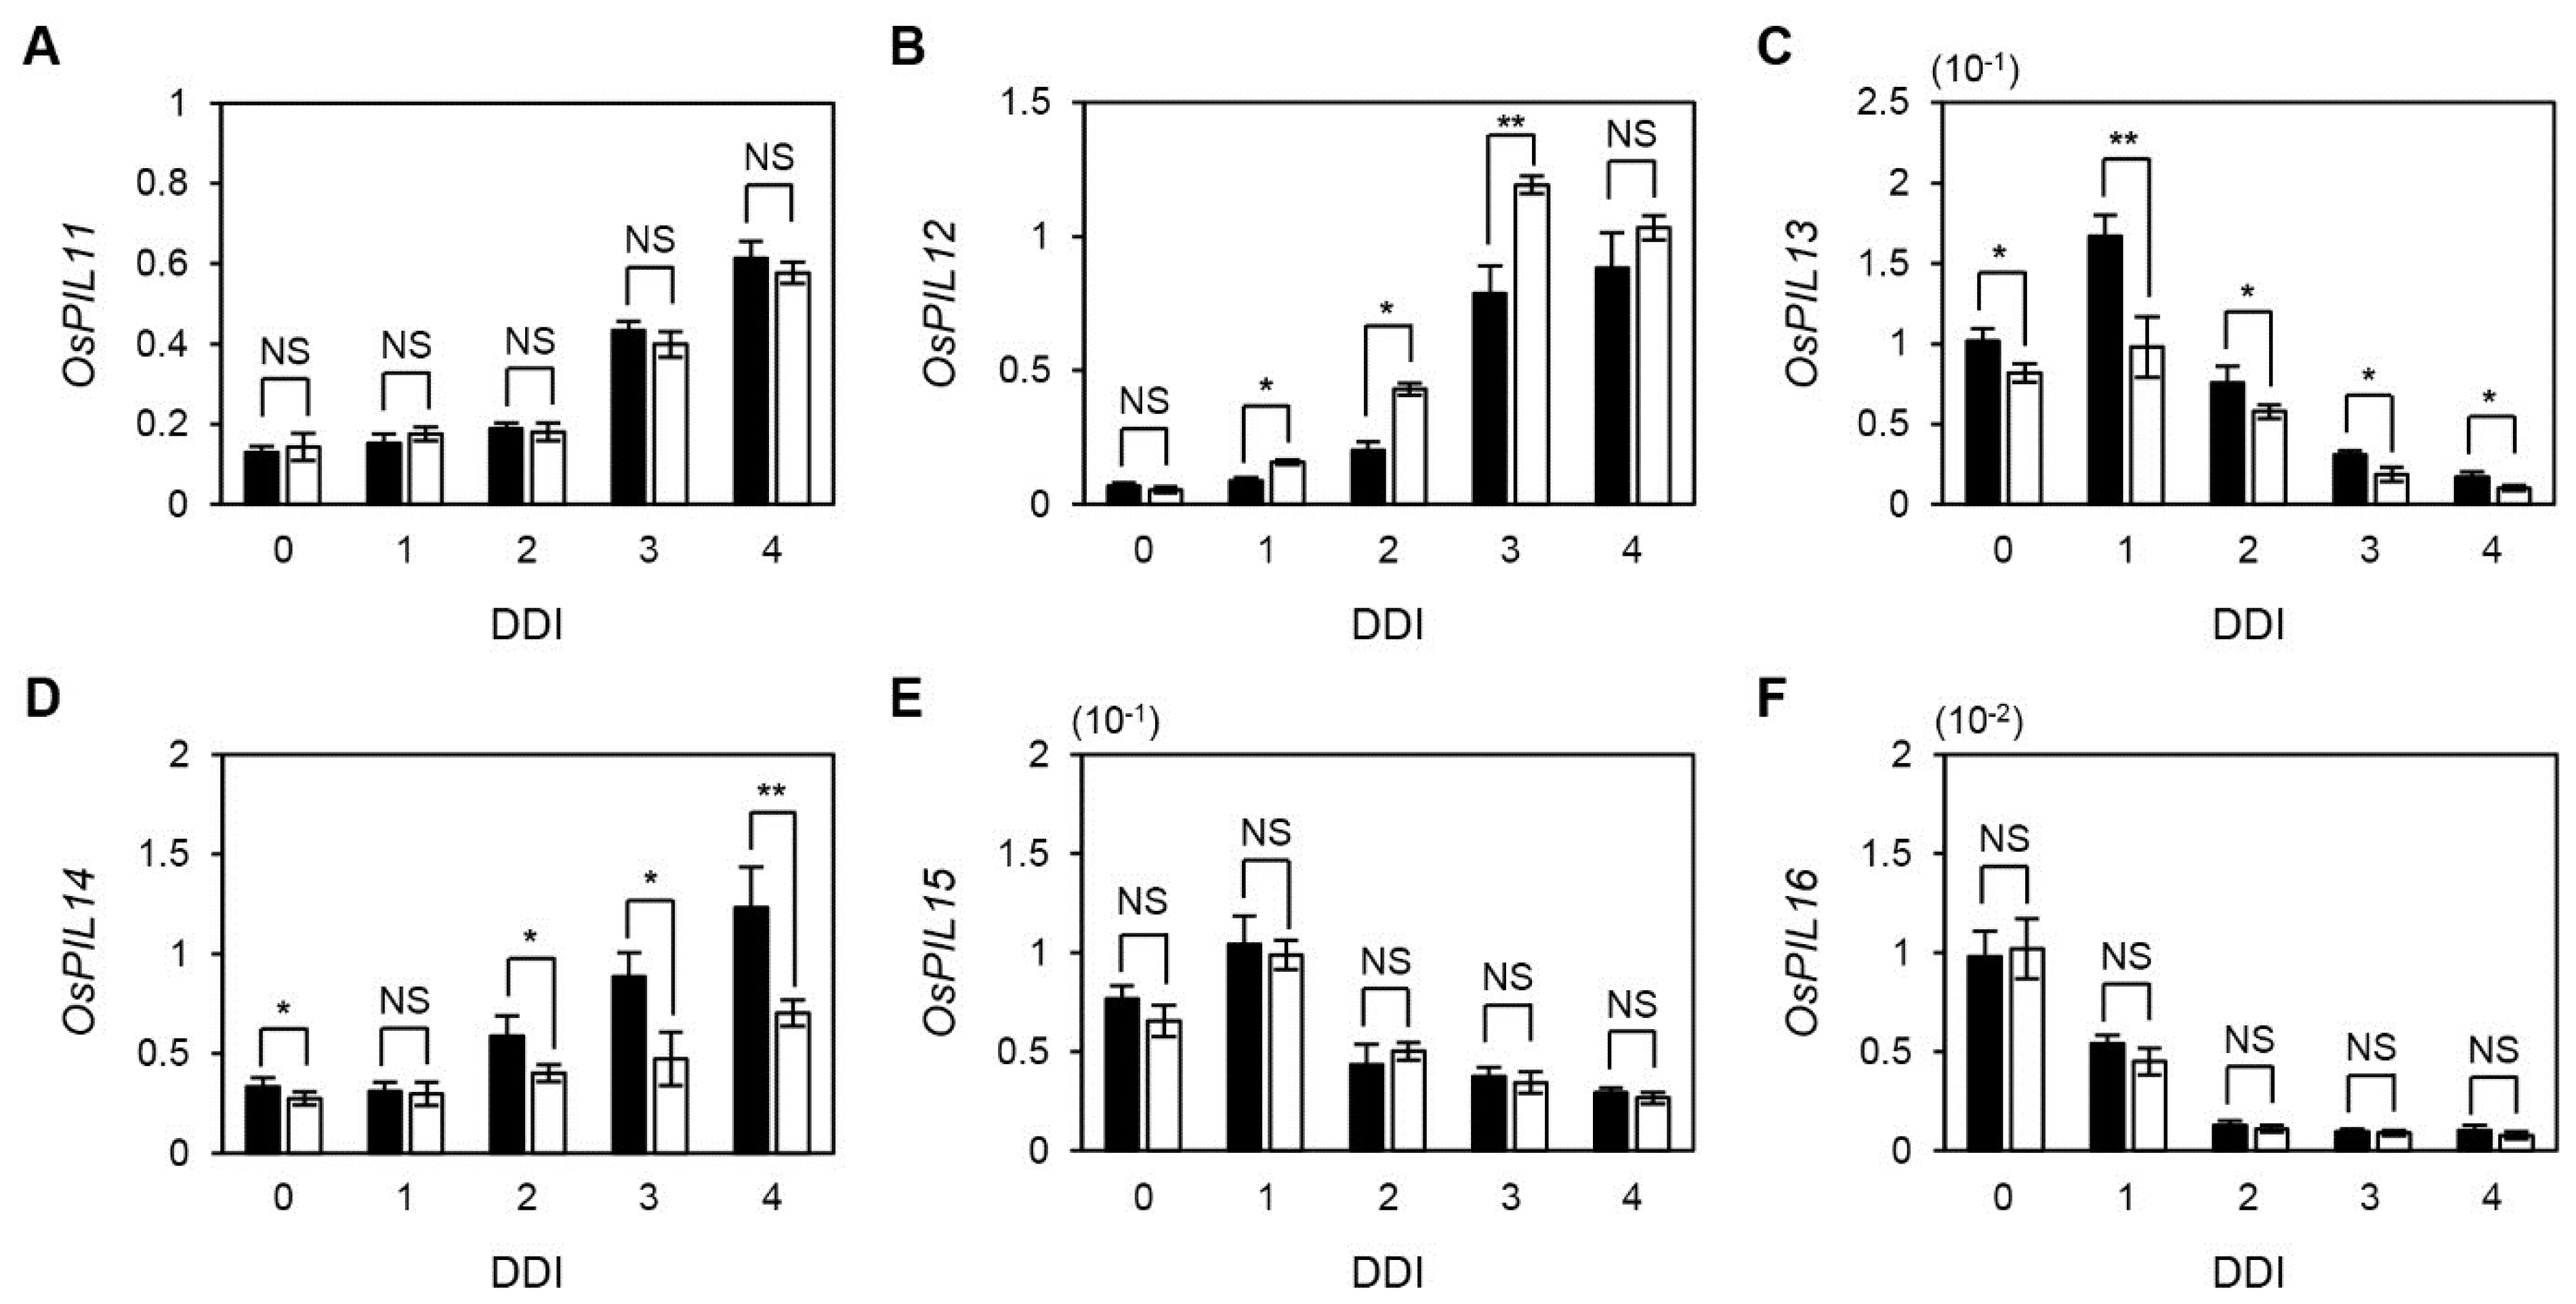
2.5. The Expression of OsPIF TFs during Senescence

Study of the PhyB-dependent leaf senescence pathway will require identification of downstream PIF components. We previously showed that in Arabidopsis, PhyB regulates PIF4 and PIF5 at the post-translational level [17]. Furthermore, Song et al. (2014) showed that Arabidopsis PIF3 is also involved in inducing leaf senescence [21]. Thus, KO mutants of each of the three PIFs showed a delayed senescence phenotype, while OX plants senesced early under both DIS and natural senescence conditions [17,21]. The expression levels of the three PIFs also significantly increased during DIS or natural senescence conditions [17,21]. However, Arabidopsis PIF1 is not involved in leaf senescence, because we found that pif1-KO mutants did not show any senescence phenotype during DIS [17]. We found by RT-qPCR analysis that the expression of PIF1 is significantly down-regulated during DIS (Supplemental Figure 8). Thus, we found that examination of the expression levels of PIF genes during senescence is a useful approach for identification of senescence-associated PIF genes.
Figure 5. Up-regulation of SAGs in osphyB-2 mutants during DIS rescued by supplementation with KNO3. Detached leaf segments from one-month-old WT (W; black bars) and osphyB-2 (p; white bars) plants grown under LD conditions were floated on the 3 mM MES (pH 5.8) buffer without (−KNO3) or with 1.9 g/L KNO3 (+KNO3), with the abaxial side up at 28 °C in darkness, and were sampled at 0 (control) and 3 DDI for RT-qPCR. RT-qPCR analysis was used to measure the relative transcript levels of OsABI5 (A); OsNAP (B); OsSGR1 (C); OsNYC1 (D); OsATG5 (E); OsATG7 (F); OsATG8a1 (G); and OsATG12 (H); and their transcript levels were normalized to the transcript levels of OsUBQ5. Mean and SD values were obtained from more than three biological replicates. These experiments were repeated twice with similar results. Asterisks indicate significant difference between WT and osphyB-2 (Student’s t-test p values, * p < 0.05; ** p < 0.01). DDI, day(s) of dark incubation; NS, not significant.
Plants 04 00644 g005
Previous phylogenetic analysis revealed that four rice PIFs, OsPIL11 (Os12g0610200), OsPIL12 (Os03g0639300), OsPIL13 (Os03g0782500), and OsPIL14 (Os07g143200), have high amino acid sequence similarity to Arabidopsis PIF4 and PIF5, and two rice PIFs, OsPIL15 (Os01g0286100) and OsPIL16 (Os05g0139100), have high similarity to Arabidopsis PIF3 [36]. Thus, these rice PIFs may be functional homologs of Arabidopsis PIF3, PIF4, and PIF5 (hereafter Arabidopsis senPIFs). Indeed, Arabidopsis transgenic plants overexpressing OsPIL11, OsPIL12, OsPIL13, OsPIL14, or OsPIL15 exhibited a long hypocotyl phenotype [36], similar to PIF3-, PIF4-, and PIF5-OX plants [37,38].
Thus, we first checked the expression of these six OsPIF genes during DIS. The transcript levels of OsPIL11, OsPIL12, and OsPIL14 continuously increased until 4 DDI (Figure 6A,B,D). The expression peaks of OsPIL13 and OsPIL15 were at 1 DDI and their expression levels gradually decreased afterward (Figure 6C,E). In contrast, the expression levels of OsPIL16 drastically decreased until 4 DDI (Figure 6F), similar to the expression pattern of Arabidopsis PIF1 (Supplemental Figure 8). Interestingly, OsPIL12 was up-regulated, while OsPIL13 and OsPIL14 were down-regulated in osphyB-2 during DIS (Figure 6B–D), similar to Arabidopsis PHYTOCHROME-INTERACTING FACTOR 3-LIKE 1 (PIL1), as reported previously [17].
Figure 6. Expression of six rice PIF genes during DIS. Detached leaf segments from one-month-old WT and osphyB-2 plants grown under LD conditions were incubated on the 3 mM MES (pH 5.8) buffer with the abaxial side up at 28 °C in darkness, and were sampled at 0 to 4 DDI for RT-qPCR. RT-qPCR was used to measure the relative transcript levels of OsPIL11 (A); OsPIL12 (B); OsPIL13 (C); OsPIL14 (D); OsPIL15 (E); and OsPIL16 (F); and transcript levels were normalized to the transcript levels of OsUBQ5. Black and white bars indicate WT and osphyB-2, respectively. Mean and SD values were obtained from more than three biological replicates. Asterisks indicate significant difference between WT and osphyB-2 (Student’s t-test p values, * p < 0.05; ** p < 0.01). These experiments were repeated twice with similar results. DDI, day(s) of dark incubation; NS, not significant.
Plants 04 00644 g006
We also checked the expression levels of these six OsPIF genes in senescent leaves. Consistent with the results under DIS conditions, OsPIL11, OsPIL12, OsPIL13, and OsPIL14 were expressed at higher levels in senescent segments of leaves than that in non-senescent green segments of leaves (Supplemental Figure 9A–E). In contrast, the expression levels of OsPIL15 and OsPIL16 were higher in non-senescent segments (Supplemental Supplemental Figure 9F,G). Thus, we identified candidate senescence-associated PIF genes, such as OsPIL11, OsPIL12, OsPIL13, and OsPIL14, which are possibly functional homologs of Arabidopsis PIF3, PIF4, and PIF5 in leaf senescence signaling.

3. Discussion

We previously found the Arabidopsis PhyB-PIFs regulatory module of leaf senescence. PIF proteins are stable in the dark but rapidly degraded upon exposure to light; the active form of Phy (Pfr) promotes the light-dependent destabilization of PIFs, via the ubiquitin-26S proteasome pathway [39,40]. During DIS in Arabidopsis, PhyB changes to the inactive form (Pr), which cannot move to the nucleus. As a result, senescence-associated PIFs (PIF3, PIF4, and PIF5) increase, leading to the activation of regulatory cascades that induce leaf senescence [17,21]. Furthermore, PIF levels increase more in phyB null mutants than in WT; therefore, Arabidopsis phyB mutants exhibited an early senescence phenotype during DIS [17]. In this study, we found that osphyB-2 mutants senesced earlier during DIS (Figure 1), similar to the Arabidopsis phyB mutants [17], indicating that phyB-PIF also has an important role in the regulation of leaf senescence in rice.
In the Arabidopsis leaf senescence pathway regulated by PhyB-PIF, we previously identified several key downstream genes, including ORE1, EIN3, ABI5, EEL, SGR1, and NYC1 [17]. Furthermore, EIN3 directly activates NAP and ORE1 during leaf senescence [41]. In this study, we confirmed by RT-qPCR that rice homologs of these genes were significantly up-regulated during DIS (Figure 2), indicating that PhyB regulation of leaf senescence cascade is highly conserved in Arabidopsis and rice, although further examination of this pathway will require the identification of OsPhyB-regulated senPIFs. We found several key genes in PhyB-PIF-regulating leaf senescence cascade in both Arabidopsis and rice, but other SAGs may also participate in this regulatory network. In recent years, many SAGs (such as NAC and WRKY TFs, and genes associated with light signaling, Phy signaling, Chl degradation, and chloroplast maintenance) have been identified in Arabidopsis and other plant species [17,42,43,44]. Further identification of downstream genes of senPIFs will improve our understanding of the PhyB-PIF cascade regulating leaf senescence.
We found that the early senescence phenotype of osphyB-2 also occurred during starvation-induced senescence under continuous light conditions (Figure 3). Furthermore, the early senescence phenotype of osphyB-2 was rescued by supplementation of nitrogen compounds, such as KNO3 and NH4NO3, under both light and dark conditions (Figure 4; Supplemental Figure 7), indicating that nitrogen deficiency is one of the major signaling cascades in OsPhyB-dependent leaf senescence. Nitrogen is an essential macronutrient in plant growth and development and plants senesce earlier under low nitrogen conditions [39,40], because under nitrogen-limited conditions, plants have to save nitrogen for the development of storage tissues, such as seeds and sink organs. Conversely, supplying nitrogen can reverse the progress of senescence [45,46]. Balazadeh et al. (2014) reported that the levels of secondary metabolites (amino acids and sugars) and SAGs in the leaves of Arabidopsis changed dramatically under N-deficient conditions, but these changes were rapidly reversed following nitrogen supply [45]. In the case of osphyB-2 leaves, we first speculated that they have lower innate nitrogen levels compared with WT. In osphyB-2 leaves, however, the protein levels of RbcL, the largest nitrogen storage protein, which contains around 75% of the total nitrogen in plants [47], was almost the same as in WT leaves (Figure 3). Thus, nitrogen signaling has an important role in OsPhyB-dependent DIS and starvation-induced senescence in the light, although it is possible that other metabolites and/or transcriptional signaling pathways also affect these phenotypes.
In this study, we also examined the expression of six OsPIFs during DIS and in naturally senescing leaves to identify candidate senPIF genes in rice (Figure 6 and Supplemental Figure 9). Expression of OsPIL13 showed the most similarity to expression of Arabidopsis senPIFs. Similar to OsPIL13, in Arabidopsis three senPIFs rapidly increased in early DIS and then gradually decreased [17,21], indicating that senPIFs have an important role in the early stages of DIS. The OsPIL13 expression level is also controlled by circadian rhythm [36], similar to the expression of Arabidopsis PIF4 and PIF5 [48,49]. The expression patterns of OsPIL11, OsPIL12, and OsPIL14 differed somewhat from those of OsPIL13 and Arabidopsis senPIFs. The mRNA levels of these three OsPILs continuously increased until 4 DDI (Figure 6). However, their expression levels were all higher in senescent segments of leaves. Thus, it is possible that four OsPIFs (OsPIL11, OsPIL12, OsPIL13, and OsPIL14) are involved in the leaf senescence cascade, like Arabidopsis senPIFs. Interestingly, expression levels of OsPIL12, OsPIL13, and OsPIL14 were differentially regulated in osphyB-2 during DIS (Figure 6), similar to the expression of PIF genes in Arabidopsis. For example, PIF4 and PIF5 directly regulate PIL1 expression [50]. Thus, PIL1 mRNA levels were much lower in pif1 pif3 pif4 pif5 quadruple mutants and much higher in phyB mutants, compared with WT, during DIS [17]. As in the case of Arabidopsis PIL1, it is possible that direct regulation by other OsPIFs causes the altered expression of OsPIL12, OsPIL13, and OsPIL14 in osphyB-2 mutants.
Isolation of KO mutants and OX plants of these OsPIFs will provide essential information to elucidate their physiological functions, but so far related reports remain very limited. One of these reports describes the development and phenotypic analysis of rice transgenic plants overexpressing OsPIL13 ([51]; it was termed OsPIL1 in this reference). OsPIL13-OX plants showed increased internode elongation, caused by differences in cell size. Microarray analysis revealed that expression of some cell wall-related genes, which are responsible for cell elongation, increased in OsPIL13-OX plants [51]. They also found that the expression of OsPIL13 dramatically decreased under drought and cold stress conditions [51], indicating that OsPIL13 has an important role in cell elongation and abiotic stress responses. This function of OsPIL13 is similar to the functions of Arabidopsis PIF3, PIF4, and PIF5; their OX plants show a long-hypocotyl phenotype [37,38] and their knockout mutants show a short-hypocotyl phenotype [52]. Thus, OsPIL13 could act as a senescence-regulating TF, similar to Arabidopsis PIF3, PIF4, and PIF5 [17,21]. In addition to cell elongation and leaf senescence, Arabidopsis PIFs also regulate other biological events, including de-etiolation, flowering time, Phy responses, and stress responses [5,17,48,53,54,55]. Isolation and analyses of mutants and OX plants of OsPIF genes will help elucidate the multiple functions of OsPIFs in rice development.

4. Experimental Section

4.1. Plant Materials and Growth Conditions

The WT japonica rice cultivar “Dongjin” and osphyB-2 mutants were grown in the growth chamber under LD conditions (14-h light/day) or in the paddy field under natural long days (>14 h light/day) in Suwon, South Korea (37° N latitude). The T-DNA insertion osphyB-1 (PFG_2D-20484.R), osphyB-2 (PFG_4A-02226.R) and osphyA-3 (PFG_3A-16812.R) mutants were obtained from the Crop Biotech Institute at Kyung Hee University, Korea [56,57].

4.2. DIS and Starvation-Induced Senescence Treatments

For the DIS and starvation-induced senescence experiments, we used whole plants or detached leaf segments at an early, vegetative phase when the plants are one-month old, about two months before the heading date of osphyB mutants. For the DIS experiments using whole plants, 4-week-old WT and osphyB-2 plants were incubated in complete darkness on 3 mM MES (pH 5.8) buffer. In addition, detached leaf segments from 1-month-old plants grown under LD conditions were incubated on 3 mM MES (pH 5.8) buffer with the abaxial side up at 28 °C in complete darkness for DIS or in the light for starvation-induced senescence. The 3 mM MES buffer (pH 5.8) containing MS (2.3 g/L), NH4KO3 (1.65 g/L), or KNO3 (1.9 g/L) were used for the recovery assay of DIS and starvation-induced senescence.

4.3. Chl Quantification

For the measurement of total Chl levels, pigments were extracted from leaf tissues with 80% ice-cold acetone. Chl concentrations were determined by spectrophotometry as described previously [58].

4.4. Measurement of Ion Leakage Rate

Ion leakage rate was measured as previously described [27]. Briefly, membrane leakage was determined by measurement of electrolytes (or ions) leaking from rice leaf segments (1 cm2). Three leaf segments from each treatment were immersed in 6 mL of 0.4 M mannitol at room temperature with gentle shaking for 3 h, and initial conductivity of the solution was measured with a conductivity meter (CON 6 METER, LaMotte Co., Chestertown, MD, USA). Total conductivity was determined after sample incubation at 85 °C for 20 min. The ion leakage rate was expressed as the percentage of initial conductivity divided by total conductivity.

4.5. Transmission Electron Microscopy

To perform transmission electron microscopy, a previously described method [59] was used with some modifications. Small leaf pieces were fixed with modified Karnovsky’s fixative (2% paraformaldehyde, 2% glutaraldehyde, and 50 mM sodium cacodylate buffer, pH 7.2). After this, samples were washed with 0.05 M sodium cacodylate buffer, pH 7.2 three times at 4 °C for 10 min. The samples were post-fixed at 4 °C for 2 h with 1% osmium tetroxide in 50 mM sodium cacodylate buffer, pH 7.2, and washed twice with distilled water at room temperature. Samples were stained en bloc in 0.5% uranyl acetate at 4 °C overnight and dehydrated in an ethanol gradient with propylene oxide, then infiltrated with Spurr’s resin. Samples were polymerized at 70 °C for 24 h and sectioned with an ultramicrotome (MT-X). The sections were mounted on copper grids, and stained with 2% uranyl acetate for 7 min and with Reynolds’ lead citrate for 7 min. Micrographs were made using a LIBRA 120 transmission electron microscope.

4.6. SDS-PAGE and Immunoblot Analysis

Protein extracts were prepared from leaf tissues. To extract total proteins, leaf tissues were ground in liquid nitrogen and 10 mg aliquots were homogenized with 100 μL of sample buffer (50 mM Tris pH 6.8, 2 mM EDTA, 10% glycerol, 2% SDS, and 6% 2-mercaptoethanol). Homogenates were centrifuged at 10,000× g for 3 min, and supernatants were denatured at 80 °C for 5 min. 4 μL of each sample was subjected to 12% (w/v) polyacrylamide SDS-PAGE and resolved proteins were electroblotted onto a Hybond-P membrane (GE Healthcare). Antibodies against the photosystem proteins Lhcb1 and Lhca1 (Agrisera, Vannas, Sweden) were used for immunoblot analysis. The level of each protein was examined using the ECL system with WESTSAVE (AbFRONTIER, Seoul, Korea) according to the manufacturer’s protocol.

4.7. Reverse Transcription and Quantitative Real-Time PCR (RT-qPCR) Analysis

Total RNA was extracted from 4-week-old plants with the MG Total RNA Extraction Kit (Macrogen, Korea). First-strand cDNAs were synthesized with 2 μg of total RNA in a 25 µL volume using M-MLV reverse transcriptase and oligo(dT)15 primer. The 20 µL of qPCR mixture contained 2 µL of the RT mixture, 10 µL of 2× Go Tag PCR mix (Roche) and 0.25 µL of the primers. The qPCR was performed on the Light Cycler 2.0 (Roche Diagnostics, Basel, Switzerland). The qPCR conditions were 95 °C for 2 min, followed by 45 cycles at 95 °C for 5 s, 59 °C for 15 s, and 72 °C for 10 s. RT-qPCR analysis was used to measure the relative transcript levels of genes examined in this study, and the transcript levels were normalized to the transcript levels of OsUBQ5 (Os01g0328400). Primers used for RT-qPCR analysis are listed in Supplemental Table 1.

Supplementary Files

Supplementary File 1

Gene Information

Sequence data from this article can be found in the National Center for Biotechnology Information (NCBI): OsABI5, Os01g0859300; OsATG5, Os02g0117800; OsATG7, Os01g0614900; OsATG8a1, Os07g0512200; OsATG12, Os06g0205000; OsEEL, Os07g0686100; OsEIN3, Os03g0324200; OsLhcb1, Os01g0601600; OsLhcb4, Os07g0558400; OsNAP, Os03g0327800; OsNYC1, Os01g0227100; OsORE1, Os04g0460600; OsPAO, Os03g0146400; OsSAG12, Os04g0208200; OsSGR, Os09g0532000; OsPhyA, Os03g0719800; OsPhyB; OsPIL11, Os12g0610200; OsPIL12, Os03g0639300; OsPIL13, Os03g0782500; OsPIL14, Os07g143200; OsPIL15, Os01g0286100; OsPIL16, Os05g0139100; OsSGRL, Os04g0692600; OsUBQ5, Os01g0328400.

Acknowledgments

We thank Gynheung An at Kyung Hee University for donating the T-DNA insertion mutant seeds of osphyB-1, osphyB-2, and osphyA-3. This work was carried out with the support of “Next-Generation BioGreen21 Program for Agriculture & Technology Development (PJ01107901 to N.-C.P)” and “National Research Foundation of Korea (500-20140212 to Y.-S.)”, funded by Korean government.

Author Contributions

Y.S. and N.-C.P. designed the study and supervised the work. W.P., E.-Y.K., S.-H.H., and Y.S. performed the experiments. W.P., Y.S., and N.-C.P. wrote the manuscript. All authors discussed the results and substantially contributed to this work.

Conflicts of Interest

The authors declare no conflict of interest.

References

  1. Chen, M.; Chory, J.; Fankhauser, C. Light signal transduction in higher plants. Annu. Rev. Genet. 2004, 38, 87–117. [Google Scholar] [CrossRef] [PubMed]
  2. Quail, P.H.; Boylan, M.T.; Parks, B.M.; Short, T.W.; Xu, Y.; Wagner, D. Phytochromes: Photosensory perception and signal transduction. Science 1995, 268, 675–680. [Google Scholar] [CrossRef] [PubMed]
  3. Borthwick, H.A.; Hendricks, S.B.; Parker, M.W.; Toole, E.H.; Toole, V.K. A reversible photoreaction controlling seed germination. Proc. Natl. Acad. Sci. USA 1952, 38, 662–666. [Google Scholar] [CrossRef] [PubMed]
  4. Bae, G.; Choi, G. Decoding of light signals by plant phytochromes and their interacting proteins. Annu. Rev. Plant Biol. 2008, 59, 281–311. [Google Scholar] [CrossRef] [PubMed]
  5. Castillon, A.; Shen, H.; Huq, E. Phytochrome interacting factors: Central players in phytochrome-mediated light signaling networks. Trends Plant Sci. 2007, 12, 514–521. [Google Scholar] [CrossRef] [PubMed]
  6. Matsushita, T.; Mochizuki, N.; Nagatani, A. Dimers of the N-terminal domain of phytochrome B are functional in the nucleus. Nature 2003, 424, 571–574. [Google Scholar] [CrossRef] [PubMed]
  7. Rockwell, N.C.; Lagarias, J.C. The structure of phytochrome: A picture is worth a thousand spectra. Plant Cell 2006, 18, 4–14. [Google Scholar] [CrossRef] [PubMed]
  8. Franklin, K.A.; Quail, P.H. Phytochrome functions in Arabidopsis development. J. Exp. Bot. 2010, 61, 11–24. [Google Scholar] [CrossRef] [PubMed]
  9. Kay, S.A.; Keith, B.; Shinozaki, K.; Chua, N.H. The sequence of the rice phytochrome gene. Nucleic Acids Res. 1989, 17, 2865–2866. [Google Scholar] [CrossRef] [PubMed]
  10. Jeong, D.H.; Lee, S.; Kim, S.L.; Hwang, I.; An, G. Regulation of brassinosteroid responses by phytochrome B in rice. Plant Cell Environ. 2007, 30, 590–599. [Google Scholar] [CrossRef] [PubMed]
  11. Takano, M.; Inagaki, N.; Xie, X.; Yuzurihara, N.; Hihara, F.; Ishizuka, T.; Yano, M.; Nishimura, M.; Miyao, A.; Hirochika, H.; et al. Distinct and cooperative functions of phytochromes A, B, and C in the control of deetiolation and flowering in rice. Plant Cell 2005, 17, 3311–3325. [Google Scholar] [CrossRef] [PubMed]
  12. Smith, H.; Xu, Y.; Quail, P.H. Antagonistic but complementary actions of phytochromes A and B allow seedling de-etiolation. Plant Physiol. 1997, 114, 637–641. [Google Scholar] [CrossRef] [PubMed]
  13. Tepperman, J.M.; Hudson, M.E.; Khanna, R.; Zhu, T.; Chang, S.H.; Wang, X.; Quail, P.H. Expression profiling of phyB mutant demonstrates substantial contribution of other phytochromes to red-light-regulated gene expression during seedling de-etiolation. Plant J. 2004, 38, 725–739. [Google Scholar] [CrossRef] [PubMed]
  14. Shinomura, T.; Nagatani, A.; Hanzawa, H.; Kubota, M.; Watanabe, M.; Furuya, M. Action spectra for phytochrome A- and B-specific photoinduction of seed germination in Arabidopsis thaliana. Proc. Natl. Acad. Sci. USA 1996, 93, 8129–8133. [Google Scholar] [CrossRef] [PubMed]
  15. Halliday, K.J.; Koornneef, M.; Whitelam, G.C. Phytochrome B and at least one other phytochrome mediate the accelerated flowering response of Arabidopsis thaliana L. to low red/far-red ratio. Plant Physiol. 1994, 104, 1311–1315. [Google Scholar] [PubMed]
  16. Childs, K.L.; Miller, F.R.; Cordonnier-Pratt, M.M.; Pratt, L.H.; Morgan, P.W.; Mullet, J.E. The sorghum photoperiod sensitivity gene, Ma3, encodes a phytochrome B. Plant Physiol. 1997, 113, 611–619. [Google Scholar] [CrossRef] [PubMed]
  17. Sakuraba, Y.; Jeong, J.; Kang, M.Y.; Kim, J.; Paek, N.C.; Choi, G. Phytochrome-interacting transcription factors PIF4 and PIF5 induce leaf senescence in Arabidopsis. Nat. Commun. 2014, 5, 4636. [Google Scholar] [CrossRef] [PubMed]
  18. Kim, J.H.; Woo, H.R.; Kim, J.; Lim, P.O.; Lee, I.C.; Choi, S.H.; Hwang, D.; Nam, H.G. Trifurcate feed-forward regulation of age-dependent cell death involving miR164 in Arabidopsis. Science 2009, 323, 1053–1057. [Google Scholar] [CrossRef] [PubMed]
  19. Li, Z.; Peng, J.; Wen, X.; Guo, H. Ethylene-insensitive3 is a senescence-associated gene that accelerates age-dependent leaf senescence by directly repressing miR164 transcription in Arabidopsis. Plant Cell 2013, 25, 3311–3328. [Google Scholar] [CrossRef] [PubMed]
  20. Choi, H.; Hong, J.; Ha, J.; Kang, J.; Kim, S.Y. ABFs, a family of aba-responsive element binding factors. J. Biol. Chem. 2000, 275, 1723–1730. [Google Scholar] [CrossRef] [PubMed]
  21. Song, Y.; Yang, C.; Gao, S.; Zhang, W.; Li, L.; Kuai, B. Age-triggered and dark-induced leaf senescence require the bHLH transcription factors PIF3, 4, and 5. Mol. Plant 2014, 7, 1776–1787. [Google Scholar] [CrossRef] [PubMed]
  22. Gu, J.-W.; Liu, J.; Xue, Y.-J.; Zang, X.; Xie, X.-Z. Functions of phytochrome in rice growth and development. Rice Sci. 2011, 18, 231–237. [Google Scholar] [CrossRef]
  23. Takano, M.; Inagaki, N.; Xie, X.; Kiyota, S.; Baba-Kasai, A.; Tanabata, T.; Shinomura, T. Phytochromes are the sole photoreceptors for perceiving red/far-red light in rice. Proc. Natl. Acad. Sci. USA 2009, 106, 14705–14710. [Google Scholar] [CrossRef] [PubMed]
  24. Ren, G.; An, K.; Liao, Y.; Zhou, X.; Cao, Y.; Zhao, H.; Ge, X.; Kuai, B. Identification of a novel chloroplast protein atnye1 regulating chlorophyll degradation during leaf senescence in Arabidopsis. Plant Physiol. 2007, 144, 1429–1441. [Google Scholar] [CrossRef] [PubMed]
  25. Horie, Y.; Ito, H.; Kusaba, M.; Tanaka, R.; Tanaka, A. Participation of chlorophyll b reductase in the initial step of the degradation of light-harvesting chlorophyll a/b-protein complexes in Arabidopsis. J. Biol. Chem. 2009, 284, 17449–17456. [Google Scholar] [CrossRef] [PubMed]
  26. Kusaba, M.; Ito, H.; Morita, R.; Iida, S.; Sato, Y.; Fujimoto, M.; Kawasaki, S.; Tanaka, R.; Hirochika, H.; Nishimura, M.; et al. Rice NON-YELLOW COLORING1 is involved in light-harvesting complex ii and grana degradation during leaf senescence. Plant Cell 2007, 19, 1362–1375. [Google Scholar] [CrossRef] [PubMed]
  27. Lee, S.H.; Sakuraba, Y.; Lee, T.; Kim, K.W.; An, G.; Lee, H.Y.; Paek, N.C. Mutation of Oryza sativa CORONATINE INSENSITIVE 1b (OsCOI1b) delays leaf senescence. J. Integr. Plant Biol. 2015, 57, 562–576. [Google Scholar] [CrossRef] [PubMed]
  28. Park, S.Y.; Yu, J.W.; Park, J.S.; Li, J.; Yoo, S.C.; Lee, N.Y.; Lee, S.K.; Jeong, S.W.; Seo, H.S.; Koh, H.J.; et al. The senescence-induced staygreen protein regulates chlorophyll degradation. Plant Cell 2007, 19, 1649–1664. [Google Scholar] [CrossRef] [PubMed]
  29. Liang, C.; Wang, Y.; Zhu, Y.; Tang, J.; Hu, B.; Liu, L.; Ou, S.; Wu, H.; Sun, X.; Chu, J.; et al. OsNAP connects abscisic acid and leaf senescence by fine-tuning abscisic acid biosynthesis and directly targeting senescence-associated genes in rice. Proc. Natl. Acad. Sci. USA 2014, 111, 10013–10018. [Google Scholar] [CrossRef] [PubMed]
  30. Tang, Y.; Li, M.; Chen, Y.; Wu, P.; Wu, G.; Jiang, H. Knockdown of OsPAO and OsRCCR1 cause different plant death phenotypes in rice. J. Plant Physiol. 2011, 168, 1952–1959. [Google Scholar] [CrossRef] [PubMed]
  31. Rong, H.; Tang, Y.; Zhang, H.; Wu, P.; Chen, Y.; Li, M.; Wu, G.; Jiang, H. The Stay-Green Rice like (SGRL) gene regulates chlorophyll degradation in rice. J. Plant Physiol. 2013, 170, 1367–1373. [Google Scholar] [CrossRef] [PubMed]
  32. Kim, Y.S.; Sakuraba, Y.; Han, S.H.; Yoo, S.C.; Paek, N.C. Mutation of the Arabidopsis NAC016 transcription factor delays leaf senescence. Plant Cell Physiol. 2013, 54, 1660–1672. [Google Scholar] [CrossRef] [PubMed]
  33. Xiao, S.; Gao, W.; Chen, Q.F.; Chan, S.W.; Zheng, S.X.; Ma, J.; Wang, M.; Welti, R.; Chye, M.L. Overexpression of Arabidopsis acyl-CoA binding protein ACBP3 promotes starvation-induced and age-dependent leaf senescence. Plant Cell 2010, 22, 1463–1482. [Google Scholar] [CrossRef] [PubMed]
  34. Murashige, T.; Skoog, F. A revised medium for rapid growth and bio assays with tobacco tissue cultures. Physiol. Plant. 1962, 15, 473–497. [Google Scholar] [CrossRef]
  35. Sakuraba, Y.; Lee, S.H.; Kim, Y.S.; Park, O.K.; Hortensteiner, S.; Paek, N.C. Delayed degradation of chlorophylls and photosynthetic proteins in Arabidopsis autophagy mutants during stress-induced leaf yellowing. J. Exp. Bot. 2014, 65, 3915–3925. [Google Scholar] [CrossRef] [PubMed]
  36. Nakamura, Y.; Kato, T.; Yamashino, T.; Murakami, M.; Mizuno, T. Characterization of a set of phytochrome-interacting factor-like bHLH proteins in Oryza sativa. Biosci. Biotechnol. Biochem. 2007, 71, 1183–1191. [Google Scholar] [CrossRef] [PubMed]
  37. Niwa, Y.; Yamashino, T.; Mizuno, T. The circadian clock regulates the photoperiodic response of hypocotyl elongation through a coincidence mechanism in Arabidopsis thaliana. Plant Cell Physiol. 2009, 50, 838–854. [Google Scholar] [CrossRef] [PubMed]
  38. Oh, E.; Kim, J.; Park, E.; Kim, J.I.; Kang, C.; Choi, G. PIL5, a phytochrome-interacting basic helix-loop-helix protein, is a key negative regulator of seed germination in Arabidopsis thaliana. Plant Cell 2004, 16, 3045–3058. [Google Scholar] [CrossRef] [PubMed]
  39. Bauer, D.; Viczian, A.; Kircher, S.; Nobis, T.; Nitschke, R.; Kunkel, T.; Panigrahi, K.C.; Adam, E.; Fejes, E.; Schafer, E.; et al. Constitutive photomorphogenesis 1 and multiple photoreceptors control degradation of phytochrome interacting factor 3, a transcription factor required for light signaling in Arabidopsis. Plant Cell 2004, 16, 1433–1445. [Google Scholar] [CrossRef] [PubMed]
  40. Park, E.; Kim, J.; Lee, Y.; Shin, J.; Oh, E.; Chung, W.I.; Liu, J.R.; Choi, G. Degradation of phytochrome interacting factor 3 in phytochrome-mediated light signaling. Plant Cell Physiol. 2004, 45, 968–975. [Google Scholar] [CrossRef] [PubMed]
  41. Kim, H.J.; Hong, S.H.; Kim, Y.W.; Lee, I.H.; Jun, J.H.; Phee, B.K.; Rupak, T.; Jeong, H.; Lee, Y.; Hong, B.S.; et al. Gene regulatory cascade of senescence-associated NAC transcription factors activated by ETHYLENE-INSENSITIVE2-mediated leaf senescence signalling in Arabidopsis. J. Exp. Bot. 2014, 65, 4023–4036. [Google Scholar] [CrossRef] [PubMed]
  42. Kusaba, M.; Tanaka, A.; Tanaka, R. Stay-green plants: What do they tell us about the molecular mechanism of leaf senescence. Photosynth. Res. 2013, 117, 221–234. [Google Scholar] [CrossRef] [PubMed]
  43. Meng, Y.; Li, H.; Wang, Q.; Liu, B.; Lin, C. Blue light-dependent interaction between cryptochrome2 and CIB1 regulates transcription and leaf senescence in soybean. Plant Cell 2013, 25, 4405–4420. [Google Scholar] [CrossRef] [PubMed]
  44. Thomas, H.; Ougham, H. The stay-green trait. J. Exp. Bot. 2014, 65, 3889–3900. [Google Scholar] [CrossRef] [PubMed]
  45. Balazadeh, S.; Schildhauer, J.; Araujo, W.L.; Munne-Bosch, S.; Fernie, A.R.; Proost, S.; Humbeck, K.; Mueller-Roeber, B. Reversal of senescence by N resupply to N-starved Arabidopsis thaliana: Transcriptomic and metabolomic consequences. J. Exp. Bot. 2014, 65, 3975–3992. [Google Scholar] [CrossRef] [PubMed]
  46. Schildhauer, J.; Wiedemuth, K.; Humbeck, K. Supply of nitrogen can reverse senescence processes and affect expression of genes coding for plastidic glutamine synthetase and lysine-ketoglutarate reductase/saccharopine dehydrogenase. Plant Biol. 2008, 10, S76–S84. [Google Scholar] [CrossRef] [PubMed]
  47. Kant, S.; Bi, Y.M.; Rothstein, S.J. Understanding plant response to nitrogen limitation for the improvement of crop nitrogen use efficiency. J. Exp. Bot. 2011, 62, 1499–1509. [Google Scholar] [CrossRef] [PubMed]
  48. Fujimori, T.; Yamashino, T.; Kato, T.; Mizuno, T. Circadian-controlled basic/helix-loop-helix factor, PIL6, implicated in light-signal transduction in Arabidopsis thaliana. Plant Cell Physiol. 2004, 45, 1078–1086. [Google Scholar] [CrossRef] [PubMed]
  49. Yamashino, T.; Matsushika, A.; Fujimori, T.; Sato, S.; Kato, T.; Tabata, S.; Mizuno, T. A link between circadian-controlled bHLH factors and the APRR1/TOC1 quintet in Arabidopsis thaliana. Plant Cell Physiol. 2003, 44, 619–629. [Google Scholar] [CrossRef] [PubMed]
  50. Hornitschek, P.; Kohnen, M.V.; Lorrain, S.; Rougemont, J.; Ljung, K.; Lopez-Vidriero, I.; Franco-Zorrilla, J.M.; Solano, R.; Trevisan, M.; Pradervand, S.; et al. Phytochrome interacting factors 4 and 5 control seedling growth in changing light conditions by directly controlling auxin signaling. Plant J. 2012, 71, 699–711. [Google Scholar] [CrossRef] [PubMed]
  51. Todaka, D.; Nakashima, K.; Maruyama, K.; Kidokoro, S.; Osakabe, Y.; Ito, Y.; Matsukura, S.; Fujita, Y.; Yoshiwara, K.; Ohme-Takagi, M.; et al. Rice phytochrome-interacting factor-like protein OsPIL1 functions as a key regulator of internode elongation and induces a morphological response to drought stress. Proc. Natl. Acad. Sci. USA 2012, 109, 15947–15952. [Google Scholar] [CrossRef] [PubMed]
  52. Nusinow, D.A.; Helfer, A.; Hamilton, E.E.; King, J.J.; Imaizumi, T.; Schultz, T.F.; Farre, E.M.; Kay, S.A. The ELF4-ELF3-LUX complex links the circadian clock to diurnal control of hypocotyl growth. Nature 2011, 475, 398–402. [Google Scholar] [CrossRef] [PubMed]
  53. Feng, S.; Martinez, C.; Gusmaroli, G.; Wang, Y.; Zhou, J.; Wang, F.; Chen, L.; Yu, L.; Iglesias-Pedraz, J.M.; Kircher, S.; et al. Coordinated regulation of Arabidopsis thaliana development by light and gibberellins. Nature 2008, 451, 475–479. [Google Scholar] [CrossRef] [PubMed]
  54. Kumar, S.V.; Lucyshyn, D.; Jaeger, K.E.; Alos, E.; Alvey, E.; Harberd, N.P.; Wigge, P.A. Transcription factor PIF4 controls the thermosensory activation of flowering. Nature 2012, 484, 242–245. [Google Scholar] [CrossRef] [PubMed]
  55. Sun, J.; Qi, L.; Li, Y.; Chu, J.; Li, C. PIF4-mediated activation of YUCCA8 expression integrates temperature into the auxin pathway in regulating Arabidopsis hypocotyl growth. PLoS Genet. 2012, 8, e1002594. [Google Scholar] [CrossRef] [PubMed]
  56. Jeon, J.S.; Lee, S.; Jung, K.H.; Jun, S.H.; Jeong, D.H.; Lee, J.; Kim, C.; Jang, S.; Yang, K.; Nam, J.; et al. T-DNA insertional mutagenesis for functional genomics in rice. Plant J. 2000, 22, 561–570. [Google Scholar] [CrossRef] [PubMed]
  57. Jeong, D.H.; An, S.; Park, S.; Kang, H.G.; Park, G.G.; Kim, S.R.; Sim, J.; Kim, Y.O.; Kim, M.K.; Kim, S.R.; et al. Generation of a flanking sequence-tag database for activation-tagging lines in japonica rice. Plant J. 2006, 45, 123–132. [Google Scholar] [CrossRef] [PubMed]
  58. Porra, R.J.; Thompson, W.A.; Kriedemann, P.E. Determination of accurate extinction coefficients and simultaneous equations for assaying chlorophylls a and b extracted with four different solvents: Verification of the concentration of chlorophyll standards by atomic absorption spectroscopy Biochim. Biophys. Acta 1989, 975, 384–394. [Google Scholar] [CrossRef]
  59. Inada, N.; Sakai, A.; Kuroiwa, H.; Kuroiwa, T. Three-dimensional analysis of the senescence program in rice (Oryza sativa L.) coleoptiles. Investigations of tissues and cells by fluorescence microscopy. Planta 1998, 205, 153–164. [Google Scholar] [CrossRef] [PubMed]

