Leaf Age and Position Effects on Quantum Yield and Photosynthetic Capacity in Hemp Crowns


Abstract
:1. Introduction
2. Results
3. Discussion
4. Materials and Methods
4.1. Leaf Gas Exchange and Light Absorption Measurements
4.2. Photosynthetically Active Radiation Measurements
4.3. An/Ci Curve Fitting
4.4. An/Qp Curve Fitting
4.5. Parameterizations of Leaf Photosynthetic Longevity
4.6. Statistical Analysis
Author Contributions
Funding
Acknowledgments
Conflicts of Interest
References
- Burgess, A.J.; Retkute, R.; Herman, T.; Murchie, E.H. Exploring relationships between canopy architecture, light distribution, and photosynthesis in contrasting rice genotypes using 3D canopy reconstruction. Front. Plant Sci. 2017, 8, 734. [Google Scholar] [CrossRef] [PubMed]
- Gspaltl, M.; Bauerle, W.L.; Binkley, D.; Sterba, H. Leaf area and light use efficiency patterns of Norway spruce under different thinning regimes and age classes. For. Ecol. Manag. 2013, 288, 49–59. [Google Scholar] [CrossRef] [PubMed] [Green Version]
- Bielczynski, L.W.; Lacki, M.K.; Hoefnagels, I.; Gambin, A.; Crocea, R. Leaf and plant age affects photosynthetic performance and photoprotective capacity. Plant Physiol. 2017, 175, 1634–1648. [Google Scholar] [CrossRef]
- Hikosaka, K.; Terashima, I.; Katoh, S. Effects of leaf age, nitrogen nutrition and photon flux density on the distribution of nitrogen among leaves of a vine (Ipomoea tricolor Cav.) grown horizontally to avoid mutual shading of leaves. Oecologia 1994, 97, 451–457. [Google Scholar] [CrossRef]
- Wright, I.J.; Michell, A.C.; Leishman, R.; Cassia, A.; Read, A.B.; Westoby, M. Gradients of light availability and leaf traits with leaf age and canopy position in 28 Australian shrubs and trees. Funct. Plant Biol. 2006, 33, 407–419. [Google Scholar] [CrossRef] [Green Version]
- Han, Q.; Kawasaki, T.; Nakano, T.; Chiba, Y. Leaf-age effects on seasonal variability in photosynthetic parameters and its relationships with leaf mass per area and leaf nitrogen concentration within a Pinus densiflora crown. Tree Physiol. 2008, 28, 551–558. [Google Scholar] [CrossRef] [PubMed] [Green Version]
- Kitajima, A.; Mulkey, S.S.; Samaniego, M.; Wright, S.J. Decline of photosynthetic capacity with leaf age and position in two tropical pioneer tree species. Am. J. Bot. 2002, 89, 1925–1932. [Google Scholar] [CrossRef] [Green Version]
- Werner, C.; Ryel, R.J.; Correia, O.; Beyschlag, W. Effects of photoinhibition on whole-plant carbon gain assessed with a photosynthesis model. Plant Cell Environ. 2001, 24, 27–40. [Google Scholar] [CrossRef]
- Whitewoods, C.D.; Coen, E. Growth and development of three-dimensional plant form. Curr. Biol. 2017, 27, R910–R918. [Google Scholar] [CrossRef]
- Ehleringer, J.; Björkman, O. Quantum yields for CO2 uptake in C3 and C4 plants. Plant Physiol. 1977, 59, 86–90. [Google Scholar] [CrossRef] [Green Version]
- Osborne, B.; Garrett, M. Quantum yields for CO2 uptake in some diploid and tetraploid plant species. Plant Cell Environ. 1983, 6, 135–144. [Google Scholar] [CrossRef]
- Long, S.P.; Postl, W.F.; Bolhár Nordenkampf, H.R. Quantum yields for uptake of carbon dioxide in C3 vascular plants of contrasting habitats and taxonomic groupings. Planta 1993, 189, 226–234. [Google Scholar] [CrossRef]
- Long, S.P.; Humphries, S.; Falkowski, P.G. Photoinhibition of photosynthesis in nature. Annu. Rev. Plant Physiol. Plant Mol. Biol. 1994, 45, 633–662. [Google Scholar] [CrossRef]
- Long, S.P.; Zhu, X.G.; Naidu, S.I.; Ort, D.R. Can improvement in photosynthesis increase crop yields? Plant Cell Environ. 2006, 29, 315–330. [Google Scholar] [CrossRef]
- Evans, J.R. Nitrogen and photosynthesis in the flag leaf of wheat (Triticum aestivum L.). Plant Physiol. 1983, 72, 297–302. [Google Scholar] [CrossRef] [Green Version]
- Osmond, C.B.; Förster, B. Photoinhibition: Then and now. In Photoprotection, Photoinhibition, Gene Regulation and Environment—Advances in Photosynthesis and Respiration; Demmig-Adams, B., Adams, W.W., Mattoo, A.K., Eds.; Springer: Dordrecht, The Netherlands, 2008; Volume 21, pp. 11–22. [Google Scholar] [CrossRef]
- Raven, J.A. Flight or flight: The economics of repair and avoidance of photoinhibition of photosynthesis. Funct. Ecol. 1989, 3, 5–19. [Google Scholar] [CrossRef]
- Kitajima, A.; Mulkey, S.S.; Wright, S.J. Decline of photosynthetic capacity with leaf age in relation to leaf longevities for five tropical canopy tree species. Am. J. Bot. 1997, 85, 702–708. [Google Scholar] [CrossRef]
- Wilson, K.B.; Baldocchi, D.D.; Hanson, P.J. Leaf age affects the seasonal pattern of photosynthetic capacity and net ecosystem exchange of carbon in a deciduous forest. Plant Cell Environ. 2001, 24, 571–583. [Google Scholar] [CrossRef]
- Niinemets, Ü.; Cescatti, A.; Rodeghiero, M.; Tosens, T. Complex adjustments of photosynthetic potentials and internal diffusion conductance to current and previous light availabilities and leaf age in Mediterranean evergreen species. Plant Cell Environ. 2006, 29, 1159–1178. [Google Scholar] [CrossRef] [Green Version]
- Warren, C. Why does photosynthesis decrease with needle age in Pinus pinaster? Trees 2006, 20, 157–164. [Google Scholar] [CrossRef]
- Bondada, B.R.; Oosterhuis, D.M. Decline in photosynthesis as related to alterations in chloroplast ultrastructure of a cotton leaf during ontogeny. Photosynthetica 1998, 35, 467–471. [Google Scholar] [CrossRef]
- Song, Q.; Zhang, G.; Zhu, X.-G. Optimal crop canopy architecture to maximize canopy photosynthetic CO2 uptake under elevated CO2—A theoretical study using a mechanistic model of canopy photosynthesis. Funct. Plant Biol. 2013, 40, 109–124. [Google Scholar] [CrossRef] [Green Version]
- Miner, G.S.; Bauerle, W.L. Seasonal responses of photosynthetic parameters in maize and sunflower and their relationship with leaf functional traits. Plant Cell Environ. 2019, 42, 1561–1574. [Google Scholar] [CrossRef]
- Parry, M.A.J.; Reynolds, M.; Salvucci, M.E.; Raines, C.; Andralojc, P.J.; Zhu, X.G.; Rice, G.D.; Condon, A.G.; Furbank, R.T. Raising yield potential of wheat. II. Increasing photosynthetic capacity and efficiency. J. Exp. Bot. 2011, 62, 453–467. [Google Scholar] [CrossRef]
- Flexas, J.; Carriquí, M. Photosynthesis and photosynthetic efficiencies along the terrestrial plant’s phylogeny: Lessons for improving crop photosynthesis. Plant J. 2019. [Google Scholar] [CrossRef] [Green Version]
- Witkowski, E.T.F.; Lamont, B.B.; Walton, C.S.; Radford, S. Leaf demography, sclerophylla and ecophysiology of two Banksias with contrasting leaf life spans. Aust. J. Bot. 1992, 40, 849–862. [Google Scholar] [CrossRef]
- Ackerly, D.D.; Bazzaz, F.A. Leaf dynamics, self-shading and carbon gain in seedlings of a tropical pioneer tree. Oecologia 1995, 101, 289–298. [Google Scholar] [CrossRef] [PubMed]
- Bauerle, W.L.; Weston, D.J.; Bowden, J.D.; Dudley, J.B.; Toler, J.E. Leaf absorptance of photosynthetically active radiation in relation to chlorophyll meter estimates among woody plant species. Sci. Hort. 2004, 101, 169–178. [Google Scholar] [CrossRef]
- Peñuelas, J.; Filella, I. Visible and near-infrared reflectance techniques for diagnosing plant physiological status. Trends Plant Sci. 1998, 3, 151–156. [Google Scholar] [CrossRef]
- Richardson, A.D.; Duigan, S.P.; Berlyn, G.P. An evaluation of noninvasive methods to estimate foliar chlorophyll content. New Phytol. 2002, 153, 185–194. [Google Scholar] [CrossRef] [Green Version]
- Bauerle, W.L.; Oren, R.; Way, D.A.; Qian, S.S.; Stoy, P.C.; Thornton, P.E.; Bowden, J.D.; Hoffman, F.M.; Reynolds, R.F. Photoperiodic regulation of the seasonal pattern of photosynthetic capacity and the implications for carbon cycling. Proc. Nat. Acad. Sci. USA 2012, 22, 8612–8617. [Google Scholar] [CrossRef] [PubMed] [Green Version]
- Farquhar, G.D.; von Caemmerer, S.; Berry, J.A. A biochemical model of photosynthetic CO2 assimilation in leaves of C3 species. Planta 1980, 149, 78–90. [Google Scholar] [CrossRef] [PubMed] [Green Version]
- Duursma, R.A. Plantecophys—An R package for analyzing and modelling leaf gas exchange data. PLoS ONE 2015, 10, e0143346. [Google Scholar] [CrossRef] [PubMed]
- Wullschleger, S.D. Biochemical limitations of carbon assimilation in C3 plants—A retrospective analysis of the A/Ci curves of 109 species. J. Exp. Bot. 1993, 44, 907–920. [Google Scholar] [CrossRef]
- Jordan, D.B.; Ogren, W.L. The CO2/O2 specificity of ribulose 1,5-bisphosphate concentration, pH and temperature. Planta 1984, 161, 308–313. [Google Scholar] [CrossRef]
- Brooks, A.; Farquhar, G.D. Effects of temperature on the CO2/O2 specificity of ribulose 1,5-bisphosphate carboxylase/oxygenase and the rate of respiration in the light. Planta 1985, 165, 397–406. [Google Scholar] [CrossRef]
- Parsons, R.; Weyers, J.D.B.; Lawson, T.; Godber, I.M. Rapid and straightforward estimates of photosynthetic characteristics using a portable gas exchange system. Photosynthesis 1997, 34, 265–279. [Google Scholar] [CrossRef]
- Sharp, R.E.; Matthews, M.A.; Boyer, J.S. Kok effect and the quantum yield of photosynthesis: Light partially inhibits dark respiration. Plant Physiol. 1984, 75, 95–101. [Google Scholar] [CrossRef] [Green Version]
- Singsaas, E.L.; Ort, D.R.; DeLucia, E.H. Variation in measured values of photosynthetic quantum yield in ecophysiological studies. Oecologia 2001, 128, 15–23. [Google Scholar] [CrossRef]


| Correlated Variable | r | p |
|---|---|---|
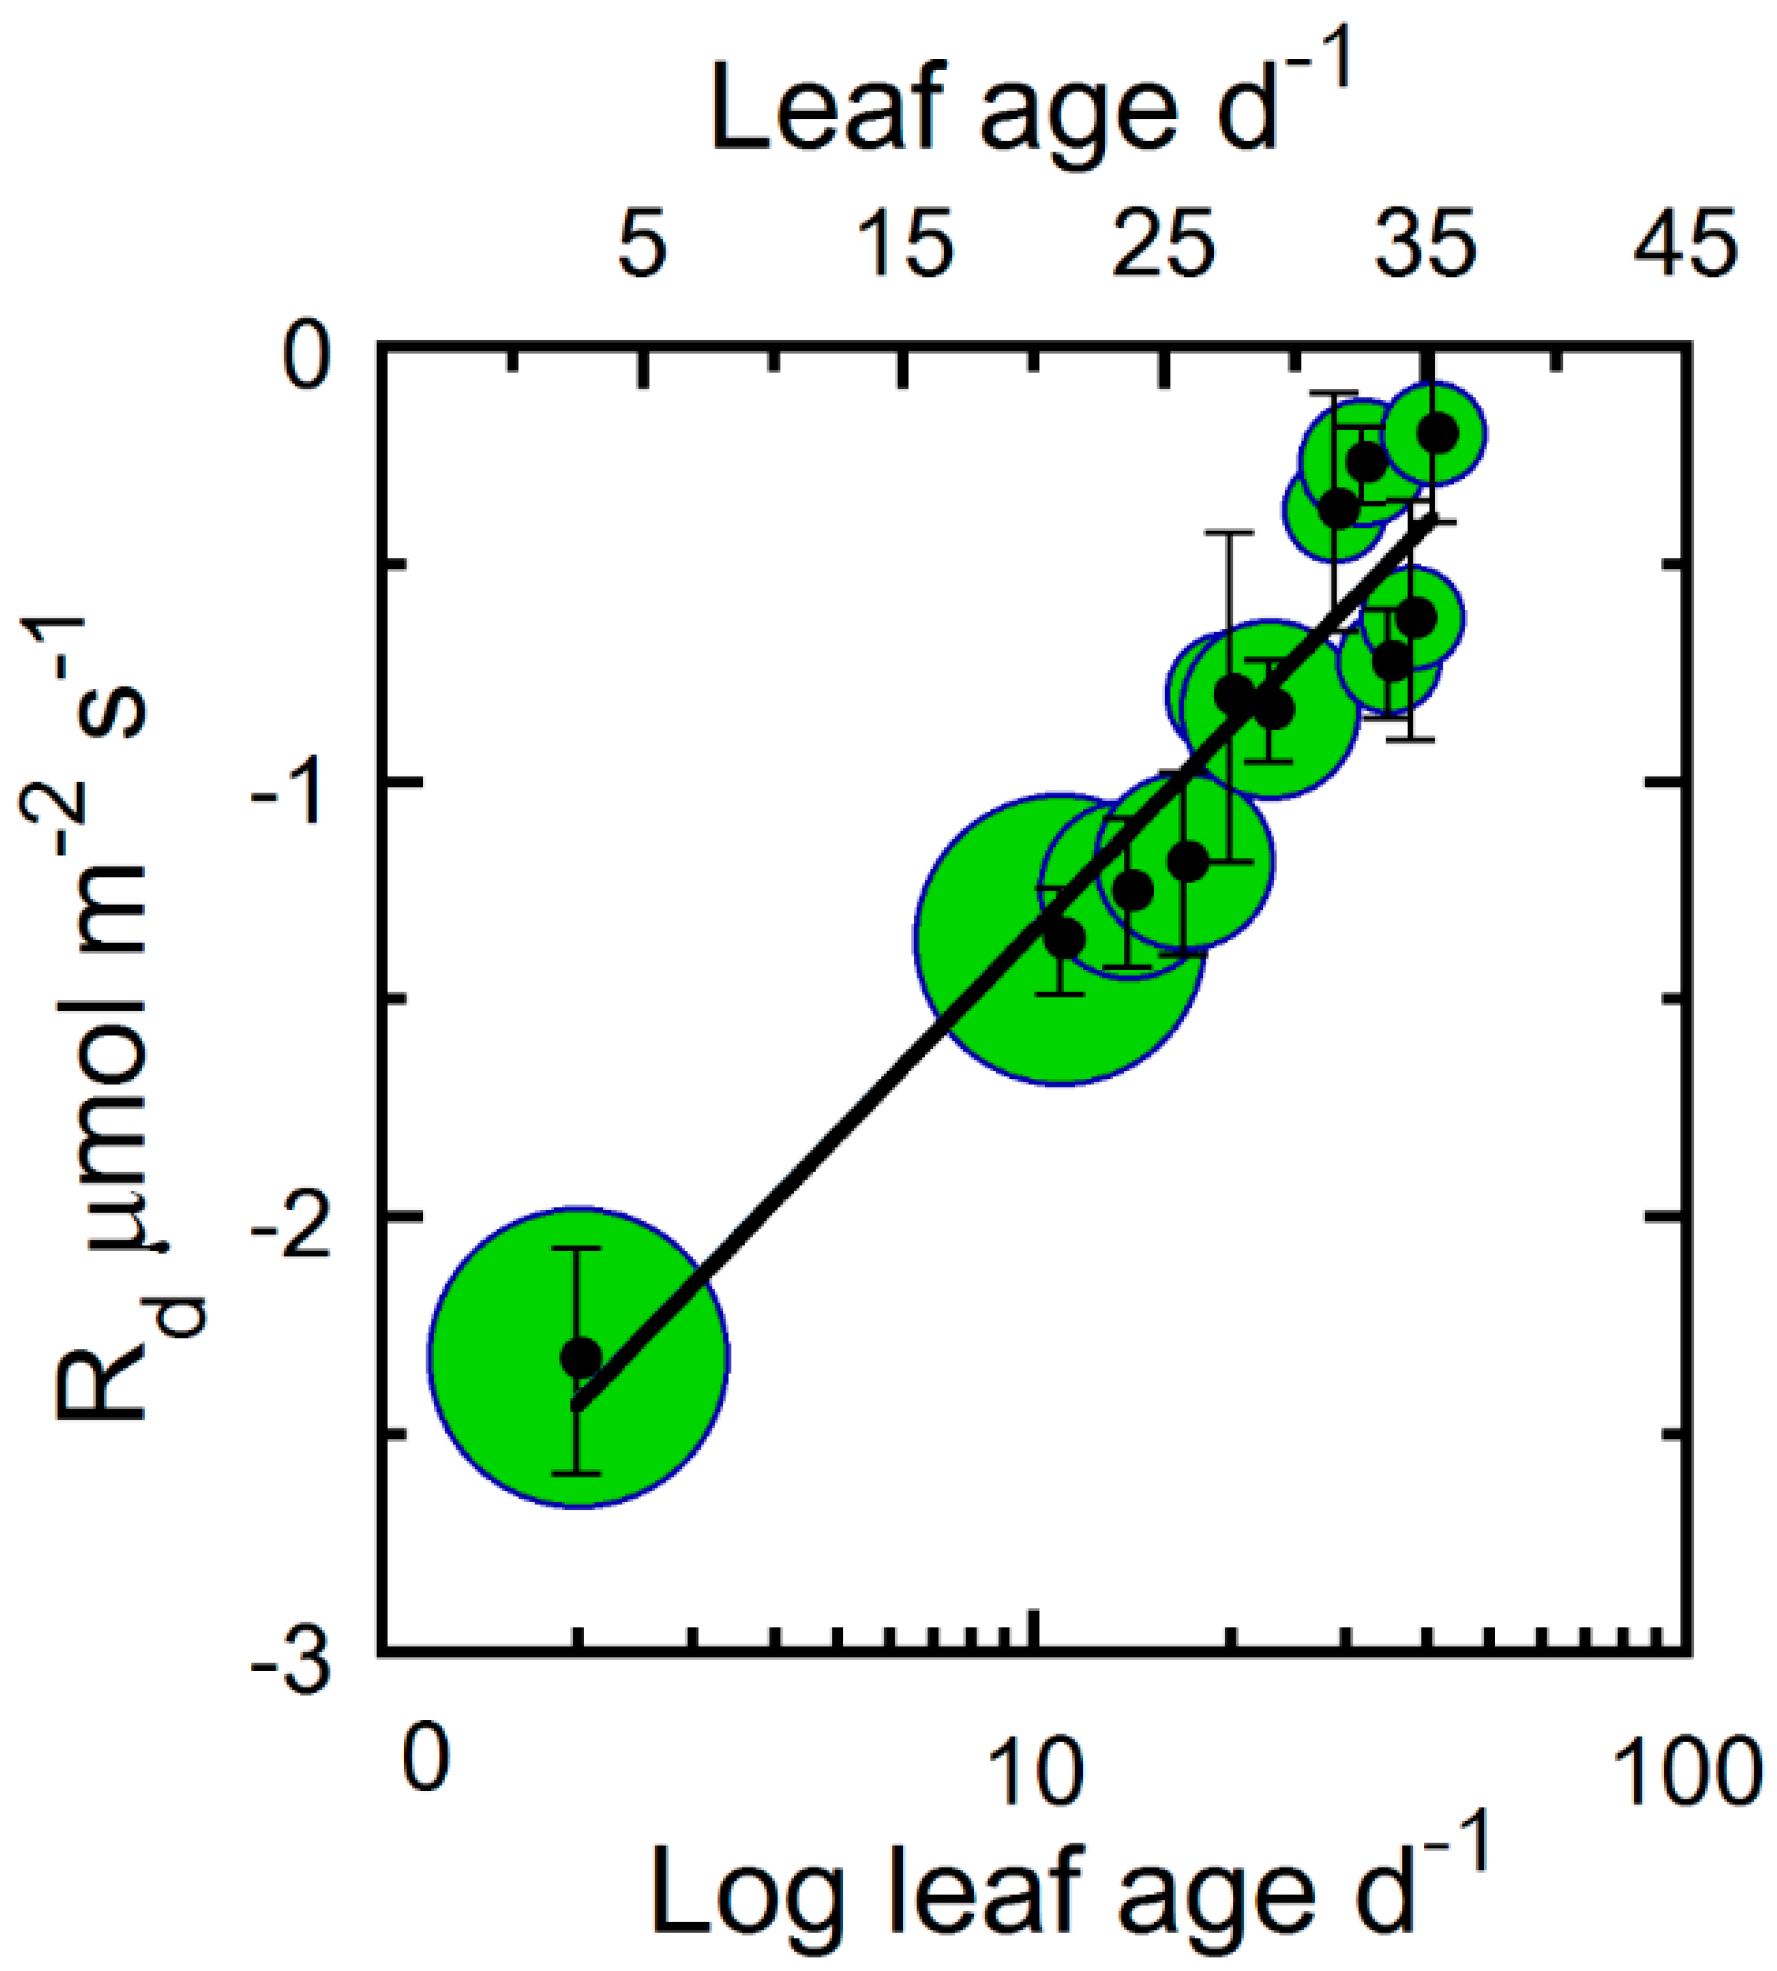
| Rd vs. Age | 0.95 | <0.00000 |
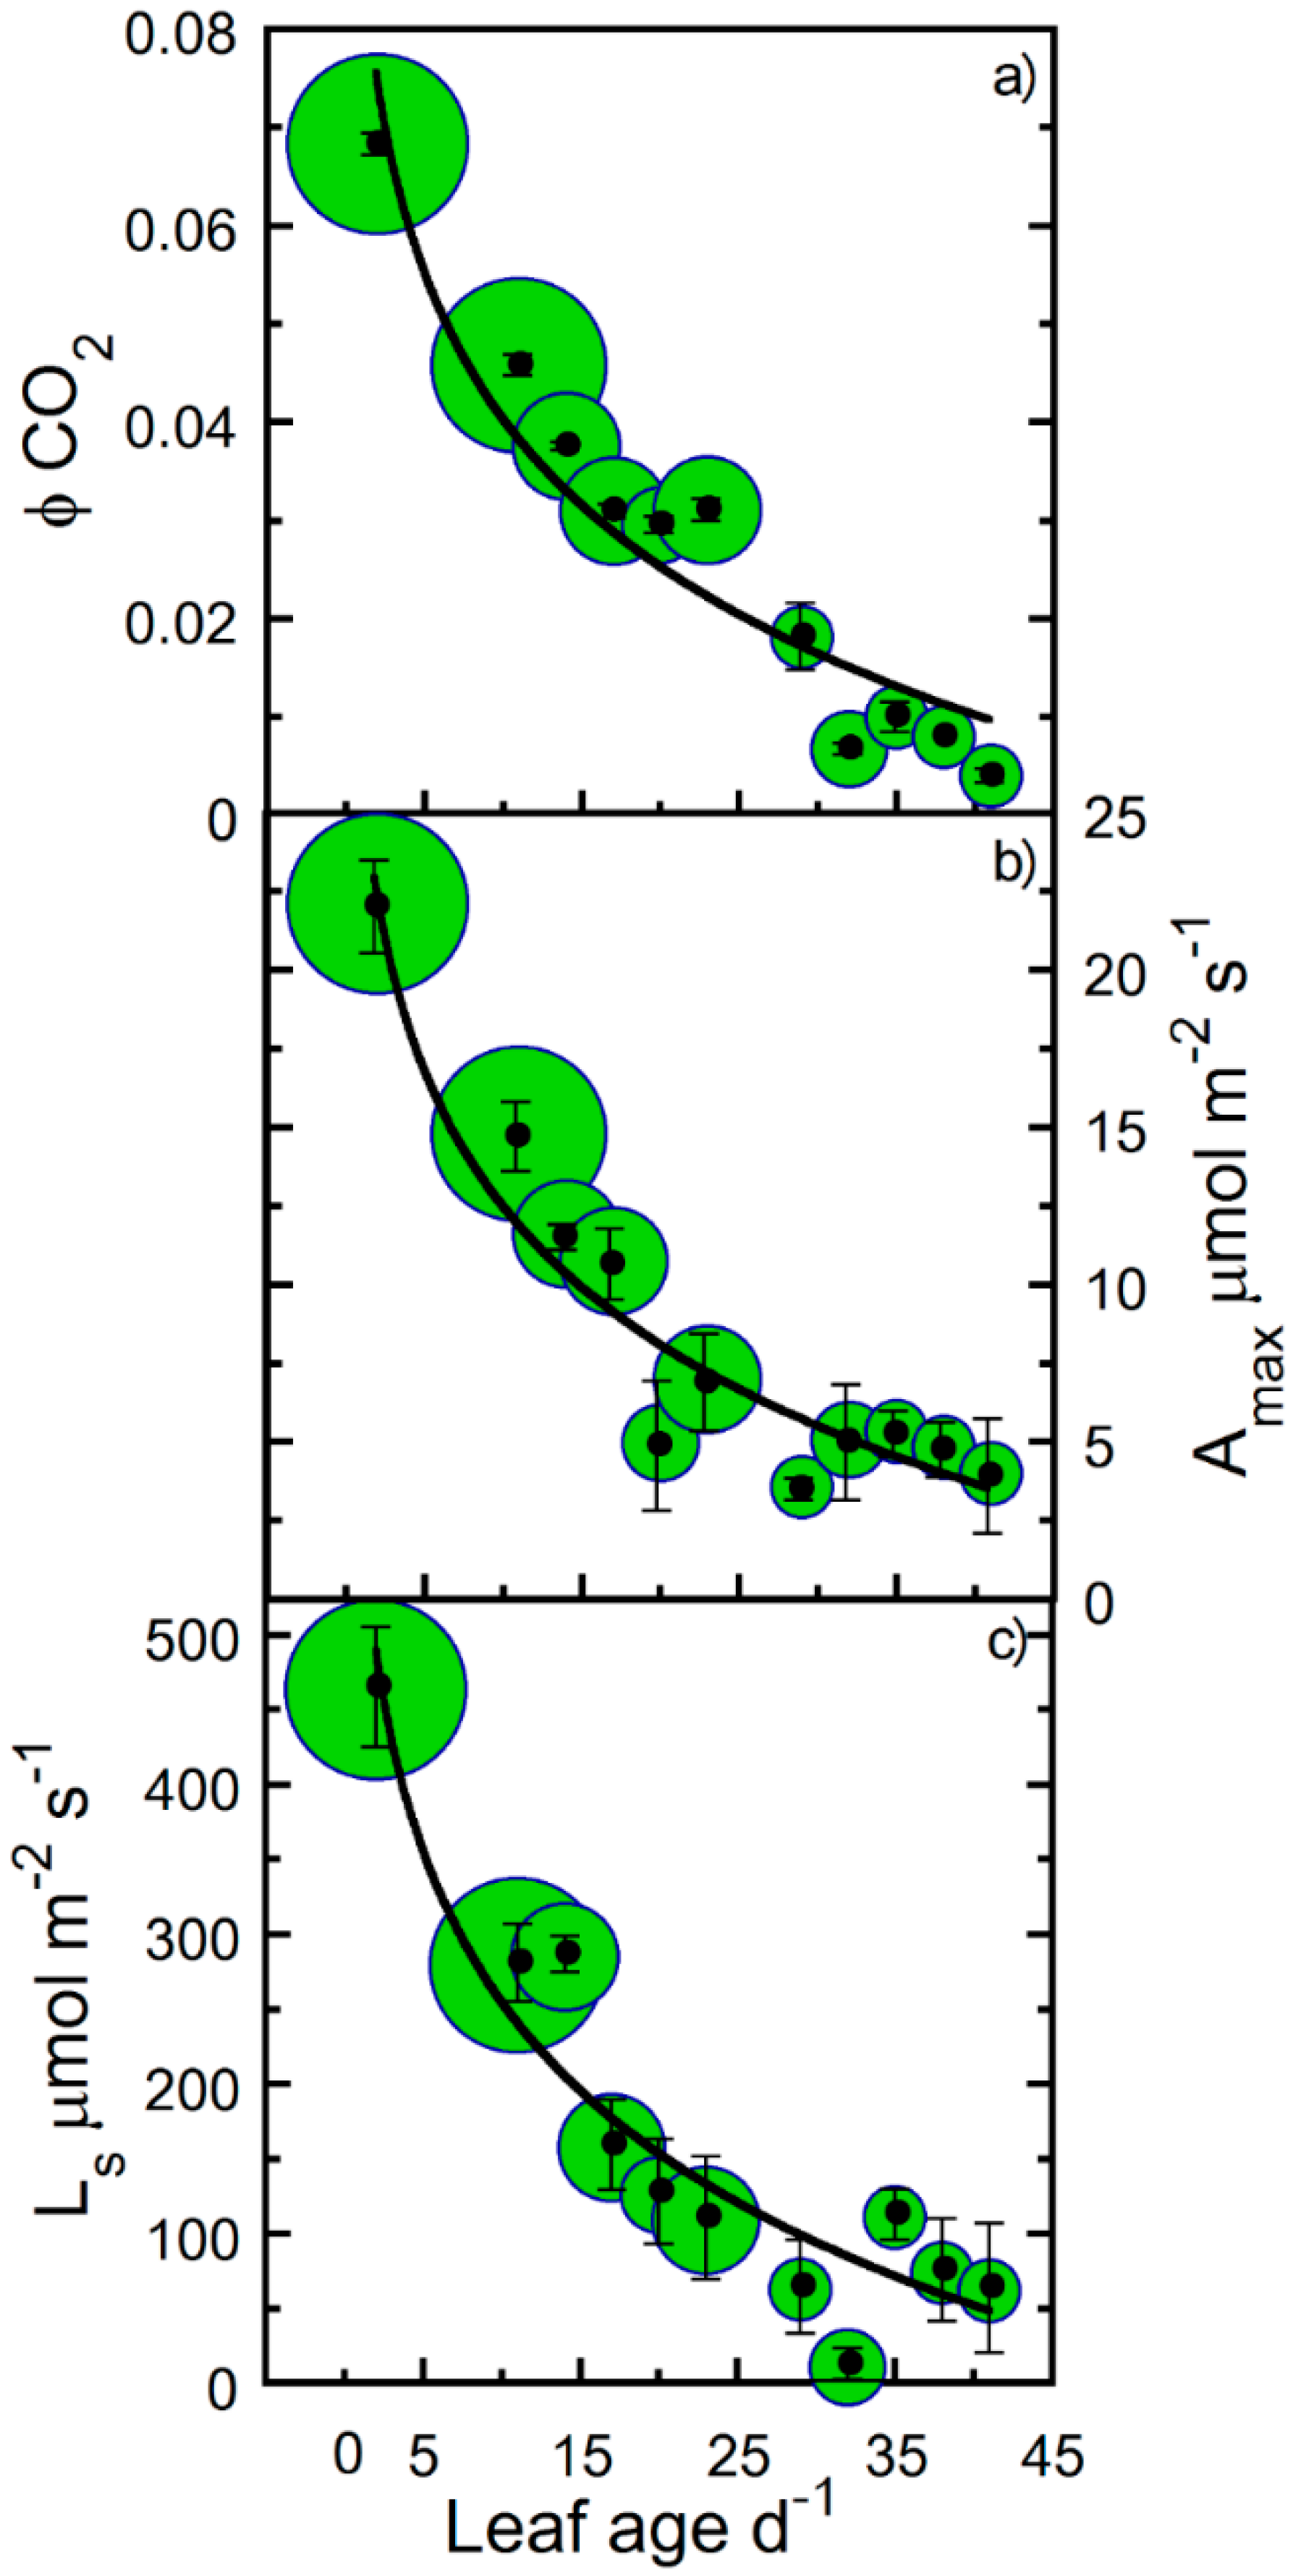
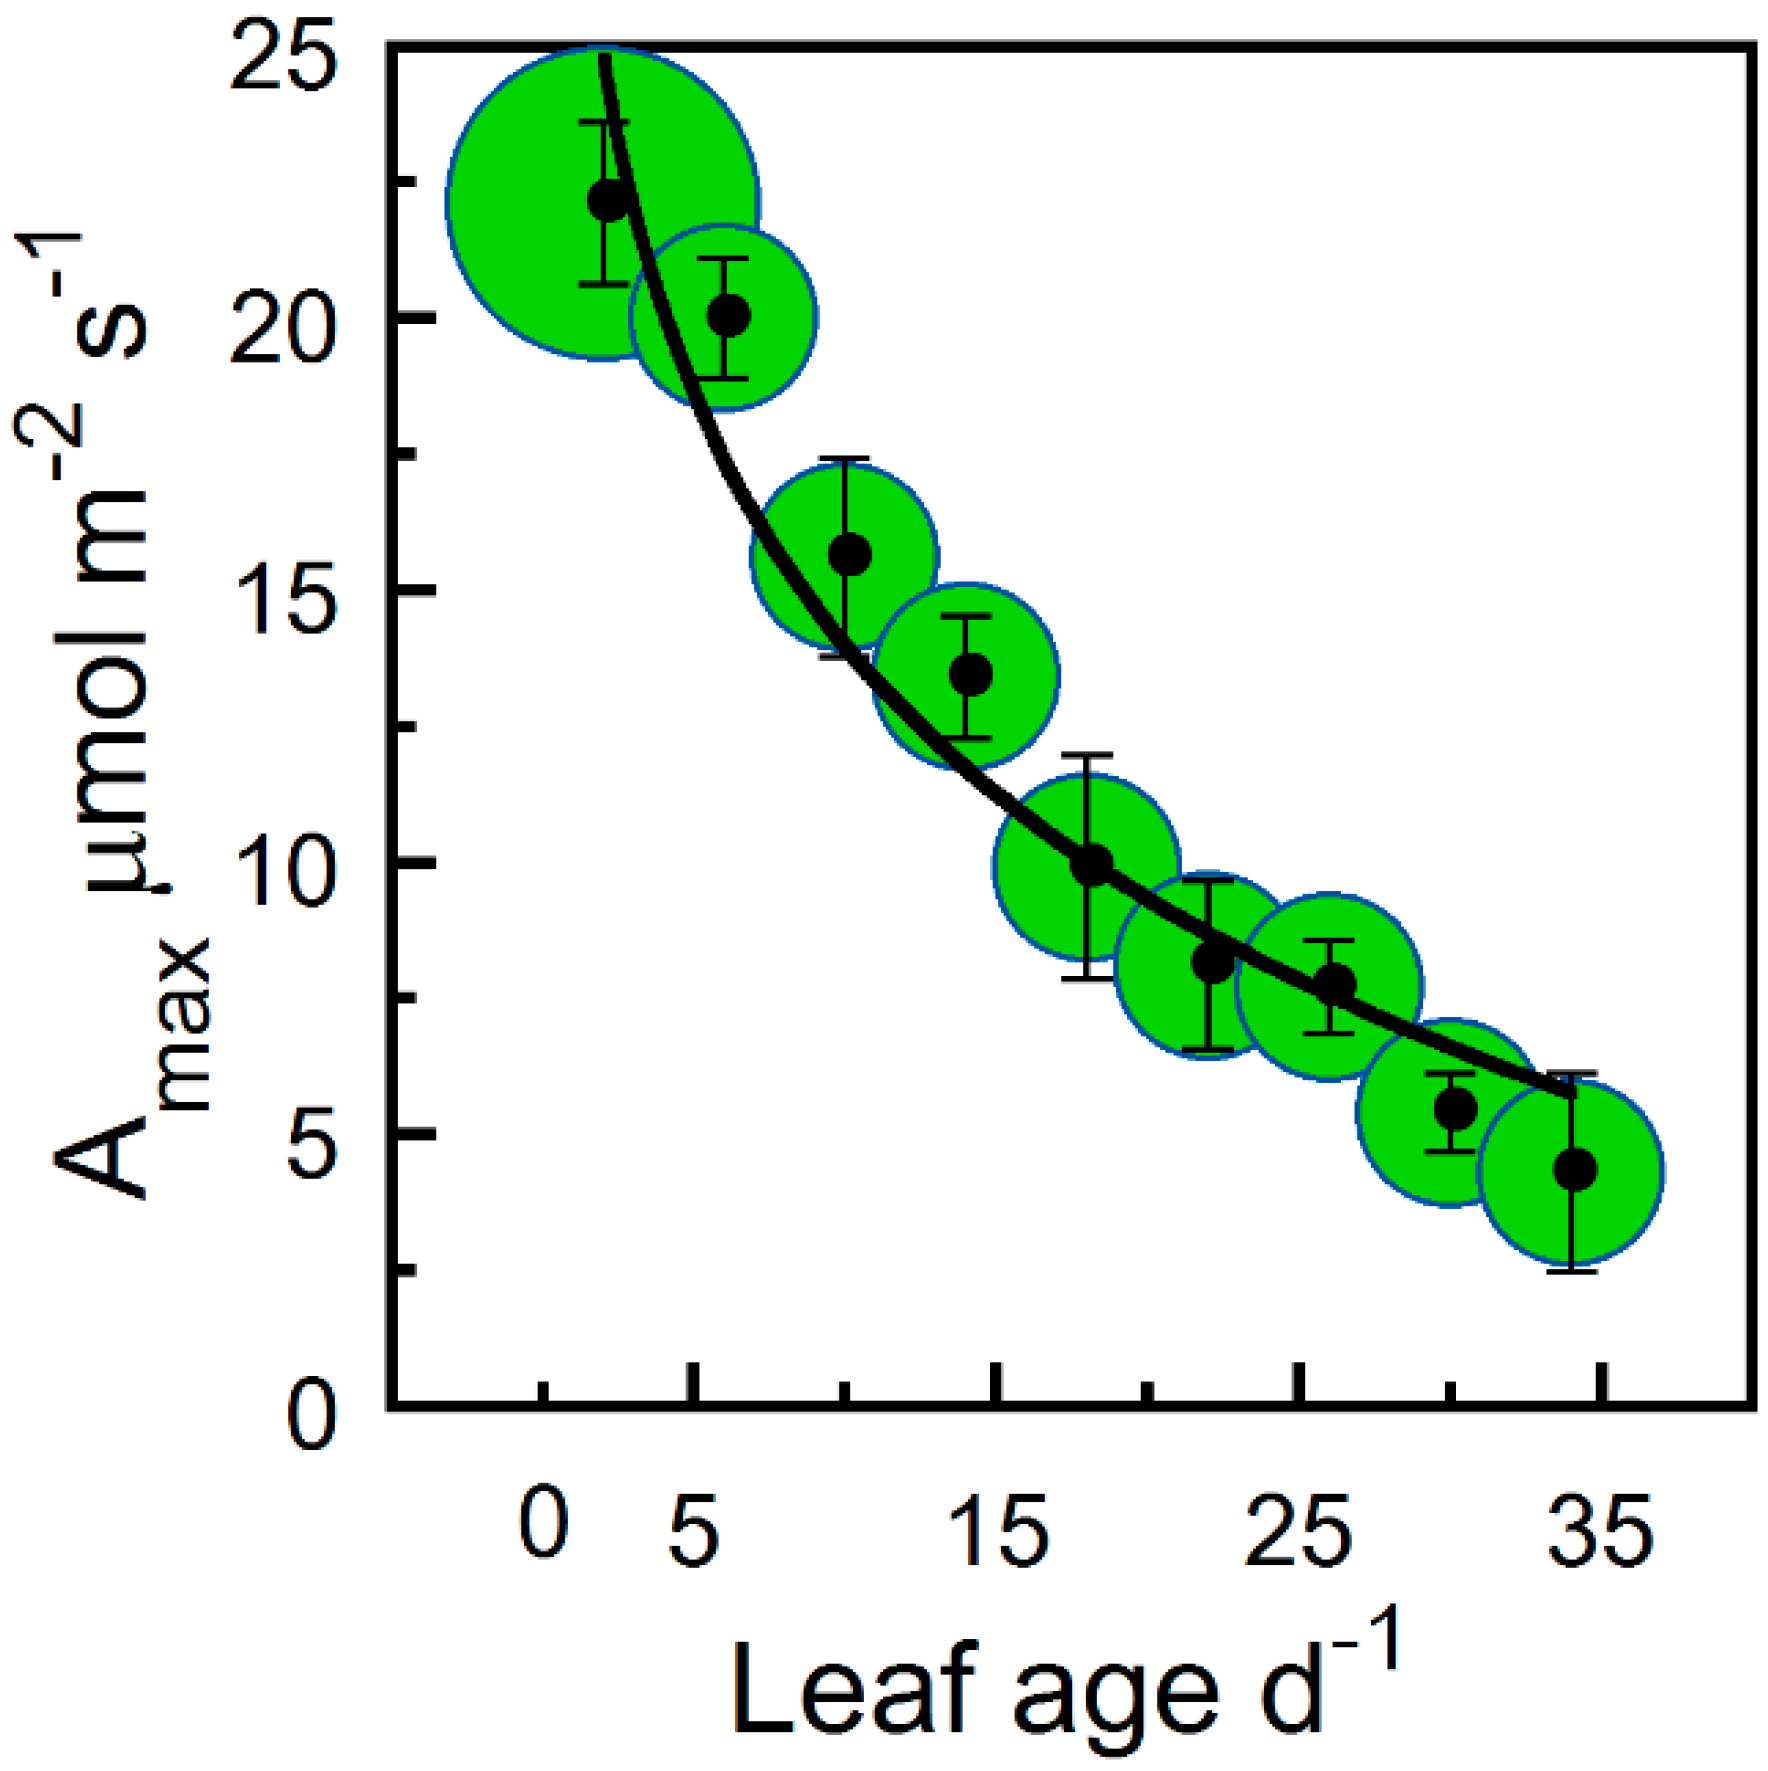
| Amax vs. Age | 0.96 | <0.00000 |
| Ls vs. Age | 0.95 | <0.00000 |
| ϕCO2 vs. Age | 0.94 | <0.00000 |
| Qc vs. Age | 0.04 | 0.60 |
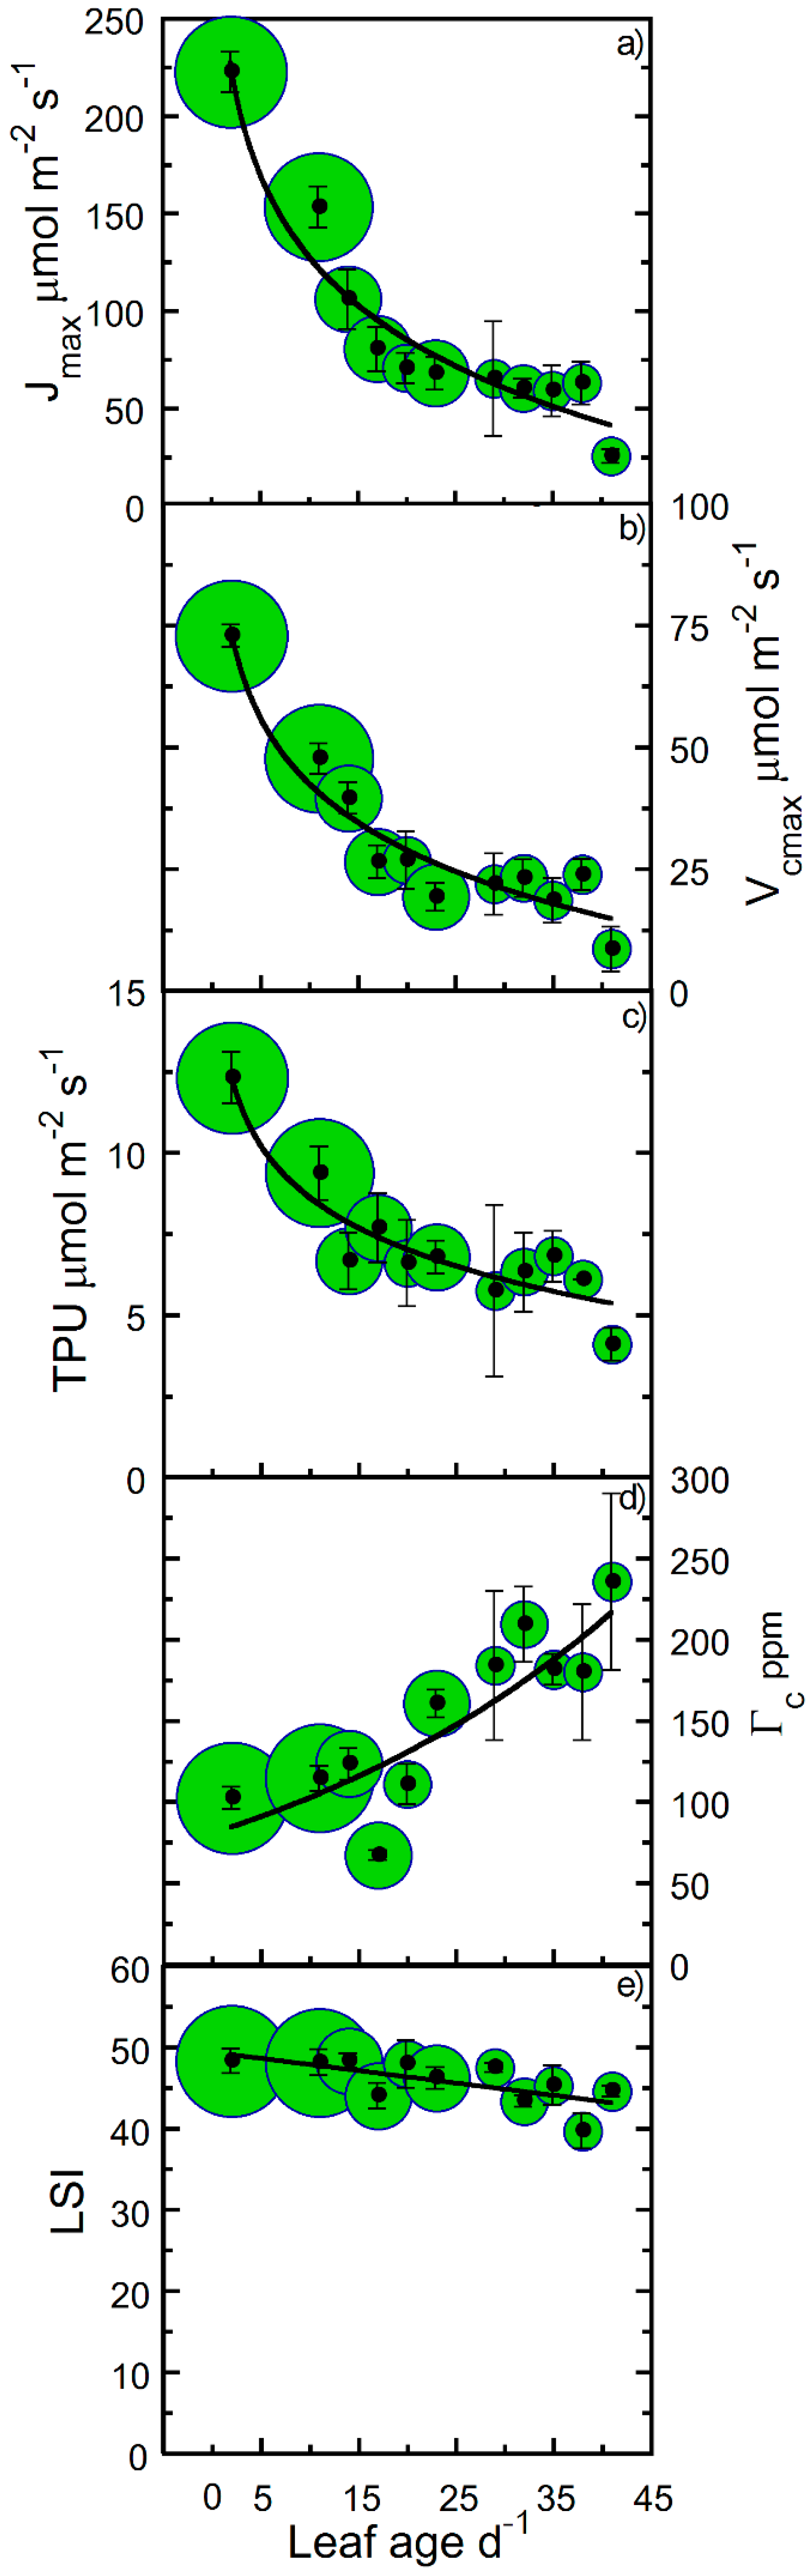
| LSI vs. Age | 0.57 | 0.07 |
| Jmax vs. Age | 0.96 | <0.00000 |
| Vcmax vs. Age | 0.96 | <0.00000 |
| TPU vs. Age | 0.93 | 0.00003 |
| Γc vs. Age | 0.66 | 0.03 |
| Parameter | (−, +) | 50% | 75% | Equation Type |
|---|---|---|---|---|
| Amax | − | 9 | 25 | † |
| Ls | − | 8 | 20 | † |
| ϕCO2 | − | 8 | 22 | † |
| Rd | − | 9 | 25 | * |
| Qc | − | >100 | >100 | * |
| Jmax | − | 9 | 27 | † |
| Vcmax | − | 9 | 28 | † |
| TPU | − | 21 | 93 | † |
| Γc | + | 19 | 24 | † |
| LSI | − | >100 | >100 | * |
| Parameter | r2 | Slope*ln(x) | +y-Intercept | Equation Type |
|---|---|---|---|---|
| Rd | 0.91 | 0.68 * | −2.898 | * |
| Amax | 0.92 | −6.419 | 27.471 | † |
| Ls | 0.89 | −145.9 | 588.31 | † |
| ϕCO2 | 0.91 | −0.022 | 0.091 | † |
| Qc | 0.04 | −0.456 * | 11.001 | * |
| LSI | 0.32 | −0.152 * | 49.334 | * |
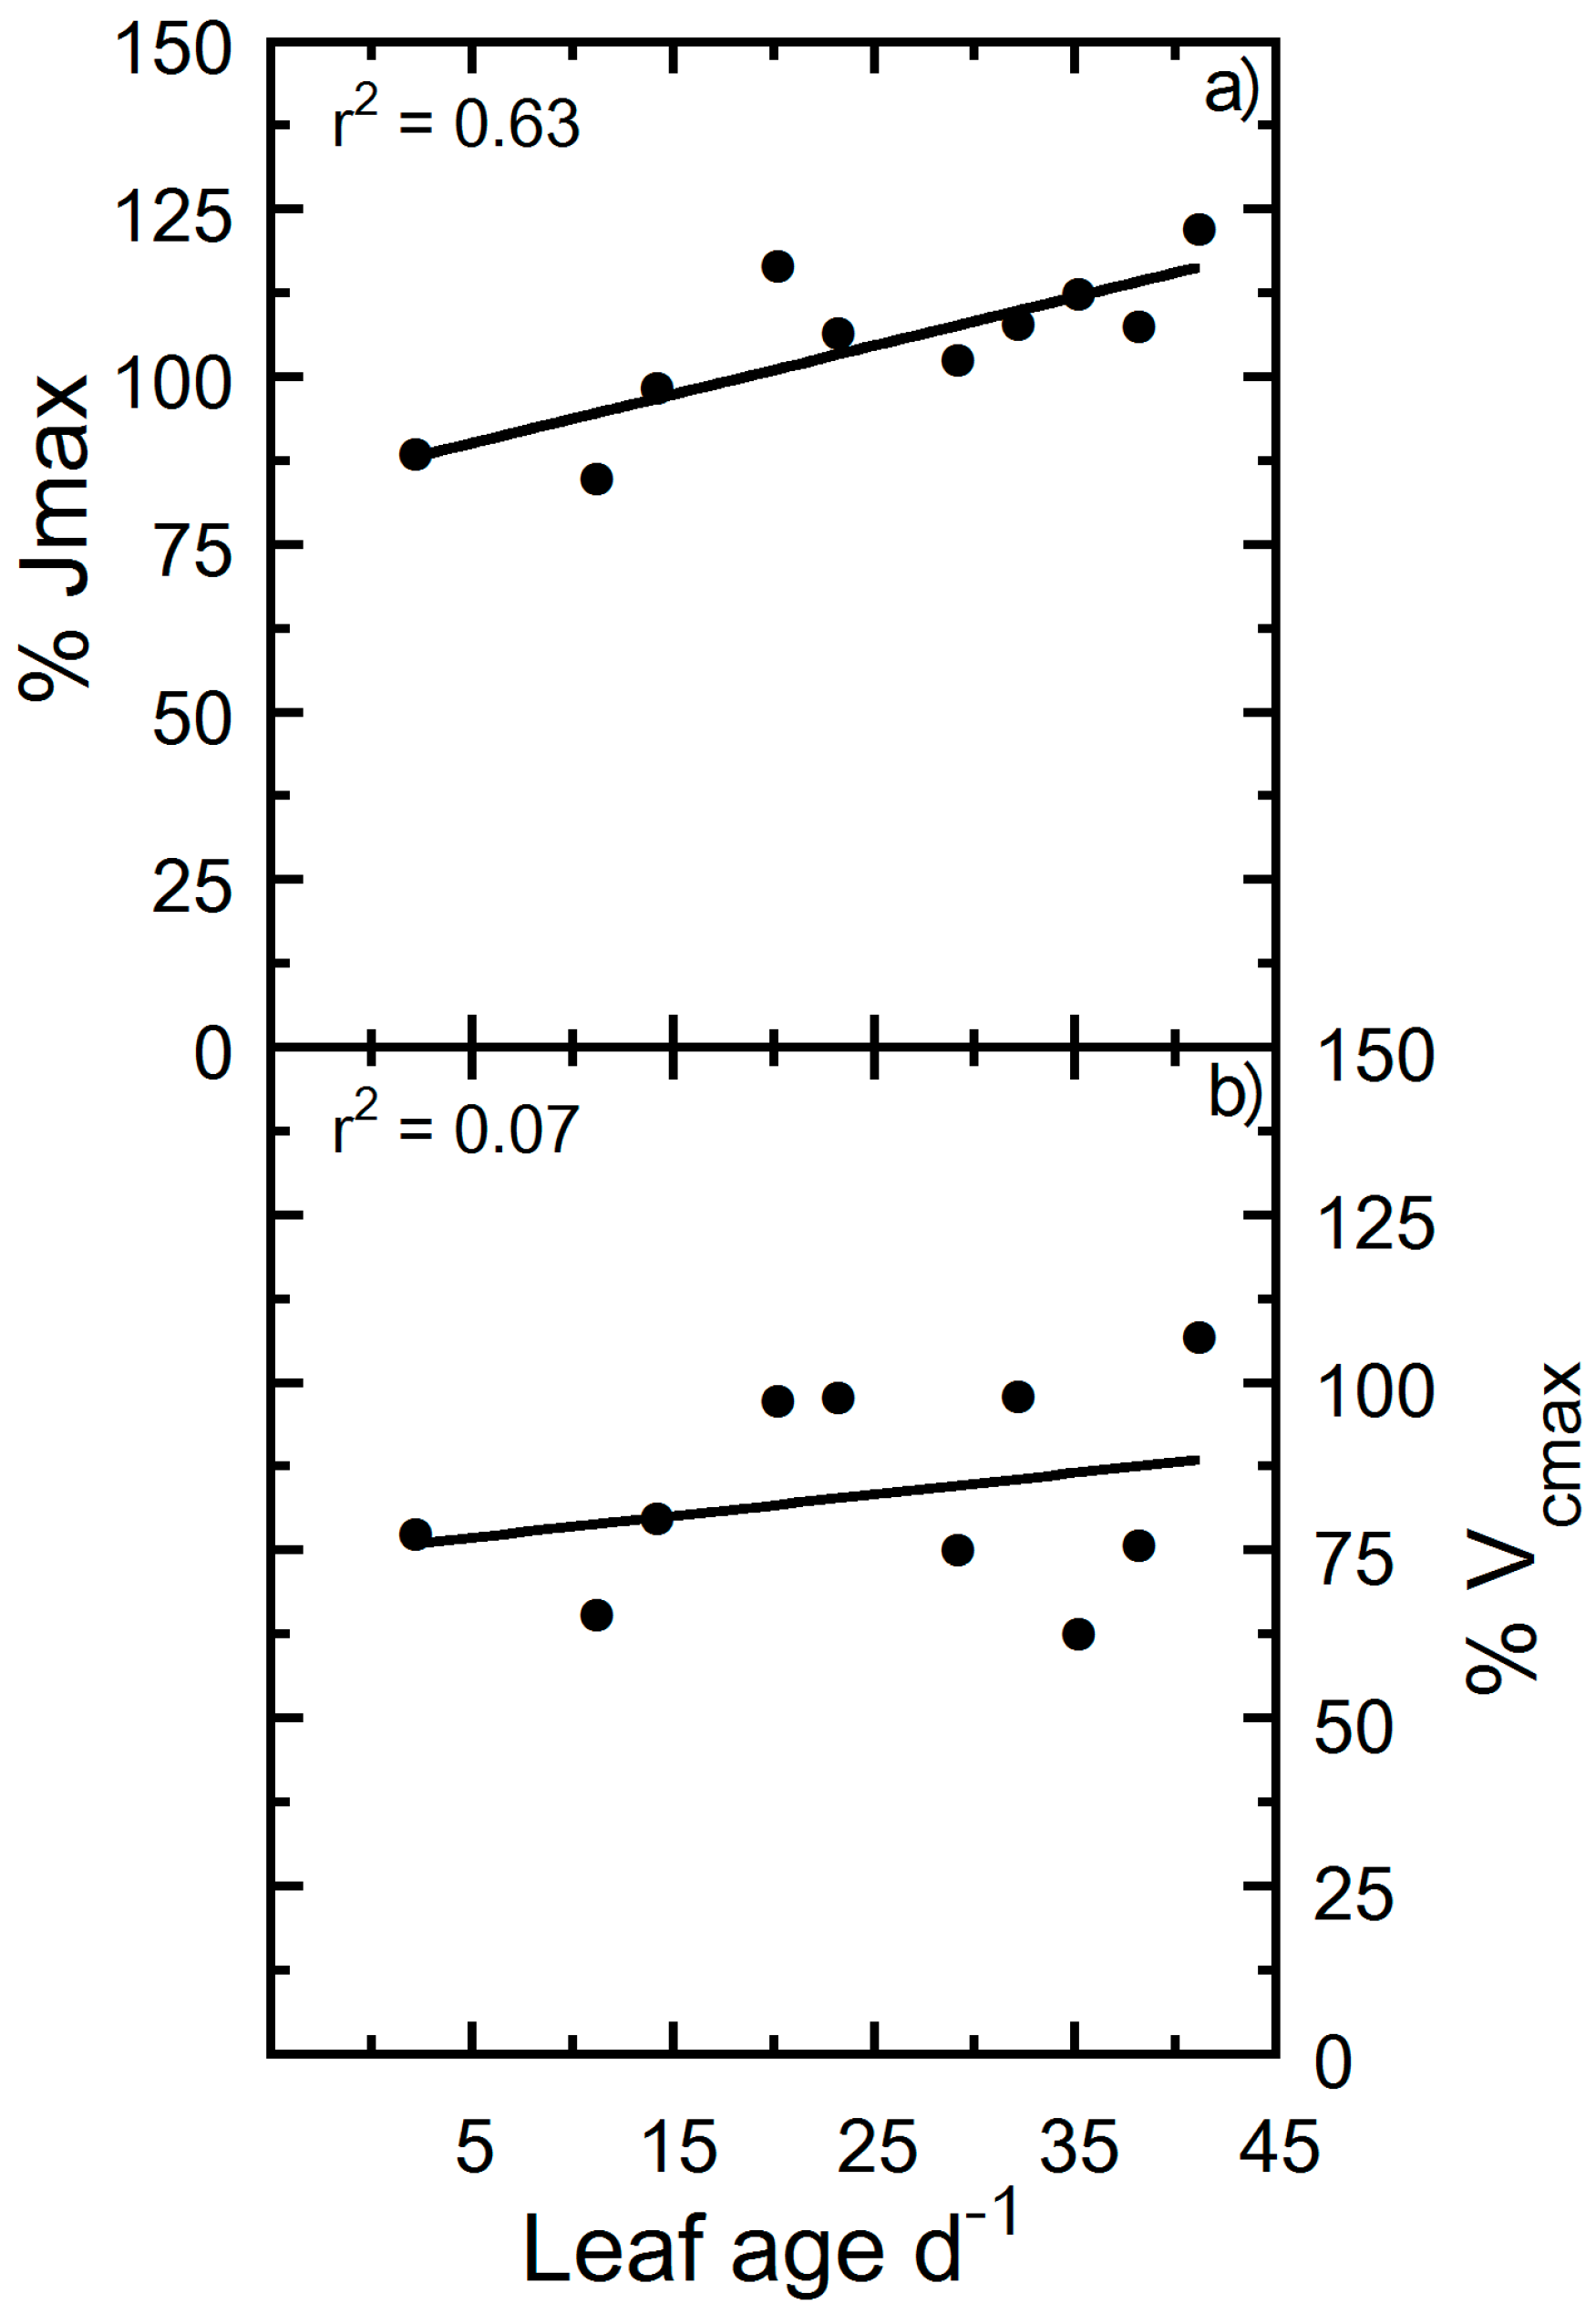
| Jmax | 0.93 | −61.47 | 269.8 | † |
| Vcmax | 0.92 | −19.65 | 87.833 | † |
| TPU | 0.93 | −2.312 | 13.956 | † |
| Γc | 0.63 | 3.546 | 67.292 | † |
© 2020 by the authors. Licensee MDPI, Basel, Switzerland. This article is an open access article distributed under the terms and conditions of the Creative Commons Attribution (CC BY) license (http://creativecommons.org/licenses/by/4.0/).
Share and Cite
Bauerle, W.L.; McCullough, C.; Iversen, M.; Hazlett, M. Leaf Age and Position Effects on Quantum Yield and Photosynthetic Capacity in Hemp Crowns. Plants 2020, 9, 271. https://doi.org/10.3390/plants9020271
Bauerle WL, McCullough C, Iversen M, Hazlett M. Leaf Age and Position Effects on Quantum Yield and Photosynthetic Capacity in Hemp Crowns. Plants. 2020; 9(2):271. https://doi.org/10.3390/plants9020271
Chicago/Turabian StyleBauerle, William L., Cole McCullough, Megan Iversen, and Michael Hazlett. 2020. "Leaf Age and Position Effects on Quantum Yield and Photosynthetic Capacity in Hemp Crowns" Plants 9, no. 2: 271. https://doi.org/10.3390/plants9020271
APA StyleBauerle, W. L., McCullough, C., Iversen, M., & Hazlett, M. (2020). Leaf Age and Position Effects on Quantum Yield and Photosynthetic Capacity in Hemp Crowns. Plants, 9(2), 271. https://doi.org/10.3390/plants9020271