
Meta-Analysis and Ranking of the Most Effective Methane Reduction Strategies for Australia’s Beef and Dairy Sector


Abstract
1. Introduction
2. Materials and Methods
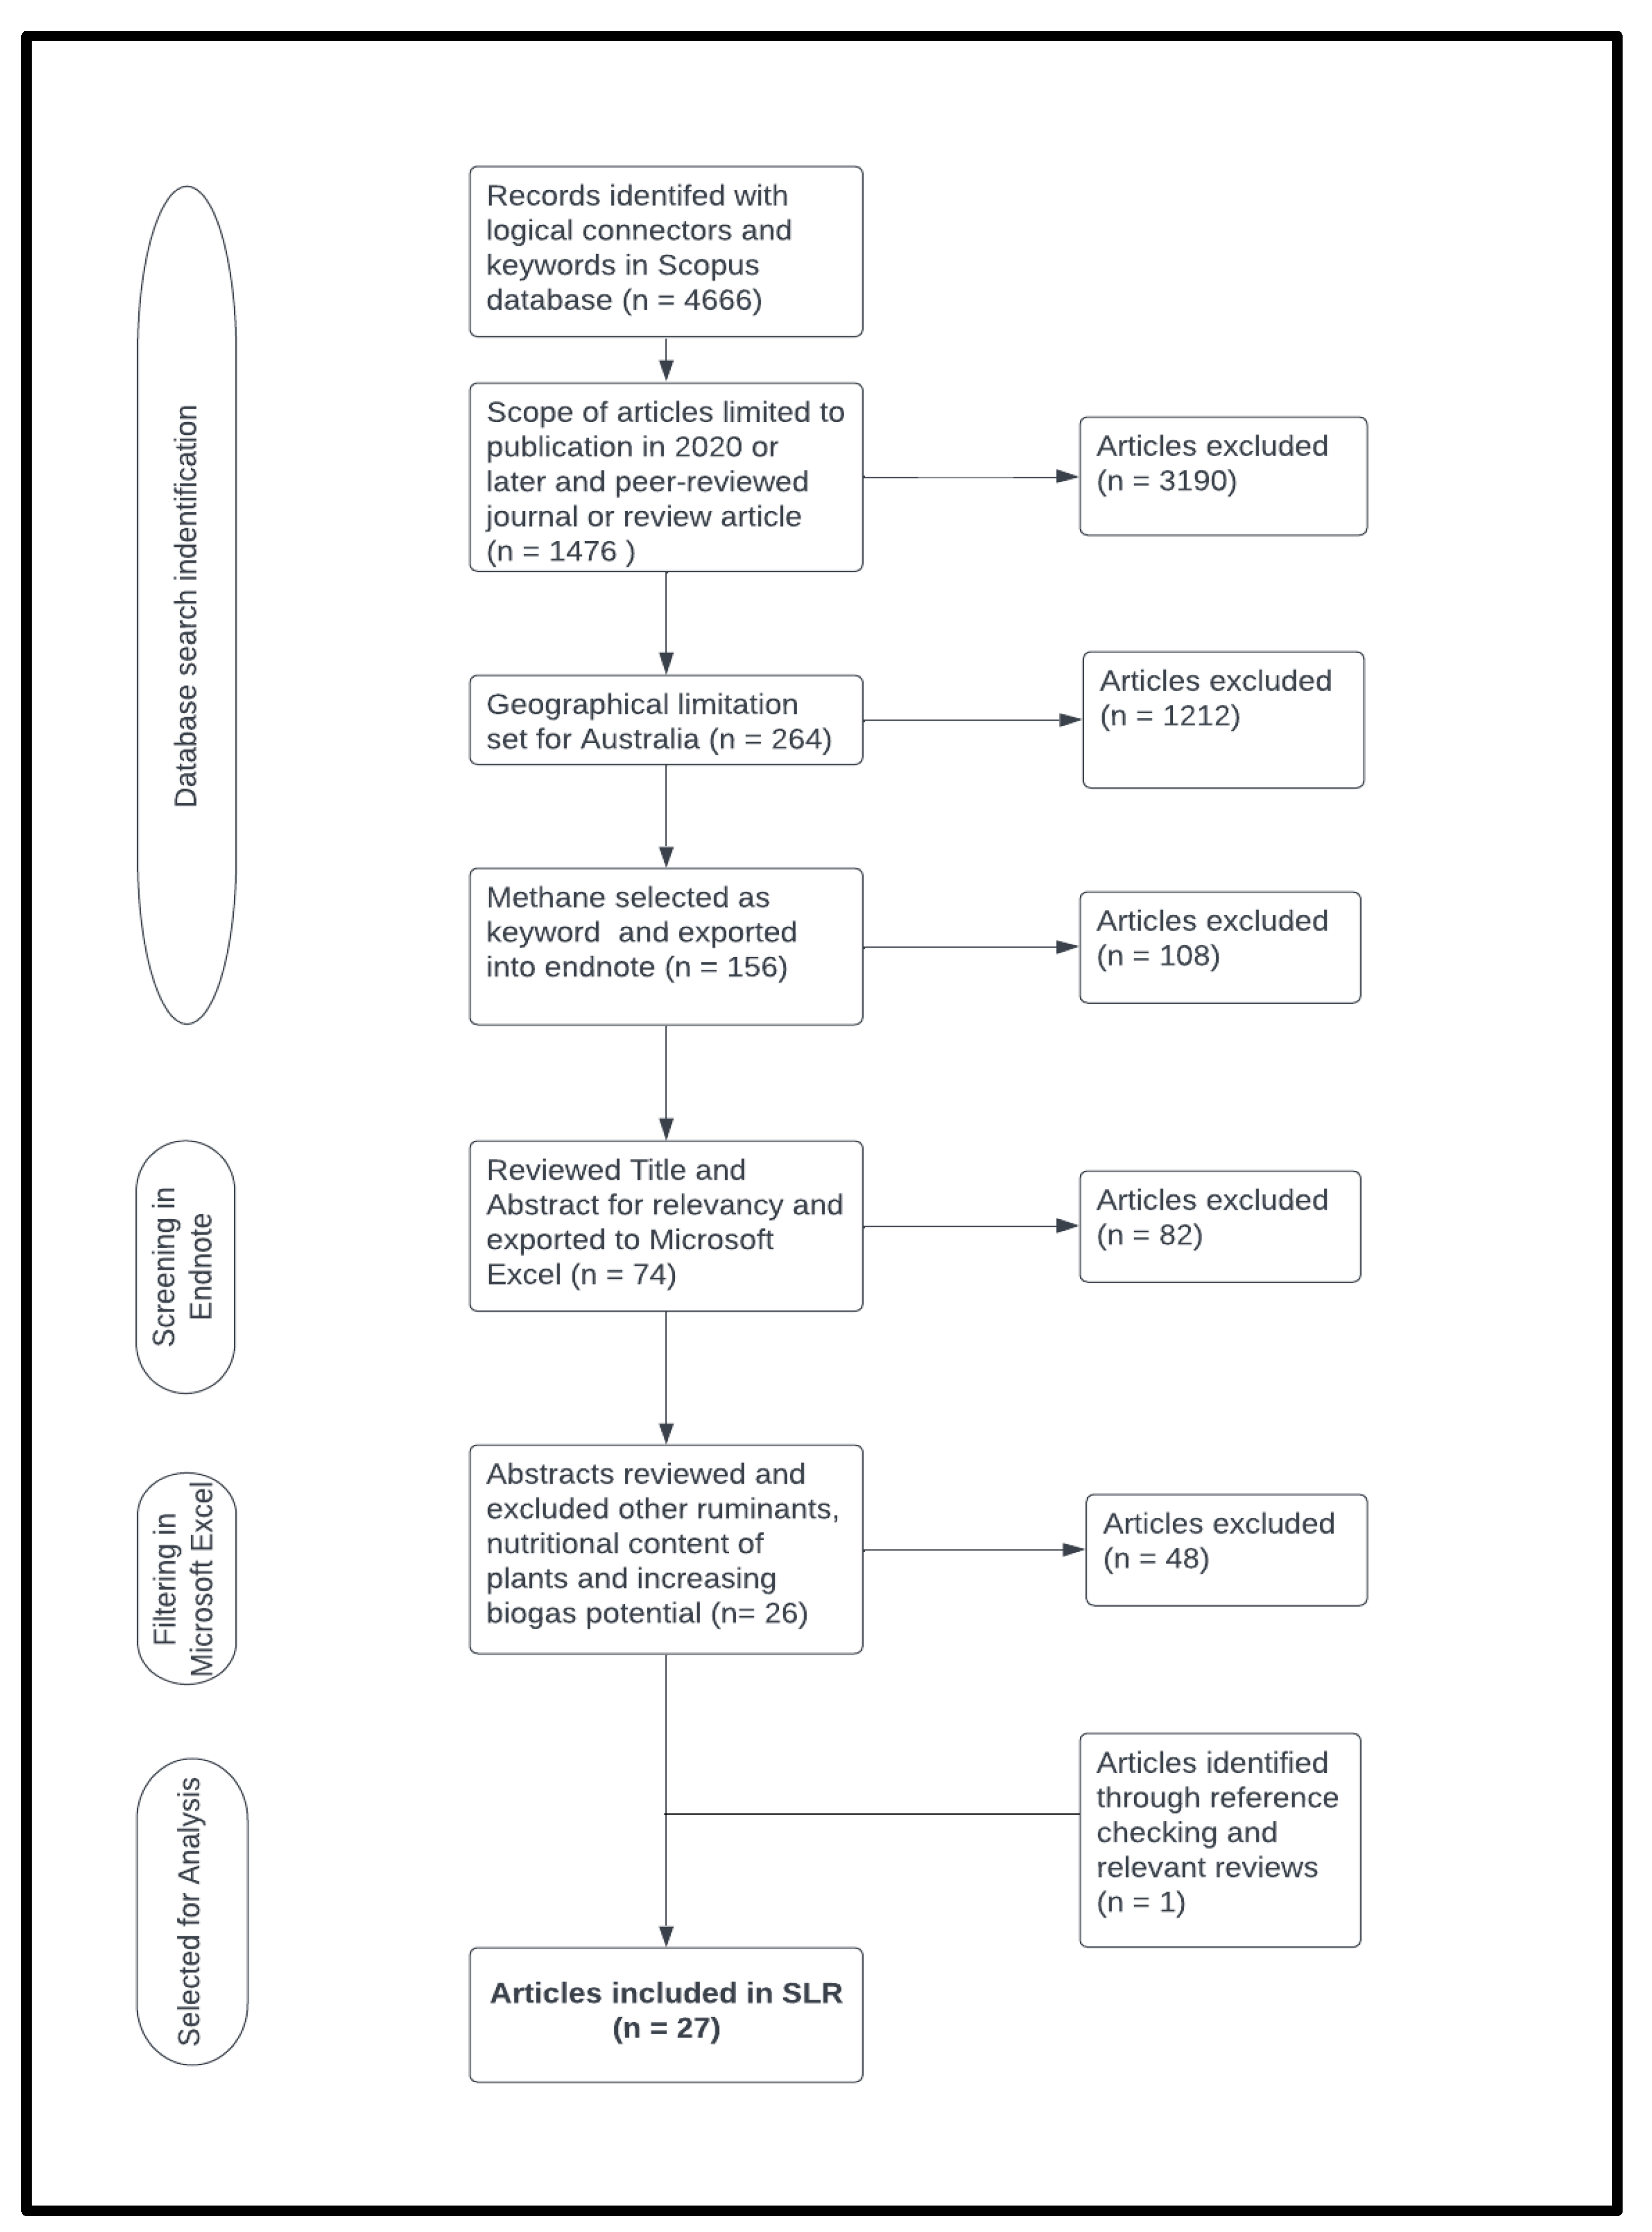
2.1. Systematic Literature Review
2.2. MCDM and TOPSIS
2.2.1. Indicator Development and Metrics
- Environmental impact—CH4 reduction;
- Economic impact—estimated intervention costs;
- Technological readiness—research development stage;
- Policy and regulatory landscape—compliance with existing laws, new policy required;
- Scalability and replicability—applicable across production systems, climatic zones, and seasons.
2.2.2. Decision Matrix
2.2.3. TOPSIS Formulations
3. Results
3.1. Systematic Literature Review
3.1.1. ‘Avoid’ Strategies
3.1.2. ‘Shift’ Strategies
3.1.3. ‘Improve’ Strategies
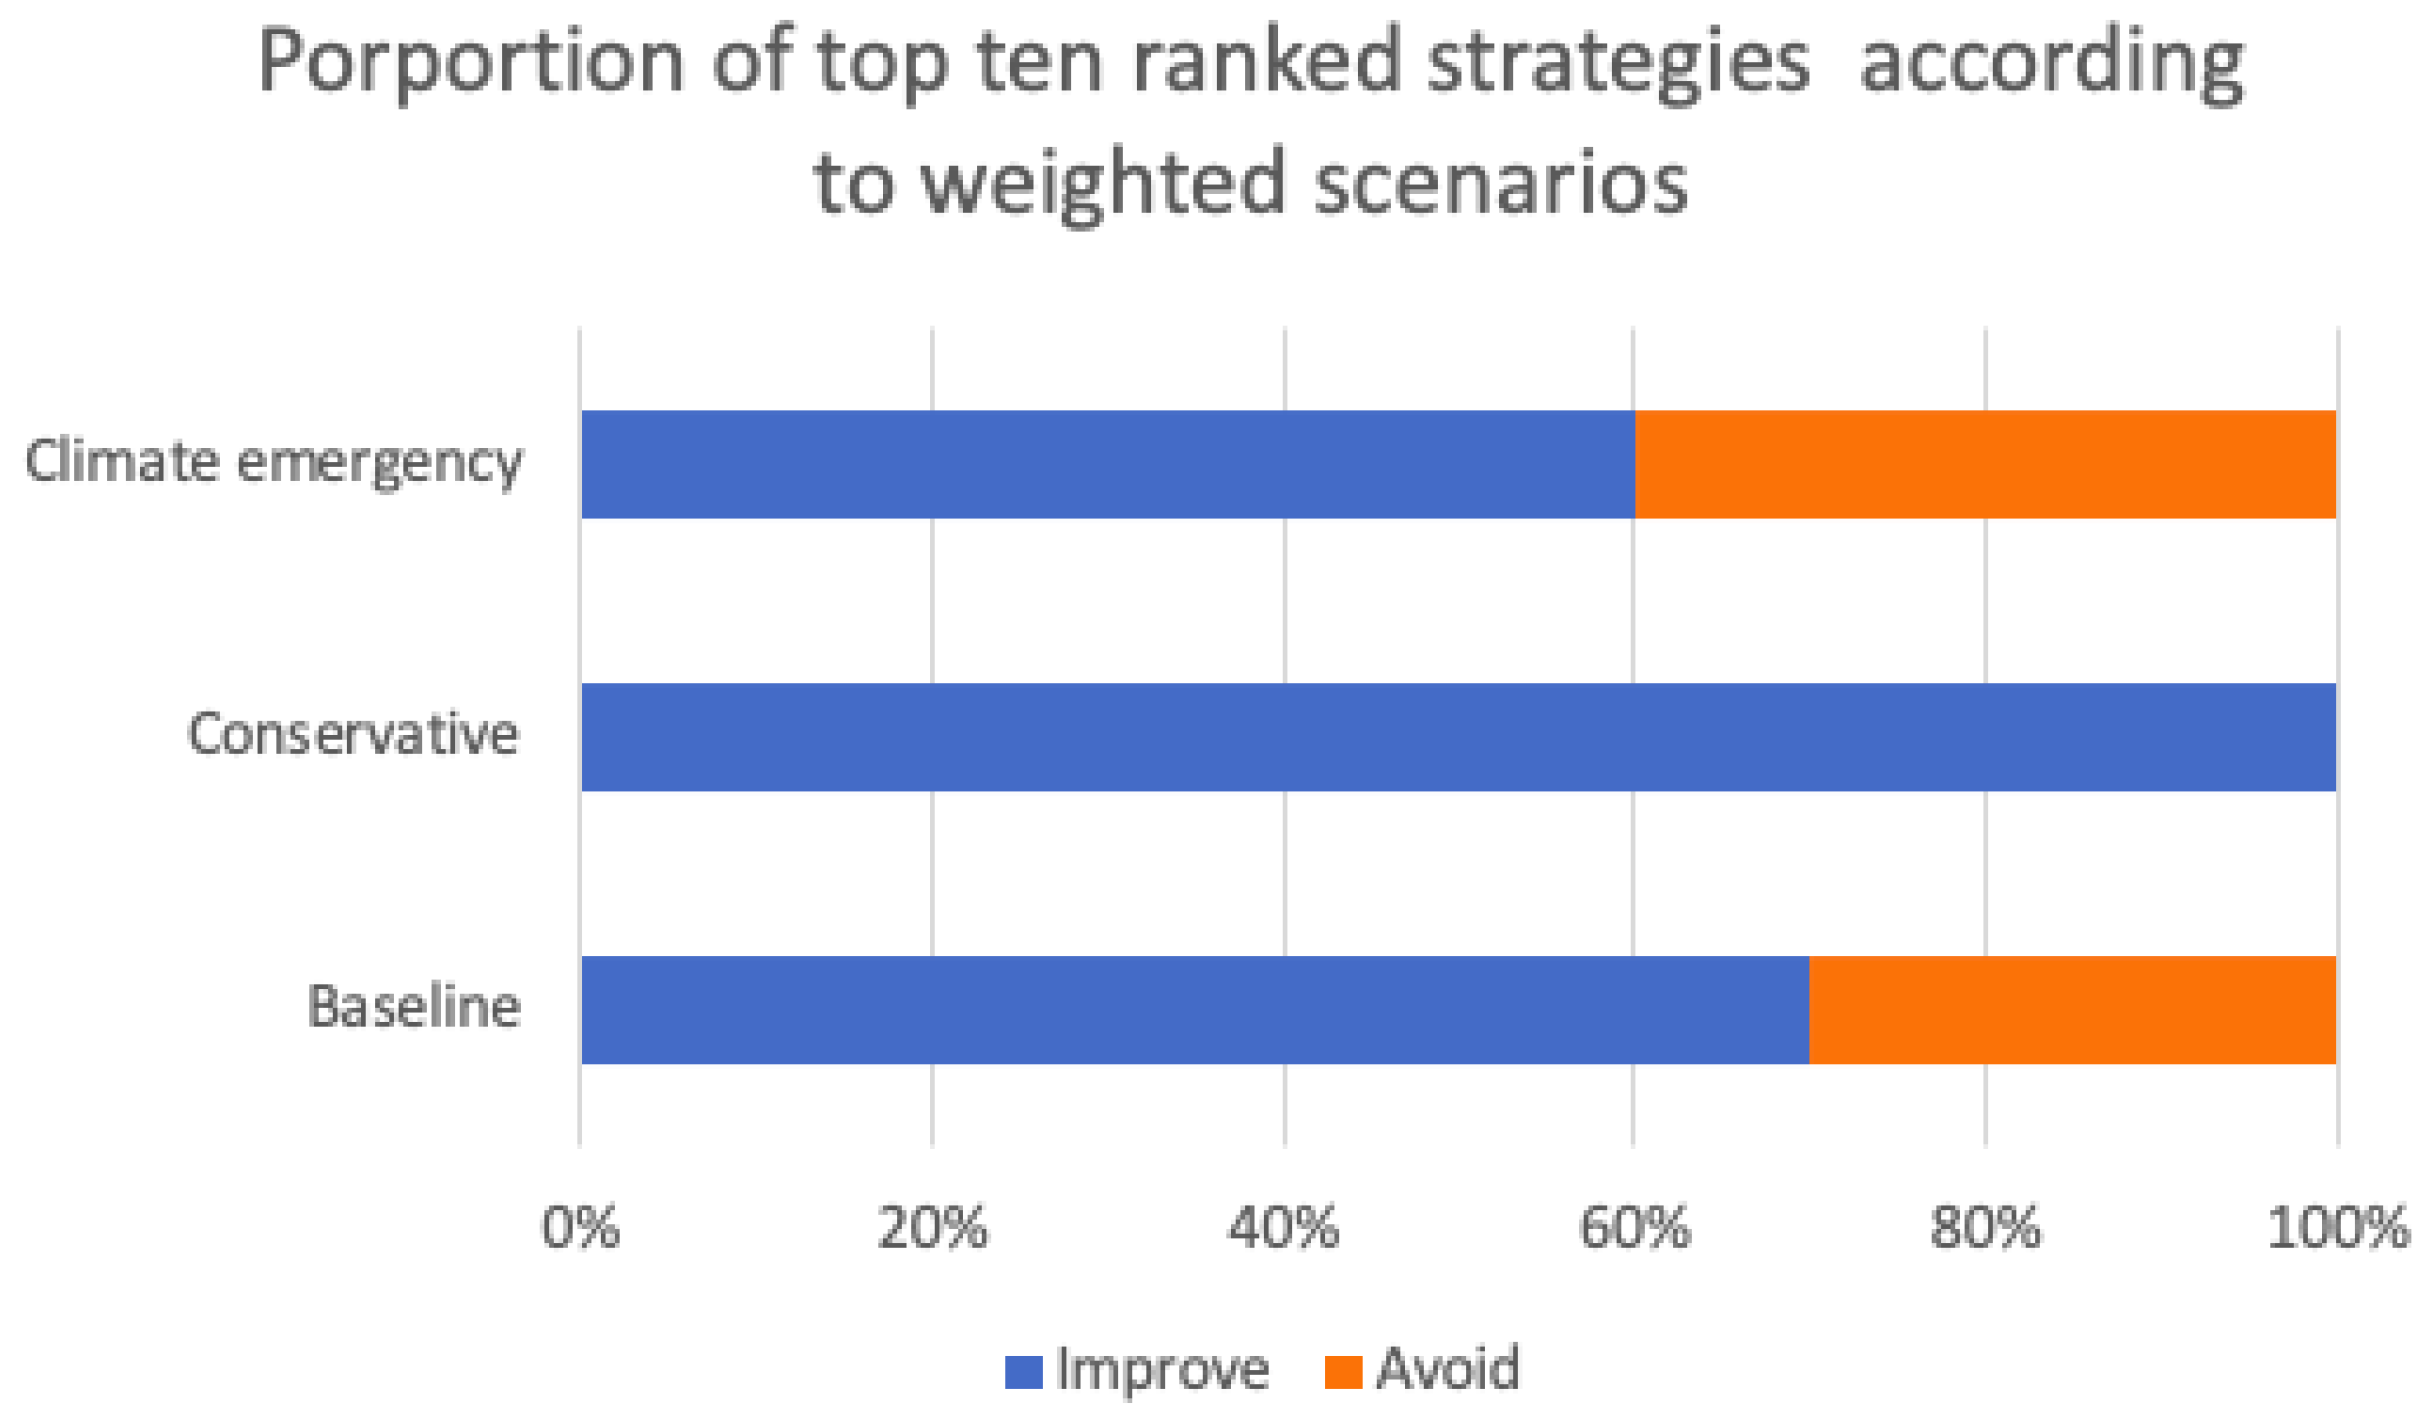
3.2. MCDM/TOPSIS Results
3.2.1. Baseline Scenario
3.2.2. Climate Emergency Scenario
3.2.3. Conservative Scenario
4. Discussion
4.1. Methane Metric Challenges
4.2. Measurement of Methane
4.3. Methane Reduction Strategies
4.4. Strategies in Perspective
4.5. Limitations of the Study
4.6. Recommendations and Future Research
5. Concluding Remarks
Author Contributions
Funding
Data Availability Statement
Conflicts of Interest
Appendix A. TOPSIS Equations Used in the Assessment of the Alternative Strategies (Yoon and Hwang [32])
Appendix B

| Author(s) | Article Number | Methane Reduction Strategy | % Reduction CH4/kg of ECM Milk or Boneless Trimmed Beef | Estimated Establishment Costs AUD | Technological Readiness | Compliance with Existing Laws and Regulations | New Policy Required | Feedlot and Grazing Systems | Applicable to Both Climatic Zones | Applicable to All Seasons |
|---|---|---|---|---|---|---|---|---|---|---|
| Thomas et al. (2021) [12] | 1 | Grain-finished feed formulation | 22.25 | 1.00 | 2.00 | 2.00 | 1.00 | 2.00 | 2.00 | 2.00 |
| Stifkens et al. (2022) [50] | 3 | 36% Leucaena leucocephala feed formulation | 25.09 | 1.00 | 2.00 | 2.00 | 1.00 | 3.00 | 1.00 | 2.00 |
| Ridoutt et al. (2022) [43] | 4 | Feed lot cattle supplemented with Asparagopsis taxiformis | 81.00 | 10.00 | 1.00 | 2.00 | 2.00 | 1.00 | 2.00 | 2.00 |
| Richardson et al. (2022) [46] | 7 | Low accuracy residual methane trait included in breeding standards | 1.78 | 1.00 | 2.00 | 2.00 | 2.00 | 3.00 | 2.00 | 2.00 |
| 7 | Higher accuracy residual methane trait included in breeding standards | 8.92 | 10.00 | 1.00 | 2.00 | 2.00 | 3.00 | 2.00 | 2.00 | |
| 7 | $150/t carbon tax + low accuracy residual methane trait included in breeding standards | 0.00 | 8.00 | 1.00 | 1.00 | 2.00 | 3.00 | 2.00 | 2.00 | |
| 7 | $250/t carbon tax + low accuracy residual methane trait included in breeding standards | 0.09 | 8.00 | 1.00 | 1.00 | 2.00 | 3.00 | 2.00 | 2.00 | |
| 7 | $500/t carbon tax + low accuracy residual methane trait included in breeding standards | 0.36 | 8.00 | 1.00 | 1.00 | 2.00 | 3.00 | 2.00 | 2.00 | |
| 7 | $1000/t carbon tax + low accuracy residual methane trait included in breeding standards | 0.71 | 8.00 | 1.00 | 1.00 | 2.00 | 3.00 | 2.00 | 2.00 | |
| 7 | $150/t carbon tax + higher accuracy residual methane trait included in breeding standards | 3.92 | 10.00 | 1.00 | 1.00 | 2.00 | 3.00 | 2.00 | 2.00 | |
| 7 | $250/t carbon tax + higher accuracy residual methane trait included in breeding standards | 5.17 | 10.00 | 1.00 | 1.00 | 2.00 | 3.00 | 2.00 | 2.00 | |
| 7 | $500/t carbon tax + higher accuracy residual methane trait included in breeding standards | 6.96 | 10.00 | 1.00 | 1.00 | 2.00 | 3.00 | 2.00 | 2.00 | |
| 7 | $1000/t carbon tax + higher accuracy residual methane trait included in breeding standards | 8.03 | 10.00 | 1.00 | 1.00 | 2.00 | 3.00 | 2.00 | 2.00 | |
| Parra et al. (2023) [51] | 10 | Inclusion of biochar and nitrates at 8% of DM | 22.83 | 1.00 | 2.00 | 2.00 | 1.00 | 3.00 | 2.00 | 2.00 |
| 10 | Inclusion of biochar and Asparagopsis at 5% of DM | 19.82 | 10.00 | 1.00 | 2.00 | 2.00 | 1.00 | 2.00 | 2.00 | |
| 10 | Inclusion of citral extract at 0.1% of DM | 41.00 | 1.00 | 1.00 | 2.00 | 1.00 | 3.00 | 2.00 | 2.00 | |
| Moate et al. (2020) [14] | 12 | Proportion of wheat is 15% of DMI | 12.35 | 1.00 | 2.00 | 2.00 | 1.00 | 3.00 | 2.00 | 2.00 |
| 12 | Proportion of wheat is 20% of DMI | 14.71 | 1.00 | 2.00 | 2.00 | 1.00 | 3.00 | 2.00 | 2.00 | |
| 12 | Proportion of wheat is 45% of DMI | 21.18 | 1.00 | 2.00 | 2.00 | 1.00 | 3.00 | 2.00 | 2.00 | |
| Manzanilla-Pech et al. (2021) [54] | 13 | Reduction of methane and DMI included in breeding goals | 16.66 | 1.00 | 2.00 | 2.00 | 2.00 | 2.00 | 2.00 | 2.00 |
| 13 | Methane production negatively economically valued at −0.30 c and DMI included in breeding goals | 36.11 | 1.00 | 2.00 | 2.00 | 2.00 | 2.00 | 2.00 | 2.00 | |
| 13 | Methane production negatively economically valued at −0.60 c per kg CH4 and DMI included in breeding goals | 58.33 | 1.00 | 2.00 | 2.00 | 2.00 | 2.00 | 2.00 | 2.00 | |
| 13 | Reduction of Methane and RFI included in breeding goals | 8.33 | 1.00 | 2.00 | 2.00 | 2.00 | 2.00 | 2.00 | 2.00 | |
| 13 | Methane production negatively economically valued at −0.30 c and RFI included in breeding goals | 27.78 | 1.00 | 2.00 | 2.00 | 2.00 | 2.00 | 2.00 | 2.00 | |
| 13 | Methane production negatively economically valued at −0.60 c per kg CH4 and RFI included in breeding goals | 47.22 | 1.00 | 2.00 | 2.00 | 2.00 | 2.00 | 2.00 | 2.00 | |
| Lean and Moate (2021) [20] | 15 | Ozone addition to water troughs | 20.00 | 4.00 | 1.00 | 2.00 | 2.00 | 3.00 | 2.00 | 2.00 |
| Nitrates supplementation | 10.00 | 1.00 | 2.00 | 2.00 | 2.00 | 2.00 | 2.00 | 2.00 | ||
| 3-nitro-oxypropanol | 30.50 | 1.00 | 2.00 | 1.00 | 2.00 | 1.00 | 2.00 | 2.00 | ||
| Iram et al. (2021) [45] | 16 | Conversion of land from ponded pasture to mangroves | 99.65 | 4.00 | 2.00 | 2.00 | 2.00 | 2.00 | 1.00 | 2.00 |
| Conversion of land from ponded pasture to freshwater tidal forest | 99.93 | 4.00 | 2.00 | 2.00 | 2.00 | 2.00 | 1.00 | 2.00 | ||
| Conversion of land from ponded pasture to salt marsh | 99.98 | 6.00 | 2.00 | 2.00 | 2.00 | 2.00 | 1.00 | 2.00 | ||
| Conversion of land from dry pasture to mangrove | −386.67 | 4.00 | 2.00 | 2.00 | 2.00 | 2.00 | 1.00 | 2.00 | ||
| Conversion of land from dry pasture to freshwater tidal forest | 6.67 | 4.00 | 2.00 | 2.00 | 2.00 | 2.00 | 1.00 | 2.00 | ||
| Conversion of land from dry pasture to salt marsh | 73.30 | 6.00 | 2.00 | 2.00 | 2.00 | 2.00 | 1.00 | 2.00 | ||
| Bai et al. (2020) [57] | 21 | Composting manure vs. stockpiling | 53.85 | 4.00 | 2.00 | 2.00 | 2.00 | 1.00 | 2.00 | 2.00 |
| Almeida et al. (2023) [17] | 24 | Improving fertility by 10% with 50% adoption rate | 2.97 | 1.00 | 2.00 | 2.00 | 2.00 | 3.00 | 1.00 | 2.00 |
| Improving fertility by 10% with 60% adoption rate | 3.56 | 1.00 | 2.00 | 2.00 | 2.00 | 3.00 | 1.00 | 2.00 | ||
| Improving fertility by 10% with 70% adoption rate | 4.16 | 1.00 | 2.00 | 2.00 | 2.00 | 3.00 | 1.00 | 2.00 | ||
| Improving fertility by 10% with 80% adoption | 4.75 | 1.00 | 2.00 | 2.00 | 2.00 | 3.00 | 1.00 | 2.00 | ||
| Improving fertility by 5% with 50% adoption | 1.56 | 1.00 | 2.00 | 2.00 | 2.00 | 3.00 | 1.00 | 2.00 | ||
| Improving fertility by 5% with 60% adoption | 1.87 | 1.00 | 2.00 | 2.00 | 2.00 | 3.00 | 1.00 | 2.00 | ||
| Improving fertility by 5% with 70% adoption | 2.18 | 1.00 | 2.00 | 2.00 | 2.00 | 3.00 | 1.00 | 2.00 | ||
| Improving fertility by 5% with 80% adoption | 2.50 | 1.00 | 2.00 | 2.00 | 2.00 | 3.00 | 1.00 | 2.00 | ||
| Kinley et al. (2020) [52] | 27 | 0.05% inclusion of Asparagopsis in OM | 0.20 | 1.00 | 1.00 | 2.00 | 2.00 | 1.00 | 2.00 | 2.00 |
| 0.10% inclusion of Asparagopsis in OM | 0.35 | 1.00 | 1.00 | 2.00 | 2.00 | 1.00 | 2.00 | 2.00 | ||
| 0.20% inclusion of Asparagopsis in OM | 0.82 | 1.00 | 1.00 | 2.00 | 2.00 | 1.00 | 2.00 | 2.00 |
Appendix C
| Strategy Type | Authors | Title | Study Summary | Extracted Data |
|---|---|---|---|---|
| Improve | Thomas et al. [12] | Net protein contribution and enteric methane production of pasture and grain-finished beef cattle supply chains | Enteric methane emissions from grass-fed and grain-fed beef supply chains were compared using net protein calculations resulting in grain-finished beef producing a lower net protein contribution value of 1.96 compared to 1597. | Grass-fed beef cattle produced a methane intensity of 10.06 kg of CO2e live weight compared to 7.82 kg of CO2e [12] resulting in 22.5% reduction in methane per kilogram of boneless trimmed weight according to Saner and Buseman (2020)’s methodology [39]. Grain estimated to be AUD 500/t based on June 2023 prices [79]. Barley, cottonseed, and cereal hay are readily available, comply with existing laws and regulations, and are implementable across both climatic zones, in all seasons and applicable to pasture systems if beef cattle relocated to feedlot for finishing. |
| Improve | Stifkens et al. [50] | Increasing the Proportion of Leucaena Leucocephala in Hay-Fed Beef Steers Reduces Methane Yield | Study compared impact of 36% inclusion of Leucaena leucocephala in diet of grazing cattle. | A 25.09% reduction in methane compared to control [50] based on boneless trimmed beef compared using Saner and Buseman (2020)’s methodology [39]. Cost considered based on industry pricing for AUD 250 per 500 mL of inoculum required plus AUD 250–300 per hectare planting estimation [80,81]. Successfully tested in the field, yet needs fertile soils to grow, limiting applicability in northern region [81]. Toxic to all mammals [82] and considered invasive species [81]. Farmers can choose to plant Leucaena as a forage species without need for new regulations, legislations, or policy. |
| Improve | Ridoutt et al. [43] | Potential GHG emission benefits of Asparagopsis taxiformis feed supplement in Australian beef cattle feedlots | Lifecycle assessment of feedlot cattle supplemented with 71.5 mg of bromoform per kilo of DMI. | An 81% reduction in methane as per previous in vivo trials [52,83]. Cost considered to be the highest due to new industry required for commercialisation with estimated of USD 39.5 million plus USD 5 million yearly [84]. More research needed for applicability to grazing cattle [43]. Northern region farmers most likely to give supplements in dry season [85]. Approved active constituents in Australia [86], but new policy required for commercialisation and wide-scale adoption. |
| Shift | Richardson et al. [46] | Reducing greenhouse gas emissions through genetic selection in the Australian dairy industry | Study compared current and future genetic accuracy of inclusion of GHG index in Balanced Performance Index (BPI) based on carbon prices of AUD 150/t, AUD 250/t, AUD 500/t, and AUD 1000/t. | Based on Richardson, Nguyen et al. (2021)’s calculations of 0.183 g of methane produced per cattle per day [55], 0, 0.05, 0.2, and 0.4 kg of methane were reduced under current genetic accuracy for AUD 150, AUD 250, AUD 500, and AUD 1000 carbon pricing per year, respectively Future genetic accuracy reduced methane by 2.2, 2.9, 3.9, and 4.5 kg for carbon pricing of AUD 150, AUD 250, AUD 500, and AUD 1000 per year, respectively [46]. Cost considered to be the highest to achieve greater genetic accuracy due to genetic research ranging from USD 150 to 300 million [87,88]. Not considered to be technologically ready until expected genetic accuracy reaches 0.54 or higher. Applicable to all systems, climates, and seasons without the need for legislative change; only policy change required to update BPI standards [53]. |
| Improve | Parra et al. 2023 [51] | In vitro screening of anti-methanogenic additives for use in Australian grazing systems | Study of methane reduction over 48 h of incubating rumen fluid in vitro testing with garlic powder, biochar and nitrates, biochar and Asparagopis Taxiformis, essential oil blend, citral extract, sandalwood essential oil, Bacillus probiotic additive, and sugar cane extract. | Based on a control of 19.32 mL/CH4 per gram of digestible matter, biochar and nitrates, biochar and Asparagopis, and citral extract significantly reduced methane reduction by 22.83%, 19.82%, and 4%, respectively. Biochar assumed to cost AUD 800/t [89], calcium nitrate, ammonium nitrate, or potassium nitrate estimated to be in the form of loose licks are considered to be ‘cost effective’ [90]; citral extract is EUR 163 per 500 ml [91] and considered to be low. Inclusion of Asparagopis was the highest cost due to requirement for establishing new industry [84]. Supplementation with Asparagopis and with citral were considered to be not technologically ready due to requirements for Asparagopis commercialisation [78], and further research for citral at higher-than-recommended doses due to digestion effects is needed [51]. Asparagopis requires new policy to establish commercialisation process and is only available in feedlot systems. |
| Improve | Moate et al. [14] | Influence of proportion of wheat in a pasture-based diet on milk yield, methane emissions, methane yield, and ruminal protozoa of dairy cows | Study compared various proportions of wheat in diet of dairy cattle over 47 days. | Diet supplemented with 15%, 20%, and 45% of DMI reduced methane by 12.35%, 14.71%, and 21.18% based on 17 g/kg per ECM of no-wheat diet [14]. Wheat estimated to be a low-cost feed supplement at AUD 485/t [92]. No compliance or readiness issues triggered. |
| Improve | Manzanilla-Pech et al. [54] | Breeding for reduced methane emission and feed-efficient Holstein cows: An international response | Study compared dairy genome databases from Australia, Canada, UK, US, and Denmark to determine genetic parameters of methane traits and response of including methane traits in breeding goals with negative economic values. | A 16.66%, 36.11%, and 58.33% reduction in methane based on methane production traits based on digestible matter intake, mean body weight, and energy-corrected milk included in breeding standards, valued at low and high economic values, respectively [54]. An 8.33%, 27.78%, and 47.22% reduction in methane based on methane production traits for residual feed intake, mean body weight, and energy-corrected milk for being included in breeding standards at no value, low value, and high value, respectively [54]. A new policy is required to update the national breeding objective to include methane traits [93]. Costs considered to be low, similarly due to minimal interventions being required, and the strategy applies to all systems, climates, and seasons. |
| Improve | Lean and Moate [20] | Cattle, climate and complexity: food security, quality and sustainability of the Australian cattle industries | Reviewed a number of strategies to reduce methane in the beef and dairy sector. | Strategies highlighted 20% reduction in methane with addition of ozonated water. Needs in vivo testing [20], not technologically ready, and costs to ozonate water troughs are expected to be higher than feed with commercial systems estimated around USD 3000 [94]. No policy, legislation, systems, or climate issues triggered. Nitrates decreased methane by 10%; considered to have low costs [90], and no policy, legislation, systems, or climate issues triggered. 3NOP reduced methane by 22% in beef cattle and 39% in dairy cattle, yet not currently available in Australia as approval is required as an animal feed from the government [20,95], and is low cost and applies to feedlot cattle. |
| Improve | Iram et al. [45] | Soil greenhouse gas fluxes from tropical coastal wetlands and alternative agricultural land uses | Study compared GHG fluxes from wet pastures, dry pastures, mangroves, freshwater tidal forest, salt marshes, and sugar cane fields in the Herbert Basin in Queensland, Australia. | Mangroves, salt marshes, and freshwater tidal forests existed naturally prior to agricultural pastures. Mangroves, freshwater tidal forests, and salt marshes produced 99.95%, 99.93%, and 99.98% less methane than wet pastures, respectively. Salt marshes and fresh water tidal forests produced 73.3% and 6.67% less than dry pastures while mangroves produced 386.67% more methane than dry pastures. Costs of restoration of land back to original habitat estimated at USD 40,000, USD 52,000, and USD 151,000 per hectare for coastal wetlands, freshwater tidal forests, and salt marshes, respectively [76]. Only applicable to pasture systems in any coastal region or river basin regardless of climate. Policy required for restoration of agricultural land. |
| Improve | Bai et al. [57] | Gas emissions during cattle manure composting and stockpiling | Study compared emissions from stockpiling emissions to windrow composting systems. | Total cumulative methane emissions were 53.85% less in windrow composting compared to stockpiling manure [57]. Costs estimated to be USD 62,000 upfront plus USD 31,000 yearly maintenance [96]. Only applicable to feedlot cattle and may require new policy to require non-static manure stockpiling. |
| Improve | Almeida et al. [17] | A regional-scale assessment of nutritional-system strategies for abatement of enteric methane from grazing livestock | This study simulated the impact of improving fertility on NSW’s beef cattle’s methane production. | A 5% increase in fertility by reducing age at joining reduced NSW emissions by 1.56%, 1.87%, 2.18%, and 2.5% for adoption rates of 50%, 60%, 70%, and 80%, respectively [17]. A 10% improvement in fertility reduced state emissions by 2.97%, 3.56%, 4.16%, and 4.75% subject to 50%, 60%, 70%, or 80% adoption rate [17]. With changes in feeding triggering early puberty, costs were considered to be low due to feed requirement, and can be implemented in any system or climate without need for policy or legislation. |
| Improve | Kinley et al. [52] | Mitigating the carbon footprint and improving productivity of ruminant livestock agriculture using a red seaweed | Low doses of Asparagopis were supplemented in the diet of feedlot beef cattle to compare various proportions of Asparagopis on methane production, feed intake, weight gain, and volatile fatty acid production. | Average daily weight gain was calculated for each of the dosages and used Saner and Buseman (2020)’s formula [39] to calculate methane production per kg of boneless trimmed beef. A 20%, 35%, and 82% reduction in methane was found, respectively, when Asparagopis doses of 0.05%, 0.10%, and 0.20% of organic matter were included in diet [52]. Commercialisation of Asparagopis is needed requiring new policies, legislation, and the highest level of funding to support development of new industry exceeding USD 40 million per farm [84]. Only applicable to feedlot cattle as part of total mixed rations [52], but can be applied in all seasons and production regions. |
Appendix D
| a. Baseline scenario | ||||||||||||||||
|---|---|---|---|---|---|---|---|---|---|---|---|---|---|---|---|---|
| Normalised Equalised Data | 0.125 | 0.125 | 0.125 | 0.125 | 0.125 | 0.125 | 0.125 | 0.125 | ||||||||
| Author/s | Article # | Methane Reduction Strategy | % Reduction CH4/kg of ECM Milk or Boneless Trimmed Beef | Estimated Costs AUD | Technological Readiness | Compliance with Existing Laws and Regulations | New Policy Required | Feedlot and Grazing Systems | Applicable to Both Climatic Zones | Applicable to All Seasons | Si+ | Si− | Si+ + Si− | Performance Score | Ranking | |
| Improve | Thomas et al. (2021) [12] | 1 | Grain-finished feed formulation | 0.0061 | 0.0037 | 0.0212 | 0.0200 | 0.0098 | 0.0147 | 0.0212 | 0.0184 | 0.0225 | 0.1187 | 0.1412 | 0.840621487 | 10 |
| Improve | Stifkens et al. (2022) [50] | 3 | 36% Leucaena leucocephala feed formulation | 0.0069 | 0.0037 | 0.0212 | 0.0200 | 0.0098 | 0.0221 | 0.0106 | 0.0184 | 0.0231 | 0.1197 | 0.1427 | 0.838355082 | 11 |
| Improve | Ridoutt et al. (2022) [43] | 4 | Feedlot cattle supplemented with Asparagopsis taxiformis | 0.0222 | 0.0368 | 0.0106 | 0.0200 | 0.0196 | 0.0074 | 0.0212 | 0.0184 | 0.0394 | 0.1288 | 0.1682 | 0.76579404 | 35 |
| Improve | Richardson et al. (2022) [46] | 7 | Low accuracy residual methane trait included in breeding standards | 0.0005 | 0.0037 | 0.0212 | 0.0200 | 0.0196 | 0.0221 | 0.0212 | 0.0184 | 0.0286 | 0.1138 | 0.1424 | 0.799093316 | 22 |
| Improve | 7 | Higher accuracy residual methane trait included in breeding standards | 0.0024 | 0.0368 | 0.0106 | 0.0200 | 0.0196 | 0.0221 | 0.0212 | 0.0184 | 0.0439 | 0.1102 | 0.1541 | 0.715070836 | 40 | |
| Shift | 7 | $150/t carbon tax + low accuracy residual methane trait included in breeding standards | 0.0000 | 0.0295 | 0.0106 | 0.0100 | 0.0196 | 0.0221 | 0.0212 | 0.0184 | 0.0415 | 0.1076 | 0.1491 | 0.721728038 | 39 | |
| Shift | 7 | $250/t carbon tax + low accuracy residual methane trait included in breeding standards | 0.0000 | 0.0295 | 0.0106 | 0.0100 | 0.0196 | 0.0221 | 0.0212 | 0.0184 | 0.0415 | 0.1076 | 0.1491 | 0.721851822 | 38 | |
| Shift | 7 | $500/t carbon tax + low accuracy residual methane trait included in breeding standards | 0.0001 | 0.0295 | 0.0106 | 0.0100 | 0.0196 | 0.0221 | 0.0212 | 0.0184 | 0.0414 | 0.1077 | 0.1491 | 0.722222853 | 37 | |
| Shift | 7 | $1000/t carbon tax + low accuracy residual methane trait included in breeding standards | 0.0002 | 0.0295 | 0.0106 | 0.0100 | 0.0196 | 0.0221 | 0.0212 | 0.0184 | 0.0414 | 0.1078 | 0.1492 | 0.722703108 | 36 | |
| Shift | 7 | $150/t carbon tax + higher accuracy residual methane trait included in breeding standards | 0.0011 | 0.0368 | 0.0106 | 0.0100 | 0.0196 | 0.0221 | 0.0212 | 0.0184 | 0.0458 | 0.1084 | 0.1542 | 0.702979188 | 45 | |
| Shift | 7 | $250/t carbon tax + higher accuracy residual methane trait included in breeding standards | 0.0014 | 0.0368 | 0.0106 | 0.0100 | 0.0196 | 0.0221 | 0.0212 | 0.0184 | 0.0456 | 0.1088 | 0.1544 | 0.70451813 | 44 | |
| Shift | 7 | $500/t carbon tax + higher accuracy residual methane trait included in breeding standards | 0.0019 | 0.0368 | 0.0106 | 0.0100 | 0.0196 | 0.0221 | 0.0212 | 0.0184 | 0.0453 | 0.1092 | 0.1546 | 0.706703235 | 43 | |
| Shift | 7 | $1000/t carbon tax + higher accuracy residual methane trait included in breeding standards | 0.0022 | 0.0368 | 0.0106 | 0.0100 | 0.0196 | 0.0221 | 0.0212 | 0.0184 | 0.0452 | 0.1095 | 0.1547 | 0.707998788 | 42 | |
| Improve | Parra et al. (2023) [51] | 10 | Inclusion of biochar and nitrates at 8% of DM | 0.0062 | 0.0037 | 0.0212 | 0.0200 | 0.0098 | 0.0221 | 0.0212 | 0.0184 | 0.0211 | 0.1196 | 0.1407 | 0.849917713 | 7 |
| 10 | Inclusion of biochar and Asparagopsis at 5% of DM | 0.0054 | 0.0368 | 0.0106 | 0.0200 | 0.0196 | 0.0074 | 0.0212 | 0.0184 | 0.0448 | 0.1122 | 0.1570 | 0.714676191 | 41 | ||
| 10 | Inclusion of citral extract at 0.1% of DM | 0.0112 | 0.0037 | 0.0106 | 0.0200 | 0.0098 | 0.0221 | 0.0212 | 0.0184 | 0.0193 | 0.1238 | 0.1431 | 0.865035721 | 5 | ||
| Improve | Moate et al. (2020) [14] | 12 | Proportion of wheat is 15% of DMI | 0.0034 | 0.0037 | 0.0212 | 0.0200 | 0.0098 | 0.0221 | 0.0212 | 0.0184 | 0.0240 | 0.1169 | 0.1409 | 0.829753499 | 16 |
| 12 | Proportion of wheat is 20% of DMI | 0.0040 | 0.0037 | 0.0212 | 0.0200 | 0.0098 | 0.0221 | 0.0212 | 0.0184 | 0.0233 | 0.1175 | 0.1408 | 0.834288801 | 14 | ||
| 12 | Proportion of wheat is 45% of DMI | 0.0058 | 0.0037 | 0.0212 | 0.0200 | 0.0098 | 0.0221 | 0.0212 | 0.0184 | 0.0216 | 0.1191 | 0.1407 | 0.846738883 | 8 | ||
| Improve | Manzanilla-Pech et al. (2021) [54] | 13 | Reduction of methane and DMI included in breeding goals | 0.0046 | 0.0037 | 0.0212 | 0.0200 | 0.0196 | 0.0147 | 0.0212 | 0.0184 | 0.0259 | 0.1169 | 0.1428 | 0.818690049 | 17 |
| 13 | Methane production negatively economically valued at −0.30 c and DMI included in breeding goals | 0.0099 | 0.0037 | 0.0212 | 0.0200 | 0.0196 | 0.0147 | 0.0212 | 0.0184 | 0.0213 | 0.1219 | 0.1433 | 0.851008137 | 6 | ||
| 13 | Methane production negatively economically valued at −0.60 c per kg CH4 and DMI included in breeding goals | 0.0160 | 0.0037 | 0.0212 | 0.0200 | 0.0196 | 0.0147 | 0.0212 | 0.0184 | 0.0167 | 0.1277 | 0.1444 | 0.884143824 | 1 | ||
| 13 | Reduction of methane and RFI included in breeding goals | 0.0023 | 0.0037 | 0.0212 | 0.0200 | 0.0196 | 0.0147 | 0.0212 | 0.0184 | 0.0279 | 0.1147 | 0.1426 | 0.804312142 | 20 | ||
| 13 | Methane production negatively economically valued at −0.30 c and RFI included in breeding goals | 0.0076 | 0.0037 | 0.0212 | 0.0200 | 0.0196 | 0.0147 | 0.0212 | 0.0184 | 0.0232 | 0.1198 | 0.1430 | 0.83742916 | 12 | ||
| 13 | Methane production negatively economically valued at −0.60 c per kg CH4 and RFI included in breeding goals | 0.0129 | 0.0037 | 0.0212 | 0.0200 | 0.0196 | 0.0147 | 0.0212 | 0.0184 | 0.0189 | 0.1248 | 0.1437 | 0.868264667 | 4 | ||
| Improve | Lean and Moate (2021) [20] | 15 | Ozone addition to water troughs | 0.0055 | 0.0147 | 0.0106 | 0.0200 | 0.0196 | 0.0221 | 0.0212 | 0.0184 | 0.0285 | 0.1153 | 0.1438 | 0.80212983 | 21 |
| Nitrates supplementation | 0.0027 | 0.0037 | 0.0212 | 0.0200 | 0.0196 | 0.0147 | 0.0212 | 0.0184 | 0.0275 | 0.1152 | 0.1427 | 0.807213855 | 19 | |||
| 3-nitro-oxypropanol | 0.0083 | 0.0037 | 0.0212 | 0.0100 | 0.0196 | 0.0074 | 0.0212 | 0.0184 | 0.0278 | 0.1198 | 0.1476 | 0.811574982 | 18 | |||
| Avoid | Iram et al. (2021) [45] | 16 | Conversion of land from ponded pasture to mangroves | 0.0273 | 0.0147 | 0.0212 | 0.0200 | 0.0196 | 0.0147 | 0.0106 | 0.0184 | 0.0196 | 0.1359 | 0.1555 | 0.873869997 | 3 |
| Conversion of land from ponded pasture to freshwater tidal forest | 0.0273 | 0.0147 | 0.0212 | 0.0200 | 0.0196 | 0.0147 | 0.0106 | 0.0184 | 0.0196 | 0.1360 | 0.1556 | 0.873931975 | 2 | |||
| Conversion of land from ponded pasture to salt marsh | 0.0274 | 0.0221 | 0.0212 | 0.0200 | 0.0196 | 0.0147 | 0.0106 | 0.0184 | 0.0245 | 0.1350 | 0.1595 | 0.846195394 | 9 | |||
| Conversion of land from dry pasture to mangrove | −0.1058 | 0.0147 | 0.0212 | 0.0200 | 0.0196 | 0.0147 | 0.0106 | 0.0184 | 0.1346 | 0.0275 | 0.1621 | 0.169513828 | 46 | |||
| Conversion of land from dry pasture to freshwater tidal forest | 0.0018 | 0.0147 | 0.0212 | 0.0200 | 0.0196 | 0.0147 | 0.0106 | 0.0184 | 0.0322 | 0.1111 | 0.1433 | 0.77529276 | 31 | |||
| Conversion of land from dry pasture to salt marsh | 0.0201 | 0.0221 | 0.0212 | 0.0200 | 0.0196 | 0.0147 | 0.0106 | 0.0184 | 0.0256 | 0.1278 | 0.1534 | 0.833110524 | 15 | |||
| Improve | Bai et al. (2020) [57] | 21 | Composting manure vs. stockpiling | 0.0147 | 0.0147 | 0.0212 | 0.0200 | 0.0196 | 0.0074 | 0.0212 | 0.0184 | 0.0244 | 0.1239 | 0.1483 | 0.835554123 | 13 |
| Improve | Almeida et al. (2023) [17] | 24 | Improving fertility by 10% with 50% adoption rate | 0.0008 | 0.0037 | 0.0212 | 0.0200 | 0.0196 | 0.0221 | 0.0106 | 0.0184 | 0.0302 | 0.1136 | 0.1438 | 0.789851064 | 26 |
| Improving fertility by 10% with 60% adoption rate | 0.0010 | 0.0037 | 0.0212 | 0.0200 | 0.0196 | 0.0221 | 0.0106 | 0.0184 | 0.0301 | 0.1137 | 0.1438 | 0.790851256 | 25 | |||
| Improving fertility by 10% with 70% adoption rate | 0.0011 | 0.0037 | 0.0212 | 0.0200 | 0.0196 | 0.0221 | 0.0106 | 0.0184 | 0.0299 | 0.1139 | 0.1438 | 0.791867173 | 24 | |||
| Improving fertility by 10% with 80% adoption | 0.0013 | 0.0037 | 0.0212 | 0.0200 | 0.0196 | 0.0221 | 0.0106 | 0.0184 | 0.0298 | 0.1140 | 0.1438 | 0.79286493 | 23 | |||
| Improving fertility by 5% with 50% adoption | 0.0004 | 0.0037 | 0.0212 | 0.0200 | 0.0196 | 0.0221 | 0.0106 | 0.0184 | 0.0306 | 0.1132 | 0.1438 | 0.787456045 | 30 | |||
| Improving fertility by 5% with 60% adoption | 0.0005 | 0.0037 | 0.0212 | 0.0200 | 0.0196 | 0.0221 | 0.0106 | 0.0184 | 0.0305 | 0.1133 | 0.1438 | 0.787983172 | 29 | |||
| Improving fertility by 5% with 70% adoption | 0.0006 | 0.0037 | 0.0212 | 0.0200 | 0.0196 | 0.0221 | 0.0106 | 0.0184 | 0.0304 | 0.1134 | 0.1438 | 0.788509985 | 28 | |||
| Improving fertility by 5% with 80% adoption | 0.0007 | 0.0037 | 0.0212 | 0.0200 | 0.0196 | 0.0221 | 0.0106 | 0.0184 | 0.0303 | 0.1134 | 0.1438 | 0.789053458 | 27 | |||
| Improve | Kinley et al. (2020) [52] | 27 | 0.05% inclusion of Asparagopsis in OM | 0.0001 | 0.0037 | 0.0106 | 0.0200 | 0.0196 | 0.0074 | 0.0212 | 0.0184 | 0.0342 | 0.1119 | 0.1461 | 0.765801601 | 34 |
| 0.10% inclusion of Asparagopsis in OM | 0.0001 | 0.0037 | 0.0106 | 0.0200 | 0.0196 | 0.0074 | 0.0212 | 0.0184 | 0.0342 | 0.1119 | 0.1461 | 0.766036889 | 33 | |||
| 0.20% inclusion of Asparagopsis in OM | 0.0002 | 0.0037 | 0.0106 | 0.0200 | 0.0196 | 0.0074 | 0.0212 | 0.0184 | 0.0341 | 0.1121 | 0.1461 | 0.766770252 | 32 | |||
| b. Conservative scenario | ||||||||||||||||
| Conservatively Weighted Data | 0.029 | 0.8 | 0.029 | 0.029 | 0.029 | 0.029 | 0.029 | 0.029 | ||||||||
| Author/s | Article # | Methane Reduction Strategy | % Reduction CH4/kg of ECM Milk or Boneless Trimmed Beef | Estimated Costs AUD | Technological Readiness | Compliance with Existing Laws and Regulations | New Policy Required | Feedlot and Grazing Systems | Applicable to Both Climatic Zones | Applicable to All Seasons | Si+ | Si− | Si+ + Si− | Performance Score | Ranking | |
| Improve | Thomas et al. (2021) [12] | 1 | Grain-finished feed formulation | 0.0014 | 0.0236 | 0.0049 | 0.0046 | 0.0023 | 0.0034 | 0.0049 | 0.0043 | 0.0052 | 0.2139 | 0.2191 | 0.9761628 | 7 |
| Improve | Stifkens et al. (2022) [50] | 3 | 36% Leucaena leucocephala feed formulation | 0.0016 | 0.0236 | 0.0049 | 0.0046 | 0.0023 | 0.0051 | 0.0025 | 0.0043 | 0.0054 | 0.2139 | 0.2192 | 0.97558359 | 8 |
| Improve | Ridoutt et al. (2022) [43] | 4 | Feedlot cattle supplemented with Asparagopsis taxiformis | 0.0051 | 0.2358 | 0.0025 | 0.0046 | 0.0045 | 0.0017 | 0.0049 | 0.0043 | 0.2123 | 0.0299 | 0.2422 | 0.12340019 | 40 |
| Improve | Richardson et al. (2022) [46] | 7 | Low accuracy residual methane trait included in breeding standards | 0.0001 | 0.0236 | 0.0049 | 0.0046 | 0.0045 | 0.0051 | 0.0049 | 0.0043 | 0.0066 | 0.2137 | 0.2204 | 0.9698875 | 16 |
| Improve | 7 | Higher accuracy residual methane trait included in breeding standards | 0.0006 | 0.2358 | 0.0025 | 0.0046 | 0.0045 | 0.0051 | 0.0049 | 0.0043 | 0.2123 | 0.0256 | 0.2379 | 0.10748597 | 42 | |
| Shift | 7 | $150/t carbon tax + low accuracy residual methane trait included in breeding standards | 0.0000 | 0.1886 | 0.0025 | 0.0023 | 0.0045 | 0.0051 | 0.0049 | 0.0043 | 0.1652 | 0.0533 | 0.2186 | 0.24401494 | 39 | |
| Shift | 7 | $250/t carbon tax + low accuracy residual methane trait included in breeding standards | 0.0000 | 0.1886 | 0.0025 | 0.0023 | 0.0045 | 0.0051 | 0.0049 | 0.0043 | 0.1652 | 0.0533 | 0.2186 | 0.24402428 | 38 | |
| Shift | 7 | $500/t carbon tax + low accuracy residual methane trait included in breeding standards | 0.0000 | 0.1886 | 0.0025 | 0.0023 | 0.0045 | 0.0051 | 0.0049 | 0.0043 | 0.1652 | 0.0533 | 0.2186 | 0.24405232 | 37 | |
| Shift | 7 | $1000/t carbon tax + low accuracy residual methane trait included in breeding standards | 0.0000 | 0.1886 | 0.0025 | 0.0023 | 0.0045 | 0.0051 | 0.0049 | 0.0043 | 0.1652 | 0.0534 | 0.2186 | 0.24408868 | 36 | |
| Shift | 7 | $150/t carbon tax + higher accuracy residual methane trait included in breeding standards | 0.0002 | 0.2358 | 0.0025 | 0.0023 | 0.0045 | 0.0051 | 0.0049 | 0.0043 | 0.2124 | 0.0252 | 0.2375 | 0.10590553 | 46 | |
| Shift | 7 | $250/t carbon tax + higher accuracy residual methane trait included in breeding standards | 0.0003 | 0.2358 | 0.0025 | 0.0023 | 0.0045 | 0.0051 | 0.0049 | 0.0043 | 0.2123 | 0.0252 | 0.2376 | 0.106201 | 45 | |
| Shift | 7 | $500/t carbon tax + higher accuracy residual methane trait included in breeding standards | 0.0004 | 0.2358 | 0.0025 | 0.0023 | 0.0045 | 0.0051 | 0.0049 | 0.0043 | 0.2123 | 0.0253 | 0.2377 | 0.10662381 | 44 | |
| Shift | 7 | $1000/t carbon tax + higher accuracy residual methane trait included in breeding standards | 0.0005 | 0.2358 | 0.0025 | 0.0023 | 0.0045 | 0.0051 | 0.0049 | 0.0043 | 0.2123 | 0.0254 | 0.2378 | 0.10687637 | 43 | |
| Improve | Parra et al. (2023) [51] | 10 | Inclusion of biochar and nitrates at 8% of DM | 0.0014 | 0.0236 | 0.0049 | 0.0046 | 0.0023 | 0.0051 | 0.0049 | 0.0043 | 0.0049 | 0.2139 | 0.2188 | 0.97761249 | 4 |
| 10 | Inclusion of biochar and Asparagopsis at 5% of DM | 0.0013 | 0.2358 | 0.0025 | 0.0046 | 0.0045 | 0.0017 | 0.0049 | 0.0043 | 0.2123 | 0.0260 | 0.2384 | 0.10919116 | 41 | ||
| 10 | Inclusion of citral extract at 0.1% of DM | 0.0026 | 0.0236 | 0.0025 | 0.0046 | 0.0023 | 0.0051 | 0.0049 | 0.0043 | 0.0045 | 0.2140 | 0.2185 | 0.9794944 | 3 | ||
| Improve | Moate et al. (2020) [14] | 12 | Proportion of wheat is 15% of DMI | 0.0008 | 0.0236 | 0.0049 | 0.0046 | 0.0023 | 0.0051 | 0.0049 | 0.0043 | 0.0056 | 0.2138 | 0.2194 | 0.97463926 | 11 |
| 12 | Proportion of wheat is 20% of DMI | 0.0009 | 0.0236 | 0.0049 | 0.0046 | 0.0023 | 0.0051 | 0.0049 | 0.0043 | 0.0054 | 0.2138 | 0.2192 | 0.9753074 | 10 | ||
| 12 | Proportion of wheat is 45% of DMI | 0.0013 | 0.0236 | 0.0049 | 0.0046 | 0.0023 | 0.0051 | 0.0049 | 0.0043 | 0.0050 | 0.2139 | 0.2189 | 0.97714331 | 6 | ||
| Improve | Manzanilla-Pech et al. (2021) [54] | 13 | Reduction of methane and DMI included in breeding goals | 0.0011 | 0.0236 | 0.0049 | 0.0046 | 0.0045 | 0.0034 | 0.0049 | 0.0043 | 0.0060 | 0.2138 | 0.2198 | 0.97268086 | 12 |
| 13 | Methane production negatively economically valued at −0.30 c and DMI included in breeding goals | 0.0023 | 0.0236 | 0.0049 | 0.0046 | 0.0045 | 0.0034 | 0.0049 | 0.0043 | 0.0050 | 0.2140 | 0.2189 | 0.97737908 | 5 | ||
| 13 | Methane production negatively economically valued at −0.60 c per kg CH4 and DMI included in breeding goals | 0.0037 | 0.0236 | 0.0049 | 0.0046 | 0.0045 | 0.0034 | 0.0049 | 0.0043 | 0.0039 | 0.2141 | 0.2180 | 0.98219361 | 1 | ||
| 13 | Reduction of methane and RFI included in breeding goals | 0.0005 | 0.0236 | 0.0049 | 0.0046 | 0.0045 | 0.0034 | 0.0049 | 0.0043 | 0.0065 | 0.2137 | 0.2202 | 0.97059409 | 15 | ||
| 13 | Methane production negatively economically valued at −0.30 c and RFI included in breeding goals | 0.0018 | 0.0236 | 0.0049 | 0.0046 | 0.0045 | 0.0034 | 0.0049 | 0.0043 | 0.0054 | 0.2139 | 0.2193 | 0.97540405 | 9 | ||
| 13 | Methane production negatively economically valued at −0.60 c per kg CH4 and RFI included in breeding goals | 0.0030 | 0.0236 | 0.0049 | 0.0046 | 0.0045 | 0.0034 | 0.0049 | 0.0043 | 0.0044 | 0.2141 | 0.2184 | 0.97988897 | 2 | ||
| Improve | Lean and Moate (2021) [20] | 15 | Ozone addition to water troughs | 0.0013 | 0.0943 | 0.0025 | 0.0046 | 0.0045 | 0.0051 | 0.0049 | 0.0043 | 0.0710 | 0.1439 | 0.2149 | 0.66960565 | 31 |
| Nitrates supplementation | 0.0006 | 0.0236 | 0.0049 | 0.0046 | 0.0045 | 0.0034 | 0.0049 | 0.0043 | 0.0064 | 0.2138 | 0.2201 | 0.97101503 | 13 | |||
| 3-nitro-oxypropanol | 0.0019 | 0.0236 | 0.0049 | 0.0023 | 0.0045 | 0.0017 | 0.0049 | 0.0043 | 0.0065 | 0.2139 | 0.2204 | 0.9707102 | 14 | |||
| Avoid | Iram et al. (2021) [45] | 16 | Conversion of land from ponded pasture to mangroves | 0.0063 | 0.0943 | 0.0049 | 0.0046 | 0.0045 | 0.0034 | 0.0025 | 0.0043 | 0.0708 | 0.1449 | 0.2157 | 0.67158033 | 29 |
| Conversion of land from ponded pasture to freshwater tidal forest | 0.0063 | 0.0943 | 0.0049 | 0.0046 | 0.0045 | 0.0034 | 0.0025 | 0.0043 | 0.0708 | 0.1449 | 0.2157 | 0.67158611 | 28 | |||
| Conversion of land from ponded pasture to salt marsh | 0.0063 | 0.1415 | 0.0049 | 0.0046 | 0.0045 | 0.0034 | 0.0025 | 0.0043 | 0.1180 | 0.0993 | 0.2173 | 0.45711502 | 34 | |||
| Conversion of land from dry pasture to mangrove | −0.0245 | 0.0943 | 0.0049 | 0.0046 | 0.0045 | 0.0034 | 0.0025 | 0.0043 | 0.0773 | 0.1415 | 0.2188 | 0.64680551 | 33 | |||
| Conversion of land from dry pasture to freshwater tidal forest | 0.0004 | 0.0943 | 0.0049 | 0.0046 | 0.0045 | 0.0034 | 0.0025 | 0.0043 | 0.0711 | 0.1437 | 0.2148 | 0.66906062 | 32 | |||
| Conversion of land from dry pasture to salt marsh | 0.0047 | 0.1415 | 0.0049 | 0.0046 | 0.0045 | 0.0034 | 0.0025 | 0.0043 | 0.1180 | 0.0988 | 0.2168 | 0.45580272 | 35 | |||
| Improve | Bai et al. (2020) [57] | 21 | Composting manure vs. stockpiling | 0.0034 | 0.0943 | 0.0049 | 0.0046 | 0.0045 | 0.0017 | 0.0049 | 0.0043 | 0.0709 | 0.1443 | 0.2152 | 0.6704453 | 30 |
| Improve | Almeida et al. (2023) [17] | 24 | Improving fertility by 10% with 50% adoption rate | 0.0002 | 0.0236 | 0.0049 | 0.0046 | 0.0045 | 0.0051 | 0.0025 | 0.0043 | 0.0070 | 0.2137 | 0.2207 | 0.96823999 | 20 |
| Improving fertility by 10% with 60% adoption rate | 0.0002 | 0.0236 | 0.0049 | 0.0046 | 0.0045 | 0.0051 | 0.0025 | 0.0043 | 0.0070 | 0.2137 | 0.2207 | 0.96838489 | 19 | |||
| Improving fertility by 10% with 70% adoption rate | 0.0003 | 0.0236 | 0.0049 | 0.0046 | 0.0045 | 0.0051 | 0.0025 | 0.0043 | 0.0069 | 0.2137 | 0.2207 | 0.96853209 | 18 | |||
| Improving fertility by 10% with 80% adoption | 0.0003 | 0.0236 | 0.0049 | 0.0046 | 0.0045 | 0.0051 | 0.0025 | 0.0043 | 0.0069 | 0.2137 | 0.2206 | 0.96867666 | 17 | |||
| Improving fertility by 5% with 50% adoption | 0.0001 | 0.0236 | 0.0049 | 0.0046 | 0.0045 | 0.0051 | 0.0025 | 0.0043 | 0.0071 | 0.2137 | 0.2208 | 0.96789304 | 24 | |||
| Improving fertility by 5% with 60% adoption | 0.0001 | 0.0236 | 0.0049 | 0.0046 | 0.0045 | 0.0051 | 0.0025 | 0.0043 | 0.0071 | 0.2137 | 0.2208 | 0.96796939 | 23 | |||
| Improving fertility by 5% with 70% adoption | 0.0001 | 0.0236 | 0.0049 | 0.0046 | 0.0045 | 0.0051 | 0.0025 | 0.0043 | 0.0071 | 0.2137 | 0.2208 | 0.96804571 | 22 | |||
| Improving fertility by 5% with 80% adoption | 0.0002 | 0.0236 | 0.0049 | 0.0046 | 0.0045 | 0.0051 | 0.0025 | 0.0043 | 0.0070 | 0.2137 | 0.2207 | 0.96812444 | 21 | |||
| Improve | Kinley et al. (2020) [52] | 27 | 0.05% inclusion of Asparagopsis in OM | 0.0000 | 0.0236 | 0.0025 | 0.0046 | 0.0045 | 0.0017 | 0.0049 | 0.0043 | 0.0079 | 0.2137 | 0.2216 | 0.96417621 | 27 |
| 0.10% inclusion of Asparagopsis in OM | 0.0000 | 0.0236 | 0.0025 | 0.0046 | 0.0045 | 0.0017 | 0.0049 | 0.0043 | 0.0079 | 0.2137 | 0.2216 | 0.96420965 | 26 | |||
| 0.20% inclusion of Asparagopsis in OM | 0.0001 | 0.0236 | 0.0025 | 0.0046 | 0.0045 | 0.0017 | 0.0049 | 0.0043 | 0.0079 | 0.2137 | 0.2216 | 0.96431385 | 25 | |||
| c. Climate emergency scenario | ||||||||||||||||
| Climate Emergency Weighted Data | 0.4 | 0.029 | 0.029 | 0.029 | 0.029 | 0.4 | 0.029 | 0.029 | ||||||||
| Author/s | Article # | Methane Reduction Strategy | % reduction CH4/kg of ECM Milk or Boneless Trimmed Beef | Estimated Costs AUD | Technological Readiness | Compliance with Existing Laws and Regulations | New Policy Required | Feedlot and Grazing Systems | Applicable to both Climatic Zones | Applicable to All Seasons | Si+ | Si− | Si+ + Si− | Performance Score | Ranking | |
| Improve | Thomas et al. (2021) [12] | 1 | Grain-finished feed formulation | 0.0195 | 0.0009 | 0.0049 | 0.0046 | 0.0023 | 0.0471 | 0.0049 | 0.0043 | 0.0720 | 0.3590 | 0.4310 | 0.83287418 | 16 |
| Improve | Stifkens et al. (2022) [50] | 3 | 36% Leucaena leucocephala feed formulation | 0.0220 | 0.0009 | 0.0049 | 0.0046 | 0.0023 | 0.0707 | 0.0025 | 0.0043 | 0.0656 | 0.3638 | 0.4294 | 0.84715733 | 11 |
| Improve | Ridoutt et al. (2022) [43] | 4 | Feedlot cattle supplemented with Asparagopsis taxiformis | 0.0709 | 0.0085 | 0.0025 | 0.0046 | 0.0045 | 0.0236 | 0.0049 | 0.0043 | 0.0507 | 0.4096 | 0.4602 | 0.88987446 | 6 |
| Improve | Richardson et al. (2022) [46] | 7 | Low accuracy residual methane trait included in breeding standards | 0.0016 | 0.0009 | 0.0049 | 0.0046 | 0.0045 | 0.0707 | 0.0049 | 0.0043 | 0.0860 | 0.3435 | 0.4296 | 0.79973606 | 37 |
| Improve | 7 | Higher accuracy residual methane trait included in breeding standards | 0.0078 | 0.0085 | 0.0025 | 0.0046 | 0.0045 | 0.0707 | 0.0049 | 0.0043 | 0.0802 | 0.3496 | 0.4298 | 0.81344855 | 21 | |
| Shift | 7 | $150/t carbon tax + low accuracy residual methane trait included in breeding standards | 0.0000 | 0.0068 | 0.0025 | 0.0023 | 0.0045 | 0.0707 | 0.0049 | 0.0043 | 0.0879 | 0.3419 | 0.4297 | 0.79557007 | 42 | |
| Shift | 7 | $250/t carbon tax + low accuracy residual methane trait included in breeding standards | 0.0001 | 0.0068 | 0.0025 | 0.0023 | 0.0045 | 0.0707 | 0.0049 | 0.0043 | 0.0878 | 0.3420 | 0.4297 | 0.79575262 | 41 | |
| Shift | 7 | $500/t carbon tax + low accuracy residual methane trait included in breeding standards | 0.0003 | 0.0068 | 0.0025 | 0.0023 | 0.0045 | 0.0707 | 0.0049 | 0.0043 | 0.0875 | 0.3422 | 0.4297 | 0.79630024 | 40 | |
| Shift | 7 | $1000/t carbon tax + low accuracy residual methane trait included in breeding standards | 0.0006 | 0.0068 | 0.0025 | 0.0023 | 0.0045 | 0.0707 | 0.0049 | 0.0043 | 0.0872 | 0.3425 | 0.4297 | 0.79701012 | 39 | |
| Shift | 7 | $150/t carbon tax + higher accuracy residual methane trait included in breeding standards | 0.0034 | 0.0085 | 0.0025 | 0.0023 | 0.0045 | 0.0707 | 0.0049 | 0.0043 | 0.0846 | 0.3453 | 0.4299 | 0.80325993 | 31 | |
| Shift | 7 | $250/t carbon tax + higher accuracy residual methane trait included in breeding standards | 0.0045 | 0.0085 | 0.0025 | 0.0023 | 0.0045 | 0.0707 | 0.0049 | 0.0043 | 0.0835 | 0.3464 | 0.4298 | 0.80579079 | 26 | |
| Shift | 7 | $500/t carbon tax + higher accuracy residual methane trait included in breeding standards | 0.0061 | 0.0085 | 0.0025 | 0.0023 | 0.0045 | 0.0707 | 0.0049 | 0.0043 | 0.0819 | 0.3479 | 0.4298 | 0.80941461 | 23 | |
| Shift | 7 | $1000/t carbon tax + higher accuracy residual methane trait included in breeding standards | 0.0070 | 0.0085 | 0.0025 | 0.0023 | 0.0045 | 0.0707 | 0.0049 | 0.0043 | 0.0810 | 0.3488 | 0.4298 | 0.81158057 | 22 | |
| Improve | Parra et al. (2023) [51] | 10 | Inclusion of biochar and nitrates at 8% of DM | 0.0200 | 0.0009 | 0.0049 | 0.0046 | 0.0023 | 0.0707 | 0.0049 | 0.0043 | 0.0676 | 0.3618 | 0.4294 | 0.84264807 | 13 |
| 10 | Inclusion of biochar and Asparagopsis at 5% of DM | 0.0174 | 0.0085 | 0.0025 | 0.0046 | 0.0045 | 0.0236 | 0.0049 | 0.0043 | 0.0850 | 0.3560 | 0.4410 | 0.8073001 | 25 | ||
| 10 | Inclusion of citral extract at 0.1% of DM | 0.0359 | 0.0009 | 0.0025 | 0.0046 | 0.0023 | 0.0707 | 0.0049 | 0.0043 | 0.0517 | 0.3776 | 0.4293 | 0.87954682 | 8 | ||
| Improve | Moate et al. (2020) [14] | 12 | Proportion of wheat is 15% of DMI | 0.0108 | 0.0009 | 0.0049 | 0.0046 | 0.0023 | 0.0707 | 0.0049 | 0.0043 | 0.0767 | 0.3527 | 0.4294 | 0.82130814 | 20 |
| 12 | Proportion of wheat is 20% of DMI | 0.0129 | 0.0009 | 0.0049 | 0.0046 | 0.0023 | 0.0707 | 0.0049 | 0.0043 | 0.0747 | 0.3548 | 0.4294 | 0.82611282 | 17 | ||
| 12 | Proportion of wheat is 45% of DMI | 0.0185 | 0.0009 | 0.0049 | 0.0046 | 0.0023 | 0.0707 | 0.0049 | 0.0043 | 0.0690 | 0.3604 | 0.4294 | 0.8392876 | 14 | ||
| Improve | Manzanilla-Pech et al. (2021) [54] | 13 | Reduction of methane and DMI included in breeding goals | 0.0146 | 0.0009 | 0.0049 | 0.0046 | 0.0045 | 0.0471 | 0.0049 | 0.0043 | 0.0767 | 0.3541 | 0.4308 | 0.82193674 | 19 |
| 13 | Methane production negatively economically valued at −0.30 c and DMI included in breeding goals | 0.0316 | 0.0009 | 0.0049 | 0.0046 | 0.0045 | 0.0471 | 0.0049 | 0.0043 | 0.0607 | 0.3711 | 0.4318 | 0.85934594 | 10 | ||
| 13 | Methane production negatively economically valued at −0.60 c per kilo ch4 and DMI included in breeding goals | 0.0511 | 0.0009 | 0.0049 | 0.0046 | 0.0045 | 0.0471 | 0.0049 | 0.0043 | 0.0435 | 0.3905 | 0.4340 | 0.89979906 | 5 | ||
| 13 | Reduction of methane and RFI included in breeding goals | 0.0073 | 0.0009 | 0.0049 | 0.0046 | 0.0045 | 0.0471 | 0.0049 | 0.0043 | 0.0837 | 0.3468 | 0.4305 | 0.80562209 | 28 | ||
| 13 | Methane production negatively economically valued at −0.30 c and RFI included in breeding goals | 0.0243 | 0.0009 | 0.0049 | 0.0046 | 0.0045 | 0.0471 | 0.0049 | 0.0043 | 0.0675 | 0.3638 | 0.4313 | 0.84346984 | 12 | ||
| 13 | Methane production negatively economically valued at −0.60 c per kilo CH4 and RFI included in breeding goals | 0.0414 | 0.0009 | 0.0049 | 0.0046 | 0.0045 | 0.0471 | 0.0049 | 0.0043 | 0.0519 | 0.3808 | 0.4327 | 0.88001861 | 7 | ||
| Improve | Lean and Moate (2021) [20] | 15 | Ozone addition to water troughs | 0.0175 | 0.0034 | 0.0025 | 0.0046 | 0.0045 | 0.0707 | 0.0049 | 0.0043 | 0.0702 | 0.3593 | 0.4294 | 0.83661398 | 15 |
| Nitrates supplementation | 0.0088 | 0.0009 | 0.0049 | 0.0046 | 0.0045 | 0.0471 | 0.0049 | 0.0043 | 0.0823 | 0.3483 | 0.4306 | 0.8089032 | 24 | |||
| 3-nitro-oxypropanol | 0.0267 | 0.0009 | 0.0049 | 0.0023 | 0.0045 | 0.0236 | 0.0049 | 0.0043 | 0.0770 | 0.3654 | 0.4425 | 0.82588596 | 18 | |||
| Avoid | Iram et al. (2021) [45] | 16 | Conversion of land from ponded pasture to mangroves | 0.0873 | 0.0034 | 0.0049 | 0.0046 | 0.0045 | 0.0471 | 0.0025 | 0.0043 | 0.0239 | 0.4266 | 0.4505 | 0.94684681 | 2 |
| Conversion of land from ponded pasture to freshwater tidal forest | 0.0875 | 0.0034 | 0.0049 | 0.0046 | 0.0045 | 0.0471 | 0.0025 | 0.0043 | 0.0239 | 0.4268 | 0.4508 | 0.94687926 | 1 | |||
| Conversion of land from ponded pasture to salt marsh | 0.0876 | 0.0051 | 0.0049 | 0.0046 | 0.0045 | 0.0471 | 0.0025 | 0.0043 | 0.0242 | 0.4268 | 0.4510 | 0.94637256 | 3 | |||
| Conversion of land from dry pasture to mangrove | −0.3386 | 0.0034 | 0.0049 | 0.0046 | 0.0045 | 0.0471 | 0.0025 | 0.0043 | 0.4268 | 0.0244 | 0.4512 | 0.05398409 | 46 | |||
| Conversion of land from dry pasture to freshwater tidal forest | 0.0058 | 0.0034 | 0.0049 | 0.0046 | 0.0045 | 0.0471 | 0.0025 | 0.0043 | 0.0851 | 0.3453 | 0.4305 | 0.80219186 | 32 | |||
| Conversion of land from dry pasture to salt marsh | 0.0642 | 0.0051 | 0.0049 | 0.0046 | 0.0045 | 0.0471 | 0.0025 | 0.0043 | 0.0336 | 0.4035 | 0.4371 | 0.92307151 | 4 | |||
| Improve | Bai et al. (2020) [57] | 21 | Composting manure vs. stockpiling | 0.0472 | 0.0034 | 0.0049 | 0.0046 | 0.0045 | 0.0236 | 0.0049 | 0.0043 | 0.0622 | 0.3858 | 0.4480 | 0.86121429 | 9 |
| Improve | Almeida et al. (2023) [17] | 24 | Improving fertility by 10% with 50% adoption rate | 0.0026 | 0.0009 | 0.0049 | 0.0046 | 0.0045 | 0.0707 | 0.0025 | 0.0043 | 0.0850 | 0.3446 | 0.4296 | 0.80208616 | 33 |
| Improving fertility by 10% with 60% adoption rate | 0.0031 | 0.0009 | 0.0049 | 0.0046 | 0.0045 | 0.0707 | 0.0025 | 0.0043 | 0.0845 | 0.3451 | 0.4296 | 0.80328586 | 30 | |||
| Improving fertility by 10% with 70% adoption rate | 0.0036 | 0.0009 | 0.0049 | 0.0046 | 0.0045 | 0.0707 | 0.0025 | 0.0043 | 0.0840 | 0.3456 | 0.4296 | 0.80450592 | 29 | |||
| Improving fertility by 10% with 80% adoption | 0.0042 | 0.0009 | 0.0049 | 0.0046 | 0.0045 | 0.0707 | 0.0025 | 0.0043 | 0.0835 | 0.3461 | 0.4296 | 0.80570567 | 27 | |||
| Improving fertility by 5% with 50% adoption | 0.0014 | 0.0009 | 0.0049 | 0.0046 | 0.0045 | 0.0707 | 0.0025 | 0.0043 | 0.0863 | 0.3433 | 0.4296 | 0.79921918 | 38 | |||
| Improving fertility by 5% with 60% adoption | 0.0016 | 0.0009 | 0.0049 | 0.0046 | 0.0045 | 0.0707 | 0.0025 | 0.0043 | 0.0860 | 0.3436 | 0.4296 | 0.7998495 | 36 | |||
| Improving fertility by 5% with 70% adoption | 0.0019 | 0.0009 | 0.0049 | 0.0046 | 0.0045 | 0.0707 | 0.0025 | 0.0043 | 0.0857 | 0.3439 | 0.4296 | 0.80047982 | 35 | |||
| Improving fertility by 5% with 80% adoption | 0.0022 | 0.0009 | 0.0049 | 0.0046 | 0.0045 | 0.0707 | 0.0025 | 0.0043 | 0.0854 | 0.3441 | 0.4296 | 0.80113049 | 34 | |||
| Improve | Kinley et al. (2020) [52] | 27 | 0.05% inclusion of Asparagopsis in OM | 0.0002 | 0.0009 | 0.0025 | 0.0046 | 0.0045 | 0.0236 | 0.0049 | 0.0043 | 0.0993 | 0.3389 | 0.4382 | 0.7733089 | 45 |
| 0.10% inclusion of Asparagopsis in OM | 0.0003 | 0.0009 | 0.0025 | 0.0046 | 0.0045 | 0.0236 | 0.0049 | 0.0043 | 0.0992 | 0.3390 | 0.4382 | 0.7735823 | 44 | |||
| 0.20% inclusion of Asparagopsis in OM | 0.0007 | 0.0009 | 0.0025 | 0.0046 | 0.0045 | 0.0236 | 0.0049 | 0.0043 | 0.0989 | 0.3394 | 0.4383 | 0.77443471 | 43 | |||
References
- Mar, K.A.; Unger, C.; Walderdorff, L.; Butler, T. Beyond CO2 equivalence: The impacts of methane on climate, ecosystems, and health. Environ. Sci. Policy 2022, 134, 127–136. [Google Scholar] [CrossRef]
- Poore, J.; Nemecek, T. Reducing food’s environmental impacts through producers and consumers. Science 2018, 360, 987. [Google Scholar] [CrossRef] [PubMed]
- Scoones, I. Livestock, methane, and climate change: The politics of global assessments. WIREs Clim. Chang. 2023, 14, e790. [Google Scholar] [CrossRef] [PubMed]
- Quinton, A. Cows and Climate Change Making Cattle More Sustainable. UCDavis. 2019. Available online: https://www.ucdavis.edu/food/news/making-cattle-more-sustainable (accessed on 9 March 2024).
- IEA. Methane and Climate Change. Global Methane Tracker 2022. Available online: https://www.iea.org/reports/global-methane-tracker-2022/methane-and-climate-change (accessed on 9 March 2024).
- Saunois, M.; Jackson, R.B.; Bousquet, P.; Poulter, B.; Canadell, J.G. The growing role of methane in anthropogenic climate change. Environ. Res. Lett. 2016, 11, 120207. [Google Scholar] [CrossRef]
- Saunois, M.; Stavert, A.R.; Poulter, B.; Bousquet, P.; Canadell, J.G.; Jackson, R.B.; Raymond, P.A.; Dlugokencky, E.J.; Houweling, S.; Patra, P.K.; et al. The global methane budget 2000–2017. Earth Syst. Sci. Data 2020, 12, 1561–1623. [Google Scholar] [CrossRef]
- Wuebbles, D.J.; Hayhoe, K. Atmospheric methane and global change. Earth Sci. Rev. 2001, 57, 177–210. [Google Scholar] [CrossRef]
- Lynch, J.; Cain, M.; Frame, D.; Pierrehumbert, R. Agriculture’s Contribution to Climate Change and Role in Mitigation Is Distinct from Predominantly Fossil CO2-Emitting Sectors. Front. Sustain. Food Syst. 2021, 4, 518039. [Google Scholar] [CrossRef] [PubMed]
- UNFCCC. Paris Agreement. 2015. Available online: https://unfccc.int/process-and-meetings/the-paris-agreement (accessed on 9 March 2024).
- Department of Industry and Resources. Australia Joins International Methane Mitigation Agreement. 2023. Available online: https://www.industry.gov.au/news/australia-joins-international-methane-mitigation-agreement#:~:text=We%20will%20collaborate%20with%20Japan,Gas%20(LNG)%20supply%20chain (accessed on 9 March 2024).
- Thomas, D.T.; Beletse, Y.G.; Dominik, S.; Lehnert, S.A. Net protein contribution and enteric methane production of pasture and grain-finished beef cattle supply chains. Animal 2021, 15, 100392. [Google Scholar] [CrossRef] [PubMed]
- Mwangi, F.W.; Suybeng, B.; Gardiner, C.P.; Kinobe, R.T.; Charmley, E.; Malau-Aduli, B.S.; Malau-Aduli, A.E.O. Effect of incremental proportions of Desmanthus spp. In isonitrogenous forage diets on growth performance, rumen fermentation and plasma metabolites of pen-fed growing Brahman, Charbray and Droughtmaster crossbred beef steers. PLoS ONE 2022, 17, e0260918. [Google Scholar] [CrossRef]
- Moate, P.J.; Deighton, M.H.; Jacobs, J.; Ribaux, B.E.; Morris, G.L.; Hannah, M.C.; Mapleson, D.; Islam, M.S.; Wales, W.J.; Williams, S.R.O. Influence of proportion of wheat in a pasture-based diet on milk yield, methane emissions, methane yield, and ruminal protozoa of dairy cows. J. Dairy Sci. 2020, 103, 2373–2386. [Google Scholar] [CrossRef]
- Tedeschi, L.O. Review: Harnessing extant energy and protein requirement modeling for sustainable beef production. Animal 2023, 17, 100835. [Google Scholar] [CrossRef]
- Badgery, W.; Li, G.; Simmons, A.; Wood, J.; Smith, R.; Peck, D.; Ingram, L.; Durmic, Z.; Cowie, A.; Humphries, A.; et al. Reducing enteric methane of ruminants in Australian grazing systems—A review of the role for temperate legumes and herbs. Crop Pasture Sci. 2023, 74, 661–679. [Google Scholar] [CrossRef]
- Almeida, A.K.; Cowley, F.C.; Hegarty, R.S. A regional-scale assessment of nutritional-system strategies for abatement of enteric methane from grazing livestock. Anim. Prod. Sci. 2023, 63, 1461–1472. [Google Scholar] [CrossRef]
- Ridoutt, B. Short communication: Climate impact of Australian livestock production assessed using the GWP* climate metric. Livest. Sci. 2021, 246, 104459. [Google Scholar] [CrossRef]
- Bai, M.; Coates, T.; Hill, J.; Flesch, T.K.; Griffith, D.W.T.; Van der Saag, M.; Rinehart, D.; Chen, D. Measurement of Long-Term CH4 Emissions and Emission Factors from Beef Feedlots in Australia. Atmosphere 2023, 14, 1352. [Google Scholar] [CrossRef]
- Lean, I.J.; Moate, P.J. Cattle, climate and complexity: Food security, quality and sustainability of the Australian cattle industries. Aust. Vet. J. 2021, 99, 293–308. [Google Scholar] [CrossRef]
- Yoon, K.; Hwang, C.L. Multiple Attribute Decision Making an Introduction; SAGE: Thousand Oaks, CA, USA, 1995. [Google Scholar]
- Agyemang, M.; Kusi-Sarpong, S.; Agyemang, J.; Jia, F.; Adzanyo, M. Determining and evaluating socially sustainable supply chain criteria in agri-sector of developing countries: Insights from West Africa cashew industry. Prod. Plan. Control. 2022, 33, 1115–1133. [Google Scholar] [CrossRef]
- Mardani, A.; Jusoh, A.; Md Nor, K.; Khalifah, Z.; Zakwan, N.; Valipour, A. Multiple criteria decision-making techniques and their applications—A review of the literature from 2000 to 2014. Econ. Res. Ekon. Istraživanja 2015, 28, 516–571. [Google Scholar] [CrossRef]
- Doumpos, M.; Ferreira, F.A.F.; Zopounidis, C. Multiple Criteria Decision Making for Sustainable Development: Pursuing Economic Growth, Environmental Protection and social Cohesion; Springer: Cham, Switzerland, 2021. [Google Scholar]
- Chakraborty, S. TOPSIS and Modified TOPSIS: A comparative analysis. Decis. Anal. J. 2022, 2, 100021. [Google Scholar] [CrossRef]
- Florindo, T.J.; Florindo, G.I.B.d.M.; Talamini, E.; Costa, J.S.d.; Léis, C.M.d.; Tang, W.Z.; Schultz, G.; Kulay, L.; Pinto, A.T.; Ruviaro, C.F. Application of the multiple criteria decision-making (MCDM) approach in the identification of Carbon Footprint reduction actions in the Brazilian beef production chain. J. Clean. Prod. 2018, 196, 1379–1389. [Google Scholar] [CrossRef]
- Koasidis, K.; Karamaneas, A.; Kanellou, E.; Neofytou, H.; Nikas, A.; Doukas, H. Towards Sustainable Development and Climate Co-governance: A Multicriteria Stakeholders’ Perspective. In Multiple Criteria Decision Making for Sustainable Development; Springer: Cham, Switzerland, 2021; pp. 39–74. [Google Scholar]
- Tutak, M.; Brodny, J.; Siwiec, D.; Ulewicz, R.; Bindzár, P. Studying the Level of Sustainable Energy Development of the European Union Countries and Their Similarity Based on the Economic and Demographic Potential. Energies 2020, 13, 6643. [Google Scholar] [CrossRef]
- Agrawal, R.; Wankhede, V.A.; Kumar, A.; Luthra, S. Analysing the roadblocks of circular economy adoption in the automobile sector: Reducing waste and environmental perspectives. Bus. Strategy Environ. 2021, 30, 1051–1066. [Google Scholar] [CrossRef]
- Intergovernmental Panel on Climate Change; Masson-Delmotte, V.; Zhai, P.; Pirani, A.; Connors, S.L.; Péan, C.; Berger, S.; Caud, N.; Chen, Y.; Goldfarb, L.; et al. Chapter 5: Sustainable Land Management. In Climate Change 2021: Mitigation of Climate Change. Contribution of Working Group III to the Sixth Assessment Report; Masson-Delmotte, V., Zhai, P., Pirani, A., Connors, S.L., Péan, C., Berger, S., Caud, N., Eds.; Cambridge University Press: Cambridge, UK, 2021. [Google Scholar]
- Liberati, A.; Altman, D.G.; Tetzlaff, J.; Mulrow, C.; Gøtzsche, P.C.; Ioannidis, J.P.; Clarke, M.; Devereaux, P.J.; Kleijnen, J.; Moher, D. The Prisma Statement for Reporting Systematic Reviews and Meta-Analyses of Studies That Evaluate Healthcare Interventions: Explanation and Elaboration. BMJ 2009, 339, b2700. [Google Scholar] [CrossRef] [PubMed]
- European Commission. Communication from the Commission to the European Parliament, the Council, the European Economic and Social Committee and the Committee of the Regions: Stepping Up Europe’s 2030 Climate Ambition—Investing in a Climate-Neutral Future for the Benefit of Our People; European Commission: Brussels, Belgium, 2020. [Google Scholar]
- United Nations Environment Programme. A Practical Framework for Planning Pro-Development Climate Policy; United Nations Environment Programme: Nairobi, Kenya, 2011. [Google Scholar]
- S&P Global. CSA Handbook 2023: Corporate Sustainability Assessment; S&P Global: New York, NY, USA, 2023. [Google Scholar]
- Institute for Sustainability. Sustainability Index; Institute for Sustainability: London, UK, 2023. [Google Scholar]
- Gibson, B.; Hassan, S.; Tansey, J. Sustainability Assessment Criteria and Processes; Taylor and Francis: Hoboken, NJ, USA, 2012. [Google Scholar]
- European Commission. 2050 Long-Term Strategy. Striving to Become the World’s First Climate-Neutral Continent by 2050, Climate Action. Available online: https://climate.ec.europa.eu/eu-action/climate-strategies-targets/2050-long-term-strategy_en (accessed on 9 March 2024).
- Tyrrell, H.; Reid, J. Prediction of the energy value of cow’s milk. J. Dairy Sci. 1965, 48, 1215–1223. [Google Scholar] [CrossRef] [PubMed]
- Saner, R.; Buseman, B. How Many Pounds of Meat Can We Expect from a Beef Animal? Available online: https://beef.unl.edu/beefwatch/2020/how-many-pounds-meat-can-we-expect-beef-animal (accessed on 9 March 2024).
- Australian Government. Agriculture, Land and Emissions Disscussion Paper; Department of Agriculture, Fisheries and Forestry: Canberra, ACT, Australia, 2023.
- Pryce, J.E.; Haile-Mariam, M. Symposium review: Genomic selection for reducing environmental impact and adapting to climate change. J. Dairy Sci. 2020, 103, 5366–5375. [Google Scholar] [CrossRef] [PubMed]
- IPCC. Climate Change 2013: The Physical Science Basis; Cambridge University Press: Cambridge, UK; New York, NY, USA, 2013. [Google Scholar]
- Ridoutt, B.; Lehnert, S.A.; Denman, S.; Charmley, E.; Kinley, R.; Dominik, S. Potential GHG emission benefits of Asparagopsis taxiformis feed supplement in Australian beef cattle feedlots. J. Clean. Prod. 2022, 337, 130499. [Google Scholar] [CrossRef]
- Kumar, M.; Choubey, V.K. A Review on Life Cycle Assessment of Various Dairy Products. In Recent Advances in Operations Management Applications; Sachdeva, A., Kumar, P., Yadav, O.P., Tyagi, M., Eds.; Lecture Notes in Mechanical Engineering; Springer: Singapore, 2022; pp. 75–89. [Google Scholar]
- Iram, N.; Kavehei, E.; Maher, D.T.; Bunn, S.E.; Rezaei Rashti, M.; Farahani, B.S.; Adame, M.F. Soil greenhouse gas fluxes from tropical coastal wetlands and alternative agricultural land uses. Biogeosciences 2021, 18, 5085–5096. [Google Scholar] [CrossRef]
- Richardson, C.M.; Amer, P.R.; Quinton, C.; Crowley, J.; Hely, F.S.; van den Berg, I.; Pryce, J.E. Reducing greenhouse gas emissions through genetic selection in the Australian dairy industry. J. Dairy Sci. 2022, 105, 4272–4288. [Google Scholar] [CrossRef] [PubMed]
- Davison, T.M.; Black, J.L.; Moss, J.F. Red meat-an essential partner to reduce global greenhouse gas emissions. Anim. Front. 2020, 10, 14–21. [Google Scholar] [CrossRef]
- Behm, K.; Nappa, M.; Aro, N.; Welman, A.; Ledgard, S.; Suomalainen, M.; Hill, J. Comparison of carbon footprint and water scarcity footprint of milk protein produced by cellular agriculture and the dairy industry. Int. J. Life Cycle Assess. 2022, 27, 1017–1034. [Google Scholar] [CrossRef]
- Mahanta, S.K.; Garcia, S.C.; Islam, M.R. Forage based feeding systems of dairy animals: Issues, limitations and strategies. Range Manag. Agrofor. 2020, 41, 188–199. [Google Scholar]
- Stifkens, A.; Matthews, E.M.; McSweeney, C.S.; Charmley, E. Increasing the proportion of Leucaena leucocephala in hay-fed beef steers reduces methane yield. Anim. Prod. Sci. 2022, 62, 622–632. [Google Scholar] [CrossRef]
- Parra, M.C.; Forwood, D.L.; Chaves, A.V.; Meale, S.J. In vitro screening of anti-methanogenic additives for use in Australian grazing systems. Front. Anim. Sci. 2023, 4, 1123532. [Google Scholar] [CrossRef]
- Kinley, R.D.; Martinez-Fernandez, G.; Matthews, M.K.; de Nys, R.; Magnusson, M.; Tomkins, N.W. Mitigating the carbon footprint and improving productivity of ruminant livestock agriculture using a red seaweed. J. Clean. Prod. 2020, 259, 120836. [Google Scholar] [CrossRef]
- Richardson, C.M.; Amer, P.R.; Hely, F.S.; van den Berg, I.; Pryce, J.E. Estimating methane coefficients to predict the environmental impact of traits in the Australian dairy breeding program. J. Dairy Sci. 2021, 104, 10979–10990. [Google Scholar] [CrossRef] [PubMed]
- Manzanilla-Pech, C.I.V.; Lovendahl, P.; Gordo, D.M.; Difford, G.F.; Pryce, J.E.; Schenkel, F.; Wegmann, S.; Miglior, F.; Chud, T.C.; Moate, P.J.; et al. Breeding for reduced methane emission and feed-efficient Holstein cows: An international response. J. Dairy Sci. 2021, 104, 8983–9001. [Google Scholar] [CrossRef]
- Richardson, C.M.; Nguyen, T.T.T.; Abdelsayed, M.; Moate, P.J.; Williams, S.R.O.; Chud, T.C.S.; Schenkel, F.S.; Goddard, M.E.; van den Berg, I.; Cocks, B.G.; et al. Genetic parameters for methane emission traits in Australian dairy cows. J. Dairy Sci. 2021, 104, 539–549. [Google Scholar] [CrossRef] [PubMed]
- Colley, T.A.; Birkved, M.; Olsen, S.I.; Hauschild, M.Z. Using a gate-to-gate LCA to apply circular economy principles to a food processing SME. J. Clean. Prod. 2020, 251, 119566. [Google Scholar] [CrossRef]
- Bai, M.; Flesch, T.; Trouvé, R.; Coates, T.; Butterly, C.; Bhatta, B.; Hill, J.; Chen, D. Gas emissions during cattle manure composting and stockpiling. J. Environ. Qual. 2020, 49, 228–235. [Google Scholar] [CrossRef]
- Climate & Clean Air Coalition Secretariat Global Methane Pledge: Fast action on Methane to Keep a 1.5 Degree Future in Reach. Available online: https://www.globalmethanepledge.org/ (accessed on 20 March 2023).
- Marinova, D.; Bogueva, D. Food in a Planetary Emergency; Springer: Singapore, 2022. [Google Scholar]
- Raphaely, T.; Marinova, D. Impact of Meat Consumption on Health and Environmental Sustainability; IGI Global: Hershey, PA, USA, 2016; pp. 1–410. [Google Scholar]
- United Nations, Department of Economic and Social Affairs, Population Division. World Urbanization Prospects: The 2018 Revision (ST/ESA/SER.A/420); United Nations: New York, NY, USA, 2019. [Google Scholar]
- Intergovernmental Panel on Climate Change (IPCC). Summary for policymakers Climate Change Impacts, Adaptation and Vulnerability. In Climate Change 2022: Impacts, Adaptation, and Vulnerability. Contribution of Working Group II to the Sixth Assessment Report of the Intergovernmental Panel on Climate Change; Pörtner, H.-O., Roberts, D.C., Poloczanska, E.S., Mintenbeck, K., Tignor, M., Alegría, A., Craig, M., Langsdorf, S., Löschke, S., Möller, V., et al., Eds.; Cambridge University Press: Cambridge, UK, 2022. [Google Scholar]
- Goodland, R.; Anhang, J. Livestock and Climate Change: What If the Key Actors in Climate Change Are … Cows, Pigs, and Chickens? Available online: https://web.archive.org/web/20091105155752/http://www.worldwatch.org/files/pdf/Livestock%20and%20Climate%20Change.pdf (accessed on 9 March 2024).
- Perez-Dominguez, I.; del Prado, A.; Mittenzwei, K.; Hristov, J.; Frank, S.; Tabeau, A.; Witzke, P.; Havlik, P.; van Meijl, H.; Lynch, J.; et al. Short- and long-term warming effects of methane may affect the cost-effectiveness of mitigation policies and benefits of low-meat diets. Nat. Food 2021, 2, 970–980. [Google Scholar] [CrossRef]
- Rogelj, J.; Schleussner, C. Unintentional unfairness when applying new greenhouse gas emissions metrics at country level. Environ. Res. Lett. 2019, 14, 114039. [Google Scholar] [CrossRef]
- Del Prado, A.; Manzano, P.; Pardo, G. The role of the European small ruminant dairy sector in stabilising global temperatures: Lessons from GWP∗ warming-equivalent emission metrics. J. Dairy Res. 2021, 88, 8–15. [Google Scholar] [CrossRef] [PubMed]
- Grešáková, Ľ.; Holodová, M.; Szumacher-Strabel, M.; Huang, H.; Ślósarz, P.; Wojtczak, J.; Sowińska, N.; Cieślak, A. Mineral status and enteric methane production in dairy cows during different stages of lactation. BMC Vet. Res. 2021, 17, 287. [Google Scholar] [CrossRef] [PubMed]
- Kumari, S.; Fagodiya, R.K.; Hiloidhari, M.; Dahiya, R.P.; Kumar, A. Methane production and estimation from livestock husbandry: A mechanistic understanding and emerging mitigation options. Sci. Total Environ. 2020, 709, 136135. [Google Scholar] [CrossRef]
- OECD-FAO. Agricultural Outlook 2023–2032, Paris. 2022. Available online: https://www.oecd.org/publications/oecd-fao-agricultural-outlook-19991142.htm (accessed on 9 March 2024).
- DCCEEW. Australia Joins Global Methane Pledge. 2022. Available online: https://minister.dcceew.gov.au/bowen/media-releases/australia-joins-global-methane-pledge (accessed on 9 March 2024).
- Abbott, D.W.; Aasen, I.M.; Beauchemin, K.A.; Grondahl, F.; Gruninger, R.; Hayes, M.; Huws, S.; Kenny, D.A.; Krizsan, S.J.; Kirwan, S.F.; et al. Seaweed and seaweed bioactives for mitigation of enteric methane: Challenges and opportunities. Animals 2020, 10, 2432. [Google Scholar] [CrossRef] [PubMed]
- Huws, S.A.; Creevey, C.J.; Oyama, L.B.; Mizrahi, I.; Denman, S.E.; Popova, M.; Muñoz-Tamayo, R.; Forano, E.; Waters, S.M.; Hess, M.; et al. Addressing Global Ruminant Agricultural Challenges through Understanding the Rumen Microbiome: Past, Present, and Future. Front. Microbiol. 2018, 9, 2161. [Google Scholar] [CrossRef]
- Our World in Data. Meat Production. Available online: https://ourworldindata.org/meat-production (accessed on 9 March 2024).
- Almeida, A.K.; Hegarty, R.S. Managing Livestock to Reduce Methane Emissions: Assessment of Strategies for Abatement of Enteric Methane; NSW Department of Primary Industries: Orange, NSW, Australia, 2021.
- Department of Climate Change, Energy, the Environment and Water. Measuring and Accounting for the Benefits of Restoring Coastal Blue Carbon Ecosystems. 2023. Available online: https://www.dcceew.gov.au/climate-change/policy/ocean-sustainability/coastal-blue-carbon-ecosystems/conservation/measuring-accounting (accessed on 9 March 2024).
- Bayraktarov, E.; Saunders, M.I.; Abdullah, S.; Mills, M.; Beher, J.; Possingham, H.P.; Mumby, P.J.; Lovelock, C.E. The cost and feasibility of marine coastal restoration. Ecol. Appl. 2016, 26, 1055–1074. [Google Scholar] [CrossRef] [PubMed]
- Mbow, C.; Rosenzweig, C.E.; Barioni, L.G.; Benton, T.G.; Herrero, M.; Krishnapillai, M.; Ruane, A.C.; Liwenga, E.; Pradhan, P.; Rivera-Ferre, M.G.; et al. Food Security Supplementary Material; IPCC: Geneva, Switzerland, 2019; Available online: https://www.ipcc.ch/site/assets/uploads/2019/11/08_Chapter-5.pdf (accessed on 9 March 2024).
- Arndt, C.; Hristov, A.N.; Price, W.J.; McClelland, S.C.; Pelaez, A.M.; Cueva, S.F.; Oh, J.; Dijkstra, J.; Bannink, A.; Bayat, A.R.; et al. Full adoption of the most effective strategies to mitigate methane emissions by ruminants can help meet the 1.5 °C target by 2030 but not 2050. Proc. Natl. Acad. Sci. USA 2022, 119, e2111294119. [Google Scholar] [CrossRef] [PubMed]
- State of New South Wales. Supplementary Feed Prices 2023. NSW Government. 2023. Available online: https://www.lls.nsw.gov.au/__data/assets/pdf_file/0010/1469530/NC-feed-prices-July2023.pdf (accessed on 9 March 2024).
- FutureBeef. Leucaena Inoculum for Cattle. 2023. Available online: https://futurebeef.com.au/resources/leucaena-inoculum/ (accessed on 9 March 2024).
- Meat and Livestock Australia Limited. Leucanena—The Productive and Sustinable Forage Legume. 2021. Available online: https://www.mla.com.au/globalassets/mla-corporate/research-and-development/program-areas/grazing-and-pasture-management/leucaena/leucaena-productive-sustainable-forage-legume.pdf (accessed on 9 March 2024).
- Kato-Noguchi, H.; Kurniadie, D. Allelopathy and Allelochemicals of Leucaena Leucocephala as an Invasive Plant Species. Plants 2022, 11, 1672. [Google Scholar] [CrossRef]
- Roque, B.M.; Venegas, M.; Kinley, R.D.; de Nys, R.; Duarte, T.L.; Yang, X.; Kebreab, E. Red Seaweed (Asparagopsis taxiformis) Supplementation Reduces Enteric Methane by over 80 Percent in Beef Steers. PLoS ONE 2021, 16, e0247820. [Google Scholar] [CrossRef]
- Kite-Powell, H.L.; Ask, E.; Augyte, S.; Bailey, D.; Decker, J.; Goudey, C.A.; Grebe, G.; Li, Y.; Lindell, S.; Manganelli, D.; et al. Estimating Production Cost for Large-Scale Seaweed Farms. Appl. Phycol. 2022, 3, 435–445. [Google Scholar] [CrossRef]
- Callaghan, M.J.; Tomkins, N.W.; Benu, I.; Parker, A.J. How Feasible Is It to Replace Urea with Nitrates to Mitigate Greenhouse Gas Emissions from Extensively Managed Beef Cattle? Anim. Prod. Sci. 2014, 54, 1300–1304. [Google Scholar] [CrossRef]
- CSIRO Data Access Portal. In Vitro Response of Rumen Microbiota to the Antimethanogenic Red Macroalga Asparagopsis Taxiformis. CSIRO. 2017. Available online: https://data.csiro.au/collection/csiro:20552 (accessed on 9 March 2024).
- Biotechnology and Biological Sciences Research Council 2019. Award Details. 2023. Available online: https://gow.bbsrc.ukri.org/grants/AwardDetails.aspx?FundingReference=BB/N016742/1 (accessed on 9 March 2024).
- Agence Nationale de la Recherche. Improving Feed Efficiency in Dairy Cows: Understanding Its Key Determinants Using Precision Phenotyping, to Allow Tailored Genetic Selection Strategies According to Environment—Deffilait. 2023. Available online: https://anr.fr/en/funded-projects-and-impact/funded-projects/project/funded/project/b2d9d3668f92a3b9fbbf7866072501ef-6495414fbc/?tx_anrprojects_funded%5Bcontroller%5D=Funded&cHash=0ea7aa21360d269bcf3dd46b7704ffcf (accessed on 9 March 2024).
- Staight, K. Biochar Industry Fuelled by Agricultural Waste Expected to Grow. ABC News. 2022. Available online: https://www.abc.net.au/news/rural/2022-10-01/biochar-industry-grows-in-australia-big-benefits-for-agriculture/101483868 (accessed on 9 March 2024).
- Clean Energy Regulator. Participating in the Emissions Reduction Fund—A Guide to Feeding Nitrates to Beef Cattle Method. 2024. Available online: https://cer.gov.au/document/guide-feeding-nitrates-beef-cattle-methodpdf (accessed on 9 March 2024).
- Sigma-Aldrich. C83007 Citral. 2024. Available online: https://www.sigmaaldrich.com/TR/en/product/aldrich/c83007 (accessed on 9 March 2024).
- Department of Agriculture, Fisheries and Forestry. Australian Agricultural Prices. 2024. Available online: https://www.agriculture.gov.au/abares/data/weekly-commodity-price-update/australian-agricultural-prices (accessed on 9 February 2024).
- Australian Dairy Farmers. Australian Dairy Herd Improvement Scheme. 2024. Available online: https://australiandairyfarmers.com.au/australian-dairy-herd-improvement-scheme/ (accessed on 2 February 2024).
- dr-ozone.com. Ozone Application in Livestock Water Treatement. 2024. Available online: https://dr-ozone.com/ozone-application-in-livestock-water-treatment/#:~:text=Ozone%C2%AE%20is%20the%20perfect,organic%20substances%2C%20inorganic%20compounds%20quickly (accessed on 2 February 2024).
- Australian Pesticides and Veterinary Medicines Authority. 2023 Acceptable Daily Intakes for Agricultural and Veterinary Chemicals. (3/2023) 30 September 2023. Available online: https://www.apvma.gov.au/sites/default/files/publication/98341-acceptable_daily_intakes_adi_for_agricultural_and_veterinary_chemicals_-_september_2022.pdf (accessed on 9 March 2024).
- Liu, Z.; Wang, X.; Wang, F.; Bai, Z.; Chadwick, D.; Misselbrook, T.; Ma, L. The Progress of Composting Technologies from Static Heap to Intelligent Reactor: Benefits and Limitations. J. Clean. Prod. 2020, 270, 122328. [Google Scholar] [CrossRef]

| Scenario | Main Indicator Weighting | Remaining Indicator Weight |
|---|---|---|
| Baseline | None | All 8 indicators weigh 12.5% |
| Conservative | 80% cost reduction | 7 remaining indicators weigh 2.9% |
| Climate Emergency | 40% CH4 reduction 40% all production systems | 6 remaining indicators weigh 2.9% |
| Categories | Indicators (Value in Brackets) | Supporting Information |
|---|---|---|
| Environmental Impact | CH4 reduction per litre of energy-corrected milk, per kilogram of trimmed boneless beef or baseline (%) | Energy-corrected metric, industry standardized unit of measurement in dairy industry [38]. Trimmed boneless beef according to Saner and Buseman [39]. |
| Estimated Implementation Costs | Estimated AUD upfront capital costs for strategy implementation and/or operating expenditures Relative comparison of strategies scaled between 1 and 10 | Similar to UNEP’s [33] Practical Framework for Planning Pro-Development Climate policy. Example indicators for energy efficiency, carbon capture and storage, and reducing human health impacts. |
| Technological Readiness | Research development stage: emerging (1) or established (2) | Based on Federal Agriculture Department [40]. |
| Policy and Regulatory Landscape | Compliance with existing laws: No (1), Yes (2) New policy required: No (1), Yes (2) | Similar to UNEP’s [33] indicators for energy efficiency regarding easy institutional implementation. Data sourced from the systematic literature review (SLR) and secondary evidence. |
| Scalability and Replicability | Applicable production system: Feedlot (1), pasture-based (2), both (3) Applicability to both northern and southern regions: No (1), Yes (2) Applicability to all seasons: No (1), Yes (2) | Similar to UNEP’s [33] indicators for energy efficiency regarding easy institutional implementation. Data sourced from SLR and secondary evidence. |
| Ranking | Performance Ranking | Baseline Equally-Weighted Strategy |
|---|---|---|
| 1 | 0.88414382 | Methane included in breeding index and valued at 0.60 c per kg of CH4 based on dry matter intake (DMI) |
| 2 | 0.87393197 | Conversion of land from ponded pasture to freshwater tidal forest |
| 3 | 0.87387 | Conversion of land from ponded pasture to mangroves |
| 4 | 0.86826467 | Methane production negatively economically valued at −0.60 c per kg CH4 and resulting feed intake (RFI) included in breeding goals |
| 5 | 0.86503572 | Inclusion of citral extract at 0.1% of dry matter (DM) |
| 6 | 0.85100814 | Methane included in breeding index and valued at 0.30 c per kg of CH4 based on RFI |
| 7 | 0.84991771 | Inclusion of biochar and nitrates at 8% of DM |
| 8 | 0.84673888 | Wheat 45% of DMI |
| 9 | 0.84619539 | Conversion of land from ponded pasture to salt marsh |
| 10 | 0.84062149 | Grain-finished pasture cattle |
| Ranking | Performance Ranking | Climate Emergency-Weighted Strategy |
|---|---|---|
| 1 | 0.94687926 | Conversion of land from ponded pasture to freshwater tidal forest |
| 2 | 0.94684681 | Conversion of land from ponded pasture to mangroves |
| 3 | 0.94637256 | Conversion of land from ponded pasture to salt marsh |
| 4 | 0.92307151 | Conversion of land from dry pasture to salt marsh |
| 5 | 0.89979906 | Methane production negatively economically valued at −0.60 c per kg CH4 and DMI included in breeding goals |
| 6 | 0.88987446 | Feed lot cattle supplemented with Asparagopsis taxiformis |
| 7 | 0.88001861 | Methane production negatively economically valued at −0.60 c per kg CH4 and RFI included in breeding goals |
| 8 | 0.87954682 | Inclusion of citral extract at 0.1% of DM |
| 9 | 0.86121429 | Composting manure vs. stockpiling |
| 10 | 0.85934594 | Methane production negatively economically valued at −0.30 c and DMI included in breeding goals |
| Ranking | Performance Ranking | Conservatively-Weighted Strategy |
|---|---|---|
| 1 | 0.98219361 | Methane production negatively economically valued at −0.60 c per kg CH4 and DMI included in breeding goals |
| 2 | 0.97988897 | Methane production negatively economically valued at −0.60 c per kg CH4 and RFI included in breeding goals |
| 3 | 0.9794944 | Inclusion of citral extract at 0.1% of DM |
| 4 | 0.97761249 | Inclusion of biochar and nitrates at 8% of DM |
| 5 | 0.97737908 | Methane production negatively economically valued at −0.30 c and DMI included in breeding goals |
| 6 | 0.97714331 | Proportion of wheat is 45% of DMI |
| 7 | 0.9761628 | Grain-finished feed formulation |
| 8 | 0.97558359 | 36% Leucaena leucocephala feed formulation |
| 9 | 0.97540405 | Methane production negatively economically valued at −0.30 c and RFI included in breeding goals |
| 10 | 0.97530739 | Proportion of wheat is 20% of DMI |
Disclaimer/Publisher’s Note: The statements, opinions and data contained in all publications are solely those of the individual author(s) and contributor(s) and not of MDPI and/or the editor(s). MDPI and/or the editor(s) disclaim responsibility for any injury to people or property resulting from any ideas, methods, instructions or products referred to in the content. |
© 2024 by the authors. Licensee MDPI, Basel, Switzerland. This article is an open access article distributed under the terms and conditions of the Creative Commons Attribution (CC BY) license (https://creativecommons.org/licenses/by/4.0/).
Share and Cite
Kelliher, M.; Bogueva, D.; Marinova, D. Meta-Analysis and Ranking of the Most Effective Methane Reduction Strategies for Australia’s Beef and Dairy Sector. Climate 2024, 12, 50. https://doi.org/10.3390/cli12040050
Kelliher M, Bogueva D, Marinova D. Meta-Analysis and Ranking of the Most Effective Methane Reduction Strategies for Australia’s Beef and Dairy Sector. Climate. 2024; 12(4):50. https://doi.org/10.3390/cli12040050
Chicago/Turabian StyleKelliher, Merideth, Diana Bogueva, and Dora Marinova. 2024. "Meta-Analysis and Ranking of the Most Effective Methane Reduction Strategies for Australia’s Beef and Dairy Sector" Climate 12, no. 4: 50. https://doi.org/10.3390/cli12040050
APA StyleKelliher, M., Bogueva, D., & Marinova, D. (2024). Meta-Analysis and Ranking of the Most Effective Methane Reduction Strategies for Australia’s Beef and Dairy Sector. Climate, 12(4), 50. https://doi.org/10.3390/cli12040050