Abstract
A climate analysis of the monthly mean temperatures of Southern Patagonia during the late-XIXth and early-XXth centuries was carried out as part of the international data rescue Atmospheric Circulation Reconstructions over the Earth (ACRE) program partnership in Argentina, together with other data sources with regional and global records. The data from these diverse sources were combined to carry out a study in the coastal region of Patagonia, including Tierra del Fuego, between 42° S and 55° S for 11 locations. Furthermore, HadSST monthly/seasonal fields during the period 1880–1920 were also used. Both mean monthly and seasonal temperature values and timeseries variability were considered. Their analysis shows consistent behavior within the study region and compared to Southern Hemisphere mean results, which are characterized by a warm late-XIX century and a cooler early-XX century. This is also in agreement with SST variability along the coasts of Patagonia and hemispheric records. A comparison with present-day observations, where available, also yields consistent behavior. Low-frequency variability, i.e., in periods longer than 3 years, during the study period is consistent with present variability. Trend estimates at Trelew and Rio Gallegos for the period 1901–2020 yield significant trends, consistent with hemispheric warming at their latitudes.
1. Introduction
Understanding climate variability and change requires both extensive weather and climate records with global coverage and a sustained modeling effort [1]. Extended timeseries with wider global coverage of relevant or essential variables [2] not only provide more statistically significant results and, through their analyses, better identification of relevant physical processes but also allow for lengthier and better-distributed records for model testing and validation, consequently extending available weather records back in time, as far as possible, into the early years of the XXth century and, whenever possible, into the XIXth century, with global coverage as a crucial task. The WMO has started to grant special recognition to weather stations with continuous observations spanning at least 100 years, i.e., centennial weather stations. While many stations may not have strictly continuous records, or may even not have been in operation in recent decades, such records are still relevant for climate variability and change studies. Data rescue (DR) actions meant to recover historic weather records are coordinated through international cooperation efforts such as the Atmospheric Circulation Reconstructions over the Earth program (ACRE). ACRE coordinates DR efforts globally with institutional, national, and regional partners in order to recover and digitize such records with standardized criteria, promoting research and its use in relevant applications, as well as the historical and social aspects of the evolution of meteorology (www.met-acre.net, accessed on 17 October 2023). ACRE has carried out considerable effort in defining operational criteria for such DR actions through manuals (available on the program website) and publications [2,3,4,5], both for land-based stations and shipboard observations recorded in ship logbooks [6].
The Southern Hemisphere is an important component of the climate system, as it is essentially an oceanic hemisphere with an isolated polar continent, Antarctica, in whose vicinity the Great Ocean Conveyor Belt interacts with major ocean basins [7]. Because of the role of atmosphere–ocean interactions in the climate system, extending weather records, both in time and coverage, over this half of the world is a significant task. The fact that there are comparatively few land masses in subtropical to extratropical southern latitudes and that there have been smaller populations, particularly in the XIXth century, enhances the need to locate and digitize all old weather records that are available. DR efforts and analyses of South Africa [8,9], Australia, and New Zealand [10,11] are among some of the studies of XIXth century climate for the Southern Hemisphere subtropics and extratropics. However, there are far fewer studies for southern South America and higher southern latitudes, in particular, southern South America [12] and Antarctica [13].
The South Cone of South America (mainly Chile, Argentina, and Uruguay) is uniquely located in the Southern Hemisphere. The region extends from subtropical to subpolar latitudes (almost 56° S, within 1000 km of Antarctica). The southern region, Patagonia, including Tierra del Fuego, shared by Argentina and Chile, is essentially the only major land mass at mid to high extratropical latitudes in an oceanic hemisphere. Patagonia and Tierra del Fuego are thus often referred to as the End of the World. Hence, Patagonia’s land-based weather observations from about 42° S to 55° S, both present and historic, are highly relevant to understanding the climate system and its evolution; the global role of the mostly oceanic Southern Hemisphere; and, in particular, the role of the Southern Ocean and Antarctica [4,5]. It is thus important to carry out a data rescue (DR) effort for the oldest weather observations in Patagonia in order to evaluate weather and climate in the region since the earliest available observations. Such a necessary DR effort in Argentina was coordinated by ACRE Argentina (cf. https://www.zooniverse.org/projects/acre-ar/meteororum-ad-extremum-terrae, accessed on 2 December 2023) as part of the international ACRE program. Furthermore, the DR effort was particularly relevant for centennial re-analyses such as NCEP 20CR and ECMWF ERA 20C, both for improvement with additional rescued pressure records and for validation with records for other variables such as temperature, winds, and precipitation.
The settlement of eastern Patagonia (Argentina) was slow because of its harsh conditions, and it was initially limited to the coast, with almost no colonial settlements surviving until Argentine National Independence (1816), except for Carmen de Patagones (40.78° S, 60.97° W, 1779) on the northern edge of the region. Welsh immigrants arrived and started to settle the region in the late 1860s, near the mouth of the Chubut River, establishing, in subsequent years, Puerto Madryn, Rawson, and Trelew, all close to 43° S. Ushuaia (54° S) in Tierra del Fuego was founded in 1884 at the site of an Anglican mission run by Rev. Thomas Bridges since the 1870s. The oldest city in Southern Patagonia is Punta Arenas (Chile) established on the coast of the Magellan Strait in 1848. While the settlement of Southern Patagonia was slow, the South Atlantic, particularly the Argentine Sea/Continental Shelf region, was a major commercial sea lane. Prior to the opening of the Panamá Canal in August 1914, Cape Horn, south of Tierra del Fuego, and, to a lesser extent, the Magellan Strait, were the points of access to the Pacific for a significant fraction of the naval traffic between Europe and Asia, as can be inferred from International Surface Pressure Databank Version 4.7 monthly records (https://psl.noaa.gov/data/20CRv3_ISPD_obscounts_bymonth/ accessed on 2 December 2023)
The earliest known weather observations in Argentina date back to 1801 and 1805 [14]. A number of weather records have been made in various Argentine cities since 1816 by scientists (both amateur and professional), doctors, and engineers, albeit in intervals. Starting in 1854, daily and sub-daily observations were carried out in Buenos Aires by scientists and teachers at the Colegio San Carlos, now Colegio Nacional de Buenos Aires, and its summer campus at Chacarita de los Colegiales (now within the Buenos Aires city boundaries). President Domingo Faustino Sarmiento proposed legislation for the creation of the Oficina Meteorológica Argentina (OMA), which was approved by the National Congress on 4 October 1872. Over the decades, the OMA became the Servicio Meteorológico Nacional. The OMA, following international agreements, followed the observational requirements of the International Meteorological Organization, established in 1873. Instruments were acquired and calibrated at Kew Gardens, UK, prior to shipment to and deployment across Argentina. The earliest observations in Southern Patagonia, specifically in Ushuaia, Tierra del Fuego, date back to January 1876, as published in the Anales de la Oficina Meteorológica Argentina Vol. 3 [15]. In subsequent years, the OMA set up other observation stations with calibrated instruments in the Tierra del Fuego, Santa Cruz, and Chubut Provinces—first in collaboration with local residents and the Argentine Navy—and starting in the XXth century, these became operational weather stations. By 1904, the OMA managed and operated, under IMO requirements, more than 40 weather stations from 23.47° S to 60.73° S. The OMA, starting in 1901, published extensive data books, recording a wide variety of observations and in 1916 began a series of monthly reports called Boletines Mensuales, with detailed records from the weather stations and pluviometric network, including subdaily observations for selected stations.
The present study is the first in a series of climatological studies with rescued weather records from Southern Patagonia in its eastern and Atlantic regions, from 42° S to 55° S and 71° W to 57° W, during the last decades of the XIX century and the first decades of the XX century. Its companion paper [16] carries out a detailed study of an array of observations for a single station in the study region. As mentioned above, this SH region can be considered a peninsula in an oceanic hemisphere, located very close to Antarctica. Understanding its climatology, variability and its evolution prior to present climate change processes can provide insights into the climatology of high southern latitudes and the links to Antarctic climate. A dynamic climatology study [13] analyzed 113 years of weather observations made at Base Antártica Orcadas (60.73° S, 44.72° W). Using state-of-the-art timeseries analysis, they found both significant, season-dependent warming trends together with strong interdecadal modes of variability. When the analysis method was applied to 150-year-old Gomez ice core records from the highest latitudes of the Antarctic Peninsula (73.59° S, 70.36° W), similar modes of variability were observed. These results suggest that decadal-to-interdecadal modes of variability span an extensive region, including at least the Antarctic Peninsula and its adjacent regions. Obtaining evidence on the existence of relevant decadal-to-interdecadal variability in Southern Patagonia from the earliest possible records is thus a relevant issue.
This study considers available and rescued surface temperature records obtained between 1876 and 1920 for nine weather stations on the continent, three in Tierra del Fuego and adjacent Islands and one in the Malvinas/Falklands. Observational temperature records from our data rescue (DR) effort and other sources—such as the Climate Explorer website, run by the Royal Dutch Weather Institute (KNMI)—were combined for this regional study, both during the study period and up to present-day observations at selected stations. When available, these records were compared with the original Boletines Mensuales of the OMA for the years 1916 to 1919, as well as other relevant OMA publications between 1901 and 1915. The study statistically assesses variability during the study period, both in interannual scales and in the annual cycle, together with its latitudinal and seasonal aspects. For selected stations, the monthly and interannual temperature evolution between 1901 and the present day was also considered, showing that, overall, the early records exhibit similar variability and are also in agreement with other hemispheric results. Finally, long-term temperature trends at two stations, Trelew and Rio Gallegos, are discussed.
2. Materials and Methods
The late XIXth century, surface temperature records for stations located in Argentine territory were digitized from the Anales de la Oficina Meteorológica Argentina, published between 1878 and 1912 through the ACRE AR project and citizen science volunteers (https://www.zooniverse.org/projects/acre-ar/meteororum-ad-extremum-terrae, accessed on 2 December 2023). These published records vary in their contents. Many years include sub-daily records, usually 3 times a day. Ten-day averages (decades) and monthly means are also provided by sub-daily records. However, for the stations considered here, many of the values corresponding to the mid and late 1890s are available only as monthly means. Part of the early XXth century records was also digitized from digital images of the weather records published by OMA, imaged in the UK by the CORRAL project, and archived by CEDA (Centre for Environmental Data Analysis, Chilton, UK). Other records were digitized from OMA Boletin Mensual publications corresponding to the years 1916 to 1919. For many but not all of the stations considered here, the records published in the early XXth century were available both as sub-daily and monthly mean records. Monthly mean surface temperatures were also validated and published in OMA publications. These values were verified, when available, with published sub-daily records.
Other records for Argentine weather stations, as well as for the Punta Dungeness (Chile) weather station, were either collected by one of us (O. Bonfilli) or obtained from the KNMI Climate Explorer database (https://climex.knmi.nl, accessed on 10 December 2023), which corresponds to the GHCN database [17]. Records for Punta Arenas (Chile) and Cape Pembroke (Malvinas/Falklands) were also retrieved from the KNMI Climate Explorer. A great effort was made to obtain as complete an observational timeseries as possible, specifically with mean monthly temperatures, for the study period, 1880–1920. The OMA records detailed above were completed with monthly mean temperatures recovered and recorded by Bonfilli for a very large number of weather stations that operated, even if only for a few years, across Argentine and Chilean Patagonia. This important DR work is compiled in the Bonfilli Collection. The Bonfilli Collection partially overlaps records from OMA publications and GHCN records from KNMI. It is important to note that the records from different sources during these overlapping periods were cross-checked, and no difference whatsoever was observed between them.
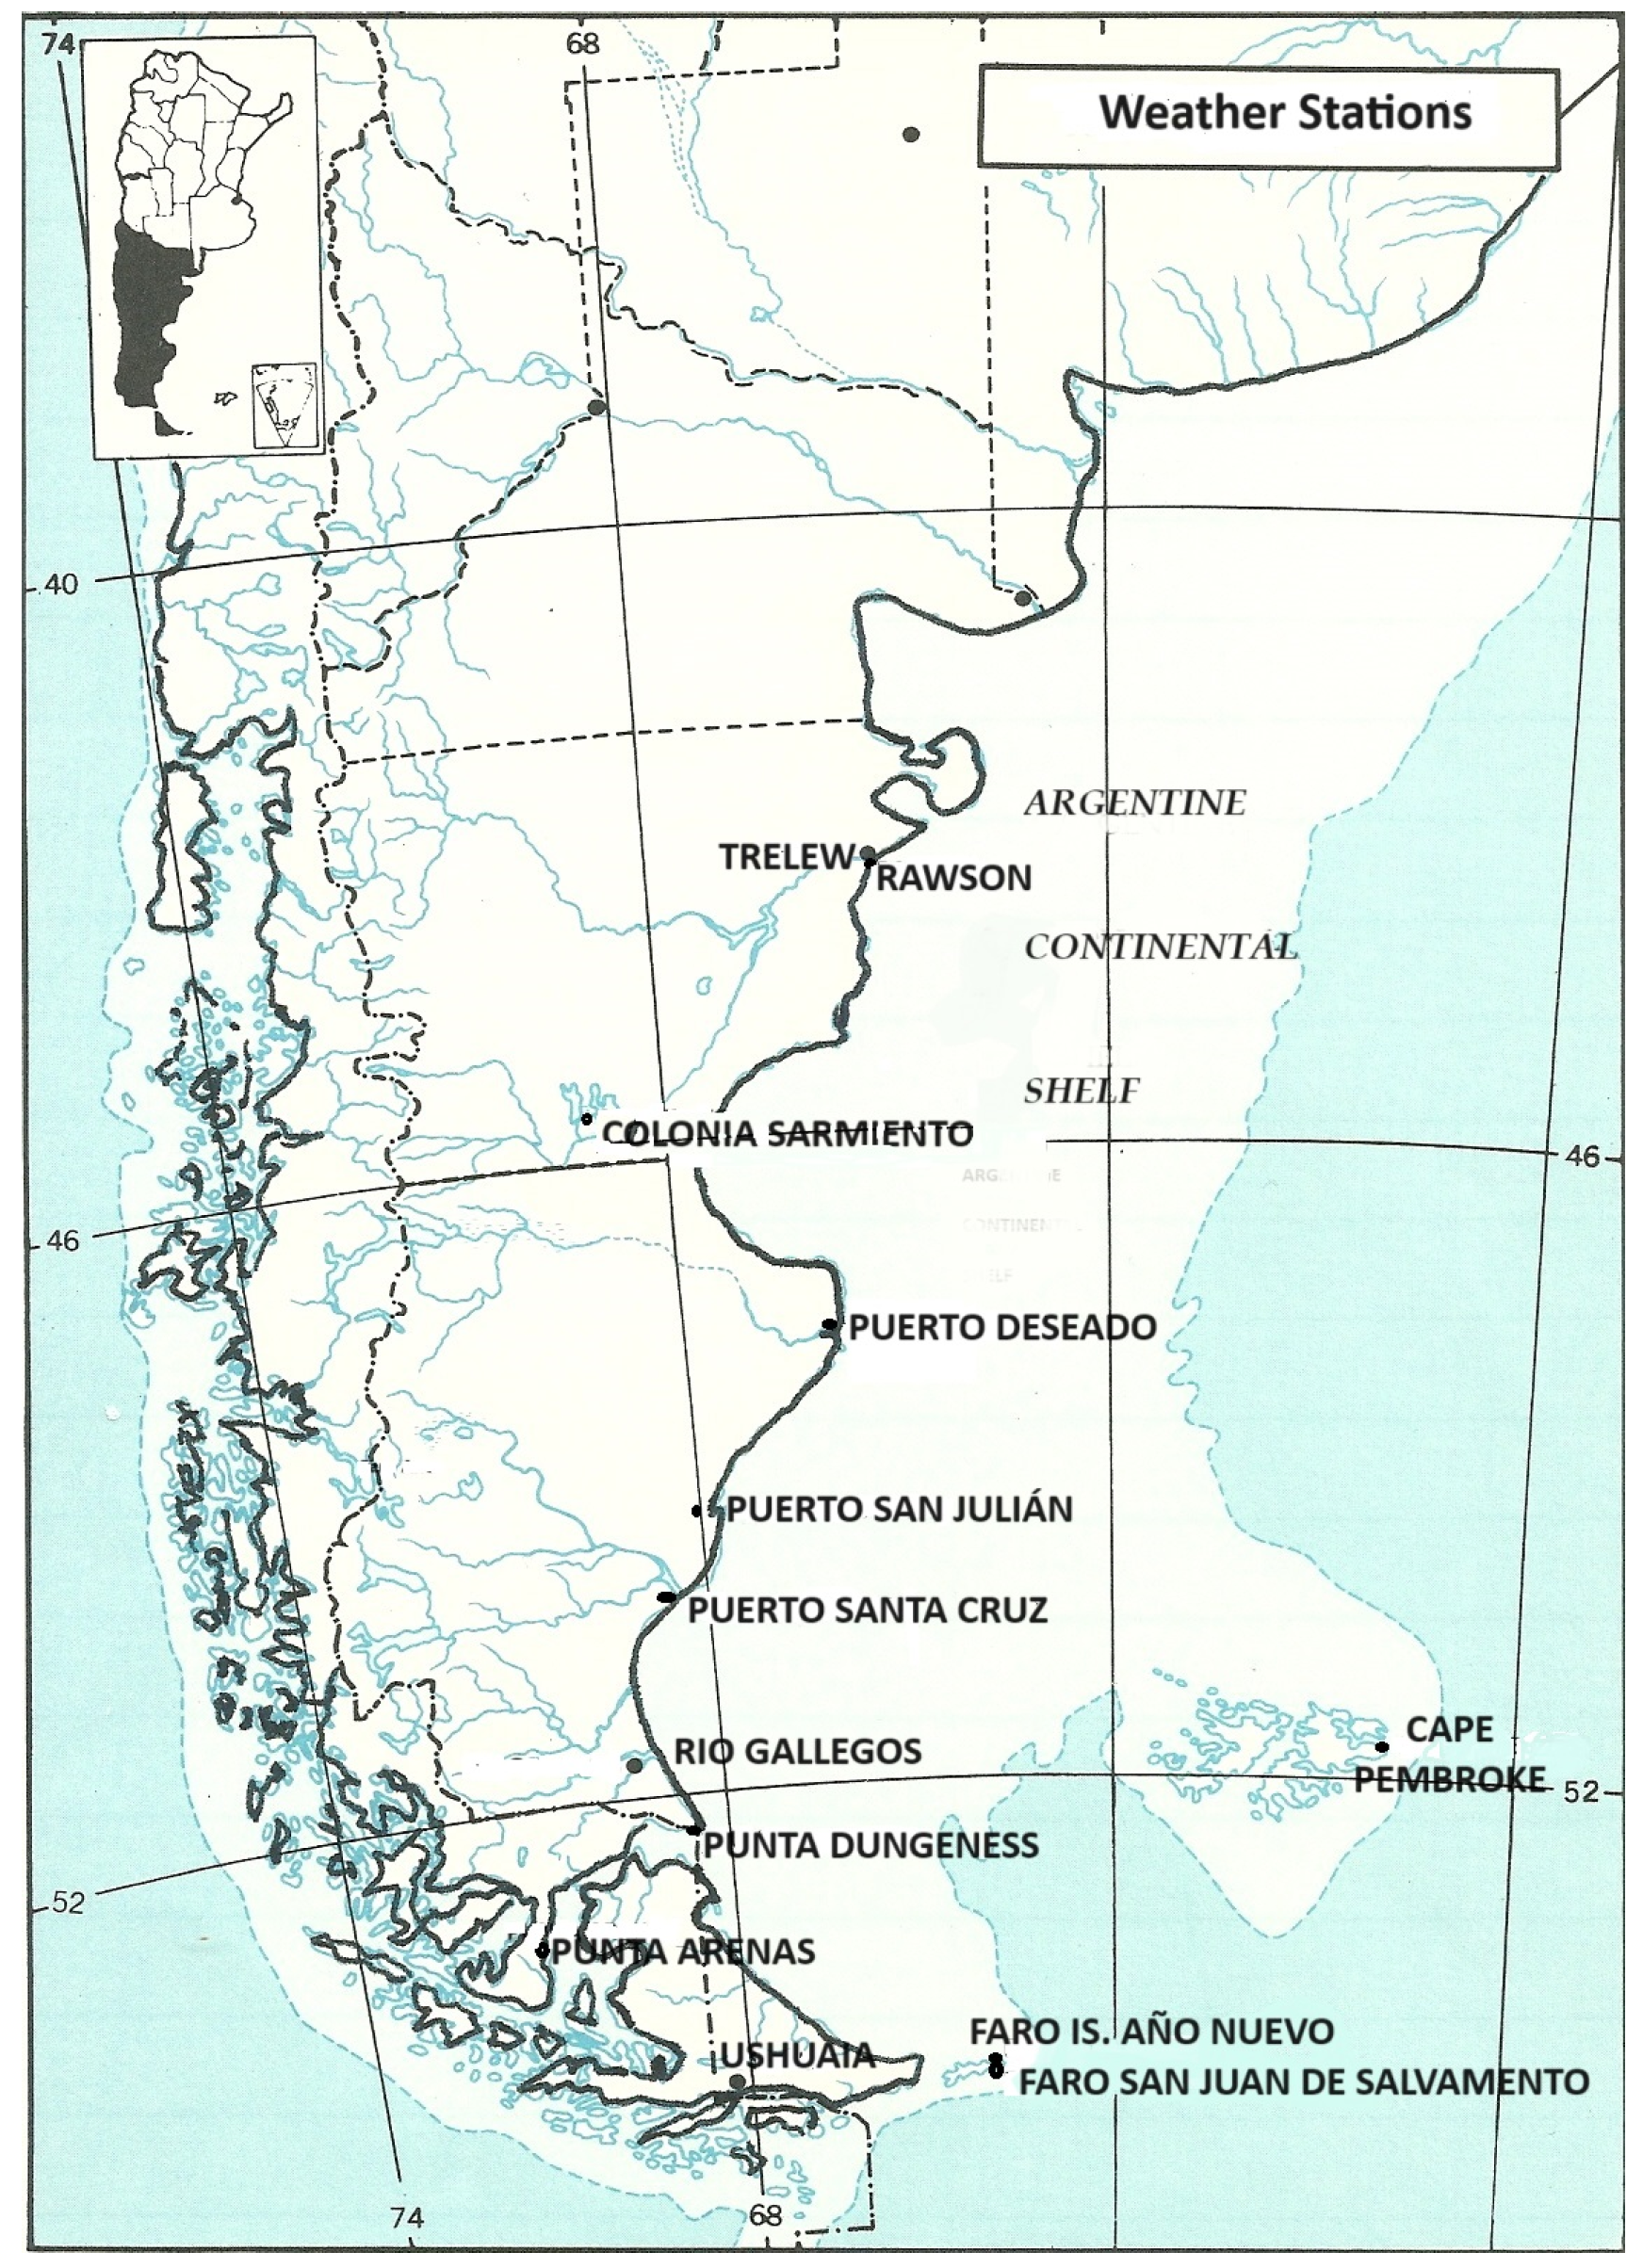
Figure 1 shows the station distribution with a map of Patagonia spanning, from south to north, the provinces of Tierra del Fuego, Antártida e Islas del Atlántico Sur, Santa Cruz, and Chubut in Argentina and the Región de Magallanes y Antártida Chilena, Chile. Table 1 lists the stations whose data, corresponding to the XIX century, were digitized from the Anales OMA, while Table 2 lists XX-century records and their sources, as described above. Additional records corresponding to OMA publications, including Boletines Mensuales, were digitized as necessary. Present-day records for operational stations still in service were obtained from the KNMI Climate Explorer (ClimEx) and/or from the Bonfilli Collection.

Figure 1.
Map of Patagonia showing the location of the stations considered for the study and the shallow Argentine Continental Shelf, extending along the eastern coast of Patagonia to Isla de los Estados and Tierra del Fuego.

Table 1.
Stations from OMA DR records and instrument metadata.
Table 2.
Stations from other data sources.
As can be seen from Figure 1 and the geographic coordinates in the tables, the stations are within a narrow longitudinal band. From Trelew to Rio Gallegos, these stations have the South Atlantic to the east and the Patagonian steppes to the west and are under prevailing westerlies, which are particularly strong to the south of Colonia Sarmiento. In the case of Rawson and Faro San Juan de Salvamento, the analysis was complemented in the XX century by records from the Trelew and Faro Is. Año Nuevo weather stations, which are located very close to the early observation sites. Station displacements in old weather records, particularly XIX-century ones, are a prevailing issue in this kind of analysis. Admittedly, such a combination of records is not optimal, but such a comparison can still provide interesting insights. It is also important to note that only Colonia Sarmiento (now Sarmiento) is an inland station (approx. 100 km from the coast to the east and 120 km from the Andes to the west). Its observations thus correspond to the Patagonian steppe climate. Trelew is approximately 20 km from the coast. The towns of Puerto Deseado, Puerto Santa Cruz, and Rio Gallegos are located in “rías”, or narrow steep-sided tidal estuaries, surrounded by the steppe-like Patagonian coastal ”meseta” or plateau. At some of these locations, observations were carried out in the meseta region. Punta Arenas and Ushuaia are coastal stations, Punta Arenas being on the southward leg of the Strait of Magellan and Ushuaia on the Beagle Channel, surrounded by the Andes mountains of Tierra del Fuego to the north and Navarino Is. to the south, which form a wind duct for strong westerlies. Cape Pembroke, Faro Punta Dungeness, Faro Is. Año Nuevo, and Faro San Juan de Salvamento Faro are found on the coast, mostly surrounded by the sea. The first three are located in low-lying areas or a low plateau (Faro Is. Año Nuevo), while the latter is on the edge of the steep terrain of the Is. de los Estados (Staten Is., Figure 2). In particular, Faro Punta Dungeness is found on the eastern entrance of the Strait of Magellan, with the South Atlantic to the east.

Figure 2.
Faro San Juan de Salvamento, Isla de los Estados (upper); Faro Isla Año Nuevo, Isla de los Estados Archipelago (middle); Faro Punta Dungeness, Magellan Strait (lower).
It is important to note that, except for a few scattered settlements, mostly Catholic and Anglican missions, Patagonia was and mostly remains scantily populated. For example, the estimated original population of Tierra de Fuego was in the order of 12,000 inhabitants at the time of Darwin and the H.M.S. Beagle’s circumnavigation, and it was sadly and severely impacted by imported diseases from Europe brought by immigrants and, as settlement progressed, by exclusion and murder committed by some of the landowners. The Patagonian coasts were mapped and explored by Magellan in 1520 and Thomas Cavendish in 1586, but no settlements managed to survive the harshness of the local climate. Hence, systematic land-based weather observations in the region began late as European migrations started to settle the region in the 1860s and 1880s (primarily Welsh, Italian, Spanish, Scandinavian, and German), and the Argentine Government formally began to recognize these settlements, provide administration, and gave free land to these immigrants.
Most of the stations set up by the OMA in the XIXth and early-XXth Centuries were managed by observers who were later remembered for their role in national and regional/local history. In this study, the observers at Rawson and Ushuaia were Richard Jones Berwyn (1838–1917) and Rev. Thomas Bridges (1842–1898). R.J. Berwyn (Figure 3, left) was one of the promoters of Welsh migration and the settlement of Chubut Province in the 1860s (Figure 3, upper center). In addition to being a teacher, author, founder, and farmer, he also ran the weather station at his rural establishment in Rawson. Rev. Thomas Bridges (Figure 3, right) was an Anglican preacher who came to Tierra del Fuego to preach to the original Yámana population. His Anglican mission (Figure 3; lower center) would become, in 1884, Ushuaia, the capital of Tierra del Fuego Province. He later moved to lands the Argentine Government gave him in recognition for his work in Tierra del Fuego, Estancia Harberton.

Figure 3.
Richard Berwyn Jones (left). Welsh migrants at Rawson (upper center). Anglican Mission Ushuaia, circa 1880 (lower center). Rev. Thomas Bridges (right).
When the original records from OMA volumes and publications had calibration corrections recorded in the station description, the specific correction value given, and it was stated that they had to be used, these corrections then were applied to the records for the present analysis. In many cases, the temperature correction provided by the Kew Gardens calibration was 0.1 °C or less, in which case, it was described as negligible. The statistical analysis methods applied are standard climatology analysis procedures, specifically, monthly, seasonal, and annual means; standard deviations; root mean square calculations for anomalies; trend testing with the Mann–Kendall Test; and least-squares linear fit for trend estimates.
3. Results
3.1. Monthly Mean Surface Temperature Behavior, 1876–1920
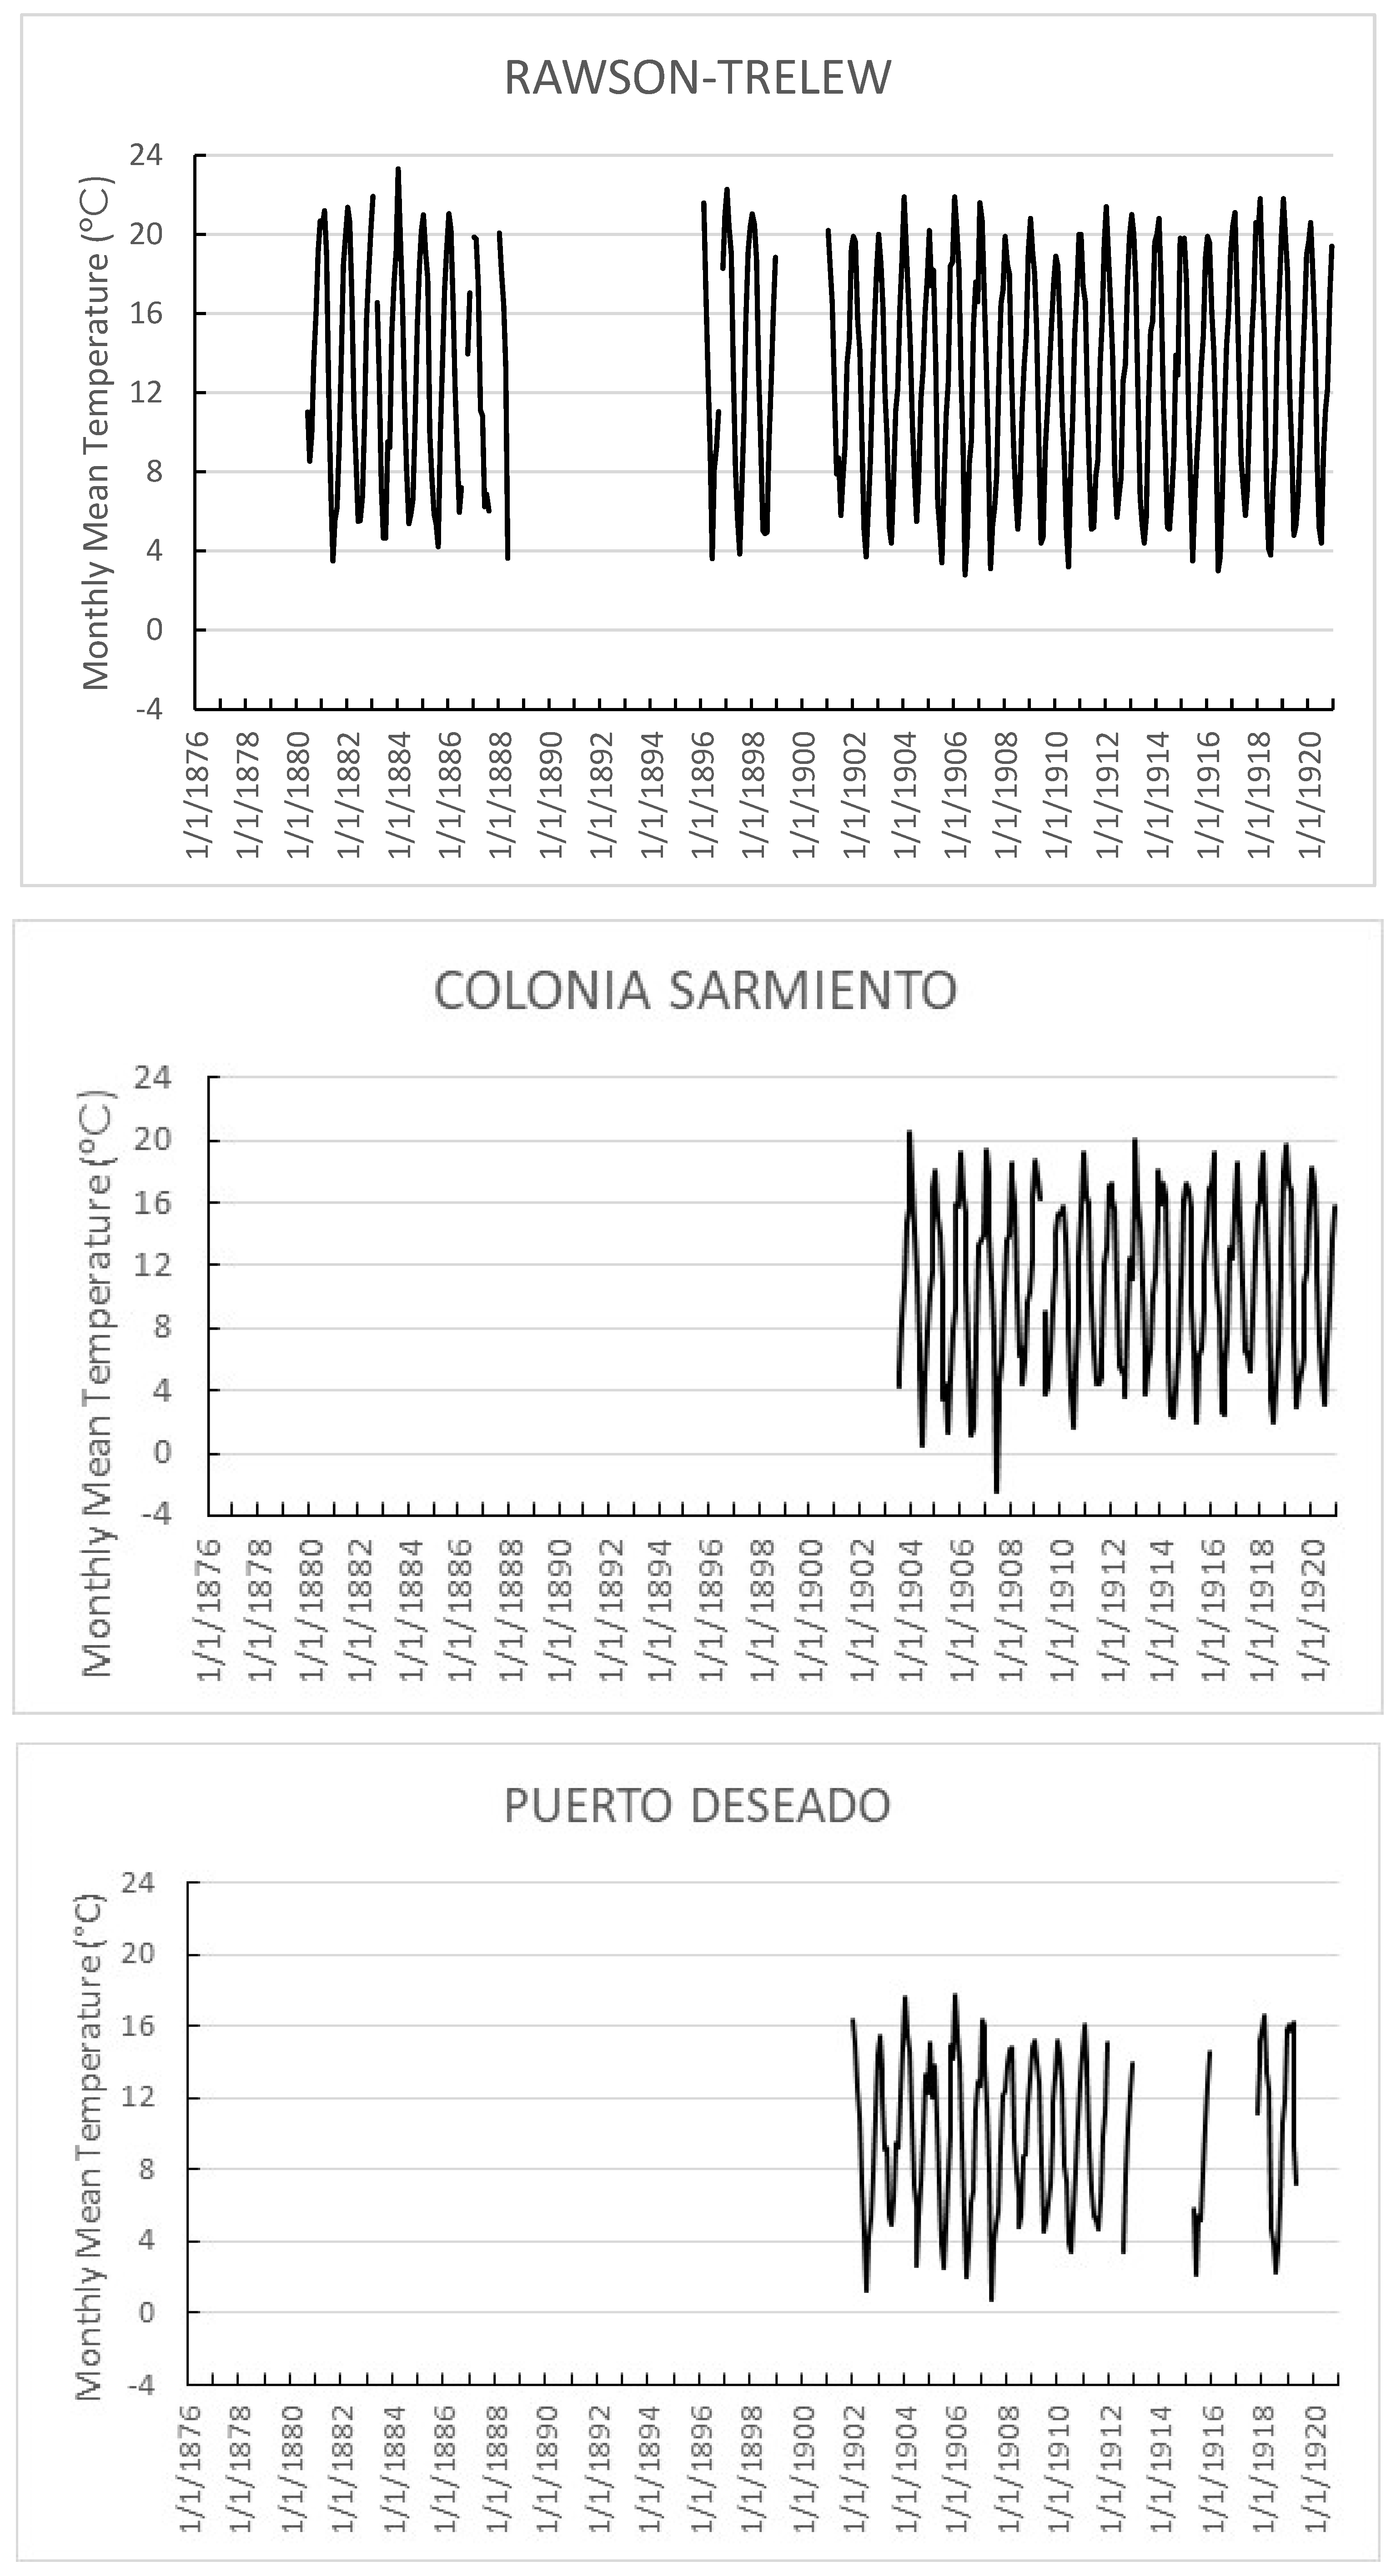
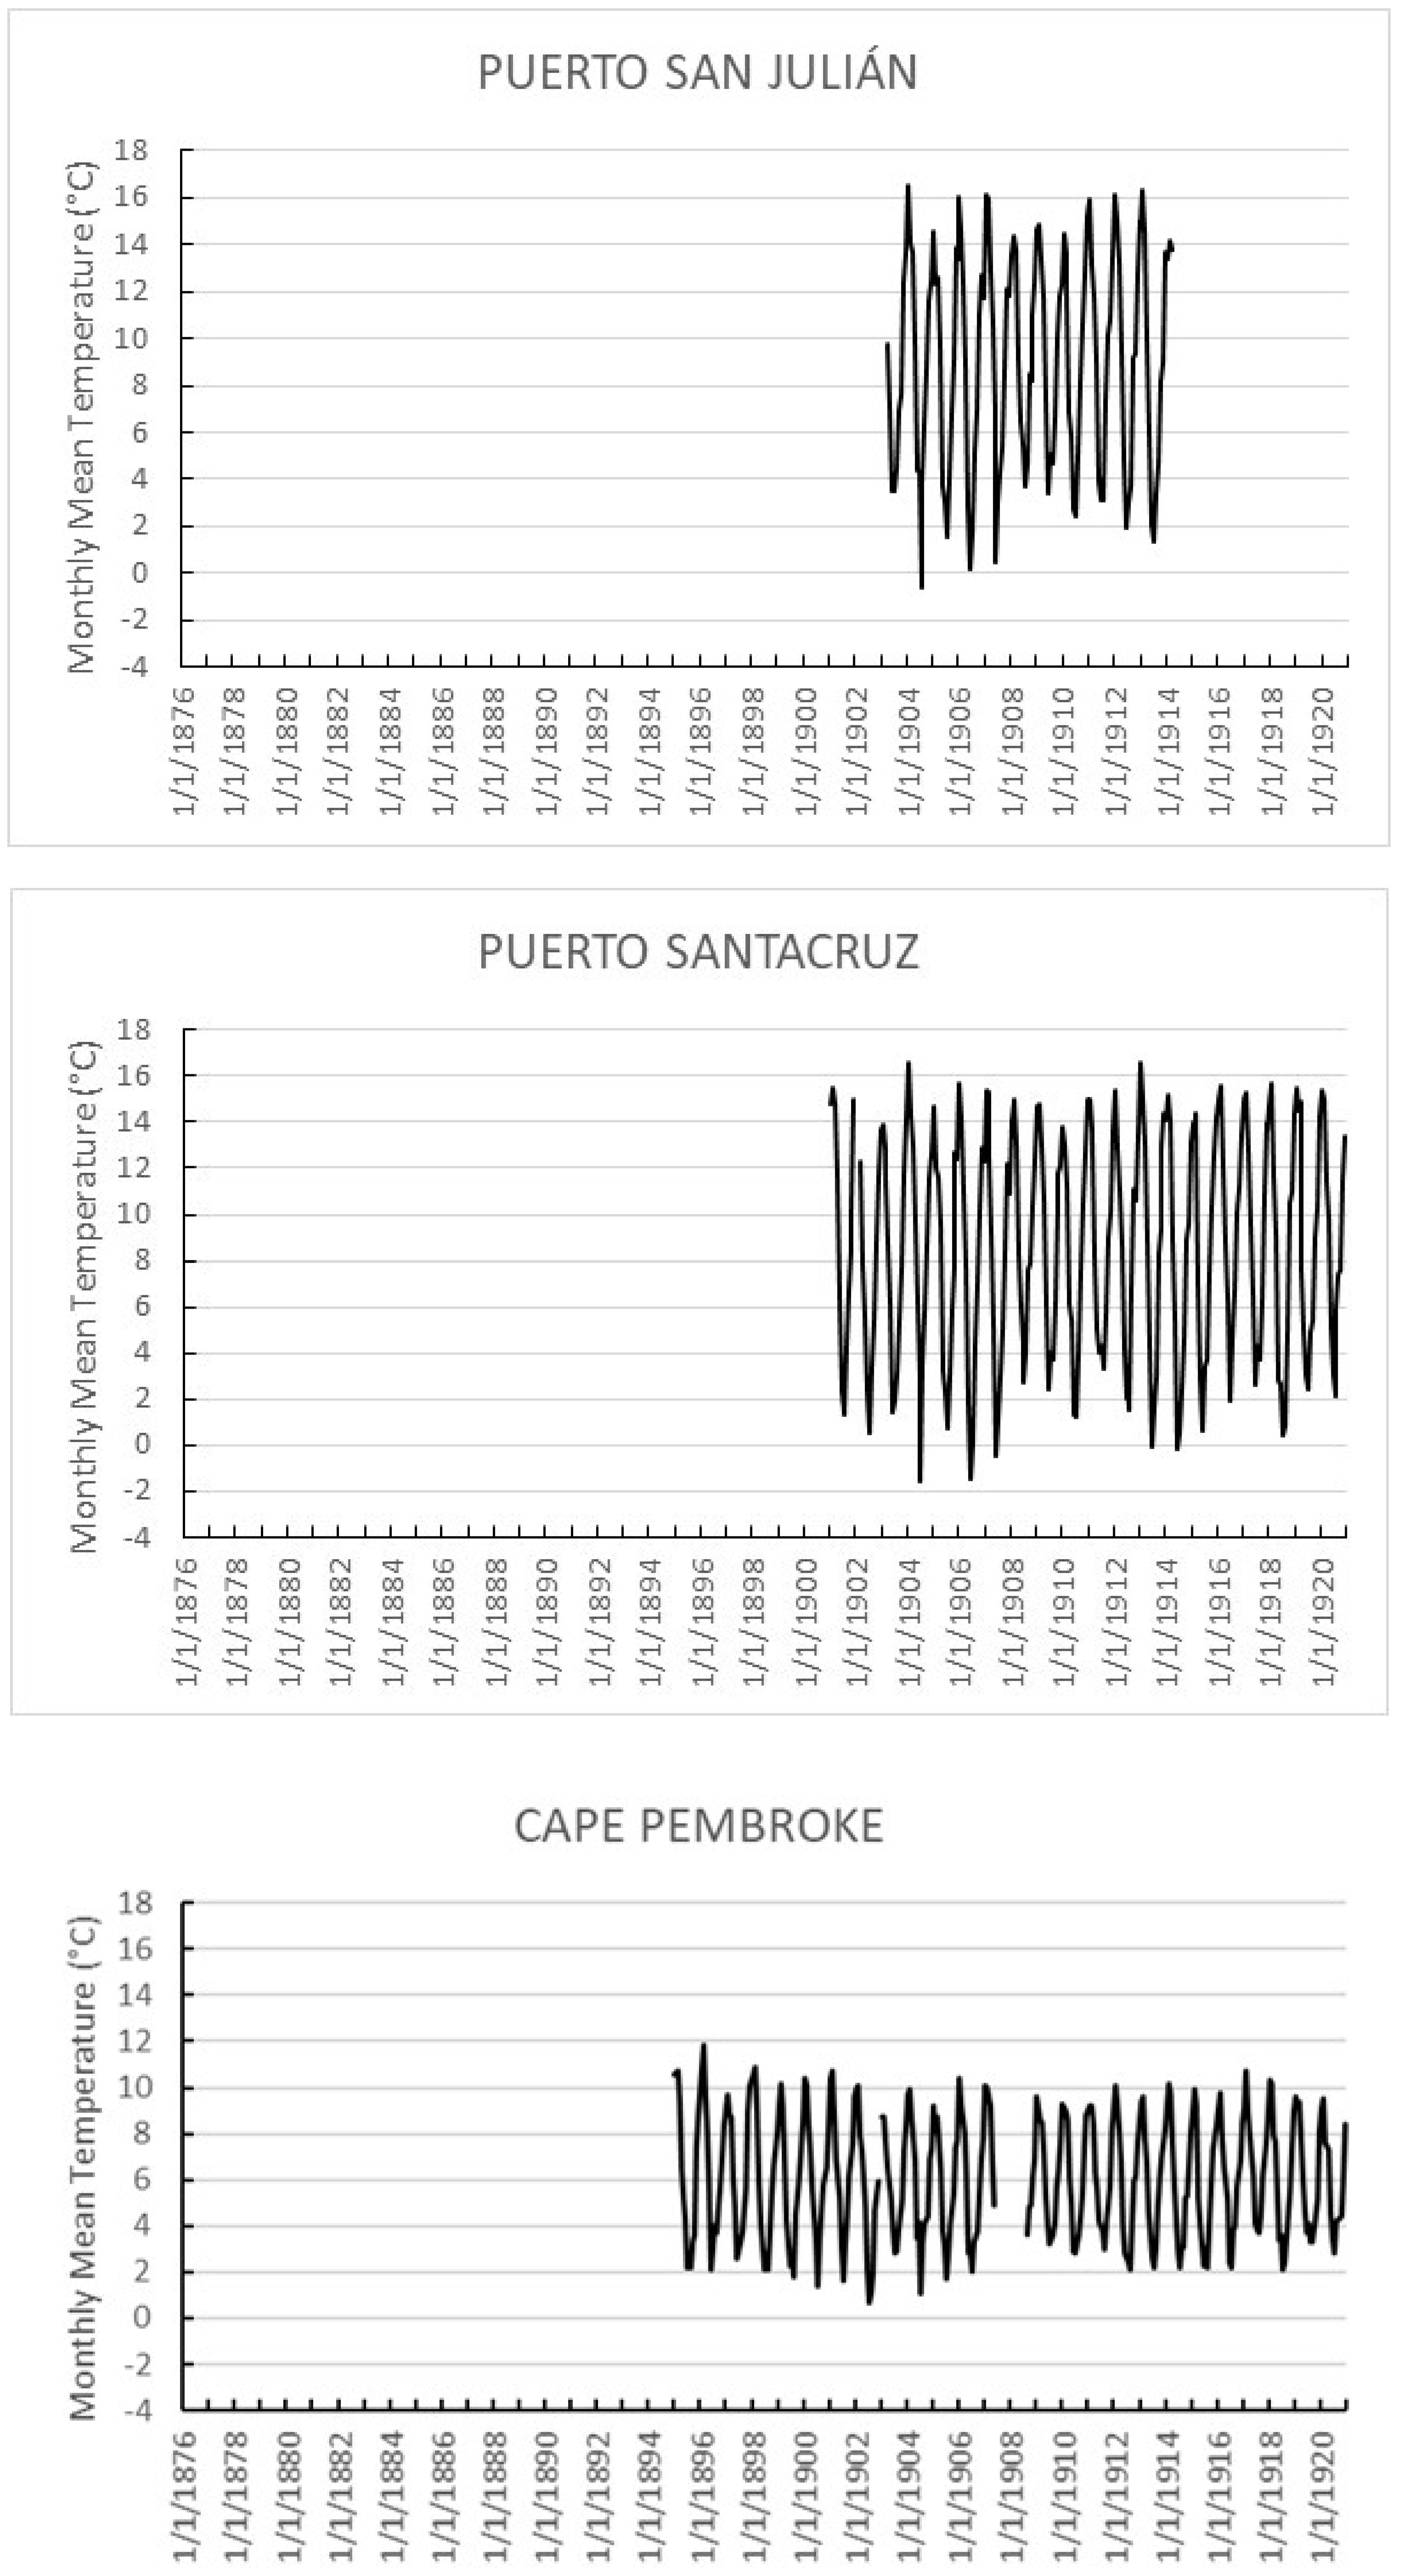
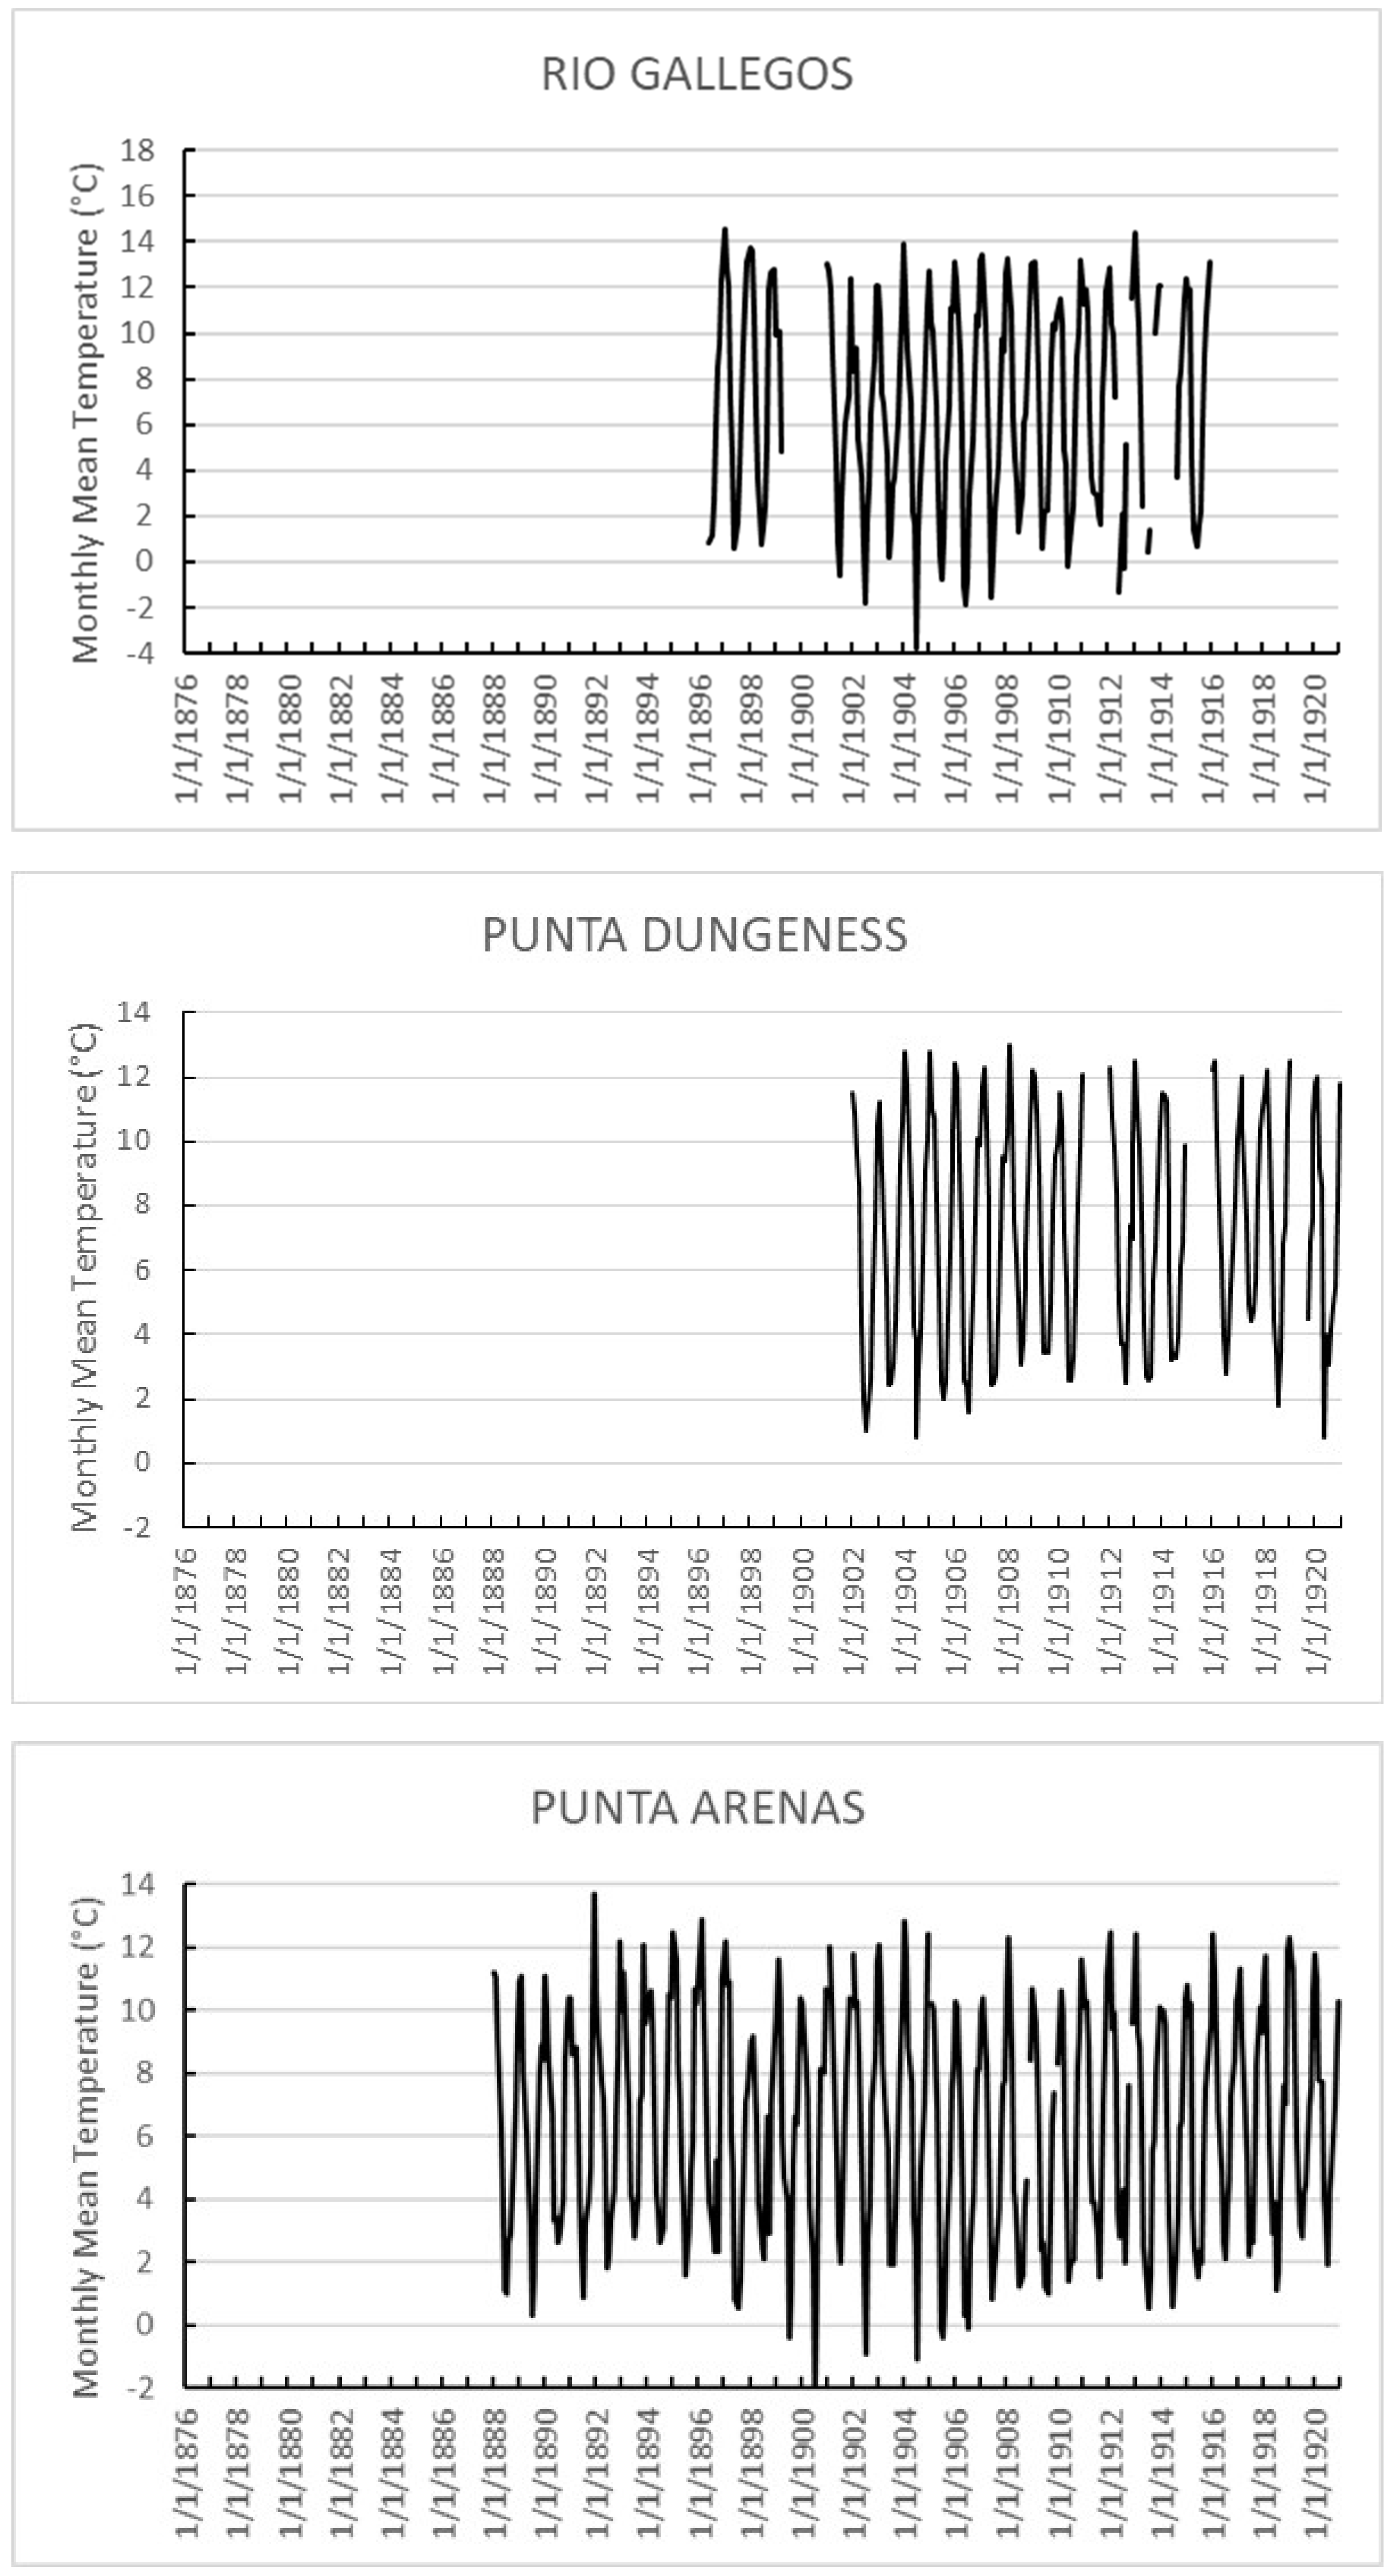
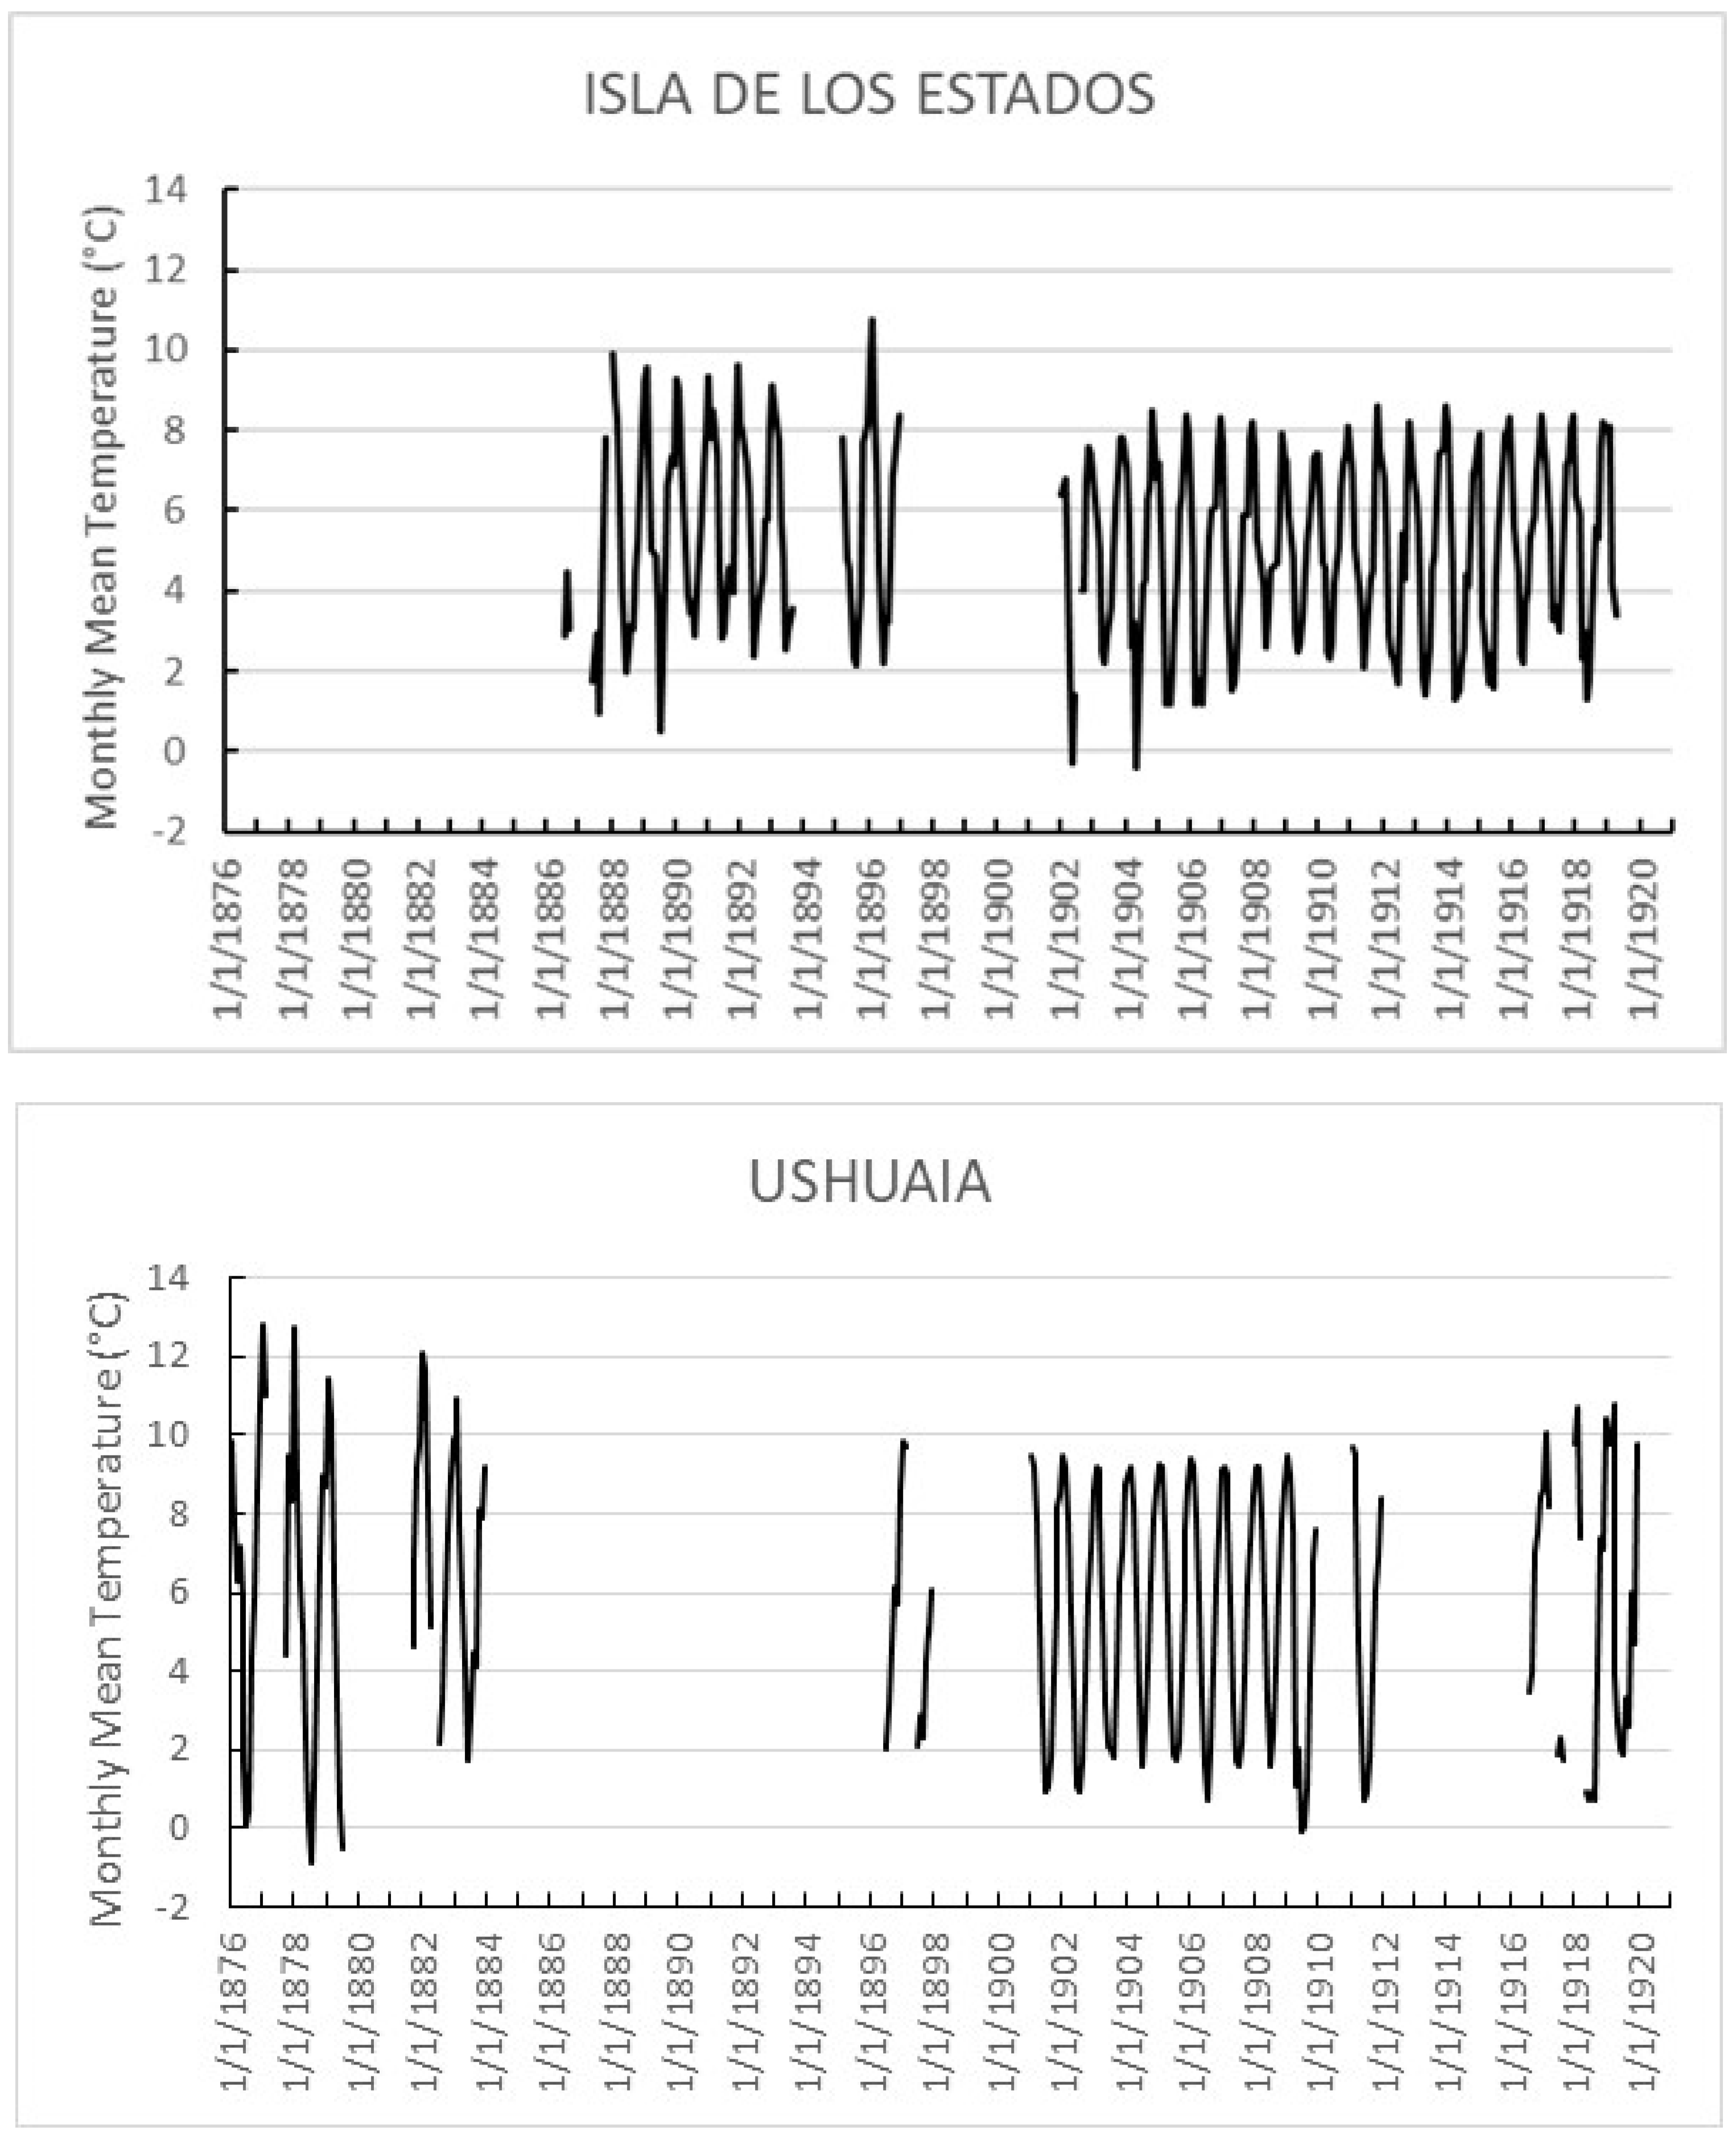
Figure 4 shows the available monthly mean surface T timeseries between 1876 (earliest available observations in the study region) and 1920. The plots are ordered from north to south, i.e., from southern midlatitudes to subpolar latitudes. The data coverage varies significantly from station to station. The longest, most continuous records in the study correspond to Punta Arenas beginning in January 1888 (almost 32 out of 32 consecutive years) and Cape Pembroke beginning in February 1895 (almost 24 years out of 25 consecutive years), whereas Ushuaia spans the longest overall period, 44 years, but with intermittent records (just under 18 years of data overall). The major gaps are detailed in Table 1. Rawson and Trelew jointly cover, with a few breaks, over 30 years of observations between June 1880 and December 1920. Similarly, Faro San Juan de Salvamento and Faro Is. Año Nuevo together cover 26.5 years between July 1886 and April 1919. These will hereafter be referred to jointly as Isla de los Estados. All other stations span around 20 years of observations, mostly after 1900.
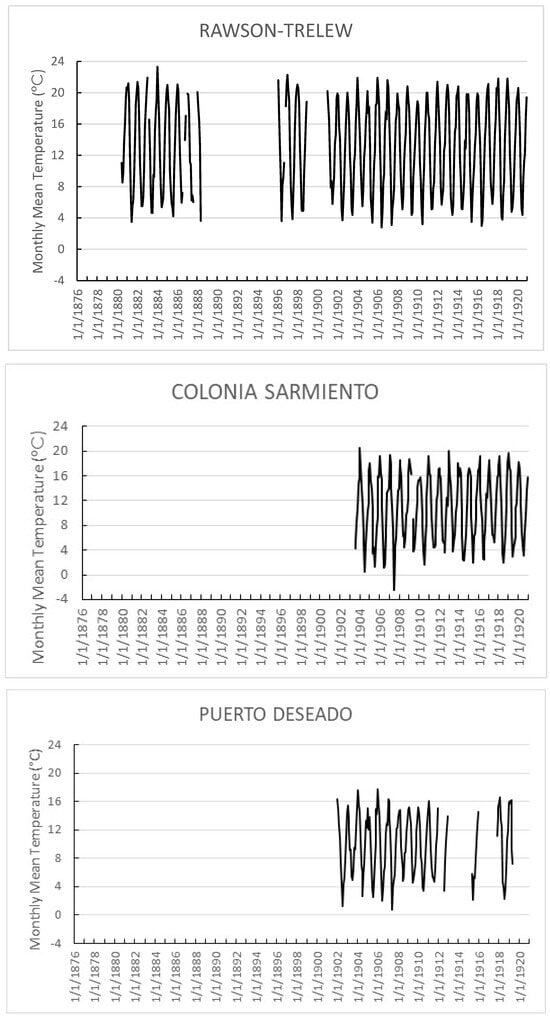
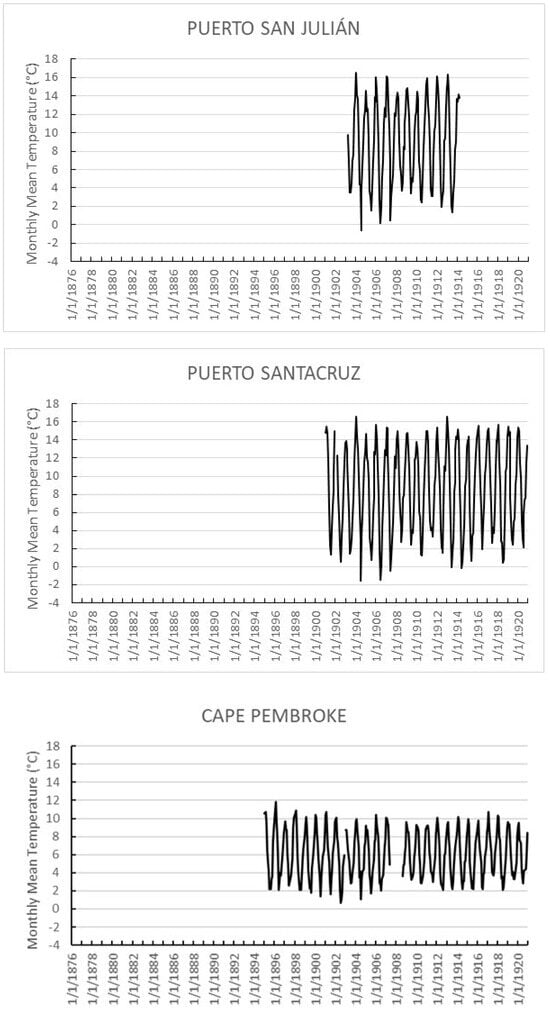

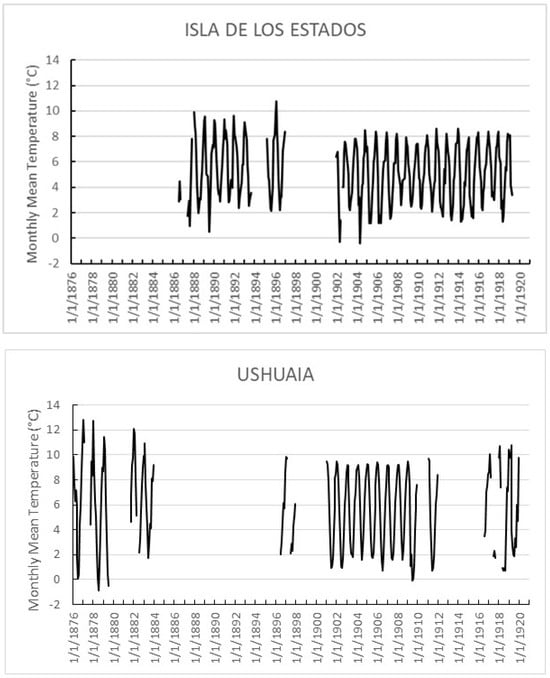
Figure 4.
Monthly mean temperatures for the period January 1876 to December 1920 (horizontal axis) at each study location. The plots are ordered by latitude from north to south, i.e., from midlatitudes to subpolar latitudes. Note that, given the significant latitudinal variations in the temperature range, the plots’ temperature scales have been divided into three geographic regions: Chubut and Northern Santa Cruz Provinces; Central and Southern Santa Cruz Province and Malvinas/Falkland Is.; and Magellan Strait/Tierra del Fuego Province.
An inspection of Figure 4 yields some interesting features in the evolution of the mean monthly surface temperature during the study period. A close inspection of the station timeseries spanning both the late-XIX century and early-XX century shows that the study region during the late XIX century was warmer than during the beginning of the XX century. This can be observed beginning with Cape Pembroke and Punta Arenas (both GHCN records spanning both centuries), where the 1890s are warmer than the 1900s. Although Rio Gallegos shows a data gap at the turn of the century, the station remained operational; it was not moved and its instruments were not changed during the study period, and hence, from an operational perspective, the overall record is continuous. The missing records are currently being sought. An inspection of coupled stations, Rawson–Trelew and Is. de los Estados—when viewed with care given the gap and limited changes in location detailed above—nevertheless also show the occurrence of a comparatively warmer late-XIXth century. Even the stations whose records are limited to the XX century show a particularly cold period between approximately 1902 and 1910 in agreement with Cape Pembroke, Punta Arenas, and Rio Gallegos. It must be noted that updated hemispheric temperature anomaly plots from NASA GISTEMP (2023) show that the most negative anomaly from 1880 to the present day occurred, in particular, in the Southern Hemisphere in the 1902–1912 period, with temperatures cooler than during the two decades prior to 1900 up to at least through the 1930s. An analysis of near-surface temperatures in the HadCRUT5 dataset [18] also shows the same evolution. Furthermore, when the annual surface temperature evolution is considered based on latitude bands, the southern extratropics (30 to 60° S) show the most prominent cooling at the time compared with other southern-latitude bands. Thus, the behavior observed for the Southern Patagonia stations is consistent with the hemispheric and global temperature variability at the time.
All locations have significant interannual-to-decadal variability, which appears to have a dominant quasi-decadal mode and probably shorter period modes as well, at least during the first decades of the XXth century. This modulation is more prominent in the Cape Pembroke and Is. de los Estados area and more distinct at higher latitudes than lower latitudes. Only Ushuaia shows a temporal evolution different from all other stations considered here. The corresponding Anales OMA do report issues with the Ushuaia temperature measurements before 1882.
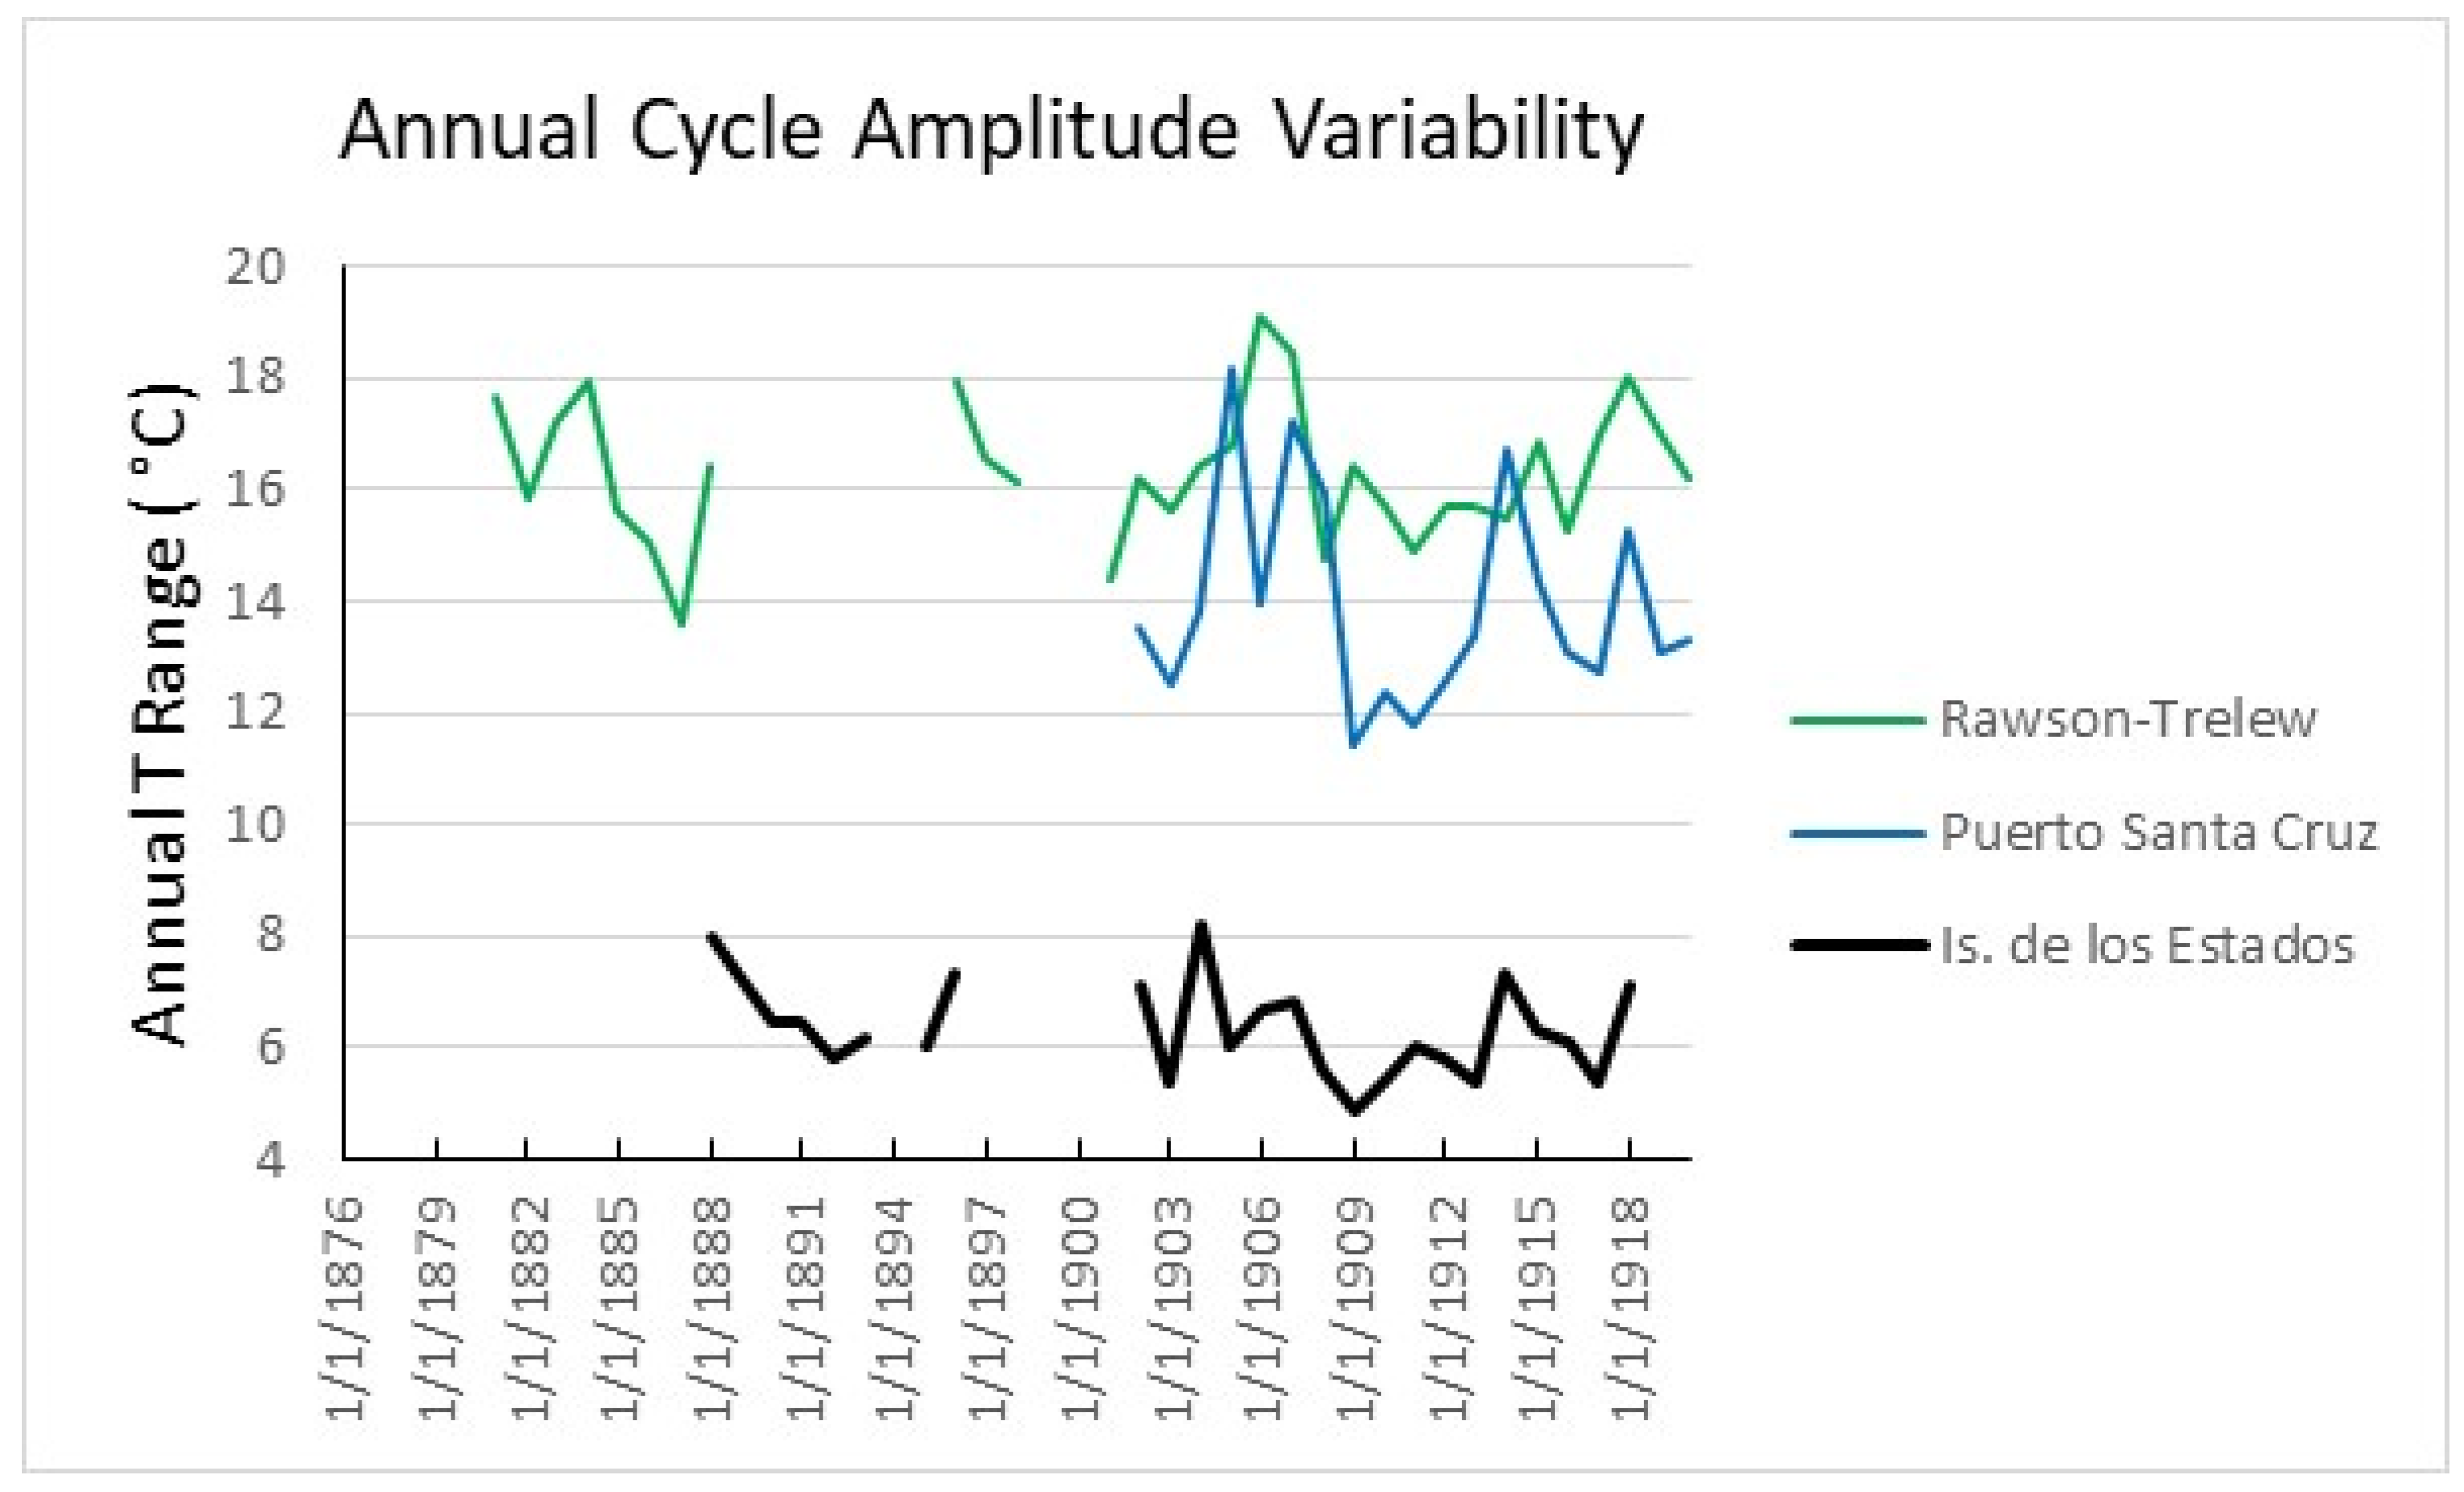
The temporal evolution of the observed low-frequency modulation (variability with a period greater than 3 years) is consistently similar across all other stations, except Ushuaia. This is further highlighted by the evolution of the annual temperature or thermal amplitude, defined as the warmest summer (DJF) monthly mean temperature minus the coldest winter (JJA) monthly mean temperature at three stations representing different latitudes of the study area (Figure 5). This figure shows that the temporal evolution of the low-frequency modulation is similar across the latitude range, with some differences in shorter timescales. During the early decades of the XX century, reduced temperature ranges can be observed for the period 1909–1913, and the largest ranges can be observed over the period 1903–1908. Considered together with Figure 4, while this variability is present throughout most of the study region, the modulation of this variability is more prominent at stations that are in a primarily maritime environment (Figure 4), such as Cape Pembroke and Is. de los Estados. This modulation impacts both winter and summer temperatures, so much so that the warmest summers frequently precede the coldest winters, i.e., a modulation that impacts the annual temperature amplitude (Figure 5). The coldest winters observed in the study period took place between 1903 and 1908 at most stations. Such a modulation of the annual thermal amplitude—affecting both summer and winter temperatures, which, furthermore, occurs in an extended region, as observed here—most probably corresponds to an interaction between the annual cycle and a lower frequency wave process, e.g., the variability of the Pacific South America (PSA) Pattern linked to ENSO and PDO [19], resulting in the modulation of the annual cycle amplitude through non-linear interactions [20]. On the other hand, a straightforward superposition of a low-frequency process and the annual cycle, i.e., an additive process, would just result in the cooling or warming of the annual cycle without changes in its thermal amplitude, as can be more clearly seen in the early years of the Cape Pembroke and Punta Arenas records. Normally, both these processes are present together—as close observation of Figure 4 highlights—during the latter years of the study period, e.g., at Puerto Santa Cruz and Punta Arenas. Determining the non-linear wave-to-wave interactions defining this modulation is beyond the scope of the present analysis.

Figure 5.
Annual temperature amplitude at three selected stations, spanning the study area.
The fact that most stations share similar low-frequency variability, as noted, in particular, for the 1901–1920 period, also points to the quality of the observations since they point to a similar response to variability drivers. The different evolution of Ushuaia with regard to all other stations, even after considering the issues reported in the Anales OMA, could result from either the peculiar geography of the Bay of Ushuaia and the Beagle Channel having a significant impact on the local weather, or there may have been issues with the observations made there, e.g., the very large annual cycle amplitude in the earliest observations, as reported in the Anales OMA with respect to subsequent years, and a lack of or very limited interannual modulation with respect to Is. de los Estados, Punta Arenas, and even Punta Dungeness in the early XX Century.
3.2. Annual Temperature Cycles
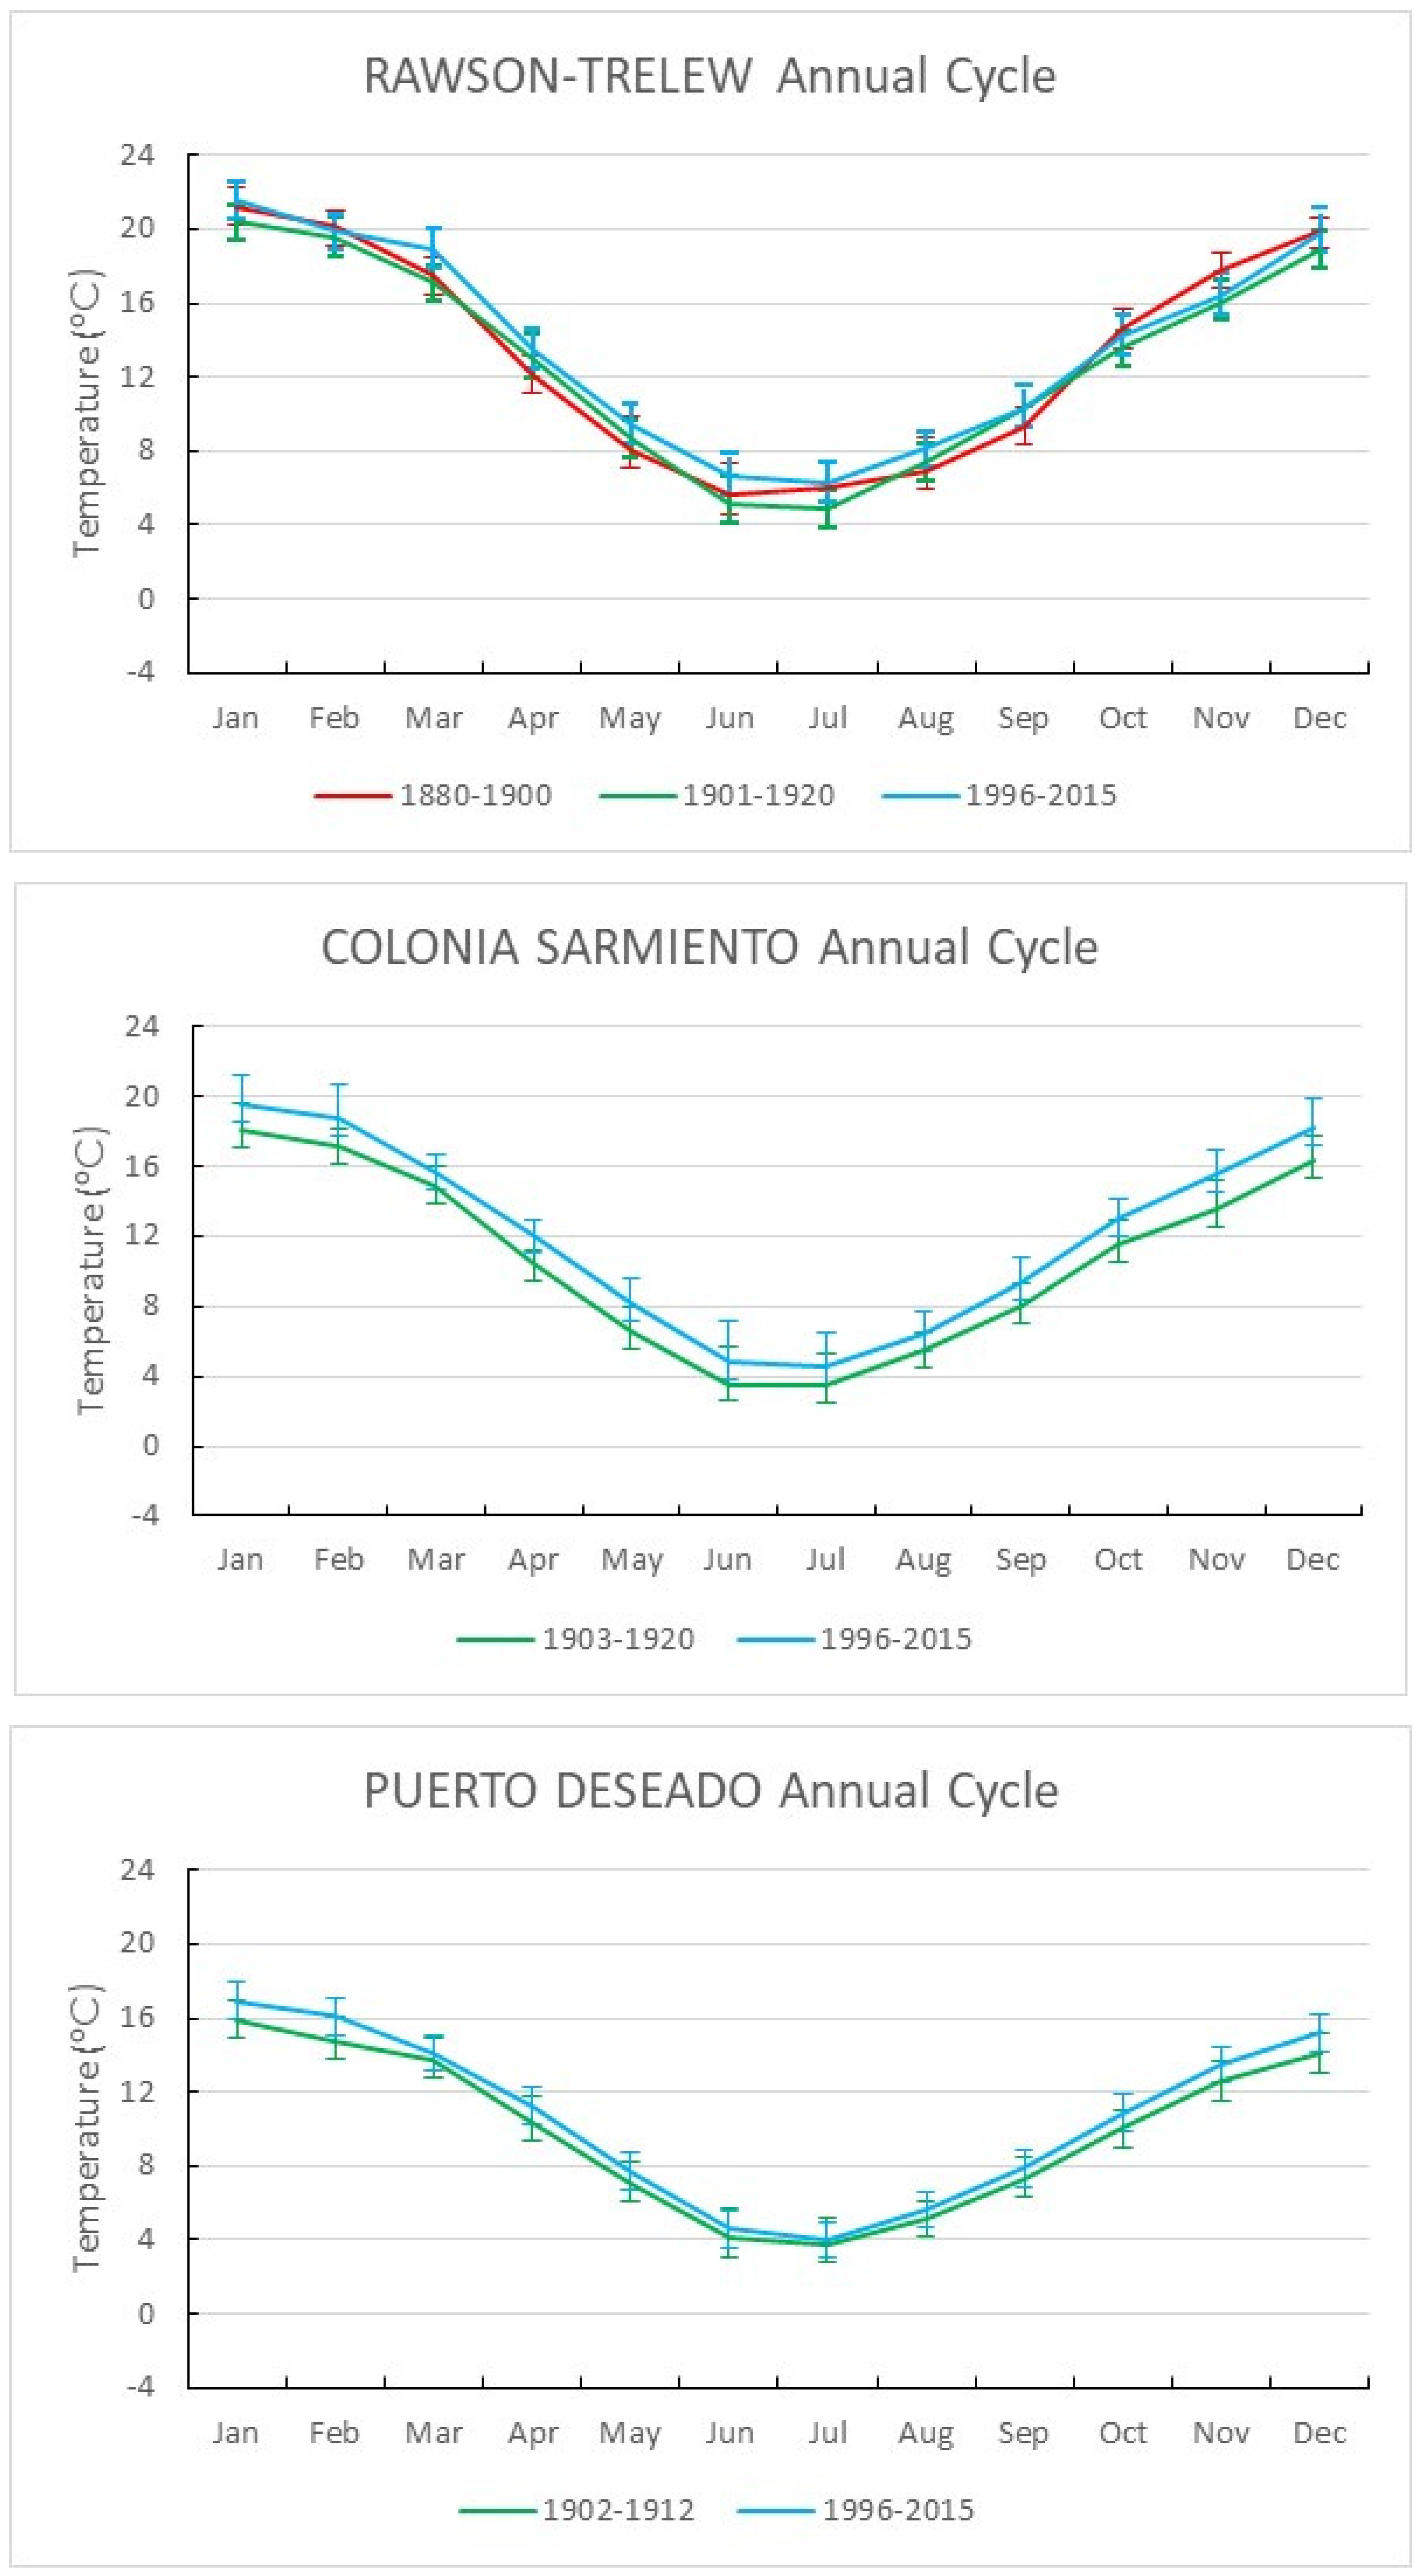
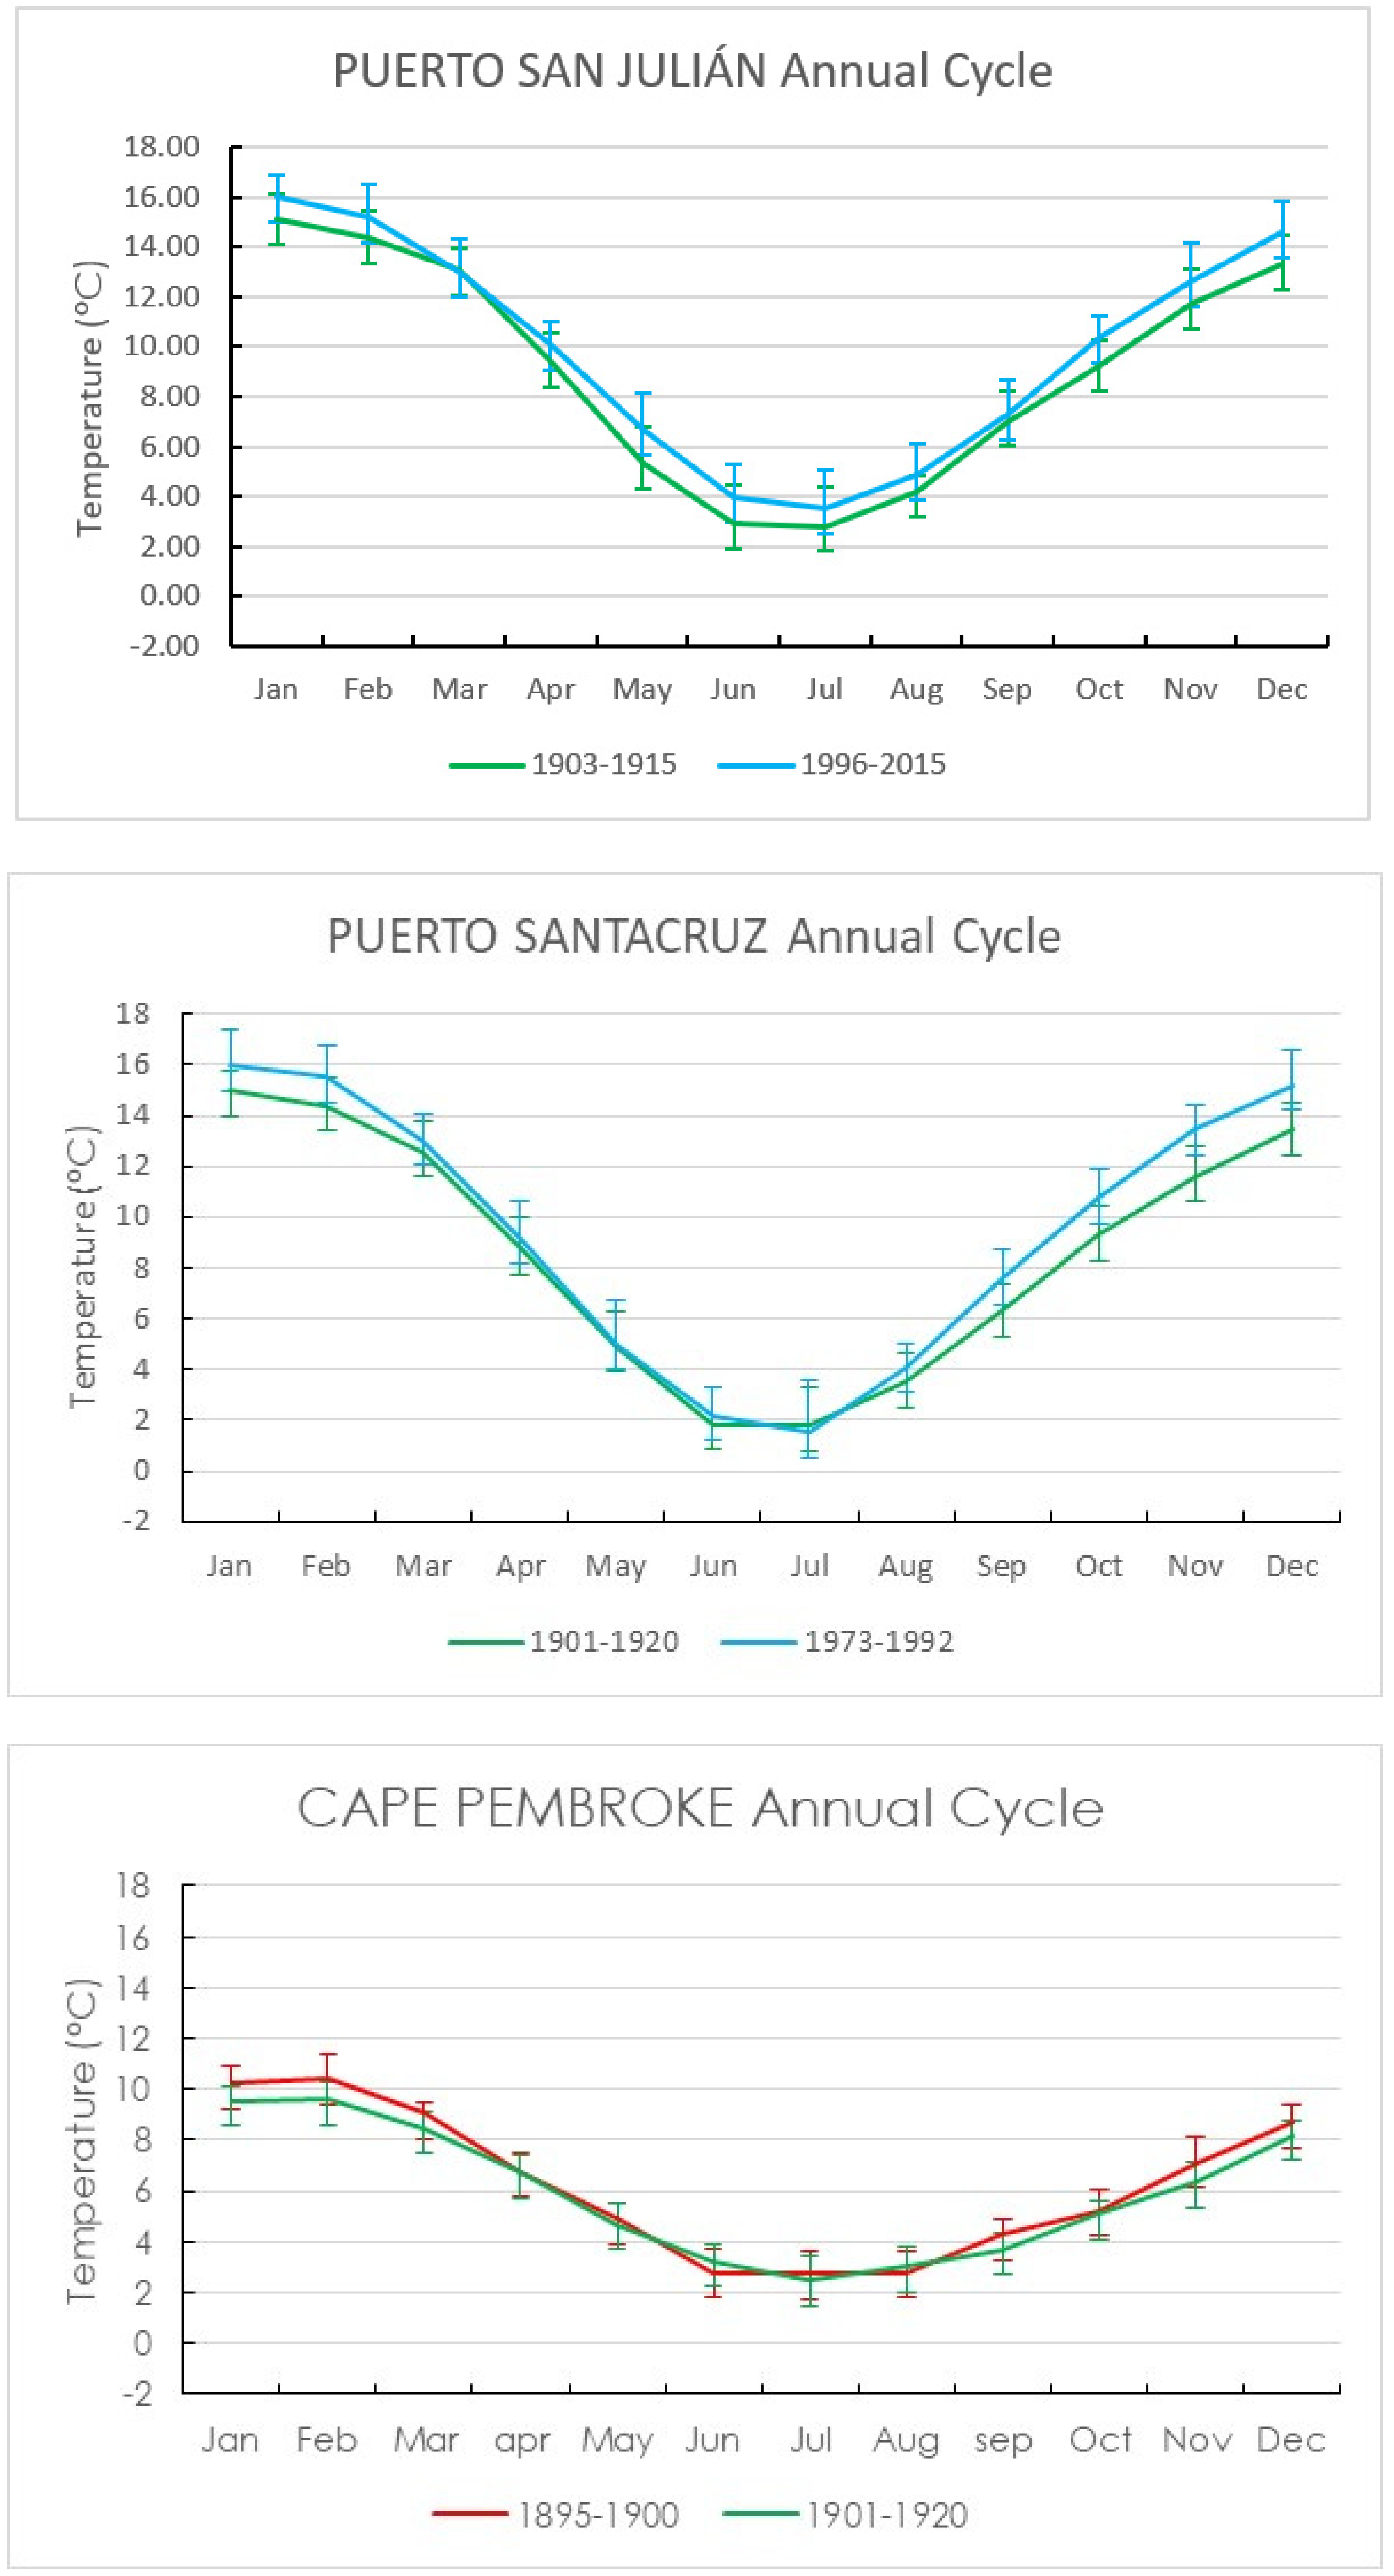
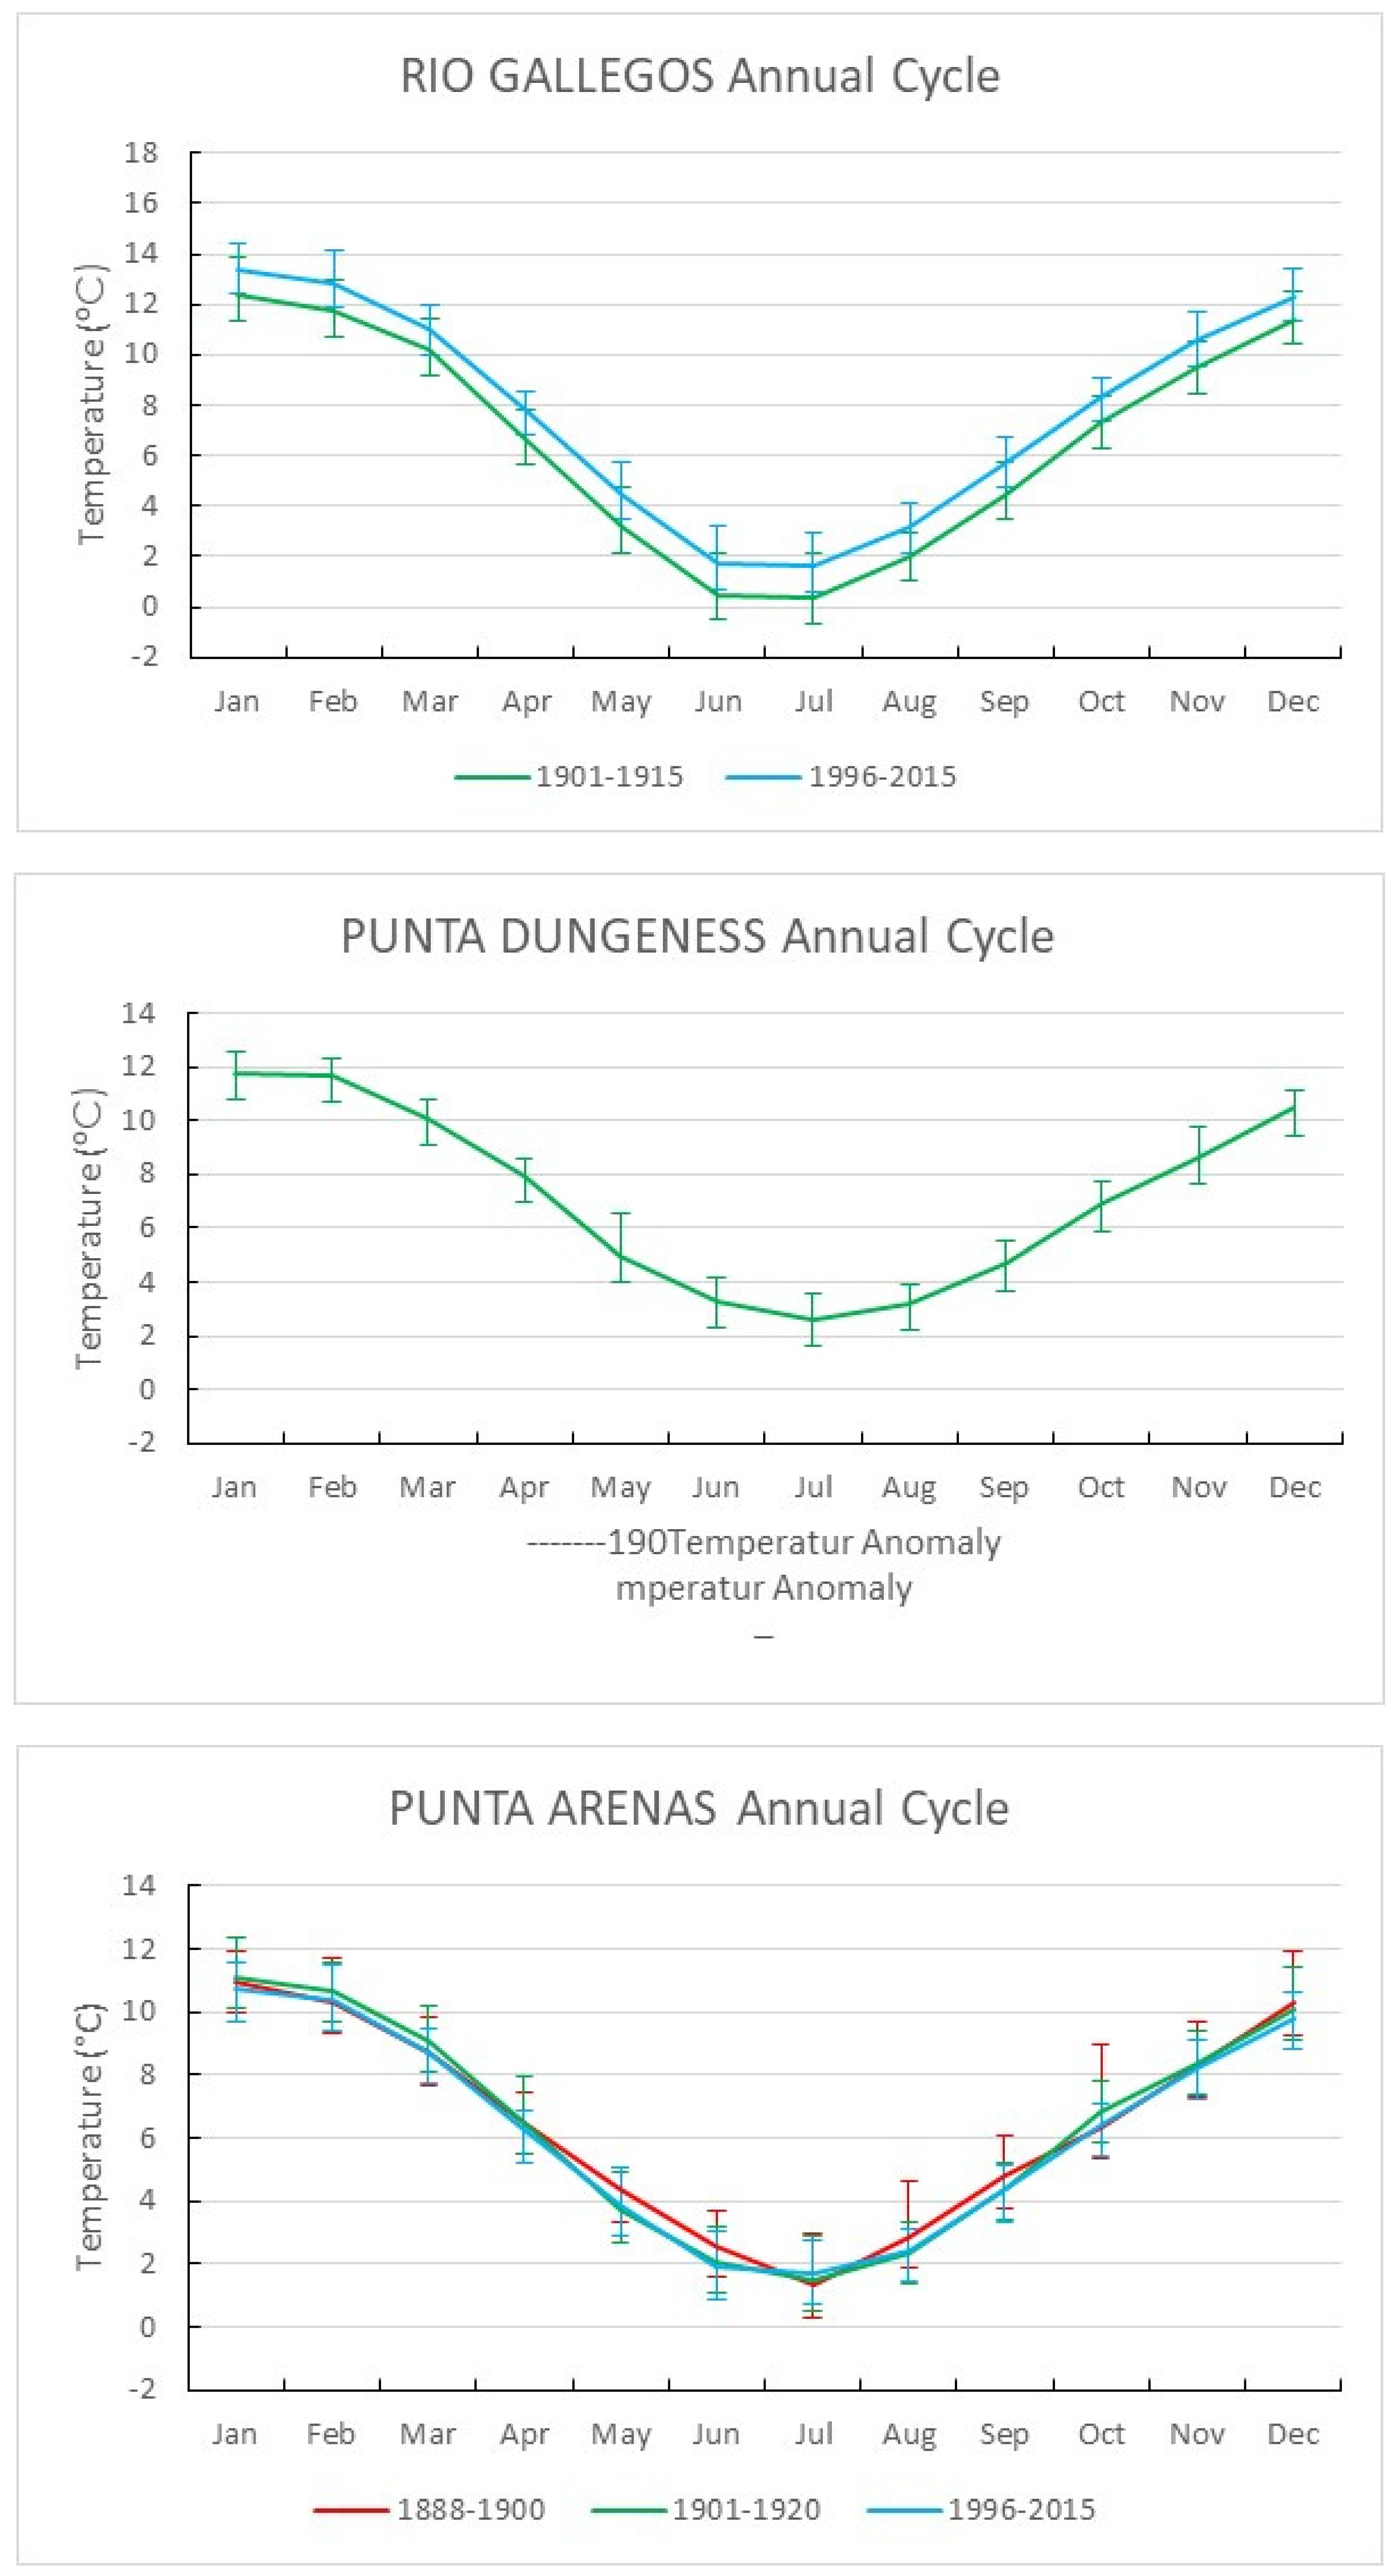
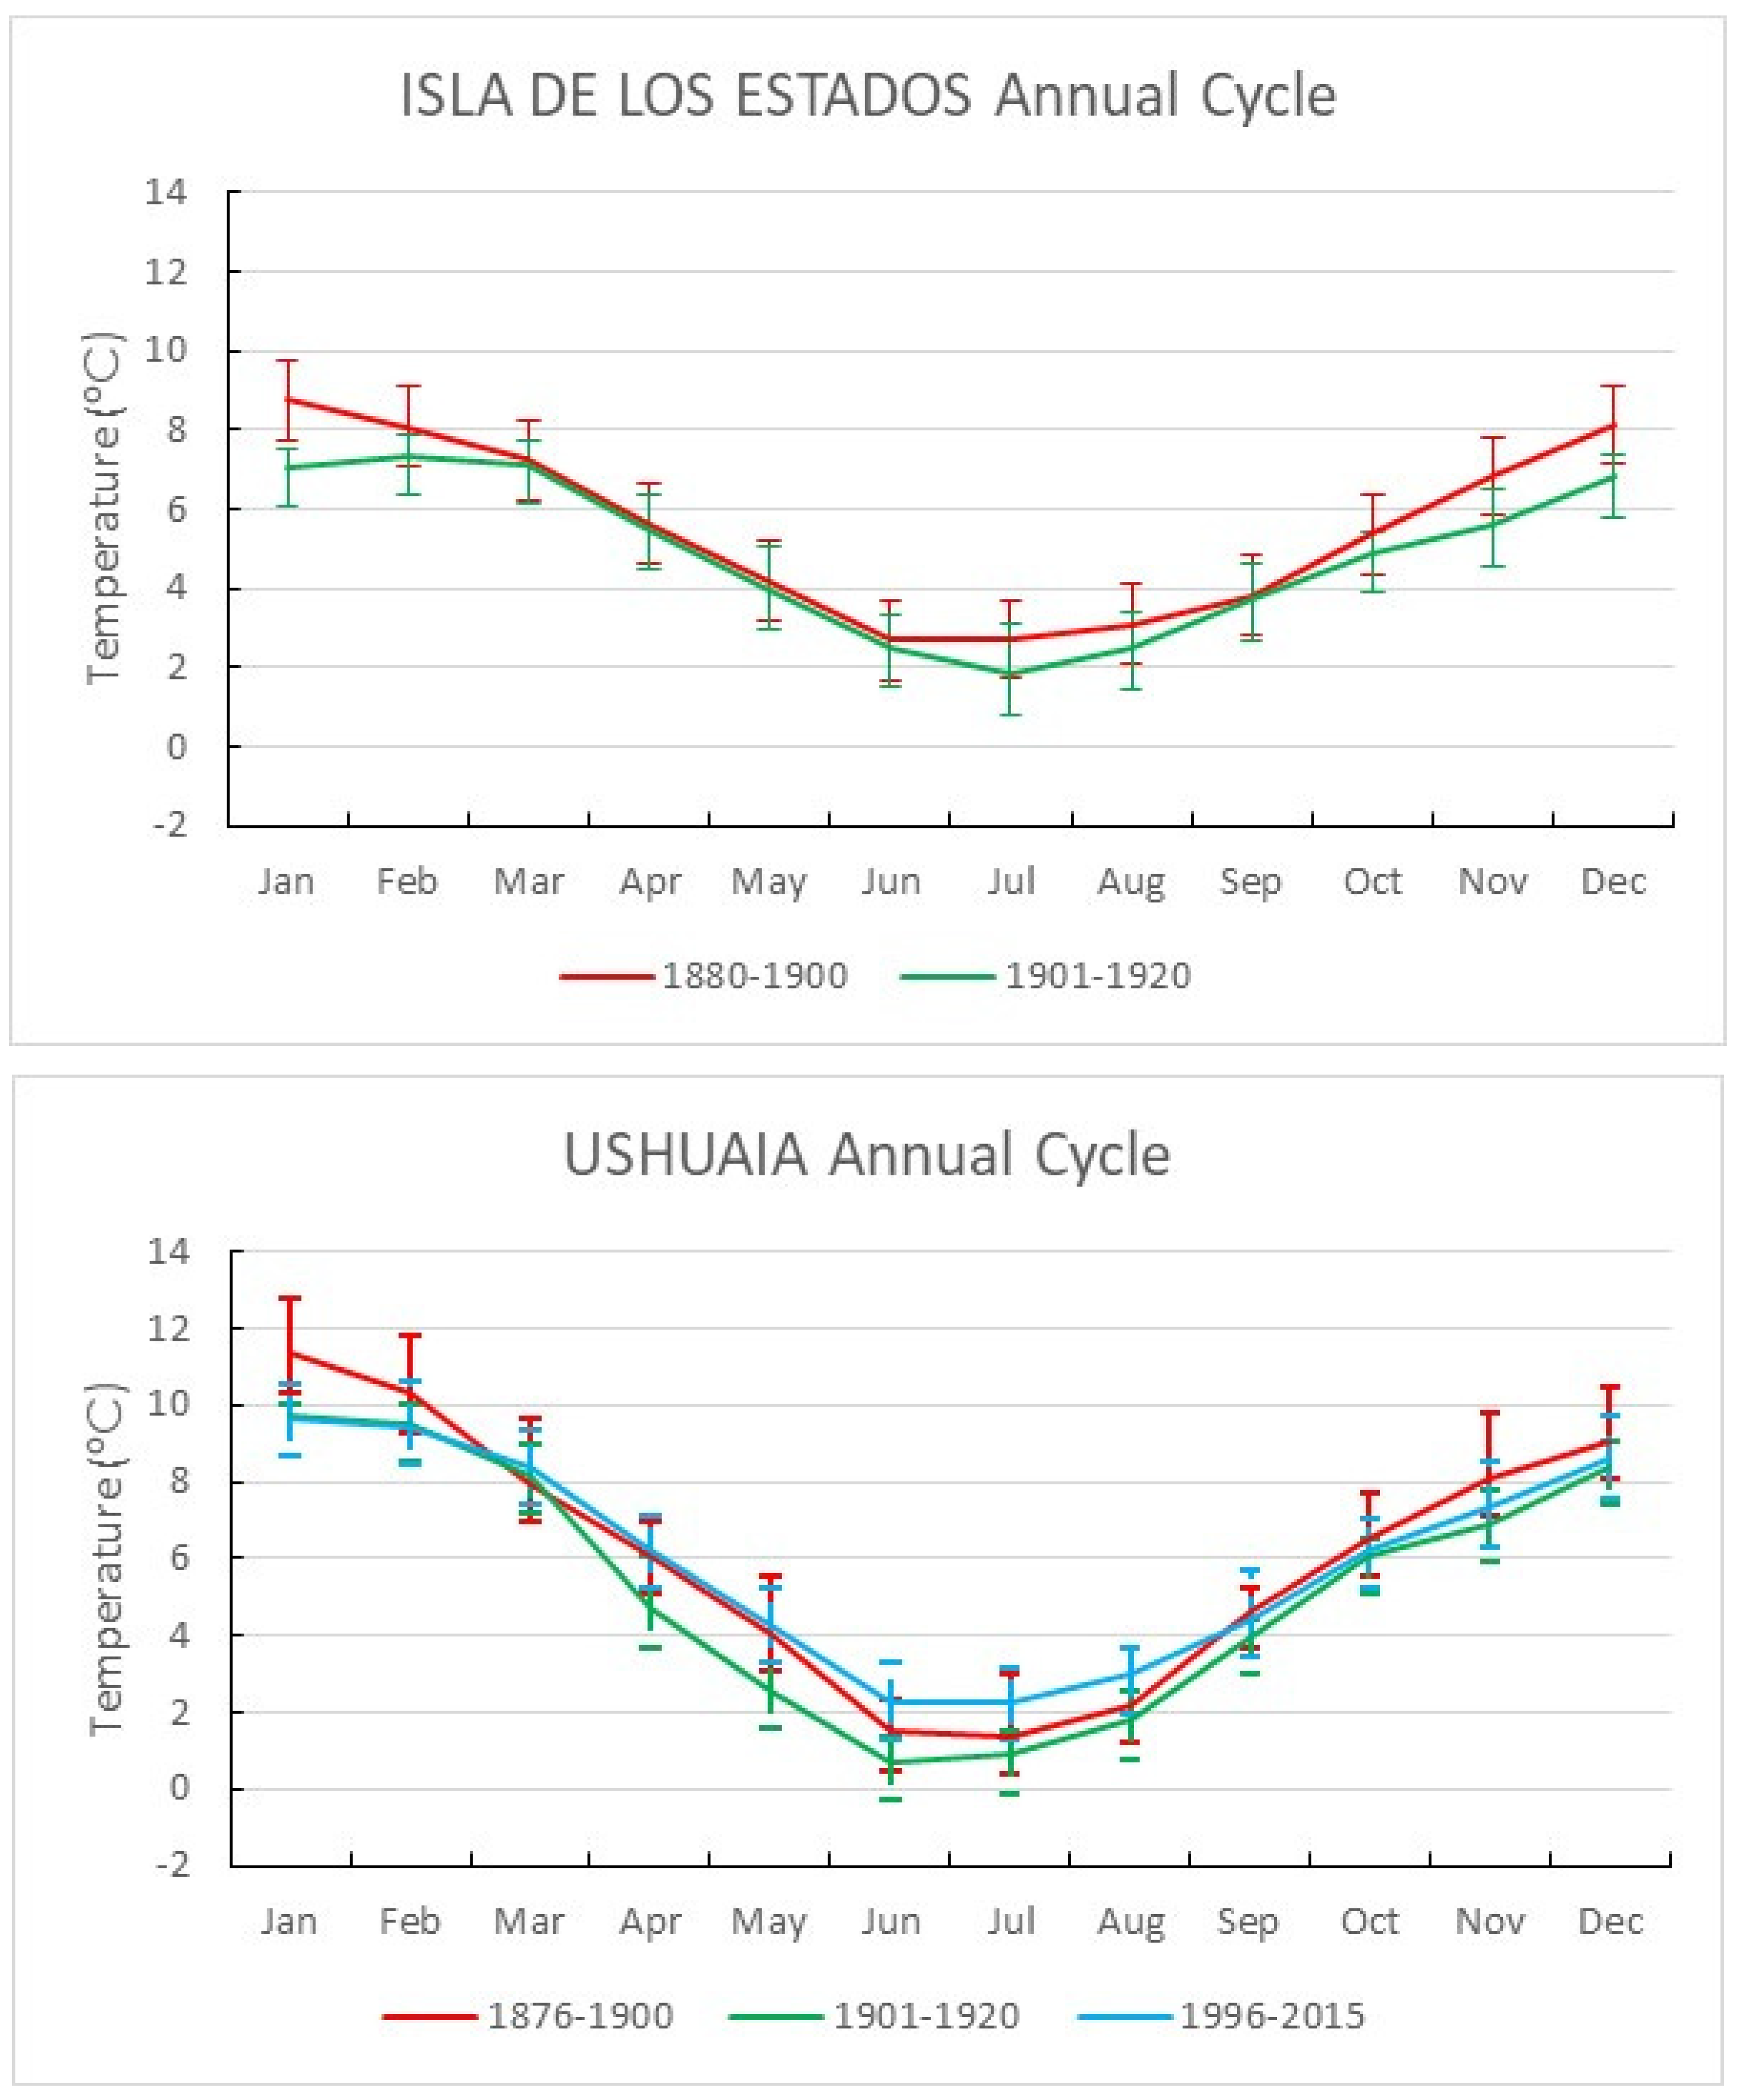
Figure 6 shows the mean annual monthly surface temperature cycles. These are shown for the periods 1880–1900, 1901–1920, and 1996–2015 when sufficient data are available. For Puerto Santa Cruz, the most recent mean annual cycle is calculated for 1973–1992 given the current data availability. The locations with records spanning all three periods are Rawson–Trelew, Punta Arenas, and Ushuaia. Because the records for Ushuaia before 1901 are scattered and, as noted above, there could be issues with the records for some of the available years in the late XIX century, the corresponding mean annual cycle should be viewed with care. Only the 1901–1920 mean annual cycle is available for Punta Dungeness. Table 3 presents the corresponding annual temperature ranges for these mean annual cycles.
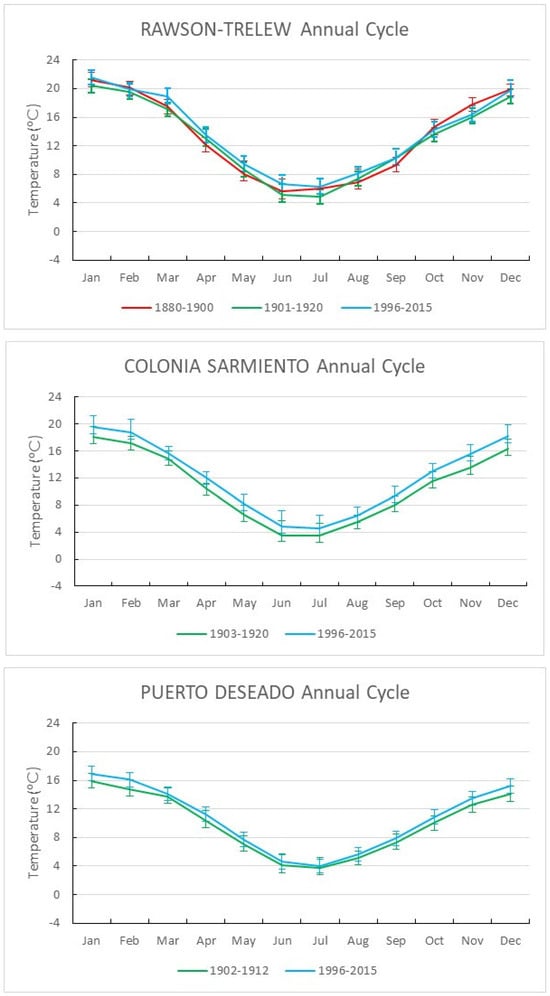
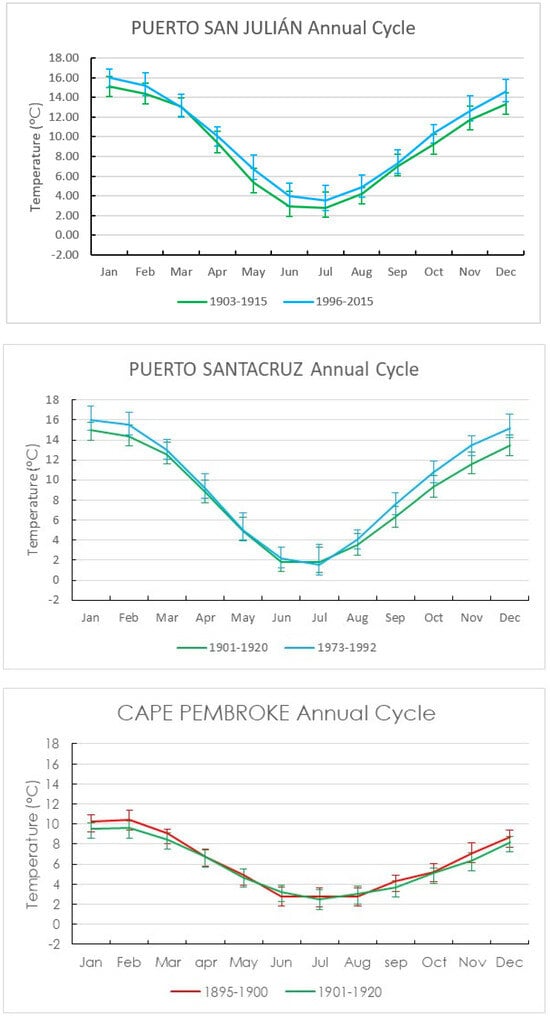
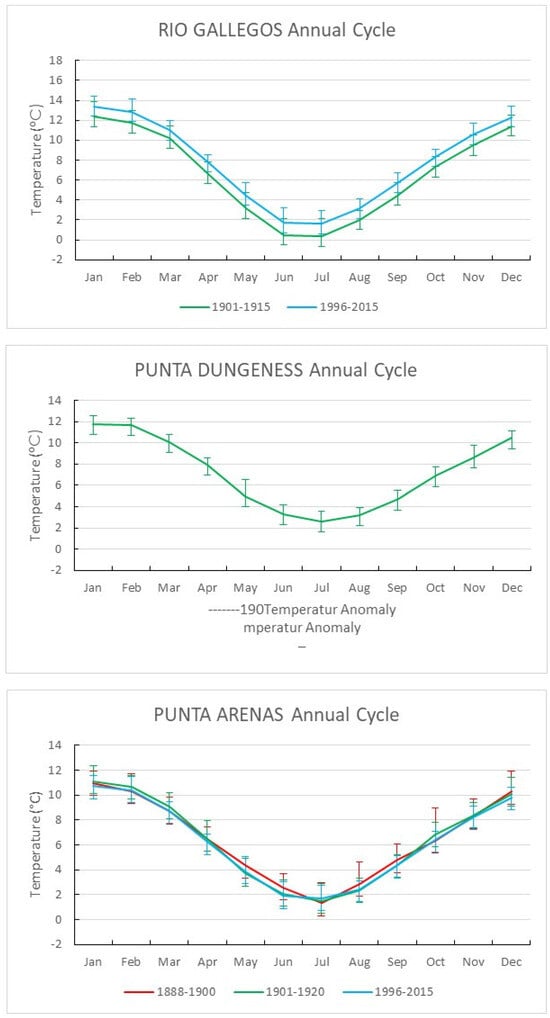
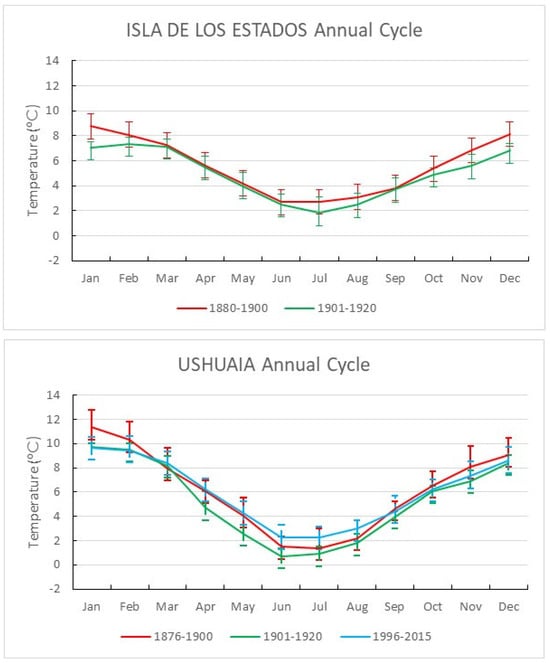
Figure 6.
Mean annual temperature cycles at all stations for the periods 1880–1900, 1901–1920, and 1996–2015. Error bars show the standard deviation of the sample monthly means. Temperature scales as in Figure 4.
Table 3.
Annual mean temperature amplitude.
The monthly standard deviations in Figure 6 demonstrate that there are mostly no statistically significant differences in monthly mean temperatures between the study periods sampled, nor with present-day observations. The only exceptions are the month of January for Is. de los Estados before and after 1900–1901 and the months of January and June for Ushuaia for the periods 1901–1920 and 1996–2015. This is most probably due to the large interannual variability observed in the region. It is nevertheless possible to note, as mentioned above, that the period 1880–1900 was, in general, warmer than the next 20 years. Figure 6 shows that the potential differences between the sampled periods vary with season and location. Thus, Colonia Sarmiento and Rio Gallegos have fairly consistent changes throughout the year. Others, like Puerto Deseado and Puerto Santa Cruz, show differences during the spring and summer months. Finally, Punta Arenas practically does not show any differences over the last 140 years. Summing up, in almost all cases, the annual cycles for the different periods, while pointing to some changes, did not have statistically significant differences.
The mean range of the annual temperature cycle over each of the periods considered is presented in Table 3. Given the standard deviations presented in Figure 6, the differences noted here are not statistically significant. Nevertheless, the table arguably points to the fact that, for stations from Rawson–Trelew to Puerto Santa Cruz, somewhat smaller annual thermal amplitudes were observed in the 1901–1920 period, while Rio Gallegos and Punta Arenas had smaller annual thermal amplitudes in recent decades. For Rawson–Trelew and other stations that also had late-XIX century observations and present-day ones, the somewhat larger annual amplitudes occurred during that XIX century period. Given that changes in temperature range can be due to different processes such as circulation changes, humidity, and cloud cover as a result of climate variability—or at some locations, urban development changes—it is not possible to provide, at this stage, conclusive reasons for such variations.
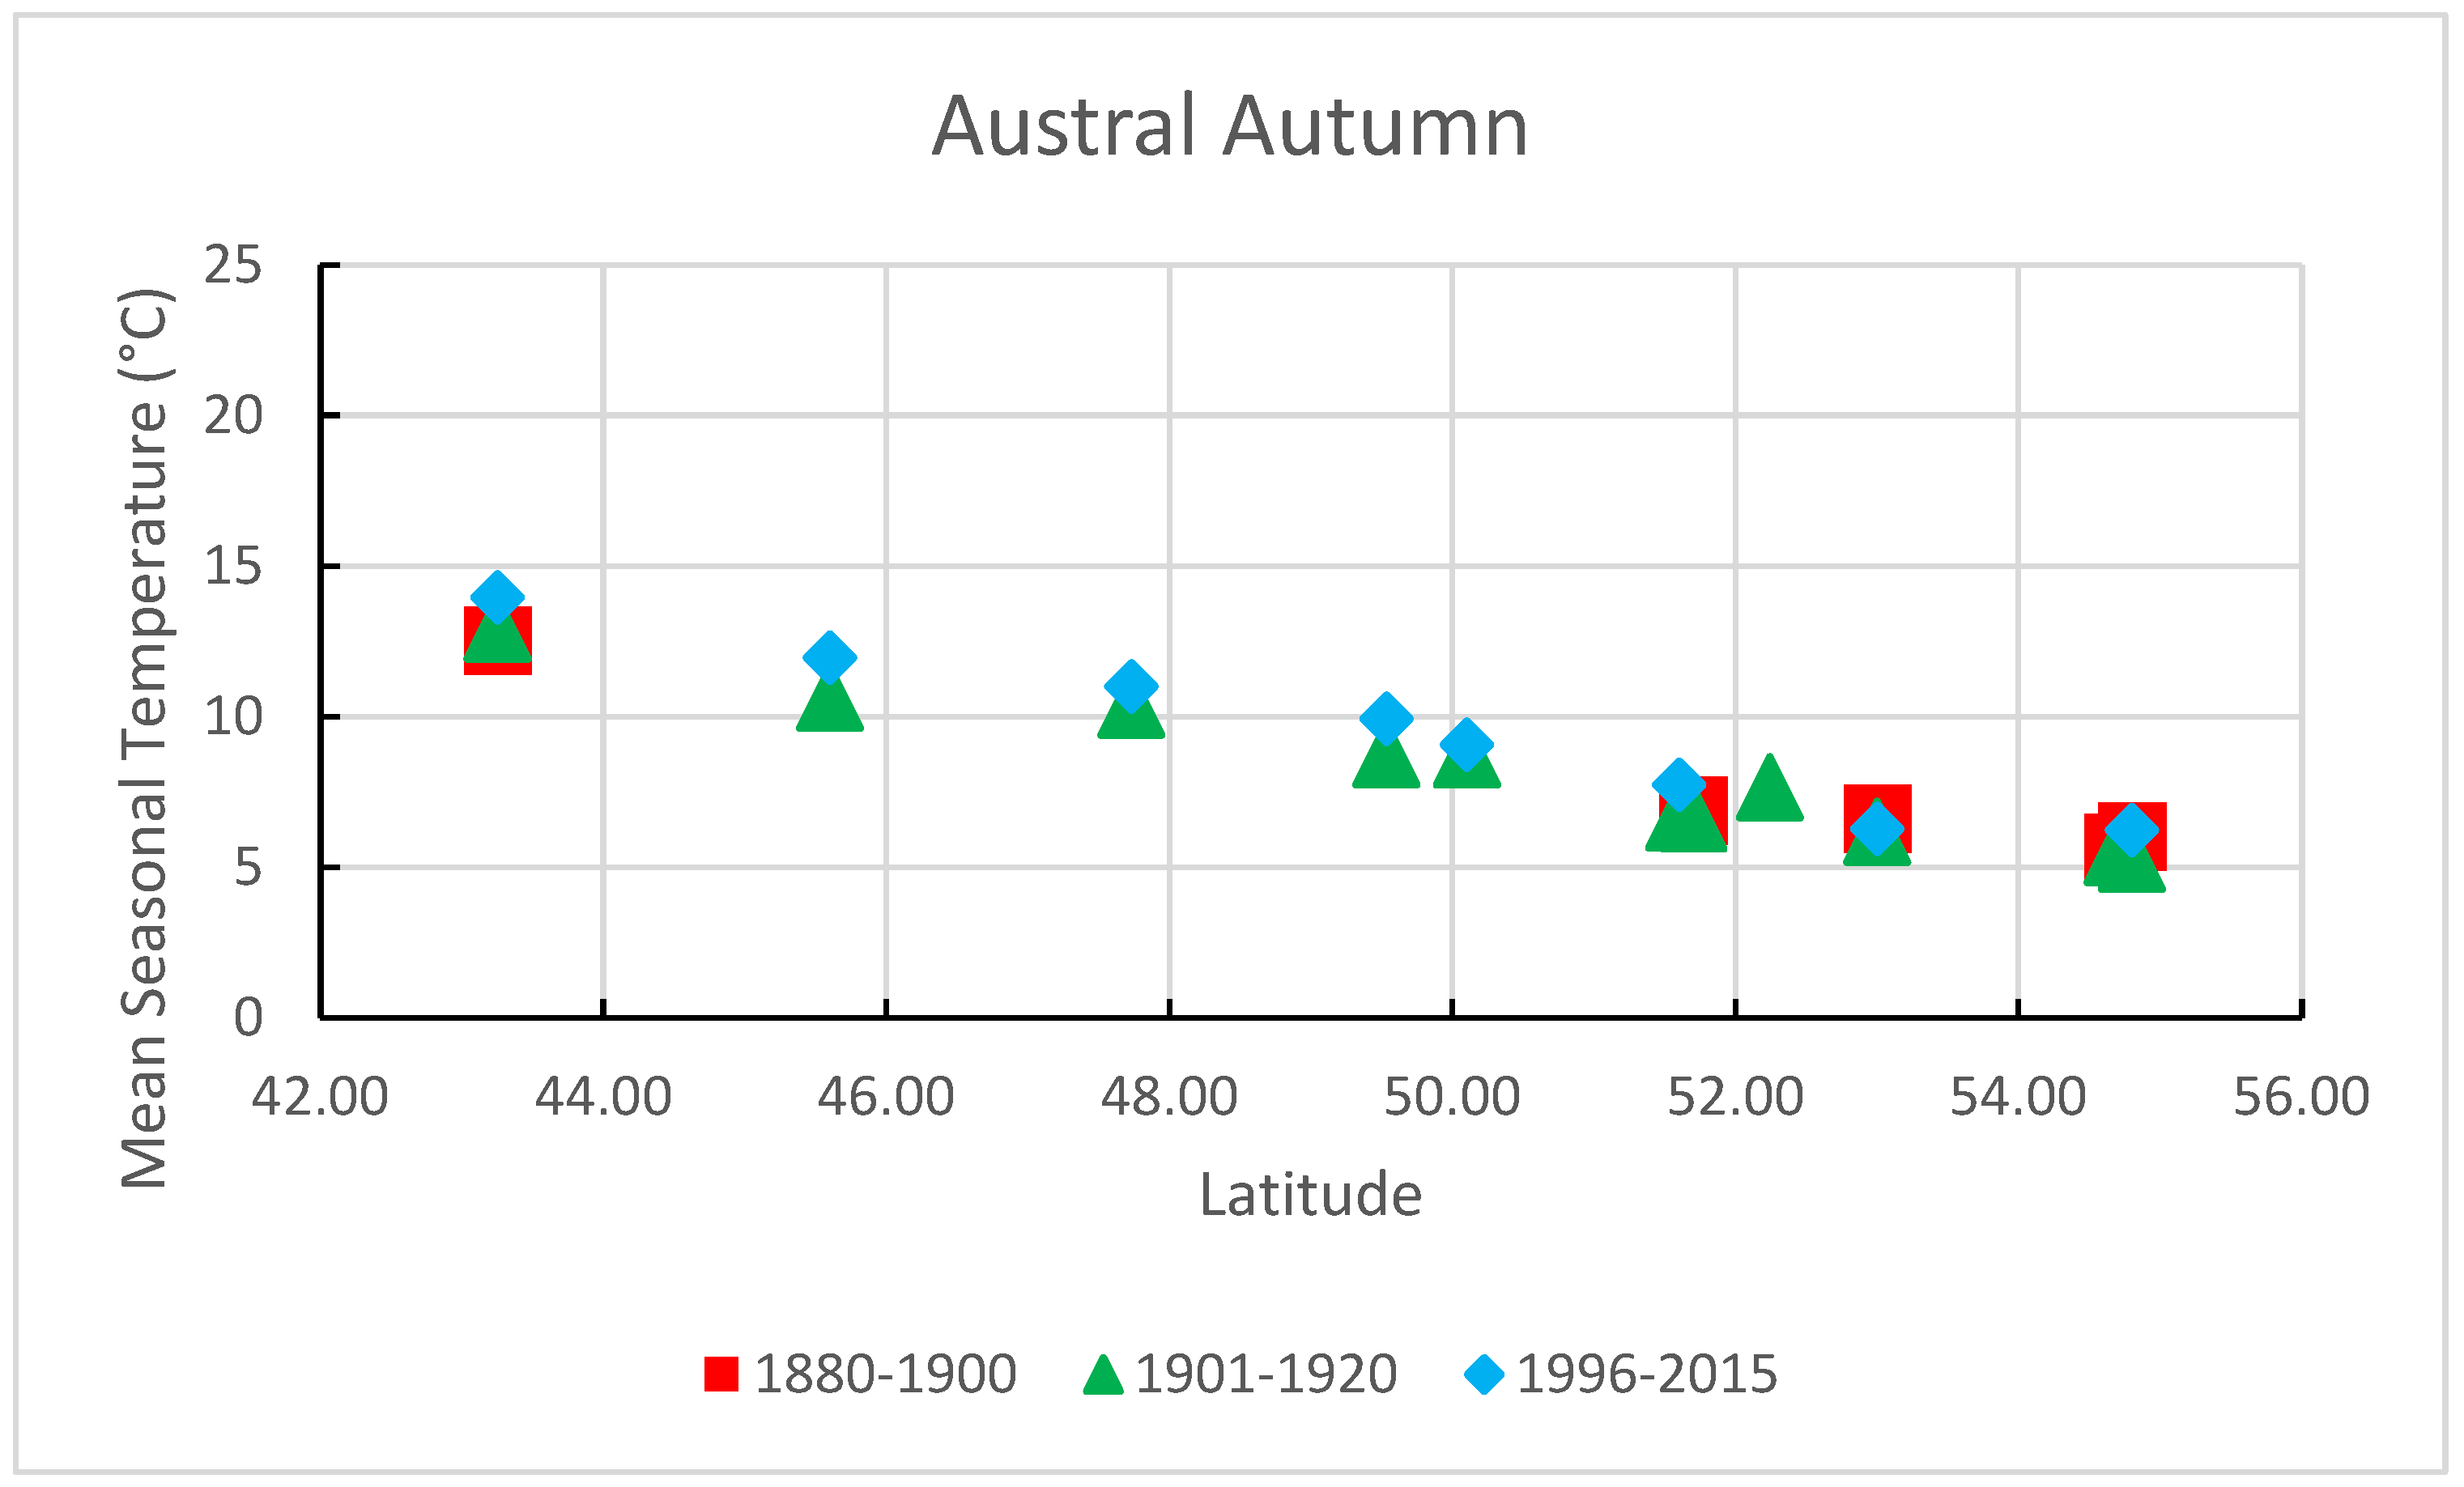
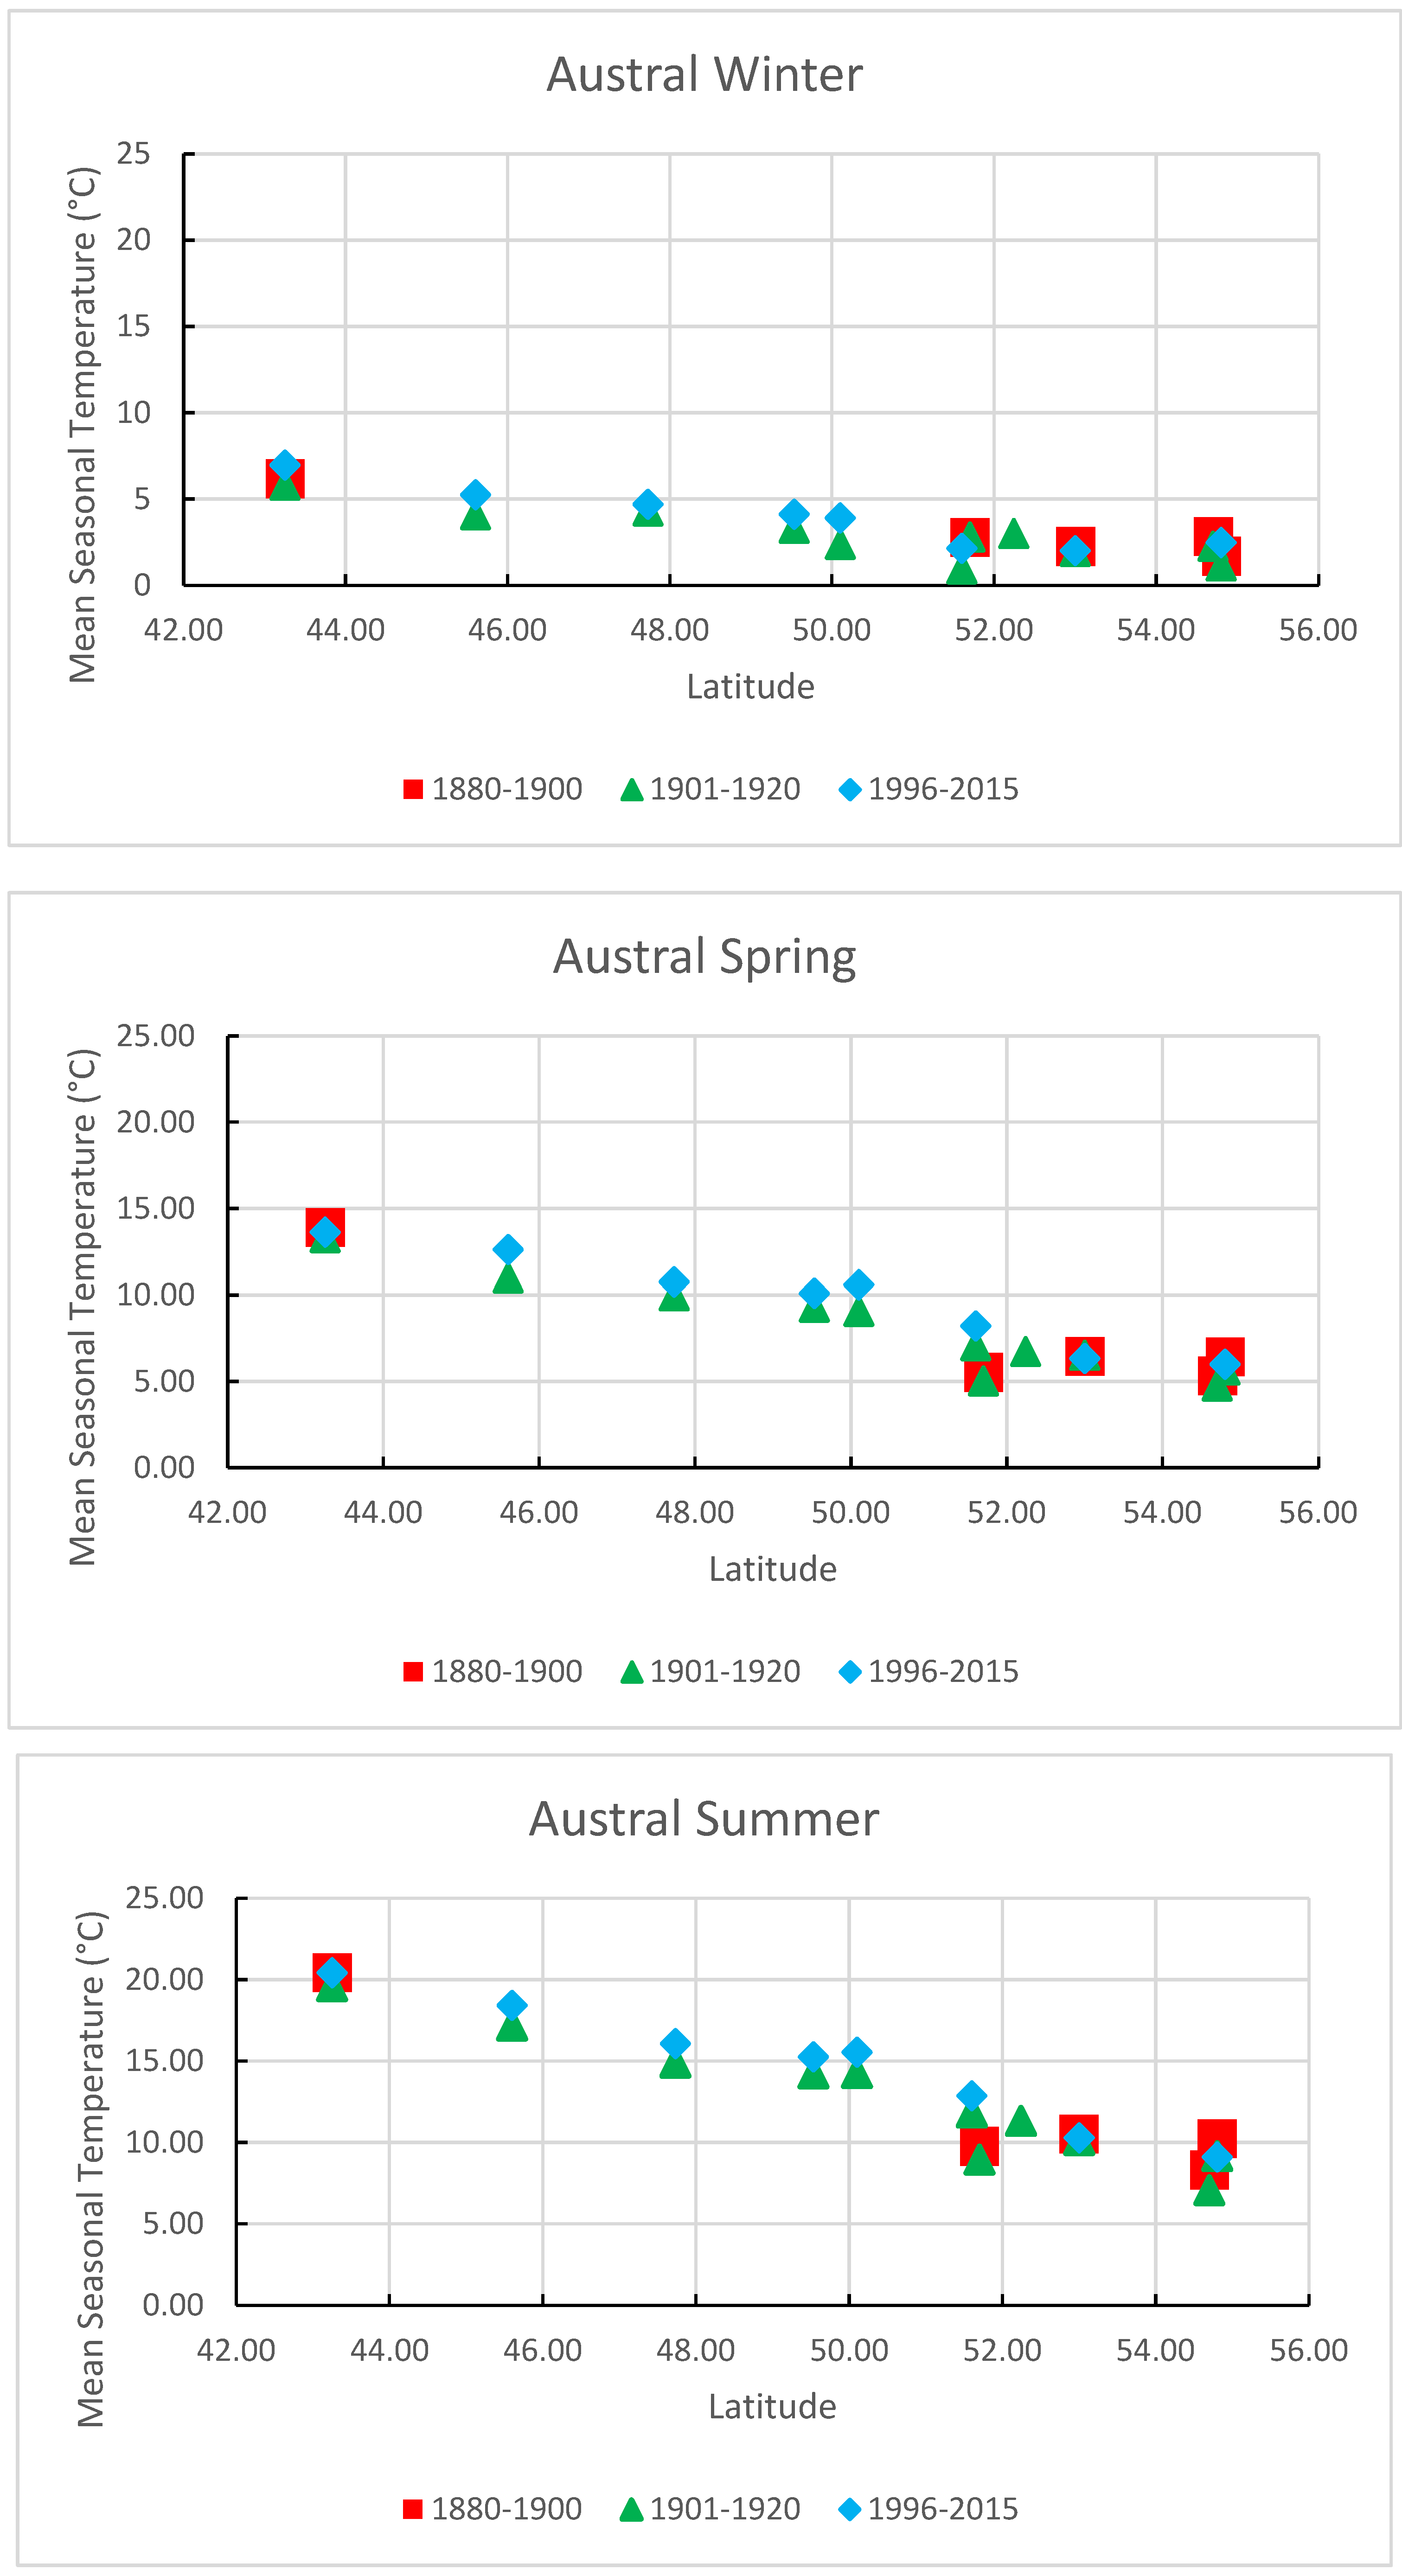
Figure 7 compares the seasonal mean temperatures as a function of latitude and the period sampled. Overall, there is a fairly linear decrease in temperature as latitude increases. Summer, autumn, and spring show the smallest scatter, particularly between stations with similar latitudes but different longitudes/geography, i.e., Rio Gallegos/Cape Pembroke/Punta Dungeness, and Ushuaia/Is. de los Estados. Spring and summer show a larger scatter at these station clusters. As was expected, maritime locations have somewhat warmer temperatures than land-based stations, even when located close to the shore.
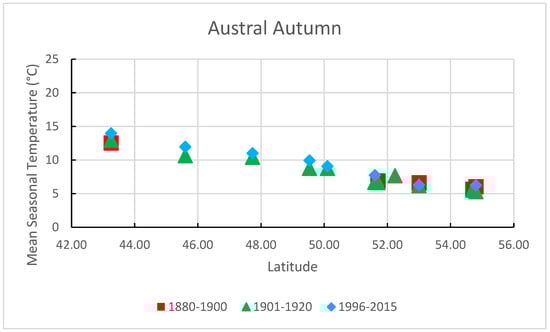
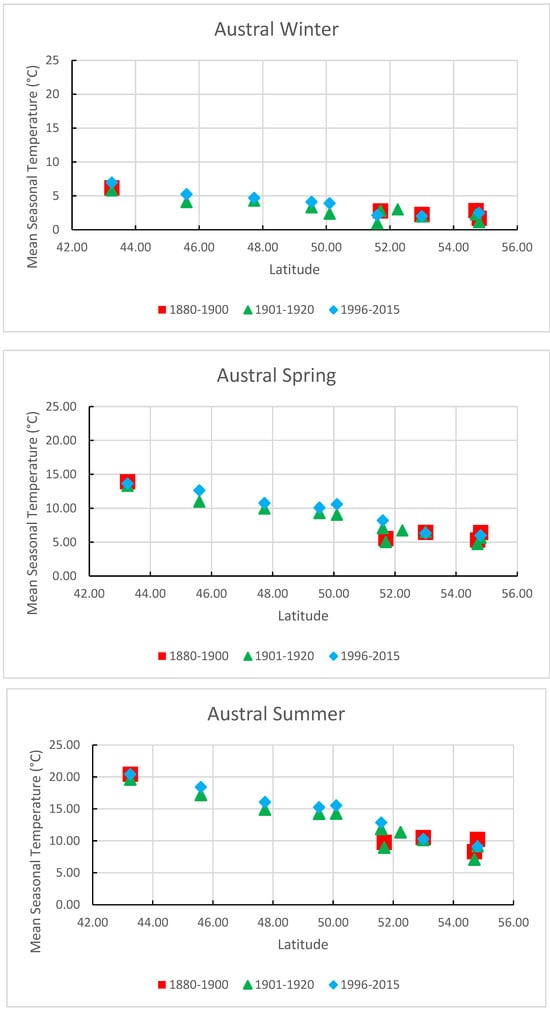
Figure 7.
Mean seasonal temperatures during the study periods as a function of latitude.
3.3. Sea Surface Temperatures during the Late-XIX and Early-XX Centuries
As previously noted, the first decades of the XXth century were cooler than the last decades of the late-XIXth century. This has been observed in both hemispheres and, in particular, at southern extratropical latitudes [18]. The following analysis considers the behavior of sea surface temperatures (SSTs) in the vicinity of Southern Patagonia.
Figure 8 presents seasonal anomaly maps as provided by HadSST database anomalies [21] in the vicinity of the South Cone for each decade between 1881 and 1920 with respect to the overall 1881–1920 seasonal SST mean. The seasonal plots, despite different decadal evolution values, highlight a decrease in SST values at the higher latitudes of the study region. Summer (DJF) SSTs are comparatively warm throughout the Mar Argentino and most of the coast of Chile in the Pacific. During the next decade (1891–1900), a significant relative cooling, by as much as 0.5 °C, can be observed in the Mar Argentino to the north of the study region and the pampas coast of Argentina and Uruguay, while the surface waters around Tierra del Fuego and the Magallanes region in Chile remain somewhat warm. During the first decade of the XXth century, the coastal areas of most of the study region were all mildly cool. By 1911–1920, the cooling moved to the Drake Strait during the summer months. Autumn (MAM) follows a somewhat similar decadal evolution with some differences in the extent and intensity of cooling/warming. Winter (JJA) begins with a comparatively warm SST (1881–1890) along the coast of Patagonia and Tierra del Fuego, both in the Atlantic and the Pacific. From 1901 to 1910, there is significant cooling along the coasts of Santa Cruz Province and Tierra del Fuego, as well as some cooling along the southern coast of Chile. By 1911–1920, only some cooling can be observed around the southern coast of Tierra del Fuego and Is. de los Estados. Spring (SON) has extensive areas of warmer SSTs all around the South Cone. SSTs remain warm around the south of Santa Cruz Province and Tierra del Fuego from 1891 to 1900. Cooling is present during the periods 1901–1910 and 1911–1920 in the southern part of the study region, particularly in Tierra del Fuego.
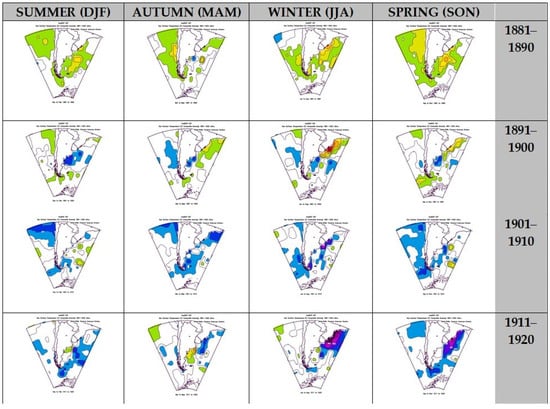
Figure 8.
Seasonal HadSST anomalies per decade with respect to the 1881–1920 HadSST seasonal means. Upper: 1881–1890; upper middle: 1891–1900; lower middle: 1901–1910; lower: 1911–1920. Contours are every 0.1 °C, green to red represent positive anomalies; sky blue to dark purple represent negative anomalies; dark red represents the warmest anomalies (0.7 °C or more); dark purple represents the coldest anomalies (−0.7 °C or less) in white temperature anomalies at ±0.1 °C. The plots were obtained using the NOAA ESRL plotting and analysis webpage.
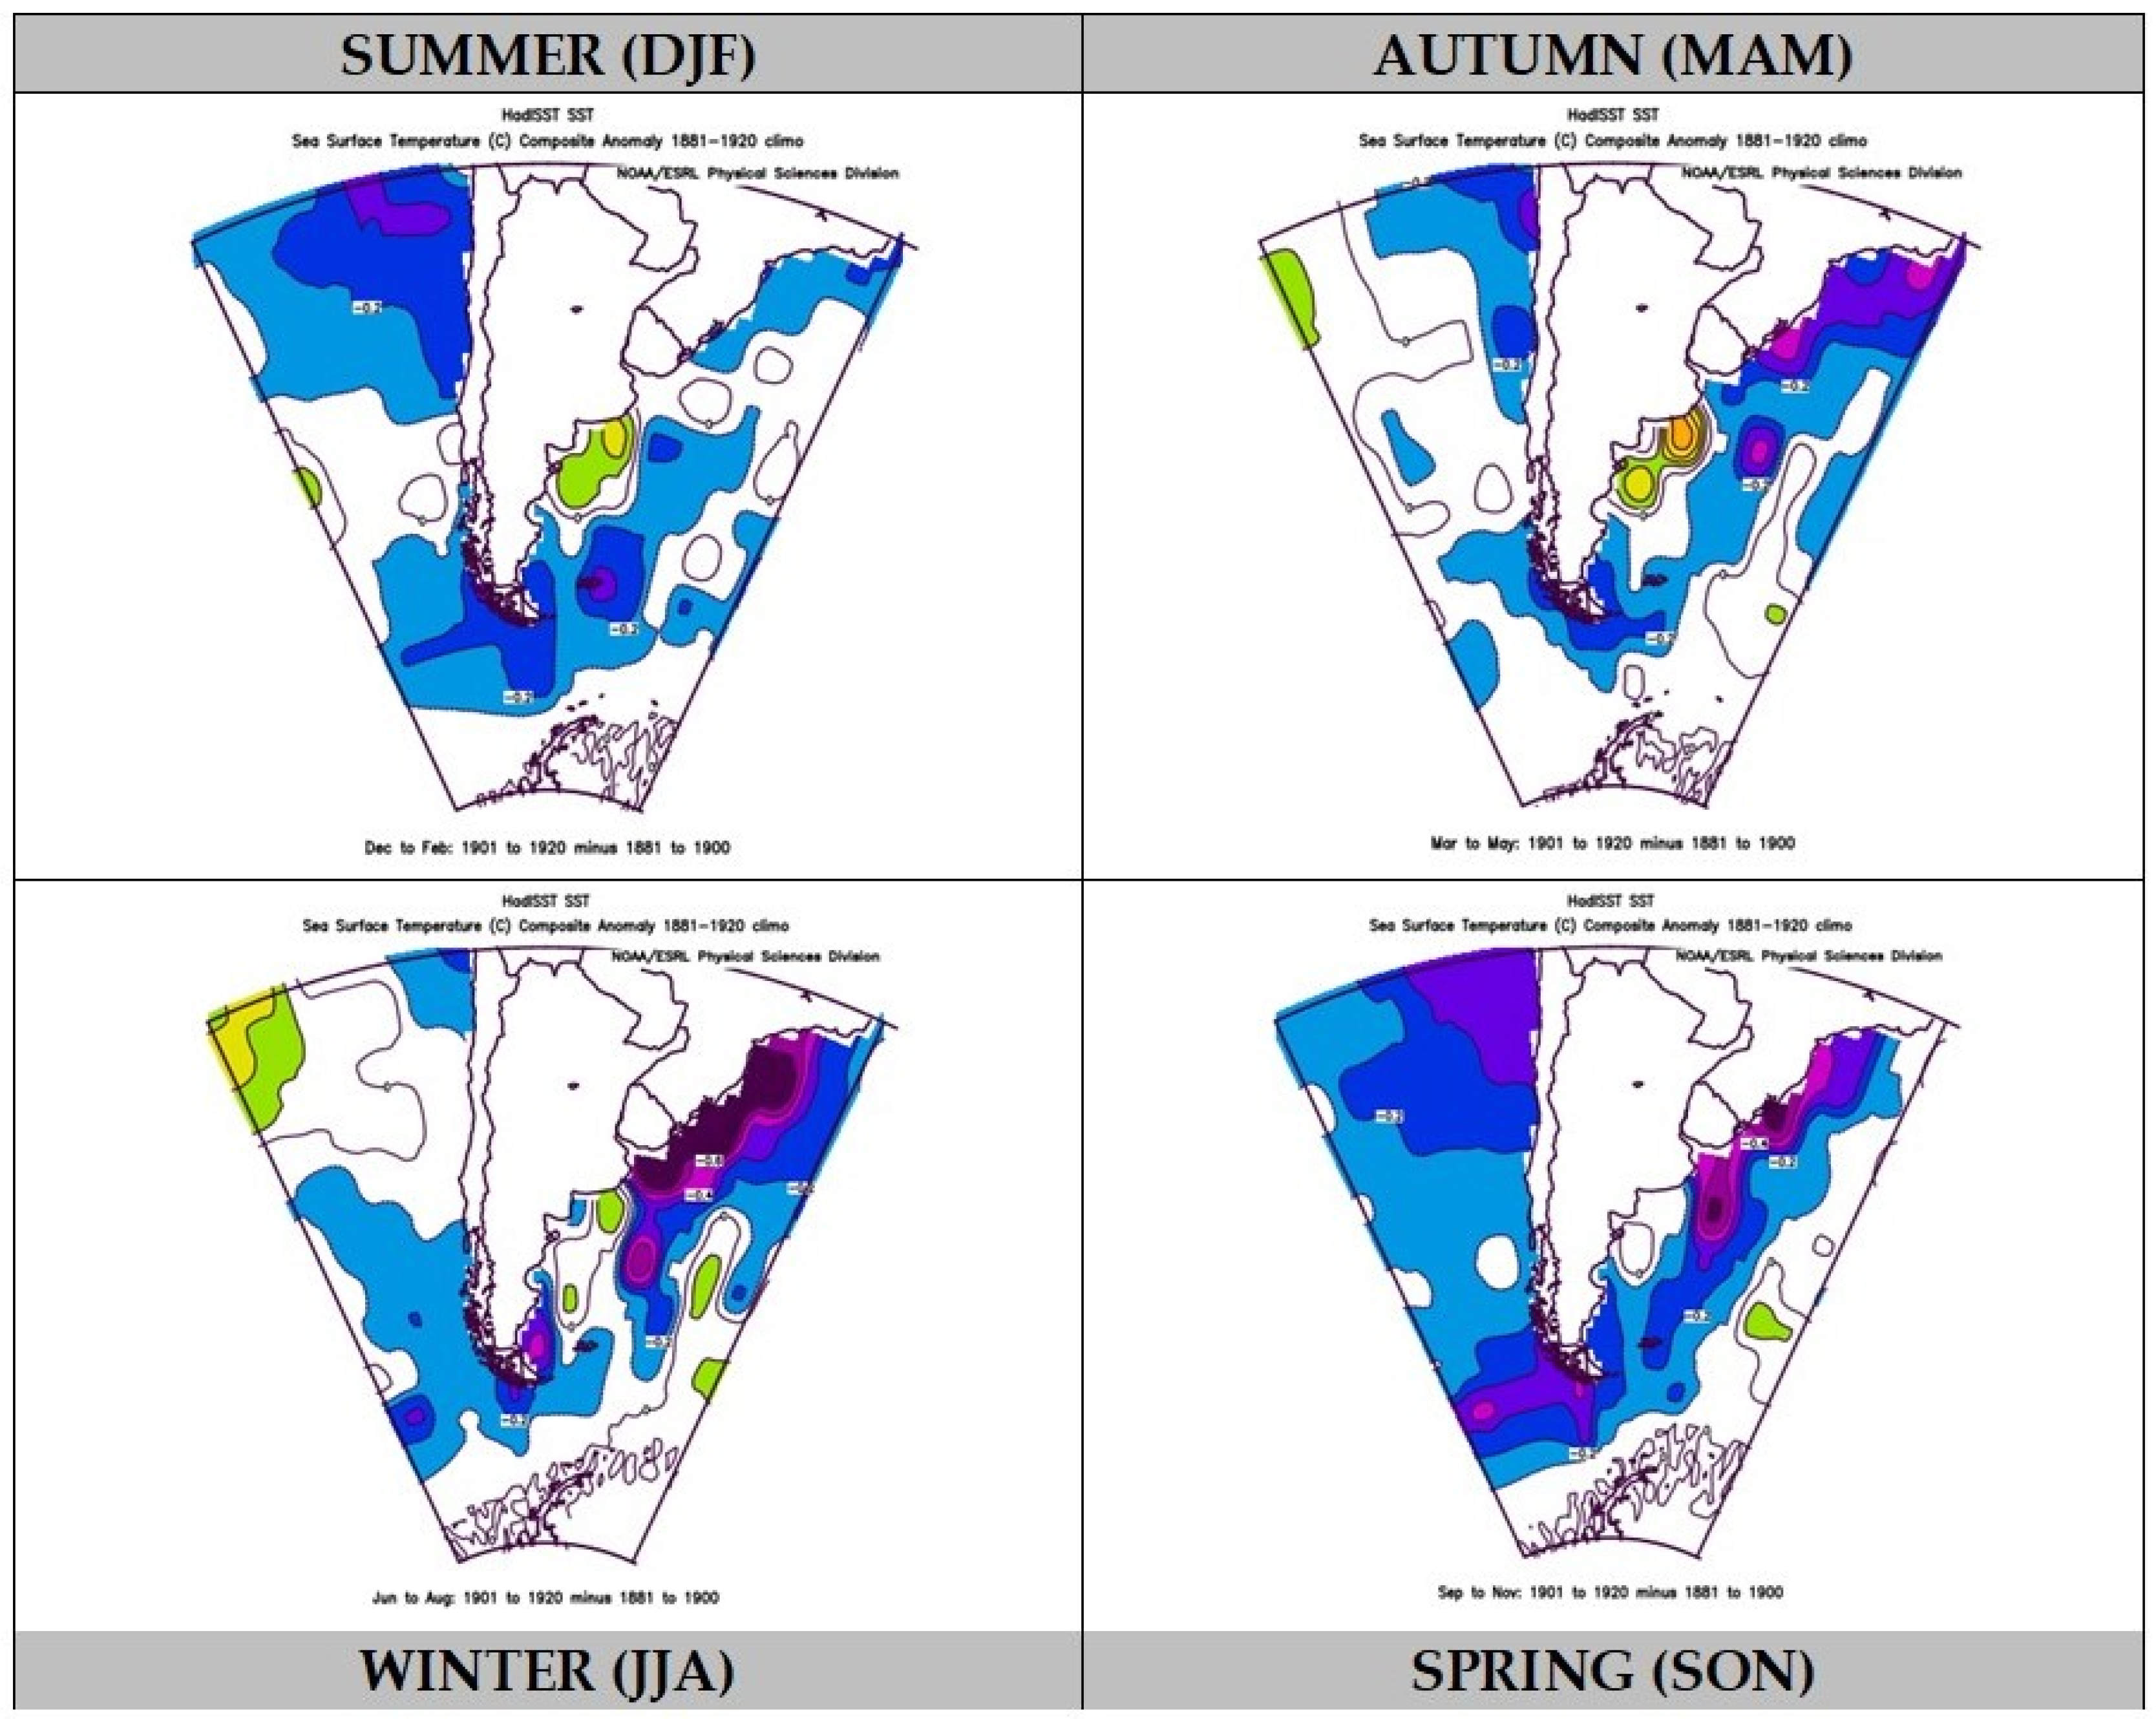
Figure 9 summarizes and highlights the seasonal SST differences before and after 1901. South of approximately 45–47° S, SSTs are between at least 0.2 °C and 0.3 °C or more, cooler during the early-XXth century than in the late-XIXth century. This is particularly so during austral winter and spring. While such changes may seem small, it is important to note that the estimated global SST trend between 1910 and 2009 is of the order of 0.0066 °C/year [22], i.e., about 0.66 °C in a hundred years. Hence, such SST changes during the analysis period need to be taken into acco-nt. It is also important to note that SST changes over the Mar Argentino/Argentine Continental Shelf (Figure 1) take place in relatively shallow waters as far south as Is. de los Estados. A modeling study [23] found that the ocean circulation over the Continental Shelf region varies significantly north and south of 40°S. Thus, in the study region, this is primarily driven by wind stress and appears to be linked to the variability of the Southern Annular Mode (SAM). Furthermore, deep circulation in the shelf break region (i.e., the transition to deep waters) could be modulated by Malvinas Current variability and Drake Passage circulation. More recently, an observation-based study [24] for the period 1982–2017 found different SST anomaly trends in the northern and southern parts of the study region. In the northern section, SST anomalies anti-correlate with zonal wind, while in the southern section, they do so with meridional wind. Temporal variability could be linked to SAM, Interdecadal Pacific Oscillation, or ENSO. In other words, a significant part of the observed SST anomaly changes noted during the study period could be attributed to atmospheric circulation variability, which may have an impact to a greater or a lesser degree, depending on the ocean circulation of the Continental Shelf. Thus, given the similarities in anomaly signs between station surface temperature and SST anomalies, it would appear that the observed cooling before and after 1900 could be due to atmospheric circulation changes. Locations such as Cape Pembroke, Is. de los Estados, and Punta Dungeness, in a mostly maritime environment, would thus have an enhanced response to such atmospheric and oceanic variability, as previously mentioned.

Figure 9.
Seasonal mean HadSST, 1901–1920, minus seasonal mean HadSST, 1881–1900. Contours defined as in Figure 8. The plots were obtained using the NOAA ESRL plotting and analysis webpage.
3.4. Surface Temperature Long-Term Variability and Trends at Selected Stations
As previously noted, an inspection of the temperature records for most of the study locations shows quasi-decadal variability between 1880 and 1920. Furthermore, the analysis shows that, for these stations, such variability appears to be synchronized throughout the study region. In order to further our understanding of such low-frequency climate variability in the study region, it is interesting to look at the variability in long temporal records. Thus, it is possible to both ascertain such long-term synchronicities and further assess the quality of the observations during the study period. Trelew and Rio Gallegos have the most complete surface temperature records for the 1901–2020 period and are at both ends of the continental part of the study region, i.e., where much of the synchronous variability can be observed between 1880 and 1920.
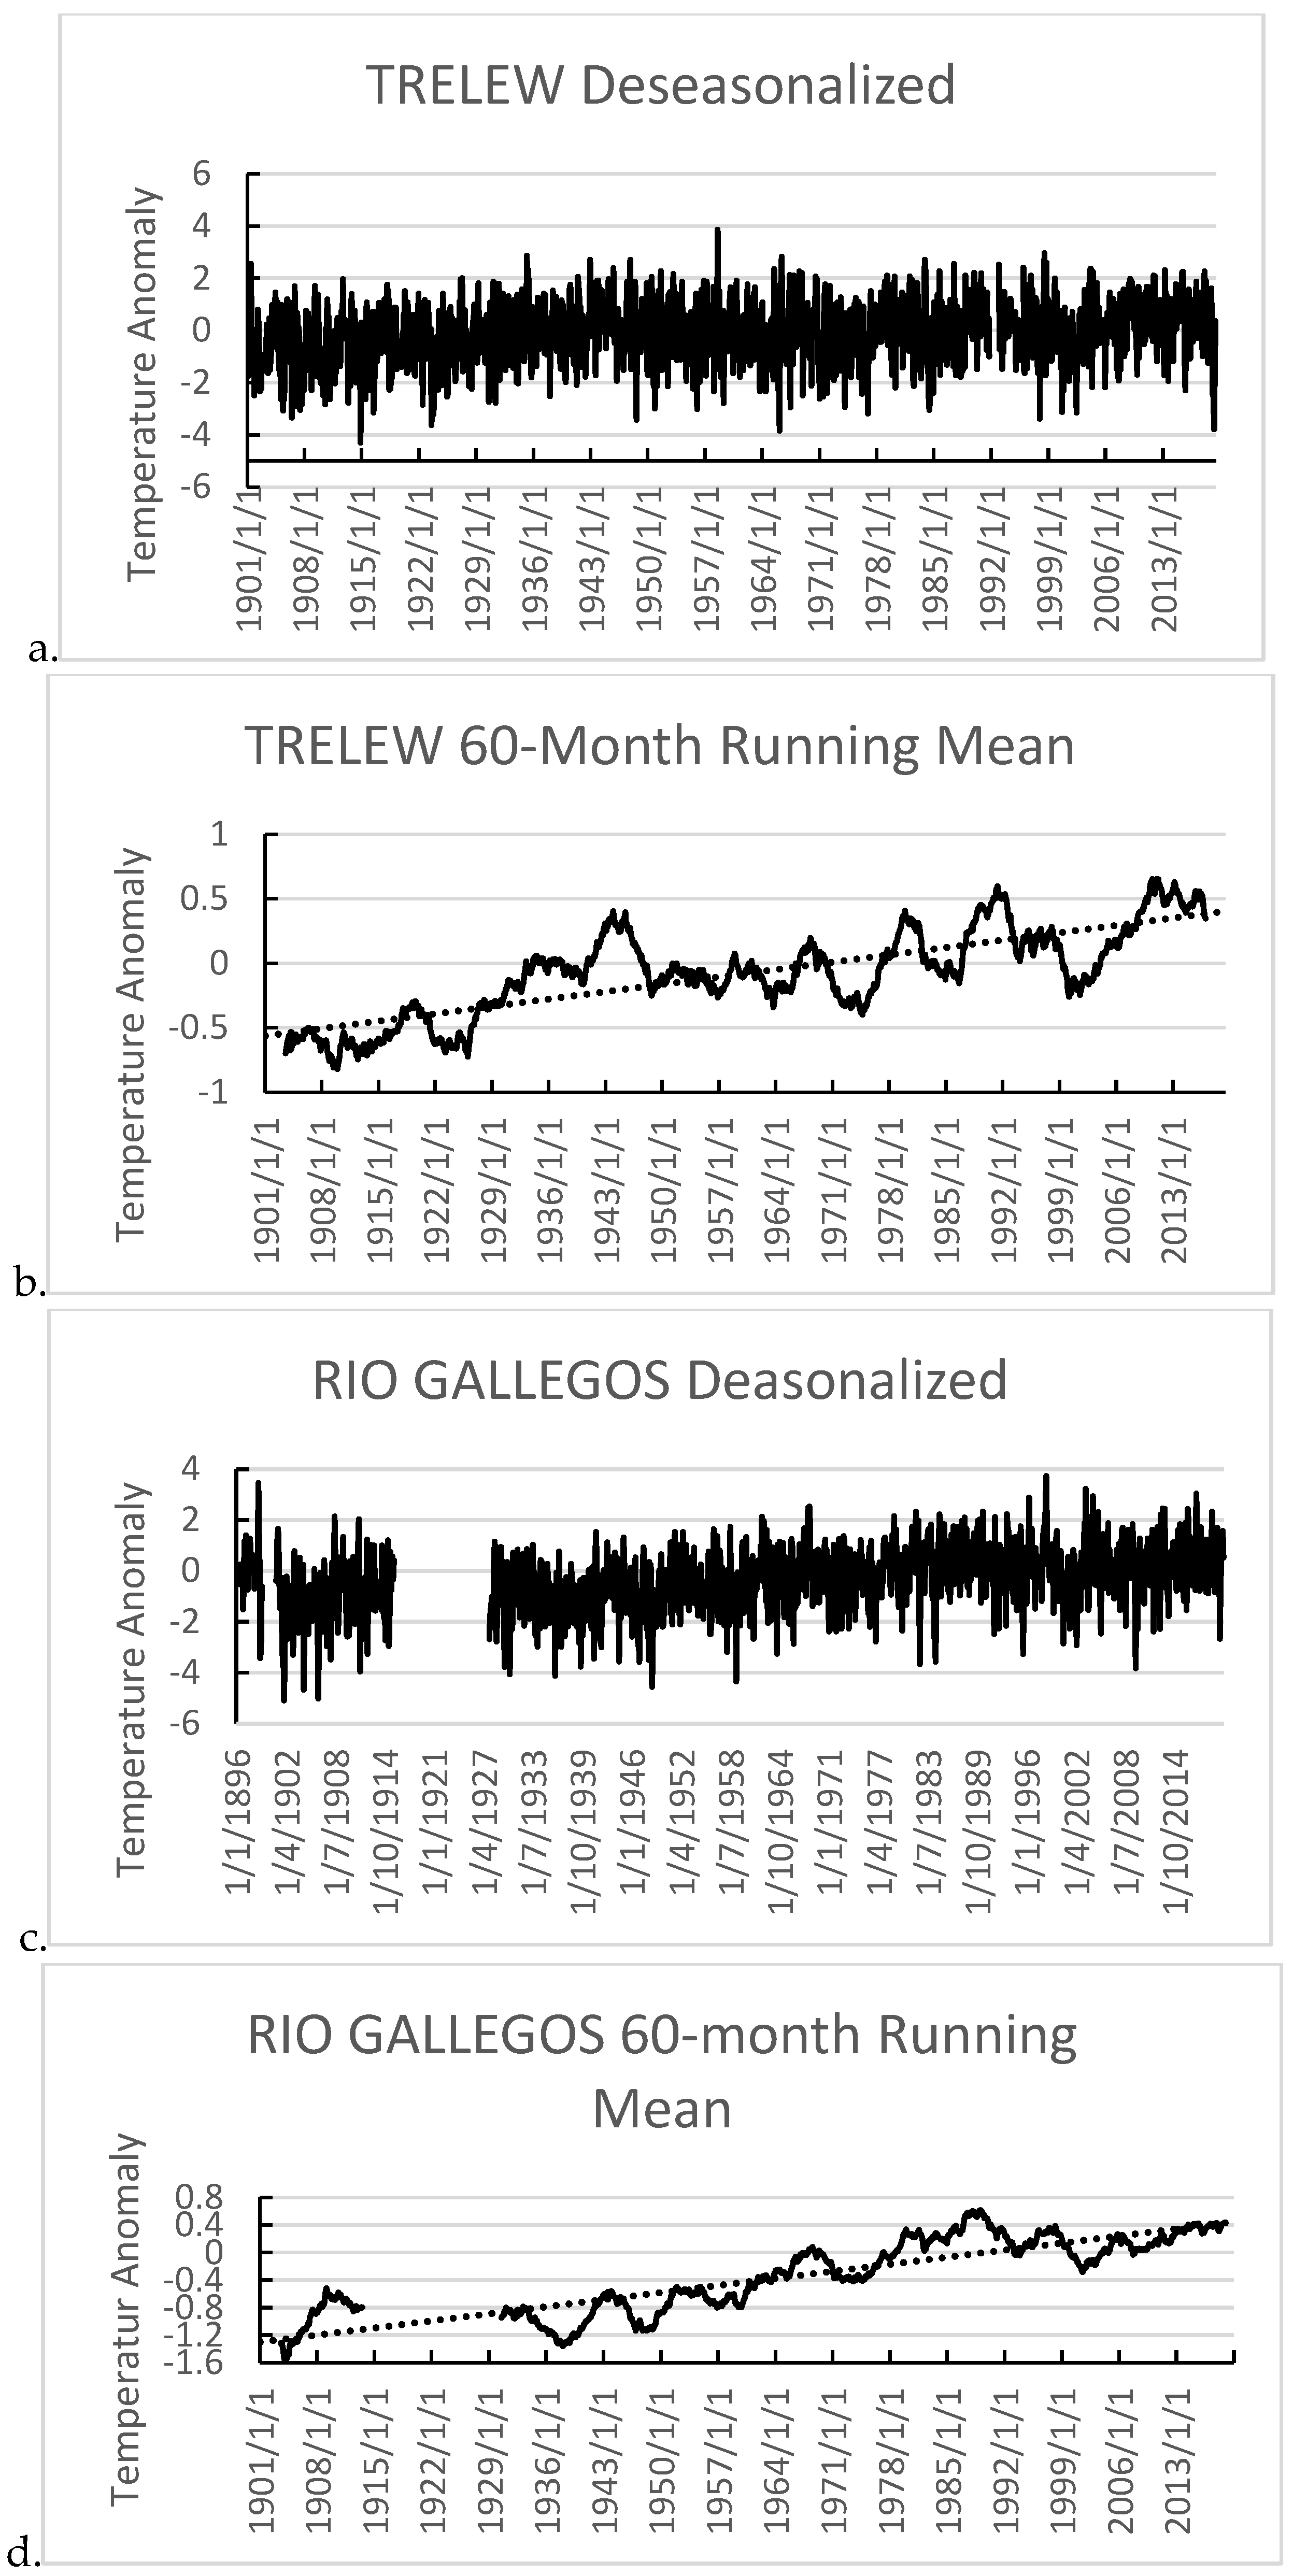
Figure 10 shows a deseasonalized monthly temperature series for Trelew and Rio Gallegos (Figure 10a,c, respectively), together with the corresponding 60-month (5-year) running mean (Figure 10b,d, respectively). While comparing both deseasonalized monthly series is difficult, it is interesting to observe that both of the 60-month smoothed time series share low-frequency variability on quasi-decadal timescales. On the other hand, it is also possible to observe that both deseasonalized timeseries show considerable variability from month to month and year to year. After filtering out the low-frequency variability by subtracting the 60-month smoothed timeseries from the deseasonalized one, the root mean squares (RMSs) of the residual timeseries are 1.143 and 1.094 for Trelew and Rio Gallegos, respectively. This difference represents the variability in intraseasonal and interannual timescales, which are of the same order at both locations, as shown by the similar RMS values.

Figure 10.
Deaseasonalized timeseries for Trelew (a) and Rio Gallegos (c). &0-month running mean timeseries for Trelew (b) and Rio Gallegos (d), overlaid with the least-square fit line.
While not always exactly in phase or of similar relative amplitude, the occurrence of low-frequency anomalies or deviations around a linear trend in both timeseries tends to be in reasonable agreement. The statistically significant Pearson correlation coefficient between these two timeseries is 0.537, significant at the 99% level. Hence, the shared variance between the smoothed timeseries is almost 30%, which is a sizeable amount. It is important to remember that these two stations are separated by almost 10° in latitude with a strong pressure gradient in between; hence, there are much stronger westerlies to the south, together with the smaller impact of the Andes barrier on flow from the Pacific over Rio Gallegos. Consequently, the temporal variabilities in quasi-decadal scales during the 1880–1920 study period are consistent with long-term behavior over southern Patagonia.
Figure 10b, d also show the trend line for the period from 1902 to 2018 for Trelew and Rio Gallegos, respectively. The existence of a linear trend in each smoothed timeseries was verified with the Mann–Kendall test. In both cases, the test shows the existence of a statistically significant linear trend. The figures include the linear trend estimate and significance calculated with least squares. The trends corresponding to Trelew and Rio Gallegos are 0.084 °C/decade (R2 = 0.618) and 0.144 °C/decade (R2 = 0.745). As was expected, the trend estimate increases with latitude and is consisted with hemispheric trend estimates. The results for Trelew are consistent with shorter, more recent timeseries [25],
4. Summary and Conclusions
The present study presents DR efforts for Patagonian observation stations in the late XIX and early XX centuries and subsequent climate analysis. This study combines monthly mean surface temperatures obtained from the Anales de la Oficina Metorológica Argentina, the KNMI Climate Explorer GHCN database operated by the KNMI, and the Bonfilli data collection for Patagonian stations in Argentina and Chile. A comparison of the periods with overlapping records from these three datasets showed outstanding agreement and consistency. The analysis of the records for stations between 43 and 55° S along the Atlantic coast of Patagonia, Tierra del Fuego e Islas del Atlántico Sur, and the Magellan Strait shows consistent climate variability for most locations between 1880 and 1920. This similar low-frequency variability, together with the other analyses and comparisons presented here, strongly points to the quality of the observations. The analysis of regional variability can be considered an additional tool when determining data quality in areas that are known to undergo similar variability processes. The fact that Ushuaia does not reproduce such variability, even after taking into account the caveats registered in the Anales OMA during the early part of the sample, highlights the practical use of such intercomparisons and points to the need for a closer inspection of this particular station´s records.
A warm late-XIX century compared with the early-XX century was observed at these Patagonian locations, in agreement with global dataset outputs for Southern Hemisphere extratropics, i.e., from the NASA GISS website and HadCRUT5 [18]. Furthermore, warmer SSTs along the coast of Patagonia and Tierra del Fuego occurred, according to the HadSST database, during the late XIX century. Finally, an inspection of almost 120 years of monthly mean observations at Trelew and Rio Gallegos shows sustained low-frequency quasi-decadal variability consistent with the variability observed between 1880 and 1920, as well as decadal temperature trends consistent with extratropical SH trends. Thus, the records compiled here for the period 1880–1920 over a rather extended geographical area are consistent with each other, within the limits of varying latitude and environment (coastal or insular). Furthermore, the present trend estimates for the period 1902 to 2020 extend back in time to previous analyses over shorter, more recent periods [25]. Ushuaia records appear to have some problems, as specifically detailed in the corresponding Anales de la Oficina Meteorológica Argentina Volumes 3, subsequent OMA publications, and as observed in the present study for subsequent years.
Author Contributions
Conceptualization, P.O.C. and S.G.L.; methodology, P.O.C. and S.G.L.; validation, P.O.C., S.G.L., A.E.Y. and O.B.; formal analysis, P.O.C. and S.G.L.; investigation, P.O.C.; resources, P.O.C. and S.G.L.; data curation, P.O.C.; writing—original draft preparation, P.O.C.; writing—review and editing, P.O.C., S.G.L. and A.E.Y.; visualization, P.O.C., S.G.L. and A.E.Y.; supervision, P.O.C. and S.G.L.; project administration, P.O.C. and. S.G.L.; funding acquisition, S.G.L., P.O.C. and A.E.Y. All authors have read and agreed to the published version of the manuscript.
Funding
This research was funded by the Universidad Tecnológica Nacional, Facultad Regional Buenos Aires, Argentina, grant numbers MSTCBA0008661 and MSTCBA0008639.
Data Availability Statement
The data presented in this study are openly available at zenodo.org: DOI https://doi.org/10.5281/zenodo.10019664, accessed on 18 October 2023.
Acknowledgments
The authors would like to thank CONICET, the Universidad Tecnológica Nacional, Facultad Regional Buenos Aires, and Pontificia Universidad Católica Argentina. The authors wish to acknowledge and thank the service provided by the Plotting and Analysis page available at psl.noaa.gov. The HadSST anomaly plots were obtained using it.
Conflicts of Interest
The authors declare no conflicts of interest. The funders had no role in the design of the study; in the collection, analyses, or interpretation of the data; in the writing of the manuscript; or in the decision to publish the results.
References
- IPCC. Climate Change 2021: The Physical Science Basis. Contribution of Working Group I to the Sixth Assessment Report of the Intergovernmental Panel on Climate Change; Masson-Delmotte, V.P., Zhai, A., Pirani, S.L., Connors, C., Péan, S., Berger, N., Caud, Y., Chen, L., Goldfarb, M.I., Gomis, M., et al., Eds.; Cambridge University Press: Cambridge, UK; New York, NY, USA, 2021; 2391p. [Google Scholar] [CrossRef]
- Thorne, P.W.; Allan, R.J.; Ashcroft, L.; Brohan, P.; Dunn, R.H.; Menne, M.J.; Pearce, P.R.; Picas, J.; Willett, K.M.; Benoy, M.; et al. Towards an integrated set of surface meteorological observations for climate science and applications. Bull. Am. Meteorol. Soc. 2017, 98, 2689–2702. [Google Scholar] [CrossRef]
- Brönnimann, S.; Allan, R.; Ashcroft, L.; Baer, S.; Barriendos, M.; Brázdil, R.; Brugnara, Y.; Brunet, M.; Brunetti, M.; Chimani, B.; et al. Unlocking pre-1850 instrumentalmeterorological records. A Global Inventory. Bull. Am. Meteorol. Soc. 2019, 100, ES389–ES413. [Google Scholar] [CrossRef]
- Brönnimann, S.; Brugnara, Y.; Allan, R.J.; Brunet, M.; Compo, G.P.; Crouthamel, R.I.; Jones, P.D.; Jourdain, S.; Luterbacher, J.; Siegmund, P.; et al. A roadmap to climate data rescue services. Geosci. Data J. 2018, 5, 28–39. [Google Scholar] [CrossRef]
- Brunet, M.; Jones, P. Data rescue initiatives: Bringing historical climate data into the 21st century. Clim. Res. 2011, 47, 29–40. [Google Scholar] [CrossRef]
- Wilkinson, C.; Woodruff, S.D.; Brohan, P.; Claesson, S.; Freeman, E.; Koek, F.; Lubker, S.J.; Marzinh, C.; Wheeler, D. Recovery of logbooks and international marine data: The RECLAIM project. Int. J. Climatol. 2011, 31, 968–979. [Google Scholar] [CrossRef]
- Wunsch, C. The Past and Future Ocean Circulation From a Contemporary Perspective. In Ocean Circulation: Mechanisms and Impacts Geophysical Monograph Series 173; American Geophysical Union: Washington, DC, USA, 2007. [Google Scholar] [CrossRef]
- Ndebele, N.E.; Grab, S.; Turasie, A. Characterizing rainfall in the south-western Cape, South Africa: 1841–2016. Int. J. Climatol. 2019, 40, 1992–2014. [Google Scholar] [CrossRef]
- Brugnara, Y.; Brönnimann, S.; Grab, S.; Steinkopf, J.; Burgdorf, A.-M.; Wilkinson CAllan, R. South African extreme weather during the 1877–1878 El Niño. Weather 2023, 78, 286–293. [Google Scholar] [CrossRef]
- Lorrey, A.M.; Chapell, P.R. The “dirty weather” diaries of Reverend Richard Davis: Insights about early colonial-era meteorology and climate variability for northern New Zealand, 1839–1851. Clim. Past 2016, 12, 553–573. [Google Scholar] [CrossRef]
- Gergis, J.; Baillie, Z.; Ingallina, S.; Ashcroft, L.; Ellwood, T. A historical climate dataset for southwestern Australia, 1830–1875. Int. J. Climatol. 2021, 41, 4898–4919. [Google Scholar] [CrossRef]
- Lakkis, S.G.; Canziani, P.O.; Rodriquez, J.O.; Yuchechen, A.E. Early meteorological records from Corrientes and Bahía Blanca, Argentina: Initial ACRE-Argentina data rescue and related activities. Geosci. Data J. 2023, 10, 328–346. [Google Scholar] [CrossRef]
- Zitto, M.E.; Barrucand, M.; Piotrkowski, R.; Canziani, P.O. 110 years of temperature observations at Orcadas Antarctic Station: Multidecadal Variability. Int. J. Climatol. 2015, 36, 809–823. [Google Scholar] [CrossRef]
- La Abeja Argentina. Revista Cultural, Política y Científica; Tomo 1; Juan Julián Agüero: Buenos Aires, Argentina, 1822. [Google Scholar]
- Gould, B. (Ed.) Anales de la Oficina Meteorológica Argentina, Vol. 3; Imprenta de Pablo E. Coni: Buenos Aires, Argentina, 1882; 537p. [Google Scholar]
- Lakkis, S.G.; Canziani, P.O.; Yuchechen, A.E. Unlocking Weather Observations at Puerto Madryn-Patagonia, Argentina, 1902–1915. Climate, 2023; in press. [Google Scholar]
- Peterson, T.C.; Vose, R.; Schmoyer, R.; Razuvaev, V. Global Historical Climatology Network (GHCN) Quality Control of Monthly Temperature Data. Int. J. Climatol. 1998, 18, 1169–1179. [Google Scholar] [CrossRef]
- Morice, C.P.; Kennedy, J.J.; Rayner, N.A.; Winn, J.P.; Hogan, E.; Killick, R.E.; Dunn, R.J.H.; Osborn, T.J.; Jones, P.D.; Simpson, I.R. An updated assessment of near-surface temperature change from 1850: The HadCRUT5 data set. J. Geophys. Res. Atmos. 2021, 126, e2019JD032361. [Google Scholar] [CrossRef]
- Mo, K.; Paegle, J.N. The Pacific–South American modes and their downstream effects. Int. J. Climatol. 2001, 21, 1211–1229. [Google Scholar] [CrossRef]
- Canziani, P.O. On tidal variability and the existence of planetary wave-like oscillations in the upper thermosphere—II. Non-linear interactions and global scale oscillations. J. Atmos. Terr. Phys. 1994, 56, 913–930. [Google Scholar] [CrossRef]
- Kennedy, J.J.; Rayner, N.A.; Atkinson, C.P.; Killick, R.E. An ensemble data set of sea-surface temperature change from 1850: The Met Office Hadley Centre HadSST.4.0.0.0 data set. J. Geophys. Res. Atmos. 2019, 124, 7719–7763. [Google Scholar] [CrossRef]
- Messié, M.; Chavez, F. Global Modes of Sea Surface Temperature Variability in Relation to Regional Climate Indices. J. Clim. 2011, 24, 4314–4331. [Google Scholar] [CrossRef]
- Combes, V.; Matano, R.P. The Patagonian shelf circulation: Drivers and variability. Prog. Oceanogr. 2018, 167, 24–43. [Google Scholar] [CrossRef]
- Risaro, D.B.; Chidichimo, M.P.; Piola, A.R. Interannual Variability and Trends of Sea Surface Temperature Around Southern South America. Front. Mar. Sci. 2022, 9, 829144. [Google Scholar] [CrossRef]
- Coronato, F.; Pessacg, N.; Alvarez, M.D.P. The Climate of Península Valdés Within a Regional Frame. In Late Cenozoic of Península Valdés, Patagonia, Argentina; Bouza, P., Bilmes, A., Eds.; Springer Earth System Sciences: Berlin/Heidelberg, Germany, 2017. [Google Scholar] [CrossRef]


Disclaimer/Publisher’s Note: The statements, opinions and data contained in all publications are solely those of the individual author(s) and contributor(s) and not of MDPI and/or the editor(s). MDPI and/or the editor(s) disclaim responsibility for any injury to people or property resulting from any ideas, methods, instructions or products referred to in the content. |
© 2024 by the authors. Licensee MDPI, Basel, Switzerland. This article is an open access article distributed under the terms and conditions of the Creative Commons Attribution (CC BY) license (https://creativecommons.org/licenses/by/4.0/).