

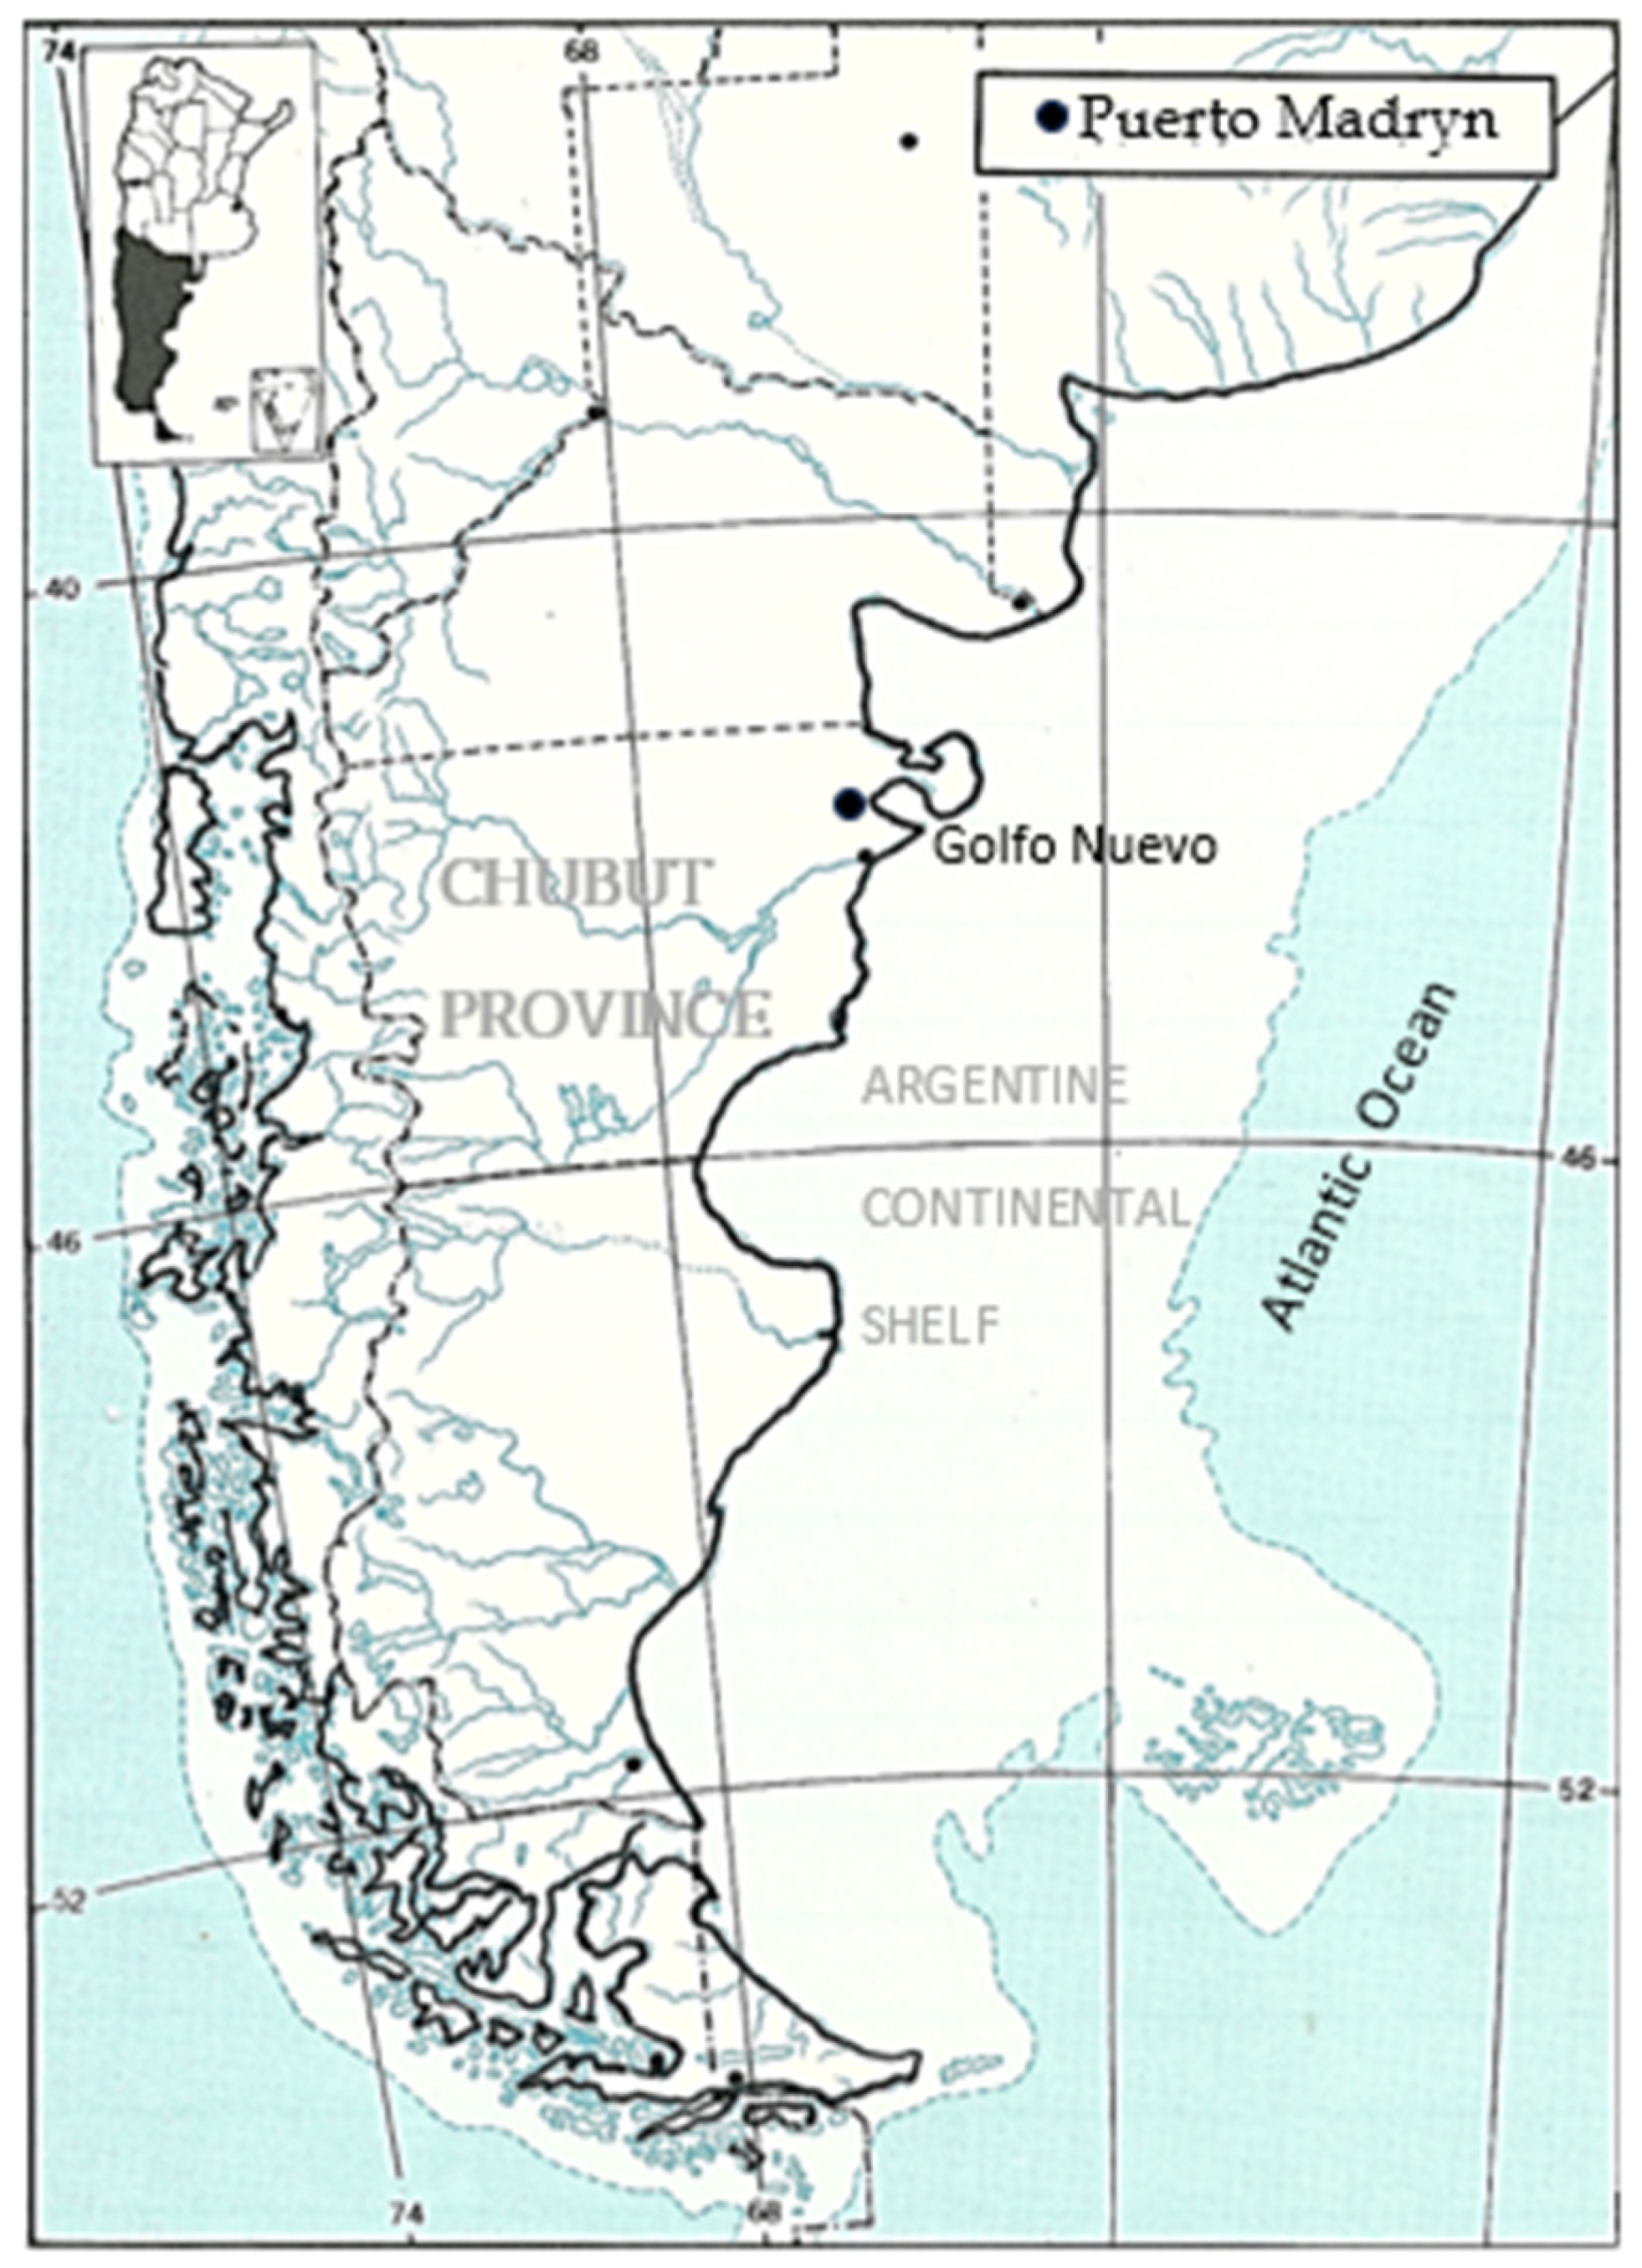
Unlocking Weather Observations at Puerto Madryn-Patagonia, Argentina, 1902–1915


Abstract
:1. Introduction
2. Materials and Methods
2.1. Materials
2.2. Methodology
3. Results
4. Summary and Conclusions
Author Contributions
Funding
Data Availability Statement
Acknowledgments
Conflicts of Interest
References
- IPCC. Climate Change 2021: The Physical Science Basis. Contribution of Working Group I to the Sixth Assessment Report of the Intergovernmental Panel on Climate Change; Cambridge University Press: Cambridge, UK, 2021. [Google Scholar]
- Brönnimann, S.; Brugnara, Y.; Allan, R.J.; Brunet, M.; Compo, G.P.; Crouthamel, R.I.; Jones, P.D.; Jourdain, S.; Luterbacher, J.; Siegmund, P.; et al. A roadmap to climate data rescue services. Geosci. Data J. 2018, 5, 28–39. [Google Scholar] [CrossRef]
- Brunet, M.; Jones, P. Data rescue initiatives: Bringing historical climate data into the 21st century. Clim. Res. 2011, 47, 29–40. [Google Scholar] [CrossRef]
- World Meteorological Organization. Guidelines on Best Practices for Climate Data Rescue; WMO-No. 1182; World Meteorological Organization: Geneva, Switzerland, 2016. [Google Scholar]
- Mateus, C.; Potito, A.; Curley, M. Reconstruction of a long-term historical daily maximum and minimum air temperature network dataset for Ireland (1831–1968). Geosci. Data J. 2020, 7, 102–115. [Google Scholar] [CrossRef]
- Domínguez-Castro, F.; Vaquero, J.M.; Gallego, M.C.; Farrona, A.M.M.; Antuña-Marrero, J.C.; Cevallos, E.E.; Herrera, R.G.; de la Guía, C.; Mejía, R.D.; Naranjo, J.M.; et al. Early meteorological records from Latin-America and the Caribbean during the 18th and 19th centuries. Sci. Data 2017, 4, 170169. [Google Scholar] [CrossRef] [PubMed]
- Di Pasquale, M. Prensa, Política y Medicina en Buenos Aires: Un Estudio de La Abeja Argentina, 1822–1823; Facultad de Humanidades, Estudios de Teoría Literaria, Universidad Nacional de Mar del Plata: Mar del Plata, Argentina, 2016; pp. 119–136. [Google Scholar]
- Di Pasquale, M. La Abeja Argentina La Abeja Argentina. (1822–1823). 15 nros. In Biblioteca de Mayo, Colección de Obras y Documentos para la Historia Argentina; Literatura; Senado de la Nación: Buenos Aires, Argentina, 1960; Volume 6, pp. 5245–5700. [Google Scholar]
- Slonosky, V.; Sieber, R. Building a Traceable and Sustainable Historical Climate Database: Interdisciplinarity and DRAW. Patterns 2020, 1, 100012. [Google Scholar] [CrossRef] [PubMed]
- Canziani Pablo, O.; Lakkis, S.G.; Yuchechen Adrián, E.; Bonfili, O. Unlocking weather observations at the End of the World: Late XIXth and early XXth century monthly mean temperatures climatological study for Southern Patagonia. Climate, 2023; in press. [Google Scholar]
- Zhu, J.; Lücke, A.; Wissel, H.; Mayr, C.; Enters, D.; Ja Kim, K.; Ohlendorf, C.; Schäbitz, F.; Zolitschka, B. Climate history of the Southern Hemisphere Westerlies belt during the last glacial–interglacial transition revealed from lake water oxygen isotope reconstruction of Laguna Potrok Aike (52° S, Argentina). Clim. Past. 2014, 10, 2153–2169. [Google Scholar] [CrossRef]
- Capozzi, V.; Cotroneo, Y.; Castagno, P.; De Vivo, C.; Budillon, G. Rescue and quality control of sub-daily meteorological data collected at Montevergine Observatory (Southern Apennines), 1884–1963. Earth Syst. Sci. Data Discuss. 2020, 12, 1467–1487. [Google Scholar] [CrossRef]
- Estévez, J.; Gavilán, P.; Giráldez, J.V. Guidelines on validation procedures for meteorological data from automatic weather stations. J. Hydrol. 2011, 402, 144–154. [Google Scholar] [CrossRef]
- González-Rouco, J.F.; Heyen, H.; Zorita, E.; Valero, F. Agreement between observed rainfall trends and climate change simulations in the southwest of Europe. J. Clim. 2000, 13, 3057–3065. [Google Scholar] [CrossRef]
- Mahmood, R.; Jia, S. Quality control and homogenization of daily meteorological data in the trans-boundary region of the Jhelum River basin. J. Geogr. Sci. 2016, 26, 1661–1674. [Google Scholar] [CrossRef]
- Brázdil, R.; Bělínová, M.; Dobrovolný, P.; Mikšovský, J.; Pišoft, P.; Řeznícková, L.; Štěpánek, P.; Valášek, H.; Zahradnícek, P. History of Weather and Climate in the Czech Lands, Vol. IX. In Temperature and Precipitation Fluctuations in the Czech Lands during the Instrumental Period; Masarykova Univerzita: Brno, Czech Republic, 2012; p. 236. [Google Scholar]
- Wang, X.L.; Wen, Q.H.; Wu, Y. Penalized Maximal t Test for Detecting Undocumented Mean Change in Climate Data Series. J. Appl. Meteorol. Clim. 2007, 46, 916–931. [Google Scholar] [CrossRef]
- Yimer, S.M.; Kumar, N.; Bouanani, A.; Tischbein, B.; Borgemeister, C. Homogenization of daily time series climatological data in the Eastern Nile basin, Ethiopia. Theor. Appl. Climatol. 2021, 143, 737–760. [Google Scholar] [CrossRef]
- Chang, C.K.; Ghani, A.; Puay, H.T.; Othman, M.A. Homogeneity testing and trends analysis in long term rainfall data for Sungai Pahang River basin over 40 years records. In Proceedings of the 37th IAHR World Congress, Kuala Lumpur, Malaysia, 13–18 August 2017. [Google Scholar]
- Wijngaard, J.B.; Klein Tank, A.M.G.; Können, G.P. Homogeneity of 20th century European daily temperature and precipitation series. Int. J. Clim. A J. R. Meteorol. Soc. 2003, 23, 679–692. [Google Scholar] [CrossRef]
- Slivinski, L.C.; Compo, G.P.; Sardeshmukh, P.D.; Whitaker, J.S.; McColl, C.; Allan, R.J.; Brohan, P.; Yin, X.; Smith, C.A.; Spencer, L.J.; et al. An Evaluation of the Performance of the Twentieth Century Reanalysis Version 3. J. Clim. 2021, 34, 1417–1438. [Google Scholar] [CrossRef]
- Kalnay, E.; Kanamitsu, M.; Kistler, R.; Collins, W.; Deaven, D.; Gandin, L.; Iredell, M.; Saha, S.; White, G.; Woollen, J.; et al. The NCEP/NCAR 40-year reanalysis project. Bull. Am. Meteorol. Soc. 1996, 77, 437–472. [Google Scholar] [CrossRef]
- Pliemon, T.; Foelsche, U.; Rohr, C.; Pfister, C. Early Humidity Measurements by Louis Morin in Paris between 1701 and 1711—Data and Metadata. Climate 2023, 11, 156. [Google Scholar] [CrossRef]


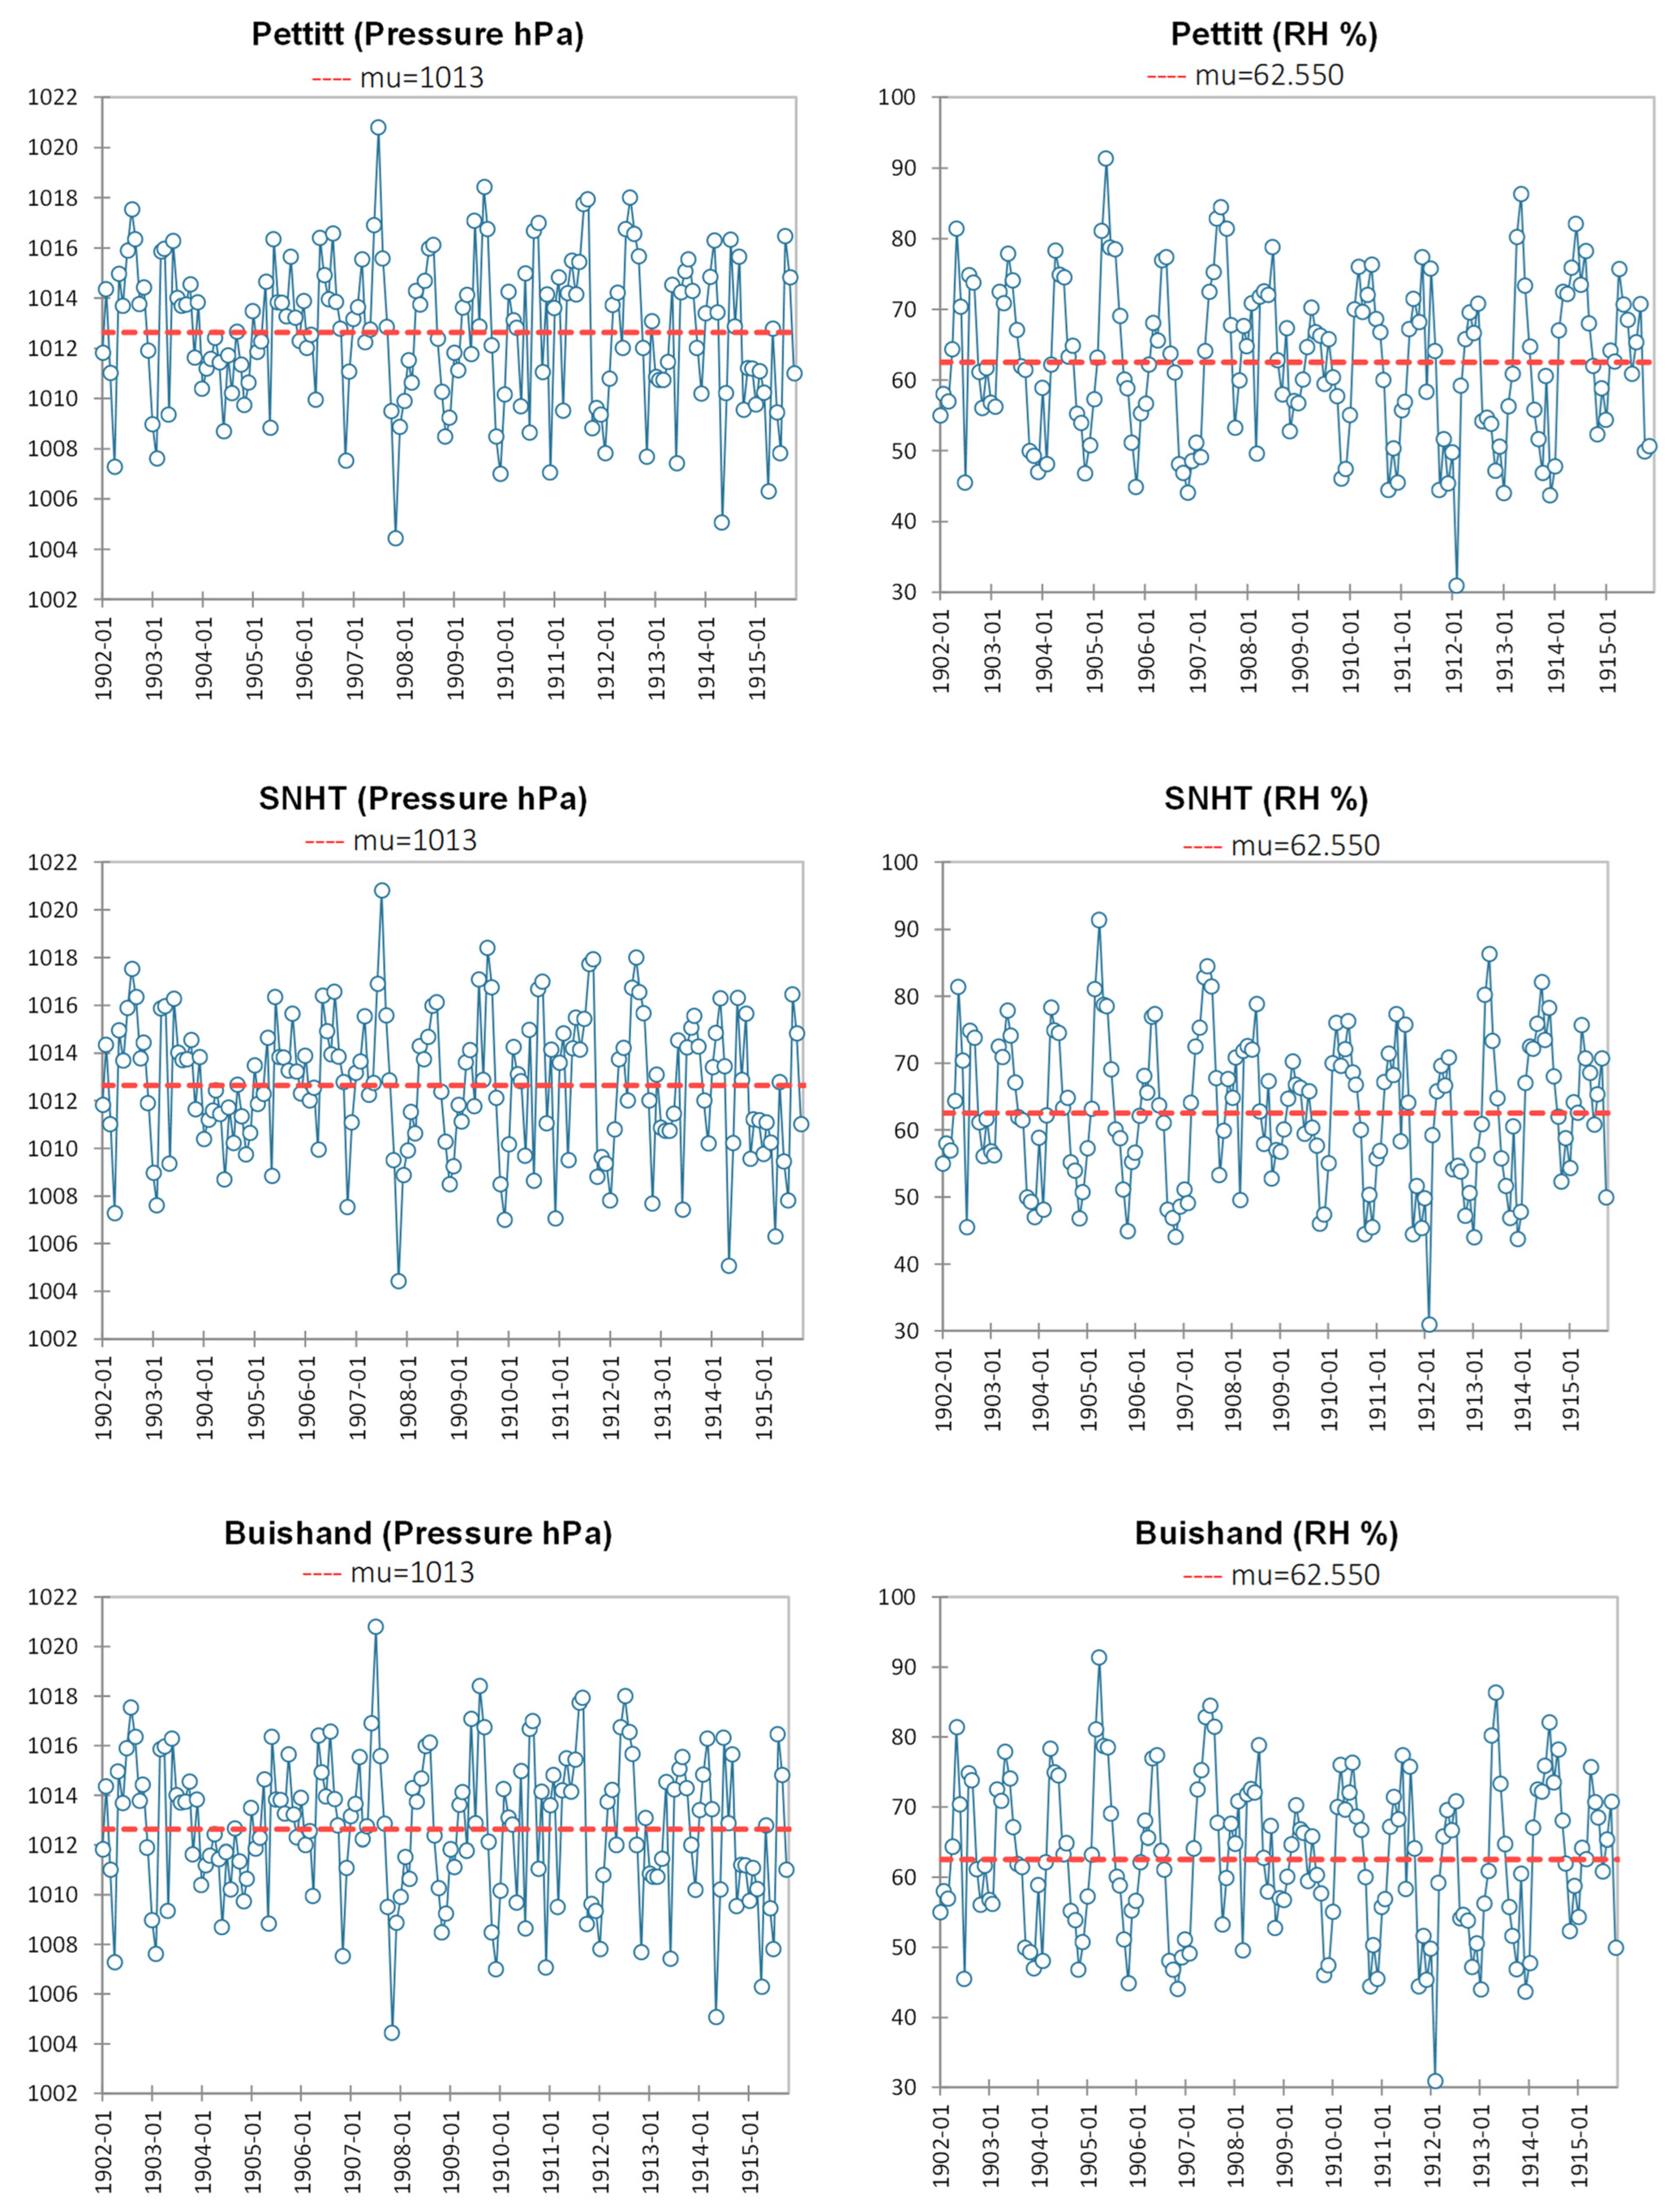
| Variable | Pettitt | SNHT | Buishand | Von Neumann | Class | Breakpoint Date: Month/Year |
|---|---|---|---|---|---|---|
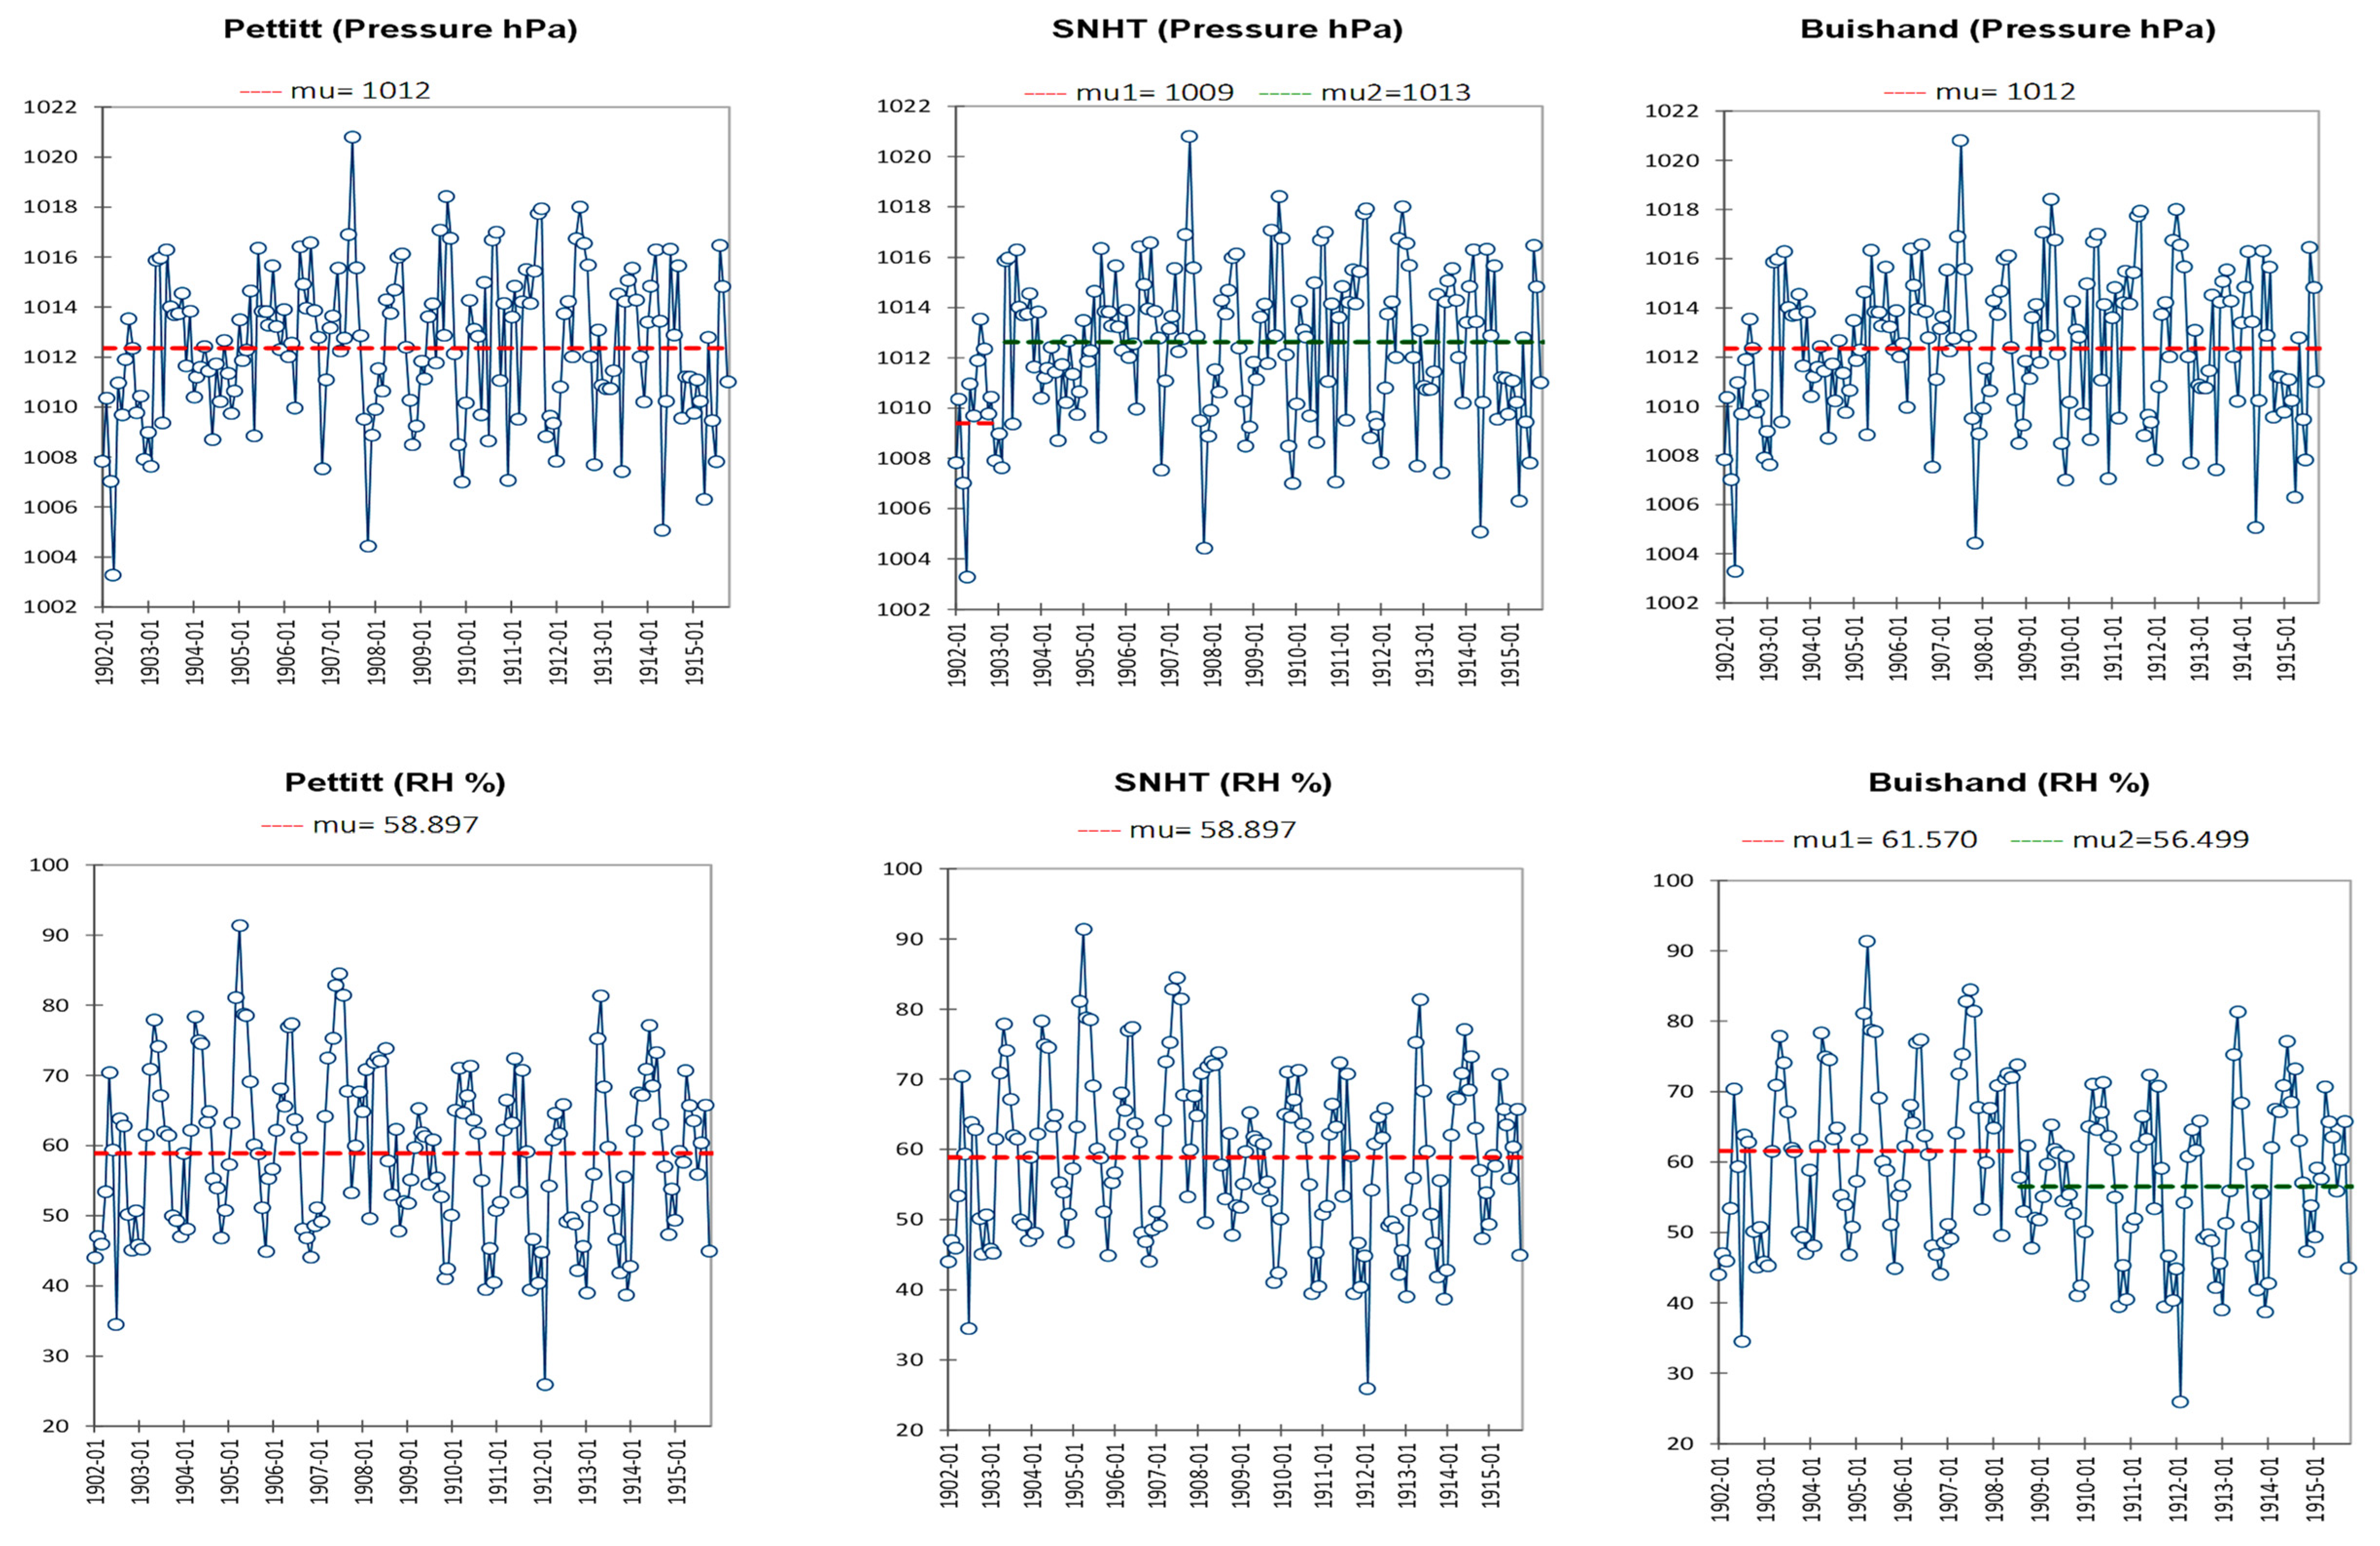
| Pressure (hPa) | 0.270 | 0.003 | 0.150 | <0.0001 | doubtful | 3/1903 |
| RH (%) | 0.150 | 0.118 | 0.028 | <0.0001 | doubtful | 9/1908 |
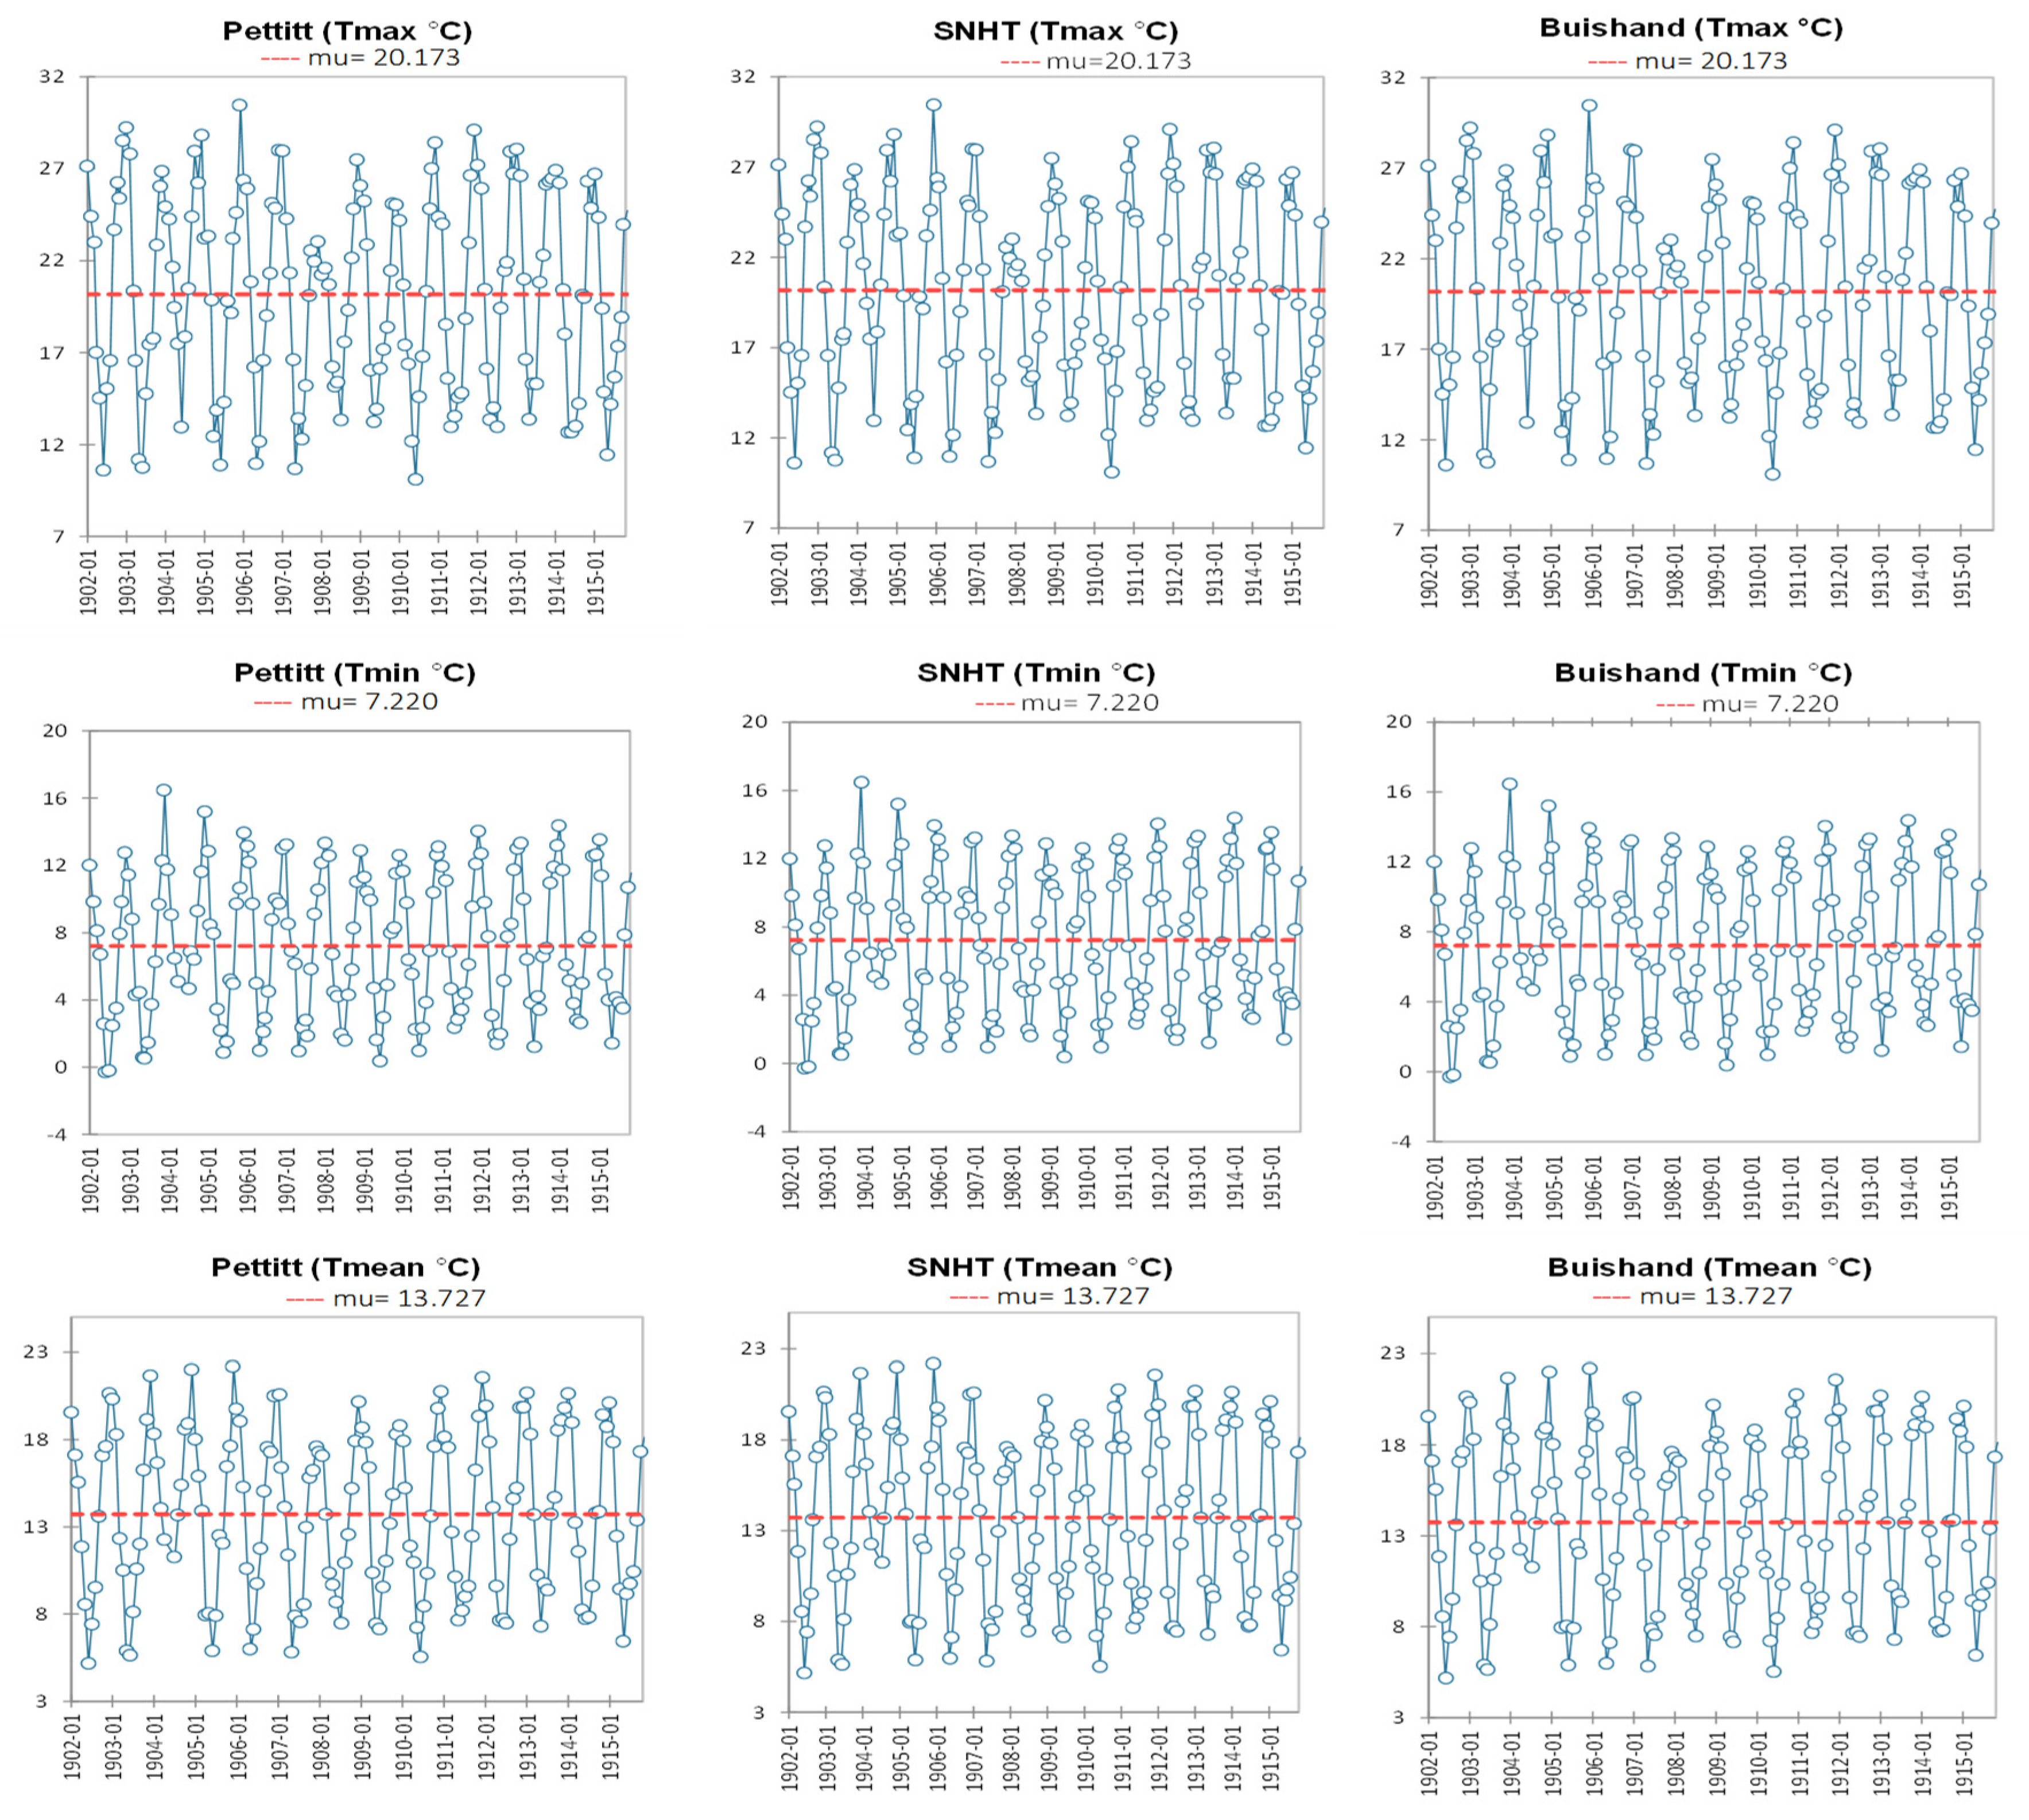
| Tmean (°C) | 0.078 | 0.952 | 0.965 | <0.0001 | useful | -- |
| Tmax (°C) | 0.577 | 0.901 | 0.719 | <0.0001 | useful | -- |
| Tmin (°C) | 0.52 | 0.593 | 0.722 | <0.0001 | useful | -- |
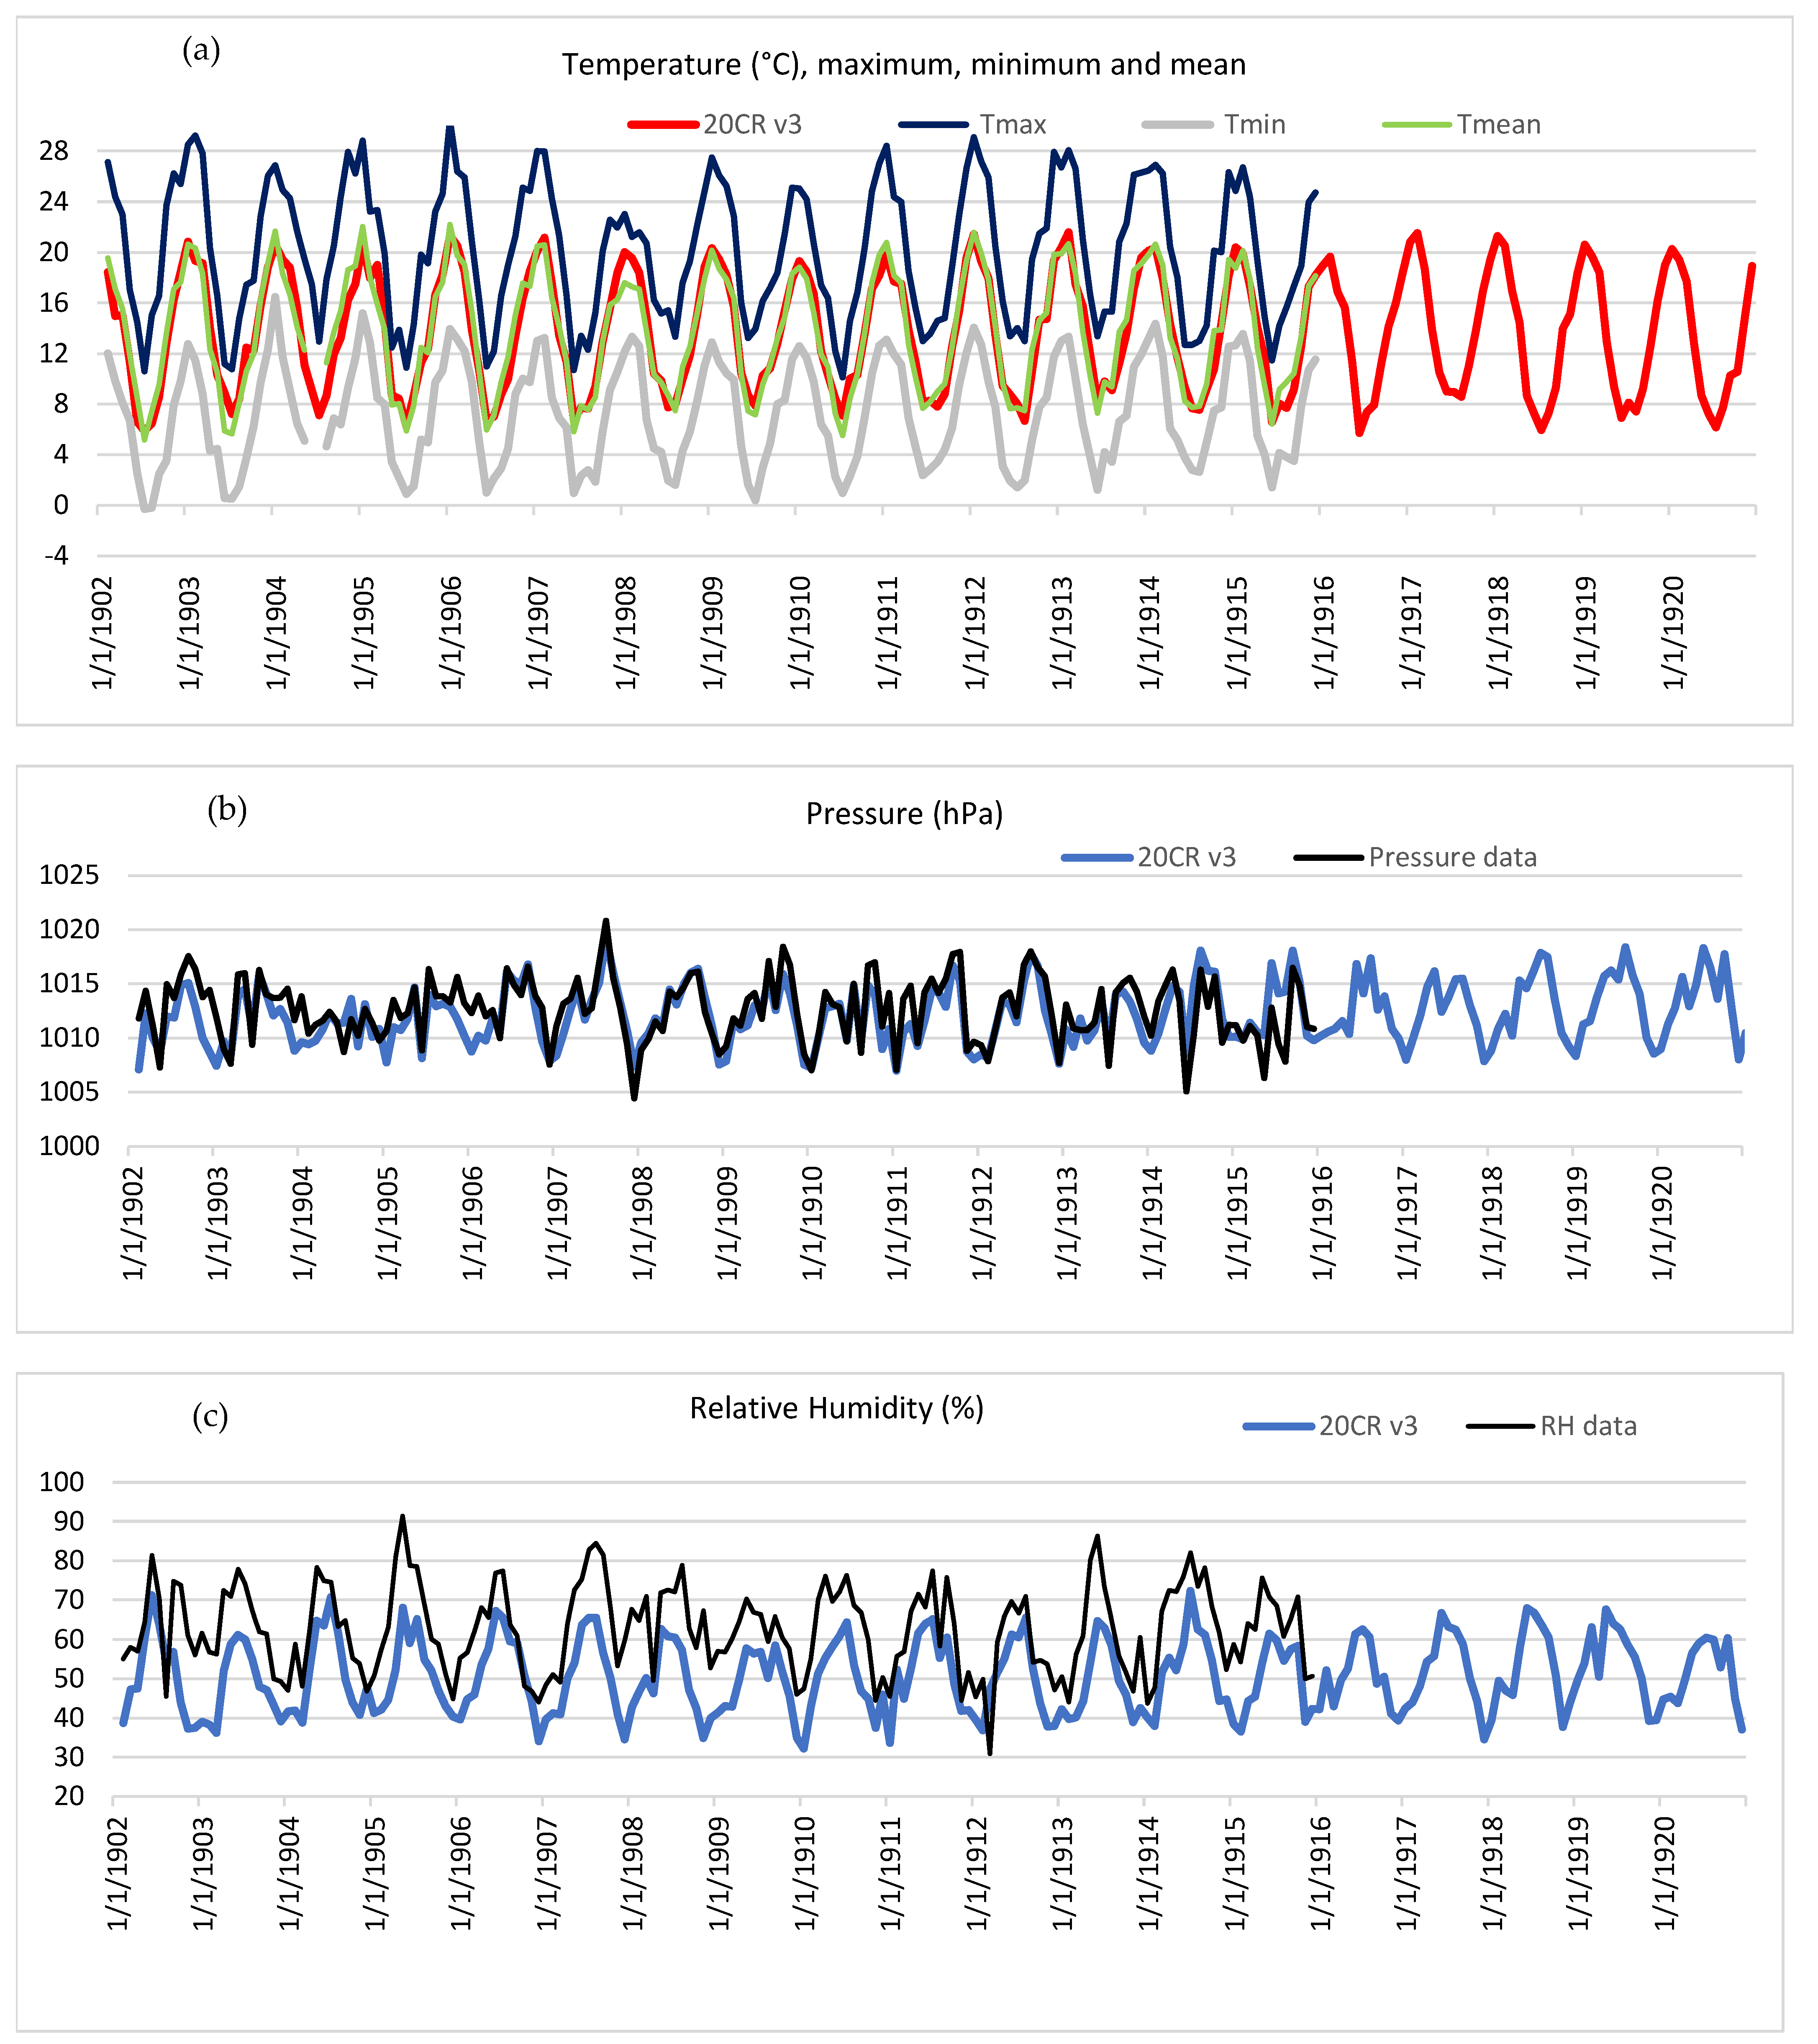
| Variables | Spearman Correlation Coefficient (Significance Level (α = 0.05)) |
|---|---|
| RH data vs. 20CRv3 | 0.65 |
| Tmean data vs. 20CRv3 | 0.94 |
| Pressure data vs. 20CRv3 | 0.61 |
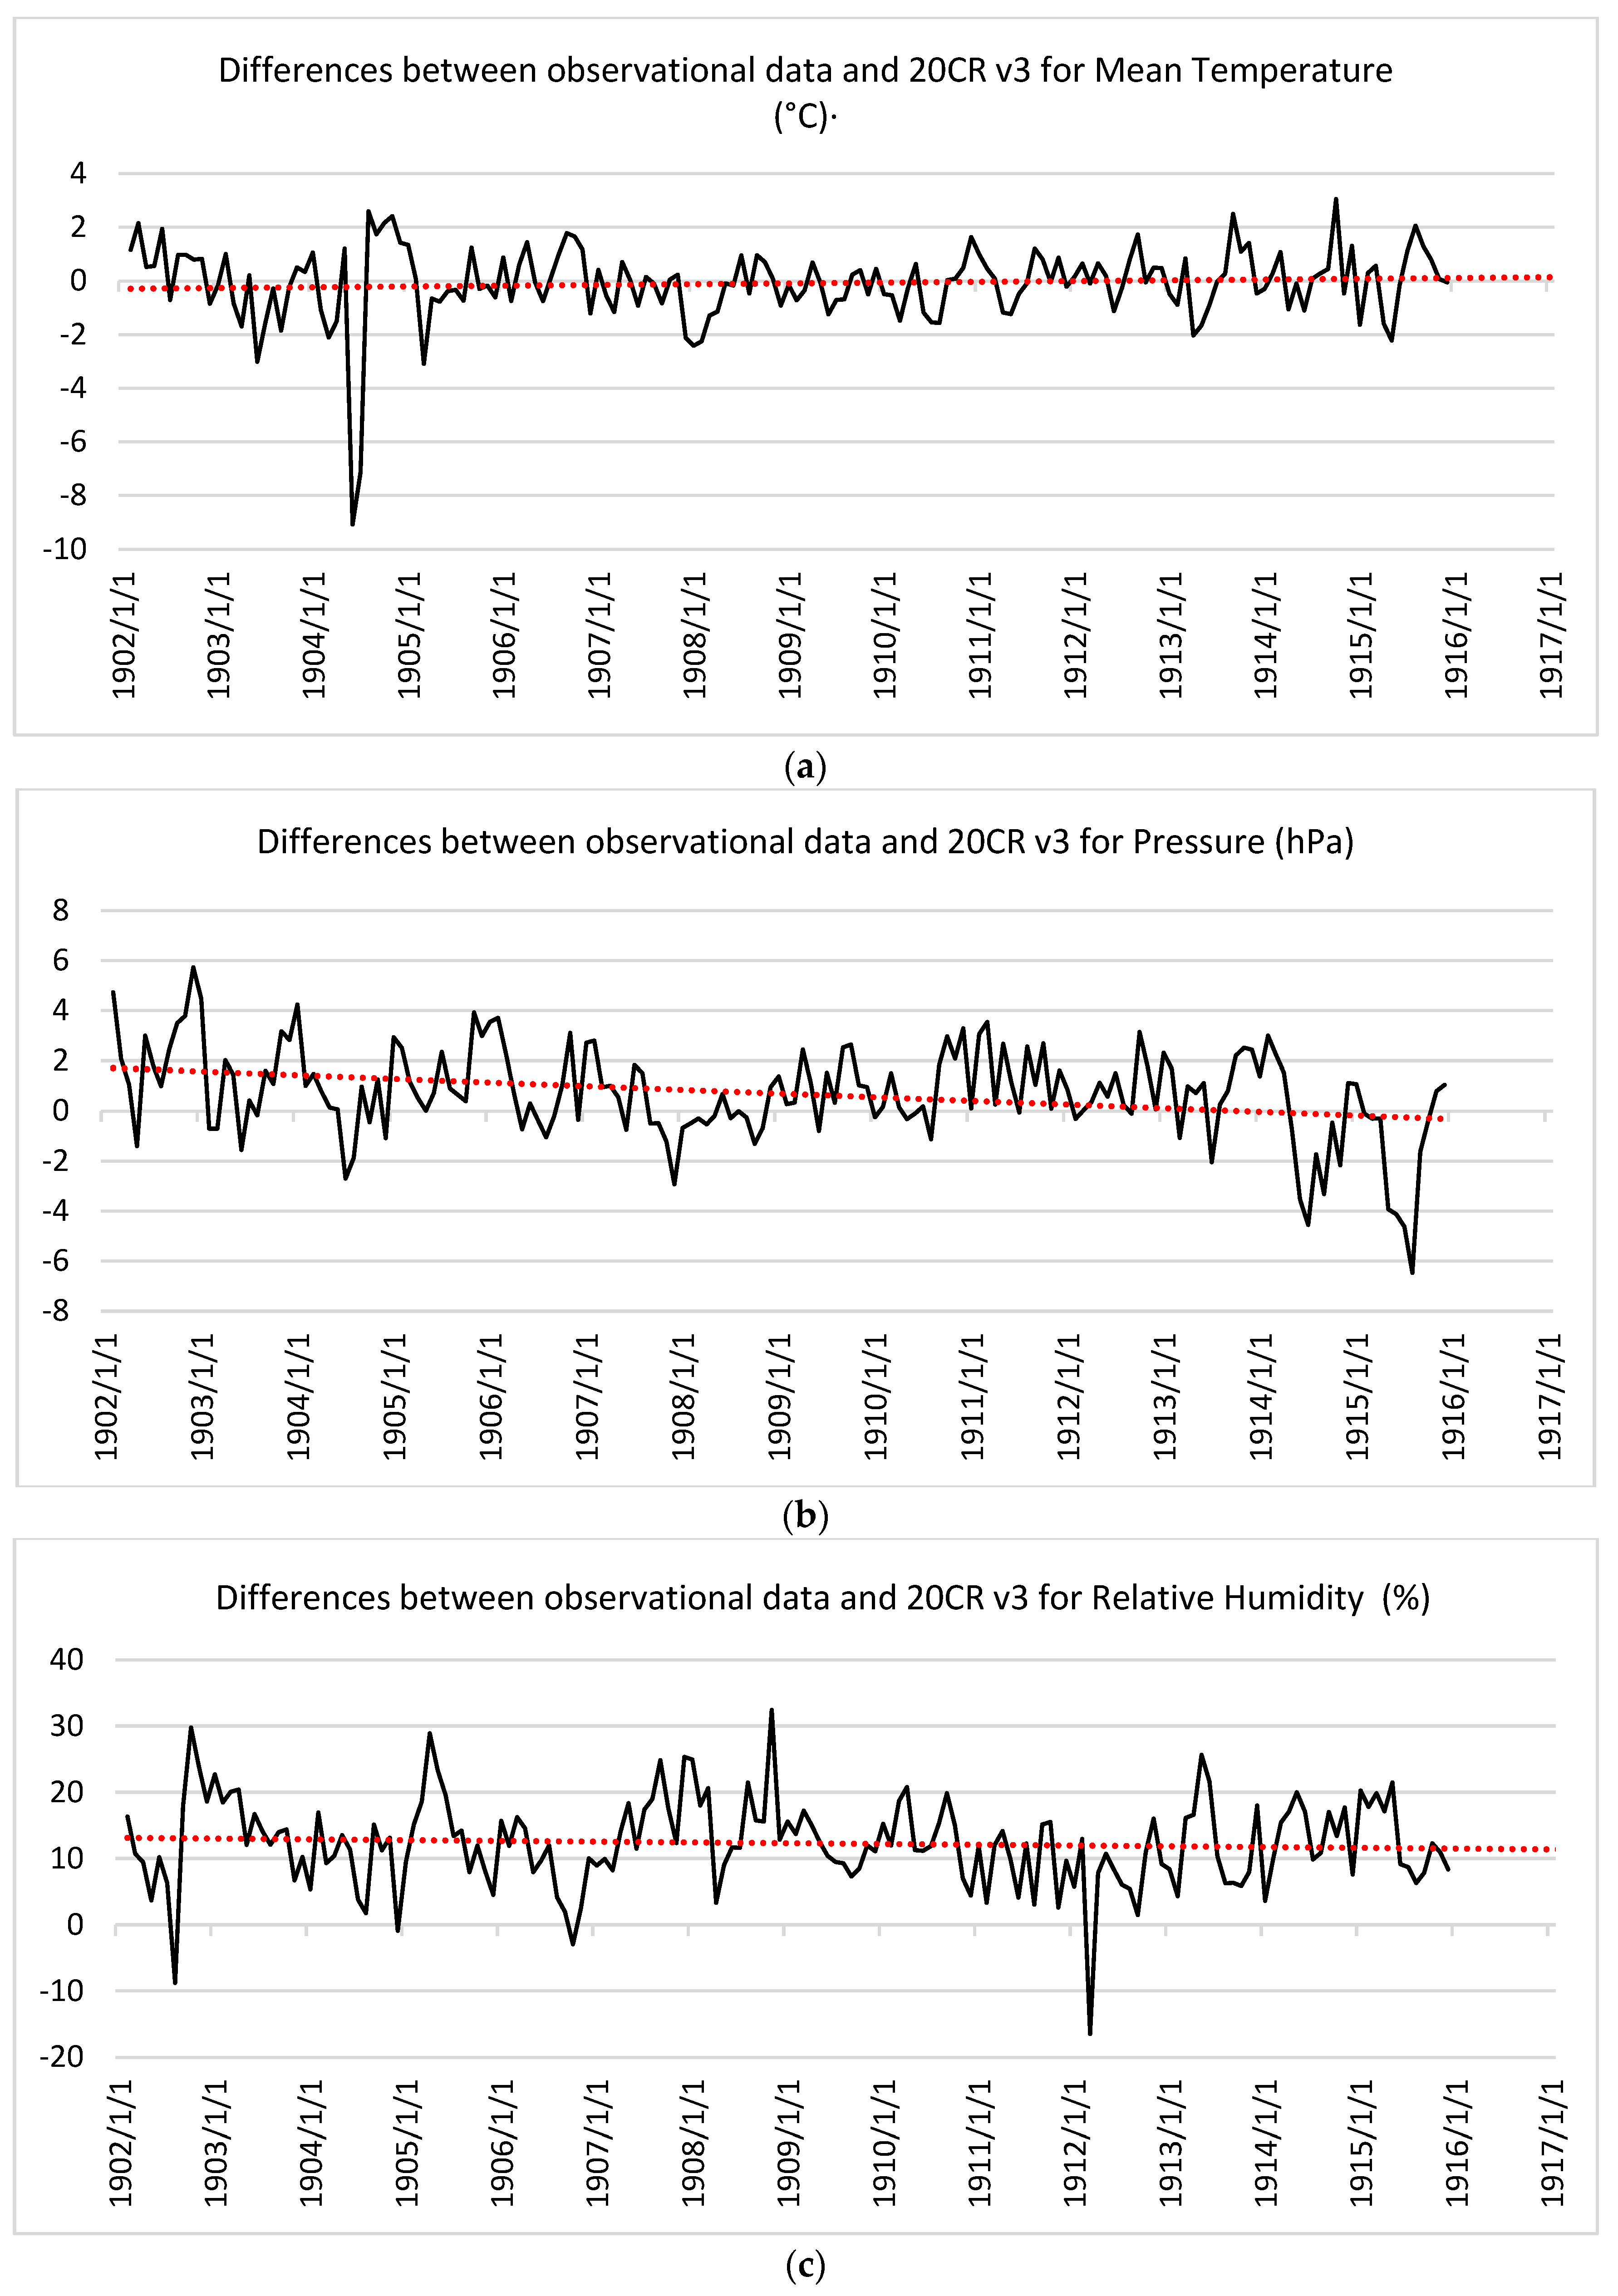
| Variable | S/Tau | p-Value | Mann–Kendall Test Trend | Sen’s Slope |
|---|---|---|---|---|
| Tmax | −393/−0.028 | 0.587 | No trend | −0.00016 |
| Tmin | 554/0.444 | 0.444 | No trend | 0.00017 |
| Tmean | 14/0.001 | 0.986 | No trend | 0.00000 |
| Pressure | −613/−0.044 | 0.397 | No trend | −0.00014 |
| RH | −307/−0.022 | 0.672 | No trend | −0.00028 |
Disclaimer/Publisher’s Note: The statements, opinions and data contained in all publications are solely those of the individual author(s) and contributor(s) and not of MDPI and/or the editor(s). MDPI and/or the editor(s) disclaim responsibility for any injury to people or property resulting from any ideas, methods, instructions or products referred to in the content. |
© 2024 by the authors. Licensee MDPI, Basel, Switzerland. This article is an open access article distributed under the terms and conditions of the Creative Commons Attribution (CC BY) license (https://creativecommons.org/licenses/by/4.0/).
Share and Cite
Lakkis, S.G.; Canziani, P.O.; Yuchechen, A.E. Unlocking Weather Observations at Puerto Madryn-Patagonia, Argentina, 1902–1915. Climate 2024, 12, 52. https://doi.org/10.3390/cli12040052
Lakkis SG, Canziani PO, Yuchechen AE. Unlocking Weather Observations at Puerto Madryn-Patagonia, Argentina, 1902–1915. Climate. 2024; 12(4):52. https://doi.org/10.3390/cli12040052
Chicago/Turabian StyleLakkis, Susan Gabriela, Pablo O. Canziani, and Adrián E. Yuchechen. 2024. "Unlocking Weather Observations at Puerto Madryn-Patagonia, Argentina, 1902–1915" Climate 12, no. 4: 52. https://doi.org/10.3390/cli12040052
APA StyleLakkis, S. G., Canziani, P. O., & Yuchechen, A. E. (2024). Unlocking Weather Observations at Puerto Madryn-Patagonia, Argentina, 1902–1915. Climate, 12(4), 52. https://doi.org/10.3390/cli12040052