Article

Small Municipalities in the Amazon under the Risk of Future Climate Change

by
Everaldo B. de Souza
1,*,
Brenda C. S. Silva
1,
Emilene M. F. Serra
1,
Melgris J. Becerra Ruiz
1,
Alan C. Cunha
2,
Paulo J. P. O. Souza
3,
Luciano P. Pezzi
4,
Edson J. P. da Rocha
5,
Adriano M. L. Sousa
3,
João de Athaydes Silva, Jr.
1,
Alexandre M. C. do Carmo
1,
Douglas B. S. Ferreira
6,
Aline M. M. Lima
1,
Flavio A. A dos Santos
5,
Bergson C. Moraes
1,
Maria de L. P. Ruivo
7,
Peter M. Toledo
4 and
Tercio Ambrizzi
8
1
Programa de Pos-Graduação em Ciências Ambientais (PPGCA), Instituto de Geociências (IG), Universidade Federal do Pará (UFPA), Belém 66075-110, PA, Brazil
2
Departamento de Engenharia Civil, Universidade Federal do Amapá (UNIFAP), Macapá 68900-070, AP, Brazil
3
Instituto Sócio Ambiental e dos Recursos Hídricos, Universidade Federal Rural da Amazônia (UFRA), Belém 66077-830, PA, Brazil
4
Instituto Nacional de Pesquisas Espaciais (INPE), São José dos Campos 12227-010, SP, Brazil
5
Centro Gestor e Operacional do Sistema de Proteção da Amazônia (CENSIPAM), Belém 66617-420, PA, Brazil
6
Instituto Tecnológico Vale (ITV), Belém 66055-090, PA, Brazil
7
Museu Paraense Emilio Goeldi (MPEG), Belém 66077-830, PA, Brazil
8
Instituto de Astronomia, Geofísica e Ciências Atmosféricas, Universidade de São Paulo (USP), São Paulo 05508-010, SP, Brazil
*
Author to whom correspondence should be addressed.
Climate 2024, 12(7), 95; https://doi.org/10.3390/cli12070095
Submission received: 9 May 2024 / Revised: 21 June 2024 / Accepted: 26 June 2024 / Published: 29 June 2024

Abstract

:
The focus of this work is on small municipalities (population below 50 thousand inhabitants) that cover around 87% of the territory of the Brazilian Legal Amazon (BLA). Based on a comprehensive integrated analysis approach using the three components hazard (climate extremes from CMIP6 future scenarios), exposure (directly affected population), and vulnerability (subdimensions of susceptibility and coping/adaptive capacity by using multidimensional indicators), the latter two using current datasets provided by the official Census IBGE 2022, we document a quantitative assessment of the risk R of natural disasters in the BLA region. We evidenced a worrying and imminent intensification of the curve of R in most Amazonian municipalities over the next two 25-year periods. The overall results of the highest proportions of R (total municipalities affected) pointed out the Amazonas, Roraima, Pará, and Maranhão as the main states, presenting projected categories of R high in the near future (2015 to 2039) and very high in the far future (2040 to 2064). The detailed assessment of the susceptibility and coping/adaptive capacity allowed us to elucidate the principal indicators that aggravate the degree of vulnerability: economy, the precariousness of urban infrastructure, medical services, communication, and urban mobility, whose combined factors, unfortunately, reveal a widespread poverty profile along the small Amazonian municipalities. Our scientific findings can assist decision makers in targeted strategies planning and public policies to minimize and mitigate ongoing and future climate change.

1. Introduction

The climate is changing, and we have a new normal [1]. Climate science is crucial in systemic understanding of ongoing and future global climate change that can exacerbate extreme atmospheric/oceanic phenomena [2,3,4], directly compromising human well-being. The occurrence of extreme weather and climate events in an area with exposed and vulnerable human and natural systems can very likely lead to natural disasters [5]. In recent decades, a novel category of extremes has become increasingly apparent, with several cities around the globe experiencing successions of extremes of floods, droughts, and heat waves, with consequent significant damage in social and environmental dimensions [4].
In particular, Brazil is a continental country presenting profound social inequalities, with the north (Amazon) and northeast regions being characterized as the most vulnerable to natural hazards [6,7]. Studies of meteorological extremes (especially long-term droughts) from a climatological perspective, including aspects of socio-environmental vulnerability, are numerous for the Brazilian Northeast [8,9,10,11] and references therein. For the Amazon, most previous studies reported composites or case studies of droughts [12,13,14] and floods [15,16,17], which provoked serious impacts during the last few decades.
Climate extremes in the Amazon have amplified their frequency and intensity [2], but the populations and environments at risk have also increased. Given this complex picture of temporally dynamic physical and environmental changes interacting with the spatially diverse social dimension, we have a great scientific challenge of investigating future scenarios of the possible worsening of disaster risk. At the same time that the science of integrated Earth system modeling advances assertively in generating future climate change projections, further efforts are needed to downscale global prognoses to a level of regional and local analysis that may be applied to disaster risk assessment [18].
Considering that the demographic, social, and environmental differences throughout the Brazilian territory are significant [6], a complicating factor in interpreting the degree of vulnerability on a national scale [19], here we propose an approach on a regional scale with a focus on municipalities of the Brazilian Legal Amazon (BLA) that are considered to be small-sized (population below 50 thousand inhabitants, according to Instituto Brasileiro de Geografia e Estatística—IBGE). The justification for choosing the municipal analysis scale in the study area is that the results of the risk evaluation in locations with the same geographic characteristics can contribute to assisting decision makers in targeted strategies planning and public policies to minimize and mitigate the threat of ongoing and future climate change. Hence, we conducted a comprehensive integrated analysis to quantitatively assess the future risk of natural disasters within and between small municipalities of the BLA region, resulting from three components: hazard (climate extremes associated with droughts and floods), exposure (directly affected population and environment), and vulnerability (sub-dimensions of susceptibility and coping/adaptive capacity by using multidimensional indicators), the latter two using current datasets provided by the official Census IBGE 2022 [20]. It is important to mention that the hazard component includes an analysis of extreme climate indices extracted from historical and future General Circulation Models (GCMs) projections included in Phase 6 of the Coupled Model Intercomparison Project (CMIP6), which represent the most up-to-date simulations to investigate the impacts of climate change in different global emissions scenarios [21].

2. Materials and Methods

The official data from the 2022 Census coordinated by the IBGE [20] were used to select municipalities with a total population below 50,000 inhabitants (defined as small municipalities). Figure 1a shows the study area, highlighting a total of 671 small municipalities selected across the territory of the nine BLA states. MA, TO, MT and PA are the states with more than one hundred municipalities, while for AP, RR and AC, the total is below twenty (Figure 1b). Around 522 municipalities have a density <16 inhabitants/km2 and 123 municipalities between 17 and 47 inhabitants/km2, the total of which accounts for around 96% of the entire region (Figure 1c). An urbanized area <3 km2 is observed in a total of 319 municipalities and values between 4 and 7 km2 are verified in around 217 municipalities, both sets accounting for almost 80% of the entire sample (Figure 1b). So, the population living in small urbanized areas with low demographic density is a prominent geographic characteristic of this study area.
Based on a conceptual framework recommended in the Special Report on Managing the Risks of Extreme Events and Disasters to Advance Climate Change Adaptation (SREX) [5], we consider that the risk (R) of natural disaster is the result of the interaction (intercession) of three main components (Equation (1): first, the threat or hazard (H) of occurrence of extreme meteorological/climate events, second, the exposure (E) of the affected/impacted population and environment, and third, the respective degree of vulnerability (V) in multiple social, economic, environmental and local infrastructure dimensions:
R = H × E × V
Equation (1) is applied for the 671 small municipalities in the BLA using a total of 3 indicators for the component E, 17 indicators for the component V and 4 indicators for component H (see Table 1 with details of all multidimensional variables/indicators) and following the methodological procedures described in the flowchart in Figure 2, as sequentially explained below. Due to the indicators presenting different units, a minimum/maximum rescaling method [22] was adopted, in which each indicator is transformed (normalized) into an identical range between zero and one, through the expression:
In = (Ii − Imin)/(Imax − Imin)
In is the normalized indicator, Imin and Imax are the minimum and maximum values, respectively, considering the entire sample of 671 municipalities of the respective indicator. The result is a score, with 0 being the best and 1 the worst in rank. After normalization employed in all indicators listed in Table 1, the components H, E and V were calculated according to the methodology described below. We used the quantile method to divide the results into five intensity categories for the spatial analysis and maps containing a classification scheme defined as very low, low, moderate, high, and very high.
Component E is of great relevance in integrated risk assessment, since the population is the central element that will directly suffer the possible damages, impacts and consequences of natural disasters. E is expressed by the simple mean of the three demographic indicators:
E = (TP + DD + UA)/3
where TP, DD and UA are the total population, demographic density and urbanized area, respectively.
The assessment of component V is multidimensional including social, economic, environmental and public infrastructure variables and indicators, which are expressed by the sub-dimensions of susceptibility (S) and coping/adaptive capacity (C):
V = (S + C)/2
S reveals the propensity of the municipality and people to suffer damage/loss and be negatively affected by the occurrence of climate extremes. We consider indicators that represent the lack of S, as below:
S = 0.15 (0.33 (SW + WD + WS)) + 0.15 (0.33 (HO + CH + EL)) +
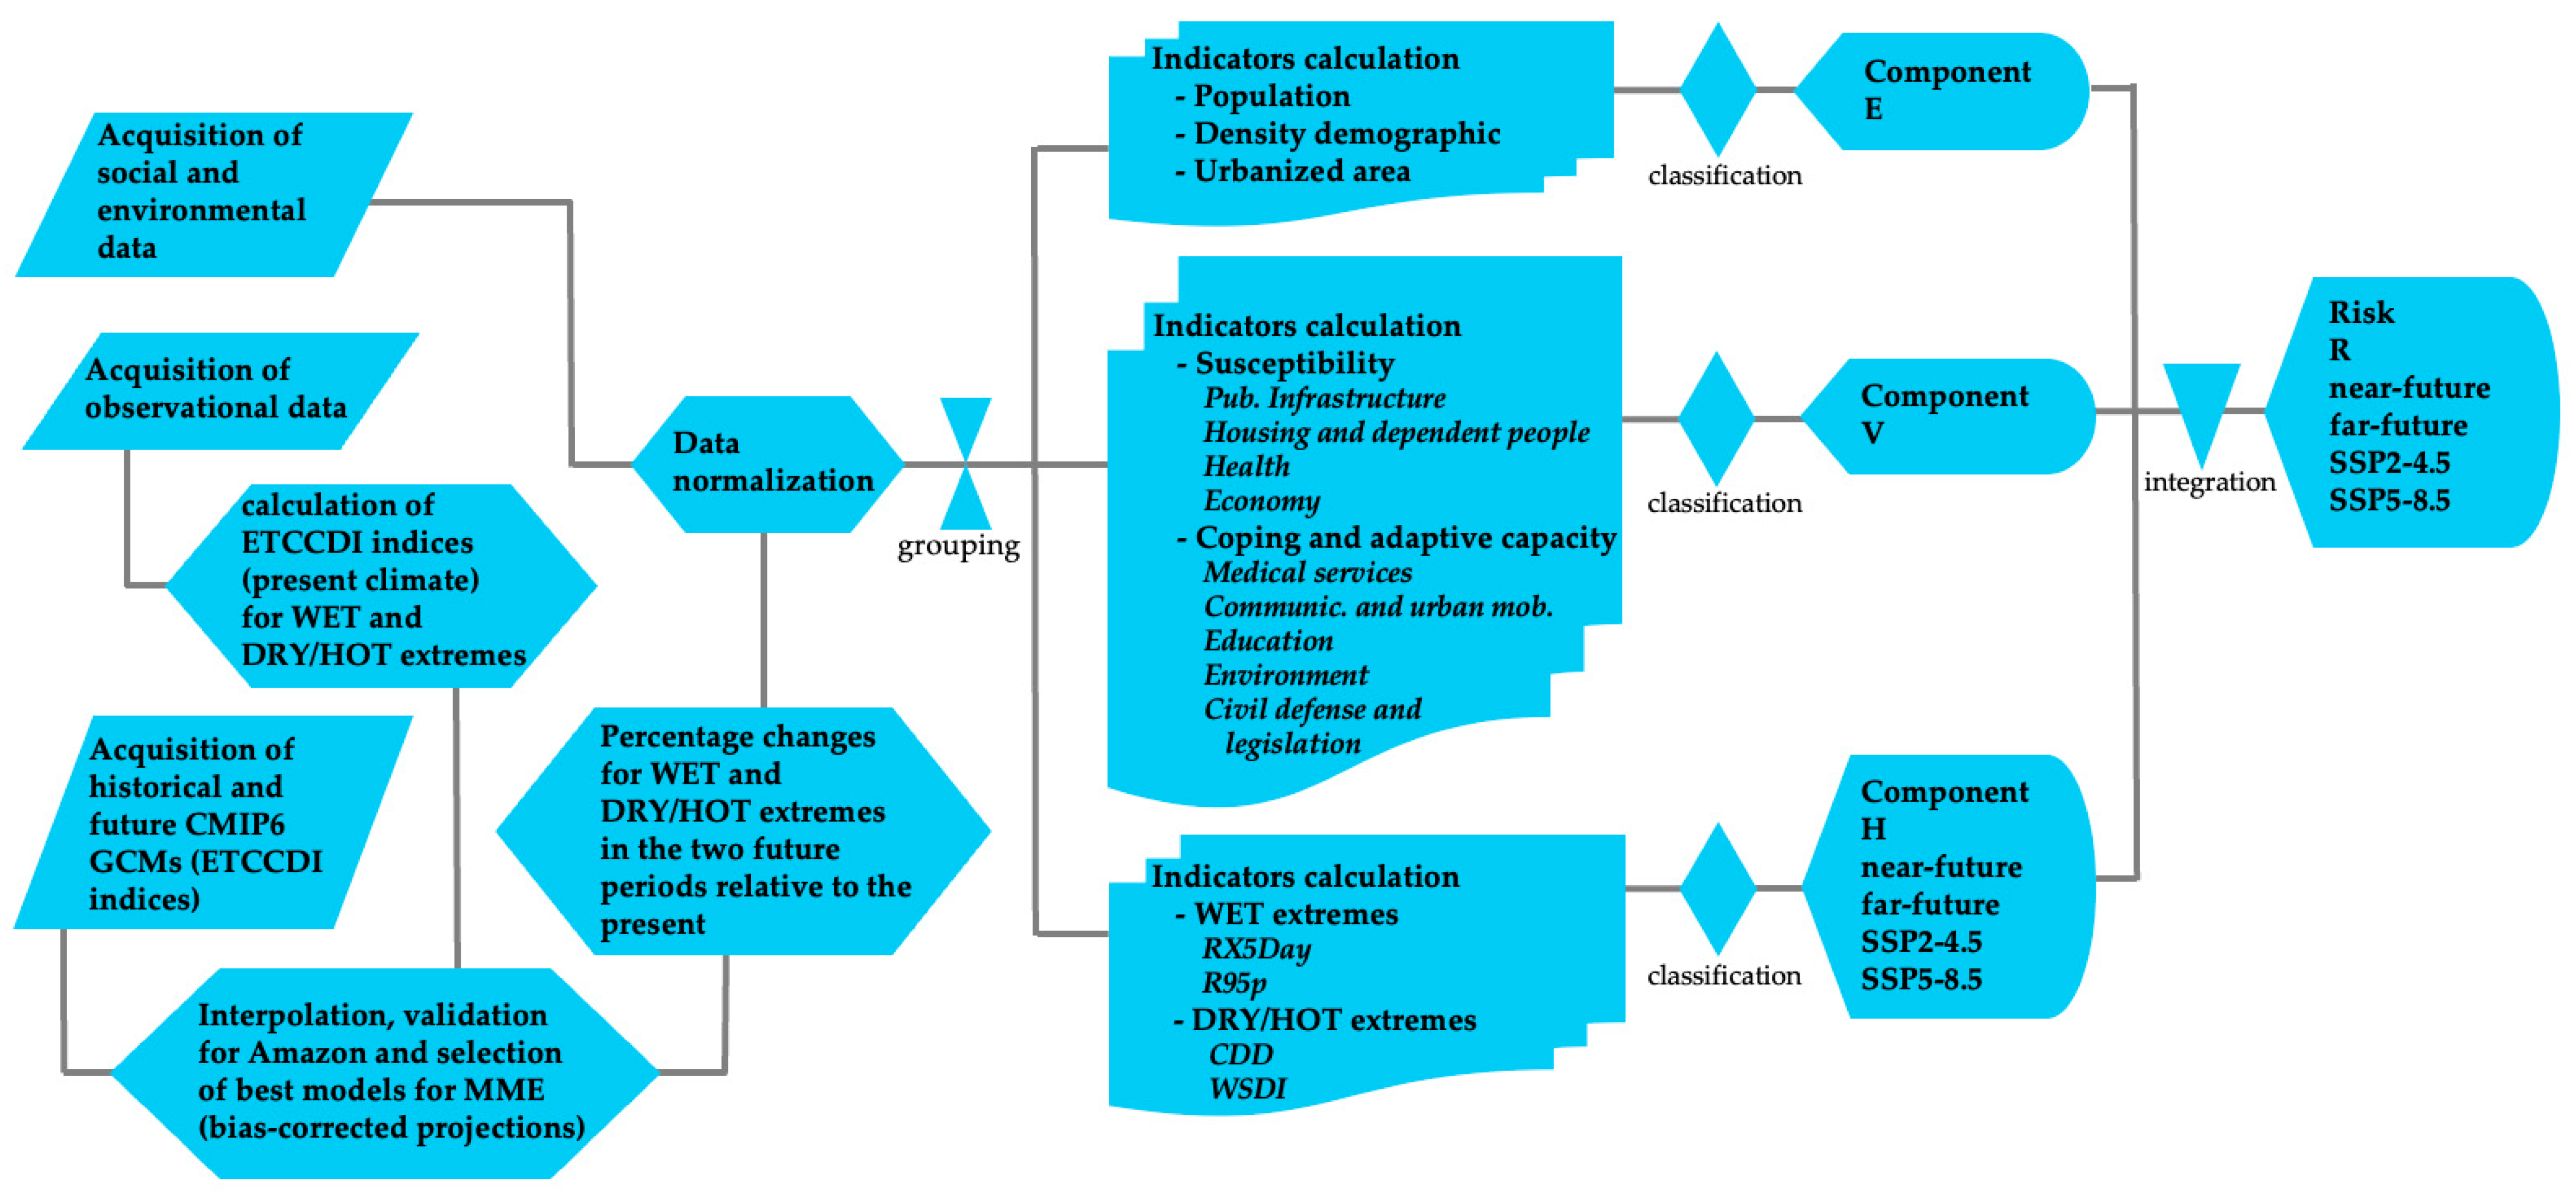
0.1 (0.5 (MA + MC)) + 0.1 GP
The acronyms of the indicators are described in detail in Table 1. The first term contains indicators that denote the precariousness of the public infrastructure of Amazonian households (critical or minimum conditions of sanitary sewage, waste destination and potable water supply), the second term reflects the fragility or insecurity of housing conditions (tenements or unfinished/degraded houses) and the presence of more dependent people (children and elderly), the third term characterizes health conditions (incidence of malaria, a disease endemic in the Amazon) and human losses given by the recent mortality rate from COVID-19, and the last term expresses the economic indicator (municipal GDP). The highest weights were assigned to the indicators of the first and second terms, which in the Amazon contribute more directly to the lack of S.
C was estimated by indicators that determine the immediate or short-term ability of the municipality to manage or react to the impact of an extreme event (coping capacity), as well as some characteristics of the adaptive capacity that enable the municipality to carry out actions and adaptation strategies in the medium and long term for the purposes of minimization of vulnerability:
C = 0.2(0.5(HB + NP)) + 0.1(0.5(BI + PT)) + 0.1(0.5(CD + IN)) + 0.05ED + 0.05D
Details of the acronyms are in Table 1. The first term emphasizes the medical services most used by the population in an emergency (receiving the highest weight), the second term represents the digital communication and urban mobility to obtain alert information and moving from the place of danger, the third term is the most important on the part of the municipal government responsible for the civil defense secretariats that deal with disaster response actions, as well as for the implementation of public policies registered in legal instruments focusing on the planning and management of climate and environmental risk, and the last terms indicate the aspects of education and environment.
The weight values used in the sub-dimensions S and C were established in accordance with the methodological framework used in the AdaptaBrasil platform, a project implemented by the Ministry of Science, Technology and Innovation (MCTI) from Brazil in partnership with the National Institute for Space Research (INPE), which developed a theoretical–methodological document to assess the risk of climate change impacts in some Brazilian strategic strategies sectors [23].
The indicators of the component H were obtained through a comprehensive analysis approach of extreme climate indices from historical and future projections of a total of 24 General Circulation Models (GCMs) included in the Coupled Model Intercomparison Project Phase 6 (CMIP6). Table A1 in Appendix A shows the complete list of GCMs used. These GCMs were used in the 6th Assessment Report of the Intergovernmental Panel on Climate Change [20] and the gridded data were acquired on the Copernicus platform [24]. We use two future scenarios considered intermediate (SSP2-4.5) and more extreme (SSP5-8.5) in terms of radiative forcing of global warming [20]. Due to the availability of historical simulation data, the present climate was defined from 1990 to 2014 (25 years). Continuing the subsequent chronological scale, the future time scale was subdivided into two 25-year periods, the near future (2015 to 2039) and the far future (2040 to 2064). Two observational databases are used to compare and validate CMIP6 model simulations for the present climate, the CHIRPS [25] that combines satellite images and station data to create a 0.25° gridded precipitation time series, and the CPC Unified [26] containing 0.5° gridded maximum and minimum air temperature generated through the optimal interpolation objective analysis technique using solely gauge data network. As in previous studies [27], all gridded databases (observations and GCMs) were interpolated into a 0.25° regular grid using the bilinear interpolation method, with the purpose of investigating climate extremes on a regional (municipal) scale over the Amazon.
We consider a set of absolute, threshold, duration, and percentile-based indices, defined by the Expert Team of Climate Change Detection and Indices, ETCCDI [28], to characterize two opposing types of climate extremes in the Amazon: very intense rainfall episodes generally associated with floods conditions (WET extremes), and the combination of drought and heat wave events (DRY/HOT extremes). Daily data from CHIRPS and CPC for the base period 1990 to 2014 (present climate) were used in the calculations of extreme climate indices of precipitation and air temperature, respectively. For the WET extremes, we use RX5day (annual maximum 5-day precipitation) and R95p (precipitation on days with daily precipitation > 95th percentile for the base period). For the DRY/HOT extremes, we use CDD (maximum number of consecutive dry days with precipitation <1 mm) describing the longest length of dry spells in a year, and the WSDI (annual count of days with at least 6 consecutive days when daily maximum temperature is above the 90th percentile centered on a 5-day window for the base period). The extreme indices gridded data for future projections were acquired directly from the Copernicus platform [24], containing pre-calculated and consistent ETCCDI indices from CMIP6 models that have the necessary daily resolved data for both historical and at least two of the future projections. Thus, the representative indices of WET and DRY/HOT extremes were extracted at the geographic points of the 671 small municipalities in the BLA for the GCM and observations in the present climate and only for the GCMS in the two periods of future climate. With the present climate time series of observed and simulated data, we calculated the statistical metrics of means, standard deviation (σ), Pearson correlation (r) and root mean squared error (RMSE) for all municipalities and in the end, we obtained the Taylor skill score, TSS [29], for each GCM and climate extreme:
TSS = 4(1 + r)/[σ + (1/σ)]2 (1 + r0)
where r is the correlation between the simulated and reference datasets, r0 is the maximum correlation (between the 24 GCM), and σ is the standard deviation of the simulated dataset. TSS provided the overall rank of the models, and we also plotted the Taylor diagram to evaluate the performance of the GCMs. A selection of models that best represent each extreme climate index over the Amazon (TSS ≥ 7.0) was made with the purpose of evaluating future projections with a more robust signal (less uncertainty). The set of these best GCMs was denominated as a multi-model ensemble (MME), in which the bias correction method (present climate simulation minus reference observation) was applied and then the percentage changes (C) of the extreme indices (EIs) in the future period relative to the present were obtained:
C = ((EIfuture − EIpresent)/EIpresent)) × 100
As previously mentioned, the EIs for WET were RX5day and R95p and for DRY/HOT extremes, they were CDD and WSDI, all extracted from the MME considering the 25-year averages in the present (1990 to 2014) and the two subsequent periods of the near future (2015 to 2039) and far future (2040 to 2064) and taking into account the two CMIP6 scenarios SSP2-4.5 and SSP5-8.5.
Finally, the component H provides the threat of climate extremes associated with drought and flood episodes in the Amazon:
H = (HWET + HDRY/HOT)/2
HWET = (C_CDD + C_WSDI)/2
HDRY/HOT = (C_RX5day + C_R95p)/2
where C_CDD, C_WSDI, C_ RX5day and C_R95p are changes of CDD, WSDI, RX5day and R95p, respectively, for the two future periods using SSP2-4.5 and SSP5-8.5.

3. Results and Discussion

The spatial distribution of the components E and V in the domain of municipalities over the BLA is shown in Figure 3. To complement the interpretation of the results, Table 2 illustrates the respective percentages in the nine states for each intensity category. Although the maps indicate high spatial variability throughout the Amazon territory, the visual analysis of both components reveals that the two highest categories of E and V are predominantly distributed in the states of PA, MA, AM and MT, while TO exhibits more municipalities in the lowest categories (Figure 3). Analyzing sequentially the values in Table 2, the three states with the component E in the very high category are PA, MA and MT (totaling 15.2%), and those with high are MA, PA and AM (totaling 13.7%). Conversely, only the state of TO, with 11.6%, has the greatest concentration of municipalities with very low, while the states of MA, TO and MT contribute a total of 14% of municipalities in the low category. In terms of component V, the states with the largest number of municipalities in the very high category are PA, MA and AM (totaling 16.2%), and in the high category are MA, PA and MT (totaling 12.5%). In contrast, the states with the greatest abundance of municipalities in the very low category are TO (9.5%) and MT (6.7%) and the low category are TO (6.0%), MT (5.4%) and MA (3.9%), according to quantitative values in Table 2.
With the purpose of identifying which indicators of sub-dimensions S and C contribute to the worsening of vulnerability, boxplots and a radar chart (Figure 4) were constructed particularly for the sets of municipalities with component V categorized as very high and high in each Amazonian state. One should bear in mind that a value tending to 0 indicates the best score and a value close to 1 indicates the worst in the rank. In terms of susceptibility, the economy indicator is critically the most serious, compared to the others, with most states showing a boxplot position close to 1. Except for MT (favored by the soybean agricultural sector), all states show average economy values at the outer edge of the radar (close to 1). The second indicator with some prominence is the lack of public infrastructure (precarious conditions of sanitary sewage, waste destination and potable water supply), mainly in the states of PA, RO and MA with boxplots displaying values from 0.1 to 0.7. In the indicator radar, these states also stand out with average values of 0.46, 0.39 and 0.38 in PA, RO and MA, respectively. The housing conditions/dependent people indicator shows relatively similar variations in the boxplots, and the states of PA and MT show average values reaching 0.32 in the radar. The health indicator is the lowest in all states, except RR with a highlighted value of 0.28 in the susceptibility quadrant of the indicator radar. On the other hand, the indicators of the sub-dimension coping/adaptive capacity reveal that digital communication/urban mobility and medical services are clearly the first and second highest contributors to the degree of vulnerability in Amazonian municipalities. The indicator radar shows that communication/urban mobility in all states is very close to 1. Medical services present values between 0.7 and 0.9 across states, and in the radar, the lowest value is seen in MT with 0.8 and the highest is verified in AC with 0.93. The education indicator is also problematic in most municipalities, with values oscillating between 0.5 and 0.7, with average values in the radar around 0.58 in RR and MA and reaching 0.7 in RO and TO. The environment indicator showed values below 0.3 and the radar illustrating that the states of PA, AM and MT are the worst in the region, with averages of 0.17, 0.14 and 0.13, respectively.
Most of the characteristics of the indicators discussed above are supported by the extensive research conducted by [6] on the social vulnerability index at the level of Brazilian cities. In the quantitative maps, it was demonstrated that the north region (Amazon) contains the most socially vulnerable cities, with conditions of poverty, poor infrastructure, lack of public employment, among others, presenting the worst scores. This pattern is consistent with historical development patterns, aggravated by the fact that this region receives the smallest shares of federal public investment. Almeida et al. [19] also found very high vulnerability in northern Brazil, implying that these locations would have more difficulties in coping and recovering from the impacts of a given disaster.
Instead of using simulated data from all 24 GCMS CMIP6, we evaluated the ability of these models to reproduce the observed patterns of extreme indices for the historical period (1990 to 2014). Through statistical analysis of the TSS, it was possible to rank quantitatively a list of the best GCMs in each extreme index, whose results are illustrated in Figure 5 (top graph), with blue bars highlighting the best models. We selected a total of eight GCMs for CDD and R95p and seven GCMs for WSDI and RX5Day. Similar performance analyses of the CMIP6 models conducted by [27] also found results similar to the rank obtained in this work. The selected models were then used to generate the multi-model ensemble (MME), which is considered to be the most assertive or with the lowest uncertainties in the projections of climate extremes for the Amazon. Thus, it is convenient to present the original observed patterns of the extreme indices in the present climate (1990 to 2014) and the corresponding MME patterns representative of the CMIP6 simulations (Figure 5, bottom). Analyzing the observations, we observe a northwest/southeast gradient of the CDD, indicating more frequent droughts in areas located on the south/southeast/eastern edge of the region, which is also coincident with the most intense manifestation of the WSDI, both indices being significant in MA, TO, MT and the respective border areas with PA. The RX4Day and R95p reveal that precipitation extremes spread across all Amazonian states. Examining the CMIP6 simulations represented by the MME, a good consistency is noted both spatially and in magnitude of the extreme indices compared to the reference observations. Therefore, we mention that the CMIP6 simulations are able to reproduce the observed patterns of climate extremes in the Amazon, whose findings are consistent with previous analyses reported by [27,30]. Some previous observational studies using satellite and station databases [31] also investigated extreme indices in the Amazon, with spatial patterns similar to those presented here.
After applying the bias correction method to the MME, the percentage changes in the two 25-year periods relative to the current climate were calculated and normalized. The maps of component H given by the MME considering both the effects of the WET and DRY/HOT extremes are shown in Figure 6. Analyzing the maps, for the near future (Figure 6, left panel) in both scenarios we verify an indication of the categories very low and low in a large number of the Amazonian states, except in the southeastern BLA encompassing the states of MA and TO and portions to the northeast MT and southeast PA. Some municipalities located in central AM and PA also display categories H moderate and high in this period. Examining the results for the far future (Figure 6, right panel), a widespread intensification of climate extremes over the Amazon territory, especially throughout the states of AM, PA, MA, TO and MT, is evident. In the SSP2-4.5 scenario, the categories H vary from moderate to very high, and in the SSP5-8.5 scenario, the high and very high categories predominate in these regions.
Our H mapping results are consistent with former evaluations of simulations with global and regional models. Previous studies based on CMIP5 future projections scenarios had already reported a significant increase in the number of consecutive dry days, amplifying droughts in the Amazon, with a more intense signal under RCP8.5 [7]. As the complete database of CMIP6 simulations was made available from 2020 onwards, there are still few studies reporting the results of climate extremes directed at sectors in South America. For the Amazon, in particular, Ferreira et al. [32] indicated results of reduced rainfall projections for the coming decades that are more prominent during the austral spring under the SSP5-8.5 scenario. Investigating the CMIP6 worst-case scenario in the middle (2046–2065) and far future (2081–2100), Medeiros et al. [30] showed that the extreme precipitation events are projected to be more severe, frequent, and long-lasting in all Brazilian regions, with the most pronounced changes expected in heavy rainfall and severe droughts in the central and northern portion, including the Amazon.
We now investigate the risk R of natural disasters (resulting from components E, V and H above mentioned) in the BLA region, whose maps are shown in Figure 7 for the near and far future in the two scenarios SSP2-4.5 and SSP5-8.5. The analysis of spatial distribution reveals the presence of high spatial variability mainly in the states located to the south/southeast (AC, RO, MT and TO) and to the north (AP and RR) portions of the BLA, where the categories R vary from very low to very high. The spatial configuration of R is somewhat more regular in the states of AM, PA and MA, where there is a greater presence of the categories R from moderate to high to very high in most municipalities.
In line with the results obtained in Figure 7, but for current climate indicators (2010 to 2013), the distribution map of the Disaster Risk Indicators in Brazil (DRIB) generated by Almeida et al. [19] also pointed out the majority of municipalities in AC, AM, PA and MA exhibiting the highest R rating. With a similar scope, Debortoli et al. [33] developed a disaster vulnerability map for 2011–2040 and 2041–2070 periods in Brazil, based on projections of the Eta regional model nested within two IPCC/AR5 global models. They showed a large number of municipalities depicting high vulnerability to natural disasters of hydrometeorological origin (in particular, flash floods) in all regions of the country, including the AP/PA border, AC and Manaus region in the AM state.
A general analysis of the results of the five disaster risk categories in terms of the proportions of the number of municipalities relative to the total for each state may be found in Table A2 in Appendix A. An objective question given the results in Figure 7 and Table A2 would be: Which risk category presents the highest proportion of municipalities considering the average between the two scenarios? And what is the evolution in the two future periods? For this point, we produced Figure 8, exhibiting for each state the average between SSP2-4.5 and SSP5-8.5 for the category containing the highest proportion of municipalities in the near and far future. The states with the most problematic configuration of increasing disaster risks are AM, RR, PA and MA, while the states TO, AP, MT and RO have lower categories (although still significant, as they occupy a significant proportion of the states). AM has a proportion of 31% of municipalities in the high category in the near future and 32% in the very high category in the far future. PA remains in the very high category with 45% of municipalities in the near future and 46% in the far future. MA ranges from 30% of municipalities in the high category in the near future to 33% in the very high category in the far future. RR presents 39% of municipalities in the very high category in the near future, decreasing to 39% in the high category in the far future, whose result may be associated with redistribution to other categories. AC maintained 44% in the high category in the near future and 40% in the far future. RO remains in the low category with 29% in the near future and 28% of municipalities in the far future. MT shows 32% of municipalities in the very low category in the near future and 31% in the low category in the far future. The very low category prevails in AP with 36% in the near future and 35% in the far future. TO is also in the very low category with 49% in the near and 48% in the far future. Such information is most important in terms of application for disaster risk management, as it focuses on the most relevant results in each Amazonian state.
The integrated perspective of all components is very interesting to analyze in the scatter plot in Figure 9. The disaster risk R curve can be interpreted by the polynomial trend line between the component V (vulnerability) and the combination of component H (hazard climate extremes) multiplied by component E (population exposure), as shown in Figure 9. This integrated analysis demonstrates in quantitative terms an intensification of R from the near future (2015 to 2039) to the far future (2040 to 2064). In the near future, the risk curve slopes positively with a smaller trend and an R2 of 0.393 in SSP2-4.5 and a much higher R2 of 0.507 in SSP5-8.5. Subsequently, in the far future, the diagonally positive R curve with R2 of 0.506 in SSP2-4.5 increases significantly to the most extreme position with an R2 of 0.523.

4. Conclusions and Recommendation

Based on an integrated assessment approach of the risk R of natural disasters resulting from component H (hazard climate extremes associated with drought and flood episodes) from the latest future scenarios of climate change projections made by GCMs available in CMIP6 (we used a set of the best models validated for the Amazon), component E (exposure of the affected/impacted population), and component V (subdimensions of susceptibility and coping/adaptive capacity obtained from multiple social, economic, environmental and local infrastructure indicators), with these two later components from the current data provided by the official IBGE 2022 Census, this work concludes the following two fundamental points:
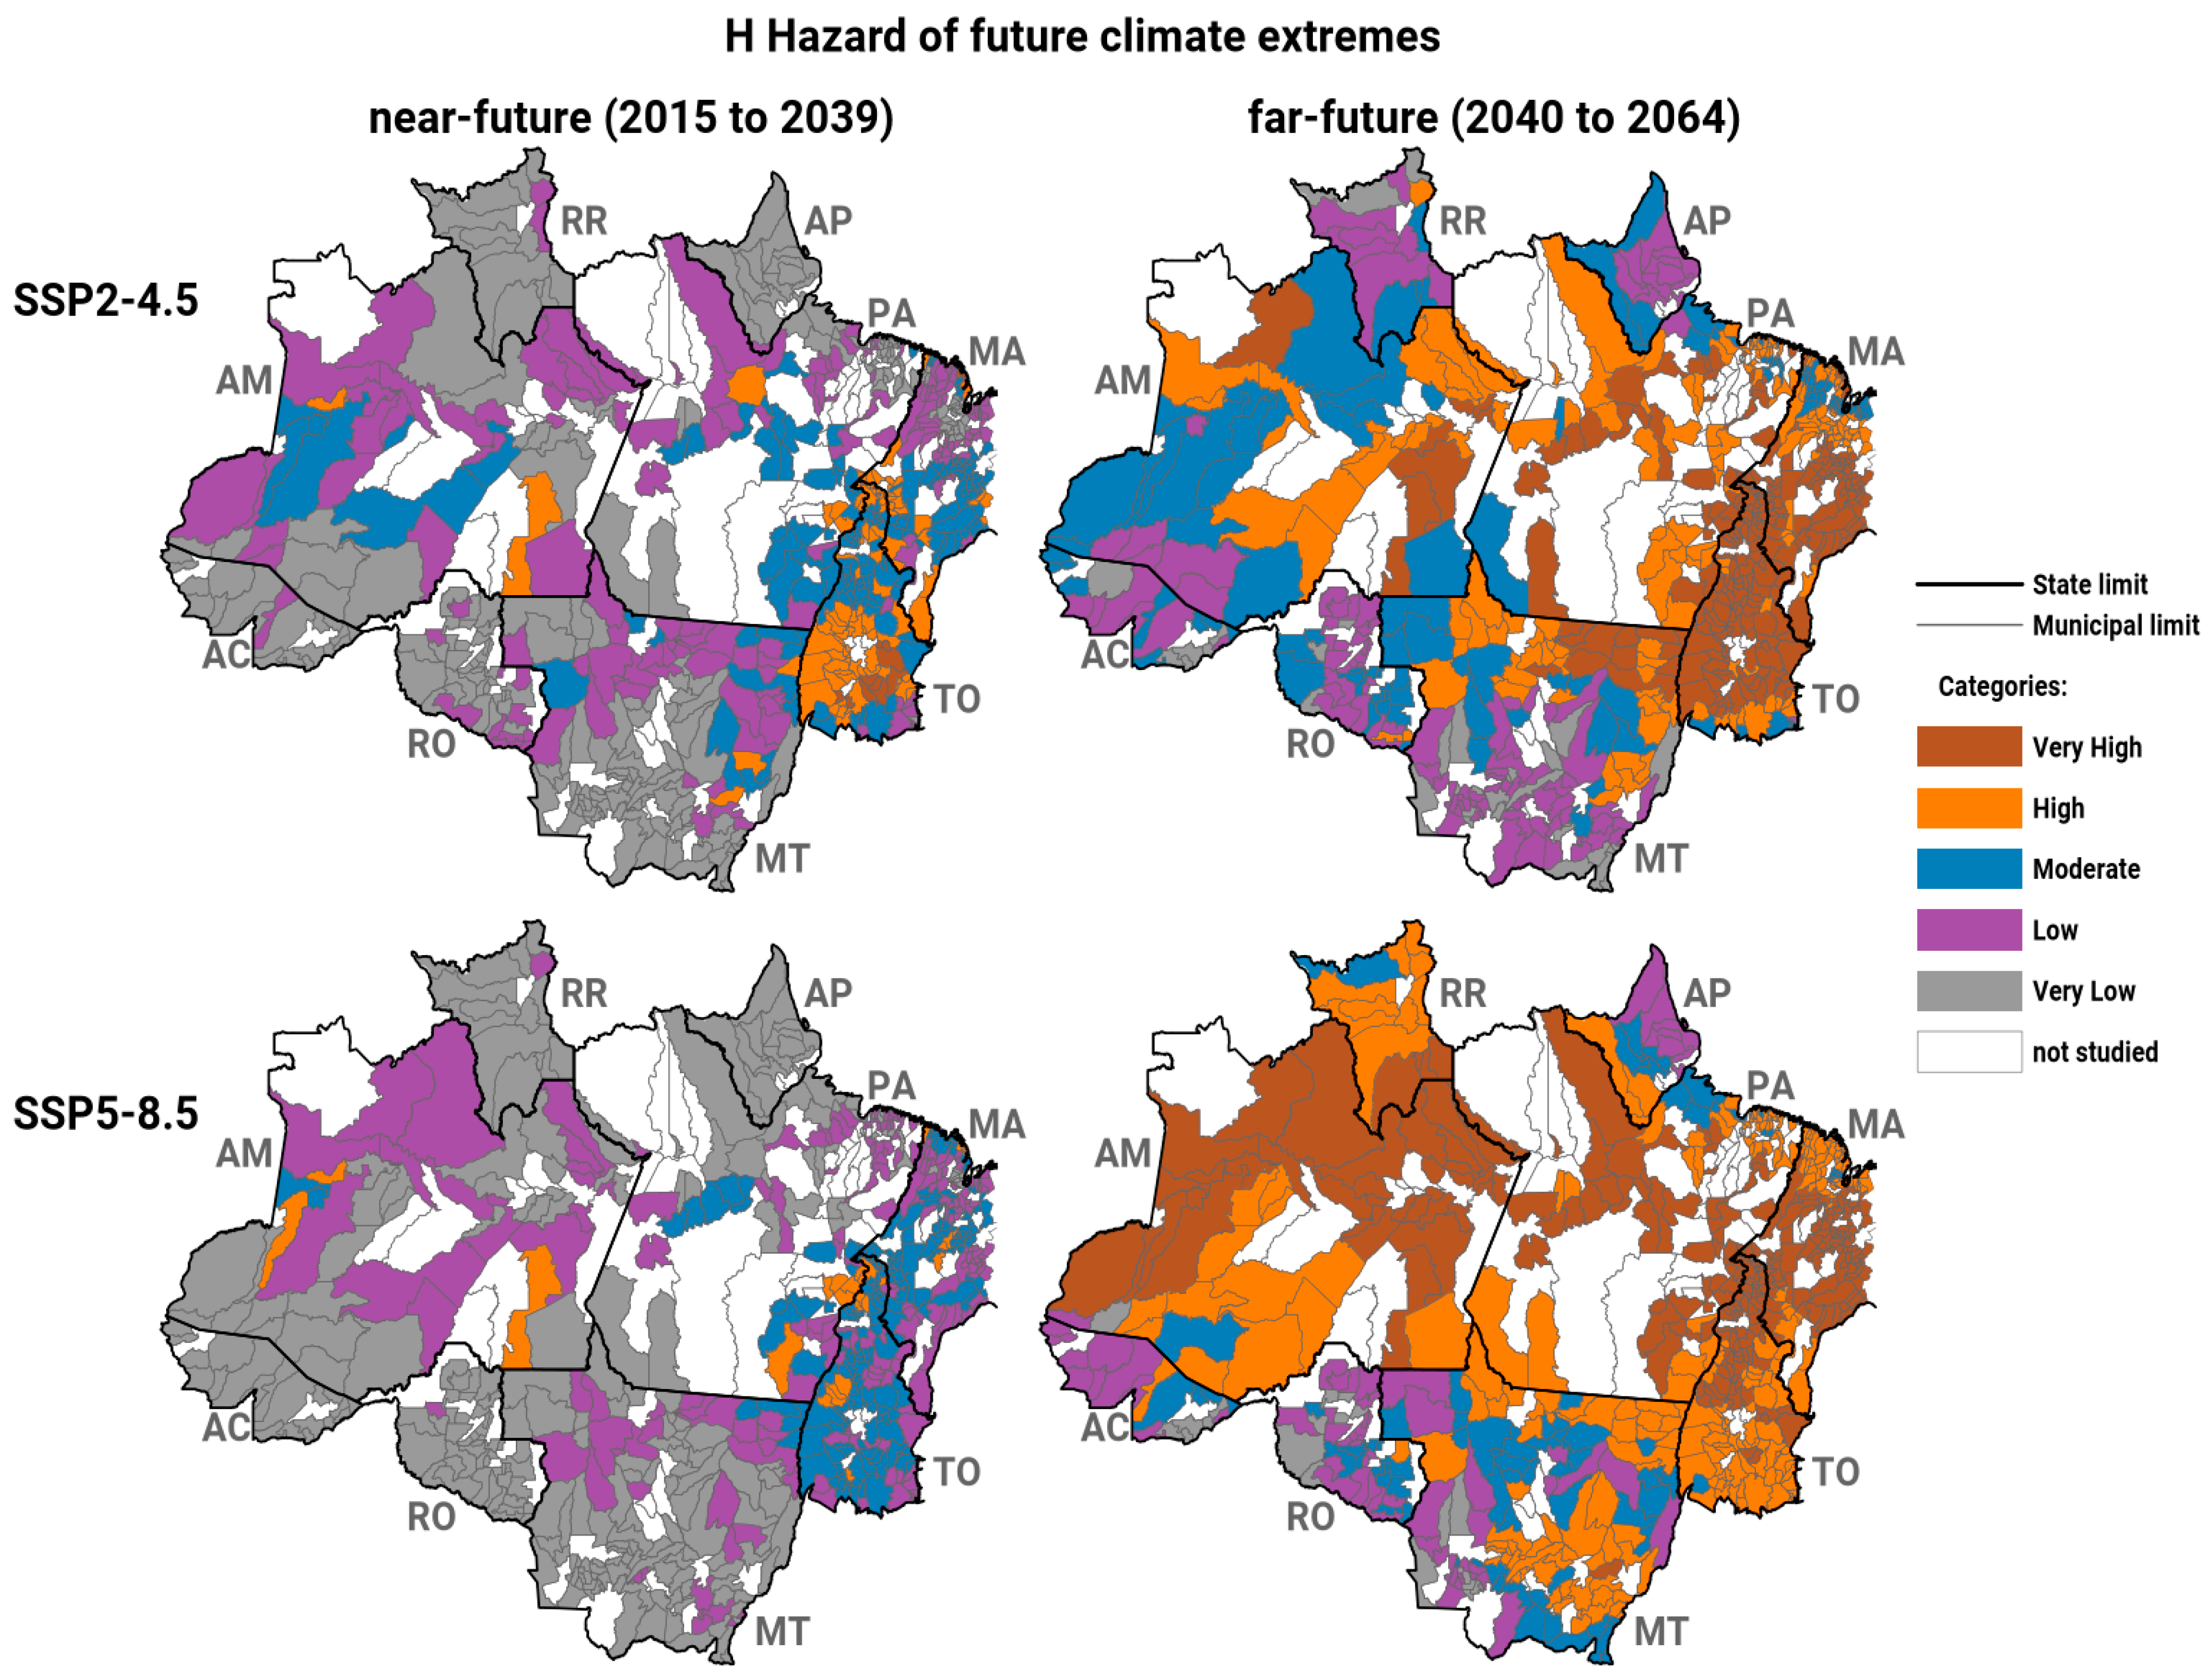
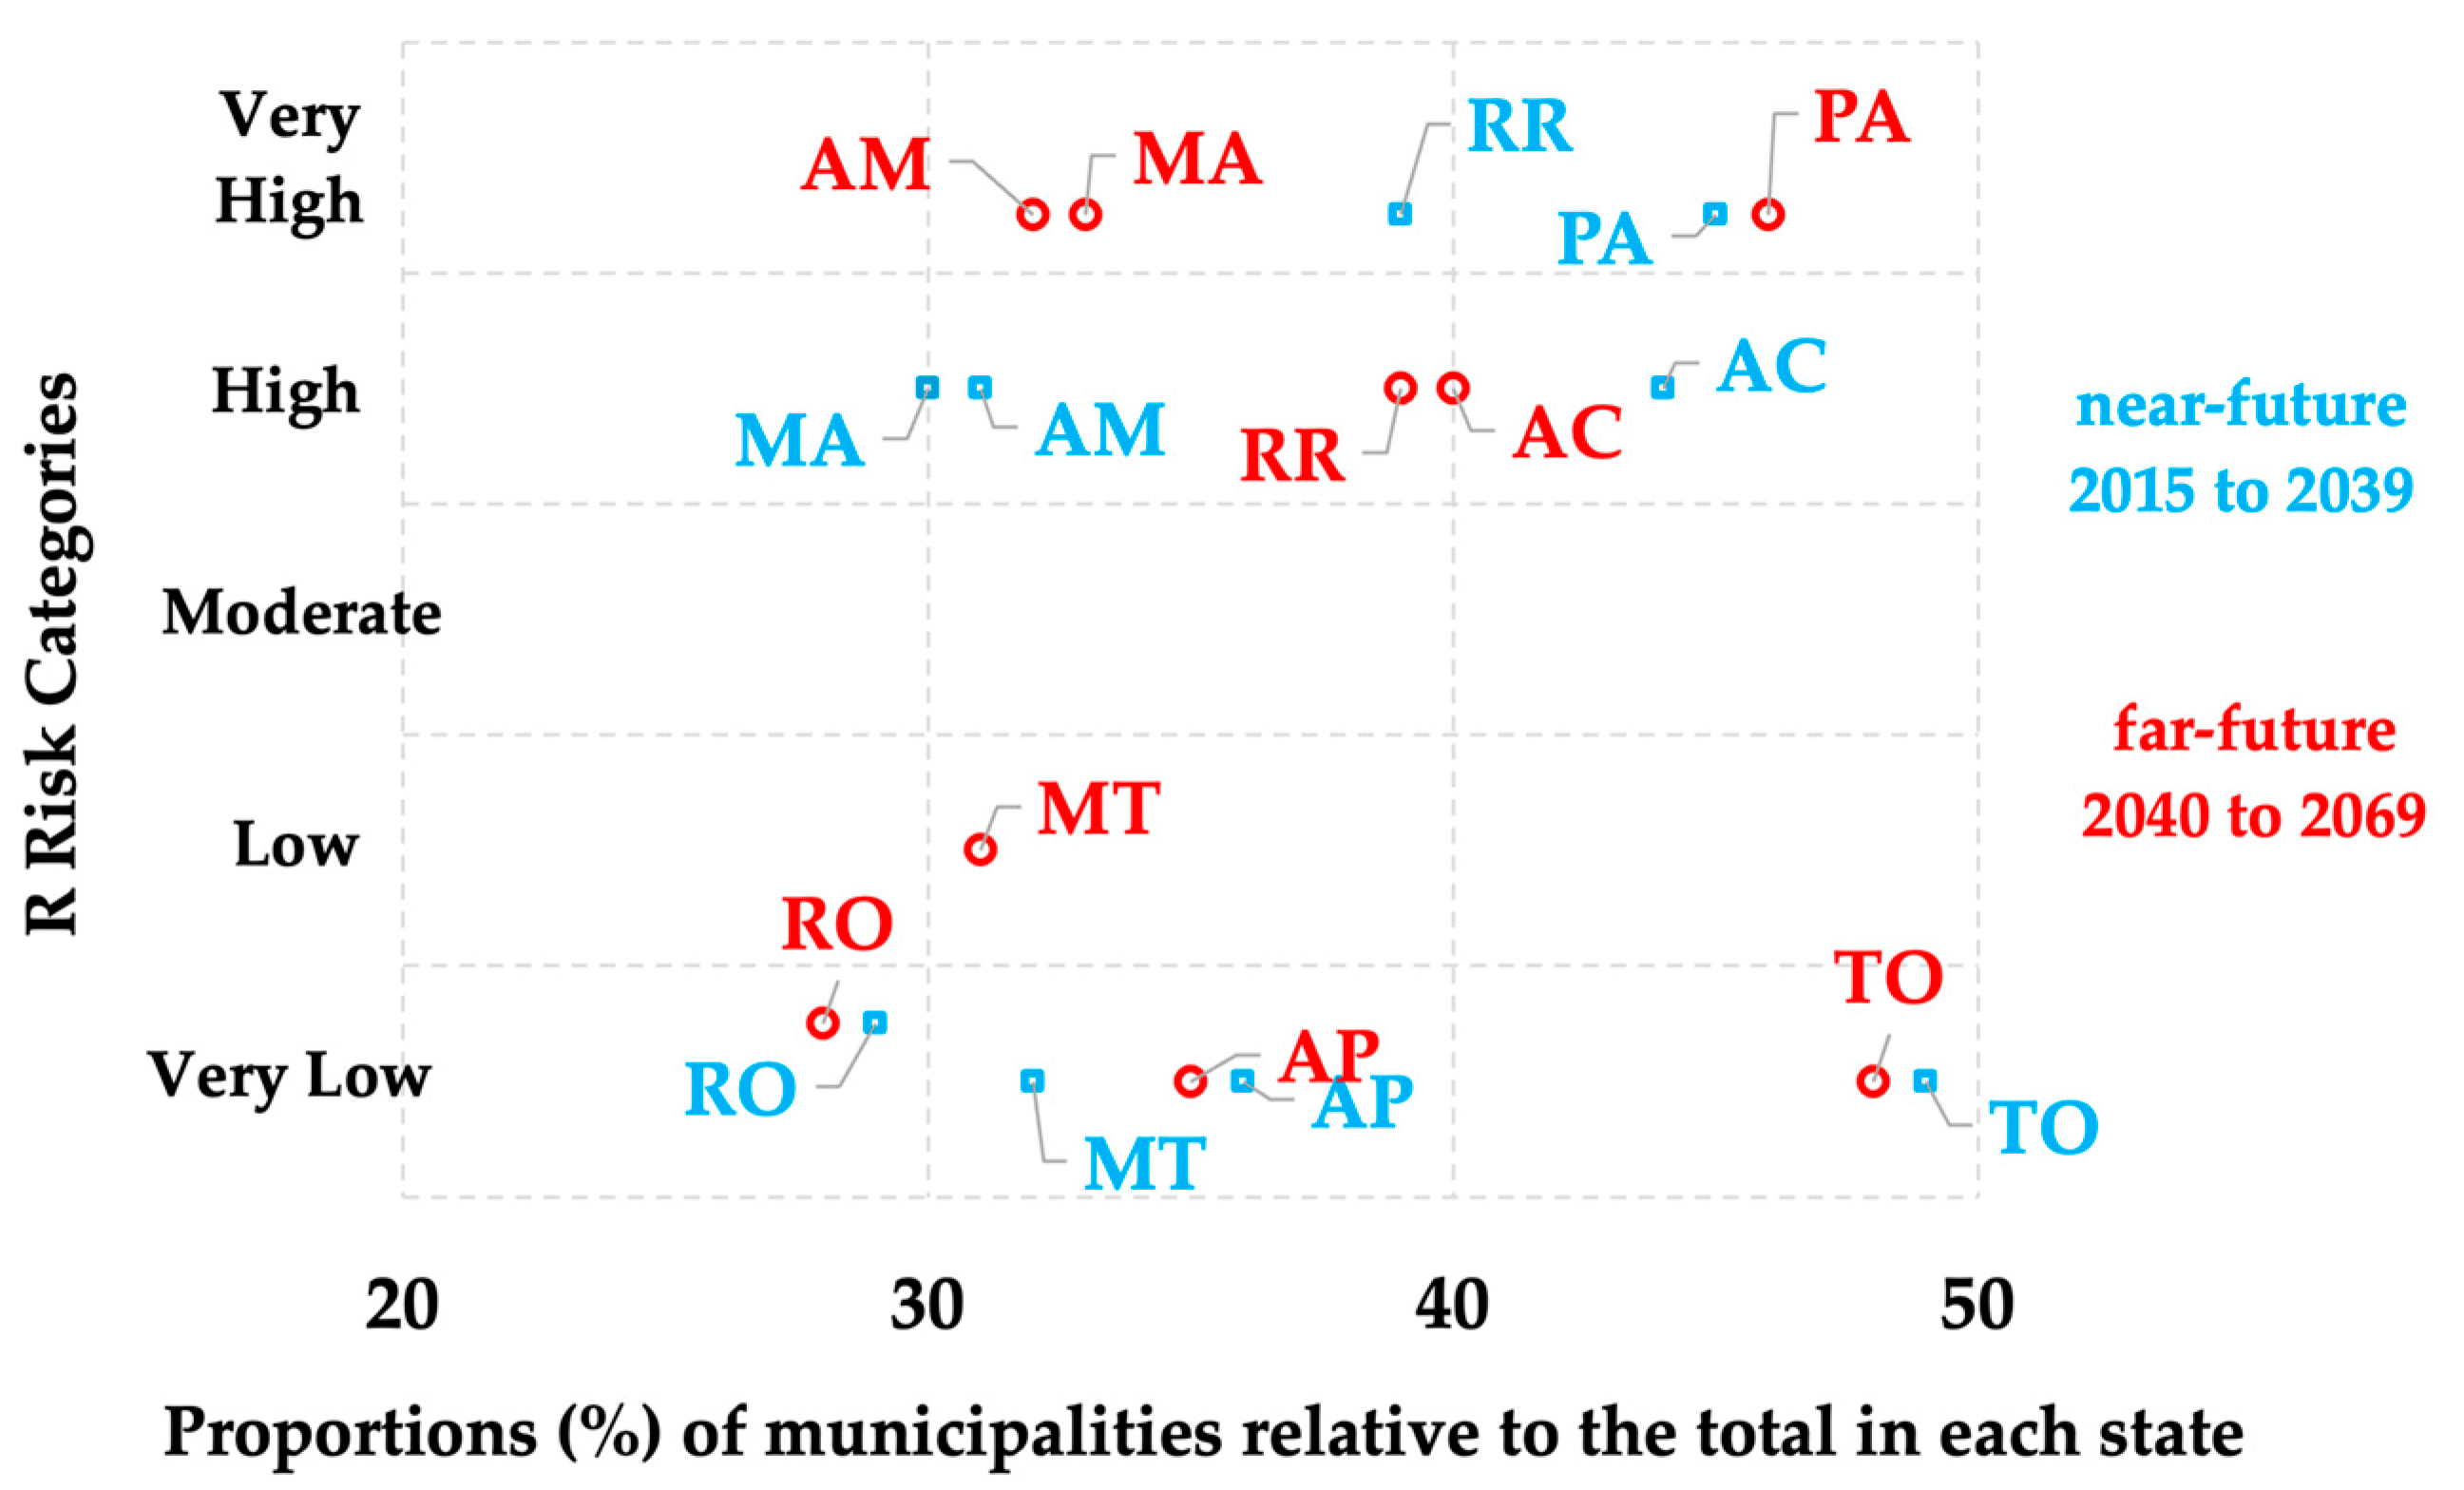
  • The curve of R of natural disasters throughout the territory of small municipalities in the Amazon will intensify significantly over the next two 25-year periods. Although there is a high intra-municipal spatial variation, the overall results of the highest proportions of R (total municipalities affected) by state indicate that for AM, RR, PA, and MA, the prevailing categories are high and very high in the near and far future. The state of AC prevails in the moderate category in both the future periods, and the states RO, MT and AP move from category very low to low in the near to the far future.
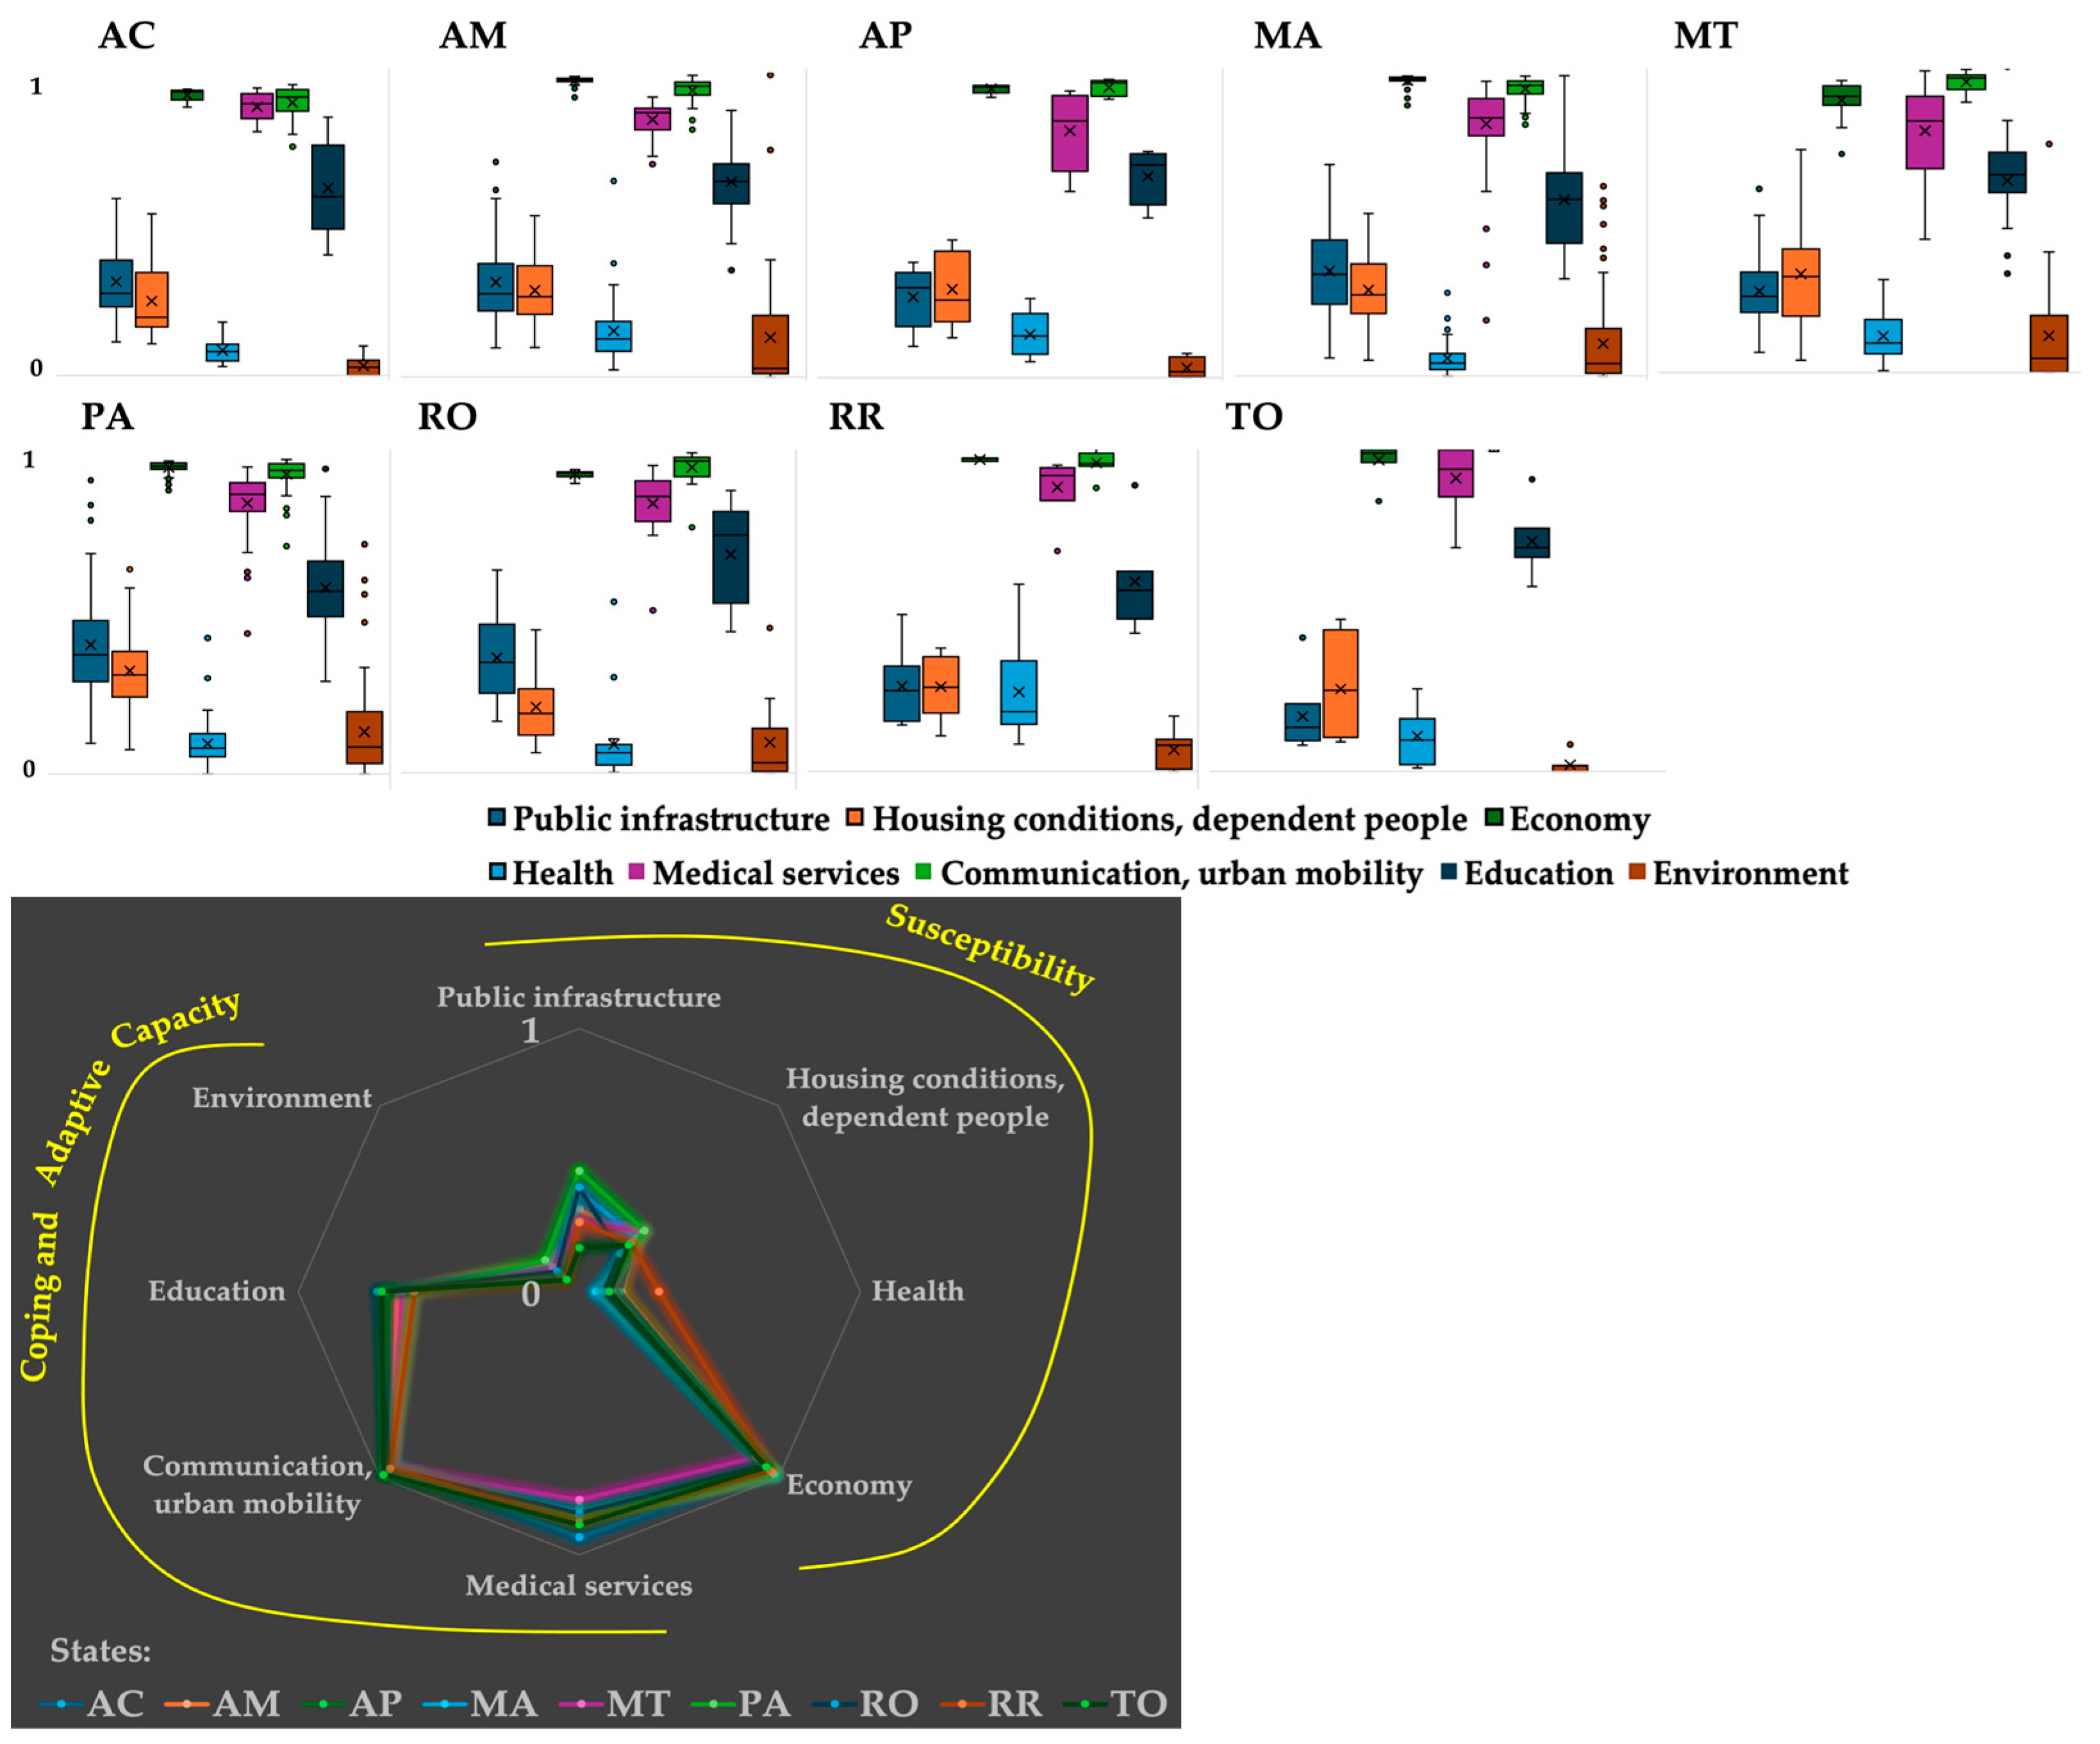
  • The detailed assessment of component V allowed us to elucidate that the economy indicator is the most serious in the scope of susceptibility, followed by indicators portraying the precariousness of urban infrastructure (households with problems in the supply of potable water, waste disposal, and sanitary sewage). Likewise, health (low availability of medical beds and hospitals), digital communication (access to broadband internet), and urban mobility (public transport) indicators, whose services are the most used by the population in the face of a climate emergency, also contributed negatively to the unfavorable situation of municipal vulnerability. These combined factors, unfortunately, reveal a widespread poverty profile among the small Amazonian municipalities, highlighting the need for greater public investments.
Therefore, our objective assessment highlighted the worrying and imminent threat of extreme phenomena exacerbated by climate change, as well as indicating a strong dependence on social and economic aspects that significantly aggravate the degree of vulnerability, thus implying an intensified disaster risk curve. Given this finding, it is crucial for all countries to meet Sustainable Development Goals, as a way of implementing aspects of mitigation and adaptation in the face of the intensification of climate extremes on a warmer planet [34]. An obvious option, that can bring positive results in the short to medium term, to reduce or flatten the risk curve is the implementation of effective strategic planning and decision-making actions by the government sector (municipal, state, and national), which is responsible for public policies to minimize and mitigate climate change. Thus, as a way of contributing scientific information for applications in the aforementioned government actions, it is convenient to point out a ranking of the top 10 municipalities in each state (highest R) that have the greatest chance of suffering negatively in the future. So, as a final recommendation in this work, we suggest that the results of the SSP5-8.5 scenario should only be considered for the near future period (2015 to 2039), whose time scale may be plausible for targeted strategy planning, as policies in Brazil are eminently pluriannual (maximum 5 years ahead). Figure 10 shows the mapped geographic locations of the top 10 municipalities, with Table 3 indicating the respective names and quantitative values of the components E, V, and R, which we consider to be priorities (from the point of view of scientific findings) in each Amazonian state.

Author Contributions

Conceptualization, methodology, formal analysis, E.B.d.S.; writing—original draft preparation, E.B.d.S., J.d.A.S.J., D.B.S.F. and T.A.; writing—review and editing, E.B.d.S., B.C.S.S., E.M.F.S., M.J.B.R., A.C.C., P.J.P.O.S., L.P.P., E.J.P.d.R., A.M.L.S., J.d.A.S.J., A.M.C.d.C., D.B.S.F., A.M.M.L., F.A.A.d.S., B.C.M., M.d.L.P.R., P.M.T. and T.A. All authors have read and agreed to the published version of the manuscript.

Funding

This research was supported by CNPQ processes 420142/2023-1 and 442261/2020-9, and the Universidade Federal do Pará (UFPA).

Data Availability Statement

Databases with respective sources and references were described in the Materials and Methods section.

Acknowledgments

B.C.S.S., E.M.F.S. and M.J.B.R. thank CAPES and CNPq for the scholarships. The authors thank CNPQ for support in research projects and scientific productivity fellow: A.M.M.L. (308770/2022-6), M.L.P.R. (307534/2021-9), A.M.L.S. (409167/2023-1), P.J.P.d.S (311681/2022-0), T.A. (304298/2014-0 and 301397/2019-8), and L.P.P. (CNPq/PROANTAR 443013/2018-7, ATMOS 2 CNPq/PROANTAR 440848/2023-7, and 303981/2023-7).

Conflicts of Interest

The authors declare no conflicts of interest.

Appendix A

Table A1. List of CMIP6 GCMs used in this work.
GCMsAcronymCountry
1ACCESS-CM2Australia
2ACCESS-ESM1-5Australia
3BCC-CSM2-MRChina
4CNRM-CM6-1-HRFrance
5CNRM-CM6-1France
6CNRM-ESM2-1France
7CanESM5Canada
8EC-Earth3-VegEurope
9EC-Earth3Europe
10GFDL-CM4USA
11GFDL-ESM4USA
12HadGEM3-GC31-LLUK
13INM-CM4-8Russia
14INM-CM5-0Russia
15KACE-1-0-GKorea
16KIOST-ESMKorea
17MIROC-ES2LJapan
18MIROC6Japan
19MPI-ESM1-2-HRGermany
20MPI-ESM1-2-LRGermany
21MRI-ESM2-0Japan
22NESM3China
23NorESM2-MMNorway
24UKESM1-0-LLUK
In Table A2, taking into account the highest proportions, it is possible to highlight some important points in each state. AC displays R moderate in proportions of 50% and 36% in the near future and moderate 40% and high 40% in the far future in the SSP2-4.5 and SSP5-8.5 scenarios, respectively. AM presents R high in the proportion of 32% and high and very high both with 32% in the near future and moderate 30% and very high 34% in the far future in SSP2-4.5 and SSP5-8.5, respectively. In the state of AP, the R is very low with proportions of 43% and 29%, verified in both future periods in SSP2-4.5 and SSP5-8.5, respectively. The MA reveals R moderate with 30% and very high with 31% in the near future and high 29% very high 36% in the far future in SSP2-4.5 and SSP5-8.5, respectively. MT shows R very low with 35% and 28% in the near future and R very low with 36% and moderate with 29% in the far future in SSP2-4.5 and SSP5-8.5, respectively. The state of PA presents R high in the proportion of 37% and very high with 53% in the near future and R high with 37% and very high with 55% in the far future in SSP2-4.5 and SSP5-8.5, respectively. RO reveals R very low with 31% low with 27% in the near future and R very low with 33% and low with 23% in the far future in SSP2-4.5 and SSP5-8.5, respectively. RR shows a higher proportion of R high with 43% and very high with 36% in the near future and R high with 43% and R high and very high both with 36% in the far future in SSP2-4.5 and SSP5-8.5, respectively. In the state of TO, a proportion of 54% and 43% is noted in R very low in the near future and R very low with 57% and 41% in the far future in SSP2-4.5 and SSP5-8.5, respectively.
Table A2. Proportions of the number of municipalities in each respective state according to the R categories in the near and far future for SSP2-4.5 and SSP5-8.5 scenarios. Colors from white to gray to magenta indicate the increasing variation in %.
Near-Future (2015 to 2039)Far-Future (2040 to 2064)
SSP2-4.5SSP5-8.5SSP2-4.5SSP5-8.5
Very HighHighModerateLowVery LowVery HighHighModerateLowVery LowVery HighHighModerateLowVery LowVery HighHighModerateLowVery Low
AC15%10%50%20%5%15%35%35%15%0%10%15%40%30%5%15%40%30%15%0%
AM20%32%30%18%0%32%32%28%8%0%20%28%30%22%0%34%32%32%2%0%
AP7%7%14%29%43%14%7%21%29%29%0%14%14%29%43%14%7%21%29%29%
MA20%27%30%16%6%31%29%23%15%2%17%28%29%20%6%36%26%21%15%2%
MT10%10%20%24%35%15%9%24%24%28%8%13%19%25%36%17%9%29%21%25%
PA33%37%15%11%4%53%26%11%9%1%29%37%19%11%4%55%25%10%9%1%
RO11%16%16%27%31%18%20%11%27%24%7%20%13%27%33%20%17%18%24%21%
RR7%43%21%29%0%36%29%7%29%0%7%43%21%29%0%35%37%7%21%0%
TO3%5%11%26%54%6%7%12%31%43%2%5%12%24%57%7%8%12%32%41%

References

  1. Trenberth, K.; Fasullo, J.; Shepherd, T. Attribution of climate extreme events. Nat. Clim. Chang. 2015, 5, 725–730. [Google Scholar] [CrossRef]
  2. Vogel, M.; Hauser, M.; Seneviratne, S. Projected changes in hot, dry and wet extreme events’ clusters in CMIP6 multi-model ensemble. Environ. Res. Lett. 2020, 15, 094021. [Google Scholar] [CrossRef]
  3. Gu, L.; Chen, J.; Yin, J.; Slater, L.J.; Wang, H.M.; Guo, Q.; Feng, M.; Qin, H.; Zhao, T. Global increases in compound flood-hot extreme hazards under climate warming. Geophys. Res. Lett. 2022, 49, e2022GL097726. [Google Scholar] [CrossRef]
  4. Zhou, S.; Yu, B.; Zhang, Y. Global concurrent climate extremes exacerbated by anthropogenic climate change. Sci. Adv. 2023, 9, eabo1638. [Google Scholar] [CrossRef]
  5. IPCC. Managing the Risks of Extreme Events and Disasters to Advance Climate Change Adaptation. A Special Report of Working Groups I and II of the Intergovernmental Panel on Climate Change; Field, C.B., Barros, V., Stocker, T.F., Qin, D., Dokken, D.J., Ebi, K.L., Mastrandrea, M.D., Mach, K.J., Plattner, G.-K., Allen, S.K., et al., Eds.; Cambridge University Press: Cambridge, UK; New York, NY, USA, 2012; p. 582. [Google Scholar]
  6. Hummell, B.M.L.; Cutter, S.L.; Emrich, C.T. Social Vulnerability to Natural Hazards in Brazil. Int. J. Disaster Risk Sci. 2016, 7, 111–122. [Google Scholar] [CrossRef]
  7. Reboita, M.S.; Kuki, C.A.C.; Marrafon, V.H. South America climate change revealed through climate indices projected by GCMs and Eta-RCM ensembles. Clim. Dyn. 2022, 58, 459–485. [Google Scholar] [CrossRef]
  8. Vieira, R.M.d.S.P.; Sestini, M.F.; Tomasella, J.; Marchezini, V.; Pereira, G.R.; Barbosa, A.A.; Santos, F.C.; Rodriguez, D.A.; Nascimento, F.R.D.; Santana, M.O.; et al. Characterizing spatio-temporal patterns of social vulnerability to droughts, degradation and desertification in the Brazilian northeast. Environ. Sustain. Indic. 2020, 5, 100016. [Google Scholar] [CrossRef]
  9. Confalonieri, U.E.C.; Lima, A.C.L.; Brito, I.; Quintão, A.F. Social, environmental and health vulnerability to climate change in the Brazilian Northeastern Region. Clim. Chang. 2014, 127, 123–137. [Google Scholar] [CrossRef]
  10. Dobkowitz, S.; Walz, A.; Baroni, G.; Pérez-Marin, A.M. Cross-Scale Vulnerability Assessment for Smallholder Farming: A Case Study from the Northeast of Brazil. Sustainability 2020, 12, 3787. [Google Scholar] [CrossRef]
  11. Marengo, J.A.; Torres, R.R.; Alves, L.M. Drought in Northeast Brazil—Past, present, and future. Theor. Appl. Climatol. 2017, 129, 1189–1200. [Google Scholar] [CrossRef]
  12. Zeng, N.; Yoon, J.-H.; Marengo, J.A.; Subramaniam, A.; Nobre, C.A.; Mariotti, A.; Neelin, J.D. Causes and impacts of the 2005 amazon drought. Environ. Res. Lett. 2008, 3, 014002. [Google Scholar] [CrossRef]
  13. Marengo, J.A.; Tomasella, J.; Alves, L.M.; Soares, W.R.; Rodriguez, D.A. The drought of 2010 in the context of historical droughts in the amazon region. Geophys. Res. Lett. 2011, 38, L12703. [Google Scholar] [CrossRef]
  14. Correa, S.H.; Paiva, R.C.D.; Espinoza, J.C.; Collischonn, W. Multi-decadal Hydrological Retrospective: Case study of Amazon floods and droughts. J. Hydrol. 2017, 549, 667–684. [Google Scholar] [CrossRef]
  15. Satyamurty, P.; Costa, C.P.W.; Manzi, A.O.; Candido, L.A. A quick look at the 2012 record flood in the Amazon basin. Geophys. Res. Lett. 2013, 40, 1396–1401. [Google Scholar] [CrossRef]
  16. Towner, J.; Cloke, H.L.; Lavado, W.; Santini, W.; Bazo, J.; de Perez, E.C.; Stephens, E.M. Attribution of Amazon floods to modes of climate variability: A review. Meteorol. Appl. 2020, 27, e1949. [Google Scholar] [CrossRef]
  17. Espinoza, J.C.; Marengo, J.; Schongart, J.; Jimenez, J.C. The new historical flood of 2021 in the Amazon River compared to major floods of the 21st century: Atmospheric features in the context of the intensification of floods. Weather. Clim. Extrem. 2022, 35, 100406. [Google Scholar] [CrossRef]
  18. Mansur, A.V.; Brondízio, E.S.; Roy, S.; Hetrick, S.; Vogt, N.D.; Newton, A. An assessment of urban vulnerability in the Amazon Delta and Estuary: A multi-criterion index of flood exposure, socio-economic conditions and infrastructure. Sustain. Sci. 2016, 11, 625–643. [Google Scholar] [CrossRef]
  19. Almeida, L.Q.; Welle, T.; Birkmann, J. Disaster risk indicators in Brazil: A proposal based on the world risk index. Int. J. Disaster Risk Reduct. 2016, 17, 251–272. [Google Scholar] [CrossRef]
  20. IBGE—Instituto Brasileiro de Geografia e Estatística. Censo Demográfico 2022; IBGE: Brasília, Brazil, 2023. Available online: https://sidra.ibge.gov.br/pesquisa/censo-demografico/demografico-2022 (accessed on 1 December 2023).
  21. Eyring, V.; Bony, S.; Meehl, G.A.; Senior, C.A.; Stevens, B.; Stouffer, R.J.; Taylor, K.E. Overview of the Coupled Model Inter-comparison Project Phase 6 (CMIP6) experimental design and organization. Geosci. Model. Dev. 2016, 9, 1937–1958. [Google Scholar] [CrossRef]
  22. Cutter, S.L.; Boruff, B.J.; Shirley, W.L. Social vulnerability to environmental hazards. Soc. Sci. Q. 2003, 84, 242–261. Available online: http://www.jstor.org/stable/42955868 (accessed on 11 December 2023). [CrossRef]
  23. AdaptaBrasil, 2022. Documento Teórico-Metodológico Para Avaliação De Risco De Impacto De Mudança Climática Nos Setores Estratégicos De Recursos Hídricos E Segurança Alimentar da Plataforma AdaptaBrasil MCTI—Versão 1.1. Available online: https://adaptabrasil.mcti.gov.br/sobre/metodologia (accessed on 10 June 2022).
  24. Sandstad, M.; Schwingshackl, C.; Iles, C. Climate Extreme Indices and Heat Stress Indicators Derived from CMIP6 Global Climate Projections. Copernicus Climate Change Service (C3S) Climate Data Store (CDS). 2022. Available online: https://cds.climate.copernicus.eu/cdsapp#!/dataset/10.24381/cds.776e08bd?tab=overview (accessed on 10 November 2023).
  25. Funk, C.; Peterson, P.; Landsfeld, M.; Pedreros, D.; Verdin, J.; Shukla, S.; Husak, G.; Rowland, J.; Harrison, L.; Hoell, A.; et al. The climate hazards infrared precipitation with stations—A new environmental record for monitoring extremes. Sci. Data 2015, 2, 150066. [Google Scholar] [CrossRef]
  26. Chen, M.W.; Shi, P.; Xie, V.B.; Silva, V.E.; Kousky, R.; Higgins, W.; Janowiak, J.E. Assessing objective techniques for gauge-based analyses of global daily precipitation. J. Geophys. Res. 2008, 113, D04110. [Google Scholar] [CrossRef]
  27. Monteverde, C.; De Sales, F.; Jones, C. Evaluation of the CMIP6 Performance in Simulating Precipitation in the Amazon River Basin. Climate 2022, 10, 122. [Google Scholar] [CrossRef]
  28. Alexander, L.V.; Zhang, X.; Peterson, T.C.; Caesar, J.; Gleason, B.; Tank, A.M.G.K.; Haylock, M.; Collins, D.; Trewin, B.; Rahimzadeh, F.; et al. Global observed changes in daily climate extremes of temperature and precipitation. J. Geophys. Res. 2006, 111, D05109. [Google Scholar] [CrossRef]
  29. Taylor, K.E. Summarizing multiple aspects of model performance in a single diagram. J. Geophys. Res. 2001, 106, 7183–7192. [Google Scholar] [CrossRef]
  30. Medeiros, F.J.; Oliveira, C.P.; Diaz, A.A. Evaluation of extreme precipitation climate indices and their projected changes for Brazil: From CMIP3 to CMIP6. Weather. Clim. Extrem. 2022, 38, 100511. [Google Scholar] [CrossRef]
  31. Funatsu, B.M.; Le Roux, R.; Arvor, D.; Espinoza, J.C.; Claud, C.; Ronchail, J.; Michot, V.; Dubreuil, V. Assessing precipitation extremes (1981–2018) and deep convective activity (2002–2018) in the Amazon region with CHIRPS and AMSU data. Clim. Dyn. 2021, 57, 827–849. [Google Scholar] [CrossRef]
  32. Ferreira, G.W.d.S.; Reboita, M.S.; Ribeiro, J.G.M.; de Souza, C.A. Assessment of Precipitation and Hydrological Droughts in South America through Statistically Downscaled CMIP6 Projections. Climate 2023, 11, 166. [Google Scholar] [CrossRef]
  33. Debortoli, N.S.; Camarinha, P.I.M.; Marengo, J.A.; Rodrigues, R.R. An index of Brazil’s vulnerability to expected increases in natural flash flooding and landslide disasters in the context of climate change. Nat. Hazards 2017, 86, 557–582. [Google Scholar] [CrossRef]
  34. IPCC. Summary for Policymakers. In Climate Change 2023: Synthesis Report. Contribution of Working Groups I, II and III to the Sixth Assessment Report of the Intergovernmental Panel on Climate Change; Core Writing Team, Lee, H., Romero, J., Eds.; IPCC: Geneva, Switzerland, 2023; pp. 1–34. [Google Scholar] [CrossRef]
Figure 1. (a) Map of the study area highlighting the small municipalities (in green) and its municipal seats (red circles) in the BLA region, (b) total number of municipalities and respective percentage by state, (c) frequency distribution of demographic density (in blue) and urbanized area (in red) of the 671 municipalities. Acronyms indicate the nine states (AC—Acre, AM—Amazonas, AP—Amapá, MA—Maranhão, west of 44° W, MT—Mato Grosso, PA—Pará, RO—Rondônia, RR—Roraima and TO—Tocantins).
Climate 12 00095 g001
Figure 2. Flowchart of methodological procedures adopted for integrated risk assessment.
Climate 12 00095 g002
Figure 3. Components E and V in the small municipalities over BLA, considering the distribution in five intensity categories (color scale). The acronyms of the nine states are placed alongside.
Climate 12 00095 g003
Figure 4. Boxplots (top) and radar (bottom) of the indicators of S and C for the sets of municipalities categorized with V very high and high in each state.
Climate 12 00095 g004
Figure 5. (Top) TSS for 24 GCMs with blue bars highlighting the best models; (bottom) original spatial patterns of CDD, WSDI, RX5Day and R95p for observations and simulations (MME using best CMIP6 GCMs) for the present climate (1990 to 2014).
Climate 12 00095 g005
Figure 6. Component H considering WET and DRY/HOT extremes in the near and far future for SSP2-4.5 and SSP5-8.5 scenarios. Color scale indicates the distribution in five intensity categories. The acronyms of the nine states are placed alongside.
Climate 12 00095 g006
Figure 7. Risk map of natural disasters in the near and far future for SSP2-4.5 and SSP5-8.5 scenarios. The acronyms of the nine states are placed alongside.
Climate 12 00095 g007
Figure 8. Average values between SSP2-4.5 and SSP5-8.5 for the category containing the highest proportion of municipalities for each Amazonian state in the near and far future.
Climate 12 00095 g008
Figure 9. Scatterplot of V versus H × E in the near- and far-future for the SSP2-4.5 and SSP5-8.5 scenarios. The disaster risk curve is indicated by the colored lines.
Climate 12 00095 g009
Figure 10. Locations of municipalities in each state in the top 10 ranking with the highest R in the SSP5-8.5 near future scenario. Numbers indicate the position in the rank and the names of the municipalities are given in Table 3. Acronyms of the nine states are placed alongside.
Climate 12 00095 g010
Table 1. List of all indicators and variables used to calculate the components E, V and H.
Components, Sub-Dimensions, Themes, Variables/Indicators and UnitsAcronymReference Year, Source
Component E
    Total population (inhabitants)TP2022, IBGE Census
    Demographic density (inhabitants/km2)DD2022, IBGE Census
    Urbanized area (km2)UA2019, IBGE
Component V
Sub-dimension S Susceptibility
  Public infrastructure
    Households by type of sewage system: rudimentary septic tank/hole, ditch, river, lake,
    stream or sea, without bathroom (total)
SW2022, IBGE Census
    Households by type of waste destination: burned or buried on the property; played on
    vacant land or public area (total)
WD2022, IBGE Census
    Households by form of water supply: no connection to general network (total)WS2022, IBGE Census
  Housing conditions and dependent people
    Housing in a rooming house or tenement; residence unfinished (total)HO2022, IBGE Census
    Children 0 to 4 years (total)CH2022, IBGE Census
    Elderly people over 65 years old (total)EL2022, IBGE Census
  Health (illnesses and family losses)
    Incidence of malariaMA2018/2022, DATASUS
    Mortality from COVID-19 (accumulated people)MC2020/2021, DATASUS
  Economy
    GDP per capita (Thousand BRL/inhabitants)GP2021, IBGE
C Coping/Adaptive Capacity
  Medical services
    Number of hospital beds (total)HB2022, DATASUS
    Number of physicians (total)NP2022, DATASUS
  Digital communication and urban mobility
    Broadband Internet (access/100 homes)BI2019, IBGE
    Public transport (total buses/1000 inhabitants)PT2019, IBGE
  Education
    IDEB Elementary Education—final years (concept)ED2021, MEC/INEP
  Environment
    Accumulated deforestation (km2)DE2000/2022, INPE
  Existence of a civil defense department and specific legislation
    Municipal civil defense coordination or secretariat or fire department (yes/no)CD2019, IBGE
    Public policy plan with municipal law instrument for planning and managing
    environmental disaster risks (yes/no)
IN2019, IBGE
Component H
  Climate extremes associated with droughts and heat waves
    Relative changes of CDD for near and far futureC_CDDFuture, CMIP6 GCMs
    Relative changes of WSDI for near and far futureC_WSDIFuture, CMIP6 GCMs
  Climate extremes associated with floods and inundations
    Relative changes of R95p for near and far futureC_R95pFuture, CMIP6 GCMs
    Relative changes of RX5day for near and far futureC_RX5dayFuture, CMIP6 GCMs
Table 2. Percentages (relative to the total 671) of the number of municipalities in each state and intensity category of components E and V. Colors from white to gray to magenta indicate the increasing variation in %.
E Exposure CategoriesV Vulnerability Categories
StatesVery HighHighModerateLowVery LowVery HighHighModerateLowVery Low
AC0.6%0.9%0.7%0.7%0.0%0.9%1.2%0.7%0.1%0.0%
AM1.9%2.1%2.4%1.0%0.0%3.0%2.5%1.0%0.7%0.1%
AP0.3%0.3%0.4%0.6%0.4%0.3%0.4%0.3%0.6%0.4%
MA5.4%7.0%6.3%4.8%1.0%6.0%5.8%7.3%3.9%1.5%
MT3.4%1.8%4.3%4.5%5.1%0.7%3.1%3.1%5.4%6.7%
PA6.4%4.6%2.5%1.3%0.3%7.3%3.6%2.5%1.2%0.6%
RO1.2%1.2%1.2%1.8%1.3%1.3%1.8%1.8%0.9%0.9%
RR0.7%0.7%0.1%0.4%0.0%0.6%0.4%0.6%0.4%0.0%
TO0.6%0.9%2.1%4.8%11.6%0.1%0.9%3.4%6.0%9.5%
Table 3. List of the top 10 ranking municipalities in each state that presented the highest R in the SSP5-8.5 near future scenario.
StateRankMunicipalityE × HVRStateRankMunicipalityE × HVR
AC1Tarauacá0.170.600.09AM1São Paulo de Olivença0.220.580.12
2Sena Madureira0.150.570.08 2Autazes0.260.610.11
3Feijó0.160.600.08 3Benjamin Constant0.180.570.11
4Senador Guiomard0.100.530.05 4Barreirinha0.160.590.11
5Mâncio Lima0.100.540.05 5Lábrea0.180.610.10
6Acrelândia0.080.500.04 6Presidente Figueiredo0.190.570.10
7Brasiléia0.080.490.04 7Boca do Acre0.190.570.09
8Porto Acre0.090.510.04 8Santo Antônio do Içá0.160.560.09
9Bujari0.090.500.04 9Borba0.170.610.09
10Marechal Thaumaturgo0.080.530.04 10Eirunepé0.160.570.08
AP1Laranjal do Jari0.150.540.08MA1Raposa0.360.490.18
2Oiapoque0.140.550.07 2Presidente Dutra0.270.510.15
3Mazagão0.090.520.04 3Colinas0.250.540.14
4Porto Grande0.080.520.03 4Lago da Pedra0.250.550.13
5Vitória do Jari0.050.480.02 5São Bento0.210.600.13
6Calçoene0.050.500.02 6Vargem Grande0.220.600.13
7Tartarugalzinho0.050.470.02 7Zé Doca0.230.570.13
8Pedra Branca do Amapari0.040.470.02 8Cururupu0.220.470.13
9Ferreira Gomes0.030.450.01 9São Mateus do Maranhão0.230.540.13
10Amapá0.030.460.01 10São Domingos do Maranhão0.200.570.12
MT1Juína0.290.510.17PA1Salinópolis0.410.540.22
2Confresa0.200.520.12 2Itupiranga0.260.620.16
3Juara0.220.510.12 3Conceição do Araguaia0.260.550.16
4Campo Novo do Parecis0.220.430.11 4Curuçá0.320.580.16
5Peixoto de Azevedo0.210.560.11 5Breu Branco0.280.620.16
6Campo Verde0.170.500.10 6Uruará0.300.640.15
7Água Boa0.180.460.10 7Jacundá0.280.540.15
8Guarantã do Norte0.200.510.10 8Augusto Corrêa0.240.530.14
9Nova Xavantina0.170.550.09 9Tucumã0.240.550.14
10Canarana0.160.490.09 10Pacajá0.260.630.13
RO1Guajará-Mirim0.200.540.12RR1Rorainópolis0.170.510.09
2Pimenta Bueno0.170.490.10 2Normandia0.150.450.07
3Espigão D’Oeste0.150.560.09 3Alto Alegre0.110.610.07
4Machadinho D’Oeste0.140.540.08 4Cantá0.140.550.06
5Buritis0.170.540.08 5Caracaraí0.110.530.06
6Nova Mamoré0.140.560.08 6Pacaraima0.100.530.06
7Candeias do Jamari0.120.560.07 7Bonfim0.100.490.06
8Ouro Preto do Oeste0.130.480.07 8Uiramutã0.080.480.04
9Colorado do Oeste0.130.450.06 9Mucajaí0.080.490.04
10São Miguel do Guaporé0.110.560.05 10Amajari0.080.520.04
TO1Araguatins0.220.560.13
2Colinas do Tocantins0.220.500.13
3Formoso do Araguaia0.150.520.09
4Guaraí0.150.480.08
5Tocantinópolis0.130.510.08
6Miracema do Tocantins0.120.470.07
7São Miguel do Tocantins0.130.480.07
8Lagoa da Confusão0.120.480.06
9Dianópolis0.110.450.06
10Augustinópolis0.100.350.05
Disclaimer/Publisher’s Note: The statements, opinions and data contained in all publications are solely those of the individual author(s) and contributor(s) and not of MDPI and/or the editor(s). MDPI and/or the editor(s) disclaim responsibility for any injury to people or property resulting from any ideas, methods, instructions or products referred to in the content.

