Analysis is completed to identify the possible temporal changes of the frequency and intensity of extreme rainfall events over the Indochina Peninsula. Trends in extreme rainfall indices were calculated using statistical software, RClimDex, an R-based language program. The positive (negative) values indicate increasing (decreasing) trends. This study used a significance level α of 5%. The slope represents the magnitude of the changes each year, such as day/year for the frequency indices and mm/year for the intensity indices.
Trends in indices were calculated using the Mann-Kendall test. Positive or the negative trends could be identified using the Z test. This calculation also produced the p-Value. The p-Value was compared with α = 5% (0.05), where if the p-Value was less (greater) than α, then the trend was categorized as significant (non-significant).
3.2.1. Frequency Indices
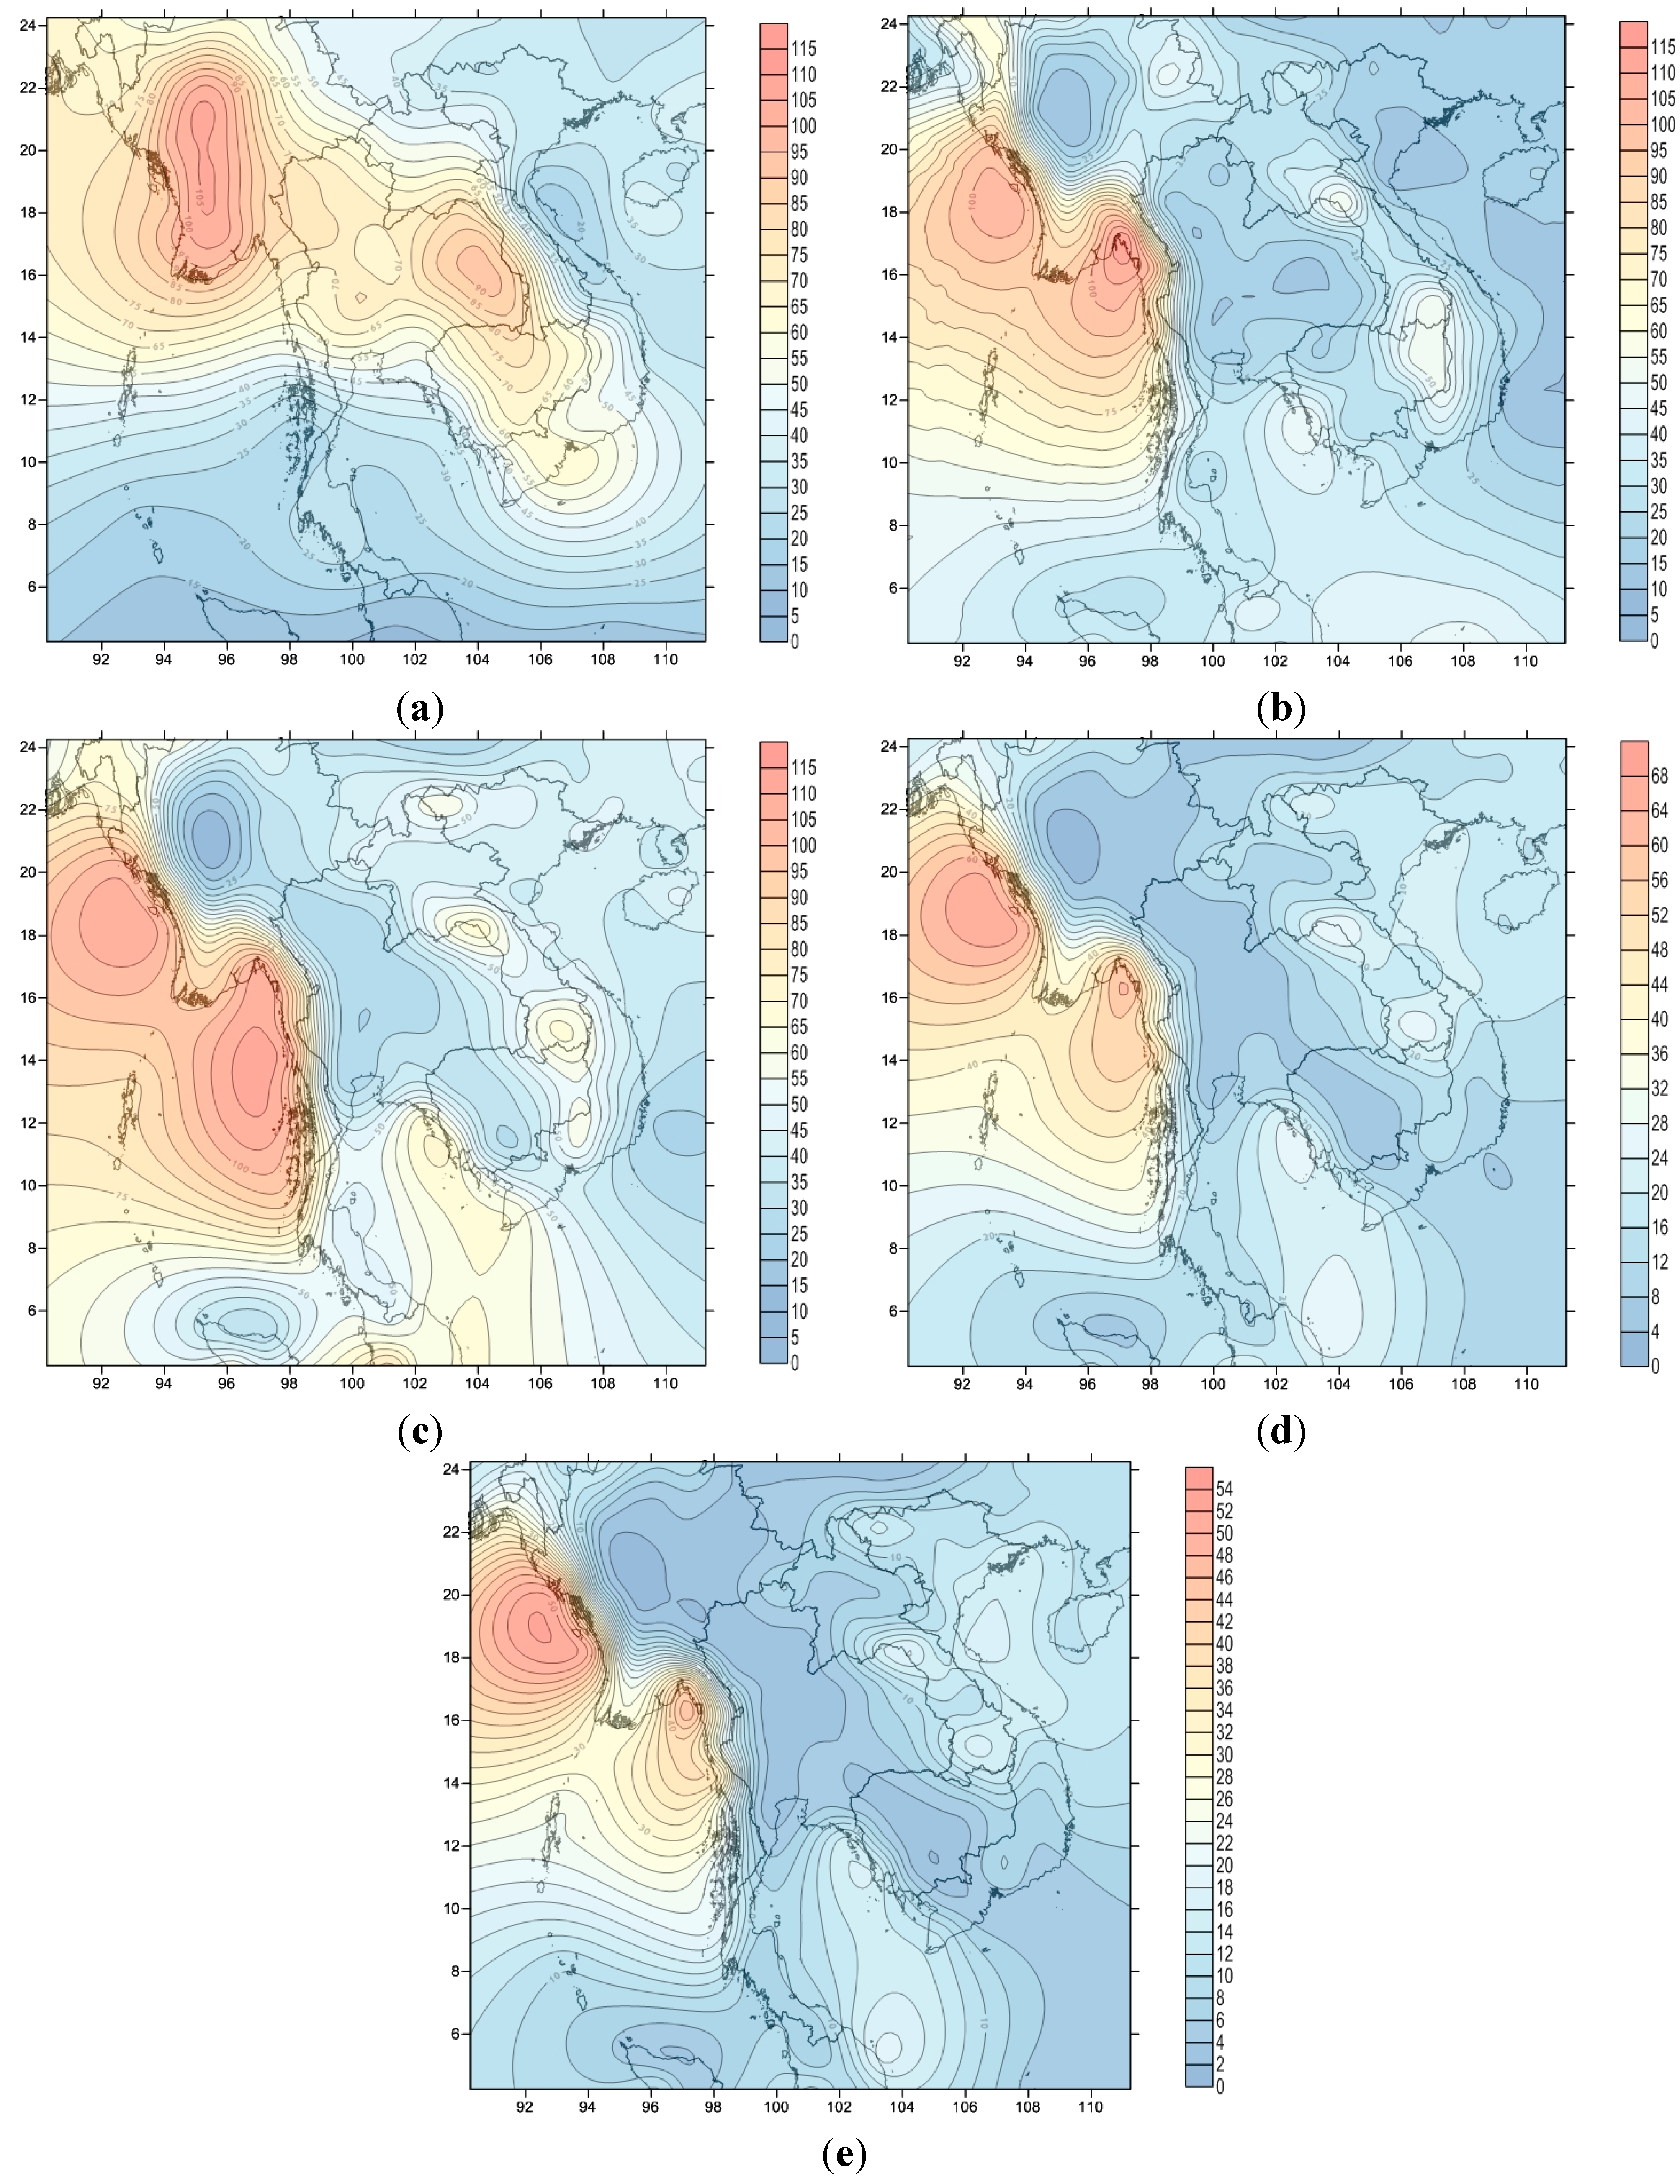
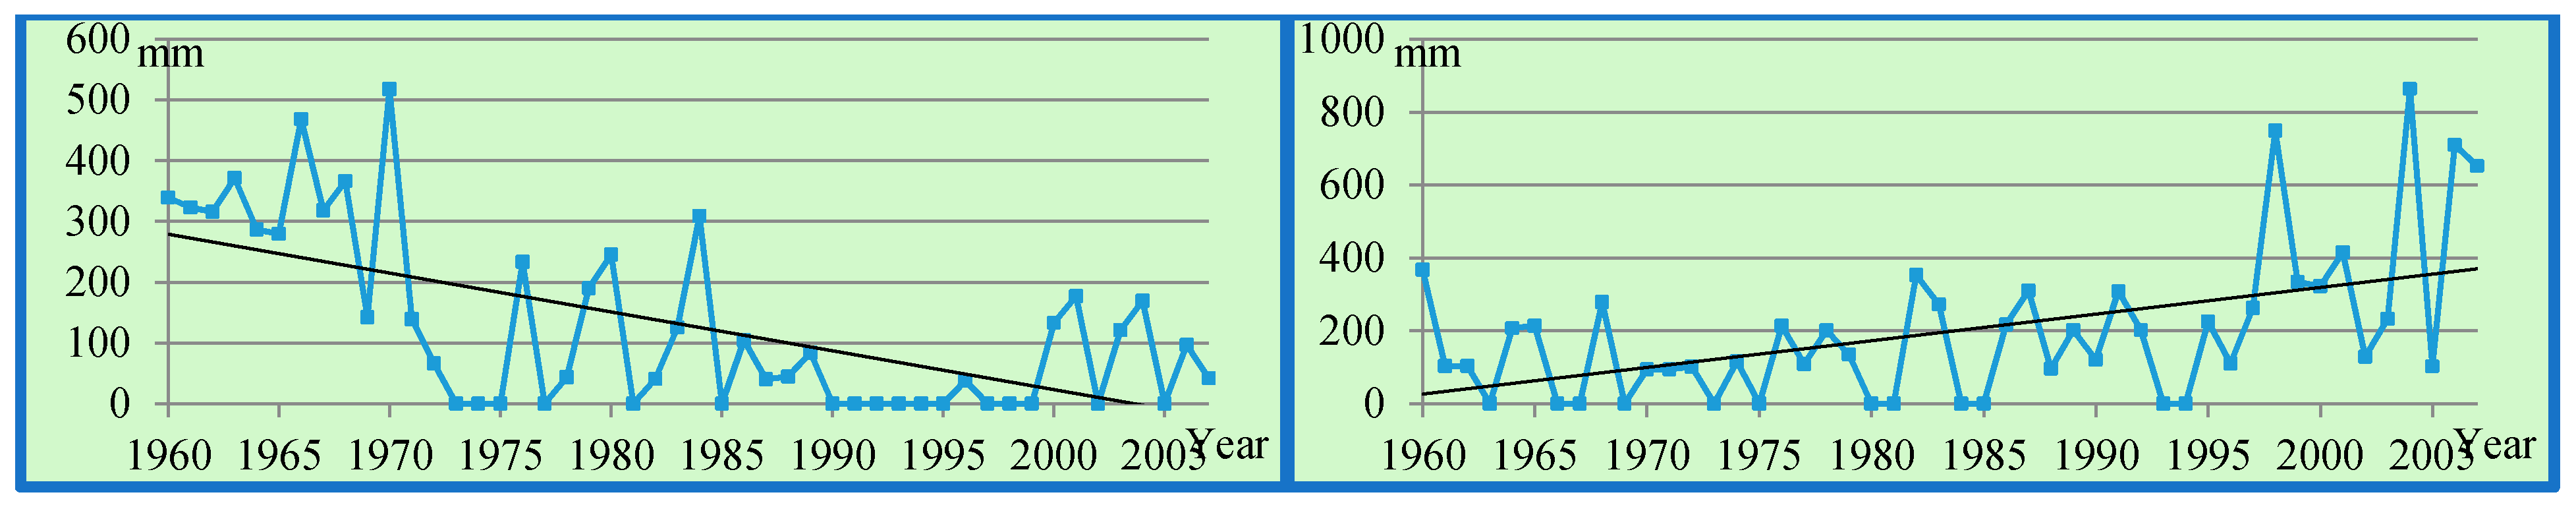
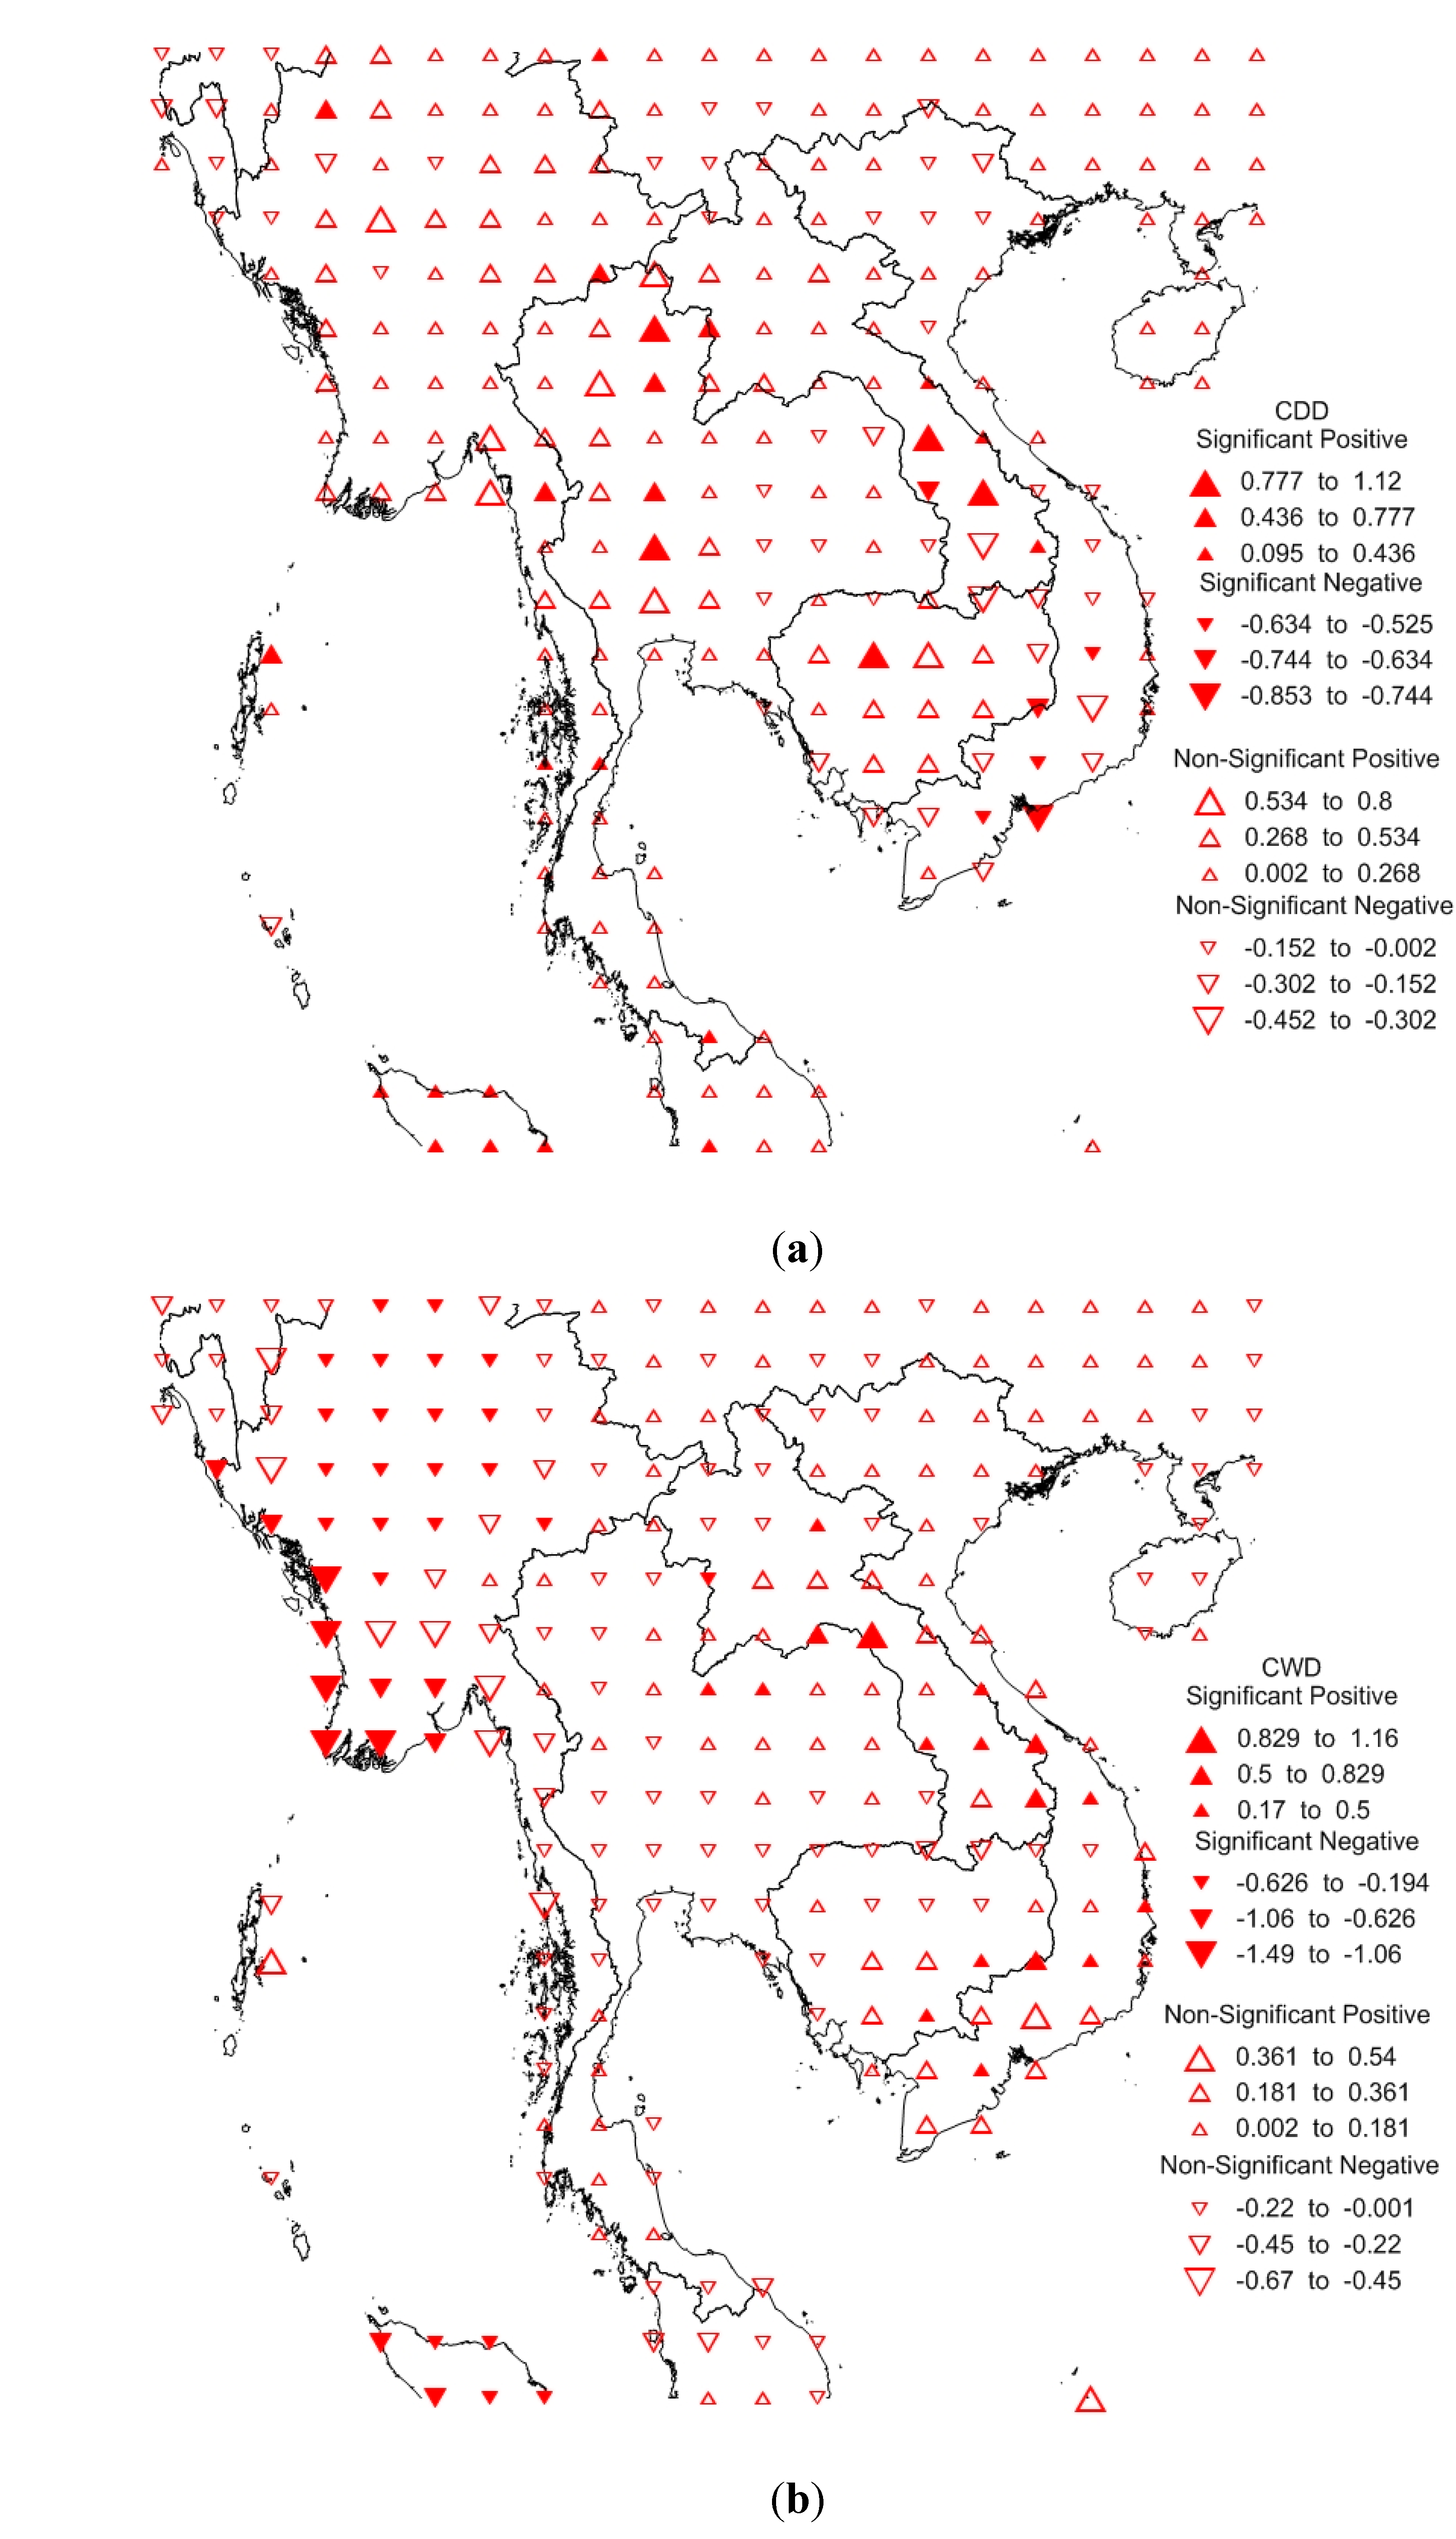
The consecutive dry days (CDD) index shows non-significant trends dominated this area. A total of 215 out of 248 grids show non-significant trends, with 65.72% of the grids indicating positive trends and 20.96% indicating negative trends (see
Table 2). The remaining 32 grids demonstrate significant trends with 10.88% of the grids indicating positive trends and 2.41% indicating negative trends.
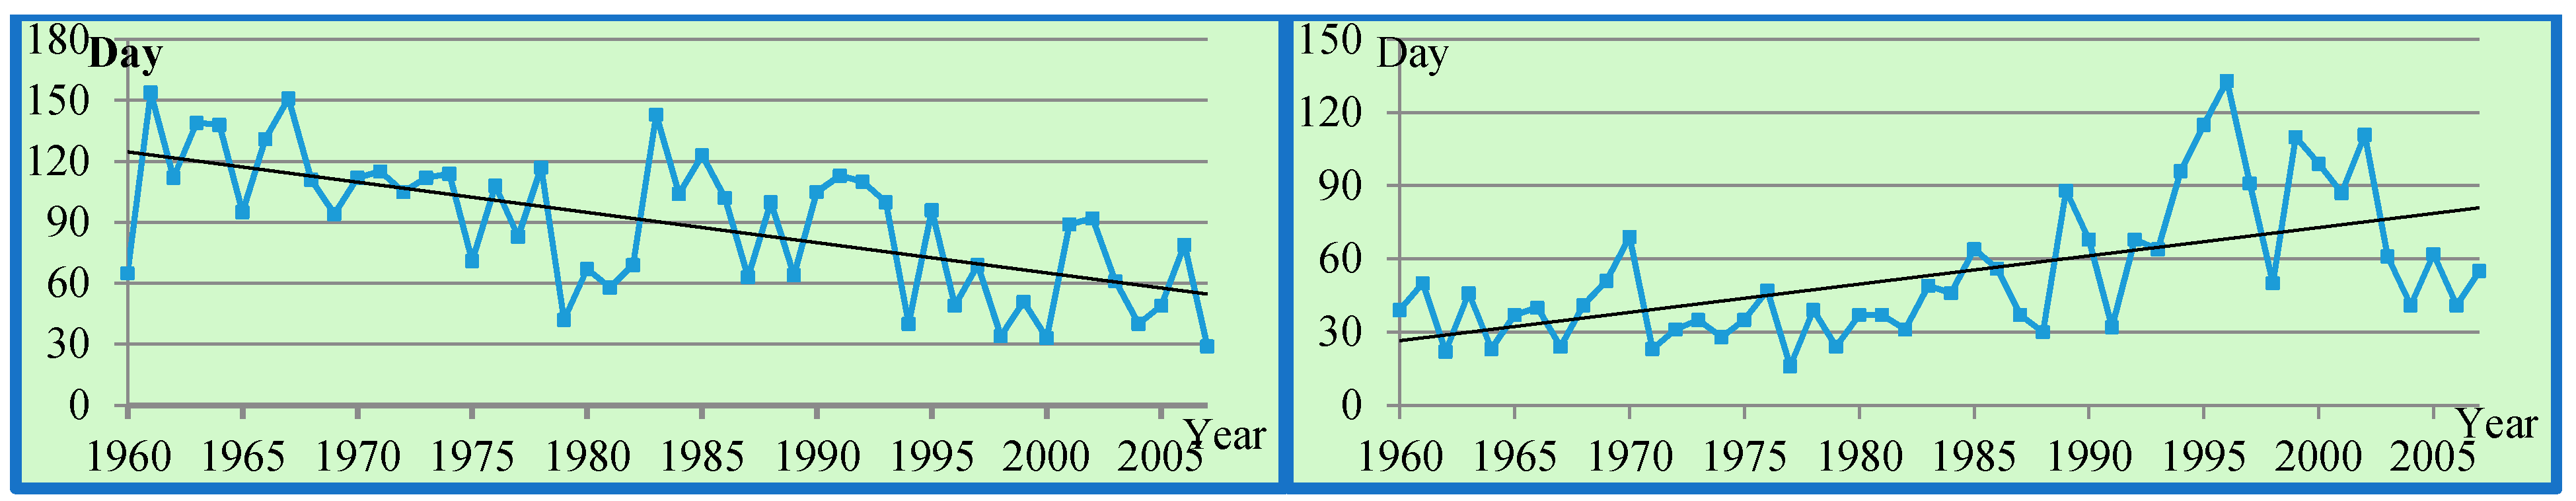
Figure 5 shows the most significant positive and negative trends of the CDD index. The most significant positive trend is at 105.25–17.25 with a slope of 1117, while the most significant negative trend is at 107.25–10.25 with a slope of −0.853 [
1].
In contrast to the consecutive dry days (CDD), the consecutive wet day (CWD) results indicate 194 grids show non-significant trends with 36.29% of the grids indicating positive trends and 41.93% indicating negative trends (see
Table 2). The remaining 53 grids demonstrate significant trends with 6.85% of grids indicating positive trends and 14.51% indicating negative trends.
Figure 6 indicates the most significant negative and positive trends. The most significant positive trend is at 104.25–18.25 with a slope of 1.1588, while the most significant negative trend is found at 95.25–16.25 with a slope of −1.488 [
1].
Figure 5.
The most significant negative trend with a slope of −0.8531 (left) and the most significant positive trend with a slope of 1.1178 (right) of the CDD index.
Figure 5.
The most significant negative trend with a slope of −0.8531 (left) and the most significant positive trend with a slope of 1.1178 (right) of the CDD index.
Figure 6.
The most significant negative trend with a slope of −1.4889 (left) and the most significant positive trend with a slope of 1.1588 (right) of the CWD index.
Figure 6.
The most significant negative trend with a slope of −1.4889 (left) and the most significant positive trend with a slope of 1.1588 (right) of the CWD index.
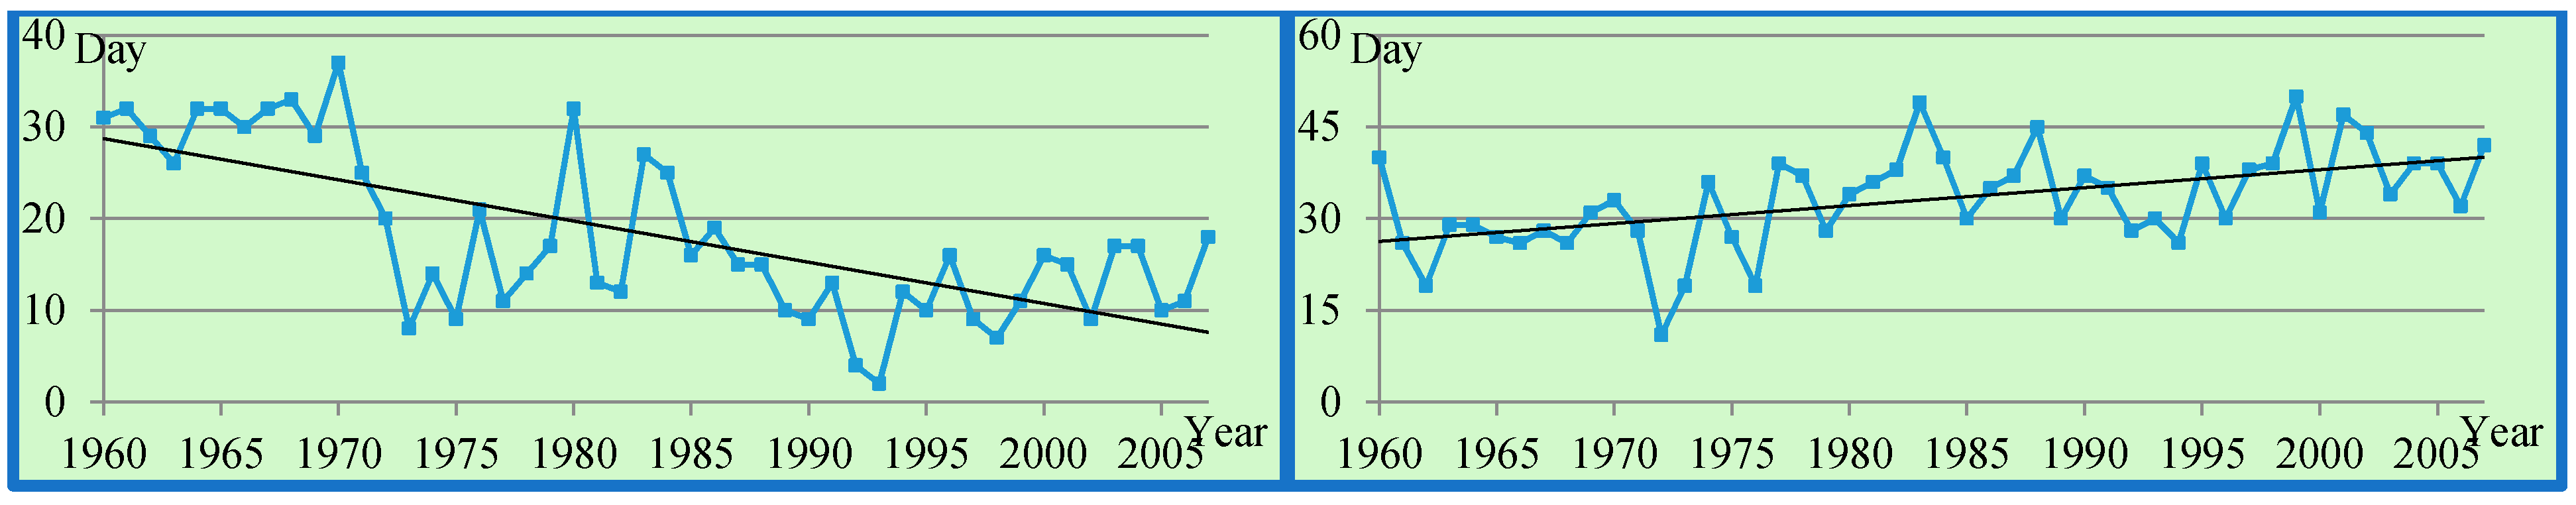
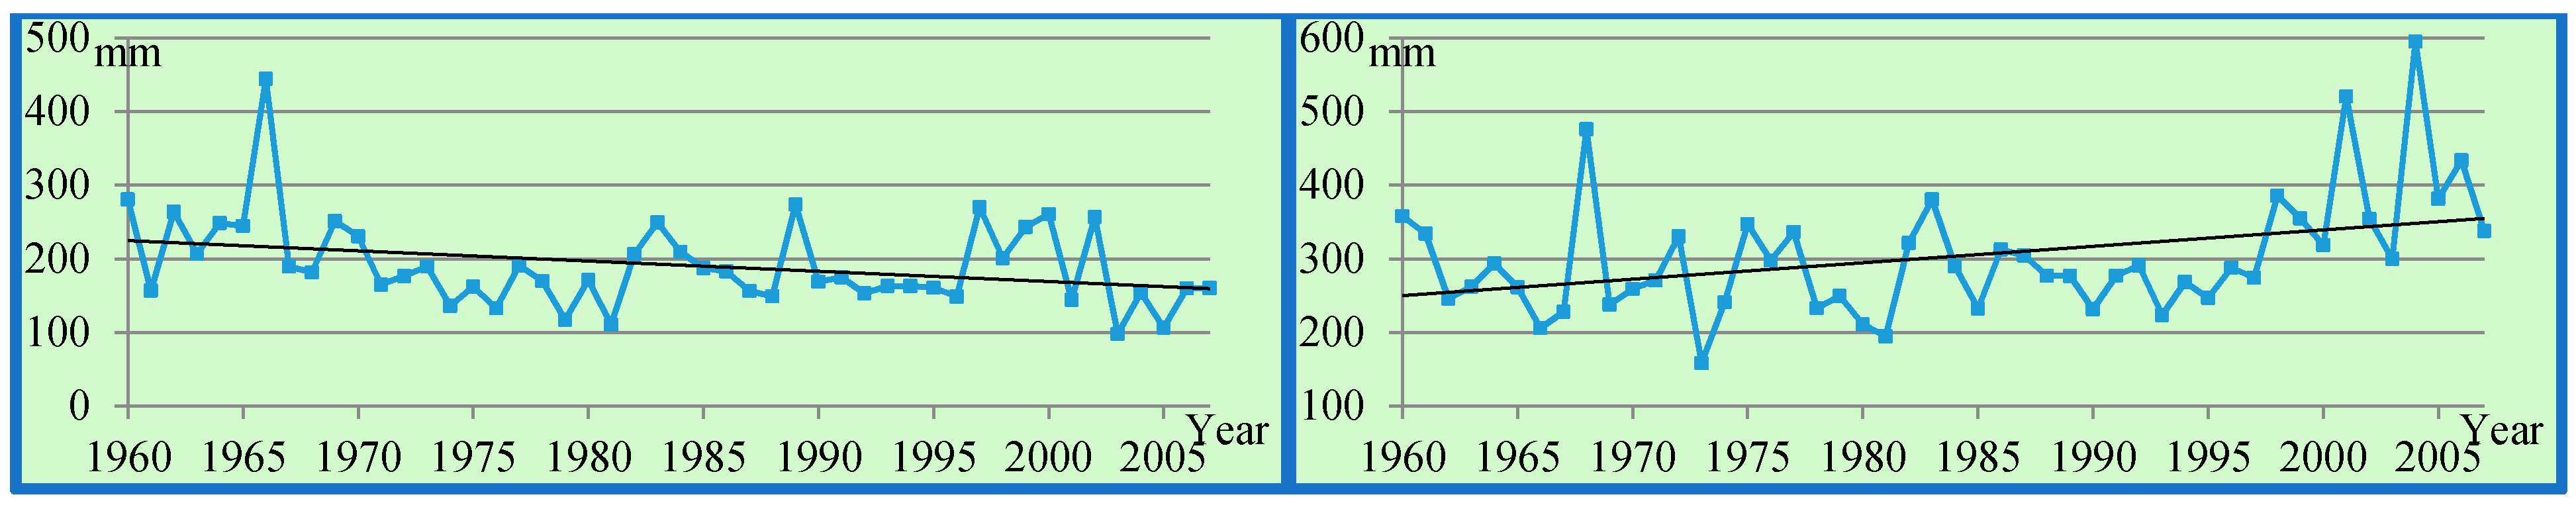
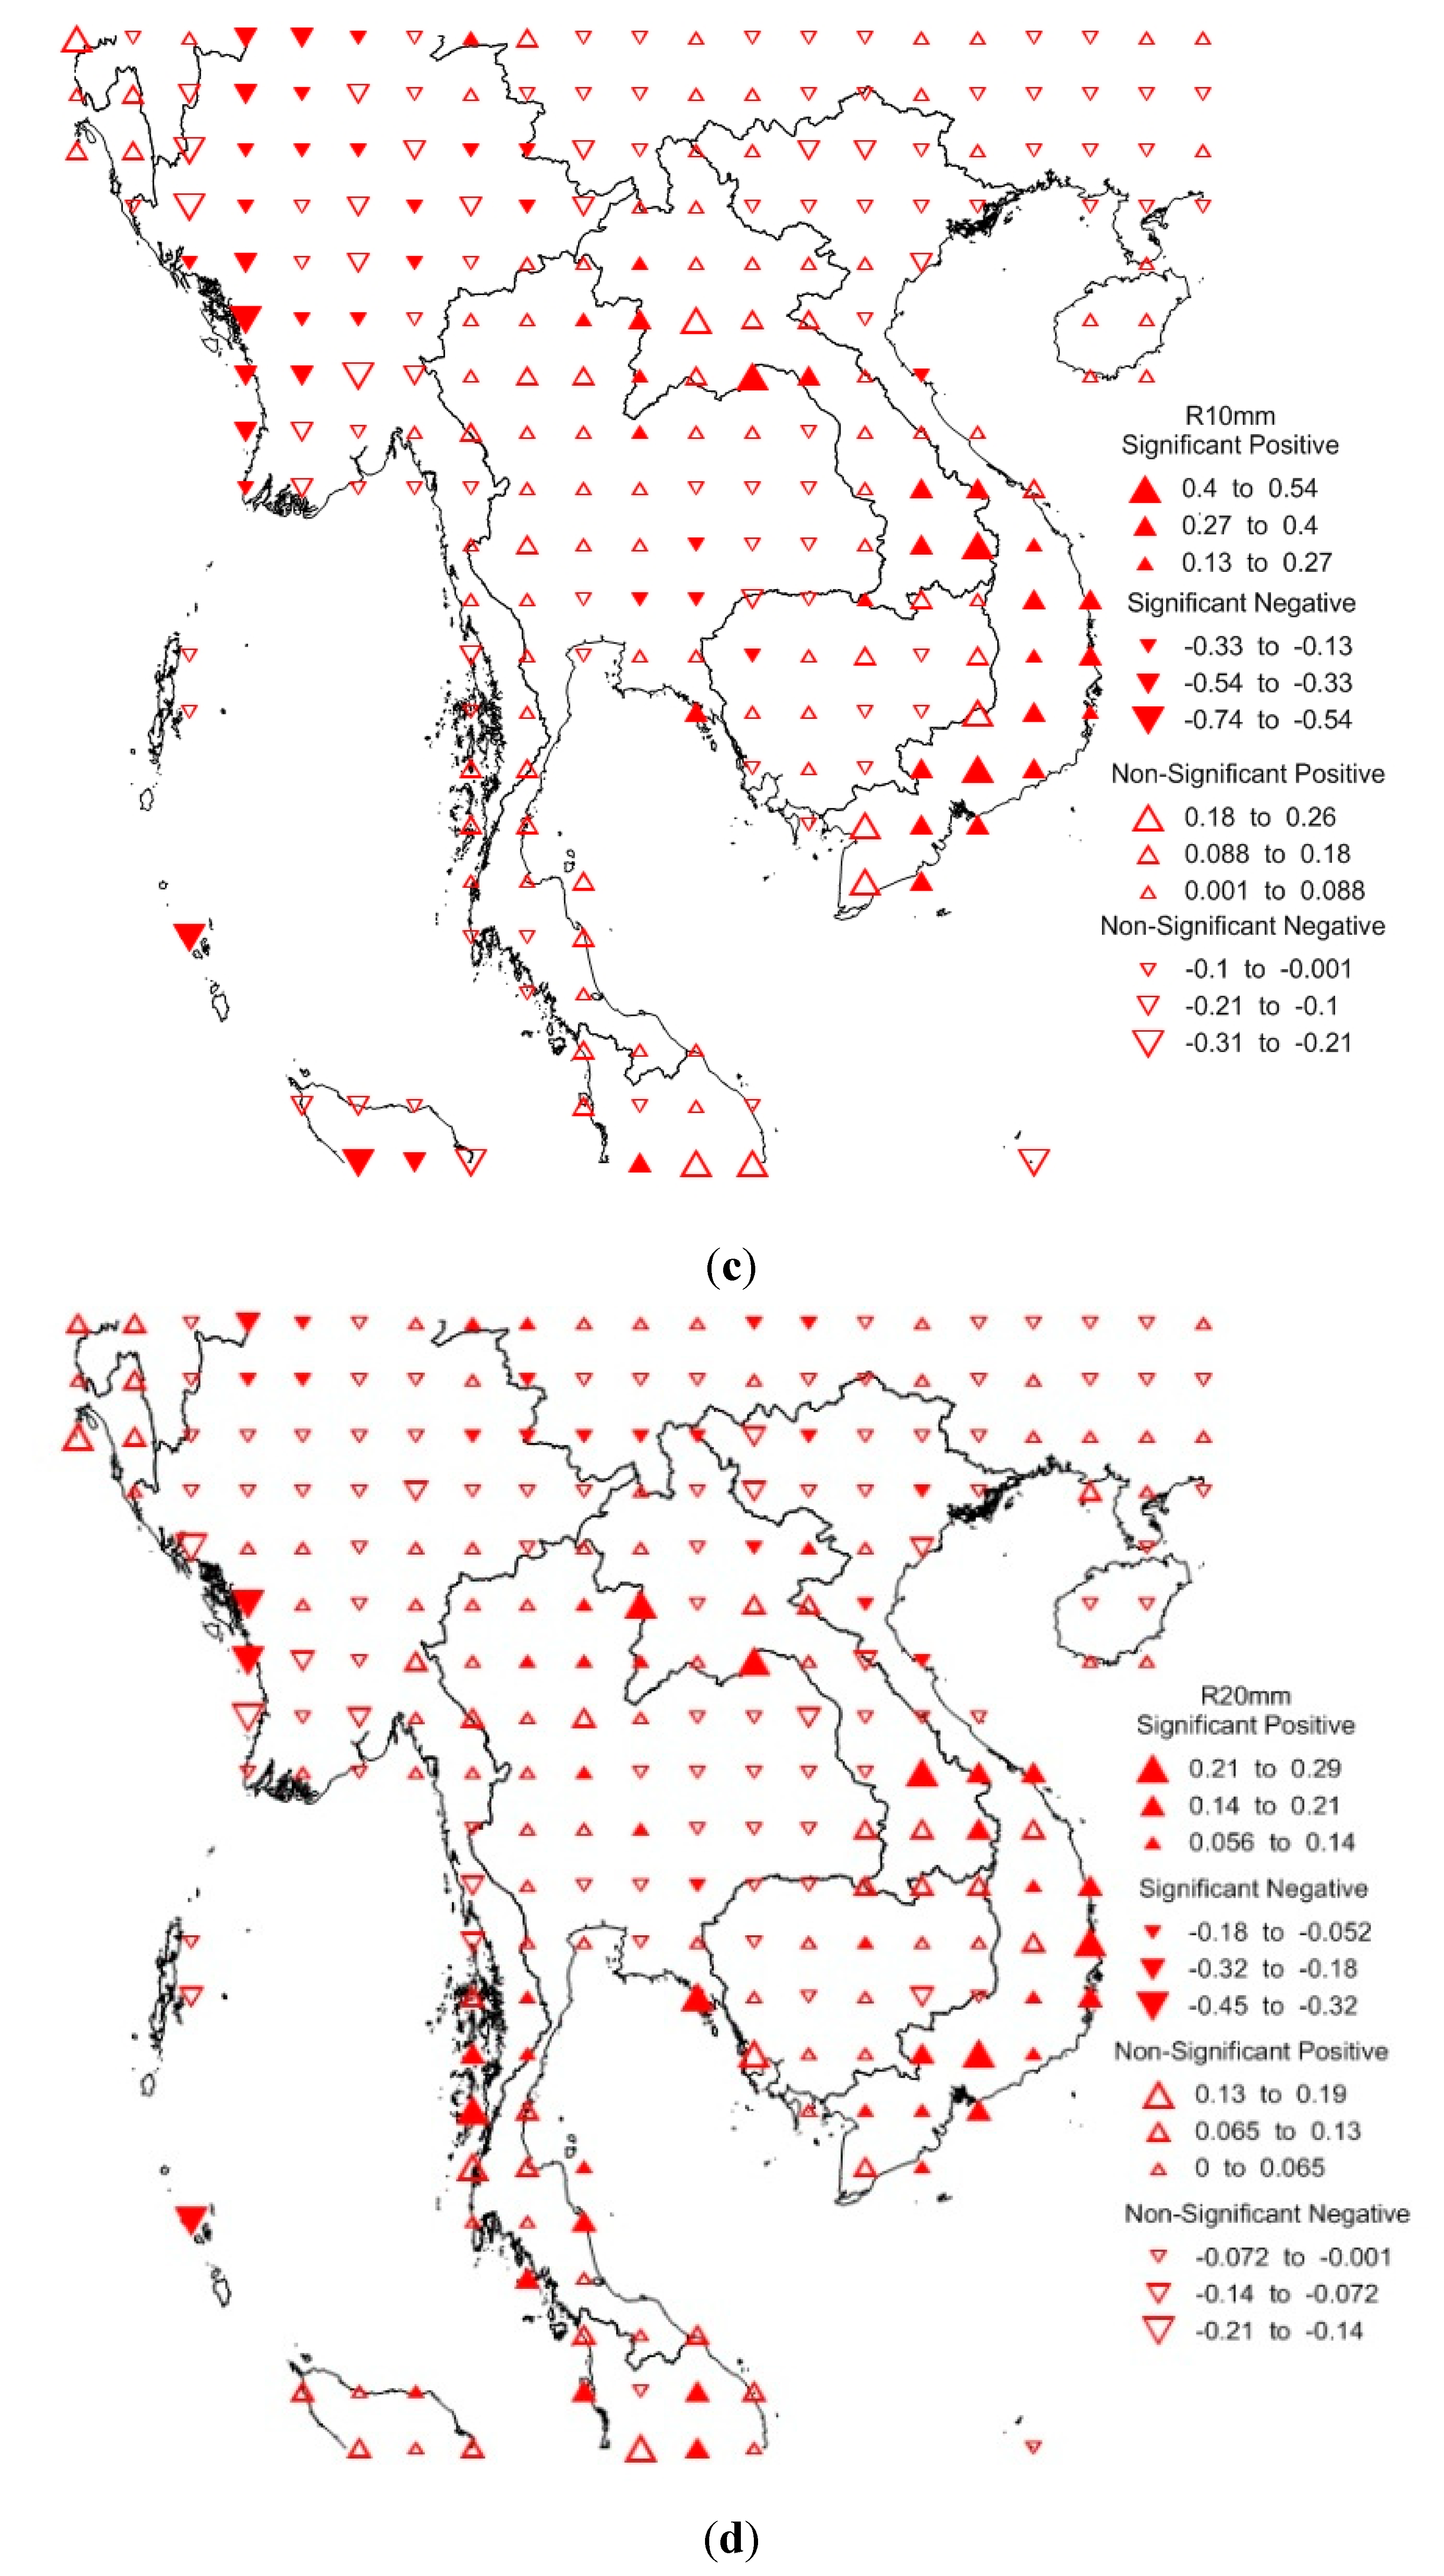
Figure 7.
The most significant negative trend with a slope of −0.7432 (left) and the most significant positive trend with a slope of 0.5404 (right) of the R10mm index.
Figure 7.
The most significant negative trend with a slope of −0.7432 (left) and the most significant positive trend with a slope of 0.5404 (right) of the R10mm index.
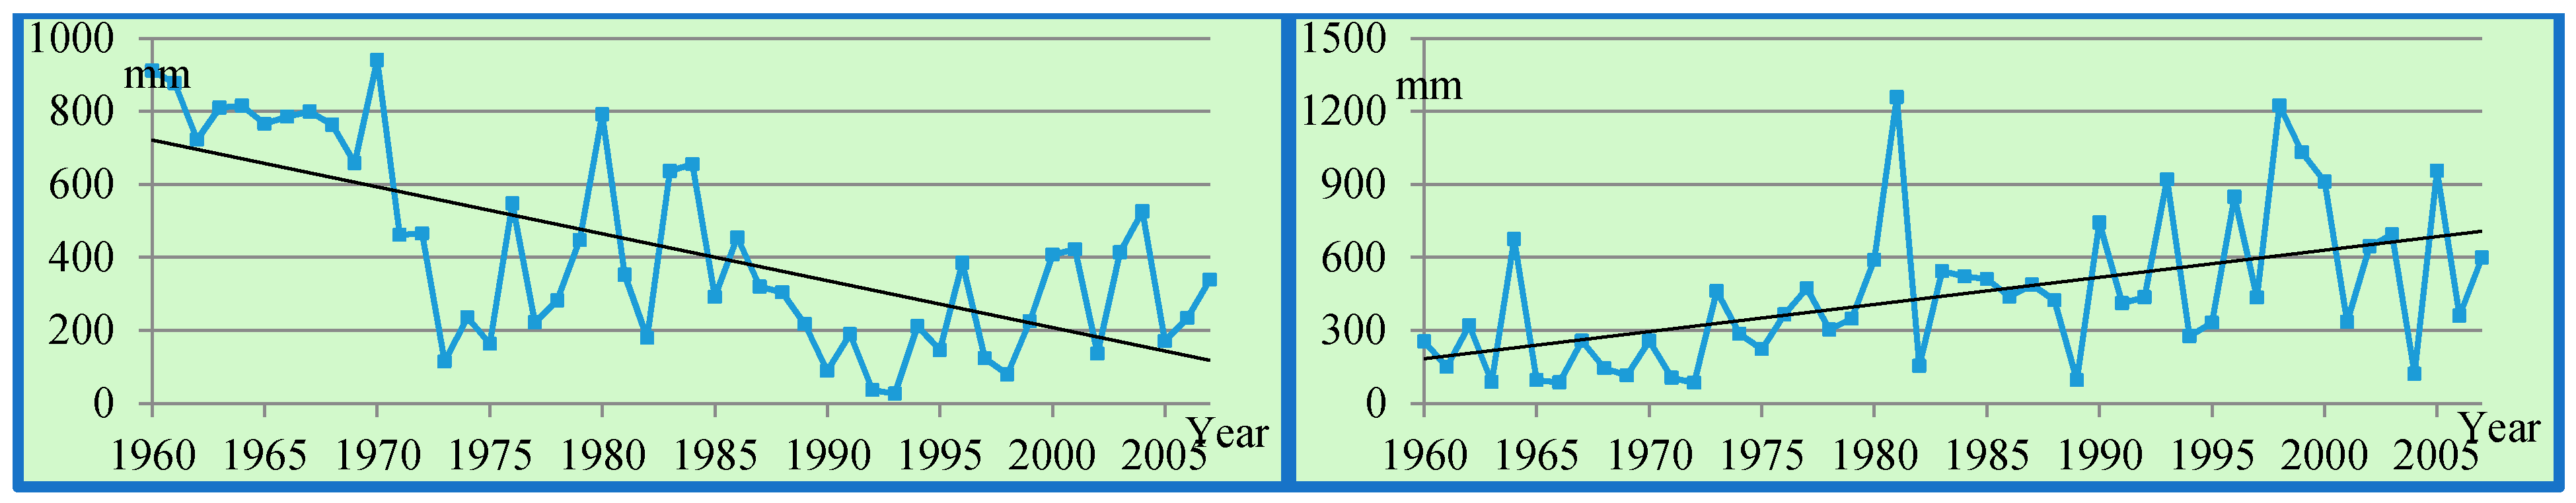
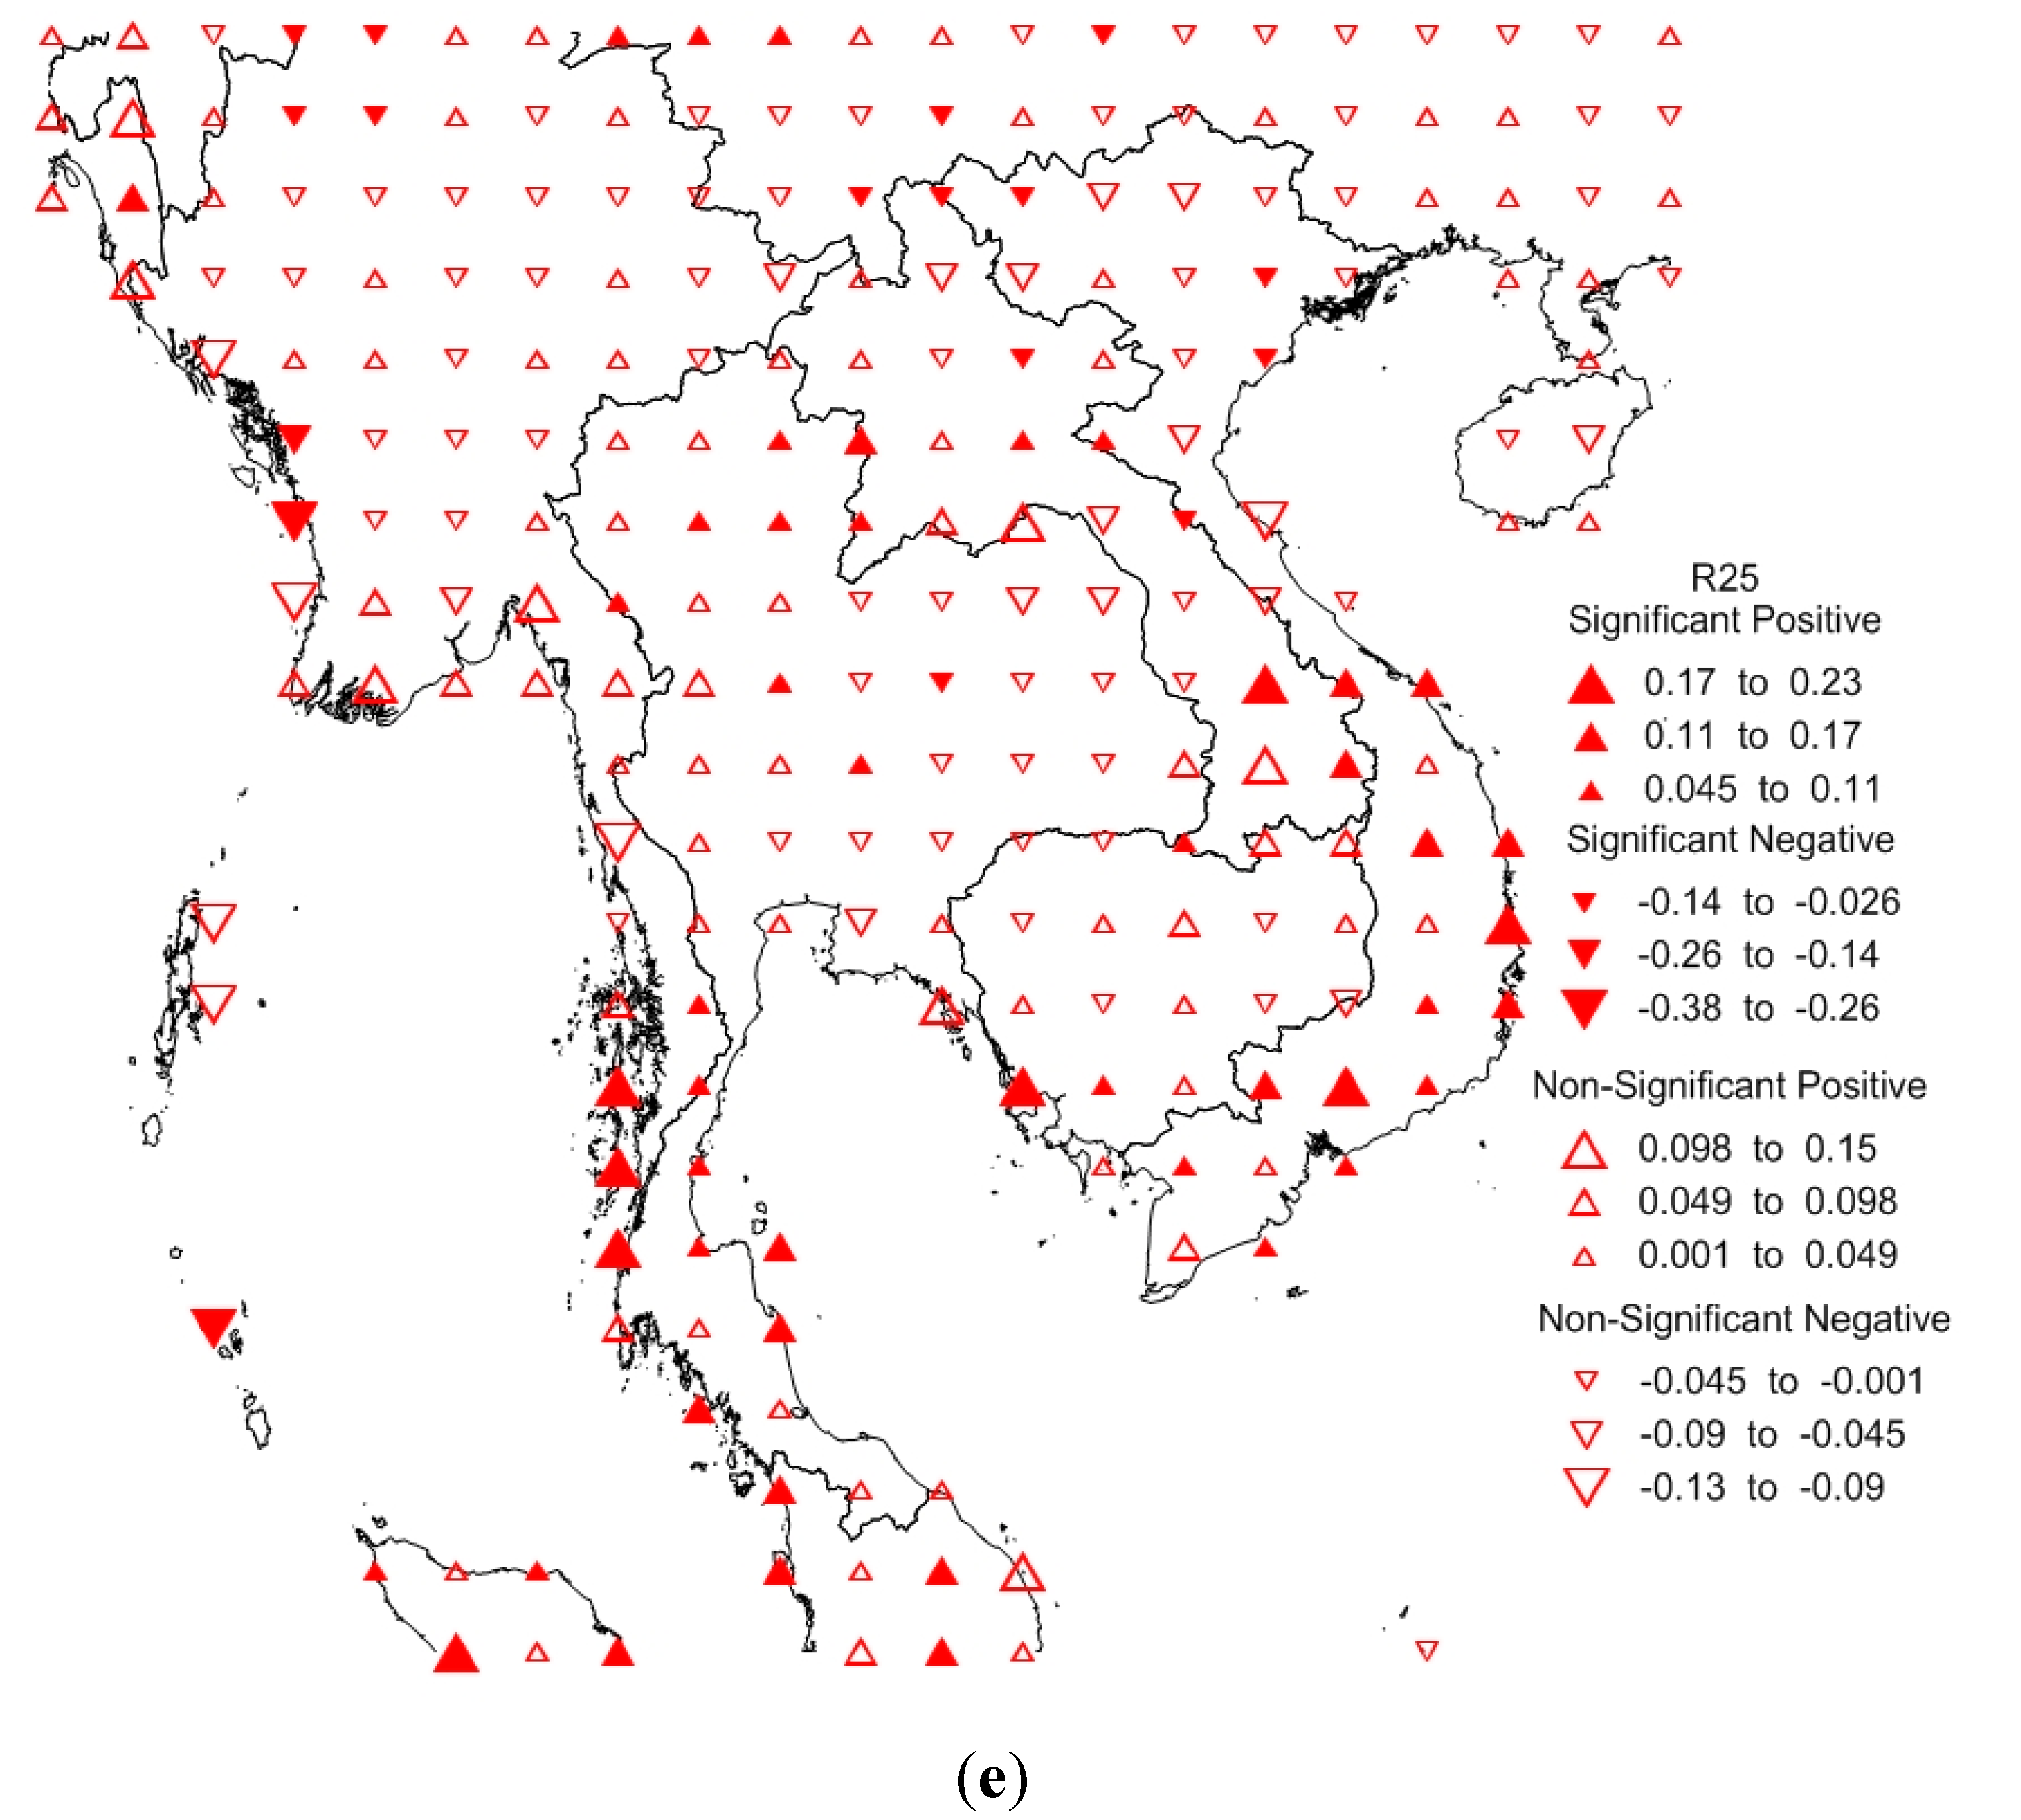
Heavy rainfall day (R10mm), very heavy rainfall day (R20mm) and extremely heavy rainfall day (R25mm) indices show non-significant trends still dominate in the Indochina Peninsula with 187 grids for the R10mm index, 183 grids for the R20mm index, and 178 grids for the R25mm index. The areas that experience the most significant positive trends are at 103.25–18.25 for the R10mm index with a slope of 0.54, at 90.25–22.25 for the R20mm index with a slope of 0.2942, and at 109.25–13.25 for the R25mm index with a slope of 0.231. Otherwise, the areas that experience the most significant negative trends are at 93.25–8.25 for the R10mm index with a slope of −0.743, at 93.25–8.25 for the R20mm index with a slope of −0.4493, and at 94.25–18.25 for the R25mm index with a slope of −0.380 (See
Figure 7,
Figure 8 and
Figure 9).
Figure 8.
The most significant negative trend with a slope of −0.4493 (left) and the most significant positive trend with a slope of 0.2942 (right) of the R20mm index.
Figure 8.
The most significant negative trend with a slope of −0.4493 (left) and the most significant positive trend with a slope of 0.2942 (right) of the R20mm index.
Figure 9.
The most significant negative trend with a slope of −0.3809 (left) and the most significant positive trend with a slope of 0.2318 (right) of the R25mm index.
Figure 9.
The most significant negative trend with a slope of −0.3809 (left) and the most significant positive trend with a slope of 0.2318 (right) of the R25mm index.
Table 2.
The percentage of significant and non-significant trends of frequency indices.
Table 2.
The percentage of significant and non-significant trends of frequency indices.
| Indices | Positive Significant Trend (%) | Positive Non-Significant Trend (%) | Negative Significant Trend (%) | Negative Non-Significant Trend (%) |
|---|
| CDD | 10.88 | 65.72 | 2.41 | 20.96 |
| CWD | 6.85 | 36.29 | 14.51 | 41.93 |
| R10mm | 11.69 | 39.11 | 12.5 | 36.29 |
| R20mm | 17.33 | 37.5 | 8.46 | 36.29 |
| R25mm | 20.96 | 36.29 | 6.85 | 35.08 |
3.2.2. Intensity Indices
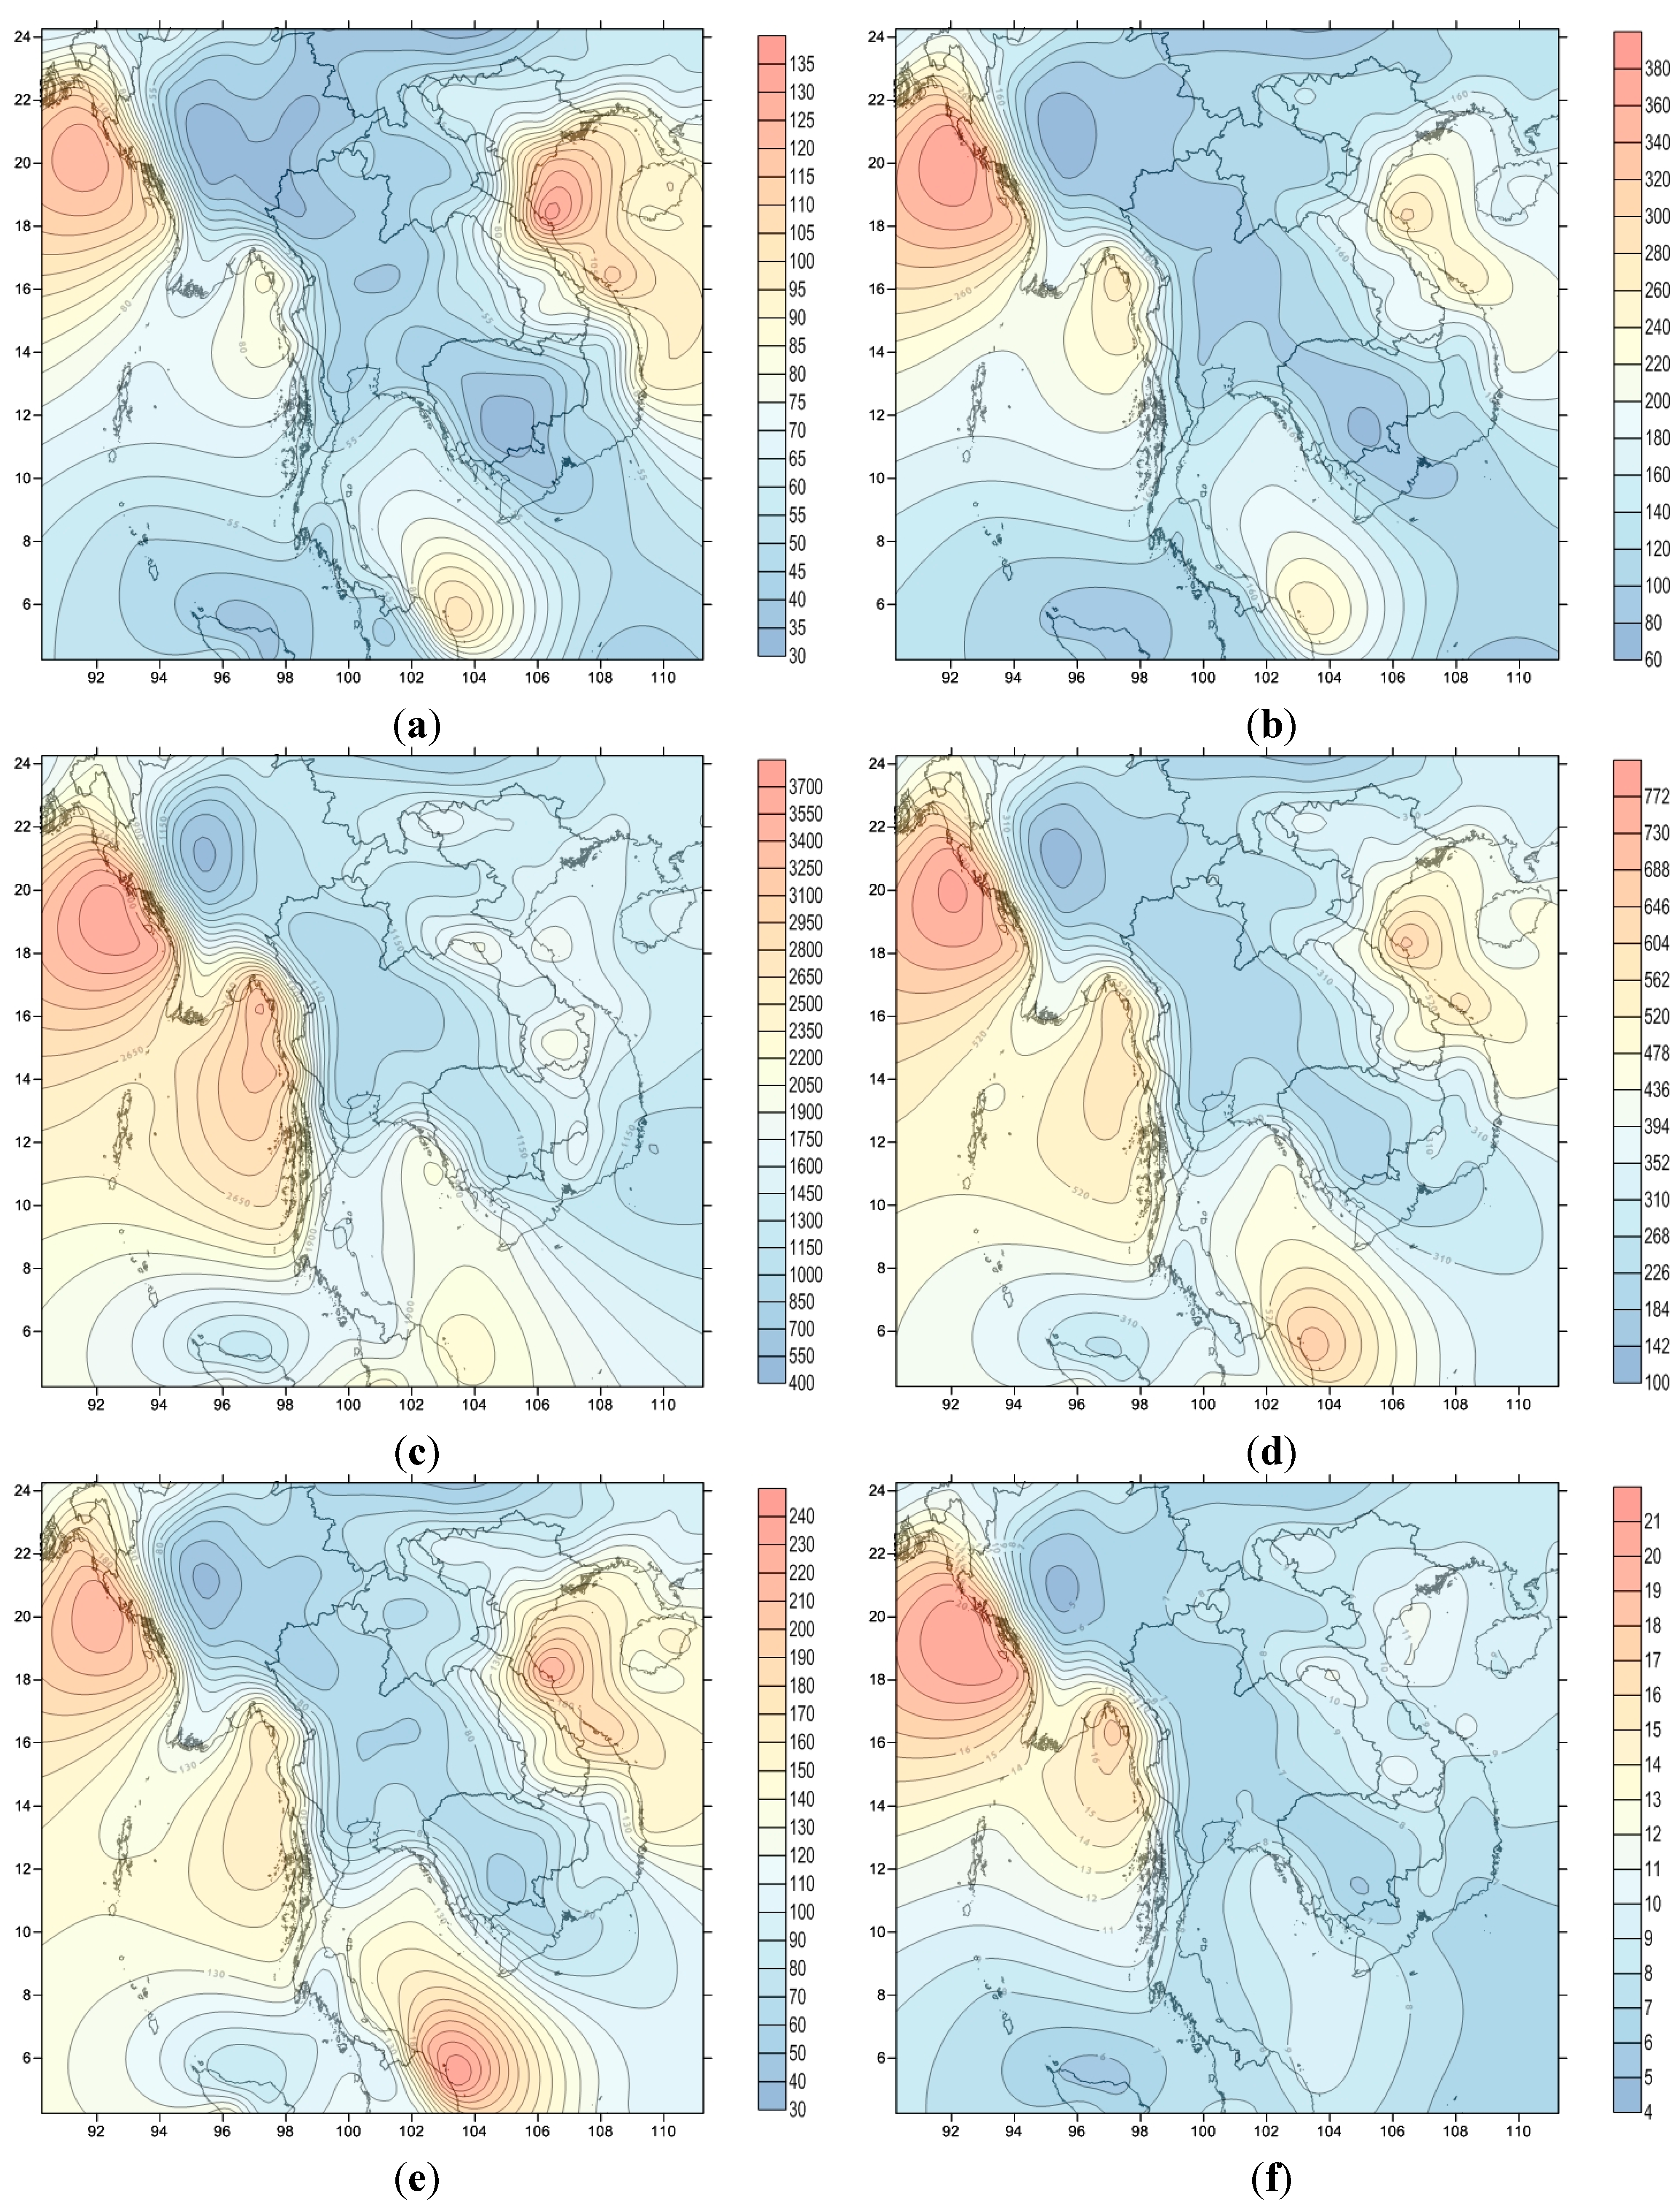
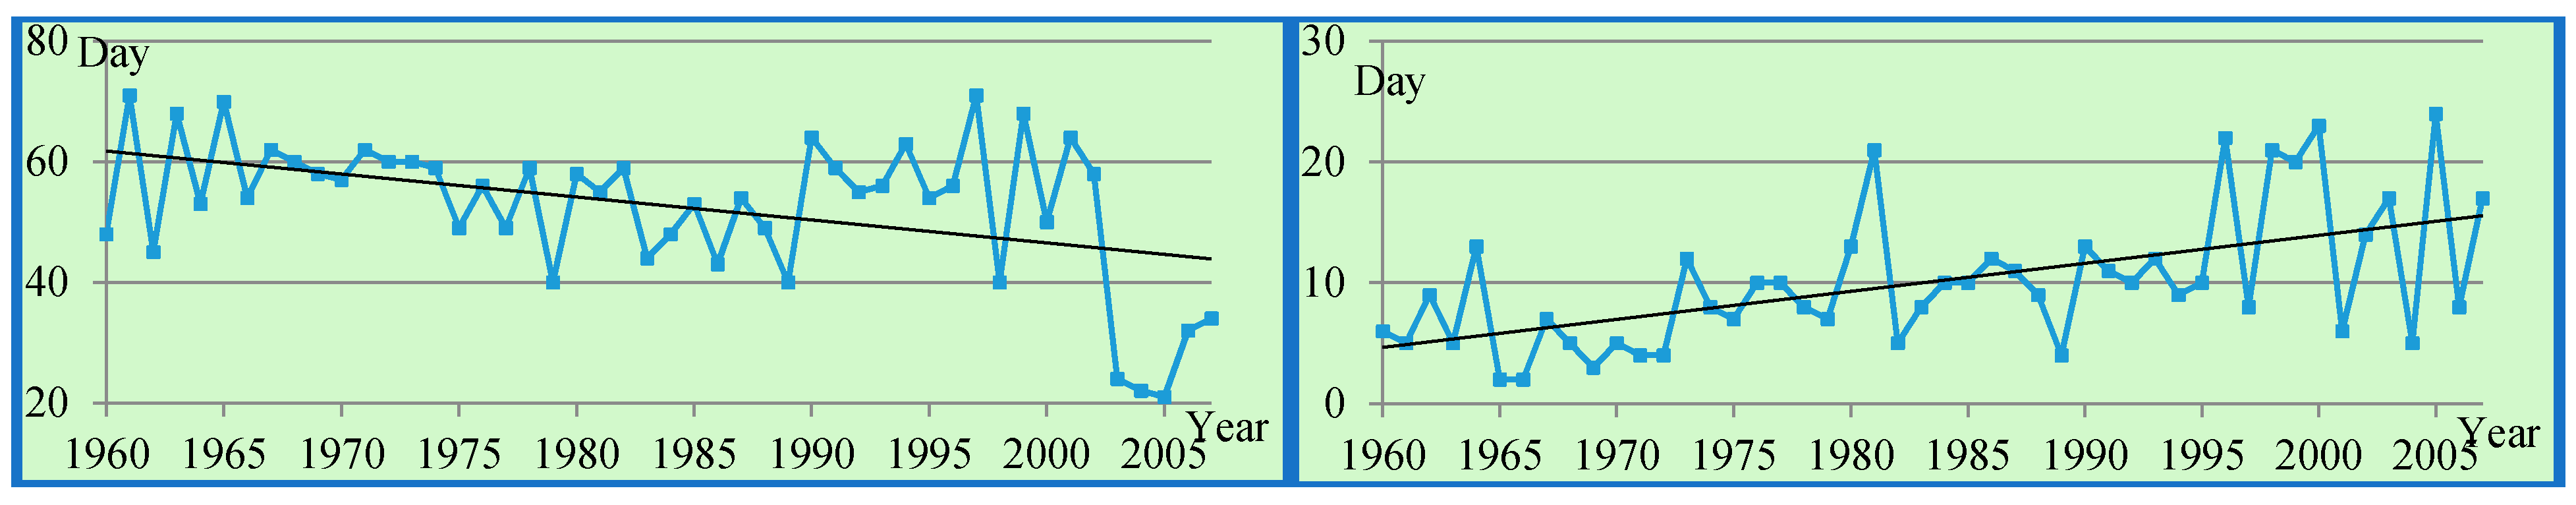
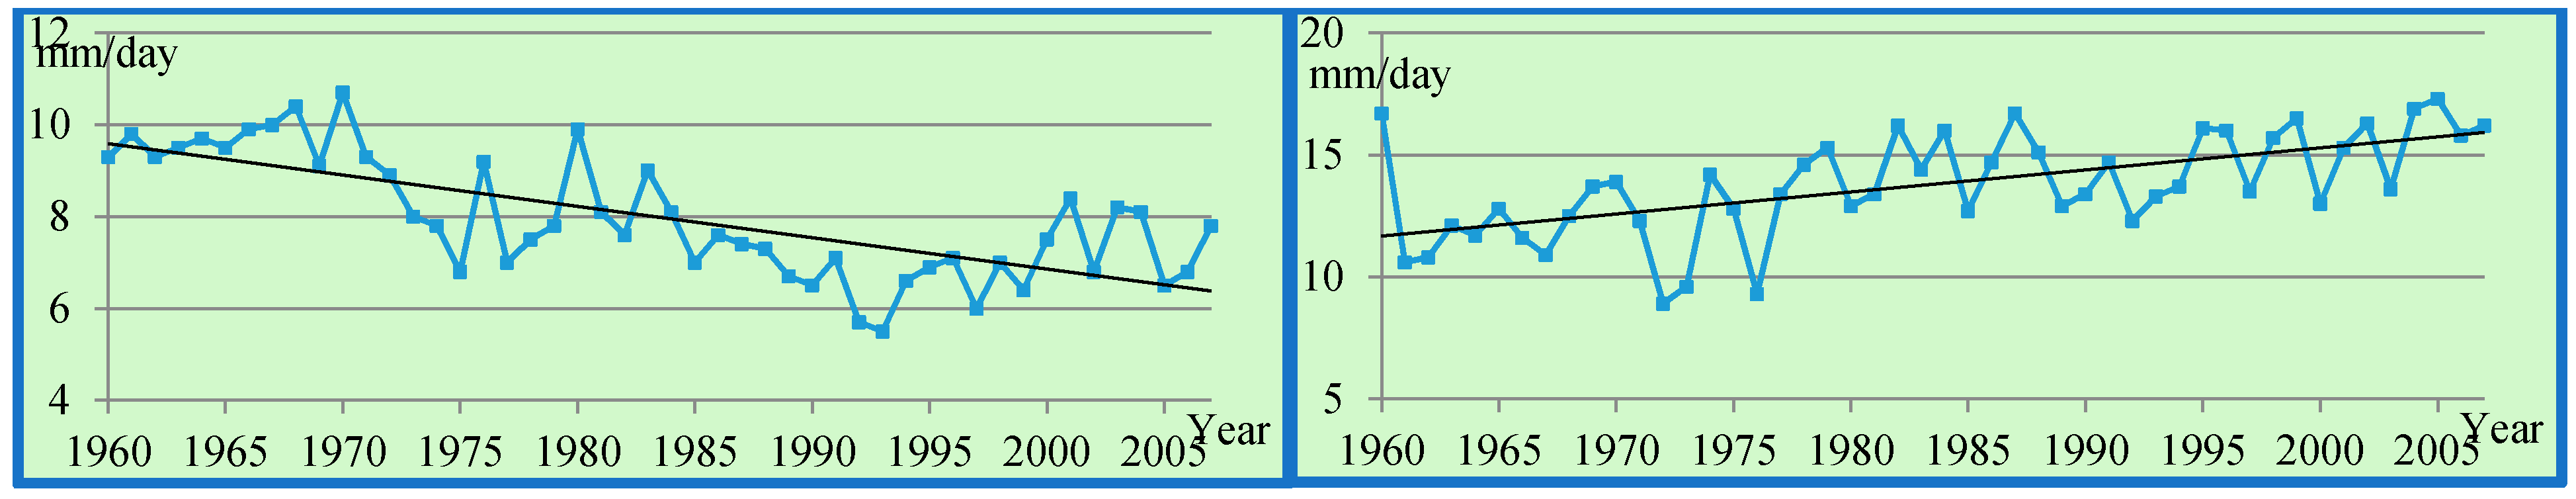
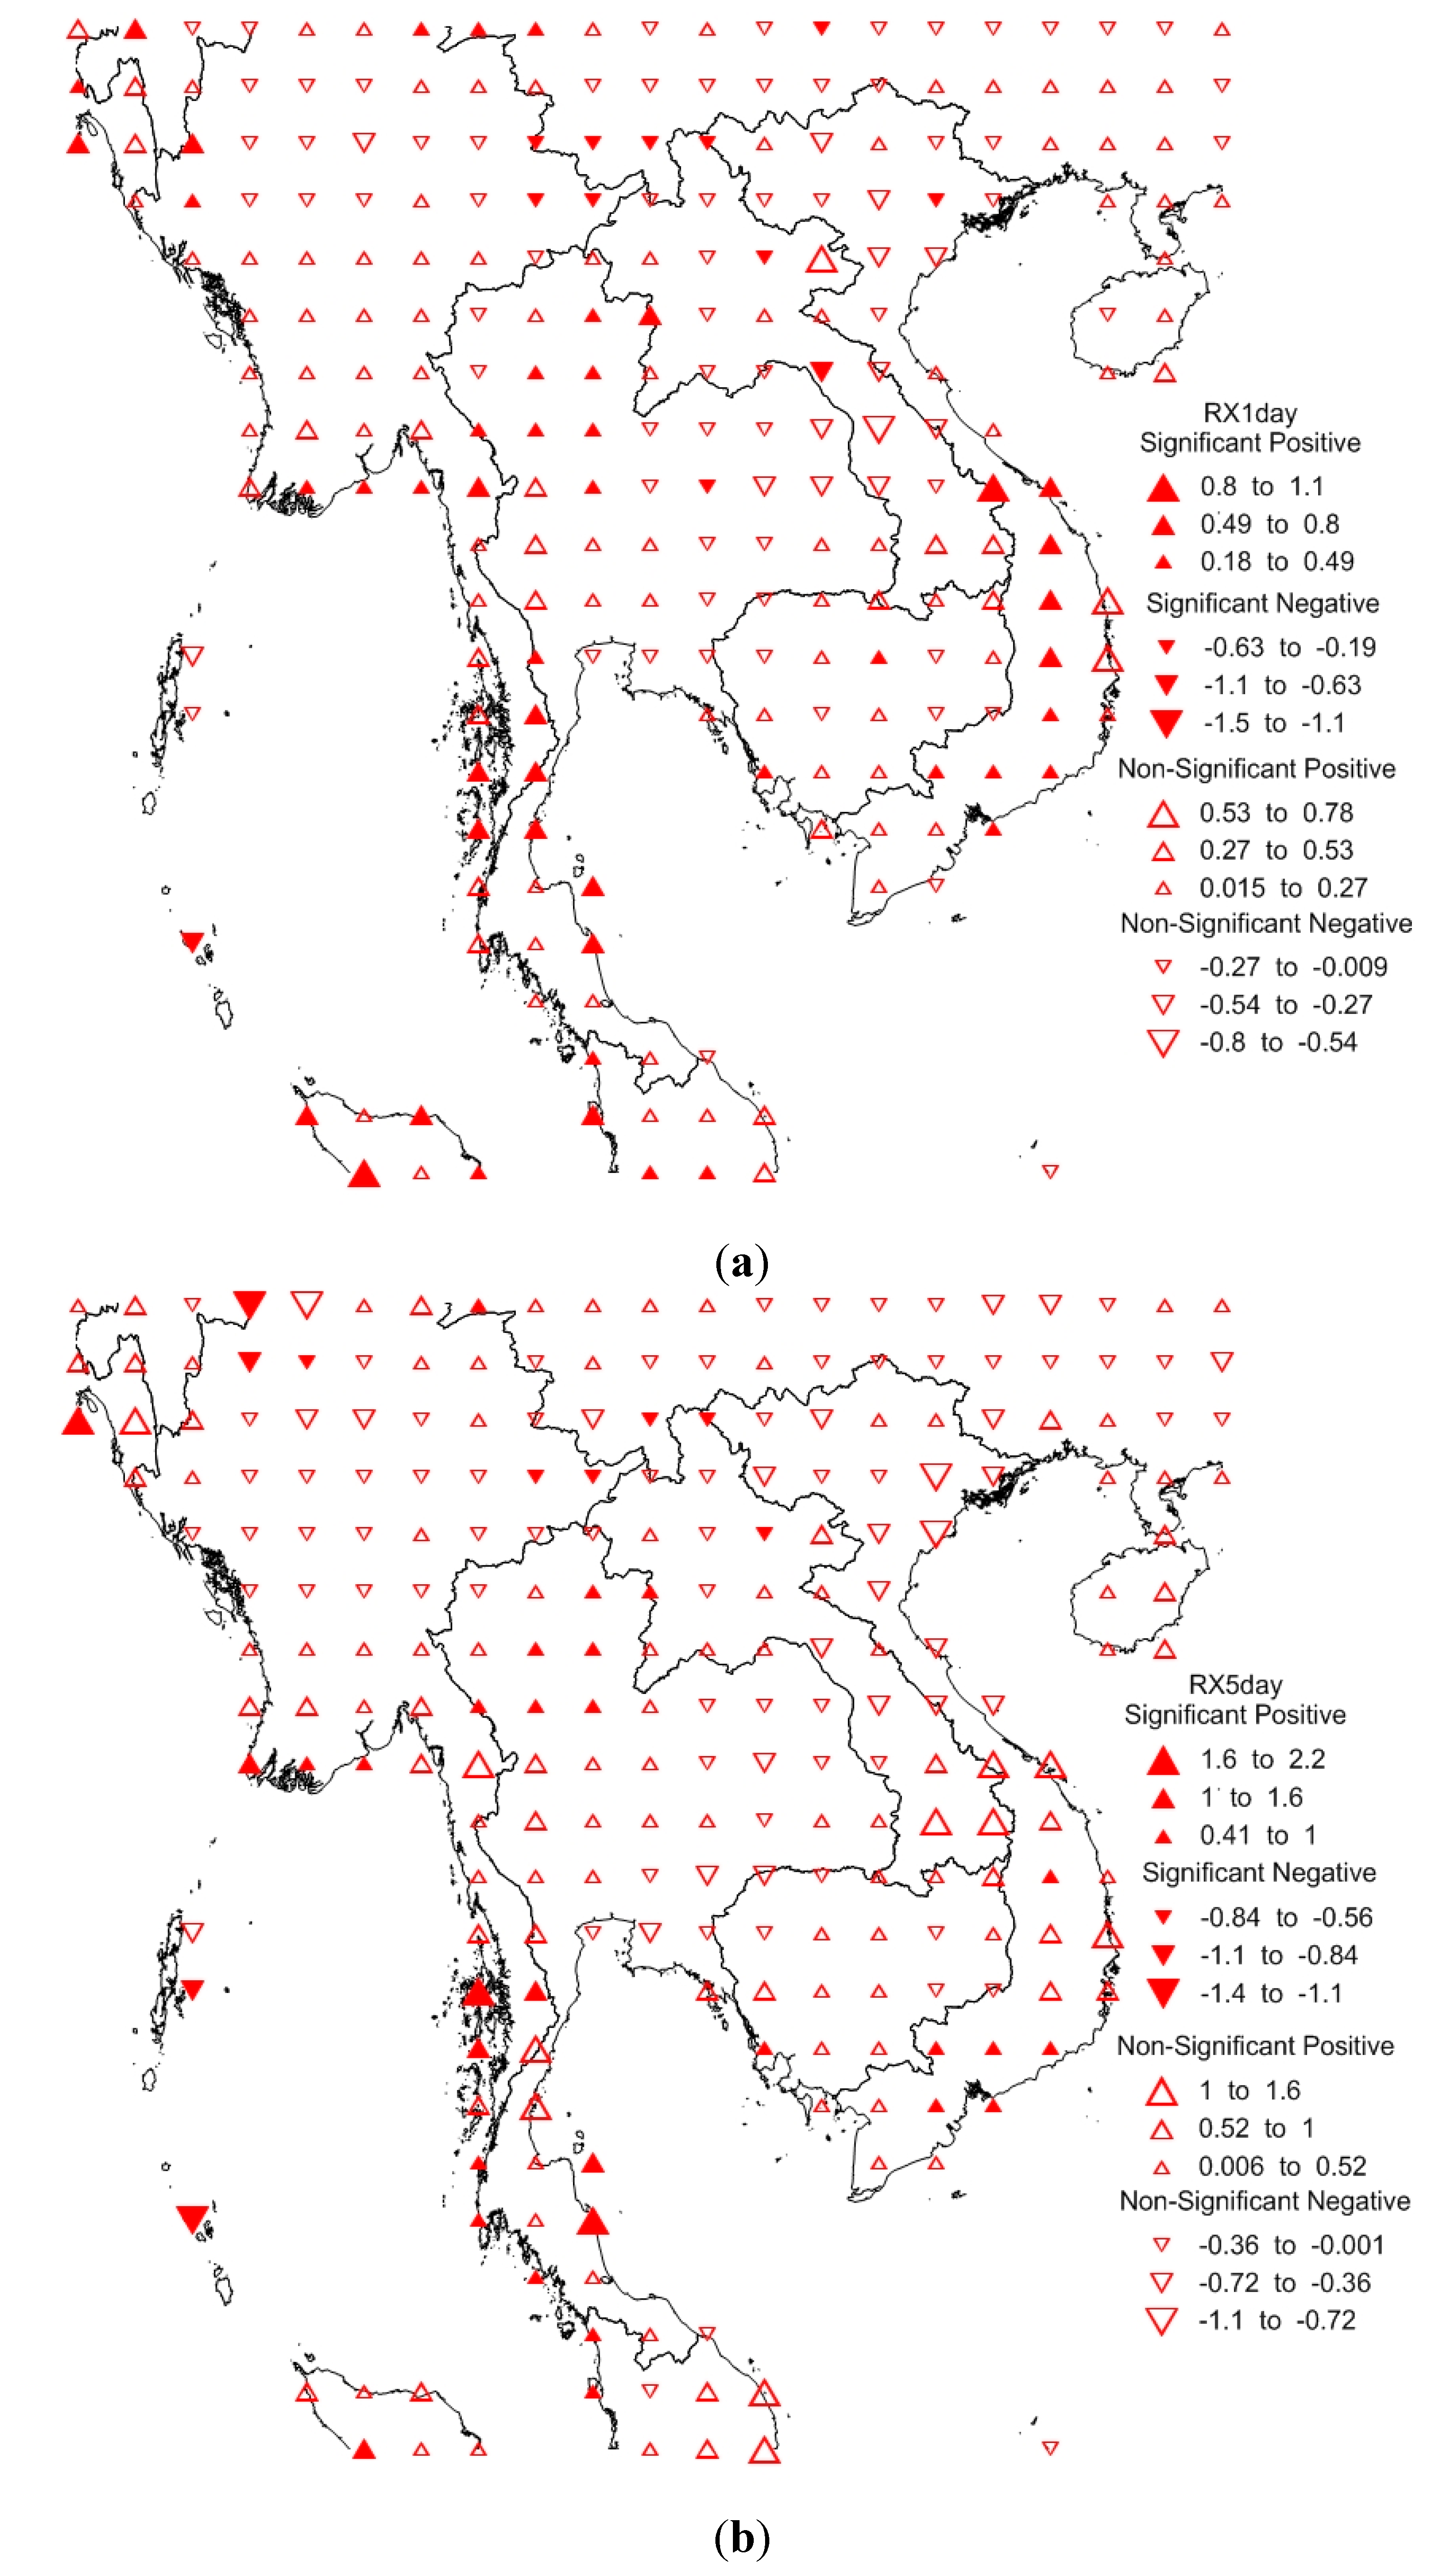
The daily maximum rainfall (RX1day) index shows the highest amount of rainfall in a single day of each year. From the simulation results, 12 grids show significant negative trends with the most significant trends at 93.25–8.25 with a slope of −0.67, and 49 grids show significant positive trends with the most significant trend at 96.25–4.25 with a slope of 1.111. Otherwise, 79 grids indicate non-significant negative trends, and 105 grids show non-significant positive trends (
Figure 10).
In the five-day maximum rainfall (RX5day) index simulation result, 207 grids show non-significant trends, and 39 grids show significant trends. The most significant negative trend is at 94.25–24.25 with a slope of −1.3859, and the most significant positive trend is at 91.25–22.25 with a slope of 2.2312 (
Figure 11).
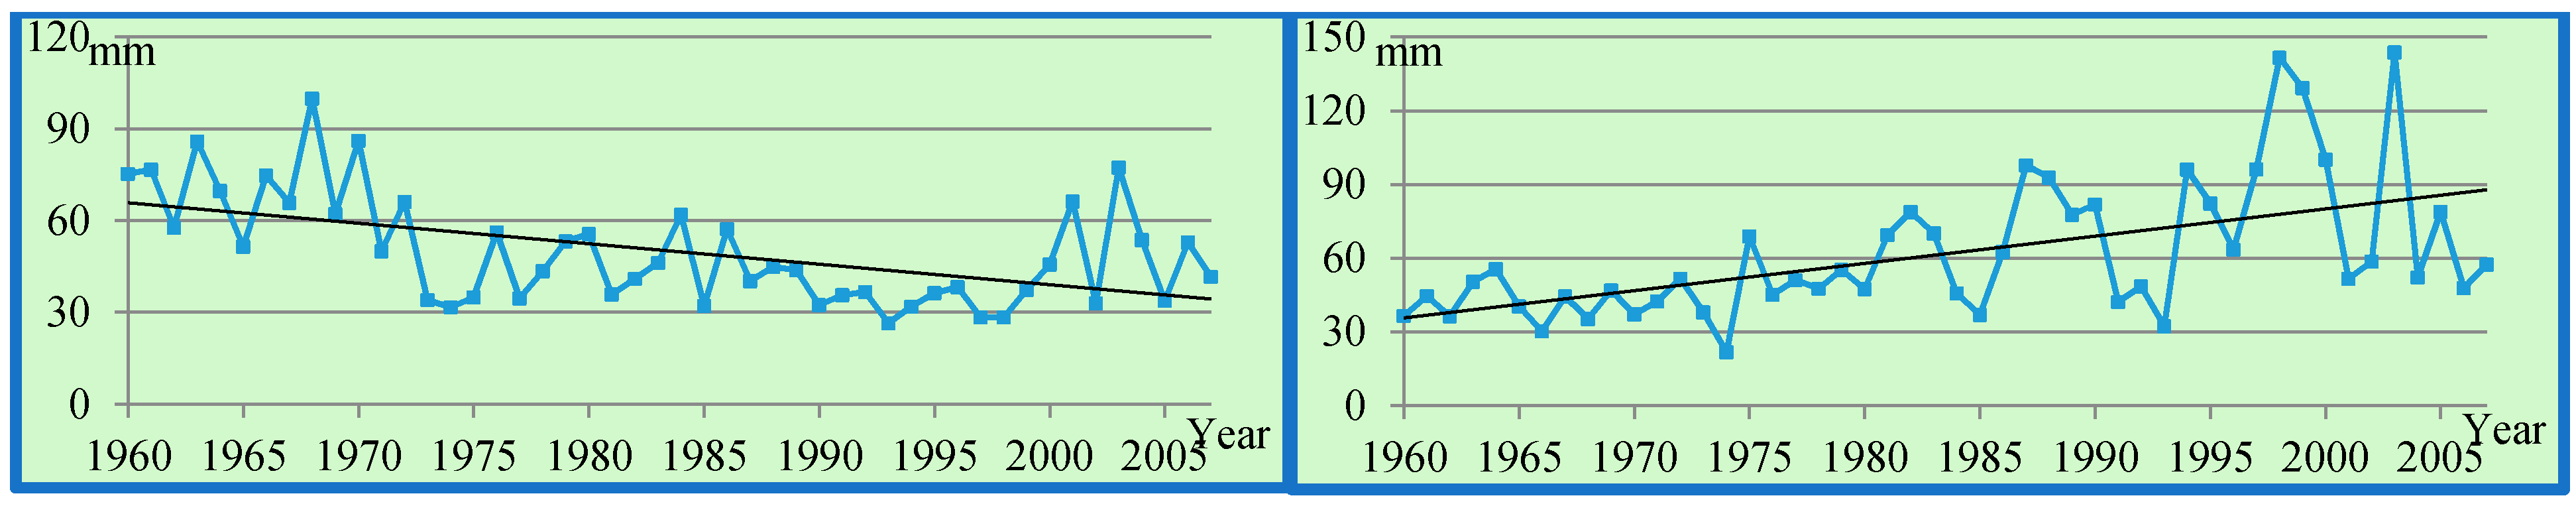
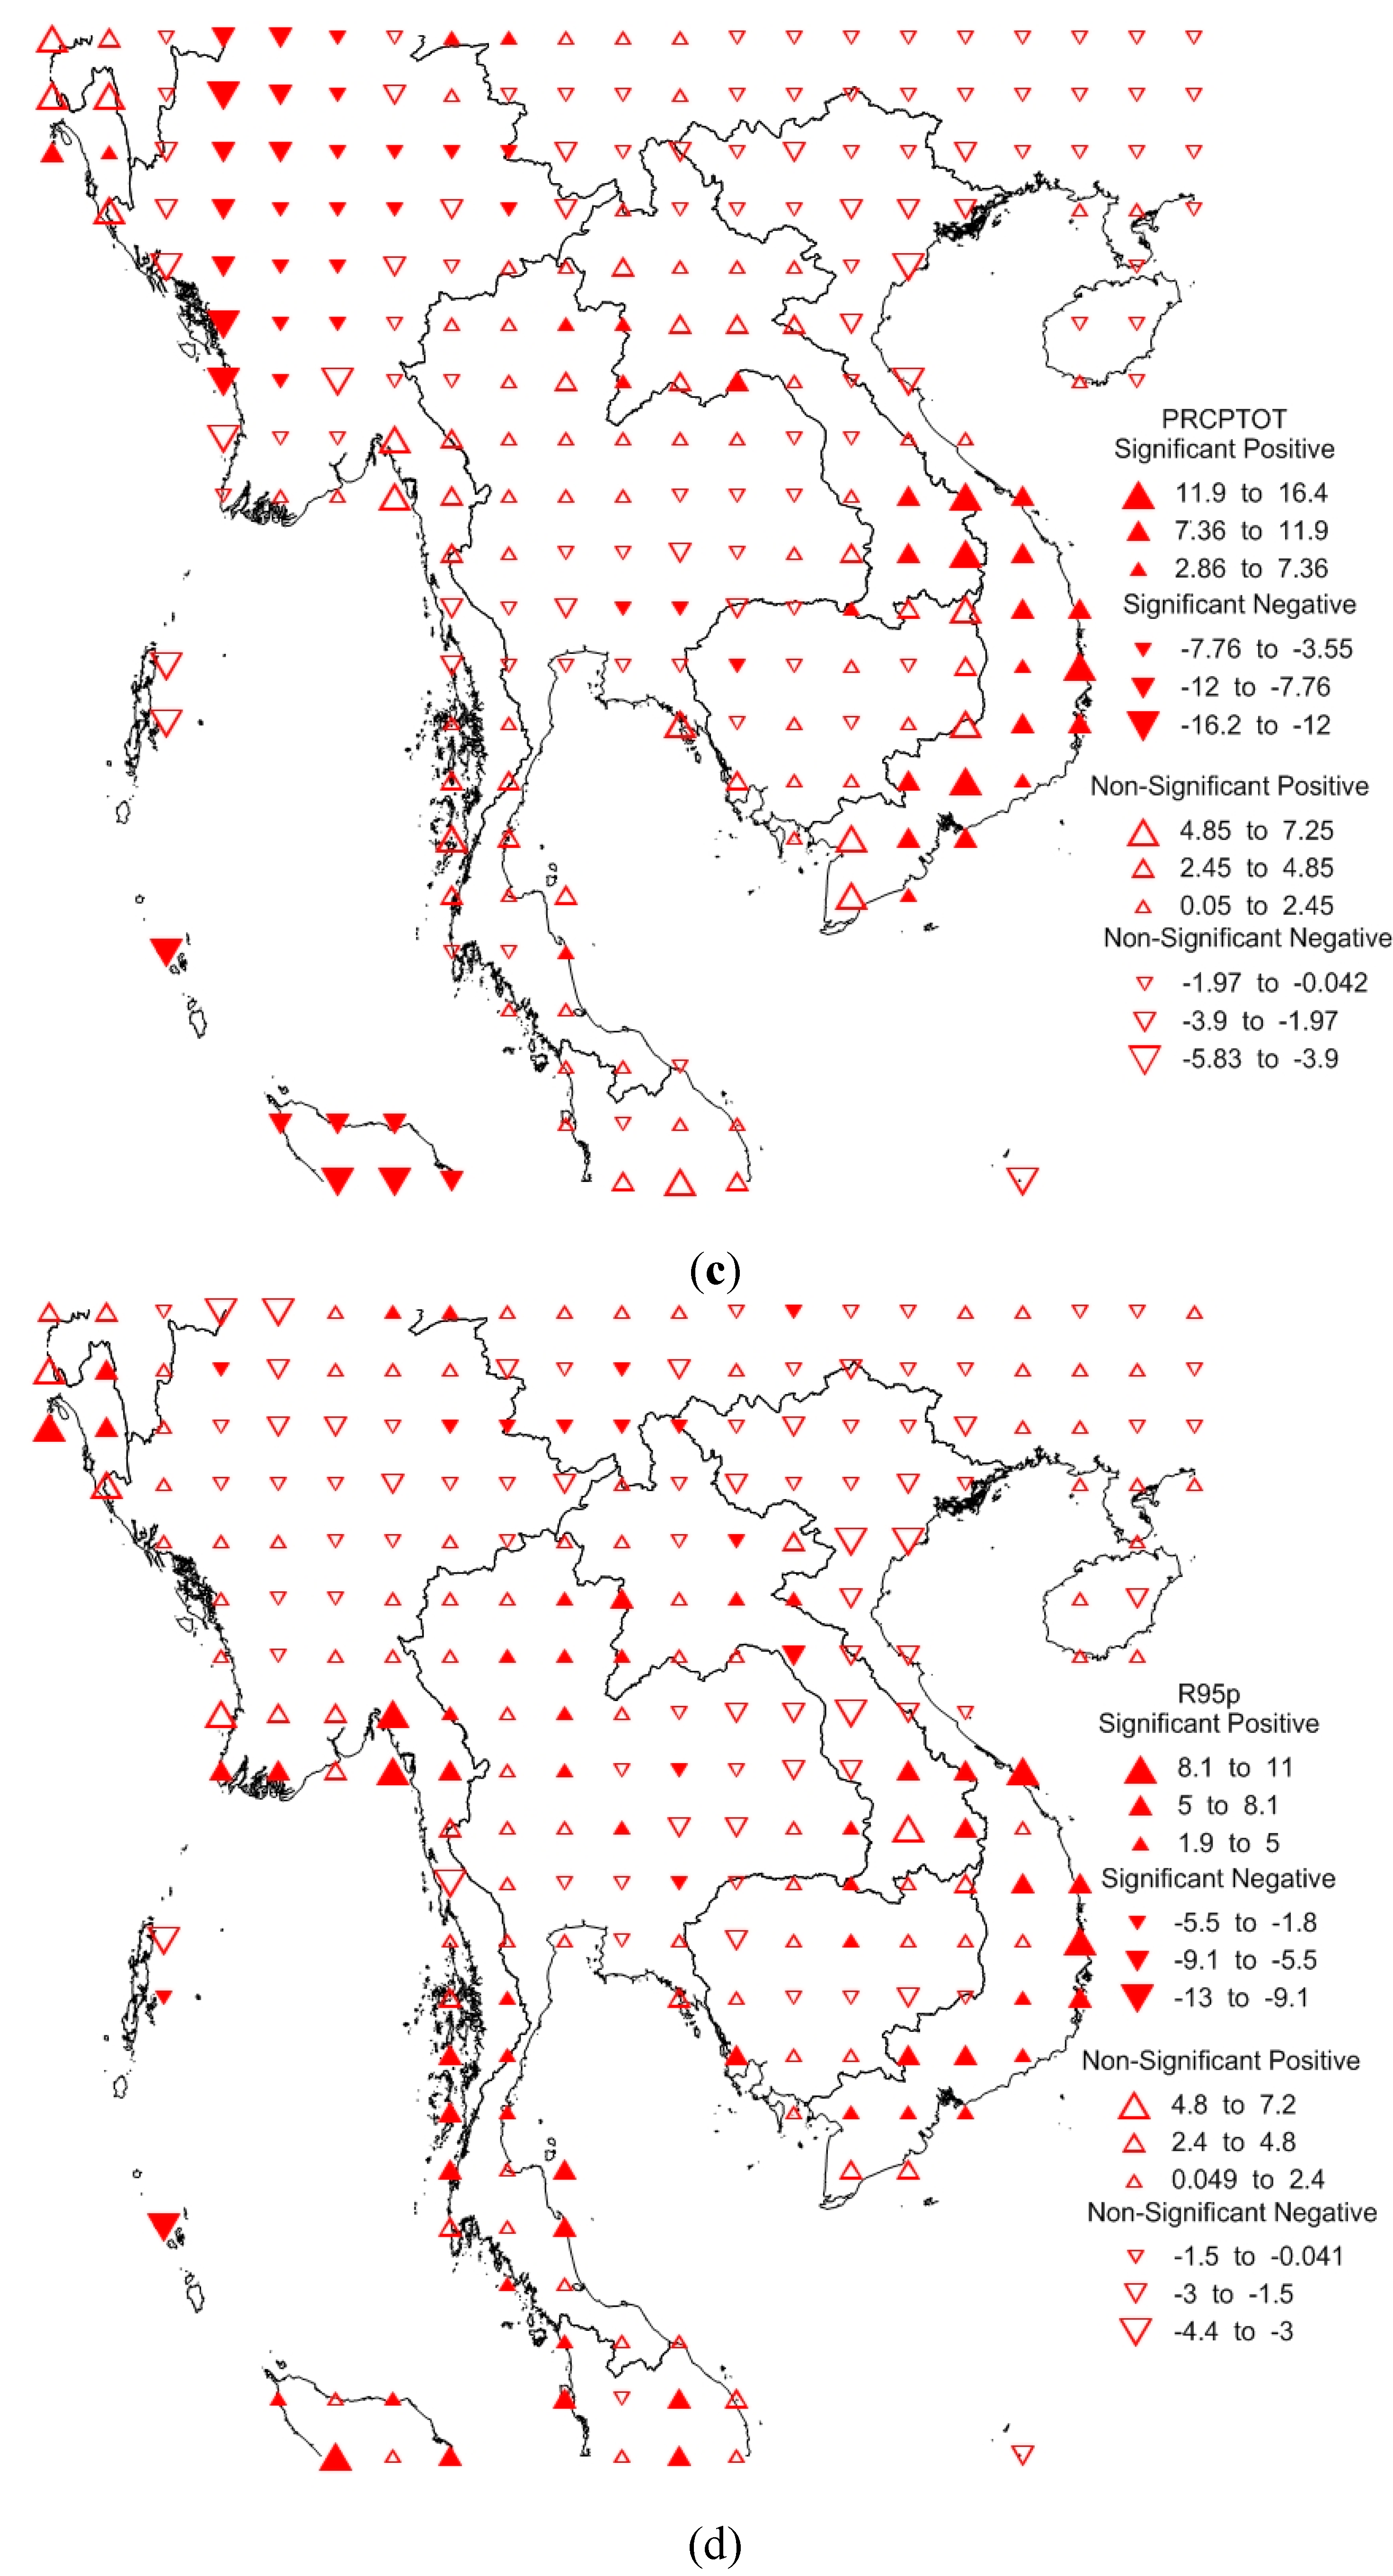
In the annual wet-day rainfall total (PRCPTOT) index, 66 grids show significant trends, and 181 grids show non-significant trends, where 12.5% of grids show significant positive trends, 33.46% show non-significant positive trends, 14.11% show significant negative trends, and 39.51% show non-significant negative trends (see
Table 3). The most significant positive trend is at 109.25–13.25 with a slope of 16.367, and the most significant negative trend is found at 93.25–8.25 with a slope of −16.178 (
Figure 12).
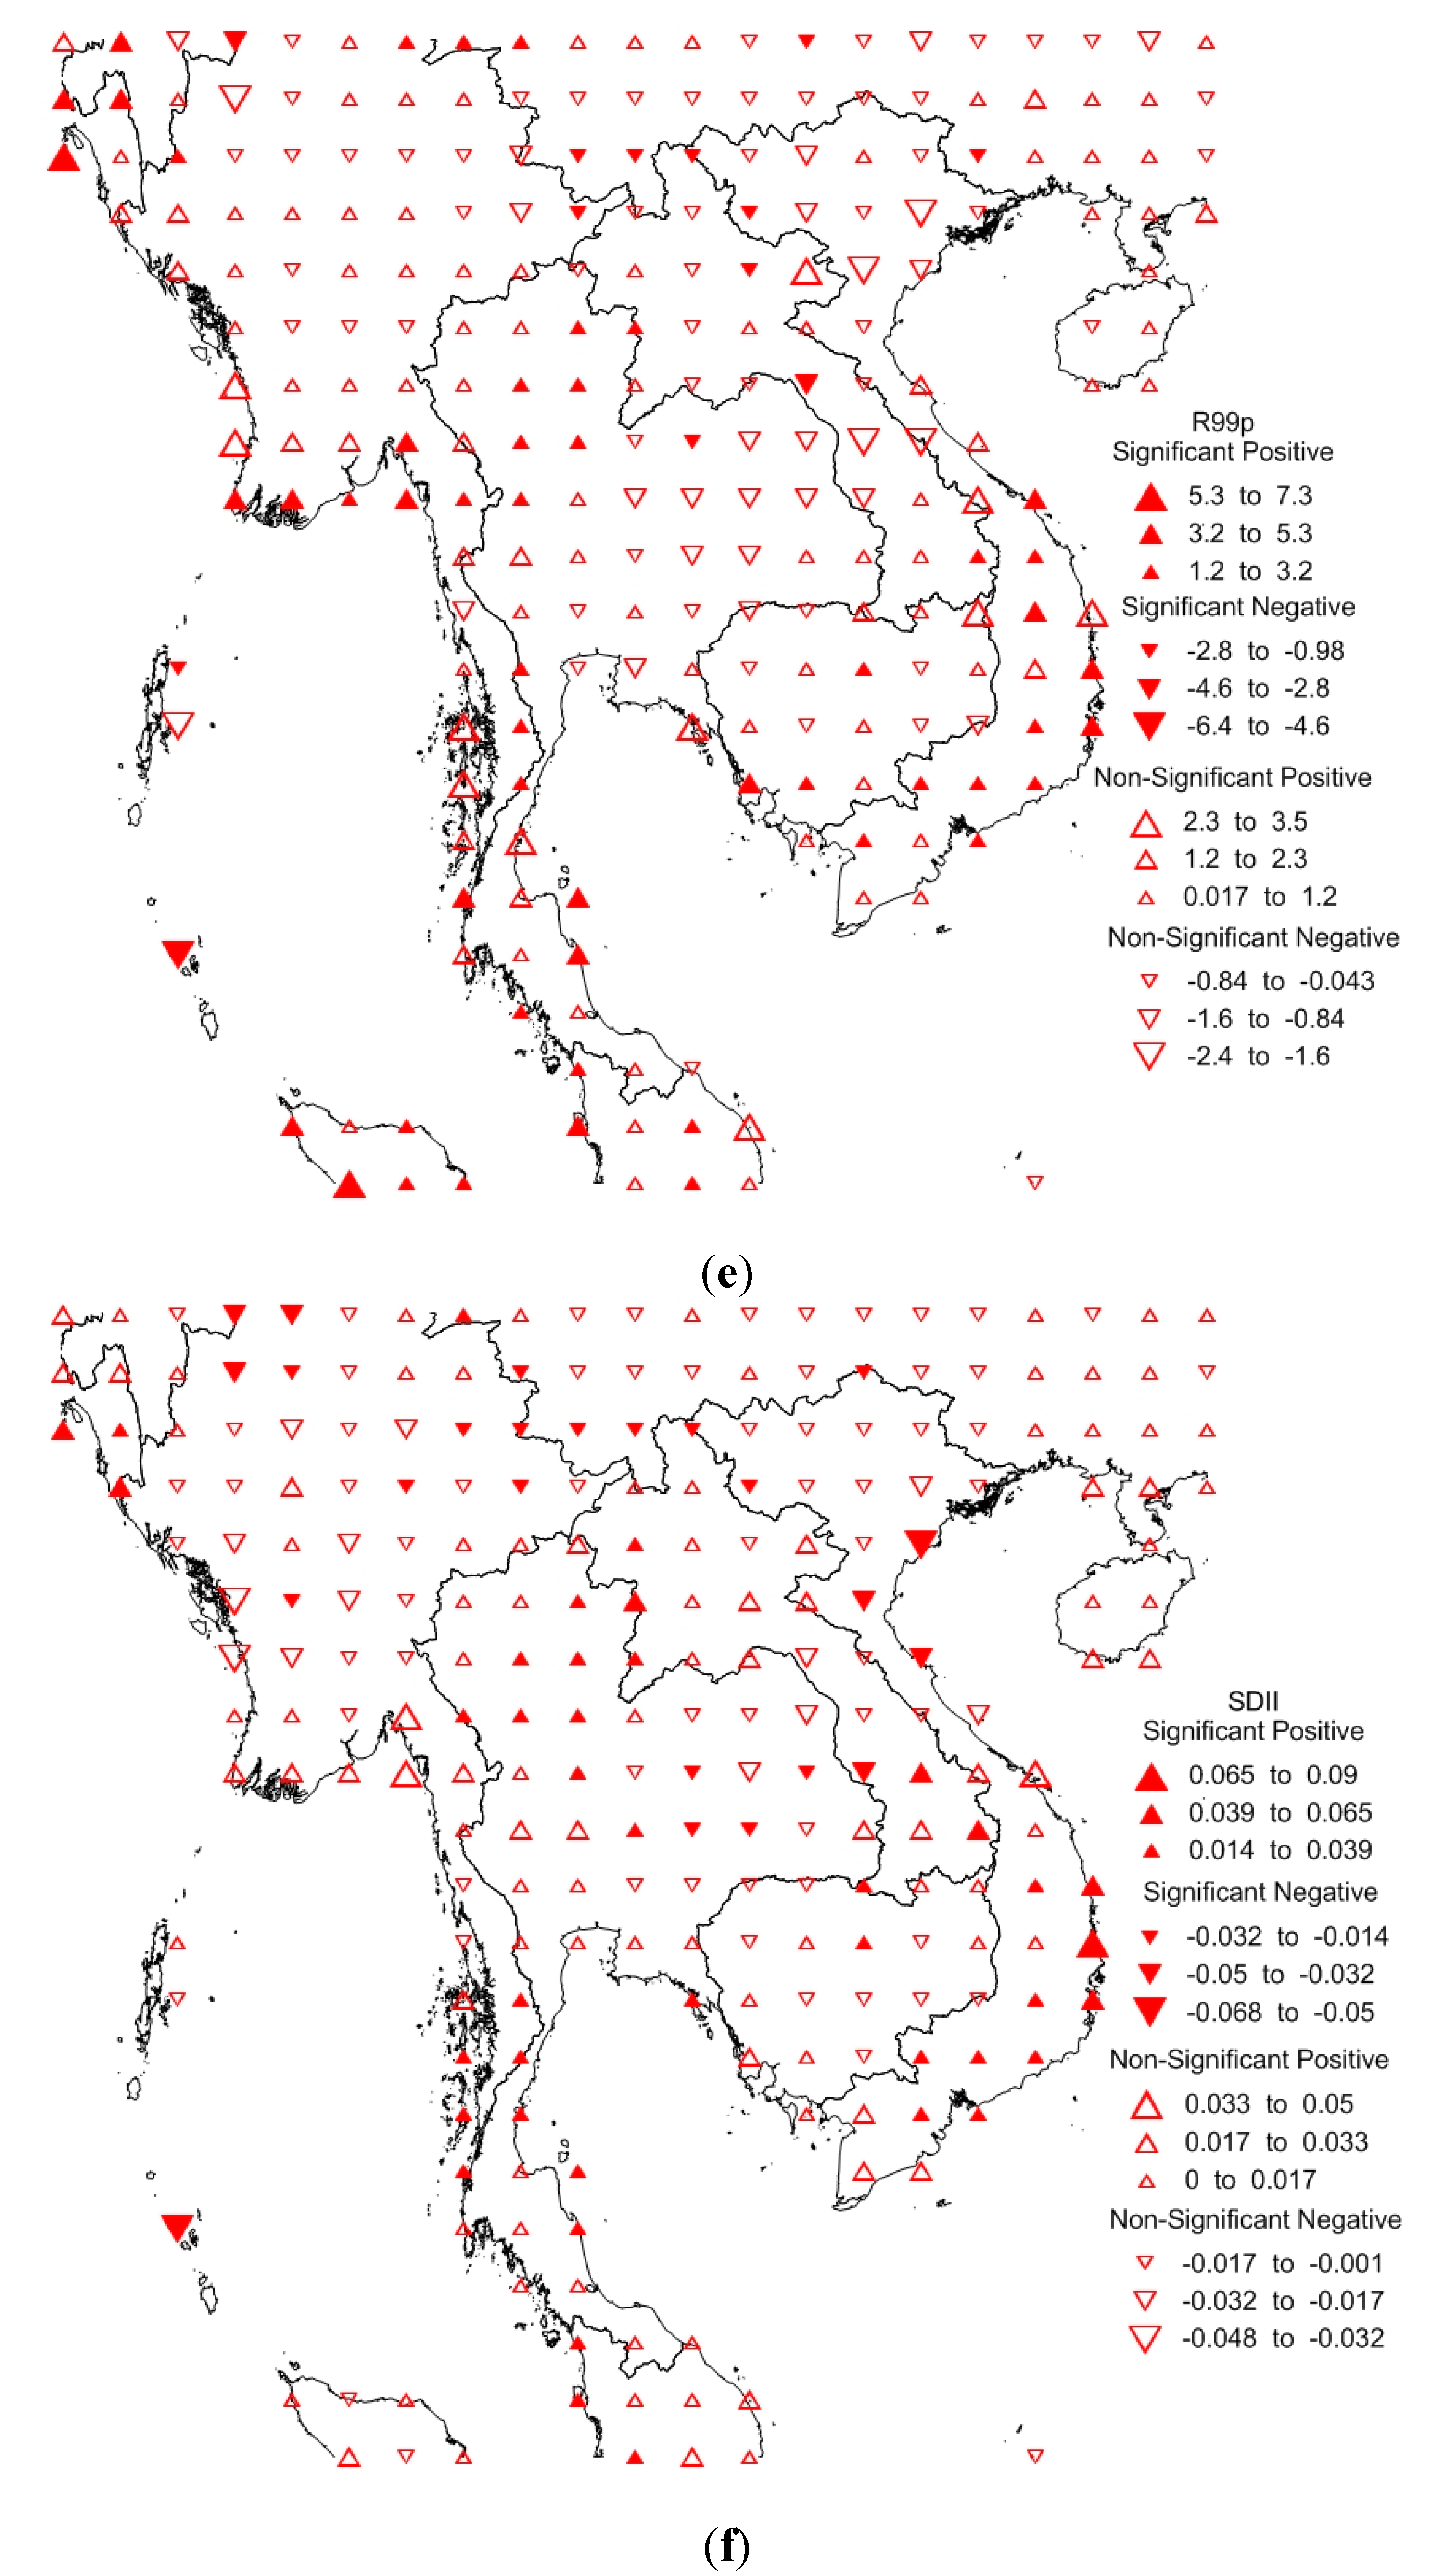
From the very wet day (R95p) and extremely wet day (R99p) indices, the R95p index demonstrates that 74 grids show significant trends and 173 grids show non-significant trends. The most significant positive trend is at 109.25–13.25 with a slope of 11.127, and the most significant negative trend is at 93.25–8.25 with a slope of −12.822 (
Figure 13). The simulation result of the R99p index shows that 68 grids indicate significant trends, and 179 grids indicate non-significant trends. The most significant positive trend of the R99p index is at 91.25–22.25 with a slope of 7.309, and the most significant negative trend is at 93.25–825 with a slope of −6.3959 (
Figure 14).
Figure 10.
The most significant negative trend with a slope of −0.6701 (left) and the most significant positive trend with a slope of 0.1116 (right) of the RX1day index.
Figure 10.
The most significant negative trend with a slope of −0.6701 (left) and the most significant positive trend with a slope of 0.1116 (right) of the RX1day index.
Figure 11.
The most significant negative trend with a slope of −1.3859 (left) and the most significant positive trend with a slope of 2.2312 (right) of the RX5day index.
Figure 11.
The most significant negative trend with a slope of −1.3859 (left) and the most significant positive trend with a slope of 2.2312 (right) of the RX5day index.
Figure 12.
The most significant negative trend with a slope of −16.178 (left) and the most significant positive trend with a slope of 16.367 (right) of the PRCPTOT index.
Figure 12.
The most significant negative trend with a slope of −16.178 (left) and the most significant positive trend with a slope of 16.367 (right) of the PRCPTOT index.
The Simple Daily Intensity Index (SDII) index is the ratio between the annual wet-day rainfall total and the total number of rainy days. There are 68 grids form the 248 grids that experience significant trends, and the remaining 179 grids experience non-significant trends, where 17.74% of grids show significant positive trends, 40.72% show non-significant positive trends, 9.67% show significant negative trends, and 31.45% show non-significant negative trends (see
Table 3). The most significant positive trend is at 90.25–22.25 with a slope of 0.0903, and the most significant negative trend is found at 93.25–8.25 with a slope of −0.0681 (
Figure 15).
Table 3 is a summary of the percentage of intensity indices in the study area.
Figure 13.
The most significant negative trend with a slope of −12.822 (left) and the most significant positive trend with a slope of 11.127 (right) of the R95p index.
Figure 13.
The most significant negative trend with a slope of −12.822 (left) and the most significant positive trend with a slope of 11.127 (right) of the R95p index.
Figure 14.
The most significant negative trend with a slope of −6.3959 (left) and the most significant positive trend with a slope of 7.3096 (right) of the R99p index.
Figure 14.
The most significant negative trend with a slope of −6.3959 (left) and the most significant positive trend with a slope of 7.3096 (right) of the R99p index.
Figure 15.
The most significant negative trend with a slope of −0.0681 (left) and the most significant positive trend with a slope of 0.0903 (right) of the SDII index.
Figure 15.
The most significant negative trend with a slope of −0.0681 (left) and the most significant positive trend with a slope of 0.0903 (right) of the SDII index.
Table 3.
Percentage of significant and non-significant trends of intensity indices.
Table 3.
Percentage of significant and non-significant trends of intensity indices.
| Indices | Positive Significant Trend (%) | Positive Non Significant Trend (%) | Negative Significant Trend (%) | Negative Non Significant Trend (%) |
|---|
| RX1day | 20.16 | 42.74 | 4.83 | 31.85 |
| RX5day | 24.19 | 37.9 | 5.64 | 31.85 |
| PRCPTOT | 12.5 | 33.46 | 14.11 | 39.51 |
| SDII | 17.74 | 40.72 | 9.67 | 31.45 |
| R95p | 24.19 | 37.90 | 5.64 | 31.85 |
| R99p | 22.17 | 39.91 | 5.24 | 32.25 |
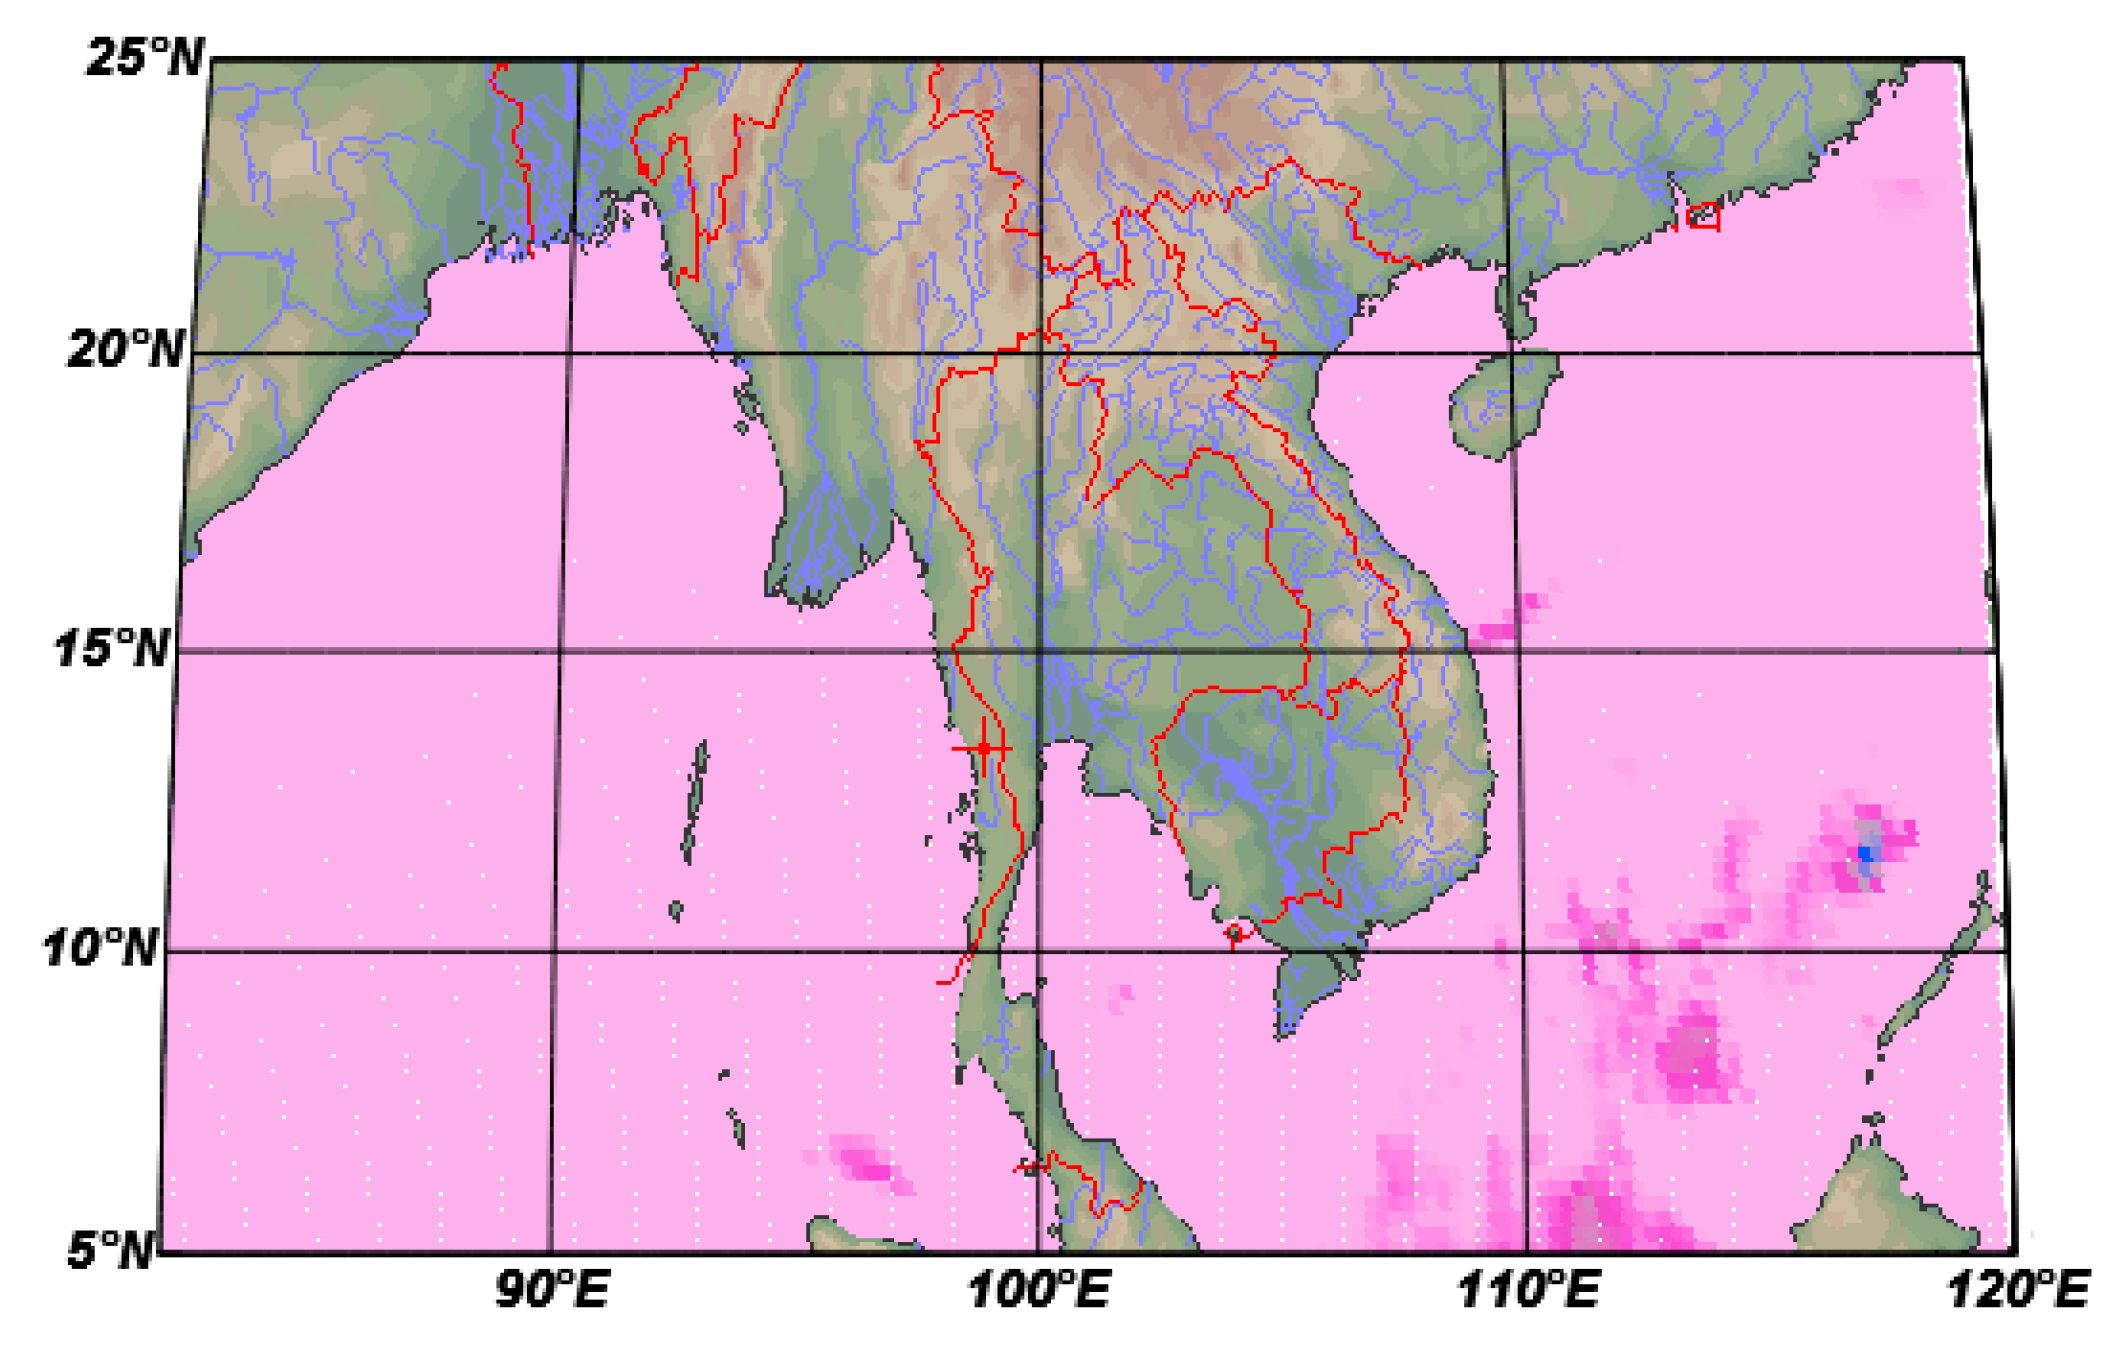
Because the population of the Indochina Peninsula countries (Vietnam, Thailand, Myanmar, Cambodia, Laos, and some parts of Malaysia, China, Bangladesh, and India) total nearly 250 million people, the Indochina Peninsula is a center of southeastern Asia economic activities. Therefore, the analysis of extreme rainfall events in this area is very important because extreme rainfall results in several disasters, such as floods and landslides, affecting human activity.
A majority of the Indochina Peninsula residents live in the major cities, such as Bangkok, Phnom Penh, Saigon, Hanoi, Vientiane, and Yangon. Additionally, these cities are the administrative center of southeastern Asian countries, the center of economic development, industrialization, and infrastructure establishment. Thus, extreme rainfall analysis is imperative in this area.
Table 4,
Table 5 and
Table 6 explain the extreme rainfall indices through the major cities over the Indochina Peninsula, including Bangkok, Phnom Penh, Saigon, Hanoi, Vientiane, and Yangon. Hanoi experiences a negative trend in most indices, except Consecutive Wet Days (CWD) index, while Phnom Penh experiences positive trends in all indices. All other cities experience both positive and negative trends evenly.
Impacts resulting from extreme rainfall events, such as floods, landslides, droughts, and other related disasters, are associated with increasing urbanization, industrialization, infrastructures and economic development in the Indochina Peninsula countries and can be anticipated.
Table 4.
The trends of frequency indices close to major cities in the Indochina Peninsula.
Table 4.
The trends of frequency indices close to major cities in the Indochina Peninsula.
| No | Lat | Lon | Near City | R10mm | R20mm | R25mm | CDD | CWD |
|---|
| Days | Days | Days | Days | Days |
|---|
| 1 | 100.25 | 14.25 | Bangkok | −0.103 | −0.003 | −0.009 | 0.599 | −0.096 |
| 2 | 104.25 | 11.25 | Phnom Penh | 0.041 | 0.058 | 0.05 | 0.404 | 0.291 |
| 3 | 105.25 | 21.25 | Hanoi | −0.091 | −0.051 | −0.005 | −0.062 | 0.054 |
| 4 | 106.25 | 10.25 | Saigon | 0.277 | 0.084 | 0.029 | −0.578 | 0.36 |
| 5 | 102.25 | 17.25 | Vientiane | 0.012 | −0.021 | −0.013 | 0.184 | 0.204 |
| 6 | 96.25 | 16.25 | Yangon | −0.059 | −0.056 | 0.067 | 0.363 | −0.897 |
Table 5.
The trends of intensity indices close to major cities in Indochina.
Table 5.
The trends of intensity indices close to major cities in Indochina.
| No | Lat | Lon | Near City | RX1 Day | RX5 Day | PRCPTOT |
|---|
| mm | mm | Mm |
|---|
| 1 | 100.25 | 13.25 | Bangkok | 0.181 | 0.074 | −2.353 |
| 2 | 104.25 | 11.25 | Phnom Penh | 0.135 | 0.4 | 0.475 |
| 3 | 105.25 | 21.25 | Hanoi | −0.363 | −0.357 | −2.154 |
| 4 | 106.25 | 10.25 | Saigon | 0.133 | 0.413 | 7.602 |
| 5 | 102.25 | 17.25 | Vientiane | −0.208 | −0.021 | 0.505 |
| 6 | 96.25 | 16.25 | Yangon | 0.4 | 0.802 | 1.587 |
Table 6.
The trends of intensity indices close to major cities in Indochina (Continued).
Table 6.
The trends of intensity indices close to major cities in Indochina (Continued).
| No | Lat | Lon | Near City | SDII | R95p | R99p |
|---|
| mm/day | mm | Mm |
|---|
| 1 | 100.25 | 13.25 | Bangkok | 0.003 | 0.411 | −0.587 |
| 2 | 104.25 | 11.25 | Phnom Penh | 0.011 | 1.819 | 1.453 |
| 3 | 105.25 | 21.25 | Hanoi | −0.015 | −1.176 | −0.663 |
| 4 | 106.25 | 10.25 | Saigon | 0.017 | 2.517 | 1.096 |
| 5 | 102.25 | 17.25 | Vientiane | −0.01 | −1.209 | −1.314 |
| 6 | 96.25 | 16.25 | Yangon | 0.017 | 4.269 | 2.841 |
Table 4,
Table 5 and
Table 6 conclude the precipitation trends close to the major cities in the Indochina Peninsula, where Hanoi and Saigon are located in the eastern area of the Indochina Peninsula, Vientiane and Phnom Penh are located in the central are of the Indochina Peninsula, and Bangkok and Yangon are located in the western area of the Indochina Peninsula.
Hanoi and Saigon experience negative trends in the CCD index as it is influenced by the two cities being located in the coastal area facing to the Pacific Ocean and by the northeastern monsoon, which occurs every October until March. Yangon and Bangkok experience positive trends in contrast to those in the eastern area of the Indochina Peninsula and are influenced strongly by the southwestern monsoon, which occurs every May until September. Meanwhile, the two cities in the central area of the Indochina Peninsula, Vientiane and Phnom Penh, experience positive trends but with a lower slope.
The opposite pattern is shown from the CDD index, of which Hanoi and Saigon experience positive trends, Yangon and Bangkok experience negative trends, Vientiane and Phnom Penh experience negative trends. Hanoi experiences a negative trend in most indices except the CWD index, while Saigon experiences a positive trend in most indices, except CDD index, despite the two cities being located in the eastern area of the Indochina Peninsula. This difference is because Hanoi is located in the northern Vietnam, whereas Saigon is located in southern Vietnam and is influenced by the northeastern and southwestern monsoons, which occur successively every year. Meanwhile, the remaining indices occur randomly between positive (negative) significant (non-significant) trends.


