Abstract
The transportation sector is a major factor contributing to climate change. Transportation Network Companies (TNC) may become part of solutions to reduce emissions and their drivers play an important role in doing so. This study aims to understand TNC driver’s perceptions of climate change, to understand how climate change and extreme weather affects their business and how they see their role in contributing to or mitigating climate change. We conducted an in-person survey of TNC drivers in Nevada, USA, and analyzed the derived information with descriptive statistics and content analysis. Among the 75 TNC drivers, almost half believe climate change is happening and is caused by human activities. We found TNC drivers and their business are affected by extreme weather events. Currently the drivers do not see their role in mitigating climate change and lack the awareness of green initiatives already in place by TNCs’. We conclude that TNCs could increase their climate change responsibility by providing driver incentives for cars with reduced emissions or by geographically expanding customer incentives for using sustainable TNC options such as car-pooling. By doing so, TNC may play a role in reducing global greenhouse gas emissions and traffic congestion; thus, contributing to improved sustainable transportation practices.
1. Introduction
Human activities and the associated emissions have long-lasting effects on the climate system, with severe climate-related risks for humans as well as ecosystems [1]. Among many other factors, transportation of people and goods is a major source for emissions to the atmosphere [1,2,3]—accounting for about 20% of global CO2 emissions in recent years [4]. Thus, the transportation sector is increasingly under pressure to reduce emissions [5], and Transportation Network Companies (TNCs) may become part of the solutions [6].
TNCs, such as Uber and Lyft, are app-based ride-sourcing companies, where a customer can request a ride from a nearby TNC driver who works on a flexible schedule and drives their own vehicle [7,8]. Since the launch of TNCs in the early 2010s, there have been billions of rides taken and millions of participating drivers, and TNC services have become available across many countries [9,10]. Recently, major TNCs have recognized their climate and environment responsibilities [3] by implementing emission-mitigating instruments, such as the introduction of multiple pick-up services in major cities (e.g., car-pooling), incentives for hybrid and electric vehicles, or carbon-offset purchases for rides [11,12].
There is mixed evidence supporting TNCs’ effects on emissions and traffic congestion that are influenced by consumer driving behaviors, public transit use, and availability of TNC drivers. In a study of TNC riders, researchers found most participants’ reasons for using TNCs was for ease of payment, the short waiting time, and because it was perceived as the fastest way to reach a destination [13]. In the same survey, 43% of TNC riders described not owning a vehicle and among TNC riders who owned a vehicle, approximately 40% described driving their owned vehicles less because of TNCs’ availability [13]. Additionally, between 2005 and 2015, researchers estimated there was a 3% decline in the United States per-capita vehicle registrations associated with the availability of TNCs [2]. Across 50 of the largest United States public transit agencies, rail use increased because TNC services provided rides to and from rail stations [14]. However, TNCs may have a negative effect on the number of bus rides [13,14,15,16]. In a study of 1.5 million TNC rides, drivers travelled approximately 21% more than the ride itself to reach TNC riders [17] and TNCs were found to be a major factor contributing to the growing congestion in recent years [15,16,17,18].
Despite the growing amount of research exploring TNCs’ emissions, effects on transportation [15,16,17,18,19,20,21,22], accessibility [13,14,15,16,17,18,19,20,21,22,23], and the TNC experience [3,4,5,6,7,8,9,10,11,12,13,14,15,16,17,18,19,20,21,22,23,24], there is currently no study that explores the perceptions of TNC drivers towards climate change. Therefore, we aim (1) to explore TNC drivers’ beliefs of climate change, (2) to understand how they perceive climate change impacts their TNC business, and (3) to examine how TNC drivers see their role in contributing to or mitigating climate change. By studying TNC drivers’ perceptions of climate change and their role in climate change actions, we can gain a better understanding of how TNCs’ can participate in mitigating climate change to generate improved sustainable practices in transportation.
2. Materials and Methods
2.1. Design and Sample
We conducted an exploratory descriptive study using data from an in-person survey of TNC drivers between March and December 2020. The interviews were conducted in Washoe County, Nevada, the United States. Washoe County is the second largest metropolitan area of the state with over 470,000 people living across 16,000 km2 and with a 12% population growth over the last decade [25]. The climate is arid with hot summers and cold winters (average high July temperature: 33 °C; average low temperature in January: −3 °C) and 3483 h of sunshine per year. The precipitation is concentrated during the winter months from December to January, resulting in an annual precipitation of <190 mm and approximately 550 mm of snow [26]. The University of Nevada, Reno Institutional Review Board gave this research an exempt determination.
Potential participants were recruited through an algorithm assignment provided by a TNC where the application matches available and nearby TNC drivers to customers. TNC drivers were eligible to participate if their English level was sufficient for a conversation and if they felt comfortable to have a conversation while driving a car. A total of 80 TNC drivers were invited to participate, of which five declined (94% response rate). We took an additional 21 rides with TNC drivers that participated in previous interviews; thus, ineligible to participate again. For this project, the TNC ride distance traveled was 778 km.
2.2. Data Collection
Prior to starting the survey, the investigator read a verbal statement about the study and informed the participant that the interview would last no longer than the duration of the ride and participation would not affect TNC tips or ratings. Participants provided verbal consent to participate.
The questionnaire was intentionally designed to be short enough to be completed within approximately ten minutes to accommodate short rides. Questions were created based on a review of previously published literature and research team expertise and were pilot tested with two participants initially before the survey. The pilot tested data were included in the final dataset. The questionnaire consisted of 18 questions that used a mixture of closed- and open-ended responses (Appendix A Table A1). The questionnaire began with general questions about the local weather, followed by questions specific to perceptions of and concerns for climate change, perceptions of TNC drivers in contributing to or mitigating climate change, knowledge about TNCs’ green initiatives, and an open-ended question to allow for additional comments. The collected demographic questions assessed the origin of participants, length of time living in the local area, age, occupation, length of time working as a TNC driver, and TNC car type.
The investigator asked the questions and took handwritten notes of participants’ responses. After the interview, the investigator recorded field notes describing the length of the ride, date and time, travel origin and destination, and the overall atmosphere of the survey process. The investigator cleaned handwritten data for minor grammar edits and digitalized the information. The digital data were verified for accuracy by a second investigator.
2.3. Measures for Climate Change Belief Categories
All participants were assigned to a climate change belief category based on their overall interview statements. Two investigators independently assigned climate change belief categories and disagreements were resolved by discussion. The categories broadly followed previous research on climate change beliefs within the United States [27], but were further merged for the purpose of this study to
- “Climate change is not happening”, which included participants believing that the climate is not changing and denying a human cause;
- “Climate change is not human related” for cautious participants that are aware of climate change but do not believe in a human cause;
- “Unsure of climate change”, including disengaged participants that had no opinion on climate change or unaware of climate change;
- “Climate change is caused by humans” for alarmed and concerned participants that are aware of climate change and attributing a human cause to it;
- “Unclear data” to classify participants that made no clear statements in regard to their climate change beliefs.
2.4. Data Analysis
Data analysis occurred in parallel with data collection and was finalized after data collection was complete. Closed-ended questions were analyzed within Stata v. 16.1 [28] using descriptive statistics. Open-ended questions were analyzed using a conventional or inductive content analysis approach [29,30]. To analyze the open-ended questions, we first created an open-ended coding scheme based on data from the first five interviews. Then, we coded the rest of the interviews based on discussion and consensus voting among two researchers using the coding scheme. Following open-coding, we refined, re-coded, sorted data into categories, and counted participants within categories. Exemplar participant statements were extracted to provide a rich description of categories. We evaluated the open-ended data’s trustworthiness using the Lincoln and Guba (1985) framework [31]. In our final data analysis step, we compared, contrasted, and merged the closed- and open-ended data to present the breadth and depth of the study aims [30].
3. Results
The sample consisted of 75 participants, of which 43% were full-time drivers, 39% were part-time drivers, and 19% were retired from other occupations (Table 1). Participants worked for TNCs for an average of two years (range: 1 week—5 years). Most participants worked with a gas-fueled Sedan or SUV (sport utility vehicle); 9% worked with an electric- or hybrid-fueled vehicle. Most participants (77%) originated from another state within the United States or outside the United States, and on average they lived in the Washoe county area for approximately 20 years.

Table 1.
Demographics of participants driving for Transportation Network Companies (TNCs) and data collected.
3.1. Climate Change Beliefs
Approximately half of participants (n = 36) believed that climate change is happening and is caused by human activities (Figure 1). For example, a participant stated, “Global warming is knocking on our door. It will cause future catastrophes”. Approximately a third of participants (36%) believed either that climate change is not happening or climate change is not caused by human activities. The participants believing that climate change is caused by human activities were also somewhat younger than participants denying a human cause to climate change, although all belief categories spanned ages from 30 to 70 years (Figure A1). We found nine categories for how participants described their climate change beliefs (Table 2). The main reasons were due to feelings that climate change is a political, economic, or societal instrument; climate change is caused by natural climate cycles; personal observations; scientific evidence for climate change. For example, one participant who believed that climate change is a political, economic, or societal instrument stated, “People try to control us to think that the climate is changing, and this is just to divide people”.
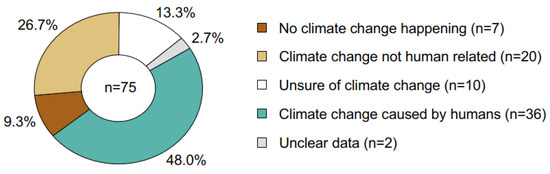
Figure 1.
Climate change belief categories of participants driving for TNCs (Transportation Network Companies).
Table 2.
Reasons for climate change (dis)-beliefs and disbeliefs among participants driving for TNCs (Transportation Network Companies). number of participants: n = 75.
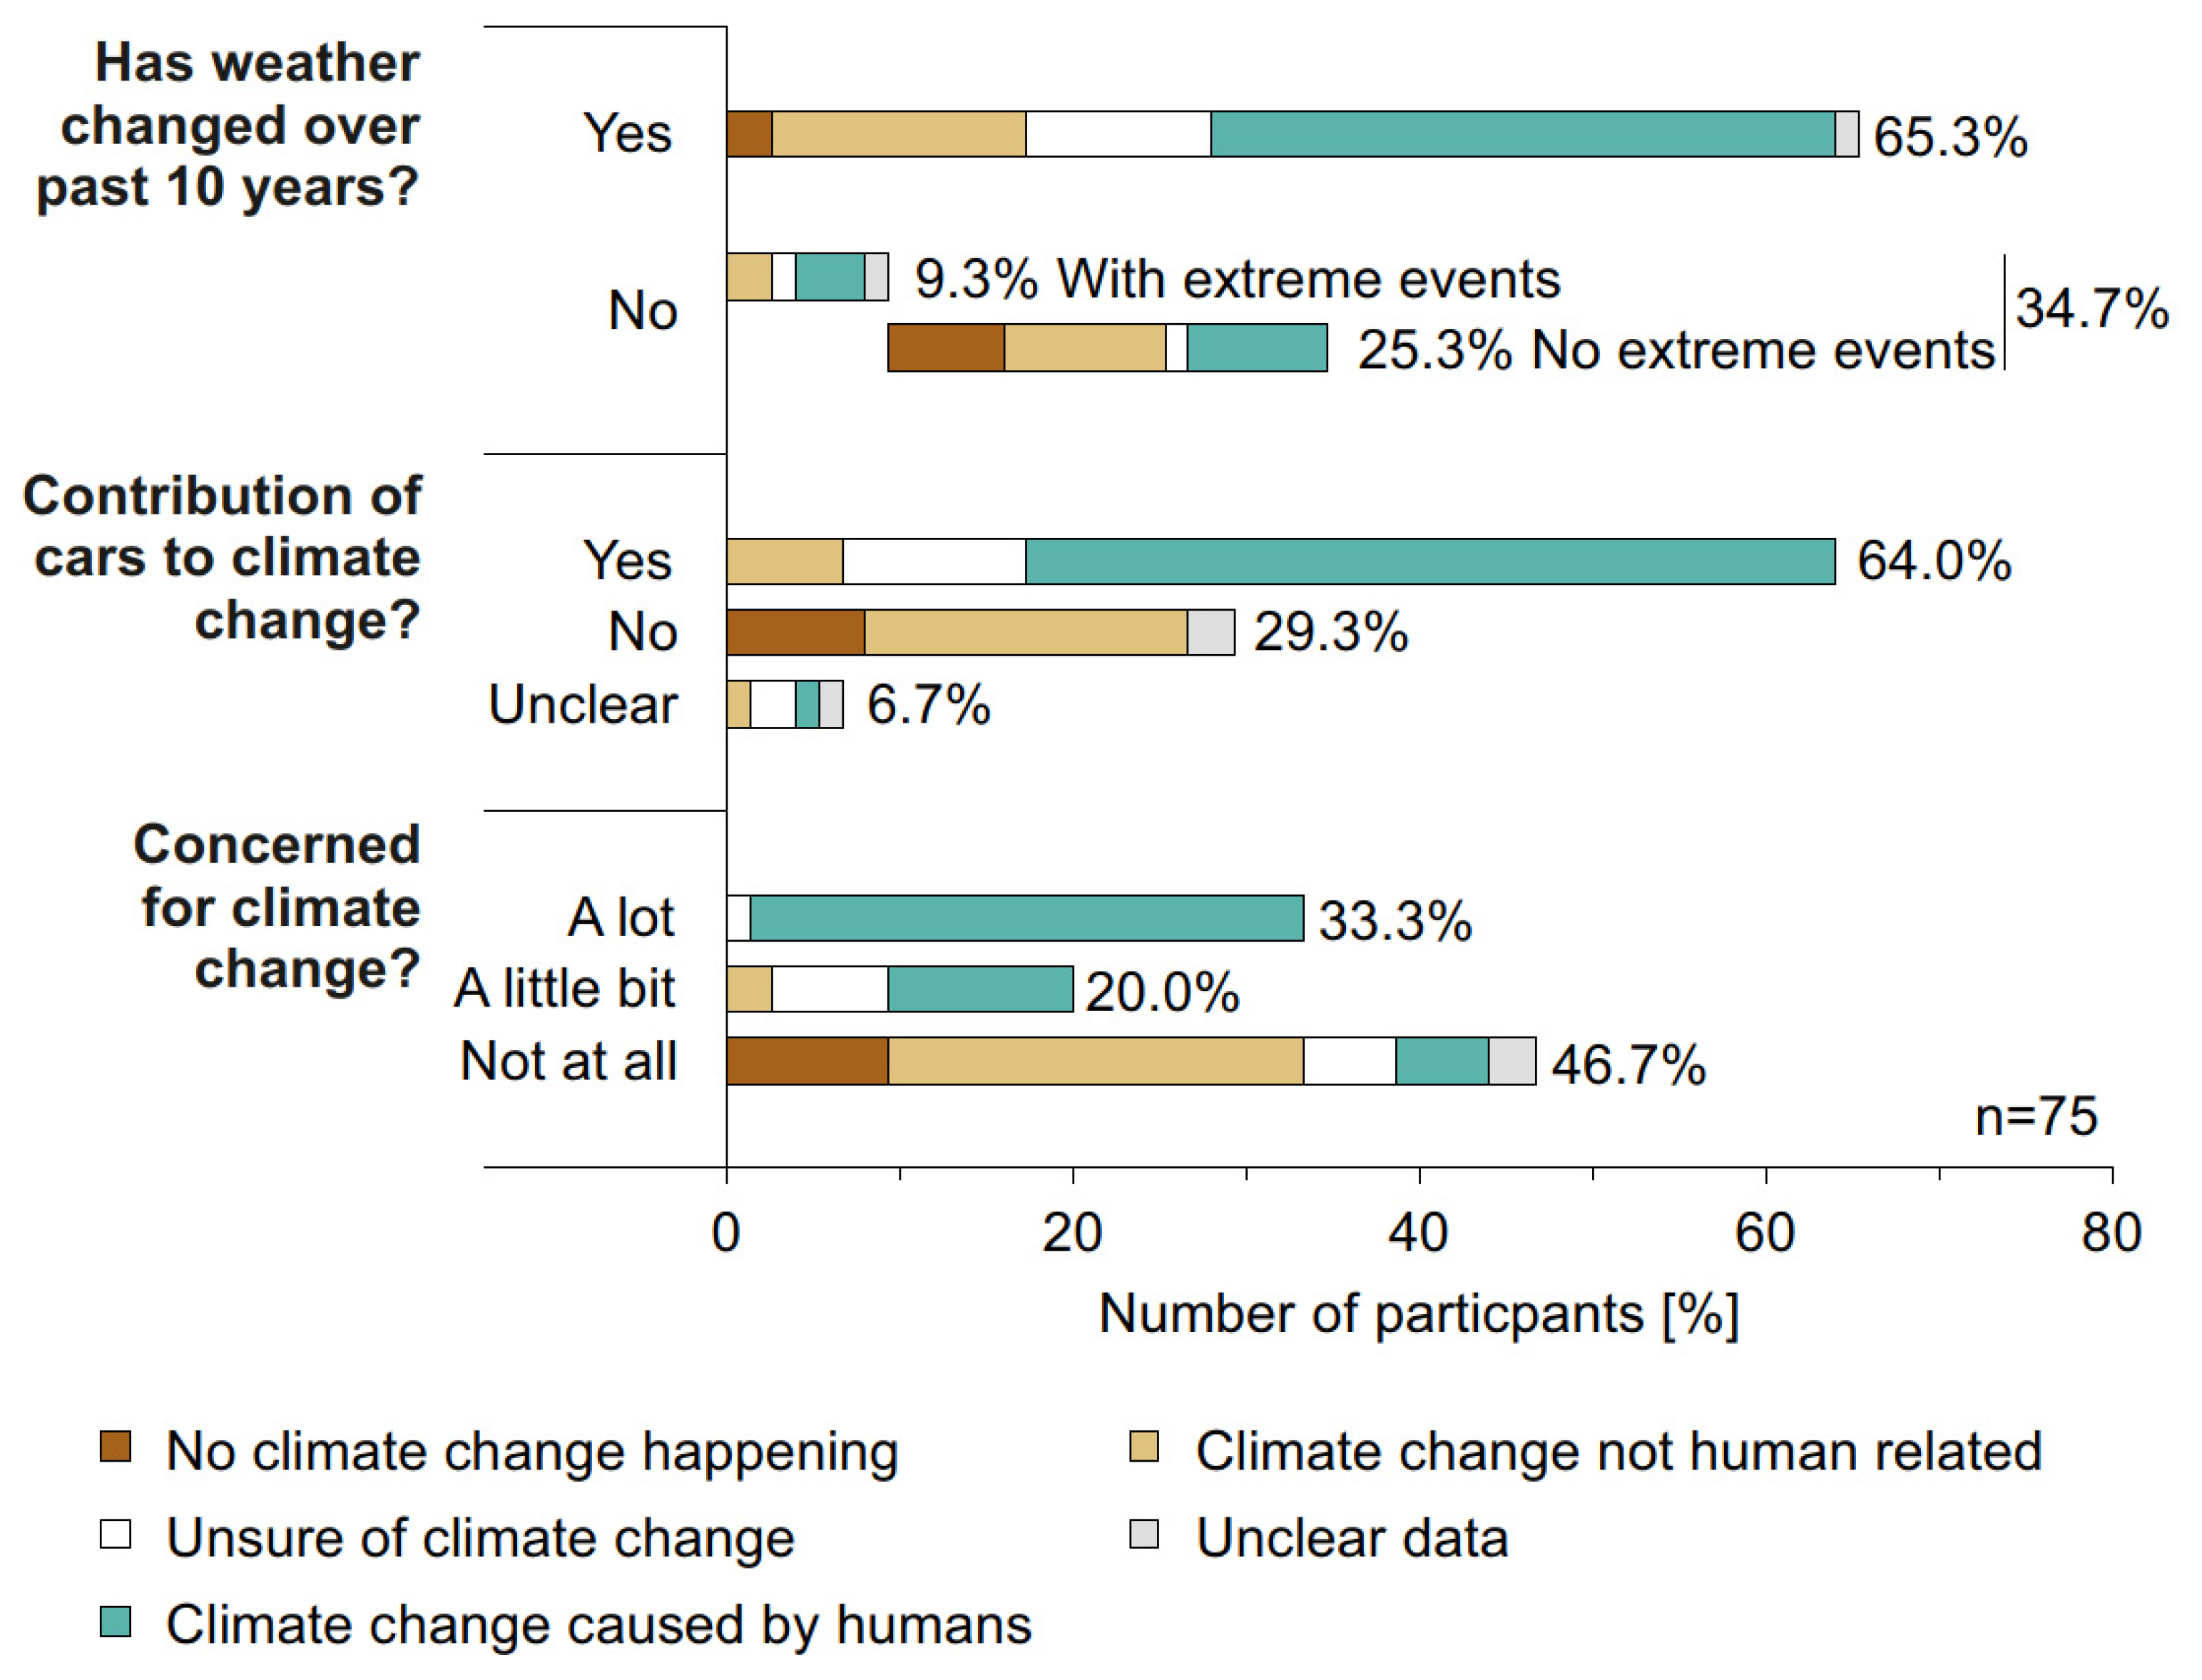
Most participants (63%) believed that the weather has changed over the past ten years (Figure 2). Among the participants who believe climate change is not happening or climate change is not caused by human activities, 17% observed that the weather has changed over the past ten years. For example, a participant who we categorized their belief category as climate change is not caused by human activity, stated “I have now observed how climate changed over 70 years, we have less storms, less snow in Reno [Washoe County, Nevada]”.

Figure 2.
Participants driving for TNCs’ (Transportation Network Company) opinions on weather changes over the past decade (top panel), their beliefs on how cars contribute to climate change (middle panel), and their concern for climate change (bottom panel). Participants who stated that the weather had not changed over the past decade were further divided into participants that reported or did not report observing changes of extreme weather events. All responses were categorized by participants’ climate change belief categories according to Figure 1.
Most participants (64%) believed that cars contribute to climate change (Figure 2). Participants often describe how car technology, specifically new technological advances for car fuel and electric development, either reduces or has no effects on cars’ contributions to climate change (n = 33). Additionally, even though most participants believed that cars contribute to climate change, participants sometimes justified car driving as not as harmful compared to other causes for climate change (n = 11) and as being necessary (n = 2): “Definitely [cars contribute to climate change] but not as bad as deforestation, agriculture, waste, meat and dairy industry, and overfishing,” and “Yes of course it [car driving] contributes, but it’s part of our culture and survival, we have to drive, it’s like eating food.”
Approximately half of participants (53%) stated that they were at least a little bit concerned about climate change, mostly because of climate change impact risks for humanity (n = 15) and nature (n = 12). Participants often described the risks for humanity as something that could occur to future generations or were concerned for impacts of natural disasters on humans. For example, “It [climate change] is one of the major issues for humankind, we only have a small window of 15–20 years before it impacts our grandchildren.” Whereas participants who were concerned about nature, were concerned specifically about animal extinction, retreating glaciers, and the disruption of ecosystems. A total of 35 participants stated that they were not at all concerned about climate change, some of them stating that the weather cycles are part of the local geographic region: “If the weather didn’t change [in Washoe County], I would be concerned. We have cycles of ten years for bad drought.” Other participants were not concerned because they felt there was nothing, they could do about it or it was not going to affect them personally: “I wonder how much does it [climate change] matter with the little life I have left on this planet, it sounds selfish.”
3.2. Climate Change Impacts on TNC Drivers’ Business
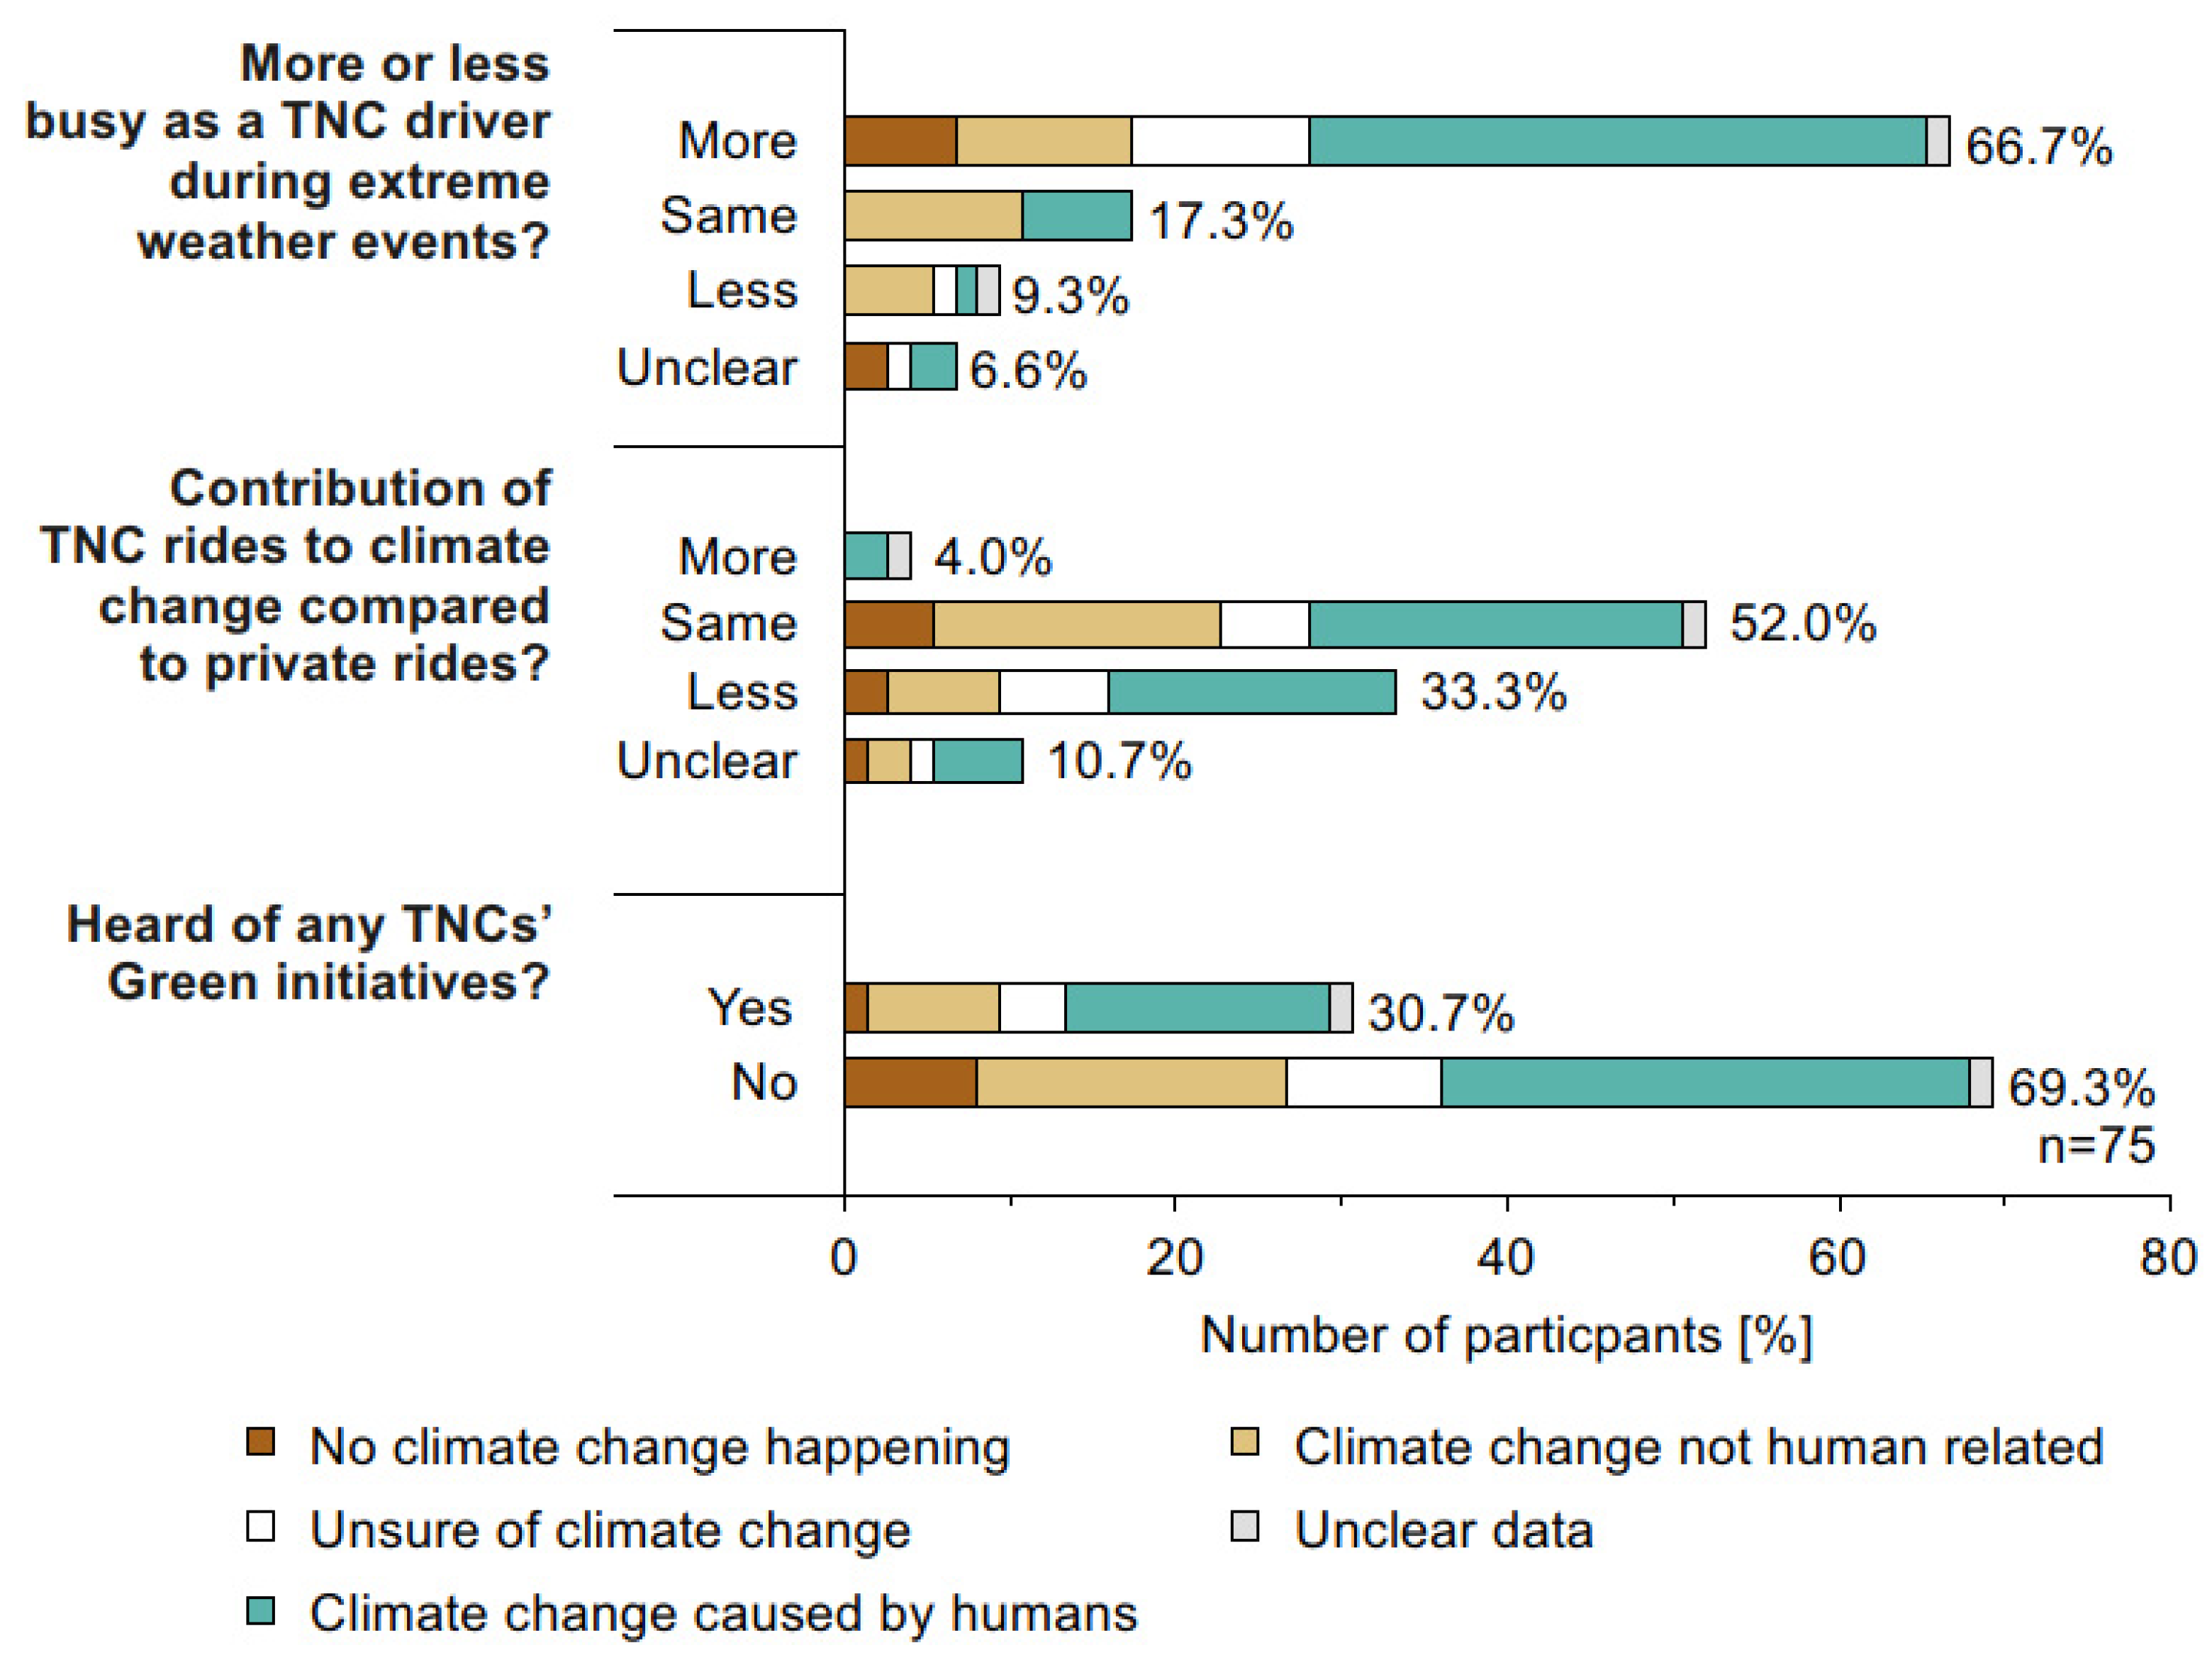
Participants described how extreme weather events, including snow, heavy rain, heat waves, extreme cold events, and wildfires, impact customers, drivers, and the companies (Figure 3). Across all belief categories, participants most frequently reported that TNC driving becomes busier during extreme weather events (Figure 4). More than 70% of participants who believed that climate change is caused by humans (n = 28; 77%), as well as participants who believed that climate change is not happening (n = 5; 71%), reported being busier during extreme weather events. Being busier was due to increases in customers, decreases in drivers, and more time spent per TNC ride. For example, participants stated, “They [TNC] offer us incentives to go out in bad weather,” and “Because it takes longer to pick up customers and drop them off, so on average less customers but more time to do that.” The largest belief group who felt that TNC driving was not affected by extreme weather were participants who believed that climate change is not human related (n = 8; 38%): “The driving is always inconsistent, weather doesn’t change [that].” Only 9% of participants felt they were less busy during extreme weather events. Although, several participants described not driving themselves for TNC during extreme weather events. Some participants perceived extreme weather events as beneficial due to less available TNC drivers: “I have a truck, so snow weather removes competition for me.” Additionally, a few participants perceived extreme weather events as beneficial to TNCs due to a customer increase: “I read that Lyft makes 40% of rides in bad weather.”
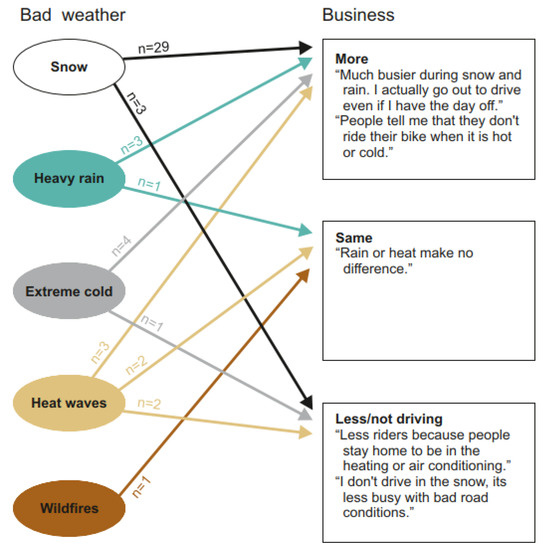
Figure 3.
Participants driving for TNC (Transportation Network Company) reporting how their TNC business is affected by different types of extreme weather events. N—number of participants reporting on a specific type of weather event.

Figure 4.
Participants driving for TNCs’ (Transportation Network Company) opinions on how extreme weather affects their TNC business (top panel), how TNC rides affect the climate differently than driving private cars (middle panel), and the number of participants that have heard of any TNCs’ green initiatives (bottom panel). All responses were categorized by participants’ climate change belief categories according to Figure 1.
3.3. TNC Drivers’ and the Companies’ Role with Climate Change
Across all belief categories, participants most frequently (52%) reported that TNC rides contribute the same to climate change compared to private rides (Figure 4). Their reasoning followed six categories, including the number of cars on the road (n = 26), car maintenance (n = 20), car-pooling (n = 11), public transport (n = 9), travel distance (n = 7), and ride purpose (n = 3). Participants often stated that the ride distance, the released pollutants, and the number of cars on the road would be the same whether someone took TNC rides or private vehicles: “You go from one place to another, the only difference is that I have to drive to you.” Among the participants who perceived that TNC rides contribute less to climate change compared to private cars (33%), arguments often included that TNCs provide car-pooling or a public transportation option, their cars are well-maintained, they reduce impulse travel in private vehicles, and they reduce cars on the road as well as allow for less car ownership. Two participants stated, “One person and one ride has little impact, but Lyft is giving us more options now with car-pooling [...] it’s a mass transport aspect that grows with more people involved” and “You don’t stop many places, you just go to the point, not taking more stops at the mall, you are less distracted on the way”. Only 4% of participants felt TNC rides were more likely to contribute to climate change than private cars. These participants described that TNC availability reduced public transportation riders and increased the distance traveled by the TNC driver: “Lyft drivers drive to “hotspots” or circle the town to increase their chance of getting customers”.
Only 31% of participants described knowing about TNCs’ green initiatives (Figure 4), which included statements about car-pooling (n = 9), electric cars (n = 2), oil change discounts (n = 1), and the companies’ policies of driving new vehicles (n = 1). One participant describes that they heard a TNC announce a zero-emission goal by 2030, but they did not know how the company plans to achieve the goal. Participants, who did not hear about green initiatives and who believed climate change is not human related, stated that TNC companies “Do a very bad job advertising it”, “They just want to be politically correct”, and “I don’t believe in their philosophy”.
Four participants provided recommendations to reduce TNCs’ climate change impact, such as financial incentives for cars with reduced emissions, to offer car-pooling in smaller towns, or to better promote their green initiatives. “I’d like to see money incentives like making one dollar more for electric car drivers. You need a carrot to convince people to change their actions”. Additionally, one participant suggested that TNC could be used as an alternative public transportation option; “It’s a community facility, I think [TNC name] helps to mitigate climate change”.
4. Discussion
Our exploratory survey was the first study to explore TNC drivers’ climate change beliefs, perceptions of climate change impacts on TNC drivers’ business, and perceived roles in contributing to or mitigating climate change. We found 48% of surveyed TNC drivers in Washoe County believed climate change is caused by human activities. In a survey of American’s climate change beliefs, 59% of surveyed Washoe County, Nevada, residents stated that “global warming is caused mostly by human activities,” [27]. Even though we found less people believed in climate change than the national survey, we found participants across all belief categories perceived extreme weather events to impact TNC driving business and varying degrees of how TNCs are perceived as a contributing to or mitigating strategy for climate change.
Our survey showed how closely TNC drivers and their business are connected to the weather. These survey results are consistent with a study that modelled changes in pick up times for TNCs during extreme weather events [32]. Washoe County is located in a geographic region (Sierra Nevada Mountain range) that experiences rapid weather changes and a variety of extreme weather events every year [33]. Accordingly, drivers in our survey reported heavy snowfall and rain resulted in difficult road conditions but they also mentioned heat waves and cold events as reasons for changes in their daily TNC business. Some drivers preferred not to drive in such conditions, while, on the other hand, customers may rely more on TNC compared to driving their own car if the weather is unfavorable [34]. These changes potentially increase the customer numbers when there are less drivers at work [32]. Interestingly, the drivers referred more to cold events and rain affecting rides, while heatwaves were less perceived as a factor affecting their business. This contrasts with previous research that found heat conditions in arid hot climate to be a major factor preventing customers from using public transport [35]. Thus, we found that the TNC business for drivers is closely dependent on weather conditions. Future climate change studies predict not only warming temperatures in many geographic areas, but also an increasing number of extreme events [36]. Rainfall and snow may be especially susceptible to change towards more extremes in the Sierra Nevada Mountain range [37,38,39] and, thus, have strong impacts on the business of TNC in the future—affecting the companies, the individual drivers, as well as customers taking rides.
We found most TNC drivers did not currently see their role as a TNC driver in contributing to or mitigating climate change. However, when the survey question was presented to participants, it was clear that many participants never considered the relationship between TNC and climate change. Additionally, with almost a third of TNC drivers not believing in human-caused climate change, it could be expected to have these participants not perceive their TNC role as affecting climate change. Our results were consistent with a previous study conducted in the United Kingdom that found only a weak link between the perceptions of travel behavior and potential impacts on climate change [40]. Our survey was conducted in a United States county where 73% of two-person households owned two or more vehicles [41], and public transportation consists only of limited bus services [42]. Consistent with previous studies [13,14,15,16], participants in our study believed TNC had a negative impact on public transit bus use. Most participants in our study did not see their role in contributing to or mitigating climate change and they did not mention how TNC affects traffic. This is an interesting finding because traffic contribution of TNC has been previously explored by other researchers [18,21] and it may indirectly, through increasing car emissions, have an impact on climate. Finally, TNC drivers might perceive their role as mitigating climate change if more sustainable or green options become available and incentives were provided to both the consumers and drivers.
We believe our study was the first to explore the relationship between TNC drivers and climate change in a survey format. Therefore, our findings have several implications for future research. As extreme weather was observed to affect TNC drivers’ business, future researchers could explore how specific extreme weather conditions affect business. For example, a survey could be conducted after different types of extreme weather events to understand how TNC drivers’ business was affected by specific events. By further understanding how the TNC business is affected by extreme weather, future researchers could design intervention studies that explore how to support TNC drivers during extreme weather. Our survey could also be repeated in other locations to capture perceptions of TNC drivers in other geographic areas such as different metropoles or in regions with different climatic conditions. Our study was conducted during the COVID-19 pandemic. During the early pandemic months, participants began sharing open-ended responses about TNC driving, the pandemic, and climate change. Thus, two post hoc questions were added to our survey (Appendix A, Table A1). Future researchers could explore how the COVID-19 pandemic affected the TNC driving business and views of the intersection between climate change and pandemics.
The qualitative data’s trustworthiness was based on four criteria [31]. We achieved credibility and confirmability through peer examination and the debriefing of participants’ statements and by exploring similarities and differences of statements within and across participants. We were unable to use member checking as a strategy to establish credibility and confirmability because we did not collect contact information of participants. Credibility was achieved by researcher agreement that participant statements represented the data as a whole. Confirmability was achieved by presenting data that represent multiple participant views and voices. To establish dependability and transferability, we provided details of the research process in the methods section, we provided the survey instrument in the Appendix A Table A1 and the description of the study participants in Table 1, we captured descriptions of the interview atmosphere, and we created a memo with the research and decision-making process.
Firstly, our study was limited to the time it would take for an interviewer to travel to the destination using TNC. The survey was restricted by the number of questions we could ask and how much elaboration a participant could provide. Secondly, because our study took place in a car and was not audio recorded, the investigator recorded participant responses with handwritten notes on paper. Audibility of participant responses could have been affected by the noise inside the car, the use of facemasks and plexiglass dividers for COVID-19 pandemic precautions, participants’ talking speed, and ease of reading the investigator’s handwriting. Additionally, our study could have been influenced by social desirability bias or participant statements that would be viewed as favorable by the investigator. There were several interviews where participants asked the investigator questions about climate change. The investigator answered the questions as best as they could without influencing the participant. Finally, conducting an interview during a TNC ride and with TNC drivers who were randomly assigned based on an application algorithm assignment presented a unique data collection approach. Future researchers could conduct methodological studies to further understand the strengths and limitations of this approach.
5. Conclusions
The transportation sector is a major source of global greenhouse gas emission [1] and TNCs can be a contributor or part of the solution. In our study, we found the impacts of extreme weather were affecting TNC drivers, customers, and the business. However, TNC drivers did not currently see their role as mitigators of climate change. If TNCs continue with the status quo, it is likely that the perceptions from drivers observed in our study will continue. However, TNCs can become part of the solution to mitigating greenhouse gas emissions by providing driver incentives for electric cars, customer incentives for using car-pooling, and business incentives of TNC as an alternative public transportation option. Additionally, TNCs could collaborate with local climate change and sustainability agencies and public transit organizations to develop strategies to improve local transportation needs, with specific exploration on commuting and times of traffic congestion. We conclude that TNCs offer an alternative to driving individual cars and further research in understanding the relationship of TNC drivers with climate can play a crucial role for the current climate change discussion.
Author Contributions
Conceptualization, S.O.B.; methodology; T.W.; formal analysis, S.O.B. and T.W.; investigation, S.O.B.; data curation, T.W.; writing—original draft preparation, S.O.B. and T.W.; writing—review and editing, S.O.B. and T.W.; visualization, S.O.B. and T.W.; funding acquisition, S.O.B. Both authors have read and agreed to the published version of the manuscript.
Funding
S.O.B. was funded by the Swiss National Science Foundation (SNSF) Postdoc Mobility grants P2BEP2_188180 and P400P2_199285.
Institutional Review Board Statement
The study was conducted according to principles set forth in the Belmont Report and the United States Department of Health and Human Service Code of Federal Regulations at 45 CFR 46. This study was approved by the University of Nevada, Reno Institutional Review Board under an exempt determination (protocol 1565936-2 approved 11 March 2020, and amended protocol approval 5 October 2020).
Informed Consent Statement
Verbal informed consent was obtained from all subjects involved in the study.
Data Availability Statement
Data and any other study material are available from the corresponding author on request.
Acknowledgments
We are grateful to H. Ostermayer, a private foundation which financed the 101 TNC rides to conduct the interviews with the TNC drivers. We thank all the anonymous TNC drivers who participated in the interviews.
Conflicts of Interest
The authors declare no conflict of interest.
Appendix A
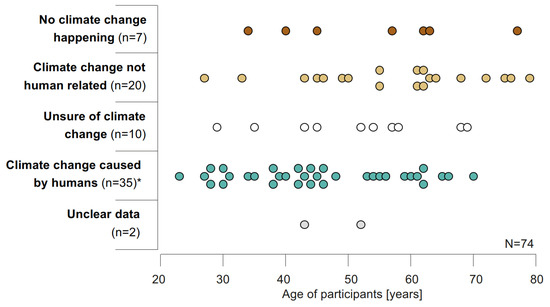
Figure A1.
Correlation of age and climate change belief categories of participants driving for TNCs (Transportation Network Companies). Each dot represents one participant. * One participant with belief category climate change caused by humans refused to answer their age and was, therefore, excluded for the age-belief category correlation.

Table A1.
Questionnaire for survey on the climate change perceptions of TNC (Transportation Network Company) drivers for this study. Questionnaire was designed for a short interview during TNC rides.
Table A1.
Questionnaire for survey on the climate change perceptions of TNC (Transportation Network Company) drivers for this study. Questionnaire was designed for a short interview during TNC rides.
| Question | Question Type | Answer Type |
|---|---|---|
| (1) Where are you from? | Closed-ended | Nevada/Other US state/International origin |
| (2) How long have you been living in the Reno area? | Closed-ended | Numeric (Number of years) |
| (3) Are you a full-time driver? … if no, 3a) what other occupation do you have? | Closed-ended Closed-ended | Yes/No Field of other occupation |
| (4) How long have you been driving for (TNC name)? | Closed-ended | Numeric (Duration in months) |
| (5) What do you think about the weather in the Reno area? | Open-ended | Open answer |
| (6) Has the weather changed over the last 10 years? … if yes, 6a) tell me, how the weather has changed over the past 10 years? … if no, 6b) have you noticed more extreme weather events such as snowstorms, periods of droughts, heatwaves, wildfires? | Closed-ended Open-ended Closed-ended | Yes/No Open answer Yes/No + additional comments |
| (7) Are you more or less busy as a (TNC name) driver during bad weather events such as snowstorms, drought periods or heat waves? | Closed-ended | More/Same/Less busy + additional comments |
| (8) Have you heard of climate change? | Closed-ended | Yes/No + additional comments |
| (9) How concerned are you about climate change? … 9a) and why? | Closed-ended Open-ended | Not at all/A little bit/A lot Open answer |
| (10) How do you think driving a car contributes to climate change? | Open-ended | Open answer |
| (11) Do you see specific characteristics through which sharing a car through (name of ride-share company) contributes or mitigates climate change differently than driving a car for private rides? | Open-ended | Open answer |
| (12) Have you heard of any green- or climate change-related initiatives from (name of TNC)? … if yes, 12a) Tell me what you heard? | Closed ended Open-ended | Yes/No Open answer |
| (13) Do you have any other climate change related thoughts and beliefs or statements regarding shared-ride companies in the relationship to climate change to note for this survey? | Open-ended | Open answer |
| (14) Are you comfortable to write down your car type? | Closed-ended | Sedan/SUV/Pickup truck |
| (15) What fuel type is this vehicle? | Closed-ended | Gas/Diesel/Electric/Hybrid |
| (16) Are you comfortable sharing your age? | Closed-ended | Numeric (Age in years) |
| (17) Could you share your experience as a (TNC name) driver during the COVID-19 pandemic? | Open-ended | Open answer |
| (18) In your opinion, do you think climate change could cause pandemics like COVID-19? | Closed-ended | Yes/No + additional comments |
References
- de Coninck, H.; Revi, A.; Babiker, M.; Bertoldi, P.; Buckeridge, M.; Cartwright, A.; Dong, W.; Ford, J.; Fuss, S.; Hourcade, J.-C.; et al. Strengthening and implementing the global response. In Global Warming of 1.5 °C. An IPCC Special Report on the Impacts of Global Warming of 1.5 °C above Pre-Industrial Levels and Related Global Greenhouse Gas Emission Pathways, in the Context of Strengthening the Global Response to the Threat of Climate Change, Sustainable Development, and Efforts to Eradicate Poverty; International Governmental Panel on Climate Change: Geneva, Switzerland, 2019. [Google Scholar]
- Ward, J.W.; Michalek, J.J.; Azevedo, I.L.; Samaras, C.; Ferreira, P. Effects of on-demand ridesourcing on vehicle ownership, fuel consumption, vehicle miles traveled, and emissions per capita in U.S. States. Transp. Res. Part C Emerg. Technol. 2019, 108, 289–301. [Google Scholar] [CrossRef]
- Pratt, A.N.; Morris, E.A.; Zhou, Y.; Khan, S.; Chowdhury, M. What do riders tweet about the people that they meet? Analyzing online commentary about UberPool and Lyft shared/Lyft line. Transp. Res. Part F Traffic Psychol. Behav. 2019, 62, 459–472. [Google Scholar] [CrossRef]
- Erdoğan, S.; Yıldırım, S.; Yıldırım, D.Ç.; Gedikli, A. The effects of innovation on sectoral carbon emissions: Evidence from G20 countries. J. Environ. Manag. 2020, 267, 110637. [Google Scholar] [CrossRef] [PubMed]
- Penna, C.C.R.; Geels, F.W. Climate change and the slow reorientation of the American car industry (1979–2012): An application and extension of the Dialectic Issue LifeCycle (DILC) model. Res. Policy 2015, 44, 1029–1048. [Google Scholar] [CrossRef]
- Xue, M.; Yu, B.; Du, Y.; Wang, B.; Tang, B.; Wei, Y.-M. Possible emission reductions from ride-sourcing travel in a global megacity: The case of Beijing. J. Environ. Dev. 2018, 27, 156–185. [Google Scholar] [CrossRef]
- Uber. Uber. Available online: https://www.uber.com (accessed on 22 June 2021).
- Lyft. Lyft. Available online: https://www.lyft.com/ (accessed on 22 June 2021).
- Fulton, L.; Mason, J.; Meroux, D. Three Revolutions in Urban Transportation: How to Achieve the Full Potential of Vehicle Electrification, Automation, and Shared Mobility in Urban Transportation Systems around the World by 2050; The National Academies of Sciences, Engineering and Medicine, Transportation Research Board: Washington, DC, USA, 2017. [Google Scholar]
- Han, M.; Dean, M.D.; Maldonado, P.A.; Masungi, P.; Srinivasan, S.; Steiner, R.L.; Salzer, K. Understanding transit agency perceptions about transportation network companies, shared mobility, and autonomous transit: Lessons from the United States. Transp. Res. Rec. 2019, 2673, 95–108. [Google Scholar] [CrossRef]
- Lyft. ESG Report 2021: Lyft’s 2021 Environmental, Social, and Corporate Governance Report. Available online: https://investor.lyft.com/financials-and-reports/esg/default.aspx (accessed on 1 July 2021).
- Uber. ESG Report 2020—An Environmental, Social, and Governance Report for Investors. 2020. Available online: https://s23.q4cdn.com/407969754/files/design/Uber-2020-ESG-Report-Final.pdf (accessed on 1 July 2021).
- Rayle, L.; Shaheen, S.A.; Chan, N.; Dai, D.; Cervero, R. App-Based, on-Demand Ride Services: Comparing Taxi and Ridesourcing Trips and User Characteristics in San Francisco; University of California Transportation Center: Berkeley, CA, USA, 2014. [Google Scholar]
- Malalgoda, N.; Lim, S.H. Do transportation network companies reduce public transit use in the U.S.? Transp. Res. Part. Policy Pract. 2019, 130, 351–372. [Google Scholar] [CrossRef]
- Diao, M.; Kong, H.; Zhao, J. Impacts of transportation network companies on urban mobility. Nat. Sustain. 2021, 4, 494–500. [Google Scholar] [CrossRef]
- Grahn, R.; Qian, S.; Matthews, H.S.; Hendrickson, C. Are travelers substituting between Transportation Network Companies (TNC) and public buses? A case study in Pittsburgh. Transportation 2021, 48, 977–1005. [Google Scholar] [CrossRef]
- Wenzel, T.; Rames, C.; Kontou, E.; Henao, A. Travel and energy implications of ridesourcing service in Austin, Texas. Transp. Res. Part. Transp. Environ. 2019, 70, 18–34. [Google Scholar] [CrossRef]
- Roy, S.; Cooper, D.; Mucci, A.; Sana, B.; Chen, M.; Castiglione, J.; Erhardt, G.D. Why is traffic congestion getting worse? A decomposition of the contributors to growing congestion in San Francisco—Determining the role of TNCs. Case Stud. Transp. Policy 2020, 8, 1371–1382. [Google Scholar] [CrossRef]
- Fuller, S.; Kunz, T.; Brown, A.L.; D’Agostino, M.C. Setting TNC Policies to Increase Sustainability; National Center for Sustainable Transportation: Davis, CA, USA, 2021. [Google Scholar]
- Qian, X.; Lei, T.; Xue, J.; Lei, Z.; Ukkusuri, S.V. Impact of transportation network companies on urban congestion: Evidence from large-scale trajectory data. Sustain. Cities Soc. 2020, 55, 102053. [Google Scholar] [CrossRef]
- Li, S.; Poolla, K.; Varaiya, P. Impact of congestion charge and minimum wage on TNCs: A case study for San Francisco. Transp. Res. Part. Policy Pract. 2021, 148, 237–261. [Google Scholar] [CrossRef]
- Martinez, I.; Jin, W.L. Trip Length Distribution of TNC Trips: Based on Empirical Data in Chicago; University of Michigan–Electrical and Computer Engineering: Ann Arbor, MI, USA, 2020. [Google Scholar]
- Shokoohyar, S.; Sobhani, A.; Nargesi, S.R.R. On the determinants of Uber accessibility and its spatial distribution: Evidence from Uber in Philadelphia. WIREs Data Min. Knowl. Discov. 2020, 10, e1362. [Google Scholar] [CrossRef]
- Shokoohyar, S. Ride-sharing platforms from drivers’ perspective: Evidence from Uber and Lyft drivers. Int. J. Data Netw. Sci. 2018, 2, 89–98. [Google Scholar] [CrossRef]
- United States Census Bureau. QuickFacts: Washoe, County, Nevada. Available online: https://www.census.gov/quickfacts/fact/table/washoecountynevada/PST045219 (accessed on 7 January 2021).
- U.S. Climate Data. Climate Reno—Nevada. Available online: https://www.usclimatedata.com/climate/reno/nevada/united-states/usnv0076 (accessed on 1 July 2021).
- Ballew, M.T.; Leiserowitz, A.; Roser-Renouf, C.; Rosenthal, S.A.; Kotcher, J.E.; Marlon, J.R.; Lyon, E.; Goldberg, M.H.; Maibach, E.W. Climate change in the American mind: Data, tools, and trends. Environ. Sci. Policy Sustain. Dev. 2019, 61, 4–18. [Google Scholar] [CrossRef]
- StataCorp. Stata Statistical Software: Release 16; StataCorp LLC: College Station, TX, USA, 2019. [Google Scholar]
- Hsieh, H.-F.; Shannon, S.E. Three approaches to qualitative content analysis. Qual. Health Res. 2005, 15, 1277–1288. [Google Scholar] [CrossRef] [PubMed]
- Polit, D.F.; Beck, C.T. Nursing Research: Generating and Assessing Evidence for Nursing Practice, 11th ed.; Wolters Kluwer Health|Lippincott Williams & Wilkins: Philadelphia, PA, USA, 2021. [Google Scholar]
- Lincoln, Y.S.; Guba, E.G. Naturalistic Inquiry; Sage Publications: Newbury Park, CA, USA, 1985. [Google Scholar]
- Shokoohyar, S.; Sobhani, A.; Sobhani, A. Impacts of trip characteristics and weather condition on ride-sourcing network: Evidence from Uber and Lyft. Res. Transp. Econ. 2020, 80, 100820. [Google Scholar] [CrossRef]
- Gonzalez, P.; Garfin, G.M.; Breshears, D.D.; Brooks, K.M.; Brown, H.E.; Elias, E.H.; Gunasekara, A.; Huntly, N.; Maldonado, J.K.; Mantua, N.J.; et al. Impacts, Risks, and Adaptation in the United States: Fourth National Climate Assessment; U.S. Global Change Research Program: Washington, DC, USA, 2017; Volume 2, pp. 1101–1184.
- Yang, H.; Liang, Y.; Yang, L. Equitable? Exploring ridesourcing waiting time and its determinants. Transp. Res. Part. Transp. Environ. 2021, 93, 102774. [Google Scholar] [CrossRef]
- Dzyuban, Y.; Hondula, D.M.; Coseo, P.J.; Redman, C.L. Public transit infrastructure and heat perceptions in hot and dry climates. Int. J. Biometeorol. 2021. [Google Scholar] [CrossRef]
- IPCC. Managing the Risks of Extreme Events and Disasters to Advance Climate Change Adaptation; Cambridge University Press: Cambridge, UK, 2012. [Google Scholar]
- Wang, J.; Kotamarthi, V.R. High-resolution dynamically downscaled projections of precipitation in the mid and late 21st century over North America. Earths Future 2015, 3, 268–288. [Google Scholar] [CrossRef]
- Krofcheck, D.J.; Hurteau, M.D.; Scheller, R.M.; Loudermilk, E.L. Restoring surface fire stabilizes forest carbon under extreme fire weather in the Sierra Nevada. Ecosphere 2017, 8, e01663. [Google Scholar] [CrossRef]
- Wrzesien, M.L.; Pavelsky, T.M. Projected changes to extreme runoff and precipitation events from a downscaled simulation over the Western United States. Front. Earth Sci. 2020, 7, 355. [Google Scholar] [CrossRef]
- Line, T.; Chatterjee, K.; Lyons, G. The travel behaviour intentions of young people in the context of climate change. J. Transp. Geogr. 2010, 18, 238–246. [Google Scholar] [CrossRef] [Green Version]
- United States Census Bureau. American Community Survey: Household Size by Vehicles. Available online: https://www.cen-sus.gov/data/tables/time-series/demo/families/households.html. (accessed on 1 July 2021).
- Regional Transportation Commission (RTC) of Washoe County. About RTC Washoe. Available online: https://www.rtcwashoe.com/about/ (accessed on 1 July 2021).


Publisher’s Note: MDPI stays neutral with regard to jurisdictional claims in published maps and institutional affiliations. |
© 2021 by the authors. Licensee MDPI, Basel, Switzerland. This article is an open access article distributed under the terms and conditions of the Creative Commons Attribution (CC BY) license (https://creativecommons.org/licenses/by/4.0/).