Article

A Methodology for Assessing Capacity of the Terminal Maneuvering Area Based on Service Resource Equilibrium

College of Airport Science and Engineering, Civil Aviation Flight University of China, Guanghan 618307, China
*
Author to whom correspondence should be addressed.
Aerospace 2023, 10(10), 894; https://doi.org/10.3390/aerospace10100894
Submission received: 18 September 2023 / Revised: 13 October 2023 / Accepted: 15 October 2023 / Published: 19 October 2023
(This article belongs to the Special Issue Advances in Air Traffic and Airspace Control and Management)

Abstract

:
To effectively estimate and optimize the airport terminal maneuvering area throughput based on the equilibrium of air traffic service resource supply and demand, this research proposes an approach to assess terminal maneuvering area capacity from the perspective of air traffic service resource availability. Terminal maneuvering area capacity is optimized based on the equilibrium of air traffic service resource supply and demand. The supply–demand nexus is examined in consideration of terminal maneuvering area route structure, traffic flow characteristics, and safety regulations. A flight service probability matrix and a terminal maneuvering area demand and supply service time model are constructed to quantify resource expenditure at varied capacity levels. An optimization model is then developed to allocate the airport resources effectively, fully utilizing the capacity to provide maximal outputs under resource limitations. Model computation and simulation results demonstrate the deviation between estimated and amended capacities is under 0.3 flight sorties per hour. The outcomes are congruent with historical statistics, thereby validating the accuracy and reliability of the model proposed in this study. Given capacity parameters, the model can deduce the maximal aircraft quantity served concurrently in terminal maneuvering areas during peak periods. These revelations indicate that the submitted model furnishes theoretical foundation and reference for terminal maneuvering area sector partition and traffic alerting.

1. Introduction

Air traffic flow management is a prerequisite for reducing flight delays [1], ensuring air traffic safety, and alleviating the workload of air traffic controllers [2,3]. When implementing air traffic flow management, an accurate and effective assessment of the terminal maneuvering area is its primary task and a prerequisite. Therefore, research on terminal maneuvering area capacity assessment algorithms is crucial for ensuring the safe, smooth, and efficient operation and management of airports and airspace. In the current state of research, terminal maneuvering area capacity algorithms can be primarily classified into three distinct approaches: Constructing and computing mathematical models, rapid computer simulation modeling, and analyzing air traffic controller workload. Mitchell J et al. proposed an airspace route maximum capacity model by analyzing the geometry of airspace sectors and employing a stochastic weather model. They applied the maximum-flow and minimum-cut method to investigate this model [4]. Janic M et al. performed an airspace capacity assessment based on air traffic controller workloads. They investigated the influence of these workloads on airspace capacity from three aspects: control procedures, separation standards, and service policies [5]. Volf P. proposed a fast-time simulation system which can simulate the entire US National Airspace System with realistic air traffic scenarios and air traffic controller behavior models that incorporate the workload and decision-making processes of the controllers [6]. Kicinger et al. developed a stochastic analytical model to predict the terminal maneuvering area capacity with explicit consideration of weather forecast uncertainty [7]. After restructuring the route network, Kageyama K et al. employed computer simulation methods to model an air traffic controller workload-based airspace capacity assessment model [8]. Zhang et al. proposed a new model for estimating airspace capacity based on decision tree ensembles, which integrates multiple sources of data to quantify the maximum transportation capacity of en route sectors under different circumstances [9]. Zamarreño Suárez et al. proposed a methodology to determine the workload thresholds for air traffic controllers, which implies that the capacity of the airport terminal maneuvering area is related to the workload of air traffic controllers [10]. Chu et al. proposed an adaptive terminal maneuvering area capacity estimation approach based on trajectory clustering and air traffic pattern identification and derived the capacity as the maximum flow rate and calculated state transition probabilities using Markov models [11].
In comparison, research specifically addressing airspace capacity assessment for terminal control areas in China is still scarce. Dong Xiangning et al. analyzed various approaches for evaluating air traffic controller workload. By optimizing the controller workload-based airspace capacity assessment model, they developed a new terminal maneuvering area airspace capacity assessment model [12]. Taking into full account the dynamic factors of hazardous weather, Yang Shangwen et al. developed strategies for scheduling arriving and departing flights as well as planning hazardous weather avoidance routes. Using computer simulation techniques, they predicted dynamic airspace capacity thresholds [13]. Shen Linan et al. incorporated delay levels as an impact factor in terminal maneuvering area airspace capacity assessment. They established a mathematical model quantifying the relationship between flight delays and aircraft count [14]. Huang Haiqing et al. analyzed and compared terminal maneuvering area airspace capacity thresholds under military operations. They employed the maximum flow/minimum cut theory and an improved genetic algorithm [15]. Peng Ying et al. proposed a multi-input deep learning model for terminal maneuvering area traffic prediction by incorporating weather factors. They integrated deep learning techniques with the consideration of meteorological characteristics [16]. Mao Limin et al. developed a random forest-based prediction model for terminal airspace operations. Their model took into account the impact of convective weather systems [17].
Traditional mathematical models for terminal maneuvering area airspace capacity assessment are built upon one or more impact factors, which are treated as constraints to set corresponding objective functions for capacity calculation [18,19,20]. Different models consider different factors, leading to significant variability among them. While improving capacity estimation accuracy for specific scenarios to some extent, these models also increase the complexity of capacity assessment operations. Regarding model variables, most current models primarily employ stochastic factors like weather as constraint variables, with little consideration given to the balance between service resource supply and demand. The influence of service resources on capacity is overlooked.
Historically in the research on the relationship between controller workload and airspace capacity, the acceptable level of controller workload is commonly defined as the time a controller spends directing aircraft under certain service standards and operational rules. The average hourly workload of a controller is supposed to be less than 70% of their maximum workload, and the accumulated time reaching over 90% of the maximum workload is supposed to not exceed 2.5% per hour. However, in surveys and statistics from frontline controllers, their tolerance for workload or intensity is often reported as the maximum number of aircraft they can direct simultaneously, which has caused a disconnect between research theory and practice.
Therefore, this paper aims to address the challenge of integrating air traffic service resource factors into terminal maneuvering area capacity assessment by analyzing the operational environment and air traffic characteristics of the airport terminal maneuvering area, and by providing a novel method that reveals the relationship between two types of metrics that characterize controller workload, bridging the gap between academia and operational realities. Considering the demand–supply relationship of air traffic service resources, a mathematical model is established to forecast the terminal maneuvering area capacity based on the equilibrium of resource supply and demand. The terminal maneuvering area of Hulunbuir Hailar Airport (ICAO: ZBLA) is taken as a case study. The capacity is calculated based on relevant statistics. Meanwhile, the effectiveness and reliability of the model are verified through Monte Carlo simulation.

2. Capacity and Service Resource Analysis of Terminal Areas

The airport terminal maneuvering area, as the transition airspace for aircraft moving from the air route into airport arrival and departure, enables the connection between the two ends of air routes and airports, its capacity refers to the maximum number of aircraft that the airspace can safely and orderly serve within a unit time, under certain airspace structures, flight procedures, control regulations and safety standards, considering the influence of variable factors such as aircraft performance, human factors, and meteorological conditions [1]. The prerequisite for achieving the maximum capacity of terminal maneuvering area is the prompt departure of the aircraft entering the maneuvering area after being serviced, thereby releasing the service resources of the area. Within the terminal maneuvering area, demand refers to aircraft requiring control services, and supply refers to air route resources and control officer service resources. The process of aircraft entering the terminal maneuvering area is depicted as the procedural flowchart shown in Figure 1.
The terminal maneuvering area airspace includes airspace of approach control areas and aerodrome control zones, as illustrated in Figure 1. The airspace is divided by two control boundaries. The control boundary is a nonexistent spatial demarcation, indicating the control handover position where the airspace resources in the current zone start/end to be occupied. When an aircraft enters the control zone, it means the aircraft begins to occupy part of the airspace resources of the area. Once the aircraft leaves the control zone, the resources occupied by the aircraft will be released immediately. Therefore, the two imaginary boundaries constitute the control transfer boundaries. During the flight process, the resource consumption includes not only the occupation of fixed resources such as air routes, but also the occupation of control service resources. Aircraft entering the terminal generates the demand for control services. While controllers provide services, they are under physical pressures and psychological stresses [21,22]. The physical operational pressure can be converted into time to relieve their own pressure and the demands of control tasks. The psychological stress determines the number of aircraft that controllers can safely handle under busy conditions, which remains unchanged within a certain period of time. The level depends mainly on the workload that controllers can bear and the number of aircraft in the terminal maneuvering area. According to the Civil Aviation Air Traffic Management Rules (CCAR-93TM-R5) [23], the number of aircraft receiving air traffic control services in a sector simultaneously shall not exceed the number that can be safely handled during peak times. Therefore, the higher the comprehensive abilities of controllers, the more aircraft sorties can be served under busy conditions, the greater the capacity of air traffic flow, and the higher the upper limit of terminal maneuvering area capacity.

3. Mathematical Modeling

3.1. Model Assumptions

This study focuses on the capacity of arrival and departure in the terminal maneuvering area of a single airport. There are many limiting factors that affect the capacity of the terminal maneuvering area [1], and different definitions of terminal maneuvering area capacity exist based on different limiting factors. According to the mathematical model developed in this study, the terminal maneuvering area capacity is defined as follows: The maximum number of aircraft the terminal maneuvering area can serve per unit time at an acceptable level of air traffic control service provision, balancing the supply and demand of service resources. Previous studies [15,16,17] have included some of the influencing factors as constraints. The construction of a mathematical model makes the computational model more relevant to the actual operating scenario. However, various influencing factors are potential risks in operation, and their occurrence probabilities are random. The complexity of the terminal maneuvering area structure also limits the accuracy of the model results. This study simplifies the limiting factors and operational methods, introduces the supply and demand relationship of terminal maneuvering area service resources, and establishes a mathematical model for terminal maneuvering area capacity computation under the balance of service resource supply. To establish this model, the following assumptions have been made:
  • Any two arriving or departing aircraft are equipped with a minimum flight separation greater than that used in the control area where they are located.
  • In the terminal area, if the service for an aircraft has already started and has not yet finished, the service for another aircraft cannot begin.
  • Aircraft service requests in the terminal area are continuous, and the number of aircraft being served in the terminal area does not exceed the safe handling capacity.
  • Each aircraft flies according to its planned route and will not deviate from or change the planned route.
  • Each aircraft of the same type experiences the same flight time on the same air route.
  • To simplify the modeling, the arrival and departure routes are assumed to have sufficient vertical separation by altitude, as implemented in real-world air traffic management, which ensures arrival and departure flows do not interfere, allowing their traffic capacities to be analyzed independently without conflicts.

3.2. Model Formulation

This model considers the supply–demand relationship among terminal area service resources. By analyzing the traffic flow characteristics of the terminal area, the terminal area capacity is finally obtained. It is assumed that the terminal area capacity of the airport is C a p a c i t y . Within the terminal area, there are multiple air routes that aircraft can take during arrival and departure. Each of these air routes is connected to specific airways as well as air traffic control transfer points, which refer to the predetermined spatial locations where control responsibility transfers from one ATC unit to the next along the flight path. There are n air routes within the terminal area. R i denotes the percentage of usage for the i t h route, as a proportion of the overall usage of all n routes. t j I N and t j O U T represent the times at which approaching/departing aircraft f j enters the terminal area and leaves the terminal area, respectively. The terminal area service procedure for aircraft f j is as follows: At time t j I N , aircraft f j crosses the control transfer point to enter the control area from outside the terminal area. From time t j I N , it starts to occupy part of the service resources and flies along the planned route i. At time t j O U T , it crosses another control transfer point to leave the control area. At this moment, the service resources occupied by f j are released. To differentiate different scenarios of service resource supply and demand, three mathematical models—demand model, supply model, and capacity calculation model—are established, respectively. The primary subject of the demand model is aircraft entering the terminal area for service. This model focuses on deriving capacity solutions that satisfy defined constraints and C a p a c i t y is the only decision variable in this mathematical model.

3.2.1. Demand Model

The main object of the demand model is the aircraft entering the terminal area for service. The approach/departure ratio (ADR) of the airport terminal area is a dimensionless quantity that measures the relative demand of arriving and departing flights within a specific period of time, such as per hour. It is calculated by dividing the number of arriving flights by the number of departing flights, as follows:
A D R = j J f j A R R j J f j D E P
i N a i = 1
R i = j J f j A R R · a i , for arrival j J f j D E P · a i , for departure
Among Equations (1)–(3), the set N is the collection of all routes and its cardinality | N | is the total number of air routes. J is defined as the set of all the aircraft sorties while j represents the j t h flight mission in the service. a i denotes the utilization rate of the i t h route.
All the aircraft f j under services are categorized into k types; here, the set K represents the collection of all the aircraft types. Then, it corresponds to the following equation for the proportion I i , k of each type of aircraft in different air routes:
k K I i k = 1 , i N
In Equation (4), I i k represents the proportion of the k t h aircraft type among overall aircraft sorties on the i t h route. p i k is denoted as the proportion of aircraft of the k t h type among the total service sorties on route i. Based on the above computations, the flight service probability matrix P can be derived as follows:
P = p 11 p 12 p 1 k p 21 p 22 p 2 k p i 1 p i 2 p i k = R 1 R 2 R i · I 11 I 12 I 1 k I 21 I 22 I 2 k I i 1 I i 2 I i k
In Equation (5), The matrix P is obtained by multiplying the vector R and the matrix I. Each element p i k in the matrix P is derived by multiplying the element R i in the vector R and the element I i k in the matrix I. That is, p i k = R i · I i k .
In Equation (6), when the aircraft f j passes through the terminal area, it will generate two time points: the entry time t j I N and the exit time t j O U T . Based on these two time points, the expected flight time T i k of each type of aircraft f j on different air route i can be calculated based on the entry time t f i k I N and exit time t f i k O U T of each aircraft f j as it passes through the terminal area.
T i k = f i k J ( t f i k O U T t f i k I N ) f i k J f i k , i N , k K
f i k represents an aircraft operated on air route i and belongs to aircraft type k. The time at which the aircraft enters the terminal airspace is denoted by t f i k I N , and the time at which it exits the terminal airspace is denoted by t f i k O U T .
Equation (7) is the mathematical model for the expected demand service time E ( T i k ) in the terminal area.
E ( T i k ) = i N , k K I i k T i k

3.2.2. Supply Model

To describe the supply–demand relationship of service resources in the terminal area, the supply model is established. Equation (8) obtains the expected maximum supply service time T s e r :
T s e r = S m a x T c a l
The parameter S m a x indicates the maximum aircraft handling capacity of an air traffic controller under peak circumstances. T c a l refers to the unit of time for capacity calculation, which is set to 60 min, converted from 1 h according to the statistical scale.

3.2.3. Capacity Calculation Model

The prerequisite for calculating terminal capacity is the balance between service supply and demand, which means that the maximum available service time should be greater than or equal to the estimated service time required. From the point of view of quantity, this translates into ensuring that the number of aircraft-receiving services in the terminal area at any given time does not exceed the number that air traffic controllers can safely handle up to four aircraft per hour at peak workload periods. Equation (9) represents the capacity calculation model:
T s e r E ( T i k ) C a p a c i t y
Considering that air traffic control services cannot remain in a state of peak period indefinitely, it is necessary to add an utilization coefficient u to constrain it. Therefore, based on service supply and demand balance, the terminal area capacity mathematical model is as shown in Equation (10):
u T s e r = E ( T i k ) C a p a c i t y
As the utilization coefficient, u represents the probability that the number of aircraft simultaneously receiving services in the terminal area within a unit of time does not exceed the number that can be safely handled under peak period conditions. When u is 1, the calculated capacity is the ultimate capacity. When u takes a value in [0,1), the calculated capacity is the operational capacity.

4. Empirical Analysis of the Proposed Model

4.1. Model Implementation Using ZBLA Airport Data

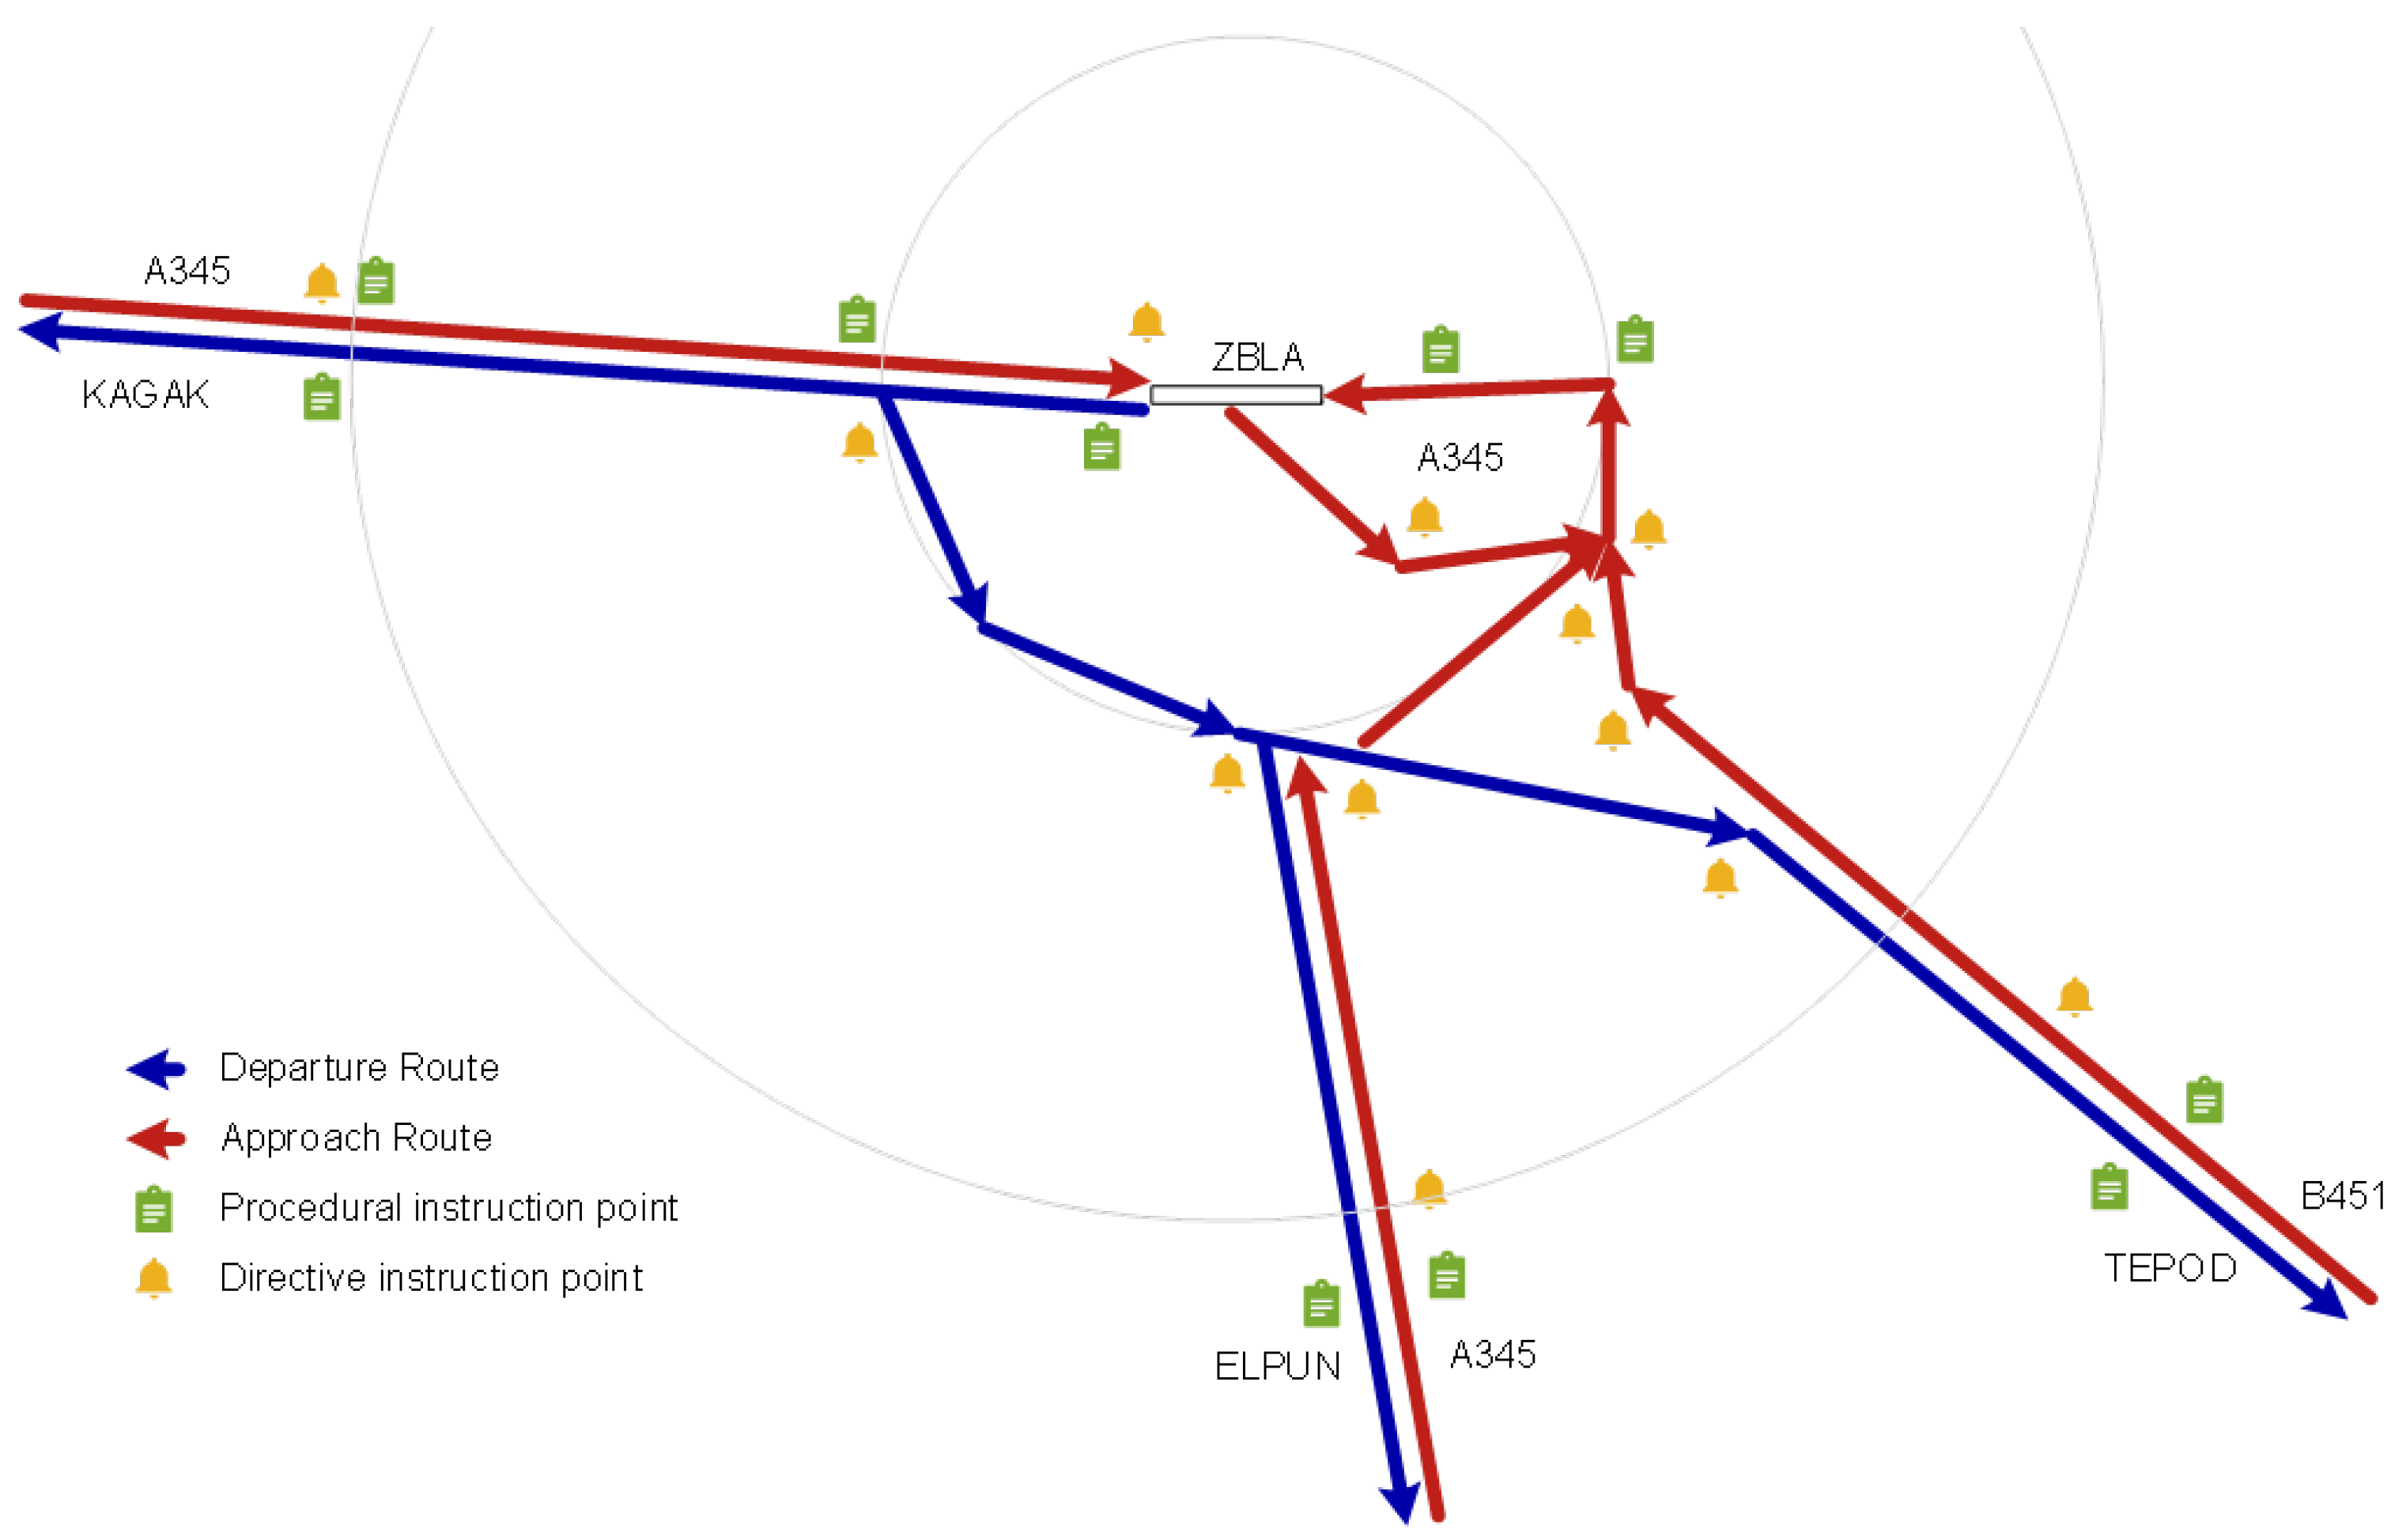
The terminal area of Hulunbuir Hailar Airport (ICAO: ZBLA) was selected as the subject for capacity calculation analysis. As shown in Figure 2, during the chosen time period, the terminal area employed procedural control and associated approach operation modes. A total of six arrival and departure routes are present in the area, consisting of three Standard Instrument Arrival (STAR) routes and three Standard Instrument Departure (SID) routes.
Based on the analysis of on-site collected data, aircraft types within the terminal area were categorized into three classes. The airport’s ADR is 4:6. The approach and departure procedures KAGAK, TEPOD, and ELPUN are utilized in a proportion of 3:17:80. The distribution of aircraft types under different approach and departure procedures is presented in Table 1.
  • Under normal conditions, air traffic controllers at the terminal area of Hulunbuir Hailar Airport (ZBLA) can safely handle up to four aircraft at peak workload periods. Therefore, the supply model parameter S m a x is set to 4, and the calculation time T c a l is 1 h. The continuous working time T s e r is calculated as
    T s e r = s m a x T c a l = 4 × 60 = 240 min
  • Considering that the average workload of air traffic controllers in China should not exceed 70% of the maximum workload threshold, the utilization coefficient u is set to 0.7 for this calculation.
  • When the utilization coefficient is unconstrained, the mathematical model can be expressed as
    u T s e r = E ( T i k ) C a p a c i t y = ( 0.408 × 11.2 + 0.072 × 14.4 + 0.086 × 9 + 0.016 × 11.5 + 0.010 × 6.5 + 0.005 × 8 + 0.003 × 7 + 0.272 × 7.8 + 0.048 × 10.1 + 0.057 × 6 + 0.011 × 7.7 + 0.006 × 12.3 + 0.004 × 15.8 + 0.002 × 22.2 ) C a p a c i t y = 9.905 × C a p a c i t y
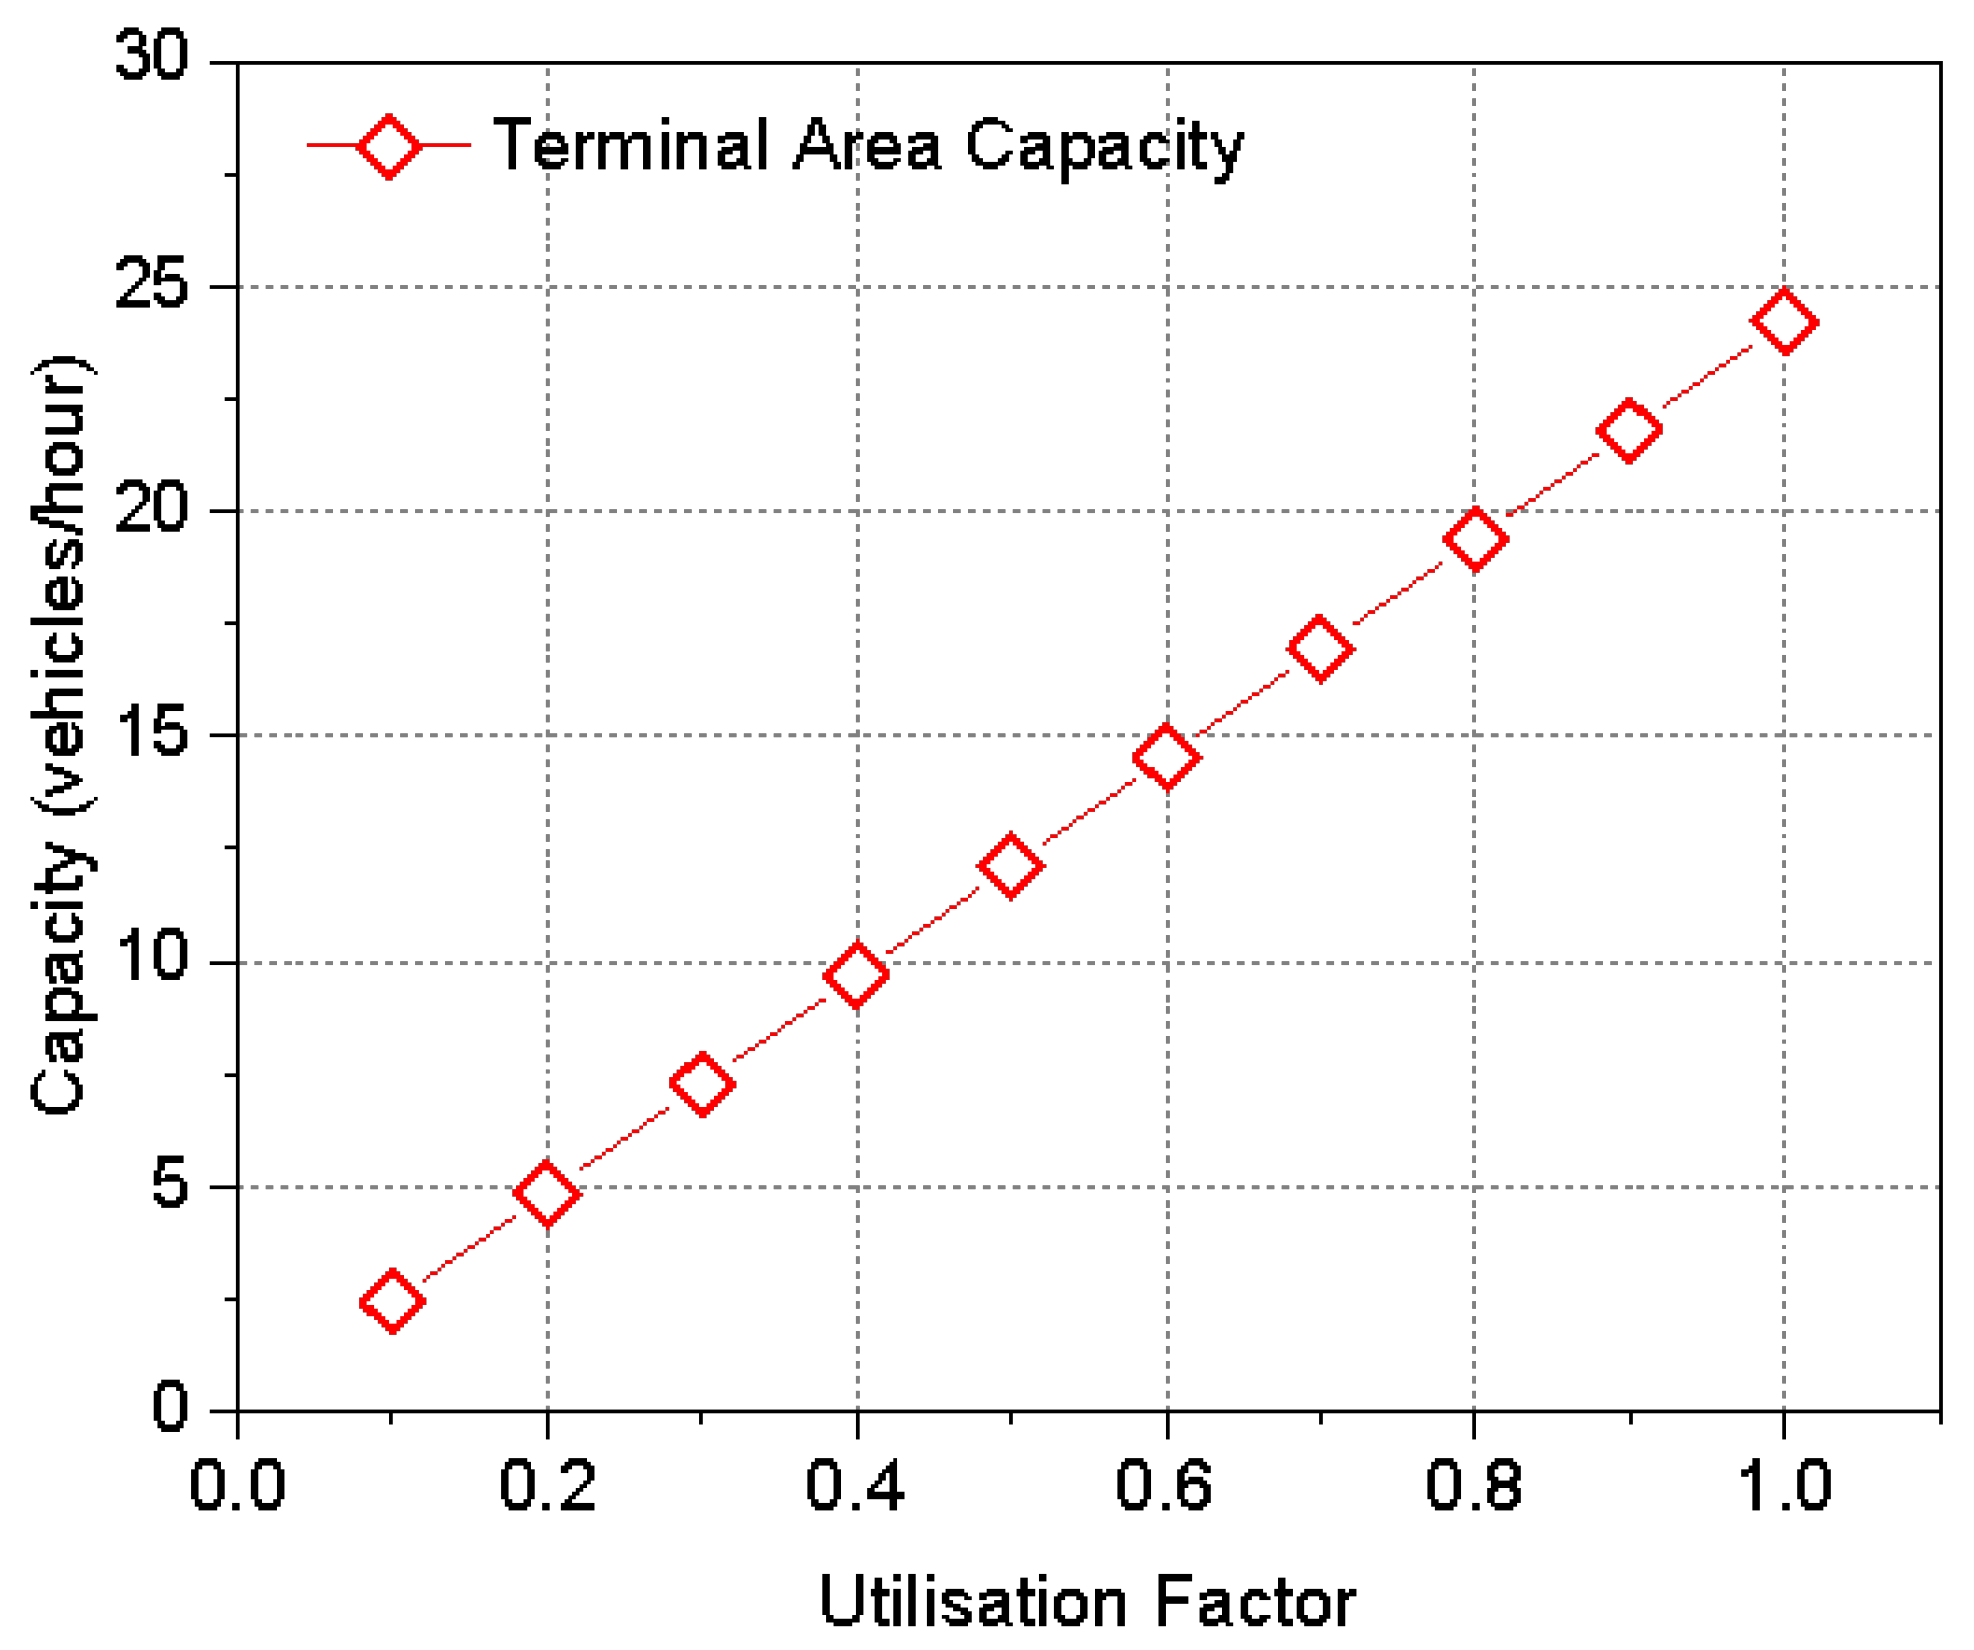
  • When the utilization coefficient u assumes different values between 0.1 and 1, the workload and estimated terminal airspace capacity results vary accordingly. A higher u indicates a greater workload for air traffic controllers; thus, as shown in Figure 3, the c a p a c i t y increases as u increases. The relationship can be expressed as a linear equation approximately equal to C a p a c i t y = 24.2 u . In this study, a utilization coefficient of 0.7 is selected to represent a busy workload scenario for terminal airspace controllers at Hulunbuir Hailar Airport (ZBLA). Consequently, the calculated recommended operational capacity is 17 aircraft movements per hour.

4.2. Model Validation by Monte Carlo Simulation

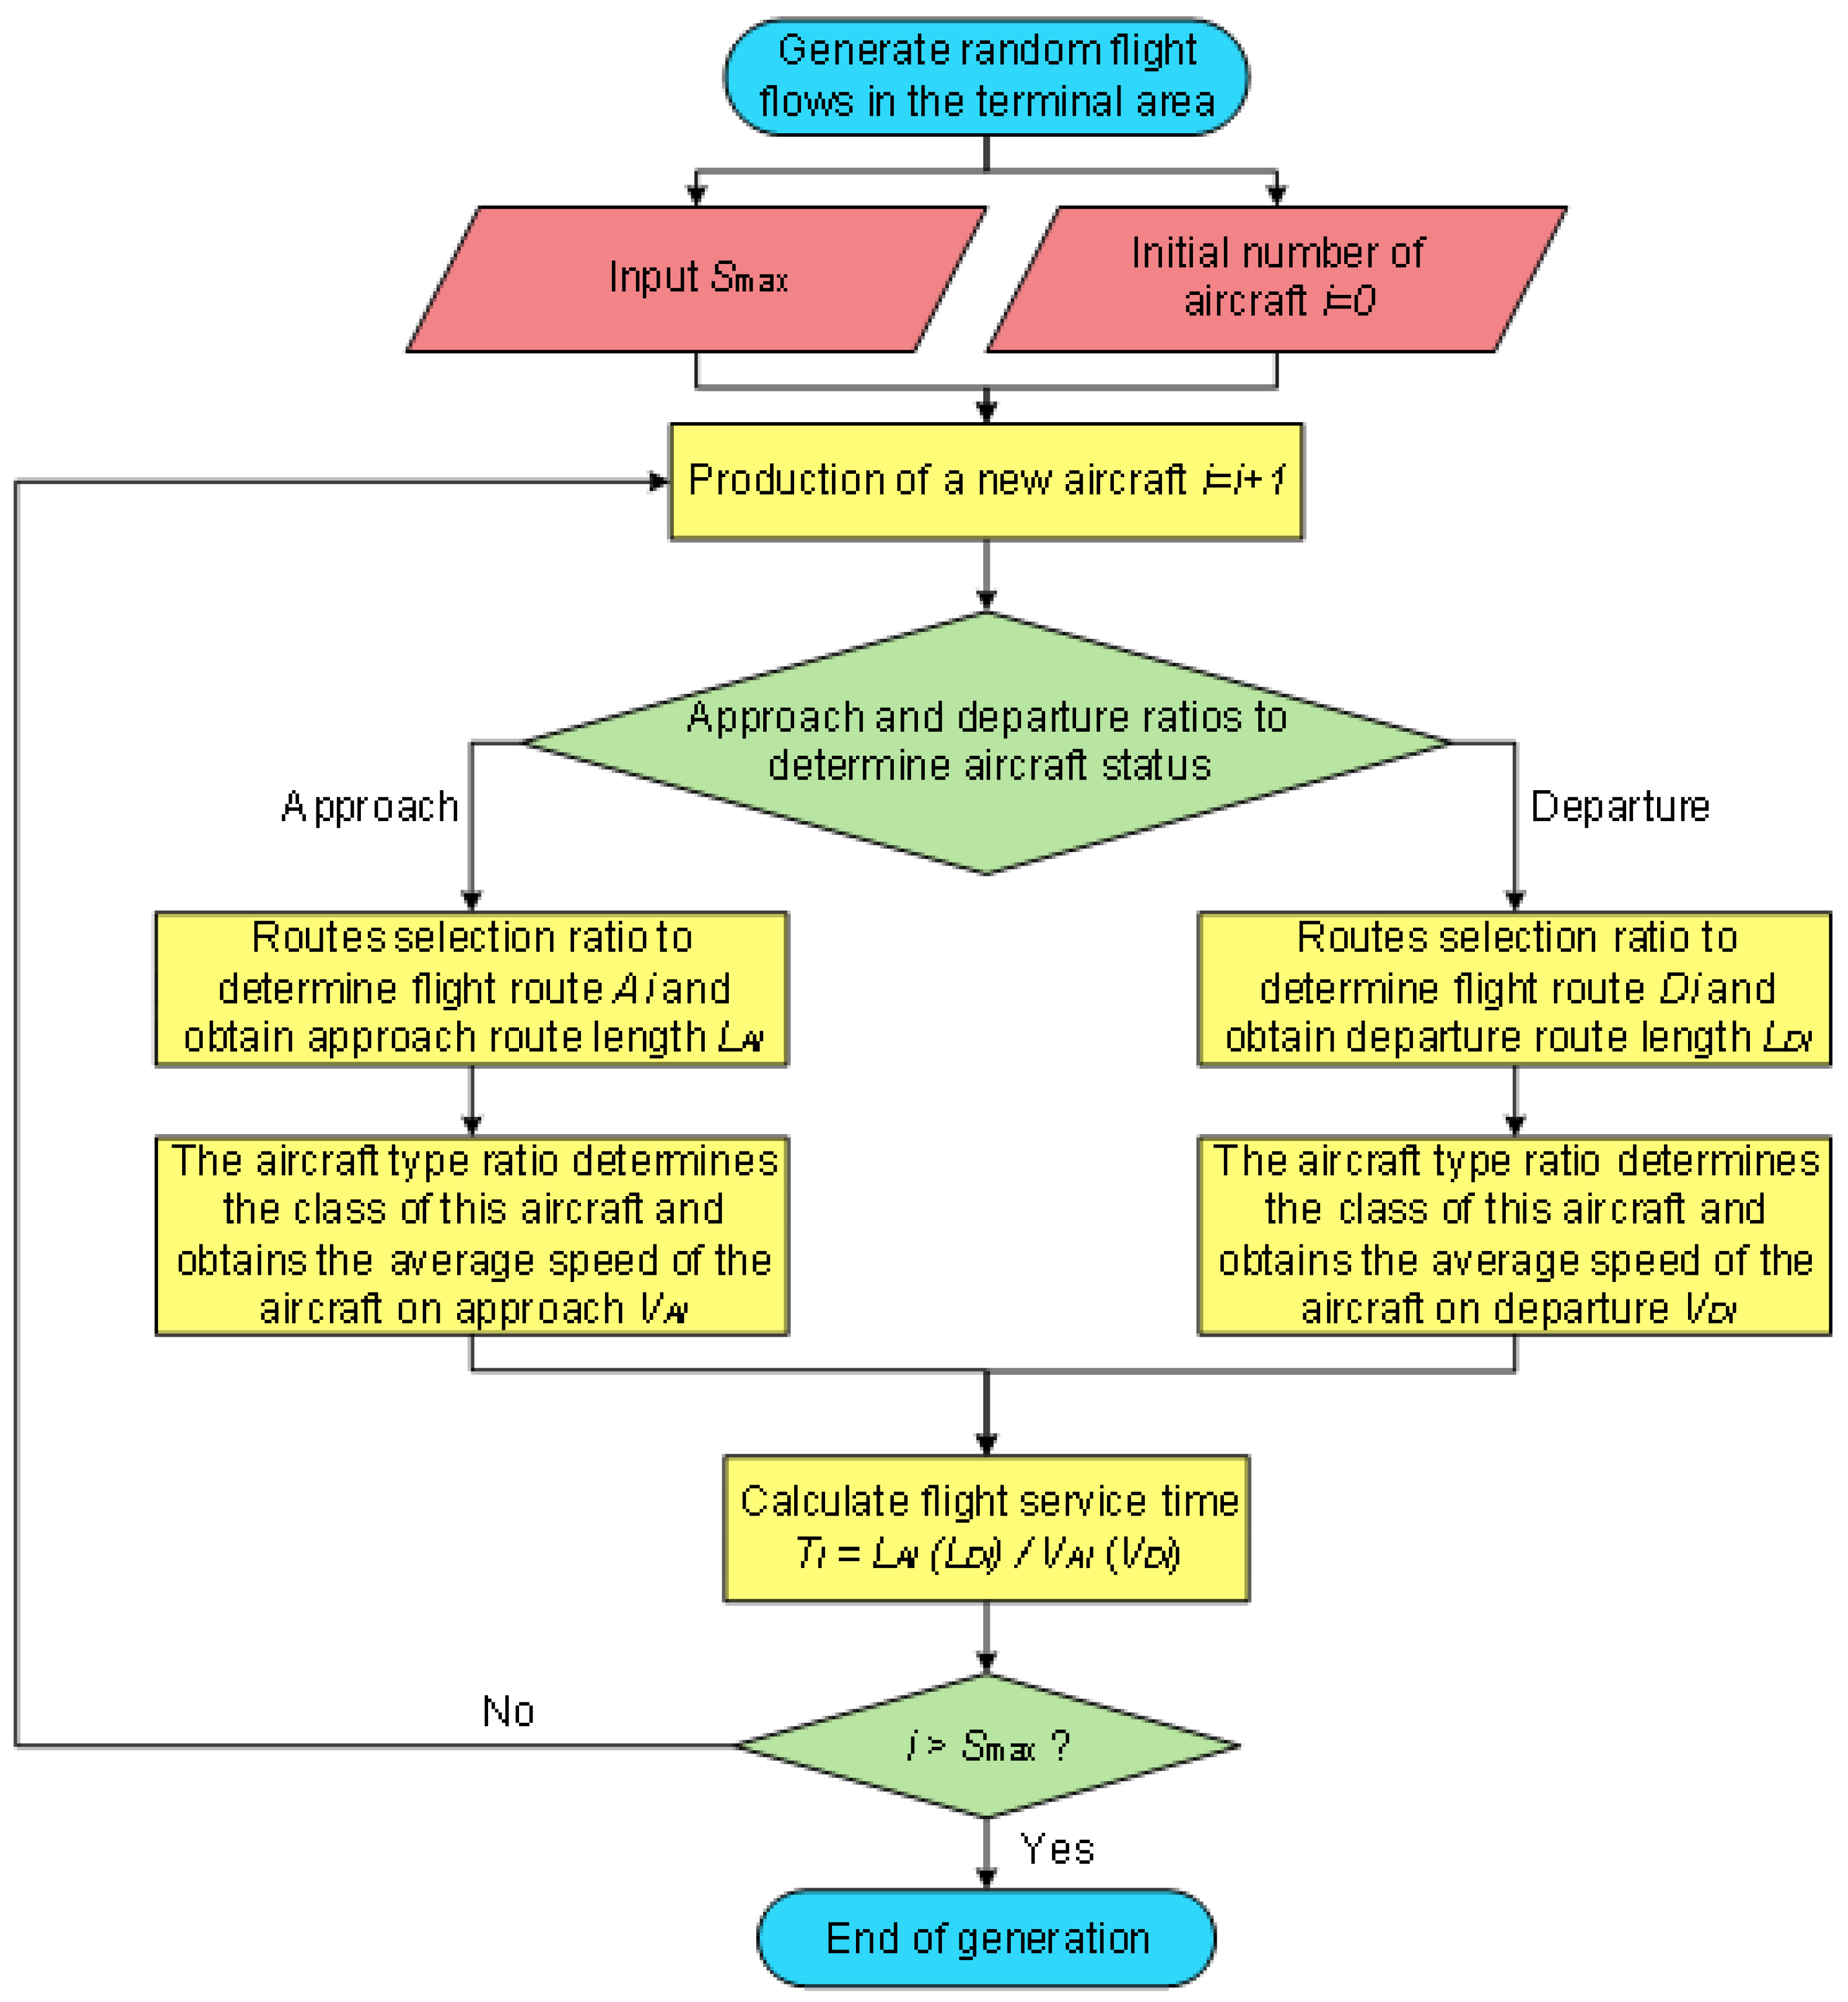
To verify the accuracy of the computation results obtained from the model, this study employs the Monte Carlo method [24] to develop and implement a numerical simulation program, which is subsequently used to assess the capacity of the terminal area at Hulunbuir Hailar Airport (ZBLA). The simulation process involves generating a random aircraft flow, which constitutes a critical step [25]. The Monte Carlo method simulates the process of random aircraft flow generation in the terminal area by conducting multiple simulation runs. This proposed approach helps to ensure that the generated random aircraft flow aligns with actual operating conditions. It also maintains the randomness for each simulation run. The detailed simulation procedure for aircraft flow generation is illustrated in Figure 4.
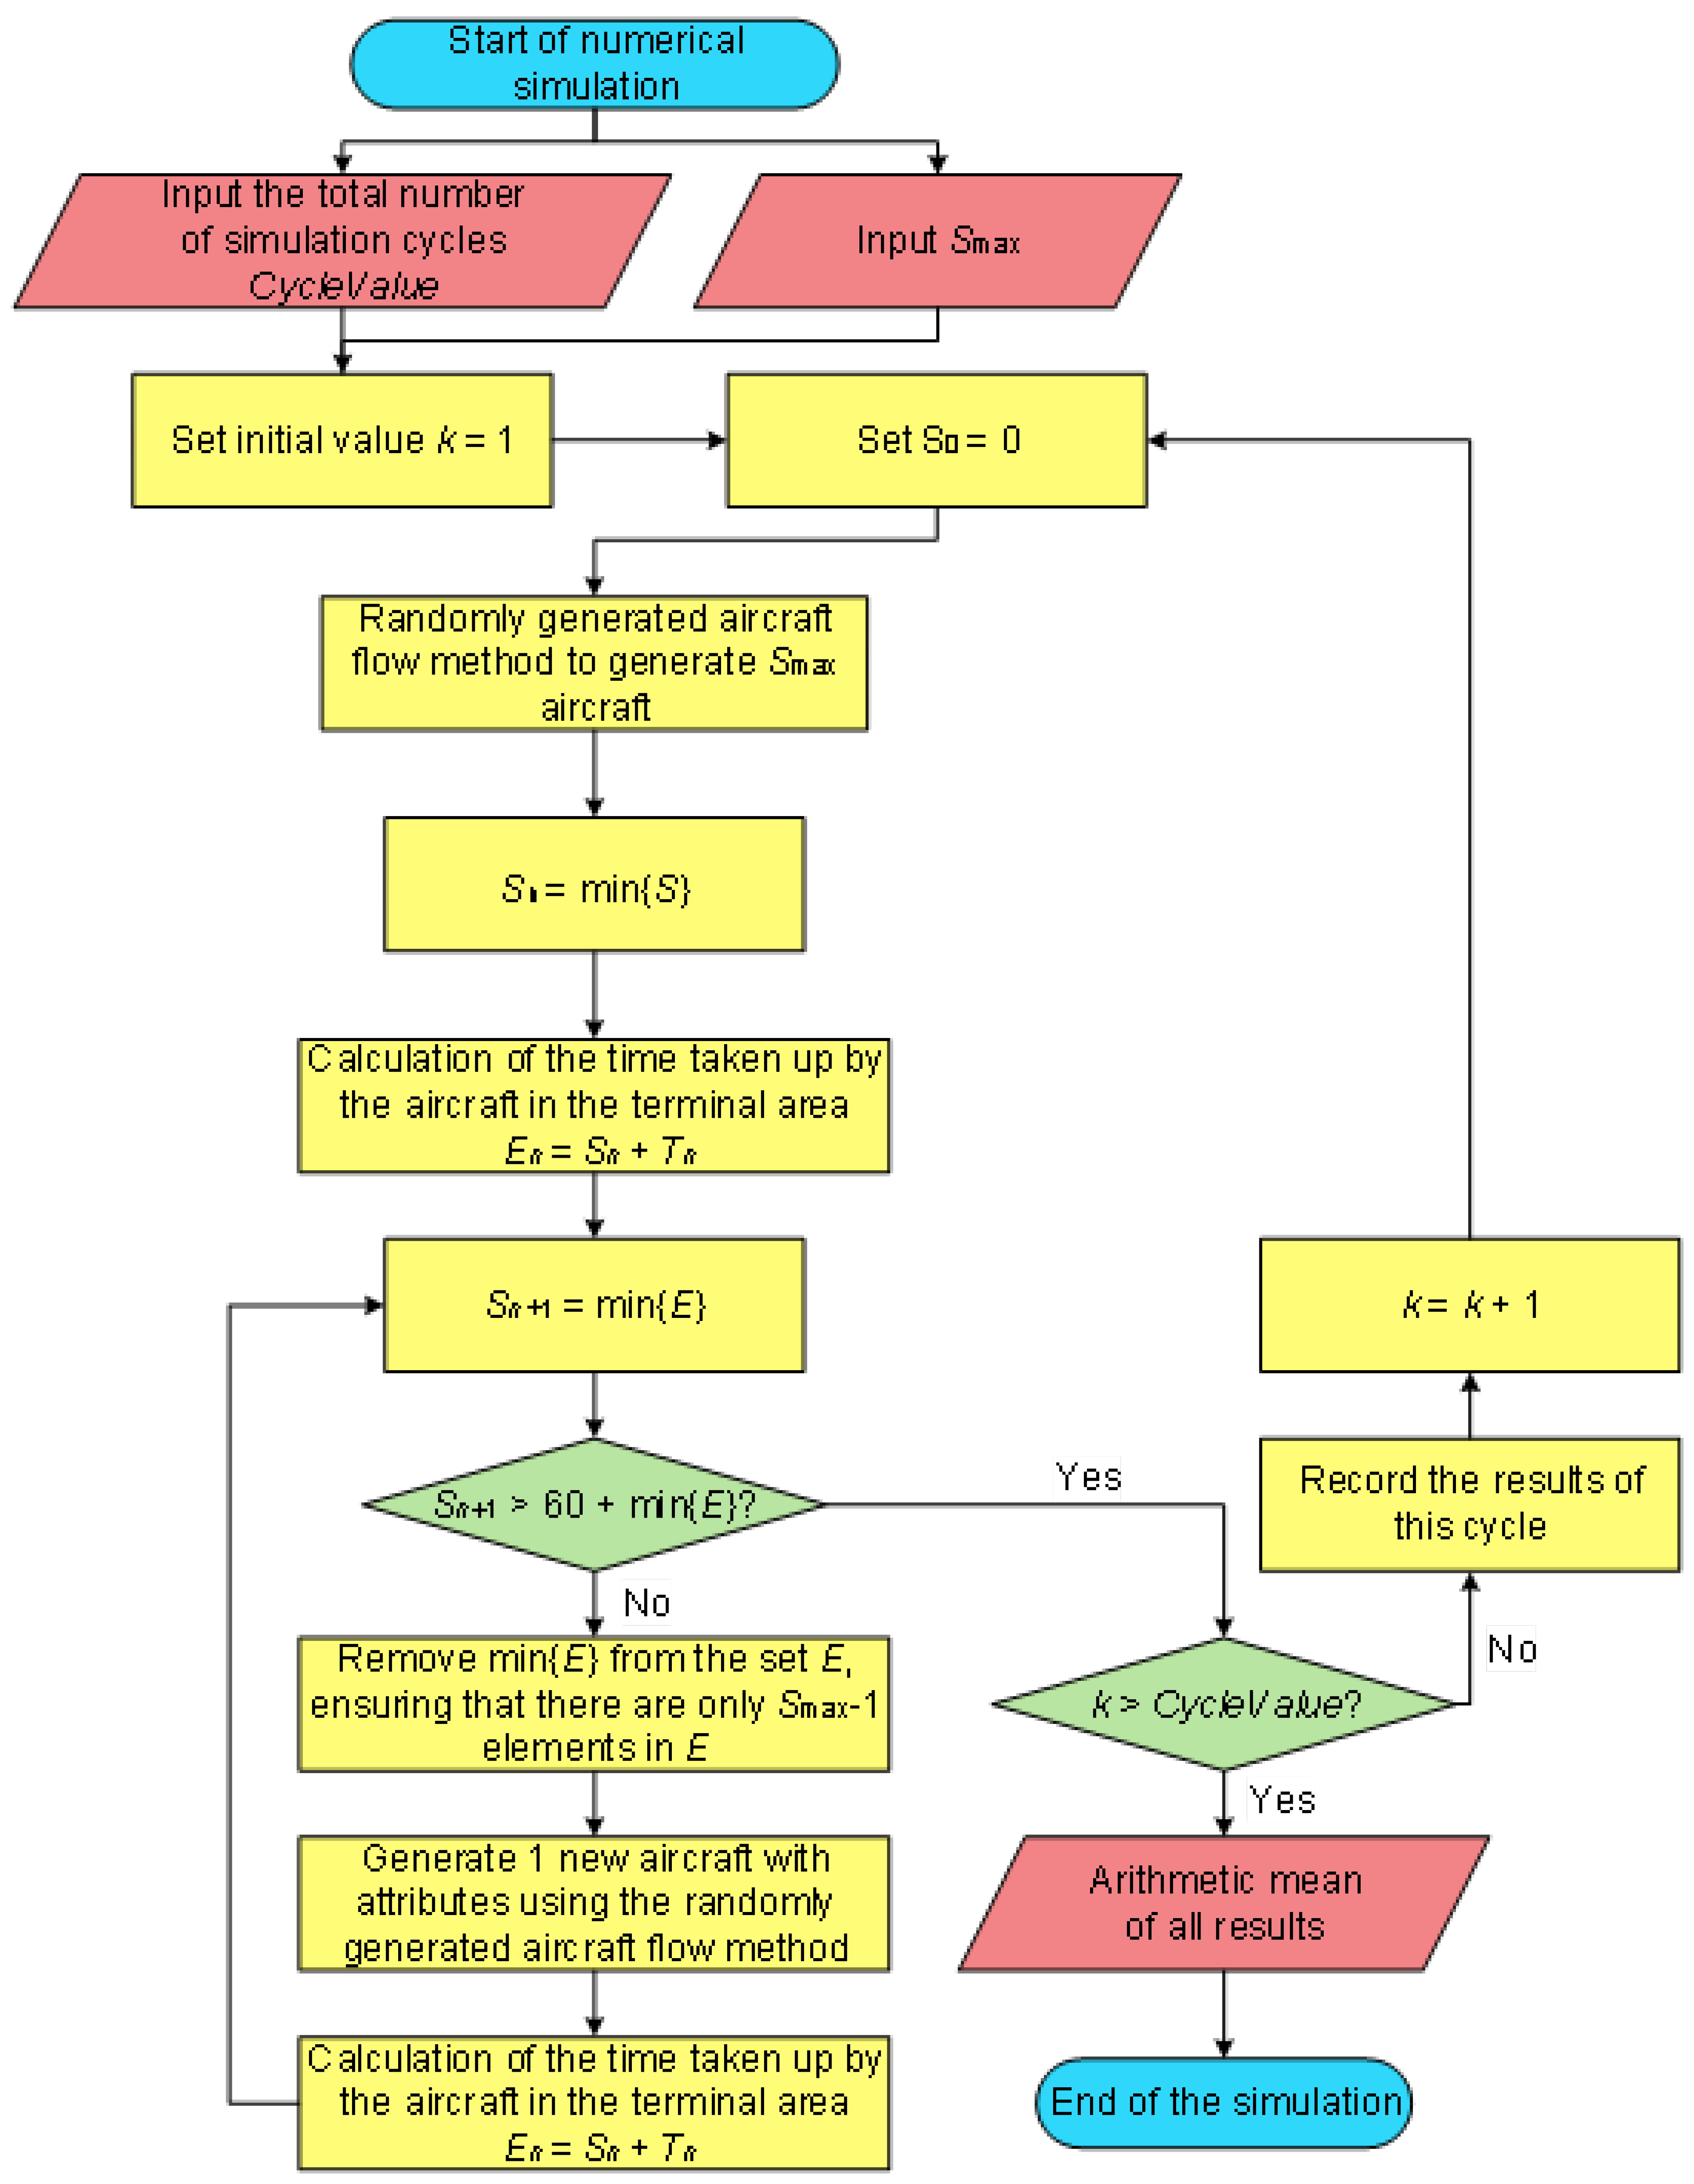
To eliminate the influence of the stochastic elements in generated aircraft flows with the simulation model, an averaging process has been utilized to satisfy the actual operational conditions. Derived from the random aircraft flow generation methodology, a statistical summarization of airspace and resources occupancy time was achieved in accordance with aircraft and airspace scenario calculation results. Each cycle corresponds to an averaging of the calculation results to minimize the impacts of random factors. The detailed simulation workflow is illustrated in Figure 5.
The detailed simulation procedure is illustrated below:
  • Random aircraft generation within the terminal area In the simulation, each aircraft needs to be randomly generated to operate in the airspace based on the take-off and landing ratios, the percentages of approach and departure procedures, and the percentages of aircraft types for different approach and departure procedures. The flight distance and speed are determined based on the selected approach, departure procedure, and aircraft type, resulting in the flight time for that aircraft. In each cycle, n aircraft are first generated to meet the condition that no more than n aircraft are under ATC control at the same time, which means n aircraft sorties in the terminal area are maintained as the limit case.
  • Confirmation upon aircraft’s proceeding out of the terminal area in the simulation progresses, aircraft fly along the selected approach and departure procedures until one of the aircraft reaches the endpoint. The timing starts from aircraft’s proceeding out of the first aircraft until the cumulative time reaches 1 h. The endpoints in this simulation are the points where arriving aircraft hand over control to the tower (for landing aircraft) or the approach control (for departing aircraft). In this simulation, the endpoints are the transfer points where aircraft in the approach control zone transfer control to the control zone (for landing aircraft) or the Area Control Center (for departing aircraft).
  • Defining the iteration rules: When an aircraft proceeds out of the endpoint, an aircraft is generated randomly in the scenario. This constantly maintains n aircraft being operated within the terminal control area. Steps 2 and 3 are repeated until the cumulative time reaches 1 h. After counting the total number of aircraft present in this iteration, aircraft generation was ceased for this iteration.
  • Defining the integrated iteration rules: Repeat Steps 1 through 3 until reaching the preset number of iterations. Take the arithmetic mean of the results as the numerical simulation capacity of the terminal area. The total number of iterations k is set to 1000. The approach and departure traffic distribution data, terminal area route selection ratios, and flight durations used in this simulation are the same as those in the previous model. The arithmetic mean of the results from these 1000 computational loops is used to determine the limit capacity of the terminal area. The final results are presented in Figure 6.
The data in Figure 6 and Figure 7 show that the solutions of each computational iteration oscillate around the midpoint between 23 and 24, which demonstrates that, within a fixed unit of time, factors including flight scheduling and types of aircraft exert certain effects on the capacity. During the computation, the maximum throughput was 29 flight sorties per hour, whereas the minimum was 20 flight sorties per hour. Given the stochastic nature of each iteration, the arithmetic mean of results from all loops should be adopted as the simulated maximum capacity.

4.3. Quantitative Assessment and Extrapolation

After the assessment of the capacity of terminal maneuvering area of Hailar Airport (ZBLA) with two methods in this paper and simulations on an ATC simulator, the results from the two methods and the simulator experiments are found to be similar under the current operating mode, with the (terminal maneuvering area) operating capacity being 17 flight sorties per hour. As shown in Table 2, the difference in maximum capacity was 0.291 flight sorties per hour, and the difference in operating capacity was 0.203 flight sorties per hour. In conventional capacity assessments, values after the decimal point are usually rounded to the nearest integer. Since the differences under the two methods were both less than 0.3, the results from the mathematical models can be validated to a certain extent.
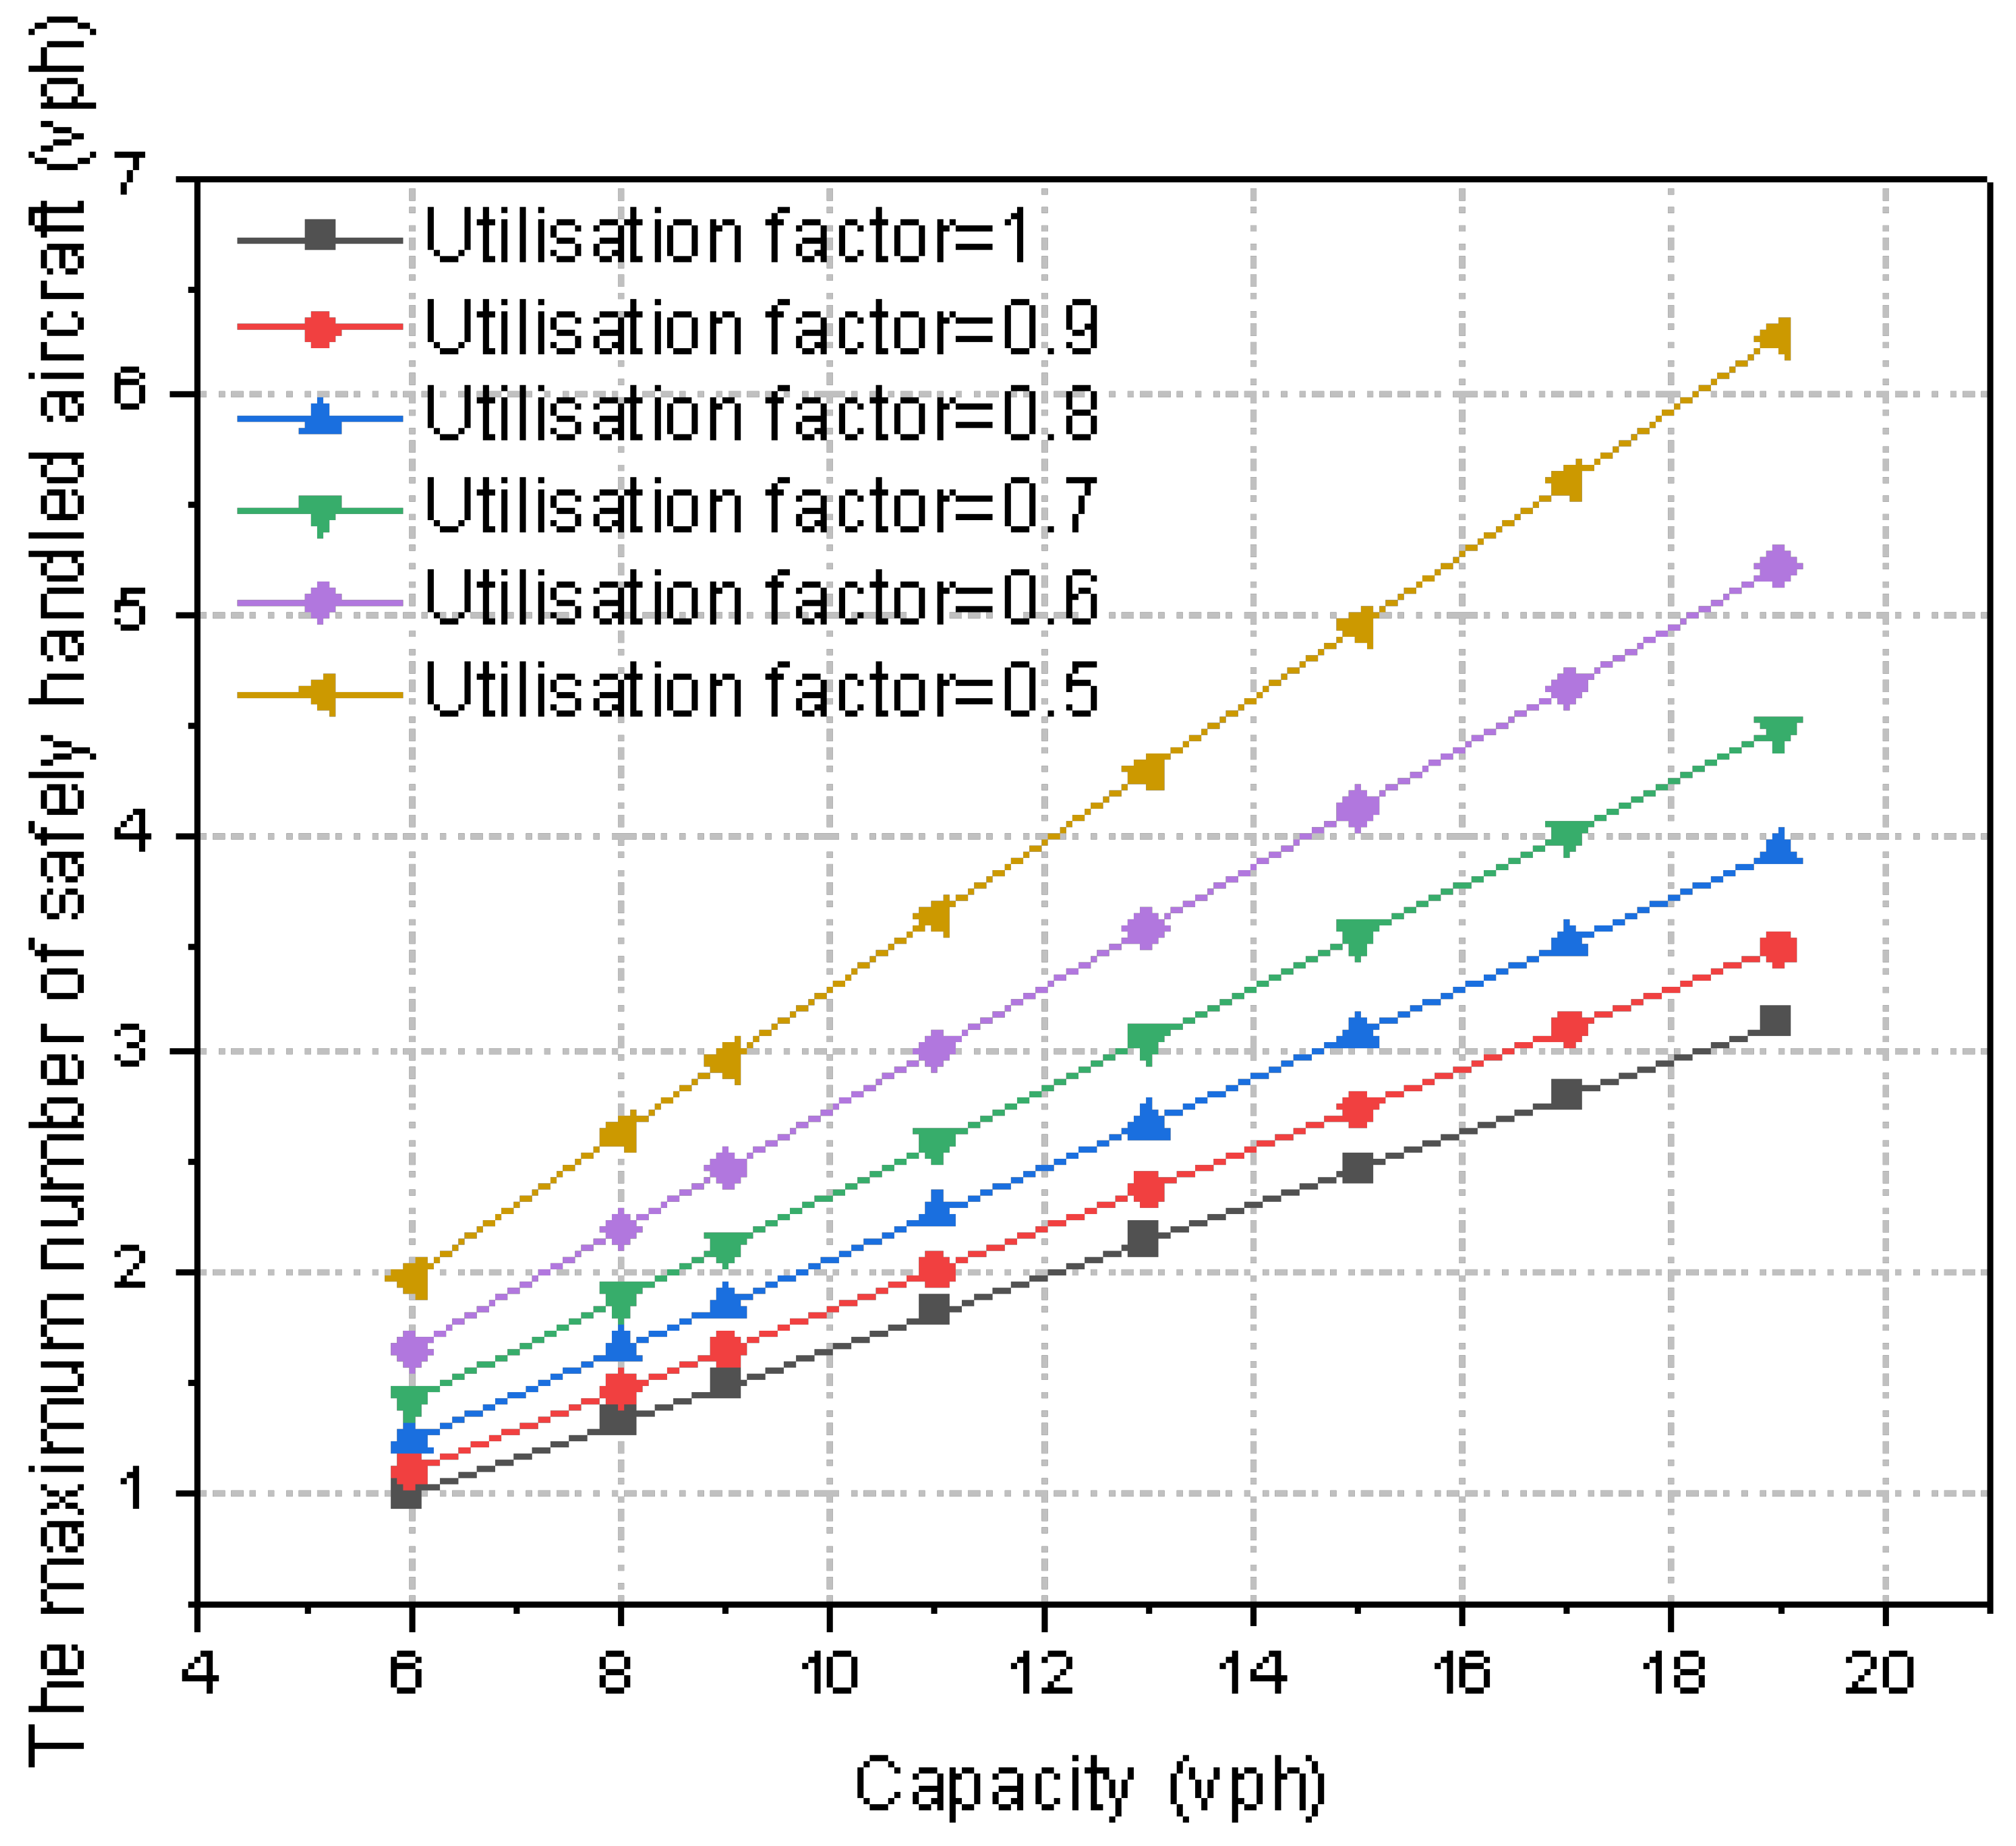
The majority of contemporary studies on airport traffic management regard capacity as an invariant parameter [25,26]. In actuality, airport capacity is subject to variations contingent upon shifts in operating conditions. Such an alerting approach necessitates substantial data aggregation and computation to derive relatively precise outcomes [27], which impedes timely alerting. Disparities in time frames and flight flow characteristics engender deviations in both controller workload and the maximum number of aircraft that can be safely handled. The fluctuating nature of air traffic also renders the maximum number of aircraft that can be securely serviced by controllers under a safe workload constantly mutable. Therefore, in order to incorporate the workload component into air traffic alerting operations, the computational model established in this study was enhanced. Given determinate controller workload, terminal area configuration, and flight flow characteristics within a particular temporal scope, the maximum number of aircraft that can be safely handled at peak periods is deduced. Taking the aforementioned airport terminal airspace as an example, the correlation between the maximum number of aircraft safely serviced and capacity during intervals of maximum controller workload is as follows:
S m a x = E ( T i k ) u T c a l C a p a c i t y
With the current capacity of 19 aircraft sorties per hour at the peak hours of the terminal area, the relationship between the maximum number of aircraft safely handled and the area capacity was obtained by gradually adjusting the utilization coefficient and reducing the capacity at peak hours. As shown in Figure 8, the maximum number of aircraft safely handled shows a decreasing trend with the decrease in terminal area capacity. This indicates that the bottleneck has shifted to the service ability of air traffic controllers as the traffic flow of the terminal area decreases. As mentioned above, under variant flow scenarios, it is viable to formulate an efficacious shift scheduling scheme for air traffic controllers. Furthermore, in view of the service abilities of the terminal area, it is promising to devise terminal zone flow regulation strategies and tactics for discrete operational conditions.

5. Conclusions

Terminal maneuvering area capacity computation constitutes one of the focal points in the preliminary phases of air traffic management and airport development planning. In order to determine the capacity of the terminal maneuvering area, this study divides the service resources of the terminal maneuvering area into supply resources and demand resources based on the relevant data. Through mathematical modeling, this study develops an optimized model to obtain the terminal maneuvering area capacity based on the dynamic equilibrium between supply resources and demand resources. Through empirical studies, this model demonstrates solid applicability in estimating the capacity of airport terminal maneuvering areas. Compared with other mathematical approaches, this model provides a new perspective of assessing terminal maneuvering area capacity based on the equilibrium of service resource supply and demand. In summary, the key conclusions drawn from this study are as follows:
  • This study validates the computed results by using a Monte Carlo-based numerical simulation method, which demonstrates a close similarity between the simulated and actual results. The computation and simulation results show that the difference between estimated and amended capacities was within 0.3 flights per hour, aligned with historical data, proving the robustness of the proposed approach. This confirms the reliability of the capacity computations obtained through the proposed model. The findings indicate that the model can accurately and reasonably estimate the terminal maneuvering area’s capacity, providing theoretical support for traffic management methods at airports and terminal maneuvering areas and offering an innovative approach to evaluating the capacity of certain airspace.
  • By incorporating service resources and traffic alert operations, and examining the relationship between the maximum safe number of aircraft handled during peak periods and the capacity, this study broadens the utility of the mathematical model. It enables the prediction of the maximum safe number of aircraft that controllers can handle during peak periods based on the determined terminal maneuvering area capacity, offering guidance for shift scheduling of air traffic controllers and traffic flow management at Air Traffic Control (ATC) facilities. The model outputs can also inform flight scheduling and air traffic control departments on optimizing arrival and departure efficiency.
  • This study has some limitations. First, the case study only selected the terminal maneuvering area of Hulunbuir Hailar Airport, which has limited sample representativeness. Second, human factors like fatigue also negatively impact the study, beyond the consideration of workload. Moreover, as the research is based on a single case analysis, the findings may not be directly generalizable to other terminal maneuvering areas or scenarios. The current model only considers the balance of service resource supply and demand, while stochastic factors like meteorological elements such as extreme adverse weather are not yet incorporated. In summary, the results and model need validation in more extensive samples and scenarios. This requires further refinement of the model to achieve higher fidelity to authentic operational circumstances. Future research should consider these factors from a more comprehensive perspective to enrich the applicability of the model.

6. Patents

A patent related to the work reported in this manuscript has been filed and granted in Mainland China. The patent, held by the Civil Aviation Flight University of China, was granted on 21 April 2023, with the patent number ZL 2022 1 0333488.4 [28].

Author Contributions

Conceptualization, Q.M. and L.Z.; methodology, Q.M. and L.Z.; software, L.Z. and Z.Y.; validation, L.Z. and Z.Y.; formal analysis, L.Z.; investigation, L.Z. and Q.M.; resources, Q.M.; data curation, L.Z. and Z.Y.; writing—original draft preparation, L.Z. and Q.M.; writing—review and editing, Z.Y.; visualization, L.Z. and Z.Y.; supervision, Q.M.; project administration, Q.M.; funding acquisition, Q.M. All authors have read and agreed to the published version of the manuscript.

Funding

This work was supported by the Fundamental Research Funds for the Central Universities (Grant No. ZHMH2022-002) and the Science and Technology Department of Sichuan Province (Grant No. 2022YFG0196).

Institutional Review Board Statement

Not applicable.

Informed Consent Statement

Not applicable.

Data Availability Statement

The data were obtained through field surveys conducted in Hailar Airport Project during 2021. For scholarly purposes, researchers who are interested in the data can contact the corresponding author.

Acknowledgments

This work was previously available as a preprint on Research Square [29].

Conflicts of Interest

The authors declare no conflict of interest.

References

  1. Jiang, B.; Hu, M.; Tian, Y.; Huang, W. Simulation method of airspace capacity eval-uation at terminal area. J. Traffic Transp. Eng. 2003, 1, 97–100. [Google Scholar] [CrossRef]
  2. Pan, W.; Kang, R. Multi-airports Coordination Optimizing Model Based on Key Points Air Traffic Flow Limitation. J. Sichuan Univ. Eng. Sci. Ed. 2013, 45, 106–111. [Google Scholar] [CrossRef]
  3. Zhang, J.; Zhang, J. Arriving and leaving aircraft scheduling model based on dynamic optimize. J. Sichuan Univ. Nat. Sci. Ed. 2012, 49, 90–96. [Google Scholar] [CrossRef]
  4. Mitchell, J.; Polishchuk, V.; Krozel, J. Airspace throughput analysis considering stochastic weather. In Proceedings of the AIAA Guidance, Navigation, and Control Conference and Exhibit, Keystone, Colorado, 21–24 August 2006; p. 6770. [Google Scholar] [CrossRef]
  5. Janic, M. Modeling effects of different air traffic control operational procedures, separation rules, and service disciplines on runway landing capacity. J. Adv. Transp. 2014, 48, 556–574. [Google Scholar] [CrossRef]
  6. Volf, P. NAS-wide simulation of air traffic with ATC behavior model. In Proceedings of the 2015 Integrated Communication, Navigation and Surveillance Conference (ICNS), Herndon, VA, USA, 21–23 April 2015; p. O3-1. Available online: https://www.researchgate.net/publication/299853129_NAS-wide_simulation_of_air_traffic_with_ATC_behavior_model (accessed on 14 October 2023).
  7. Kicinger, R.; Chen, J.T.; Steiner, M.; Pinto, J. Airport capacity prediction with explicit consideration of weather forecast uncertainty. J. Air Transp. 2016, 24, 18–28. [Google Scholar] [CrossRef]
  8. Kageyama, K. ATC Procedures Modeling for Capacity Estimation of Japanese Airspace. In Proceedings of the AIAA Modeling and Simulation Technologies Conference, Grapevine, TX, USA, 9–13 January 2017. [Google Scholar] [CrossRef]
  9. Zhang, K.; Liu, Y.; Wang, J.; Song, H.; Liu, D. Tree-based airspace capacity estimation. In Proceedings of the 2020 Integrated Communications Navigation and Surveillance Conference (ICNS), Herndon, VA, USA, 8–10 September 2020; pp. 5C1-1–5C1-8. [Google Scholar] [CrossRef]
  10. Zamarreño Suárez, M.; Arnaldo Valdes, R.M.; Pérez Moreno, F.; Delgado-Aguilera Jurado, R.; López de Frutos, P.M.; Gomez Comendador, V.F. How much workload is workload? A human neurophysiological and affective-cognitive performance measurement methodology for ATCOs. Aircr. Eng. Aerosp. Technol. 2022, 94, 1525–1536. [Google Scholar] [CrossRef]
  11. Chu, M.; Yang, Y.; Fang, J.; Cai, K. An Adaptive Capacity Estimation Method for Terminal Airspace Operation. In Proceedings of the 2022 Integrated Communication, Navigation and Surveillance Conference (ICNS), Dulles, VA, USA, 5–7 April 2022; pp. 1–7. [Google Scholar] [CrossRef]
  12. Dong, X.; Hu, M.; Su, J. Terminal Capacity Assessment Based on Workload of ATC. Aeronaut. Comput. Tech. 2011, 41, 5–8+13. [Google Scholar] [CrossRef]
  13. Li, Y.; Hu, M.; Peng, Y.; Wang, H. Effect Mechanism of Multi-scenarios Terminal Capacity Based on Flow Decomposition Barrier. J. Southwest Jiaotong Univ. 2014, 49, 928–934. [Google Scholar] [CrossRef]
  14. Shen, L.; Xie, P.; Fu, C. Terminal Area Capacity Assessment Based on Certain Delay Level. Informatiz. Res. 2017, 43, 24–27+36. Available online: https://kns.cnki.net/kcms2/article/abstract?v=3uoqIhG8C44YLTlOAiTRKibYlV5Vjs7iAEhECQAQ9aTiC5BjCgn0Rj41MJcFXPushonbYEMvaP7kA1m32PiOQOeoUjqE9Erw&uniplatform=NZKPT&src=copy (accessed on 14 October 2023).
  15. Huang, H.; Gan, X.; Ding, L.; Sun, J. Study on capacity assessment method of terminal area under the influence of military activities. Adv. Aeronaut. Sci. Eng. 2020, 11, 344–352. [Google Scholar] [CrossRef]
  16. Ying, P.E.N.G.; Hong, W.A.N.G.; Limin, M.A.O.; Peng, W.A.N.G. Terminal Traffic Flow Prediction Method Under Convective Weather Using Deep Learning Approaches. Trans. Nanjing Univ. Aeronaut. Astronaut. 2021, 38, 634–645. [Google Scholar] [CrossRef]
  17. Mao, L.; Peng, Y.; Li, J.; Guo, C.; Kang, B.; Cao, Z. Random-forest based terminal capacity prediction under convective weather. Syst. Eng.—Theory Pract. 2021, 41, 2125–2136. [Google Scholar] [CrossRef]
  18. Yu, J.; Liu, H.; Xiong, Y. An improved evaluation model of en route dynamic capacity. J. Sichuan Univ. Nat. Sci. Ed. 2007, 44, 1005–1008. [Google Scholar] [CrossRef]
  19. Li, X.; Zhang, Z.; Wang, L. Terminal area capacity evaluation method based on following stability. Syst. Eng.—Theory Pract. 2009, 29, 173–179. [Google Scholar] [CrossRef]
  20. Zhang, Z.; Wei, Z. A Model for Dynamic Terminal Airspace Capacity Estimation Considering Hazardous Weather. Sci. Technol. Eng. 2015, 346, 53–59+71. [Google Scholar] [CrossRef]
  21. Liu, J.X.; Li, C.C. Assessment of Capacity Based on Air Traffic Controllers’ Workload Simulated on Airtop. Aeronaut. Comput. Tech. 2018, 48, 8–12. [Google Scholar] [CrossRef]
  22. Zhao, Z. Research on Airspace Capacity Assessment and Forecast. Master’s Thesis, Nanjing University of Aeronautics and Astronautics, Nanjing, China, 2015. Available online: https://kns.cnki.net/KCMS/detail/detail.aspx?dbname=CDFDLAST2016&filename=1016751873.nh (accessed on 14 October 2023).
  23. Civil Aviation Administration of China. Civil Aviation Air Traffic Management Rules (CCAR-93TM-R5). 21 December 2017. Available online: http://www.caac.gov.cn/XXGK/XXGK/MHGZ/201712/P020171221370496163543.pdf (accessed on 14 October 2023).
  24. Xie, C.; Wang, X. Terminal Area Capacity Calculation Based on Monte-Carlo Simulation Method. Aeronaut. Comput. Tech. 2009, 39, 1–4. [Google Scholar] [CrossRef]
  25. Bowen, E.G.; Pearcey, T. Delays in the flow of air traffic. Aeronaut. J. 1948, 52, 251–258. [Google Scholar] [CrossRef]
  26. Blumstein, A. An Analytical Investigation of Airport Capacity; Technical Report; Cornell Aeronautical LAB Inc.: Buffalo, NY, USA, 1960; Available online: https://www.researchgate.net/publication/235022981_AN_ANALYTICAL_INVESTIGATION_OF_AIRPORT_CAPACITY (accessed on 14 October 2023).
  27. Zhao, Y.; Chen, K.; Liu, G.; Yue, R. A New Flow Alert Index for Sector Congestion and Its Application. China Saf. Sci. J. 2009, 19, 103–107. [Google Scholar] [CrossRef]
  28. Mou, Q.; Zhang, L.; Feng, X.; Li, M.; Wang, R. 一种基于服务资源供需平衡的机场终端区容量预测方法. China Patent No. CN114758528B, 21 April 2023. Available online: https://xueshu.baidu.com/usercenter/paper/show?paperid=1x1h0gj0f00y0cc0sr4u06k0me444570 (accessed on 14 October 2023).
  29. Mou, Q.; Zhang, L.; Fang, C.; Li, M.; Feng, X. Airport Terminal Area Capacity Calculation Based on Supply and Demand Balance of Service Resources. Preprint 2022. [Google Scholar] [CrossRef]
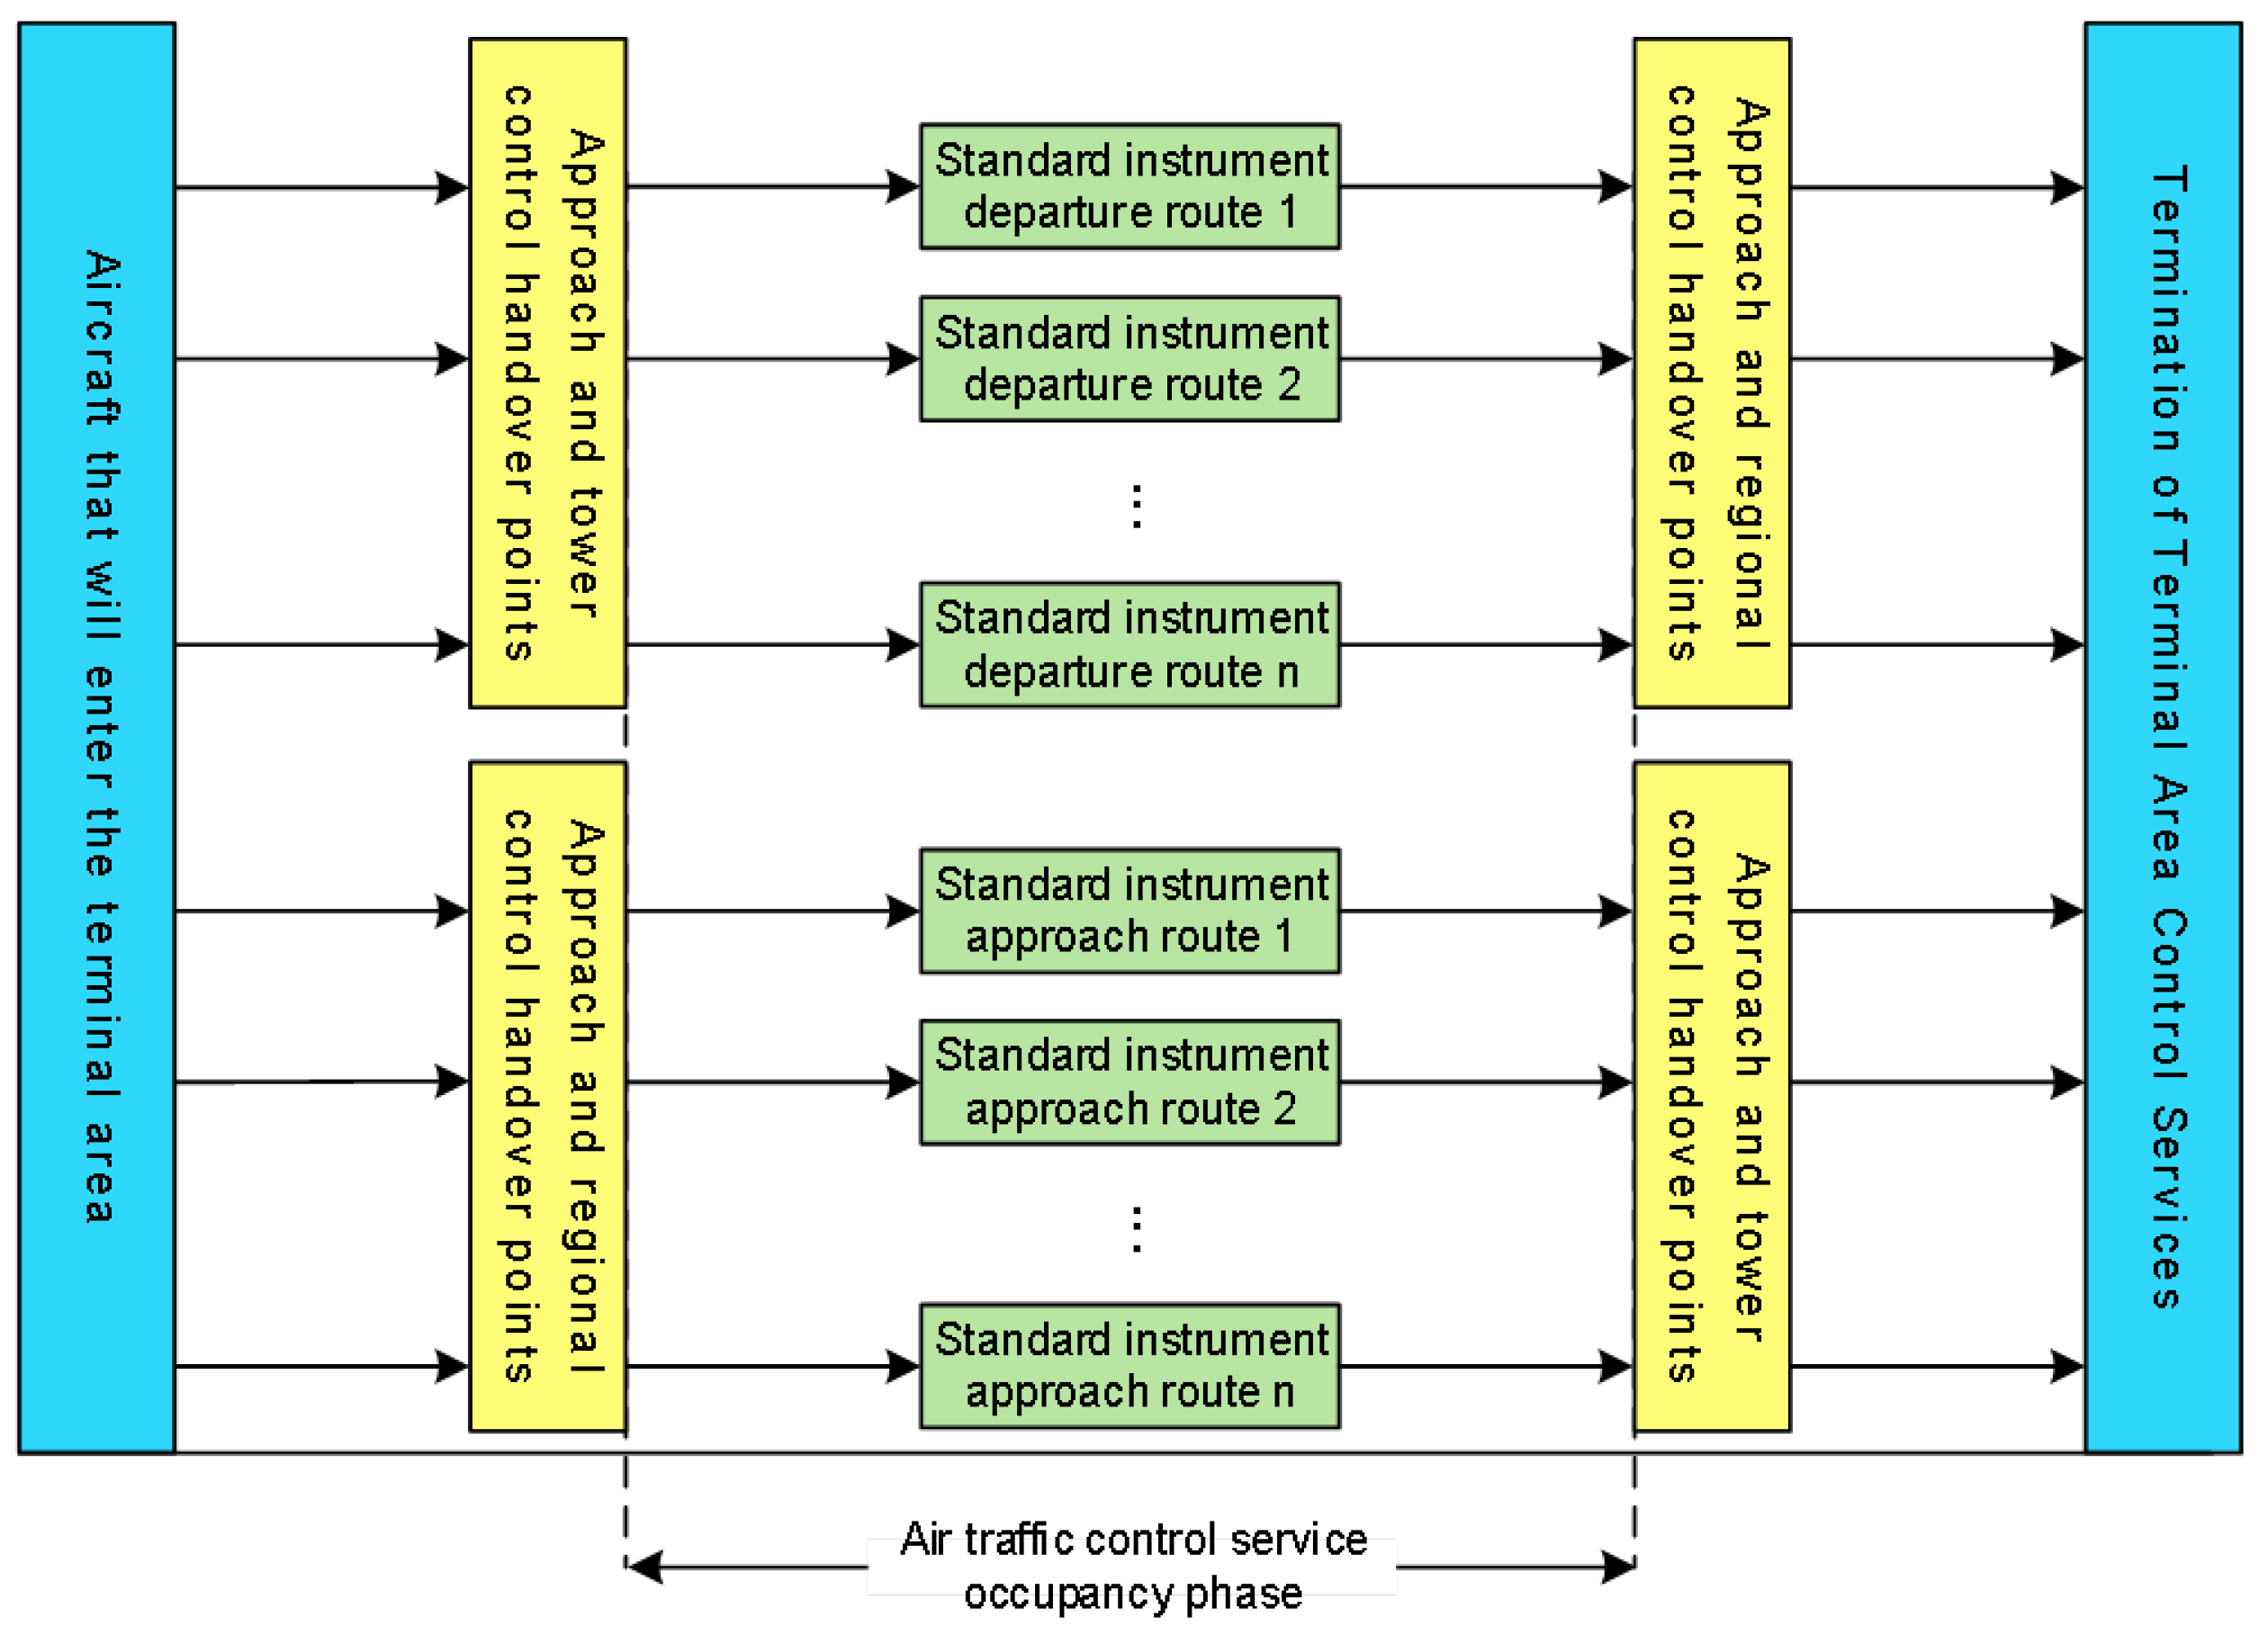
Figure 1. Schematic diagram of the air traffic service process in the terminal area.
Aerospace 10 00894 g001
Figure 2. Schematic diagram of the terminal area structure at Hulunbuir Hailar Airport (ZBLA).
Aerospace 10 00894 g002
Figure 3. Line chart of the capacity computation results for the terminal area at ZBLA airport.
Aerospace 10 00894 g003
Figure 4. Flowchart of the random aircraft flow generation procedure.
Aerospace 10 00894 g004
Figure 5. Flowchart of capacity assessment for numerical simulation.
Aerospace 10 00894 g005
Figure 6. Computational iteration results versus iteration number based on the Monte Carlo method.
Aerospace 10 00894 g006
Figure 7. Histogram of simulation results.
Aerospace 10 00894 g007
Figure 8. The relationship between maximum number of aircraft that can be safely handled and airport terminal capacity.
Aerospace 10 00894 g008
Table 1. Distribution of aircraft types under different approach and departure procedures and corresponding flight times at Hulunbuir Hailar Airport (ZBLA).
LegendExplanation
Flight missionThe purpose of the flight (departure or approach)
ProcedureThe specific approach or departure procedure used, typically represented by a five-letter code known as a waypoint which is designated locations along an aircraft’s flight path, established according to the standards set by the ICAO
Aircraft TypeThe type of aircraft
Proportion (%)The percentage of aircraft for each procedure
Mean time (min)The average flight time for each aircraft type during the procedure
Flight MissionProcedureAircraft TypeProportion (%)Mean Time (min)
DepartureKAGAKA320, B73853%6.5
E190, CRJ, RRJ30%8
ATR, Y1217%7
ELPUNA320, B73885%11.2
E190, CRJ, RRJ15%14.4
ATR, Y120%20.2
TEPODA320, B73884%9
E190, CRJ, RRJ16%11.5
ATR, Y120%16.2
ApproachKAGAKA320, B73853%12.3
E190, CRJ, RRJ30%15.8
ATR, Y1217%22.2
ELPUNA320, B73885%7.8
E190, CRJ, RRJ15%10.1
ATR, Y120%14.2
TEPODA320, B73884%6
E190, CRJ, RRJ16%7.7
ATR, Y120%10.8
Table 2. Results of capacity assessment.
Assessment ModelsUltimate Capacity (fph)Corrected Capacity (fph)
Mathematical modeling24.23016.961
Numerical simulation23.93916.757
ATC simulator experiment-17
Disclaimer/Publisher’s Note: The statements, opinions and data contained in all publications are solely those of the individual author(s) and contributor(s) and not of MDPI and/or the editor(s). MDPI and/or the editor(s) disclaim responsibility for any injury to people or property resulting from any ideas, methods, instructions or products referred to in the content.