Abstract
DPS (distributed propulsion system) utilizing BLI (boundary-layer ingestion) has shown great potential for reducing the power consumption of sustainable AAM (advanced air mobility), such as BWB (blended-wing body) aircraft. However, the ingesting boundary layer makes it easier for flow separation to occur within the S-shaped duct, and the consequent distortion due to flow separation can dramatically reduce the aerodynamic performance of the fan, which offsets the power-saving benefit of BLI. By analyzing the source of power saving and power loss of BLI, this paper presents the LDPS (layered distributed propulsion system) concept, in which the freestream flow and boundary-layer flow are ingested separately to improve the power-saving benefit of BLI. In order to preliminarily verify the feasibility of LDPS, an existing DPS is modified. The design parameters and the system performances of LDPS are studied using a 1D engine model. The results show that there is an optimal ratio of the FPR (fan pressure ratio) for the FSE (freestream engine) to the BLE (boundary-layer engine) that maximizes the PSC (power-saving coefficient) of LDPS. This optimal ratio of FPR for the two fans can be obtained when the exit velocities of FSE and BLE are the same. Under the optimal ratio of FPR for the two fans, the PSC of LDPS is improved by 5.83% compared to conventional DPS.
1. Introduction
Energy issues and environmental problems have received extensive attention worldwide in recent years. As one of the main contributors to environmental change and fossil energy consumption, the aviation sector is gradually starting to focus on sustainable development. Among many sustainable solutions, BLI (boundary-layer ingestion) is one of the technologies with great potential. The idea of BLI has long been known in the field of marine propulsion, that using the wake of the craft as part of the propulsive stream can bring power-saving benefits []. In recent years, this concept has been applied to aircraft propulsion, and many new aircraft concepts with a BLI propulsion system have been developed, such as SAX-40, CENTRELINE, STARC-ABL, D8, N3-X TeDP, etc. [,,,,]. Among them, the representative BWB (blended-wing body) aircraft with DPS (distributed propulsion system) utilizing BLI provides a unique perspective for the next-generation large AAM (advanced air mobility), with great potential for reducing power consumption, noise, and emissions [,]. To realize these benefits, BLI is an essential technology for such propulsion airframe integration. The benefit of BLI comes from lower inlet velocity, which enables the propulsion system to generate the same thrust with less power compared to the conventional podded configuration [,].
However, the adverse effect of BLI on the aerodynamic performance of the propulsion system is more serious [,]. Different from the inlet distortion of the podded configuration under a specific flight state, such as at high angle-of-attack operations like takeoff or under crosswind, etc., the inlet distortion caused by BLI continuously affects the aerodynamic performance of the propulsion system through the whole flight envelope []. For the S-shaped duct, ingesting low momentum boundary-layer flow causes flow separation due to aggressive S-shaped curvature, thus introducing additional loss to inlet-pressure recovery and increasing flow distortion at the AIP (aerodynamic interface plane) []. This flow distortion at AIP changes the inlet conditions of the fan, which alters the amount of flow turning and blade loading, leading to a reduction in efficiency and stability [,]. Failure to overcome these issues will lead to a critical system performance decrease, thus offsetting the power-saving benefit of BLI.
In recent years, several studies have emphasized the importance of the components’ performance penalties when evaluating the power-saving benefit of BLI. Plas et al. [] evaluated that the fuel-burn benefit of BLI is between 3% and 4% when 16% of the upper-fuselage boundary layer is ingested. However, when a 2% fan efficiency penalty and a 2% duct total pressure loss are considered, the DPS of SAX-40 with BLI is no better than a podded configuration of the same FPR (fan pressure ratio). Geiselhart et al. [] estimated a net 5.5% reduction in BWB aircraft fuel burn using BLI propulsion. Considering the effect of AIP distortion on engine performance, active flow control was introduced to improve the duct performance. However, the system benefit assessment did not account for the additional consumptions resulting from introducing flow-control devices, such as weight gain and energy consumption. Kawai et al. [] conducted a more detailed study using CFD (computational fluid dynamics) simulations of the entire aircraft. Consistent with the previous study [], the performance benefit provided by BLI was found to be significantly offset by the reduced duct pressure recovery and fan efficiency. Rodriguez [] optimized an N + 2 class BWB aircraft with DPS using an automated optimization-based design, and the BLI propulsion was found not to provide a fuel-burn benefit relative to podded baseline engines due to performance degradation of duct and fan caused by BLI. Hardin et al. [] conducted a high-level trade-factor-based study on a distortion-tolerant propulsion system for SAX-40. It was found that a 3–5% fuel-burn benefit can be achieved with embedded configuration if the reduction in fan efficiency is less than 2% relative to a clean-inflow baseline. These studies have shown that the power-saving benefit of DPS with BLI is very sensitive to the component performance penalties. Significant performance debits to the propulsion system due to BLI must be mitigated to maximize the power-saving benefit.
In order to resolve the components’ performance degradation due to BLI to improve the power-saving benefit, researchers have carried out a large number of studies on the design and optimization methods of S-shaped ducts [,,], flow-control devices within S-shaped ducts [,], the response of fan stage to distortion [,], and the design of a distortion-tolerant fan [,]. These previous works have had varying degrees of success, but all focused on the component level to mitigate the adverse effect of BLI on component performance. However, a system-level approach promises to address the root causes of this problem. Therefore, this paper presents the LDPS (layered distributed propulsion system) concept to improve the power-saving benefit of BLI from the system level by analyzing the source of power saving and power loss of BLI, and the purpose of this paper is to verify the feasibility of this new configuration preliminarily.
This paper is organized as follows: The concept of LDPS is proposed by analyzing the source of power saving and power loss of BLI in Section 2. Next, in Section 3, the studied case and modeling methods are introduced. Then, in Section 4, the design parameters as well as the system performance of LDPS are analyzed, and the reasons for improving the power-saving benefit are also discussed in detail. In the end, the concluding remarks are summarized in Section 5.
2. Concept Descriptions of LDPS
This section introduces the concept of LDPS. First, the physical principle of the power-saving benefit of BLI is reviewed. Next, based on this principle, the source of power saving of conventional BLI propulsion systems is discussed. Then, the source of power loss that offsets the power-saving benefit of BLI is discussed based on the mechanical energy equation. Finally, the concept of LDPS to improve the power-saving benefit of BLI is proposed.
For a conventional BLI propulsion system, a portion of the fuselage boundary layer enters the engine. The average inlet velocity is thus lower than the freestream velocity that the engine would ingest without BLI, and the physical principle of the power-saving benefit of BLI can be described based on this feature. Figure 1 shows the physical principle of the power-saving benefit of BLI. In Figure 1, the ranges on the horizontal and vertical axes represent momentum and energy changes of flow passing through the engine, respectively. The red strip corresponds to the podded engine without BLI, and the blue strip corresponds to the embedded engine with BLI. For the podded engine without BLI, the inlet velocity is freestream. It can be clearly seen that, for a given mass flow, the thrust required to propel the aircraft scales as the inlet velocity increases, while the mechanical power scales as the inlet velocity increases squared. Therefore, for a specific thrust requirement, when the strip moves along the horizontal axis in the direction of lower inlet velocity, the corresponding power consumption decreases. This reveals that the physical principle of the power-saving benefit of BLI is that less mechanical power is required for a given thrust requirement if the inlet velocity is lowered by BLI.
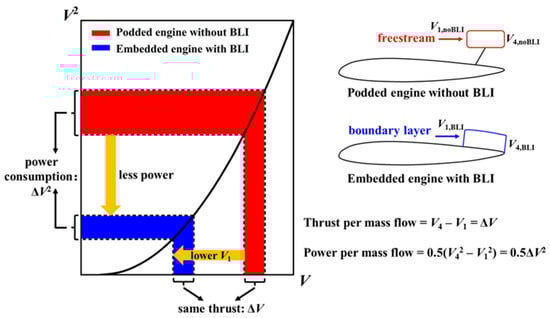
Figure 1.
Physical principle of power-saving benefit of BLI (the ranges on the horizontal and vertical axes represent momentum and energy changes of flow passing through the engine, respectively).
The above arguments capture the physical principle of BLI, and it is further used to investigate an ideal embedded engine with BLI, see Figure 2. Different from simplifying the inlet velocity to an appropriate average value, in the present analysis, the freestream and boundary layer through the embedded engine are artificially divided into two stream tubes to more clearly see the source of power saving of BLI.
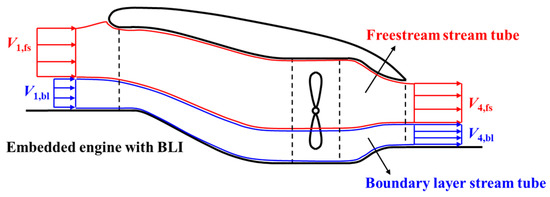
Figure 2.
Schematic showing of flow passing through an ideal embedded engine with BLI (the freestream and boundary layer are divided into two stream tubes).
The freestream entering the engine has an inlet velocity , which is assumed to be the same as the flight speed of the aircraft. The boundary layer entering the engine has an assumed average inlet velocity , which is lower than the freestream velocity. The engine accelerates the flow in the two stream tubes to the exit velocity and , which are assumed to be the same. Assuming that the flow in these two stream tubes is fully expanded at the exit, then the propulsion efficiency (the ratio of propulsion power to mechanical power) of these two stream tubes is given as:
where and are the propulsion efficiency of the freestream and boundary layer, respectively. and are the thrust generated by the freestream and boundary layer, respectively. and are the mechanical power added to the freestream and boundary layer, respectively.
Since and , a comparison of Equations (1) and (2) shows that the propulsion efficiency of the boundary-layer stream tube is greater than that of the freestream stream tube . In addition, if a podded engine ingests the same mass flow contained in the freestream stream tube depicted in Figure 2 and produces the same thrust , it will have the same propulsion efficiency of . This shows that the power-saving benefit of BLI of an embedded engine only comes from the low velocity of the boundary layer and has nothing to do with the freestream entering the engine.
In practice, the distortion due to BLI will cause internal flow loss in the S-shaped duct and fan, leading to additional lost power. Therefore, the critical metric to determine the power-saving benefit of BLI should be the fan-shaft power that includes internal flow loss rather than the mechanical power. The generalized Bernoulli equation given in Equation (3) establishes the relation between mechanical power, lost power, and fan-shaft power (the pressure potential energy term is not given in Equation (3) on the assumption that the flow is fully expanded at the exit of the two stream tubes). On the one hand, the flow separation in the S-shaped duct caused by BLI will not only introduce loss in the boundary-layer stream tube but also reduce the quality of the freestream. On the other hand, the highly distorted flow entering the fan will cause additional lost power, both in the freestream and boundary-layer stream tube due to flow mixing. Therefore, for an embedded engine with BLI, ingesting freestream will not only bring any power-saving benefit but will cause the fan to add more power to the freestream flow due to distortion (see the lost power term of the freestream stream tube in Equation (3)). However, the freestream still needs to be ingested because the mass flow of the boundary layer is often insufficient to produce the required thrust.
where and are the mass flow rate of the freestream and boundary layer, respectively. and are the lost power of the freestream and boundary-layer stream tubes due to distortion, respectively. is fan-shaft power considering internal flow loss.
The lost power term and can be further expressed as the product of the mass flow rate and lost work, and the lost work is apparently a function of components performance. To better illustrate the effect of BLI on component performance, we use the uniform inlet condition as a reference. Figure 3 is a schematic showing the performance penalty of the S-shaped duct and fan under uniform and BLI inlet conditions. For the uniform inlet condition, the total pressure recovery of the S-shaped duct describes the loss due to the wall boundary layer. In this case, the fan is assumed to operate at the highest efficiency point, which is (black point in Figure 3). These performance parameters of the S-shaped duct and fan are used as the reference values for calculating the performance penalty due to BLI, i.e., deltas in total pressure recovery and fan adiabatic efficiency. For the BLI inlet condition, the total pressure recovery of the freestream stream tube is less than because the freestream is mixed with the separated boundary layer. Meanwhile, the total pressure recovery of the boundary-layer stream tube is also less than due to flow separation loss. Therefore, the total pressure-recovery penalty of different stream tubes and is defined as the difference between the total pressure recovery under uniform and BLI inlet conditions. In addition, the efficiency characteristic line of the fan under the BLI inlet condition will be shifted downward compared to the uniform inlet condition. In this case, the equivalent operation points of the different stream tubes (undistorted region for freestream stream tube: red point in Figure 3, distorted region for boundary-layer stream tube: blue point in Figure 3) can be determined according to the parallel compressor theory, and the equivalent operating point of the boundary -layer stream tube is closer to the small mass flow direction. Therefore, the fan adiabatic efficiency penalty of different stream tubes and are defined as the difference between the fan adiabatic efficiency under uniform and BLI inlet conditions. Therefore, the lost power can be expressed as:
where and are the lost work of the freestream and boundary-layer stream tubes, respectively. is the total pressure recovery of the S-shaped duct under uniform inlet conditions. is the adiabatic efficiency of the fan under uniform inlet conditions. and are the total pressure-recovery penalty of the freestream and boundary-layer stream tubes in the S-shaped duct, respectively. and are the adiabatic efficiency penalty of the freestream and boundary-layer stream tubes in the fan, respectively.
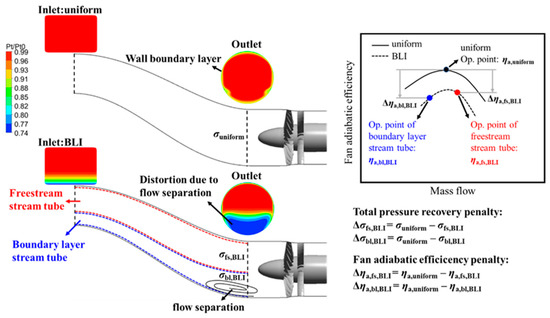
Figure 3.
Schematic showing of the performance penalty of the S shaped and fan under uniform and BLI inlet conditions.
Based on the above arguments, the power-saving benefit of BLI only comes from boundary-layer flow with low velocity, and the power loss is caused by distortion due to the mixing of the freestream and boundary layer. Therefore, the keys to improving the power-saving benefit of BLI are, first, to ensure that the freestream quality is not affected by the boundary layer, i.e., the flow loss occurs only in the boundary-layer stream tube and, second, to rationally organize the boundary-layer flow to generate thrust with minimal internal flow loss. Assuming that both of the above two parts can be satisfied, then the corresponding lost power is:
Since there is no internal flow loss due to mixing with the separated boundary layer in the freestream stream tube, a comparison of Equations (4) and (5) shows that . Therefore, the way to improve the power-saving benefit of BLI is to modify the configuration of the conventional DPS to ingest the freestream and boundary-layer separately, and this new configuration is called the LDPS (see Figure 4). The LDPS consists of an upper and lower row of propulsion systems arranged along the spanwise direction. The BLEs (boundary-layer engine) near the fuselage ingest the boundary layer, and the FSEs (freestream engine) above ingest the freestream. The layered duct is divided into FSD (freestream duct) and BLD (boundary-layer duct) by the inner lip. The FSD and BLD deliver the freestream and boundary layer to the FSF (freestream fan) and BLF (boundary-layer fan). After being pressurized by the FSF and BLF, the freestream and boundary layer are mixed in the nozzle and discharged. In LDPS, the power-saving benefit of BLI can be maximized by rationally organizing the boundary layer within the BLE. Meanwhile, the quality of the freestream is not affected by the distorted boundary layer, which can supplement the thrust. To summarize, the concept of LDPS is to maximize the aerodynamic potential of incoming flow according to its different characteristics.
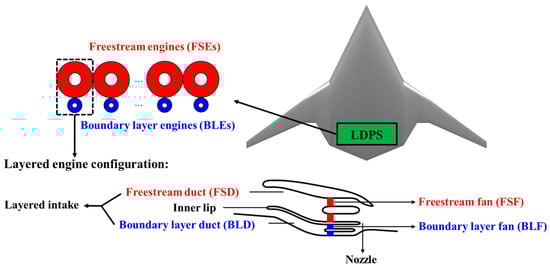
Figure 4.
Concept and configuration of LDPS.
The above arguments discuss the potential aerodynamic benefits that LDPS may bring. Also, the concept of LDPS raises a number of new issues, some of which are listed below.
- Possible increased weight from two fan arrays of LDPS;
- Possible increased drag due to a larger wetted area needed for the nacelle;
- Design of the layered intake to split the freestream and boundary layer;
- Design of the BLF since it is only ingesting the boundary layer;
- Coupling effect between FSE and BLE, especially at off-design conditions;
- Design of the control laws of FSF and BLF to match the incoming flow conditions.
In addition to the issues on the aerodynamic aspects mentioned above, the concept of LDPS may also bring some issues on the practical aspects, such as how to connect the two fan arrays to a single generator, how to arrange the interior space of the cabin for the LDPS, etc. Any of the above issues could have an impact on the potential system-level benefits of the LDPS. However, since the focus of this paper is to preliminarily verify the feasibility of LDPS, other aspects will not be discussed in this paper but will be examined in detail in future work.
3. Studied Case and Modeling Methods
The BWB-350 is selected as the studied case to verify the feasibility of LDPS. The BWB-350 aircraft is designed to carry 350 passengers with a cruise altitude of 11,000 m at Ma∞ 0.85. These mission requirements yield the following thrust requirements listed in Table 1. The embedded engines are designed at the aerodynamic design point with a minimum thrust requirement of 112.78 kN.

Table 1.
BWB-350 thrust requirements.
3.1. Modeling Methods
The DPS of BWB-350 consists of nine distributed embedded engines placed in a continuous array across the upper rear surface of the fuselage. The chord position X/C of the propulsion system is 0.724, while the maximum span-wise distance available is 17.64 m. This span is always filled by the embedded engines to ingest the fuselage boundary layer as much as possible. For the modeling of LDPS, the above design parameters remain the same (see Figure 5).
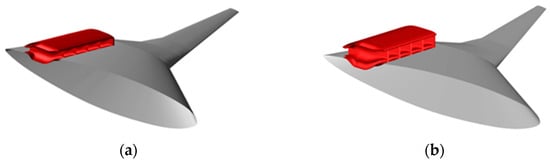
Figure 5.
BWB-350 with different propulsion system configurations. (a) BWB-350 with DPS. (b) BWB-350 with LDPS.
The engine design parameters at ADP are yielded from the aircraft mission requirements. For one embedded engine of DPS of BWB-350, the mass flow is 180.2 kg/s. The design FPR is 1.27, with the fan adiabatic efficiency of 0.93. The thrust provided by one embedded engine is 12.53 kN under these engine design parameters. These parameters are used as inputs for the design of one layered embedded engine of LDPS of BWB-350.
For the conceptual design of LDPS, the total mass flow and thrust requirement of LDPS are the same as that of DPS. Since the LDPS is now divided into two parts, the aerodynamic parameters of the freestream and boundary layer are needed to determine the inlet conditions for FSE and BLE, respectively. To obtain these parameters, numerical simulations were conducted using the commercial software FLUENT 18.0. The flow field of BWB-350 with DPS at cruise (flight height of 11,000 m, Ma∞ = 0.85, angle of attack of 2°) was calculated by solving steady RANS equations with the k–ω SST turbulent model, where the fan was modeled using the streamwise body-force model. The input to the body-force model is a fan performance map at different rotating speeds. During the simulation procedure, different force and energy source terms are then added to the momentum and energy equations by searching the fan performance map, which ultimately ensures that the net streamwise force is zero. The details of the streamwise body-force model can be found in references [,]. Figure 6 shows the Ma contour on the symmetry plane of BWB-350 with DPS at cruise. The inlet of DPS of BWB-350 is the station where the aerodynamic parameters of the freestream and boundary layer are extracted (corresponding to the solid red line), and the yielded mass-average values are listed in Table 2, normalized by the freestream value. These parameters are further used as inputs for the modeling of LDPS.
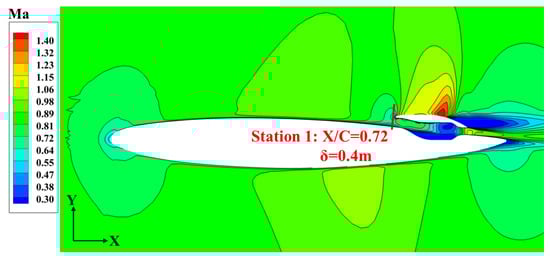
Figure 6.
Ma contour on symmetry plane of BWB-350 with DPS at cruise (flight height of 11,000 m, Ma∞ = 0.85, angle of attack of 2°).
Table 2.
Inlet conditions of DPS and LDPS.
After determining the inlet conditions, the fan design parameters are required to construct the engine model of LDPS. The technology trend curve of fan design adiabatic efficiency as a function of design FPR is developed by ASDL (Aerospace System Design Laboratory) []. This trend curve reflects the fan design level from 2015 to 2025. As can be seen from the dashed black line in Figure 7, the design adiabatic efficiency of the fan varies approximately linearly with the design FPR. The current design FPR of the BWB-350 fan is 1.27, which corresponds to a design efficiency of 0.93, whereas the design efficiency corresponding to a design FPR of 1.27 would be 0.9546 according to the trend curve by ASDL. Therefore, the trend curve is shifted downward by 0.0246 to ensure that the LDPS fans are at the same design level as the BWB-350 fan. Also, this treatment can ensure that the benefit of the LDPS is not due to a higher level of fan design. Based on the above arguments, the trend curve used in the present study is the solid red line in Figure 7.
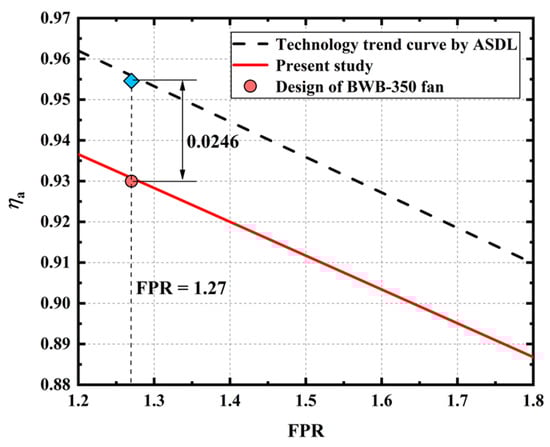
Figure 7.
Fan design adiabatic efficiency as a function of design FPR by ASDL [].
The performance of the S-shaped duct and nozzle are estimated using total pressure loss since there is no work input and heat exchange in these components. However, the S-shaped duct for the embedded engine will suffer a loss in total pressure recovery due to flow separation resulting from ingesting the boundary layer. Consequently, the downstream fan will also suffer a loss in efficiency due to flow distortion resulting from the upstream S-shaped duct. According to the summary by Berrier et al., inlets for podded nacelles and S-shaped ducts under uniform inlet conditions at subsonic cruise have high pressure-recovery values since pressure-recovery losses incurred for these inlets are dominated by friction drag. It is not unusual to assume perfect pressure recovery (σ = 1) during conceptual design for these inlets []. So, for the purpose of this study, the total pressure-recovery penalties for the S-shaped duct of FSE and the inlet of the referenced podded engine are initially set as 0.3% considering the boundary layer developed on the duct wall. As for the performance of the S-shaped duct in the presence of BLI, Berrier et al. estimated that the total pressure recovery of the S-shaped duct will decrease by at least 2% compared to the uniform inlet condition []. However, this estimation is only indicative, since the total pressure recovery of the S-shaped duct is closely related to the specific boundary layer inlet condition and the duct design. Therefore, the total pressure-recovery penalties for the S-shaped duct of DPS and BLE are initially set as 2%. For the performance of the fan under distortion, the published literature gives different estimations of the fan efficiency penalty in the presence of BLI, with more optimistic values of about 1–2% [,]. These estimations are closely related to the methodology used, the degree of distortion at AIP, and the fan design. So, for the purpose of this study, the fan efficiency penalties of DPS and BLE are initially set as 2%. In addition, the fan efficiency penalties of FSE and the referenced podded engine are removed since the inlet conditions are assumed to be uniform. As for the losses in the nozzle, the total pressure penalty is initially set as 0.1% in all cases since the flow undergoes a positive pressure gradient within the nozzle. It should be noted that these parameters are fixed only for the initial comparison of DPS and LDPS. The sensitivity analysis is also conducted by comparing the performance of DPS and LDPS with different combinations of performance penalties.
For a propulsor consisting of an S-shaped duct, a fan, and a nozzle, there exists a unique FPR of the fan that satisfies a given thrust requirement when the inlet conditions and components’ performance are determined. For the LDPS, the above arguments imply that there are a series of different combinations of the FPR of FSF and BLF that satisfy a given thrust requirement since the thrust generated by FSE and BLE can be different. Therefore, the purpose of the thrust matching procedure of LDPS is to find these different FPR combinations. Figure 8 shows the 1D engine model and the thrust matching procedure of LDPS (the left side is the FSE model and the right side is the BLE model). The 1D engine model is coded using MATLAB R2021a. The input freestream/boundary-layer inlet conditions are listed in Table 2. These parameters are first used to calculate velocity, flow area, and static pressure at the engine inlet. The performance of the S-shaped intake is divided into two parts, namely the external performance corresponding to the ram drag and the internal performance corresponding to the total pressure-recovery penalty. The total parameters at the fan entrance (station 2) are then calculated through the total parameters at station 1 and the total pressure-recovery penalty of the S-shaped duct. The iteration loop begins with setting the initial FPR value. This initial value can be chosen arbitrarily. However, the closer this value is to the convergent solution, the better the robustness of the whole loop is. After setting this initial FPR value, the fan design adiabatic efficiency is then looked up based on the trend curve in Figure 7 (the f(FPR) term in the fan design parameters and performance box). This design value minus the considered fan efficiency penalty is the final fan efficiency. The total parameters at the nozzle entrance (station 3) are then calculated through the total parameters at station 2 and the fan design parameters. The performance of the nozzle is also divided into two parts, namely the internal performance corresponding to the total pressure penalty and the external performance corresponding to the gross thrust. The state of the nozzle is determined by comparing the total pressure at station 4 with the maximum total pressure at the current ambient pressure (or by comparing the actual pressure-drop ratio with the critical pressure-drop ratio). The velocity, flow area, and static pressure at station 4 are then calculated according to different nozzle states. These parameters are used to calculate the gross thrust of the nozzle. The net thrust of the engine is defined as the gross thrust minus the ram drag, and the fan-shaft power is calculated using mass flow and total temperature at the entrance and exit of the fan. Finally, the relative error between the sum of the thrusts generated by FSE and BLE and the target thrust (12.53 kN) is checked. If this value is below 1%, then output the performance of LDPS; if not, then change the FPRs of FSF and BLF.
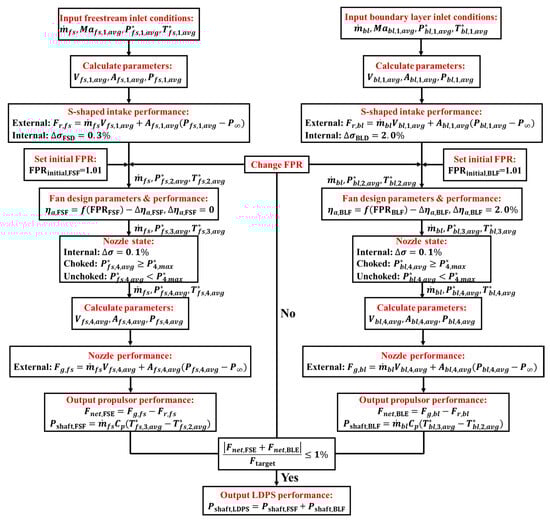
Figure 8.
The 1D engine model and the thrust matching procedure of LDPS (the left side is the FSE model and the right side is the BLE model).
3.2. Performance Metrics
The perspective adopted here is that the metrics to compare configurations should capture the features of BLI benefit, including the power-saving benefit due to lower inlet velocity and the additional power consumption due to internal flow loss. Therefore, the parameter used in the present study is the power-saving coefficient (PSC) proposed by Smith []. The definition of PSC is given as:
where and denote the fan-shaft power needed to propel the aircraft for the reference engine and with BLI, respectively. The basis for selecting the reference engine in this paper is to replace the inlet conditions of the embedded engine with the freestream conditions while keeping the same mass flow rate and thrust requirement.
In order to compare the performances of engines that produce different thrusts, the thrust-to-power ratio (TPR), which is defined as the ratio of thrust to fan-shaft power, is selected as another performance metric. The traditional parameter that describes this performance is propulsion efficiency. However, the value of propulsion efficiency may be greater than one and, thus, is ill-defined in the presence of BLI. The TPR is given as:
In order to capture the additional power loss of different components, the lost power, defined as the product of the mass flow rate and enthalpy change for an irreversible process, is selected as another performance metric []. The lost power is given as:
where the subscript i denotes the irreversible process in a certain component (typically the S-shaped duct or fan in an embedded engine). is the total enthalpy change of the irreversible process, and Equation (9) gives a good approximation for calculating the enthalpy change []:
where the subscript n denotes the start of the irreversible process. is the total temperature at the start of the irreversible process. is the total entropy increase of the irreversible process, which can be calculated by Equation (10) []:
where the subscript n + 1 denotes the end of the irreversible process. is the total temperature at the end of the irreversible process. and are the total pressure at the start and the end of the irreversible process. is the specific heat capacity at constant pressure, and is the ideal gas constant. For the S-shaped duct, the total temperature ratio is equal to one since there is no work or heat change, and the total pressure ratio is exactly the total pressure recovery of the S-shaped duct. For the fan, the total temperature ratio is related to the FPR and adiabatic efficiency, and the total pressure ratio is exactly the FPR. Therefore, the total entropy increase in the S-shaped duct and fan are given as:
where is the adiabatic index. is the total pressure recovery of the S-shaped duct. and are the FPR and adiabatic efficiency, respectively.
Finally, the lost power caused by the component performance penalty due to BLI can be described quantitatively using Equations (8)–(12).
4. Results
4.1. Design-Parameters Analysis
Figure 9 shows the PSC of LDPS as a function of the ratio of FPR for two fans, where the ratio of FPR for two fans denotes the ratio of the FPR of FSF to the FPR of BLF. The PSC of DPS is also displayed with a green dashed line. As the ratio of FPR for two fans increases, the PSC of LDPS first increases and then decreases. When the ratio of FPR for two fans is 0.92, the PSC reaches the maximum value, and the improvement in PSC is 5.83% compared to DPS. This trend is because, under the given mass flow and thrust requirements, the increase of the FPR of FSF leads to the decrease of the FPR of BLF. Therefore, as the ratio of FPR for two fans increases, the shaft power of FSF increases. In contrast, the shaft power of BLF decreases (see Figure 10), resulting in an optimal ratio of FPR for two fans of LDPS. In addition, the FPR of FSF is lower than DPS, and the FPR of BLF is higher than DPS under this optimal ratio (, , and ). This indicates that, in order to maximize the power-saving benefit of an embedded configuration, the fan should add more energy to the boundary layer than to the freestream.
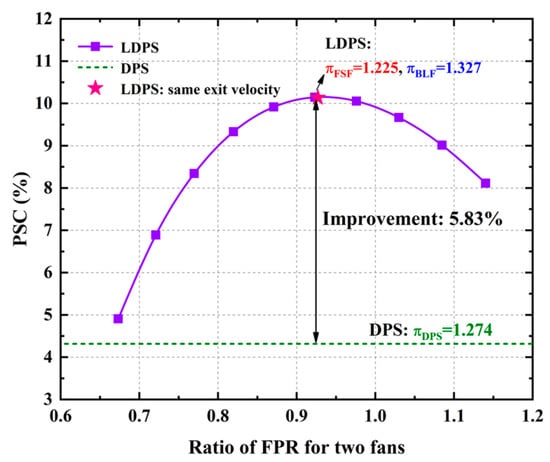
Figure 9.
The PSC of LDPS as a function of the ratio of FPR for two fans (the PSC of DPS is displayed in green dashed line).
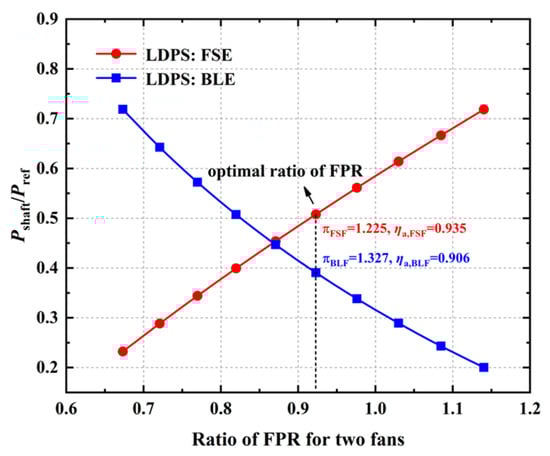
Figure 10.
Normalized fan-shaft power of FSE and BLE as a function of the ratio of FPR for two fans.
For LDPS, the different inlet conditions and FPRs of FSE and BLE result in different exit velocities. An excessive gradient in FSE and BLE exit velocity will bring additional wake mixing loss. Therefore, in addition to ensuring that the ratio of FPR for two fans of LDPS can reach the maximum PSC, the exit velocity of FSE and BLE should also be considered. Figure 11 shows the normalized inlet and exit velocities of FSE and BLE at each ratio of FPR for two fans. As the ratio of FPR for two fans increases, the exit velocity of FSE increases while the exit velocity of BLE decreases. In addition, the position where the slope of increasing exit velocity of FSE decreases means that the nozzle is choked. At this point, the slope of decreasing exit velocity of BLE increases consequently to meet the thrust requirement. It is worth noting that the exit velocity of FSE is almost the same as that of BLE under the optimal ratio of FPR for two fans. Whether it is a coincidence that the two engines have the same exit velocity under this optimal ratio of FPR for two fans can be further investigated by analyzing an ideal LDPS.
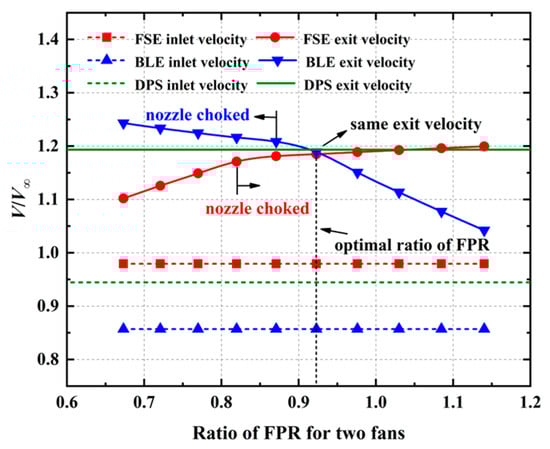
Figure 11.
Normalized inlet and exit velocities of FSE and BLE as a function of the ratio of FPR for two fans.
Figure 12 displays the schematic showing an ideal LDPS with different exit velocities (Figure 12a) and the same exit velocities (Figure 12b). The “ideal” means no internal flow loss in FSE and BLE. Thus, the fan-shaft power is all used to increase the mechanical power of the flow through the engine. When the nozzles are unchoked, the thrust and mechanical power of FSE and BLE for these two cases are given as:
where and are the inlet velocity of the freestream and boundary layer, respectively. and are the different exit velocities of the freestream and boundary layer, respectively. is the same exit velocity of the freestream and boundary layer. and are the mass flow rates of the freestream and boundary layer, respectively. and are the thrust and mechanical power when the exit velocity of the freestream and boundary layer are different. and are the thrust and mechanical power when the exit velocity of the freestream and boundary layer are the same.
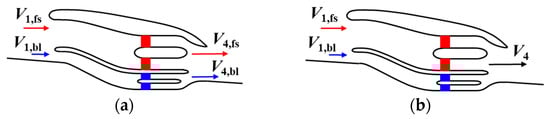
Figure 12.
Schematic showing of ideal LDPS with different and same exit velocity. (a) different exit velocity. (b) same exit velocity.
For these two cases, the thrust requirement is the same. Therefore, letting Equations (13) and (15) be equal gives:
Since and are all non-negative, the above equation indicates that the value of exit velocity is between and . In order to obtain the condition of minimum mechanical power consumption, rewriting Equation (14) gives:
where is the excess mechanical power. Substituting Equation (17) into Equation (19) gives:
Since the value of the exit velocity is between and . Equation (18) shows that is always non-negative. Therefore, in order to achieve the minimum mechanical power consumption, must be equal to zero, which gives:
The above derivations prove that the mechanical power consumption of an ideal LDPS is minimal when the exit velocities of FSE and BLE are the same. Although additional power loss due to flow distortion must be considered for an actual LDPS, most of the fan-shaft power is used to increase the mechanical power of the flow. Therefore, the minimum mechanical power consumption directly corresponds to the minimum fan-shaft power. This can be confirmed by recalculating the design parameters of LDPS by constraining the same exit velocity of FSE and BLE. The pink star in Figure 9 is the PSC of LDPS obtained with the same exit velocity as the constraint. It can be seen that the optimal point obtained with the same exit velocity is almost the same as the optimal point obtained by simply changing the ratio of FPR for two fans. This indicates that the same exit velocity of FSE and BLE can be used as the principle to determine the optimal ratio of FPR for two fans which maximizes the PSC of LDPS.
4.2. Propulsion-System Performance Analysis
As can be seen from Figure 9, the PSC of LDPS is 5.83% higher than that of DPS under the optimal ratio of FPR for two fans. This can be explained from two aspects, namely the power-saving benefit of low inlet velocity due to BLI and the offset of additional power loss due to flow distortion. Figure 13 shows the TPR of FSE and BLE of LDPS as a function of the ratio of FPR for two fans. The TPR of DPS is also displayed in the green dashed line. When the boundary-layer flow is ingested alone by BLE, the inlet velocity of BLE is lower than that of DPS, which can be seen from Figure 11, so the TPR of BLE is improved by 4.2% compared with DPS. However, the inlet velocity of FSE is higher than that of DPS, resulting in a 1.15% drop in TPR. This shows that the power-saving benefit comes entirely from ingesting the boundary-layer flow, and ingesting the freestream flow will not bring any power-saving benefit. Overall, the comprehensive TPR of LDPS is 1.24% higher than that of DPS, which indicates that ingesting the boundary-layer flow alone can improve the power-saving potential of BLI.
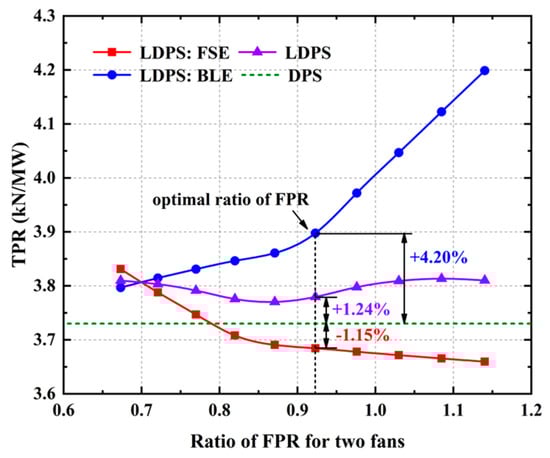
Figure 13.
The TPR of FSE and BLE of LDPS as a function of the ratio of FPR for two fans.
Figure 14 compares the PSC of LDPS and DPS under actual and ideal conditions, where the actual condition refers to the performance penalties of components due to BLI being considered and the ideal condition refers to the performance penalties of components being removed. It can be seen that the PSC of ideal LDPS is 1.16% higher than that of DPS, again proving that ingesting boundary-layer flow alone can provide more power-saving benefits. However, for both LDPS and DPS, additional power loss due to flow distortion offsets the power-saving benefit of BLI. In this study, these losses are considered as the total pressure-recovery penalty of the S-shaped duct and the efficiency penalty of the fan. As can be seen from Figure 14, the performance penalty of DPS offsets the 66.1% power-saving benefit of BLI, while the performance penalty of BLE of LDPS only offsets the 26.9% power-saving benefit of BLI. This difference between the ideal and actual PSC of LDPS and DPS can be explained by further disassembling the power loss of each component. Figure 15 compares the normalized lost power of each component for LDPS and DPS. It can be seen that, when the total pressure-recovery penalty ∆σ = 2% is considered in the S-shaped duct of DPS and BLE of LDPS, the normalized lost power of the S-shaped duct of DPS is 0.073, while the normalized lost power of the S-shaped duct of BLE is only 0.024, with a reduction of 67.1%. When the fan efficiency penalty ∆ηa = 2% is considered in DPS and BLE of LDPS, the normalized lost power of the fan of DPS is 0.083 (29.7% rise relative to uniform inlet condition of 0.064), while the normalized lost power of the fan of BLE is only 0.034, with a reduction of 59.0% relative to fan of DPS. Overall, the normalized lost power of all components of DPS is 0.153, while the normalized lost power of all components of LDPS is only 0.096, with a reduction of 37.3%. This shows that the power loss due to BLI can be effectively reduced when the distortion-induced degradation of component performance occurs only in the BLE since the lost power is not only dependent on the component performance parameters but also directly related to the mass flow rate of the engine.
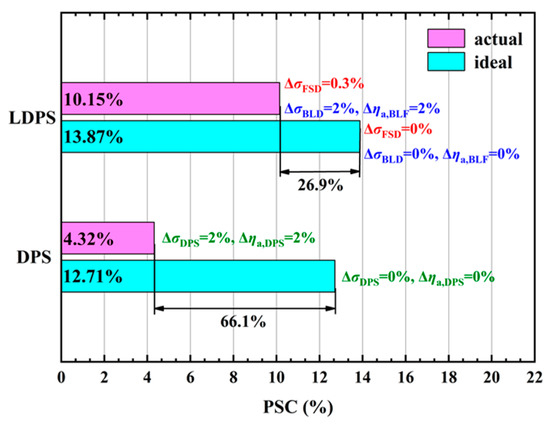
Figure 14.
Comparison of the PSC of LDPS and DPS under actual and ideal conditions.
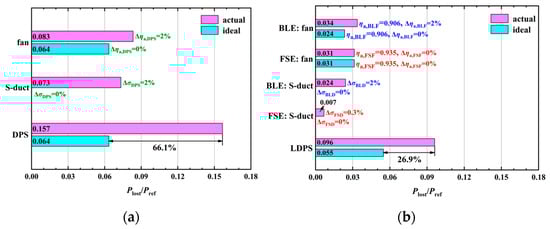
Figure 15.
Comparison of normalized lost power of each component of LDPS and DPS under actual and ideal conditions. (a) Normalized lost power of DPS. (b) Normalized lost power of LDPS.
The above discussions are only for fixed component performance penalties. In order to further investigate the sensitivity of the PSC of DPS and LDPS to the component performance penalties due to BLI, the effect of different component performance penalties on the PSC of DPS and LDPS is also studied. Figure 16 compares the PSC of DPS and LDPS with various component performance penalties. The slope of each line represents the PSC drop per Δηa, and the spacing between different lines represents the PSC drop per Δσ. It can be seen that each 1% total pressure-recovery penalty of the S-shaped duct of DPS results in a reduction in PSC of 3.5%. In comparison, each 1% total pressure-recovery penalty of the S-shaped duct of BLE only results in a reduction in PSC of 1.25%. Meanwhile, each 1% efficiency penalty of the fan of DPS results in a reduction in PSC of 0.86%, while each 1% efficiency penalty of the fan of BLE results in a reduction in PSC of 0.36%. In addition, it can be clearly seen that, if the total pressure-recovery penalty of the S-shaped duct and the efficiency penalty of the fan of DPS are both greater than 3%, the DPS is no better than the podded configuration. This shows that LDPS, which ingests the freestream and boundary-layer separately, can effectively reduce the sensitivity of PSC to component performance penalties due to BLI, thus improving the power-saving benefit.
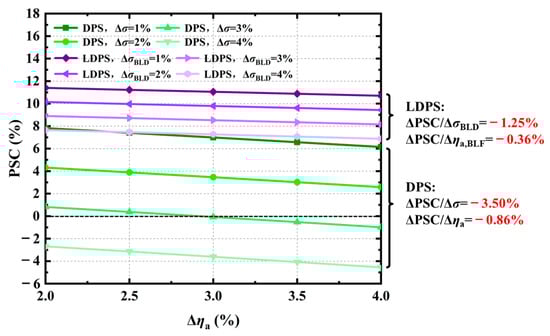
Figure 16.
Comparison of the PSC of LDPS and DPS with various component performance penalties.
5. Conclusions
This paper presents the concept of LDPS by analyzing the source of power saving and power loss of BLI to overcome the problem that the internal flow loss offsets the power-saving benefit of BLI of DPS due to the ingesting boundary layer, and the purpose of this paper is to verify the feasibility of this new configuration preliminarily. Therefore, an existing DPS of BWB-350 is modified, and the design parameters and the system performance of LDPS are studied using a 1D engine model. The concluding remarks are summarized as follows.
- (1)
- There is an optimal ratio of FPR for two fans that maximizes the PSC of LDPS. Under this optimal ratio of FPR, the FPR of BLE is higher than that of FSE, indicating that the fan should add more energy to the boundary layer than to the freestream to improve the power-saving benefit. In addition, the FSE and BLE have the same exit velocity under the optimal ratio of FPR. By analyzing the ideal LDPS, the required mechanical power to produce the same thrust is least when the FSE and the BLE of LDPS have the same exit velocity, and this minimum mechanical power also corresponds to the minimum fan-shaft power. Therefore, the same exit velocity of FSE and BLE can be used as the principle to determine the optimal ratio of FPR, which maximizes the PSC of LDPS;
- (2)
- Under the optimal ratio of FPR, the PSC of LDPS is improved by 5.83% compared to DPS when the same component performance penalties due to BLI are considered. On the one hand, the ingesting boundary-layer flow alone can further lower the inlet velocity of BLE and thus improve the PSC of LDPS by 1.3% compared to DPS. On the other hand, the additional power loss of LDPS, which offsets the power-saving benefit of BLI, is reduced by 39.2% compared to DPS, when the component performance penalties due to BLI occur only in BLE. In addition, when various component performance penalties are considered, the LDPS can effectively reduce the sensitivity of PSC to the component performance penalties due to BLI, thus improving the power-saving benefit of BLI.
This paper provides a preliminary verification of the potential aerodynamic benefits of LDPS. Future studies will use more accurate models to consider the impact of additional factors on the system-level benefits of LDPS, such as weight, drag, aero-propulsive coupling effect assessment, etc. In addition, efforts will be made on the internal flow features and the design of boundary-layer duct and boundary-layer fan, since they are now only ingesting the boundary-layer flow. In general, the authors expect that these studies can provide new perspectives for future applications of the BLI propulsion system.
Author Contributions
Conceptualization, Z.L., T.P. and Y.L.; methodology, validation, formal analysis and investigation, T.P. and Y.L.; resources, Z.L. and T.P.; data curation, Z.L. and Y.L.; writing—original draft preparation, Y.L.; writing—review and editing, Z.L. and T.P.; supervision and funding acquisition, Z.L. and T.P. All authors have read and agreed to the published version of the manuscript.
Funding
The authors acknowledge the support of the National Natural Science Foundation of China (Nos. 52176032 and 51976005), ScienceCenter for Gas Turbine Project (P2022-B-II-004-001), Advanced Jet Propulsion Creativity Center, AEAC (Project ID. HKCX2020-02-013), National Science and Technology Major Project (2017-II-0005-0018), the Foundation of National Key Laboratory of Science and Technology on Aero-Engine Aero-thermodynamics (WDZC2019601A202), the Fundamental Research Funds for the Central Universities, and the Beijing Nova Program.
Data Availability Statement
The data presented in this study are available on request from the corresponding author.
Conflicts of Interest
The authors declare no conflicts of interest.
Nomenclature
| Abbreviations | |
| AAM | Advanced air mobility |
| ADP | Aerodynamic design point |
| AIP | Aerodynamic interface plane |
| ASDL | Aerospace system design laboratory |
| BLI | Boundary-layer ingestion |
| BLE | Boundary-layer engine |
| BLD | Boundary-layer duct |
| BLF | Boundary-layer fan |
| BWB | Blended-wing body |
| CFD | Computational fluid dynamics |
| DPS | Distributed propulsion system |
| FSE | Freestream engine |
| FSD | Freestream duct |
| FSF | Freestream fan |
| FPR | Fan pressure ratio |
| ISA | International standard atmosphere |
| LDPS | Layered distributed propulsion system |
| PSC | Power-saving coefficient |
| RTO | Rolling takeoff |
| SAX | Silent aircraft eXperiment |
| TPR | Thrust-to-power ratio |
| Variables | |
| A | Flow area |
| Chord length | |
| Specific heat capacity at constant pressure | |
| Thrust | |
| Fg | Gross thrust |
| Fnet | Net thrust |
| Fr | Ram Drag |
| Total enthalpy change | |
| Mass flow | |
| Mach number | |
| Mechanical power | |
| Lost power | |
| Fan-shaft power | |
| P | Static pressure |
| Total pressure | |
| Excess mechanical power | |
| Ideal gas constant | |
| Total entropy change | |
| Total temperature | |
| Velocity | |
| Lost work | |
| Chord-wise position | |
| Propulsion efficiency | |
| Fan adiabatic efficiency | |
| Fan adiabatic efficiency penalty | |
| Fan pressure ratio | |
| Total pressure recovery | |
| Total pressure-recovery penalty | |
| Subscripts | |
| 1 | Propulsion system inlet |
| 4 | Propulsion system exit |
| avg | Mass averaged |
| bl | Boundary-layer stream tube |
| BLI | BLI inlet condition |
| uniform | Uniform inlet condition |
| d | Different exit velocity |
| fs | Freestream stream tube |
| i | Irreversible process |
| n | Begin of irreversible process |
| n + 1 | End of irreversible process |
| s | Same exit velocity |
| ∞ | Far upstream |
References
- Betz, A. Introduction to the Theory of Flow Machines, 1st ed.; Section 59; Pergamon: New York, NY, USA, 1966; pp. 215–217. [Google Scholar]
- Freuler, P.N. Boundary Layer Ingesting Inlet Design for a Silent Aircraft. Ph.D. Thesis, Massachusetts Institute of Technology, Department of Aeronautics and Astronautics, Cambridge, MA, USA, January 2005. [Google Scholar]
- Seitz, A.; Habermann, A.L.; Peter, F.; Troeltsch, F.; Pardo, A.C.; Corte, B.D.; Sluis, M.V.; Goraj, Z.; Kowalski, M.; Zhao, X.; et al. Proof of Concept Study for Fuselage Boundary Layer Ingesting Propulsion. Aerospace 2021, 8, 16. [Google Scholar] [CrossRef]
- Gray, J.S.; Mader, C.A.; Kenway, G.K.W.; Martins, J.R.R.A. Modeling Boundary Layer Ingestion using a Coupled Aeropropulsive Analysis. J. Aircr. 2019, 55, 1191–1199. [Google Scholar] [CrossRef]
- Uranga, A.; Drela, M.; Greitzer, E.M.; Hall, D.K.; Titchener, N.A.; Lieu, M.K.; Siu, M.N.; Casses, C.; Huang, A.C.; Gatlin, G.M.; et al. Boundary Layer Ingestion Benefit of the D8 Transport Aircraft. AIAA J. 2017, 55, 3693–3708. [Google Scholar] [CrossRef]
- Felder, J.L.; Kim, H.D.; Brown, G.V.; Chu, J. An Examination of the Effect of Boundary Layer Ingestion on Turboelectric Distributed Propulsion Systems. In Proceedings of the 49th AIAA Aerospace Sciences Meeting including the New Horizons Forum and Aerospace Exposition, Orlando, FL, USA, 4–7 January 2011. Paper No. AIAA-2011-300. [Google Scholar]
- Mantič-Lugo, V.; Doulgeris, G.; Singh, R. Computational Analysis of the Effects of a Boundary Layer Ingesting Propulsion System in Transonic Flow. Proc. Inst. Mech. Eng. Part G J. Aerosp. Eng. 2012, 227, 1215–1232. [Google Scholar] [CrossRef]
- Goldberg, C.; Nalianda, D.; MacManus, D.; Pilidis, P.; Felder, J. Method for Simulating the Performance of a Boundary Layer Ingesting Propulsion System at Design and Off-design. Aerosp. Sci. Technol. 2018, 78, 312–319. [Google Scholar] [CrossRef]
- Smith, A.M.O.; Roberts, H.E. The Jet Airplane Utilizing Boundary Layer Air for Propulsion. J. Aerosol Sci. 1947, 14, 97–109. [Google Scholar] [CrossRef]
- Smith, L.H. Wake Ingestion Propulsion Benefit. J. Propuls. Power 1993, 9, 74–82. [Google Scholar] [CrossRef]
- Liou, M.S.; Kim, H.; Liou, M.F. Challenges and Progress in Aerodynamic Design of Hybrid Wingbody Aircraft with Embedded Engines; Technical Memorandum NASA/TM-2016-218309; National Aeronautics and Space Administration (NASA): Washington, DC, USA, 2016. [Google Scholar]
- de la Rosa Blanco, E.; Hall, C.; Crichton, D. Challenges in the Silent Aircraft Engine Design. In Proceedings of the 45th AIAA Aerospace Sciences Meeting and Exhibit, Reno, NV, USA, 8–11 January 2007. [Google Scholar]
- Hathaway, M.D.; Rosario, R.D.; Madavan, N.K. NASA Fixed Wing Project Propulsion Research and Technology Development Activities to Reduce Thrust Specific Energy Consumption; Technical Memorandum NASA/TM-2013-216548; National Aeronautics and Space Administration (NASA): Washington, DC, USA, 2013. [Google Scholar]
- Berrier, B.L.; Carter, M.B.; Allan, B.G. High Reynolds Number Investigation of a Flush-Mounted, S-Duct Inlet with Large Amounts of Boundary Layer Ingestion; Technical Publication NASA/TP-2005-213766; National Aeronautics and Space Administration (NASA): Washington, DC, USA, 2005. [Google Scholar]
- Ferrar, A.M.; O’Brien, W.F. Fan Response to Total Pressure Distortions Produced by Boundary Layer Ingesting Serpentine Inlets. In Proceedings of the 48th AIAA/ASME/SAE/ASEE Joint Propulsion Conference and Exhibit, Atlanta, GA, USA, 30 July–1 August 2012. Paper No. AIAA-2012-3996. [Google Scholar]
- Giuliani, J.E.; Chen, J.P. Fan Response to Boundary-Layer Ingesting Inlet Distortions. AIAA J. 2016, 54, 3232–3243. [Google Scholar] [CrossRef]
- Plas, A.P.; Sargeant, M.A.; Madani, V.; Crichton, D.; Greitzer, E.M.; Hynes, T.P.; Hall, C.A. Performance of a Boundary Layer Ingesting (BLI) Propulsion System. In Proceedings of the 45th AIAA Aerospace Sciences Meeting and Exhibit, Reno, NV, USA, 8–11 January 2007. Paper No. AIAA-2007-450. [Google Scholar]
- Geiselhart, K.A.; Daggett, D.L.; Kawai, R.; Friedman, D. Blended Wing Body Systems Studies: Boundary Layer Ingestion Inlets with Active Flow Control; Contractor Report NASA/CR-2003-212670; National Aeronautics and Space Administration (NASA): Washington, DC, USA, 2003. [Google Scholar]
- Kawai, R.; Friedman, D.; Serrano, L. Blended Wing Body (BWB) Boundary Layer Ingestion (BLI) Inlet Configuration and System Studies; Contractor Report NASA/CR-2006-21453; National Aeronautics and Space Administration (NASA): Washington, DC, USA, 2006. [Google Scholar]
- Rodriguez, D.L. Multidisciplinary Optimization Method for Designing Boundary-Layer-Ingesting Inlets. J. Aircr. 2009, 46, 883–894. [Google Scholar] [CrossRef]
- Hardin, L.W.; Tillman, G.; Sharma, O.P.; Berton, J.; Arend, D.J. Aircraft System Study of Boundary Layer Ingesting Propulsion. In Proceedings of the 48th AIAA/ASME/SAE/ASEE Joint Propulsion Conference and Exhibit, Atlanta, GA, USA, 30 July–1 August 2012. Paper No. AIAA-2012-3993. [Google Scholar]
- Li, Z.P.; Zhang, Y.F.; Pan, T.Y.; Zhang, J.; Shang, Y.H. Study on the Aerodynamic Performance of Boundary-layer-ingesting Inlet with Various Geometries. Proc. Inst. Mech. Eng. Part G J. Aerosp. Eng. 2022, 236, 60–71. [Google Scholar] [CrossRef]
- Chiang, C.; Koo, D.; Zingg, D.W. Aerodynamic Shape Optimization of an S-Duct Duct for a Boundary Layer Ingesting Engine. J. Aircr. 2022, 59, 725–741. [Google Scholar] [CrossRef]
- Lee, B.J.; Liou, M.S.; Kim, C. Optimizing a Boundary-Layer-Ingestion Offset Inlet by Discrete Adjoint Approach. AIAA J. 2010, 48, 2008–2016. [Google Scholar] [CrossRef]
- Owens, L.R.; Allan, B.G.; Gorton, S.A. Boundary-Layer-Ingesting Inlet Flow Control. In Proceedings of the 44th AIAA Aerospace Sciences Meeting and Exhibit, Reno, NV, USA, 9–12 January 2006. Paper No. AIAA 2006-839. [Google Scholar]
- Allan, B.G.; Owens, L.R.; Berrier, B.L. Numerical Modeling of Active Flow Control in a Boundary Layer Ingesting Offset Inlet. In Proceedings of the 2nd AIAA Flow Control Conference, Portland, OR, USA, 28 June–1 July 2004. Paper No. AIAA2004-2318. [Google Scholar]
- Gunn, E.J.; Tooze, S.E.; Hall, C.A.; Colin, Y. An Experimental Study of Loss Sources in a Fan Operating with Continuous Inlet Stagnation Pressure Distortion. J. Turbomach. 2013, 135, 051002. [Google Scholar] [CrossRef]
- Fidalgo, V.J.; Hall, C.A.; Colin, Y. A Study of Fan-Distortion Interaction Within the NASA Rotor 67 Transonic Stage. J. Turbomach. 2012, 134, 051011. [Google Scholar] [CrossRef]
- Castillo Pardo, A.; Hall, C.A. Aerodynamics of Boundary Layer Ingesting Fuselage Fans. J. Turbomach. 2021, 143, 041007. [Google Scholar] [CrossRef]
- Hall, D.K.; Greitzer, E.M.; Tan, C.S. Analysis of Fan Stage Conceptual Design Attributes for Boundary Layer Ingestion. J. Turbomach. 2017, 139, 071012. [Google Scholar] [CrossRef]
- Cui, R.; Li, Q.S.; Pan, T.Y.; Zhang, J. Streamwise-body-force-model for rapid simulation combining internal and external flow fields. Chin. J. Aeronaut. 2016, 29, 1205–1212. [Google Scholar] [CrossRef]
- Li, Z.P.; Zhang, Y.F.; Pan, T.Y.; Zhang, J. A modified streamwise body force model of fan with distorted inflow for rapid propulsion-airframe integrated simulation. Chin. J. Aeronaut. 2023, 36, 202–213. [Google Scholar] [CrossRef]
- Guynn, M.D.; Berton, J.J.; Fisher, K.L.; Haller, W.J.; Tong, M.T.; Thurman, D.R. Engine Concept Study for an Advance Single-Aisle Transport; Technical Memorandum NASA/TM-2009-215784; National Aeronautics and Space Administration (NASA): Washington, DC, USA, 2009. [Google Scholar]
- Greitzer, E.M.; Tan, C.S.; Graf, M.B. Internal Flow: Concepts and Applications; Cambridge University Press: Cambridge, UK, 2007. [Google Scholar]
Disclaimer/Publisher’s Note: The statements, opinions and data contained in all publications are solely those of the individual author(s) and contributor(s) and not of MDPI and/or the editor(s). MDPI and/or the editor(s) disclaim responsibility for any injury to people or property resulting from any ideas, methods, instructions or products referred to in the content. |
© 2024 by the authors. Licensee MDPI, Basel, Switzerland. This article is an open access article distributed under the terms and conditions of the Creative Commons Attribution (CC BY) license (https://creativecommons.org/licenses/by/4.0/).