Article

Acoustic and Vibration Response and Fatigue Life Analysis of Thin-Walled Connection Structures under Heat Flow Conditions

Liaoning Province Key Laboratory of Advanced Measurement and Test Technology of Aviation Propulsio Systems, Shenyang Aerospace University, Shenyang 110136, China
*
Author to whom correspondence should be addressed.
Aerospace 2024, 11(4), 287; https://doi.org/10.3390/aerospace11040287
Submission received: 19 March 2024 / Revised: 1 April 2024 / Accepted: 2 April 2024 / Published: 8 April 2024
(This article belongs to the Section Aeronautics)

Abstract

:
Thin-walled connection structures are commonly used in the hot-end components of aerospace vehicles. Large deflection nonlinear responses and fatigue failure occur due to their discontinuous mass distribution and prominent cross-sectional changes under the action of complex thermal, aerodynamic, and noise loads. A thermoacoustic fatigue test was carried out to obtain the acoustic and vibration responses and fatigue life changes of the connection structure under heat flow conditions in engineering applications. The high-temperature acoustic fatigue test system of aviation thin-walled structures was used, taking the high-temperature alloy thin-walled plate-load-bearing frame bolted connection structure as the research object. As a result, the vibration response and fatigue life under different thermoacoustic loads were obtained. The contact finite element method was used to simulate the connection pre-tightening force, and the coupled finite element/boundary element method was used to calculate the acoustic and vibration response of the heat flow conditions. The changing rules of the frequency response peak value at the critical point of the thin-walled connection structure under the effects of different temperature fields, fluid fields, and sound fields were obtained through the processing and analysis of the calculation results. Considering the structural vibration fatigue damage mechanism, this study employed an improved rainflow counting method to compute the rainflow circulation matrix (RFM) and rainflow damage matrix (RFD) of the vibration stress time history at critical points within the structure framework. Said method was combined with Miner’s linear cumulative damage theory to estimate the fatigue life under various thermal-fluid-acoustic coupled loads. A comprehensive analysis validates the accuracy of the established numerical simulation calculation model in identifying critical connection points within structures subjected to pre-tightening forces. This model effectively characterizes thermal, aerodynamic, and acoustic loads on high-temperature alloy thin-walled-load-bearing frame bolted connection structures. It delineates the relationship between vibration response and fatigue life while assessing the impact of three distinct load parameters.

1. Introduction

The aerospace domain is experiencing rapid development, witnessing a proliferation of thin-walled connection structures within various aerospace structures. These structures are found in components such as the skin, radome, and vertical tail of hypersonic aircraft, the load-bearing frames of aircraft exhaust ducts, stringers, and wall panels, as well as critical elements like aeroengine main combustion chamber, afterburner, heat insulation anti-vibration screens, and tail nozzles. Their designs employ high-specific strength, stiffness, and materials resistant to high temperatures to optimize these thin-walled connection structures for weight reduction. This approach bolsters the stability and reliability of these thin-walled structures, meeting the demanding requirements of aerospace applications.
The thin-walled connection structures exhibit three primary characteristics. Firstly, a notable thickness disparity between the thin-walled components and their mounting bases leads to uneven mass distribution, impacting structural dynamics. Secondly, the abrupt changes at connection interfaces often trigger stress concentration, making these areas more susceptible to damage. Thirdly, material differences between the thin-walled parts and their connectors and differing thermal expansion coefficients result in substantial drops in connector preload force, especially in high-temperature environments.
These structures are subjected to complex thermal, aerodynamic, and acoustic excitation loads during operation. Various complex load coupling effects induce forced vibration, flutter, and acoustic resonance phenomena [1], resulting in multiple failure modes attributable to the coupling of physical fields. Under high temperatures, the structure undergoes thermal buckling, significantly affecting its stiffness and overall reliability. Aerodynamic loads, caused by high-speed airflow, present formidable random loads with local noise levels potentially reaching 180 dB [2,3]. When the external noise load frequency is equal to the natural vibration frequencies of thin-walled structures, resonance occurs, triggering pronounced alternating stress and dynamic displacement responses. This resonance seriously affects the service life of thin-walled connection structures, often culminating in fatigue failure. Given this scenario, there is an evident need for analyzing nonlinear responses and predicting structure life to address the thermal-fluid-acoustic-solid coupling effects on thin-walled connection structures.
A lot of theoretical and experimental research on nonlinear response analysis and fatigue problems of thin-walled connection structures has been carried out. Currently, numerical methods employed for assessing the stress/strain response of thin-walled connection structures under thermoacoustic loading include various approaches. Some of these are the perturbation method, Fokker Planck Kolmogorov (FPK) equation method, Von Karman-Herrmann large deflection plate equation, equivalent linearization method (EL), Reduced mode method (ROM), Galerkin method (Galerkin), finite element method (FEM), and coupled finite element/boundary element method.
Ng et al. [4] used the Von Karman equations and the Galerkin method to derive a single-mode equation, and combined experimental studies to investigate the nonlinear response of flat and curved plates under thermoacoustic excitation, including snap-through behavior and the basic characteristics of the thermoacoustic response of plate structures. Lee [5,6,7] used the EL method to compute the stress and strain response of thermal buckling plates. Vaicaitis [8,9] used the Galerkin method in conjunction with the Monte Carlo method to study the nonlinear response of both metal and composite structures under random excitation. C. Mei and Dhainaut [10,11] used the finite element method to calculate the nonlinear random responses in plate and shell structures subjected to thermoacoustic excitation. Maekawa [12] combined the FEM with the ROM method, analyzing the structural-acoustic fatigue life of aircraft skin at both room temperature and high-temperature conditions. The assessment was based on the cumulative fatigue damage theory and the local stress/strain field strength method.
The U.S. Air Force, NASA Langley Research Center, and McDonnell Douglas Corporation [13,14,15] carried out fatigue failure tests and observed materials and structures in high-temperature and high-noise environments. The observed environments were characterized by high temperatures (500–1000 °C) and were mainly concerned with materials such as C/SiC, C/C, and ceramic matrix composites. Furthermore, NASA Langley Research Center studied methods for obtaining dynamic strain data of superalloy thin-walled honeycomb structures under thermal and acoustic loads. The structural strain data was obtained for the frequency range of 50–500 Hz and sound pressure levels of 140–160 dB in both ambient and high-temperature environments. Ng, C.F. et al. [16] investigated the random motion of rectangular aluminum plates under thermal loads at 120 °F and strong acoustic loads at 160 dB via thermoacoustic fatigue tests. The results have shown that, when the acoustic load reached 160 dB, it was able to induce snap-through motion of the thermally buckled plates, which became more pronounced as the temperature increased.
On the other hand, Blevins et al. [17] conducted thermo-vibro-acoustic tests on C/C square flat panel structures at temperatures exceeding 1480 °C and sound pressure levels of up to 170 dB. The authors analyzed the structural characteristics under acoustic fatigue, concluding that the dominant load in designing most engines and aircraft skins are sound loads and the impact of shock waves. Jacobson et al. [18] conducted acoustic fatigue tests using composite wall panels characterized by surface curvature and stiffening features. These panels were then subjected to a wide-frequency excitation of 163.5 dB obtained using a wave tube; tests were carried out at both room temperature and high temperatures (up to 250 °F). The study results highlighted that the techniques for predicting fatigue life, strain response, and natural frequency under strong noise excitation are still incomplete, requiring further development to enhance design practicality. Moreover, Lee et al. [19,20,21] combined the second law of thermodynamics with Newton’s laws to effectively predict high-cycle fatigue life based on Unified Mechanics Theory (UMT). The presented work has not relied on traditional empirical curve fitting, providing an important alternative perspective.
Hypersonic vehicles have started to be deployed since the beginning of the 21st century. Due to their gradually increasing airspeed, many scholars have considered the impact of aerodynamic loads on aircraft and engine structures based on thermal and acoustic loads. Zou et al. [22] took a four-edge-supported titanium alloy wall panel as the research object and analyzed its dynamic response characteristics under different buckling coefficients. The baseline temperature was 22.36 °C and the noise level was under 160 dB noise, while the static loads were varied. It was observed that the snap-through response tends to move towards a post-buckling state as the static loads increase. This study preliminarily explored the thermo-acoustic response mechanism; however, effective experimental verification was not carried out. Li et al. [23] conducted a numerical simulation study aiming to solve the two-dimensional circular pipe flow-thermal-structural coupling problem in hypersonic vehicles; the study was based on the finite volume method. They carried out the unified simulation of the flow field and structural temperature field; however, the impact of noise loads was not considered and there was no experimental validation. While the presented study serves as the preliminary exploration of the convective heat–solid coupling simulation method, further research and validation are needed. Gui et al. [24] reviewed the research history and current status of the thermal-fluid-structural coupling problem in hypersonic vehicles. The coupling relationships between different loads, their physical meanings, and modeling and analysis methods were summarized. However, the research did not involve the effects of thermal-fluid-acoustic coupling on the structures. On the other hand, it provided a basis for understanding the coupling phenomena in hypersonic vehicles but must be expanded to include considerations of acoustic effects. Further, Gao et al. [25] used the finite element method for thermal-fluid-structural coupling to conduct numerical simulations of the annular flame tube of a combustion chamber. The simulation conditions were as follows: a nozzle speed of 50 m/s and a fuel injection temperature of 300 K. The overall shape of the flow and temperature fields was accurately simulated. However, the study did not consider the impact of noise loads on the flame tube structure and there was no experimental validation, indicating that, while the simulation provided useful insights, its completeness and practical application value remained limited. Hence, further research and validation were needed. Sha et al. [26,27,28,29] extensively researched the response and fatigue failure occurring in aeronautical thin-walled structures under high temperatures and intense noise excitations. They carried out numerical simulations and experimental validations of models (e.g., single thin-walled plates) under various coupled loads. However, the response and fatigue situations of geometrically nonlinear distributed thin-walled connection structures were not considered.
The above-presented literature review indicates that, while trials on the response of single thin-walled plates under thermal-acoustic loads and thermal-fluid-structural coupling were conducted, some common issues were found. Firstly, some of the presented works only carried out numerical simulations of thermal-fluid-structural coupling, without considering the impact of acoustic loads on the structural performance. Hence, it is possible that the critical role of sound loads in real-world applications could potentially be overlooked. Secondly, many studies lacked adequate validations given trial results or predict fatigue life, thus reducing their effectiveness in engineering applications. Lastly, some of the studies have not considered the comprehensive numerical simulations and trial validations of connection structure models under multiple loads, limiting their applicability in real-world scenarios.
Despite the extensive research, there are no in-depth investigations into the fatigue failure of typical thin-walled connection structures with geometric nonlinearity under the combined effects of thermal, fluid, acoustic, and structural loads. Currently, available studies have not adequately determined the response and life-change patterns of such structures under complex loads. For this reason, in this paper, the authors aimed to examine the performance of thin-walled structure models made from high-temperature alloy GH188. The alloy used in the paper is generally used in the hot-end components of aerospace applications, under actual operational conditions. The research is focused on situations where preload constraints are applied to the model base, employing numerical simulation to analyze stress responses under various temperature fields, high-speed flow fields, and acoustic environments. Then, calculate the rain flow cycles and damage matrices, thereby making a reasonable estimate of the structure’s fatigue life. Furthermore, trials were carried out to compare the results from numerical simulations with the responses and fatigue life measured experimentally, during tests, primarily to assess the effectiveness and reliability of the simulation methodologies. Therefore, this study aims to improve the understanding of such structures’ performance in complex conditions. Finally, special attention was given to dynamic strength design and fatigue life evaluation under geometric nonlinearity and various coupled loads, aiming to fill the current insufficiency in research.

2. Nonlinear Response Theory

2.1. Bolt Preload Modeling

In bolted connection structures, the contact conditions within contact regions are pivotal and are influenced by various factors, such as load, material, and boundary conditions. These conditions significantly impact the dynamic characteristics of the structure [30]. Effectively addressing the contact problem in bolted connections requires suitable contact algorithms. Commonly used contact algorithms include the penalty function, Lagrange multiplier, and augmented Lagrange multiplier methods [31]. To ensure higher analysis accuracy and numerical solution stability, in this paper, we opted for the augmented Lagrange multiplier method in iteratively resolving the contact problem within thin-walled connectors.
The fundamental equation for determining the system energy function is obtained through Hamilton’s principle.
Π u = t 1 t 2 Π 1 + Π 2 + Γ c 1 2 α g N t k 2 + λ N t k g N t k d s d t
where t1 and t2 are the start and end times, respectively; Π ( u ) is the total energy of the system; Π 1 is the kinetic energy of the system; Π 2 is the strain energy of the system; Γ c is the contact boundary; α is the penalty factor; u is the displacement at the midpoint of the connection region; s is the arc length parameter of the contact interface; λ N t k and g N t k are the k -th iteration Lagrange multiplier and the contact gap at t time, respectively.
The dynamic control equations for the contact problem system are derived by varying and discretizing the unconstrained function problem obtained using the augmented Lagrangian method.
M u ¨ t k + C u ˙ t k + K t k u t k - B c t k λ N t k = F K t k = K e t + K s t k
where M, C, F are mass matrix, damping matrix, and preload vector, respectively; u t k , u ˙ t k , u ¨ t k , B c t k are the displacement, velocity, acceleration, and contact constraint matrix for the kth iteration at moment t, respectively. Finally, K t k , K e t , K s t k are the total stiffness matrix of the system at time t, the structural stiffness matrix, and the stiffening matrix due to the preload after k iterations, respectively.
The bolted connection is shown in Figure 1, indicating the bolt preload. According to the “Mechanical Design Manual” [32] preload calculation guidelines, high-temperature alloy steel bolt preloads should be taken as follows:
F 0 0.6 0.7 σ s A 0
where A 0 = π d 2 / 4 is the dangerous cross-section area of the bolt; d is the diameter of the dangerous bolt cross-section; and σ s is the yield strength of the bolt.
The GH188 was used as the base, while M6 bolts were made of performance grade 8.8 material. Hence, bolt yield strength σ s = 640 MPa. The associated hazardous bolt cross-section area was 20.06 mm2. Equation (3) gives the bolt hazardous cross-section preload: 7750   N F 0 8989   N ; the bolt preload was taken to be 8000 N.

2.2. Coupled Heat-Fluid-Acoustic-Solid Finite Element Governing Equations for Thin-Walled Structures

The overall structural control equations are obtained through the derivation and summation operations of the vibration equations of each unit using the finite element method.
M W ¨ + C W ˙ + K W = F f + F P + F T
where M is the mass matrix, K is the stiffness matrix, C is the damping matrix, W is the overall displacement, F f is the barometric pressure load, F P is the acoustic pressure load, and F T is the temperature load.
The finite element and boundary element methods were coupled to analyze the effect of damping on the response characteristics of the structure. The motion equations of the structure in modal coordinates are obtained as follows:
d ¨ n + 2 ζ n ω n d ˙ n + ω n 2 d n = Φ n Τ F f + F P + F T M n
where Φ n is the normal mode shape of the boundary element node, ω n is the fundamental frequency of the structure, d n is the displacement of the nth mode, and ζ n and M n are the damping coefficient and modal mass, respectively. By deriving the equation of motion for the structural modal coordinates (Equation (5)), the response function expression can be obtained as follows:
H S n = 1 M n ω n 2 - ω 2 + 2 i ζ n ω n ω
Combining Equation (5) with the response function yields the following control equation:
H S d = Φ Τ F f + Φ Τ F P + Φ Τ F T
where H S is the response function; d is the modal displacement and Φ is the modal matrix. Further, the finite element and boundary element model of the system is shown in Figure 2, where 1 denotes the solid domain structure, 2 is the fluid domain inside and outside of the structure, and Γ is the fluid domain boundary.
The structural dynamics control equations for the coupled finite elements/boundary elements in the frequency domain are established by linking spectral density coupling of structural finite elements and acoustic boundary elements as follows:
C P L G ω S D r ω = S D I N ω
where C P L G ω is the full coupling matrix, S D I N ω is the external excitation power spectral density function, and S D r ω is the structural dynamic response power spectral density function.
The shear stresses inside the structure and film stress during random vibration at high temperatures were considered. Large deflection equations for the variation of each material parameter with temperature under thermoacoustic loading are given for thin-walled structures:
ρ h 2 w t 2 + ρ h ξ w t D 4 w + α 1 + υ D 2 θ = 2 w x 2 · 2 F y 2 + 2 w y 2 · 2 F z 2 - 2 2 w x y · 2 F x y + p x , y , t
where ρ is the density; ξ is the damping coefficient; υ is the Poisson’s ratio; p x , y , t  is the random stress of the simulated acoustic load; and D is the bending rigidity. Finally, it should be added that 4 is the dual harmonic operator. F is the film stress.

2.3. Theories Related to Fatigue Life Estimation

The response results obtained for the thin-walled connection structure are analyzed to estimate the fatigue life using the combination of Morrow’s average stress model and Miner’s linear cumulative damage theory. Miner’s theory suggests that cyclic stresses under the yield limit represent linear cumulative fatigue damage. The structure experiences fatigue damage when the damage accumulates to a certain value, expressed as follows:
D = i n i N f σ a i
where σ a i is the amplitude of the response of the i-th stress structure, N f is the damage life of the i-th stress structure, and n i is the number of cycles of the structure at that value. In the form of stress extremes and cyclic stresses, it is possible to write the following:
E D = E P T - - p σ a , σ m N f σ a , σ m d σ a σ m
where N f is a function of σ a , σ m determined by the selected average stress model. In this paper, the Morrow mean stress model was used:
σ a r = σ a 1 σ m / σ f
where σ a is the cyclic stress amplitude; σ m is the mean cyclic stress value; and σ f is the modified fatigue strength.
When employing the enhanced rainflow cycle counting method, the stress peak probability density function p σ a , σ m can be determined from the rainflow cycle matrix as follows:
- - p σ a , σ m d σ a d σ m = 1 N R F - - R F M σ a , σ m
where N R F is the number of rainfall cycles and RFM is the rainfall cycle matrix. The damage level expectation E(D) for a finite time interval Tr is calculated using the following:
E D = T T r - - R F M σ m i n , σ m a x N f σ m i n , σ m a x = T T r - - R F D σ m i n , σ m a x
where R F D σ m i n , σ m a x is the rainflow damage matrix. When the expected damage level is E D = 1 , the median fatigue life can be derived as:
T = T r / - - R F D σ m i n , σ m a x

3. Thermoacoustic Loading Test and Numerical Simulation of Thin-Walled Connectors

3.1. High-Temperature Acoustic Fatigue Test

A high-temperature acoustic fatigue test was conducted to verify the response and life analysis of the thin-walled connection structure subjected to multi-field coupling. The quartz lamp was used for heating, and light boxes were hung on both sides of the travelling wave tube, simultaneously heating both test piece sides. The noise is generated by the compressed air supplied via a gas storage tank, which is emitted through the sound generator at the test end of the wave tube once it is processed. The noise then enters the test section as a traveling wave, eventually reaching the rear end of the test section. It ensures that the air source pressure remains stable. Further, based on the spatial position and shape of the wave tube test section, as well as the gas flow rate within, the airflow speed through the test section can be steadily maintained at around 20 m/s, ensuring the uniformity of the sound field. Two groups of tests were conducted—A and B, with group A subjected to a sound load of 151.5 dB and group B to 154.5 dB. The thermoacoustic fatigue performance of the material in a high-temperature environment was measured by conducting a thermoacoustic fatigue test on GH188 thin-walled parts. As a result, damage location, response results, and damage time of the test piece were obtained. The test rig is shown in Figure 3.
In the project, the GH188 material was selected as the research object with a melting point of 1318 °C. The shape and size of the workpiece are as shown in Figure 4, with a wall thickness of 1.5 mm. The material parameters of GH188 plates at different temperatures are given in Table 1; T is the temperature; E is the elastic modulus; υ is Poisson’s ratio, α thermal expansion coefficient; and K is thermal conductivity.
For the high-temperature acoustic fatigue test, based on the group method in engineering tests, seven workpieces are installed at one time, with five test pieces in the middle with test equipment attached, and one fixture piece on each side, which are not considered as objects of study. All workpieces are staggered up and down, and the roots of the test pieces are fixed to the fixture with four bolts. A torque wrench was used to adjust the bolt pre-tightening forces to 8000 N, achieving complete support and restraint at the root. The installation of the test section of the thin-walled connection structure test piece is shown in Figure 5.
A thermocouple, welded at the surface root of the test piece, continuously transmits real-time temperature data of the test piece to the high-temperature control cabinet, ensuring precise closed-loop control of the temperature load. The target surface temperature is set to 450 °C, as shown in Figure 6, showcasing a typical temperature control measurement curve. During the test, the surface temperature of the thin-walled connection structure exhibits a gradual increase, with a lag behind the set temperature. As time progressed, the surface temperature of the test piece approached the set temperature of 450 °C, maintaining stable operation. Such behavior was highly consistent with the preset temperature, illustrating the accuracy of the temperature load control in this test.
The test results for Groups A and B in Figure 7 reveal that the thin-walled connection structure experienced breakage at its root and neck. Analyzation has shown that the test piece is completely fixed and constrained by four bolts during the test. The structure was simplified to a cantilever beam during the vibration process. Under the combined action of thermal, acoustic, and aerodynamic loads, the test piece was at the root position. Stress concentration occurred, causing fatigue damage to the structure.
For a comprehensive analysis of the fatigue life of thin-walled connection structures under heat-fluid-acoustic loads, several high-temperature acoustic fatigue tests were conducted, factoring in various random variables affecting fatigue life. Three test sets were conducted at 450 °C and 20 m/s to ensure rigorous and reliable results, with sound loads at 151.5 dB and 154.5 dB. The results are shown in Table 2.

3.2. Numerical Simulation and Experimental Comparison

The simulation analysis was strictly compared with the experimental model. The simulation model consisted of a thicker mounting base, typical thin-walled plate, and a four-bolt assembly, as shown in Figure 8. The thin-walled structure was connected to the mounting base via four bolts and a pre-tightening force of 8000 N was applied. This ensured that the root restraint was complete, which was needed for simulation calculations.
The high-speed hot air flow impact environment was simulated through fluid simulation software Fluent. The air flow speeds were 20 m/s, 40 m/s, and 60 m/s, while inlet temperatures were 300 °C, 400 °C, 450 °C, 500 °C, and 600 °C. The simulation calculates the thin-walled plate selecting GH188 physical parameters. The mounting base, bolts, and nuts were high-temperature-resistant alloy steel. The simulation results were all within the linear elastic range.
To improve the accuracy and convergence of numerical simulations, the contact finite element method was applied in this study to analyze the contact surfaces between the thin-walled structure, the mounting base, and the bolts and nuts. Symmetrical contact was utilized to manage the interaction between the thin-walled structure, the base, and the bolt connections. Considering that during the test, the thin-walled structure and the mounting base exhibited no deflection or slippage, the thin-walled structure and the mounting base were equivalent to complete frictional contact. Hence, the contact algorithm was set to the augmented Lagrange multiplier for iterative calculation, and the Gaussian integration method was used to detect the contact position to obtain the stress, strain, and displacement at the contact position, yielding the overall thin-walled connection structure results.
Modal analysis was carried out on the thin-walled connection structure, generating the first-order mode shape computed through simulation at 450 °C, as shown in Figure 9. A comparison of the first-order mode frequencies obtained from three different groups through simulation and experiment is shown in Table 3. The first-order mode frequency measured by simulation and experiment was highly consistent, with an error margin of less than 0.2%. Therefore, the boundary conditions set under multi-field coupling in static structure calculation are both accurate and effective.
Acoustic simulation software VA One was used to solve the coupling of sound, temperature, pressure, and structural fields of bolted thin-walled structures; this was conducted through the coupled finite element/boundary element method. The acoustic load was induced via limited broadband Gaussian white noise with a frequency range of 21 to 1485 Hz, with an 8 Hz interval. This acoustic load was applied to the thin-walled connection structure in the form of travelling wave grazing incidence.
Under the combined action of thermal, aerodynamic, and acoustic load, the critical location of the thin-walled connection structure, as shown in Figure 10, aligns completely with the high-temperature acoustic fatigue test results. The fatigue failure points appear at the axial root and neck of the structure. The reliability of the numerical simulation under the combined heat-fluid-acoustic load was thus verified.
Figure 11 shows the stress power spectral density of the thin-walled connection structure at sound pressure levels of 151.5 dB, 154.5 dB, and 157.5 dB under conditions of 450 °C and 20 m/s. The stress levels vary across directions, with the X direction registering the highest, followed by the Y direction, and the Z direction is the lowest stress, as indicated in the figure. The shear stress in the XY, XZ, and YZ directions is 5 to 7 orders of magnitude smaller than in the X direction. Consequently, it can be ignored. Therefore, the X-direction dynamic stress response results were taken as the focus of the fatigue failure life study of thin-walled connection structures.
To investigate the impact of acoustic load on the axial dynamic stress in thin-walled connection structures and to validate the accuracy of simulation calculation results, thermal loads were maintained at 450 °C, with two sound pressure levels of 151.5 dB and 154.5 dB. Due to the inherent strong randomness observed in high-temperature acoustic fatigue tests for such structures, potential errors in the test results prompted the implementation of four tests for each working condition. The comparison between test and simulation results is shown in Table 4.
The average value of the X-direction dynamic stress in the high-temperature acoustic fatigue test of the thin-walled connection structure at 151.5 dB sound pressure level is 175.19 MPa (see Table 4). Compared to the numerical simulation result of 177.72 MPa, the error is 1.44%. The average value of the three test results at 154.5 dB sound pressure level is 256.69 MPa, a 2.20% error compared to the numerical simulation result (251.04 MPa).
The X-direction stress power spectrum density of the critical point on the thin-walled connection structure under different sound loads, using 450 °C and 20 m/s as examples (as shown in Figure 12), indicates specific resonance frequencies. At the sound load of 145.5 dB, the first-order response peak is 8.66 × 10¹⁴ Pa2/Hz, while the second-order response peak is 1.24 × 10¹³ Pa2/Hz. At 160.5 dB, the first-order response peak value is 2.56 × 10¹⁶ Pa2/Hz, and the second-order response peak is 3.68 × 10¹⁴ Pa2/Hz. Notably, at both 145.5 dB and 160.5 dB sound pressure levels, the disparity between the first and second-order response peaks of the structure is approximately 1 to 2 orders of magnitude.
Similarly, at 151.5 dB, 154.5 dB, and 157.5 dB sound pressure levels, the discrepancy between the first and second-order response peaks is also on the order of 1 to 2. This observation confirms the need to focus solely on the frequency corresponding to the first-order response peak for structural damage assessment. The comparison of the X-direction dynamic stress test and simulation results of the thin-walled connection structure reveals that, for constant temperature, an increase in sound load from 151.5 dB to 154.5 dB (essentially doubling the sound pressure energy) leads to an approximate 70 MPa rise in the X-direction dynamic stress. Such behavior indicates that, under these constraint conditions, the destructive influence of acoustic loads on the structure is very severe.

4. Analysis of Dynamic Stress Nonlinear Response under Multi-Field Coupling

4.1. Response Analysis in a High-Speed Heat Flow Environment

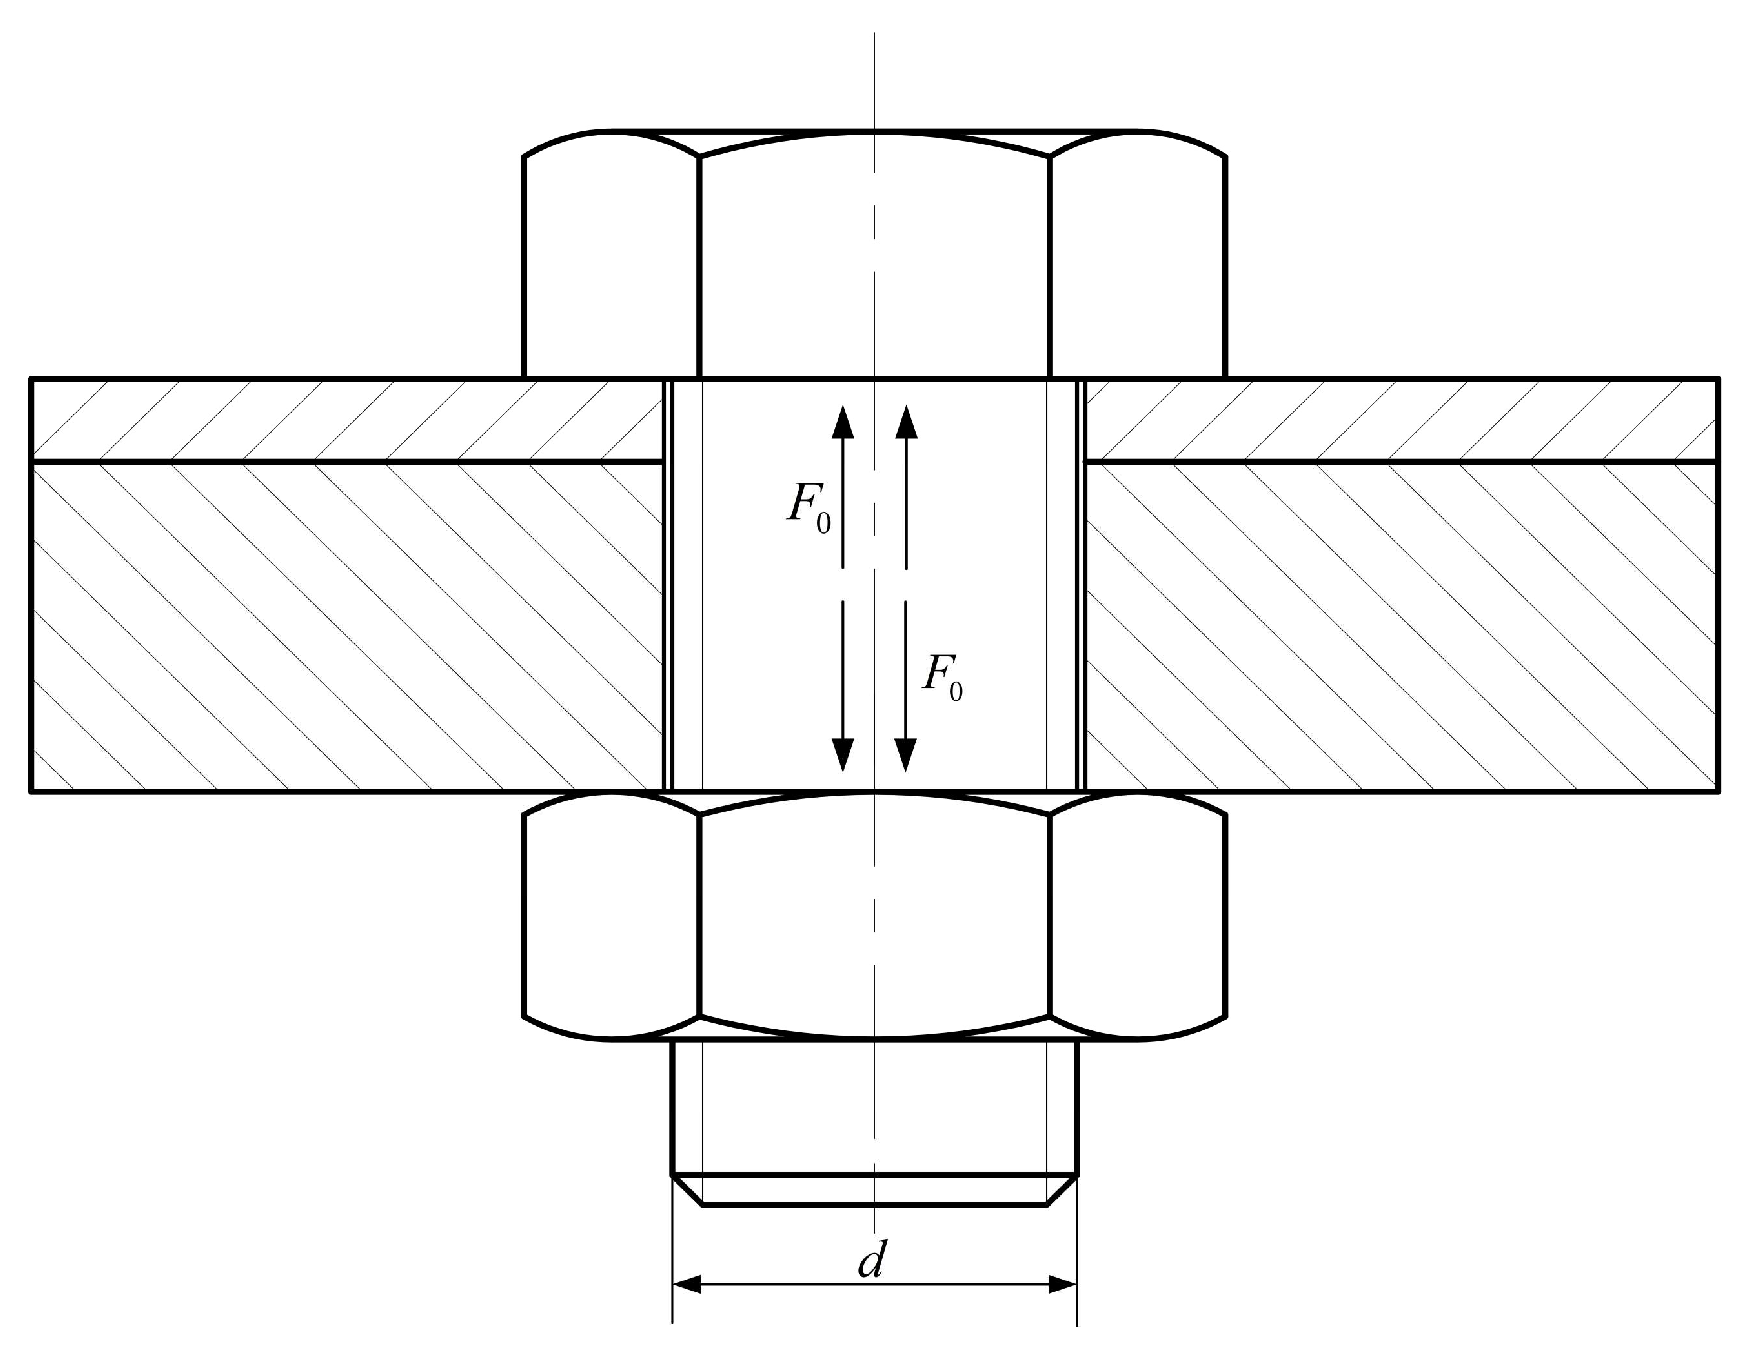
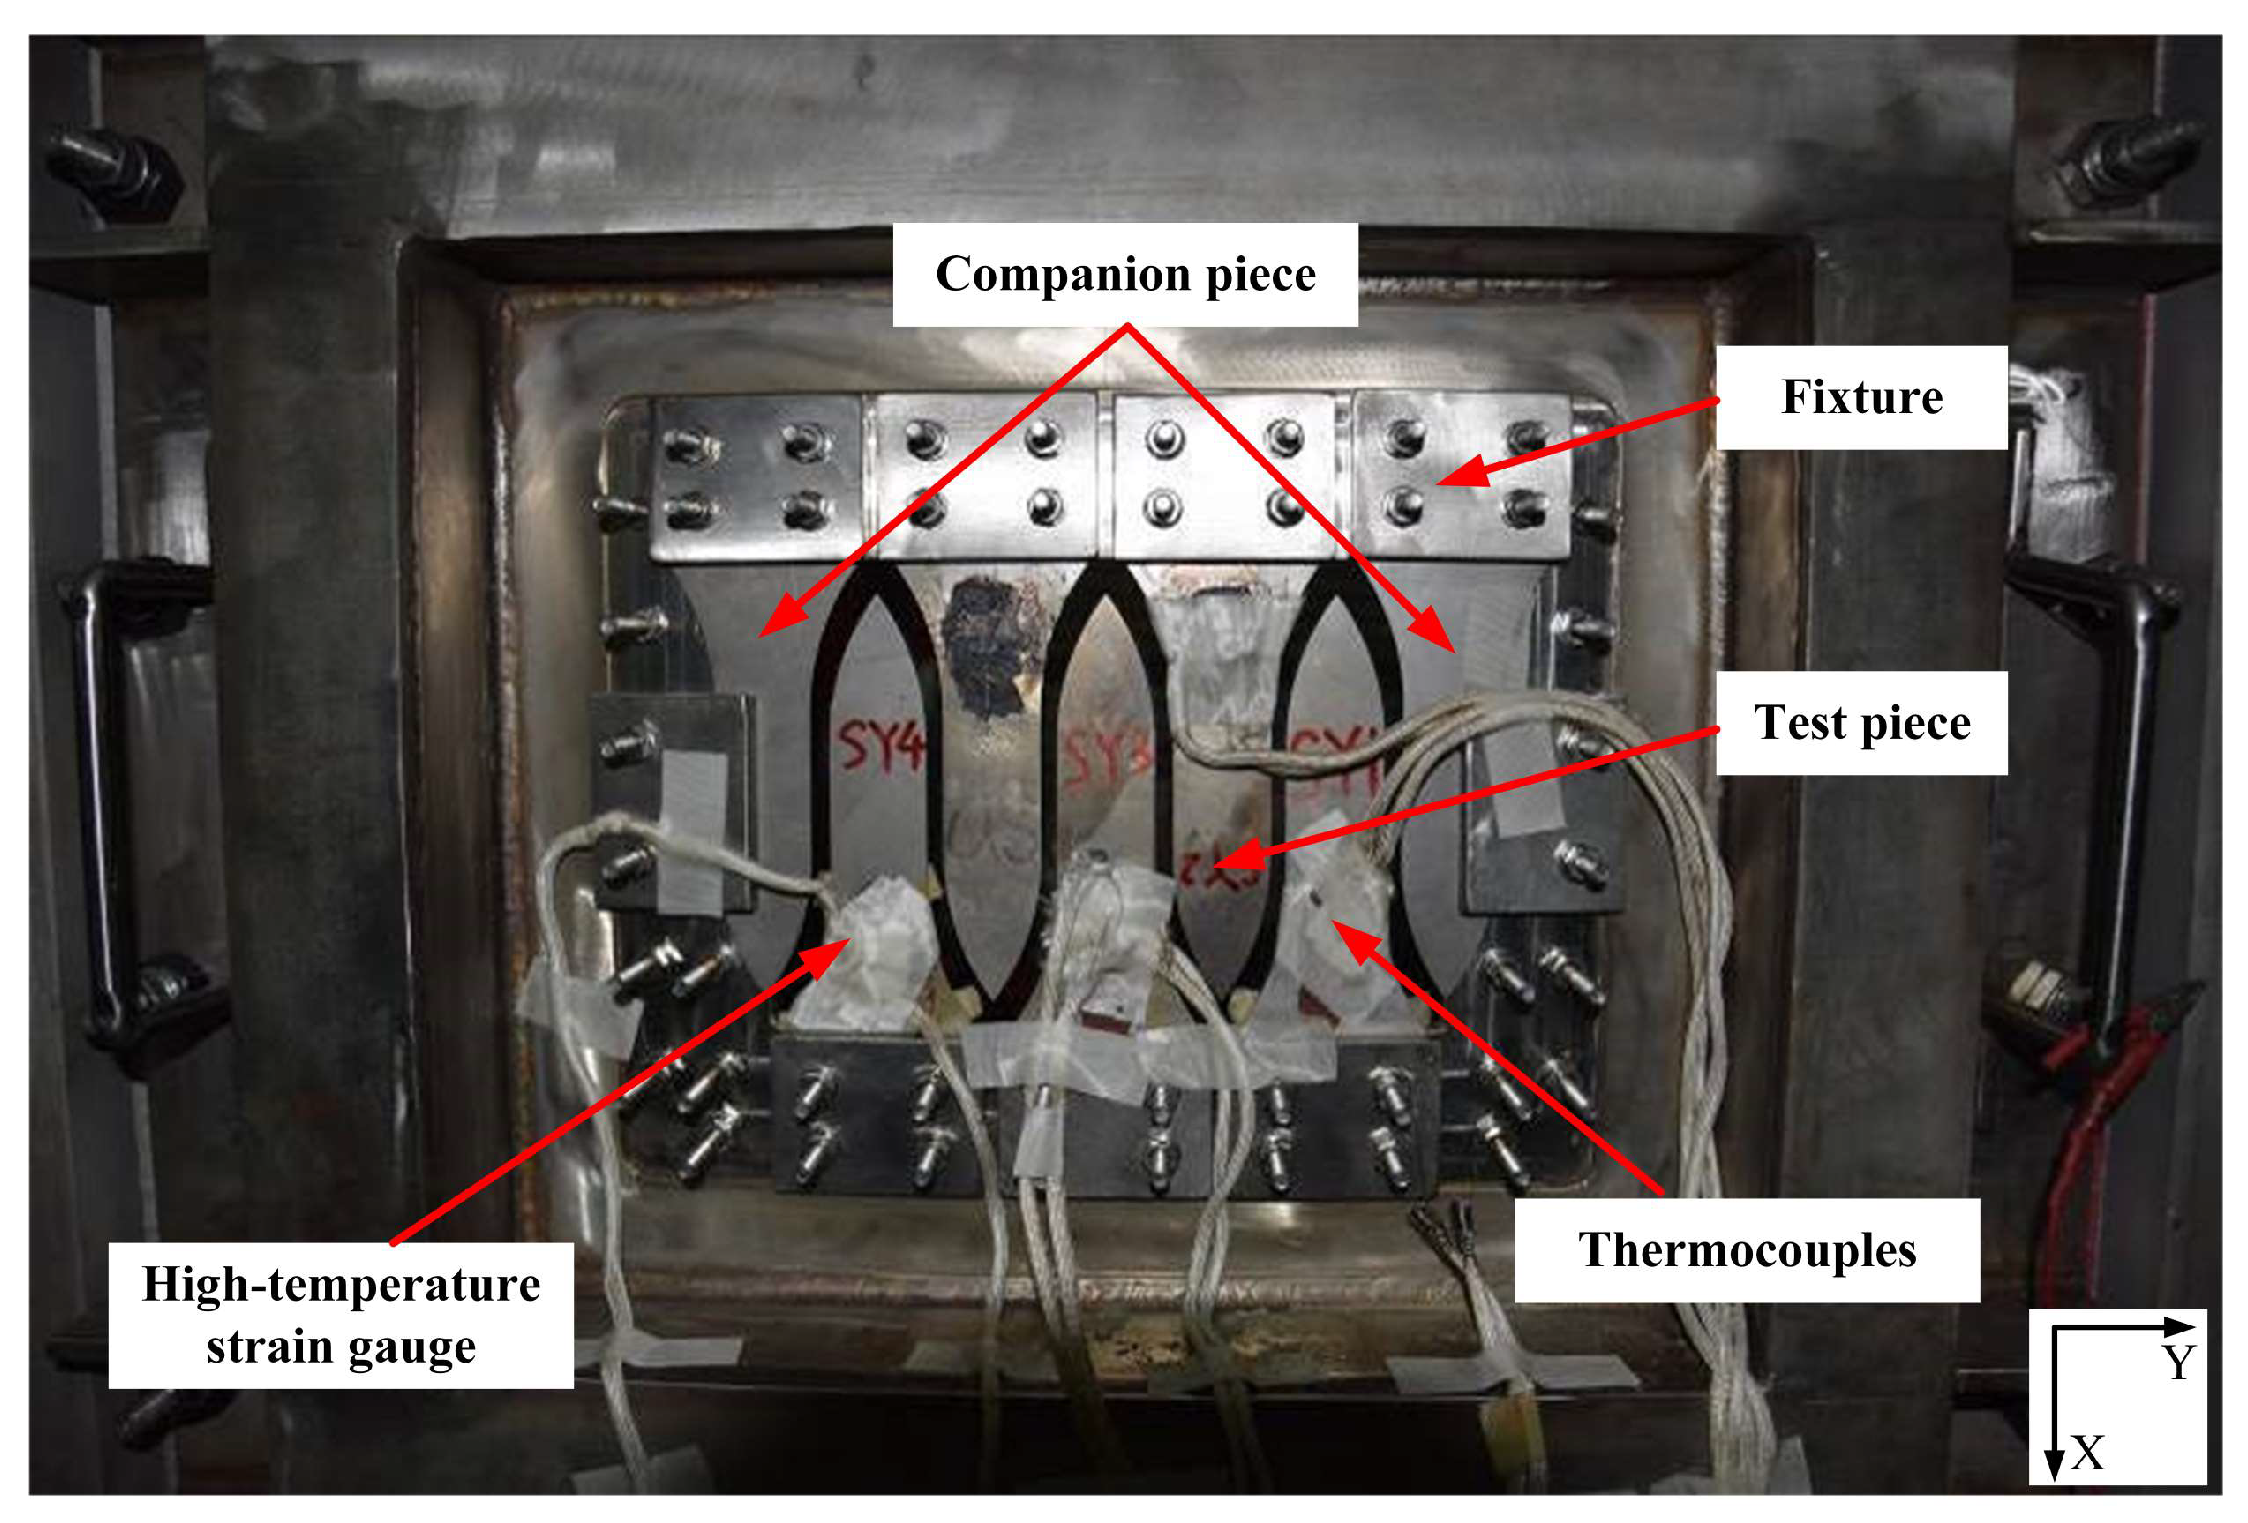
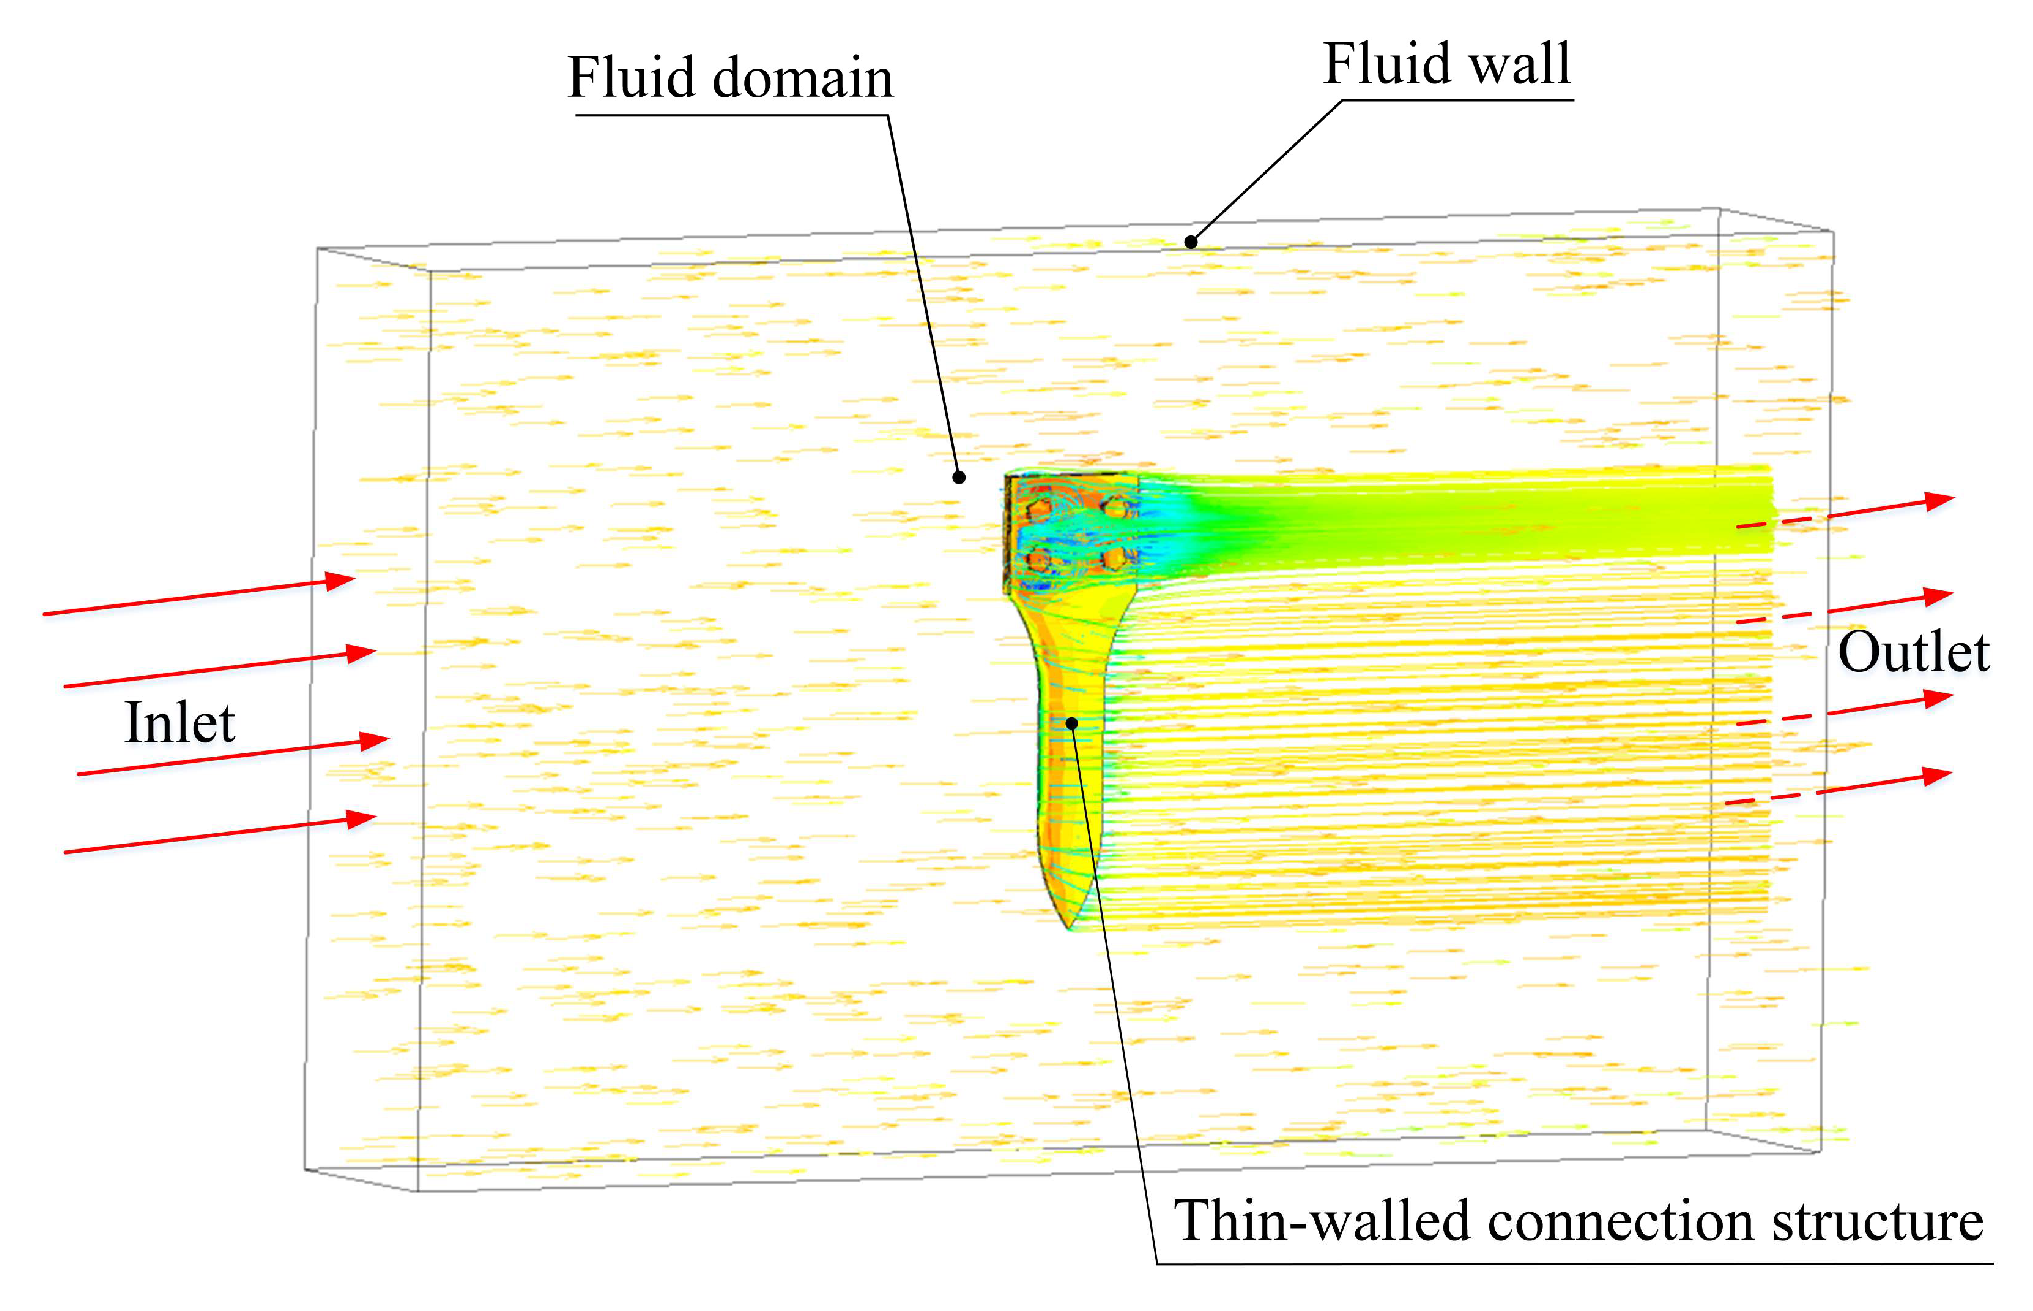
The finite element method was used to simulate both the temperature and pressure fields of thin-walled connection structures under typical working conditions. Since the environmental temperature, noise excitation, and load effects generated by airflow are the same for the test pieces, and the composition and constraint forms of the workpieces are consistent, therefore, based on the principle of equivalence, the simulation analysis selected typical components of the test pieces for equivalent analog calculations. The structural solid and fluid domain calculation models are shown in Figure 13. The k-turbulence model was used to simulate the surface heat flow and friction of the thin-walled connection structure, and data exchange between the fluid and the solid domains was achieved. This resulted in consistent displacement, heat flow, temperature, and pressure on the coupling interface between the fluid and the solid domains. Finally, the temperature and pressure fields obtained through the fluid analysis were imposed on the static structure as boundary conditions.
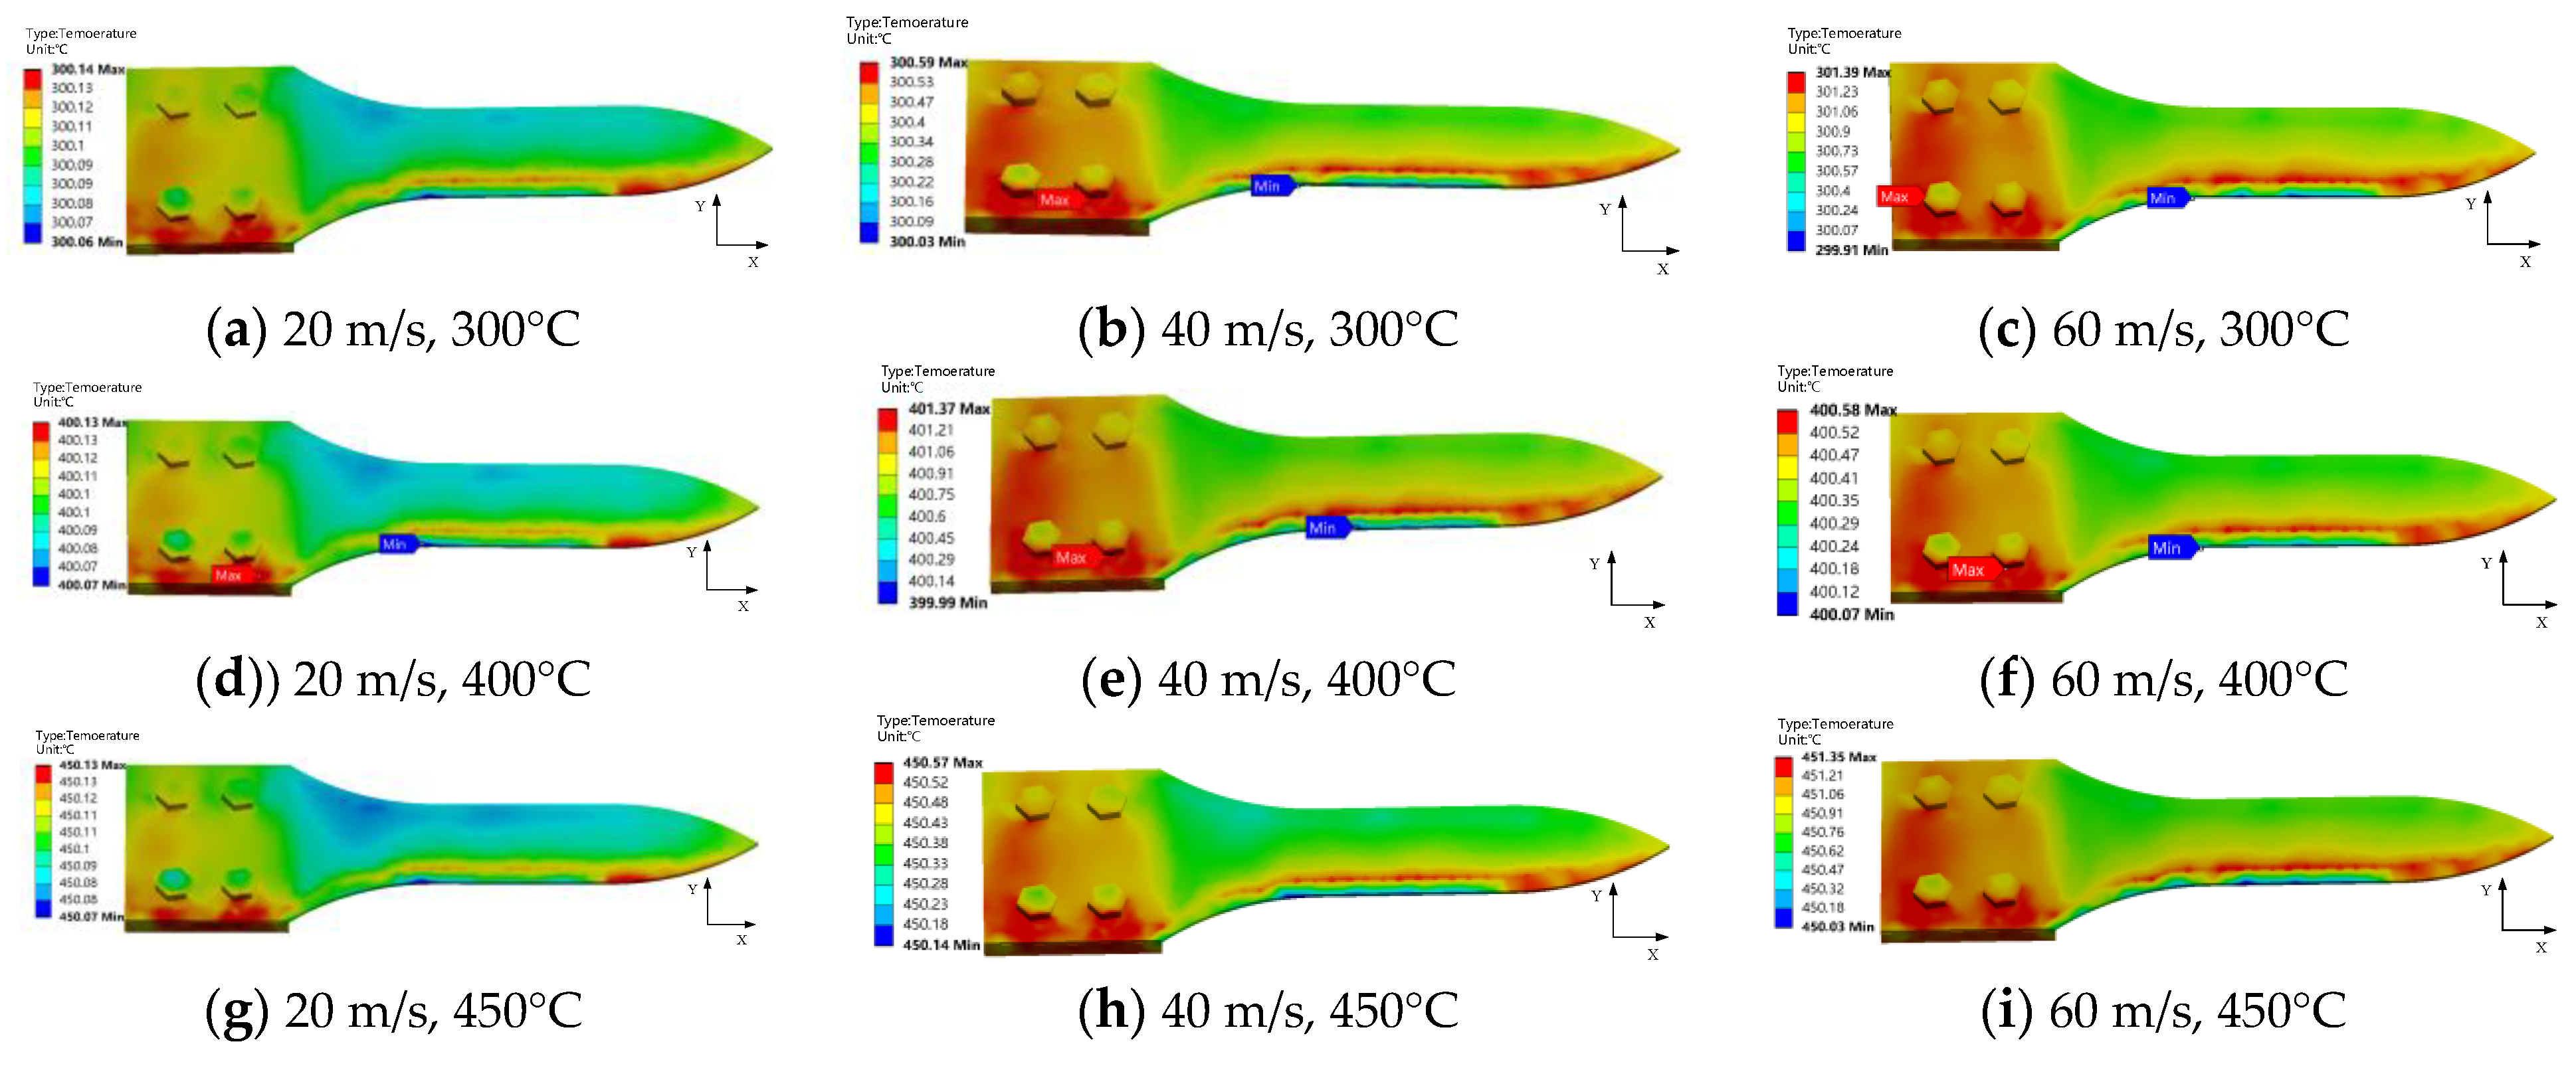
The temperature distribution cloud diagram for the thin-walled connection structure under high-speed heat flow load is shown in Figure 14 Due to variations in thickness and material between the test piece and the mounting seat at the bolted connection, the high-temperature airflow concentrates at the structure entrance and exit, spreading from the edge to the center. The boundary line between high- and low-temperature zones forms an envelope along the test piece root and neck. Finally, a turbulent flow zone is formed on the outlet side of the fluid domain, corresponding to a lower temperature area for the test piece.
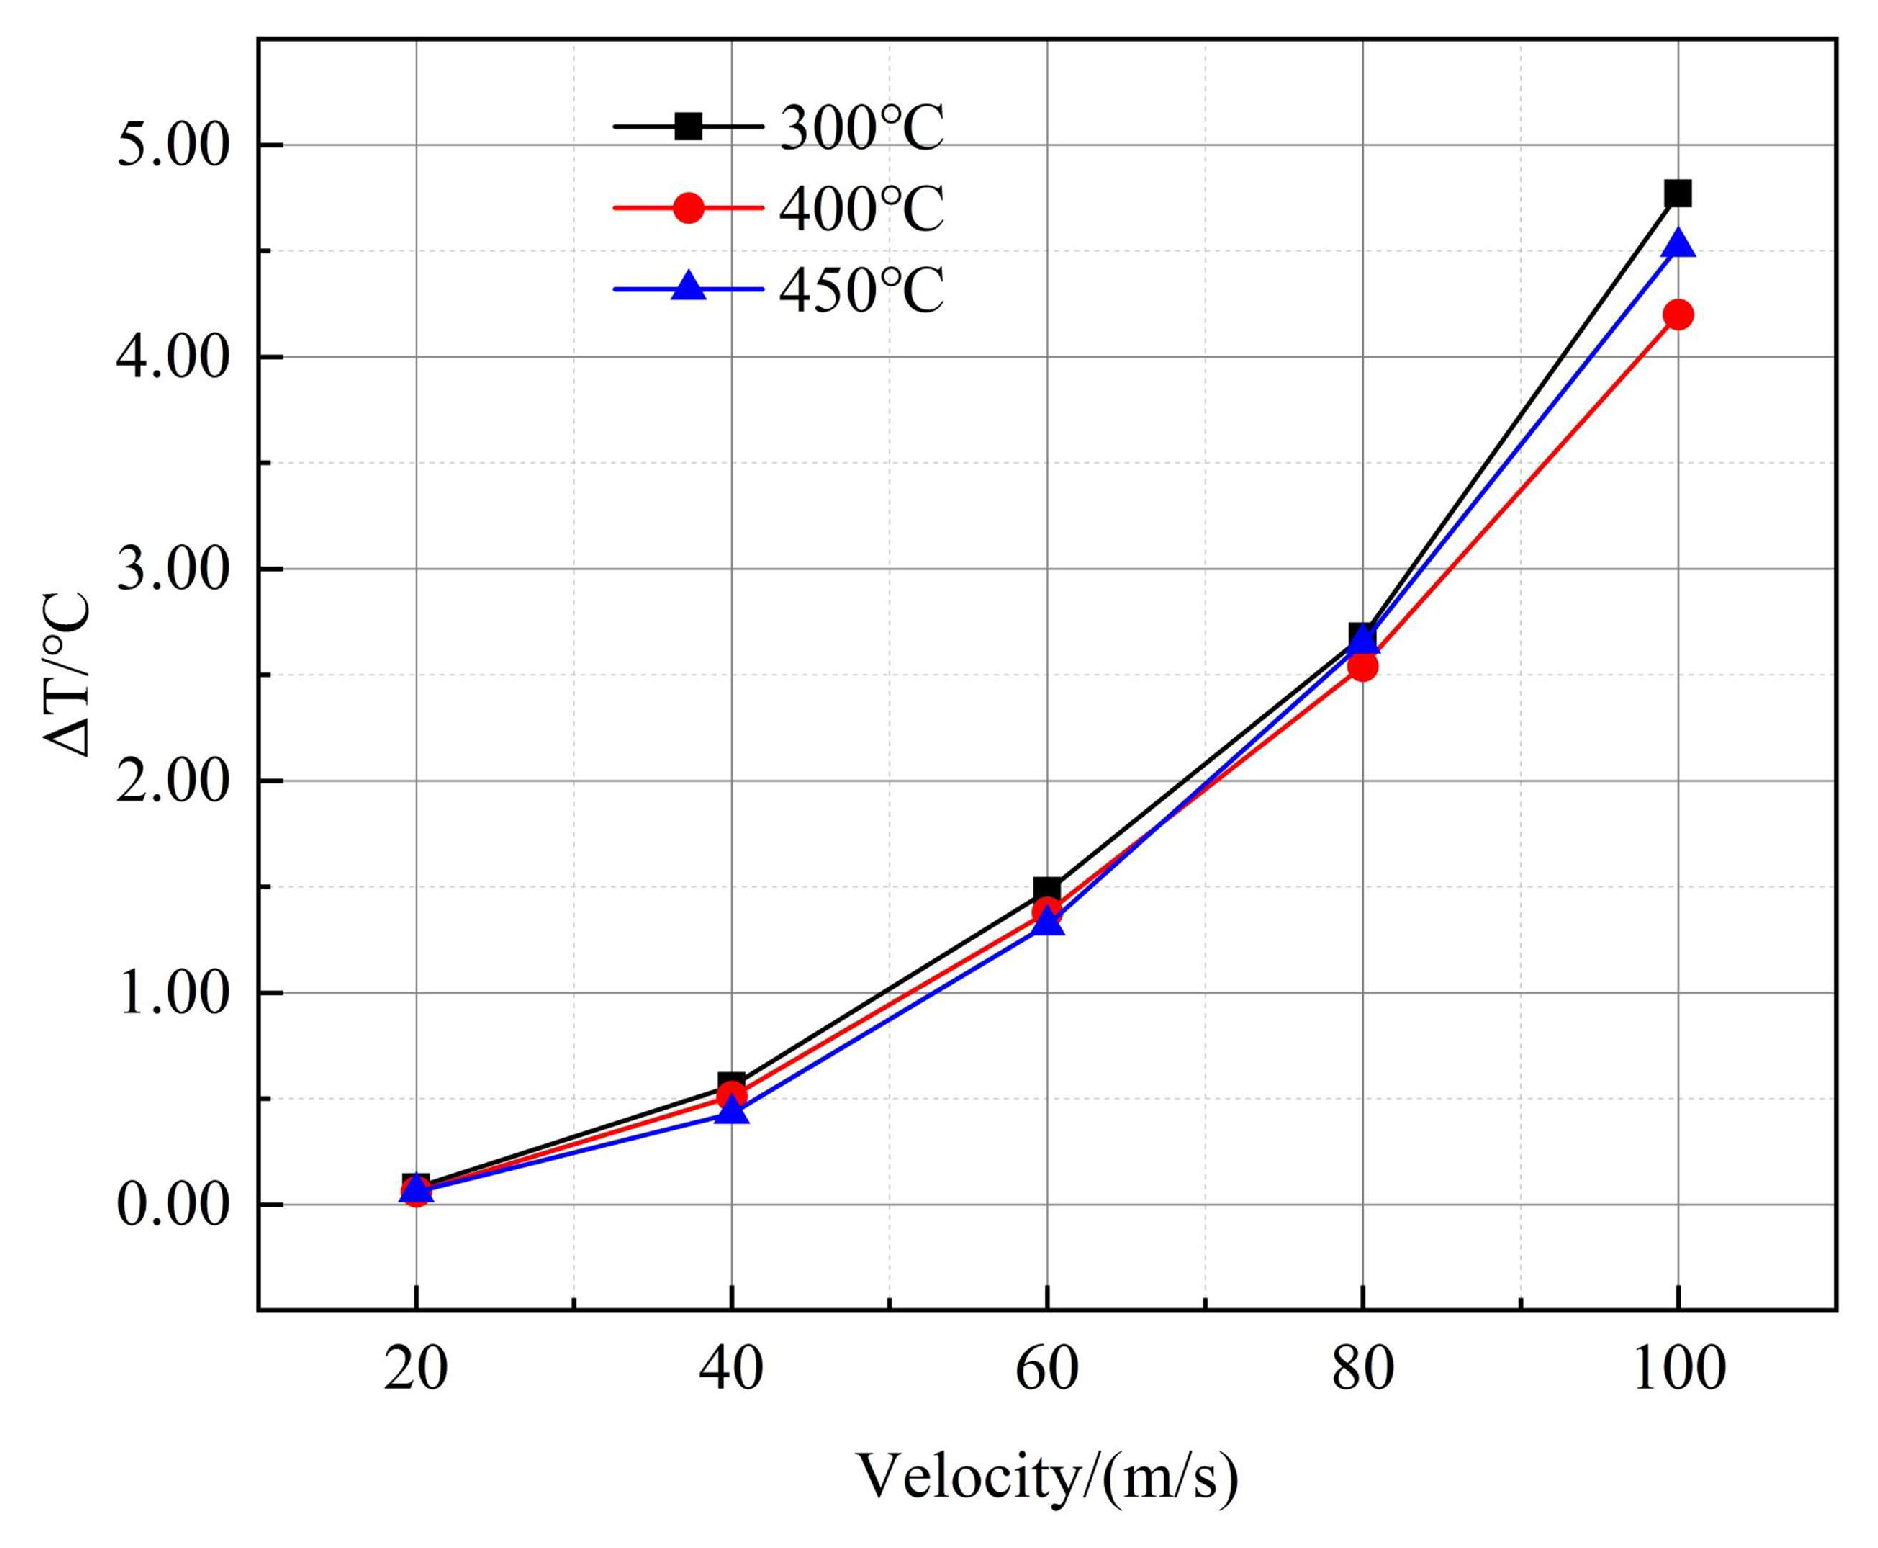
It can be seen from Figure 15, as the flow velocity increases from 20 m/s to 60 m/s at 300 °C, the surface temperature difference on the structure increases from 0.08 °C to 1.48 °C. The temperature difference increases with the flow velocity; the range of the high-temperature region also increases. The change range of the structure surface temperature at 400 °C and 450 °C is the same as that at 300 °C. In other words, the greater the flow velocity, the more concentrated the temperature distribution, making its impact on the thin-walled connection structure more evident. Further, the three temperature distribution cloud diagrams show that the surface temperature distribution rules are consistent under the same flow velocity and different temperatures. Since the high-speed hot air flow passes through the whole thin-walled structure, there will be no large gradient in the temperature difference on the structure surface at different heat flow loads.
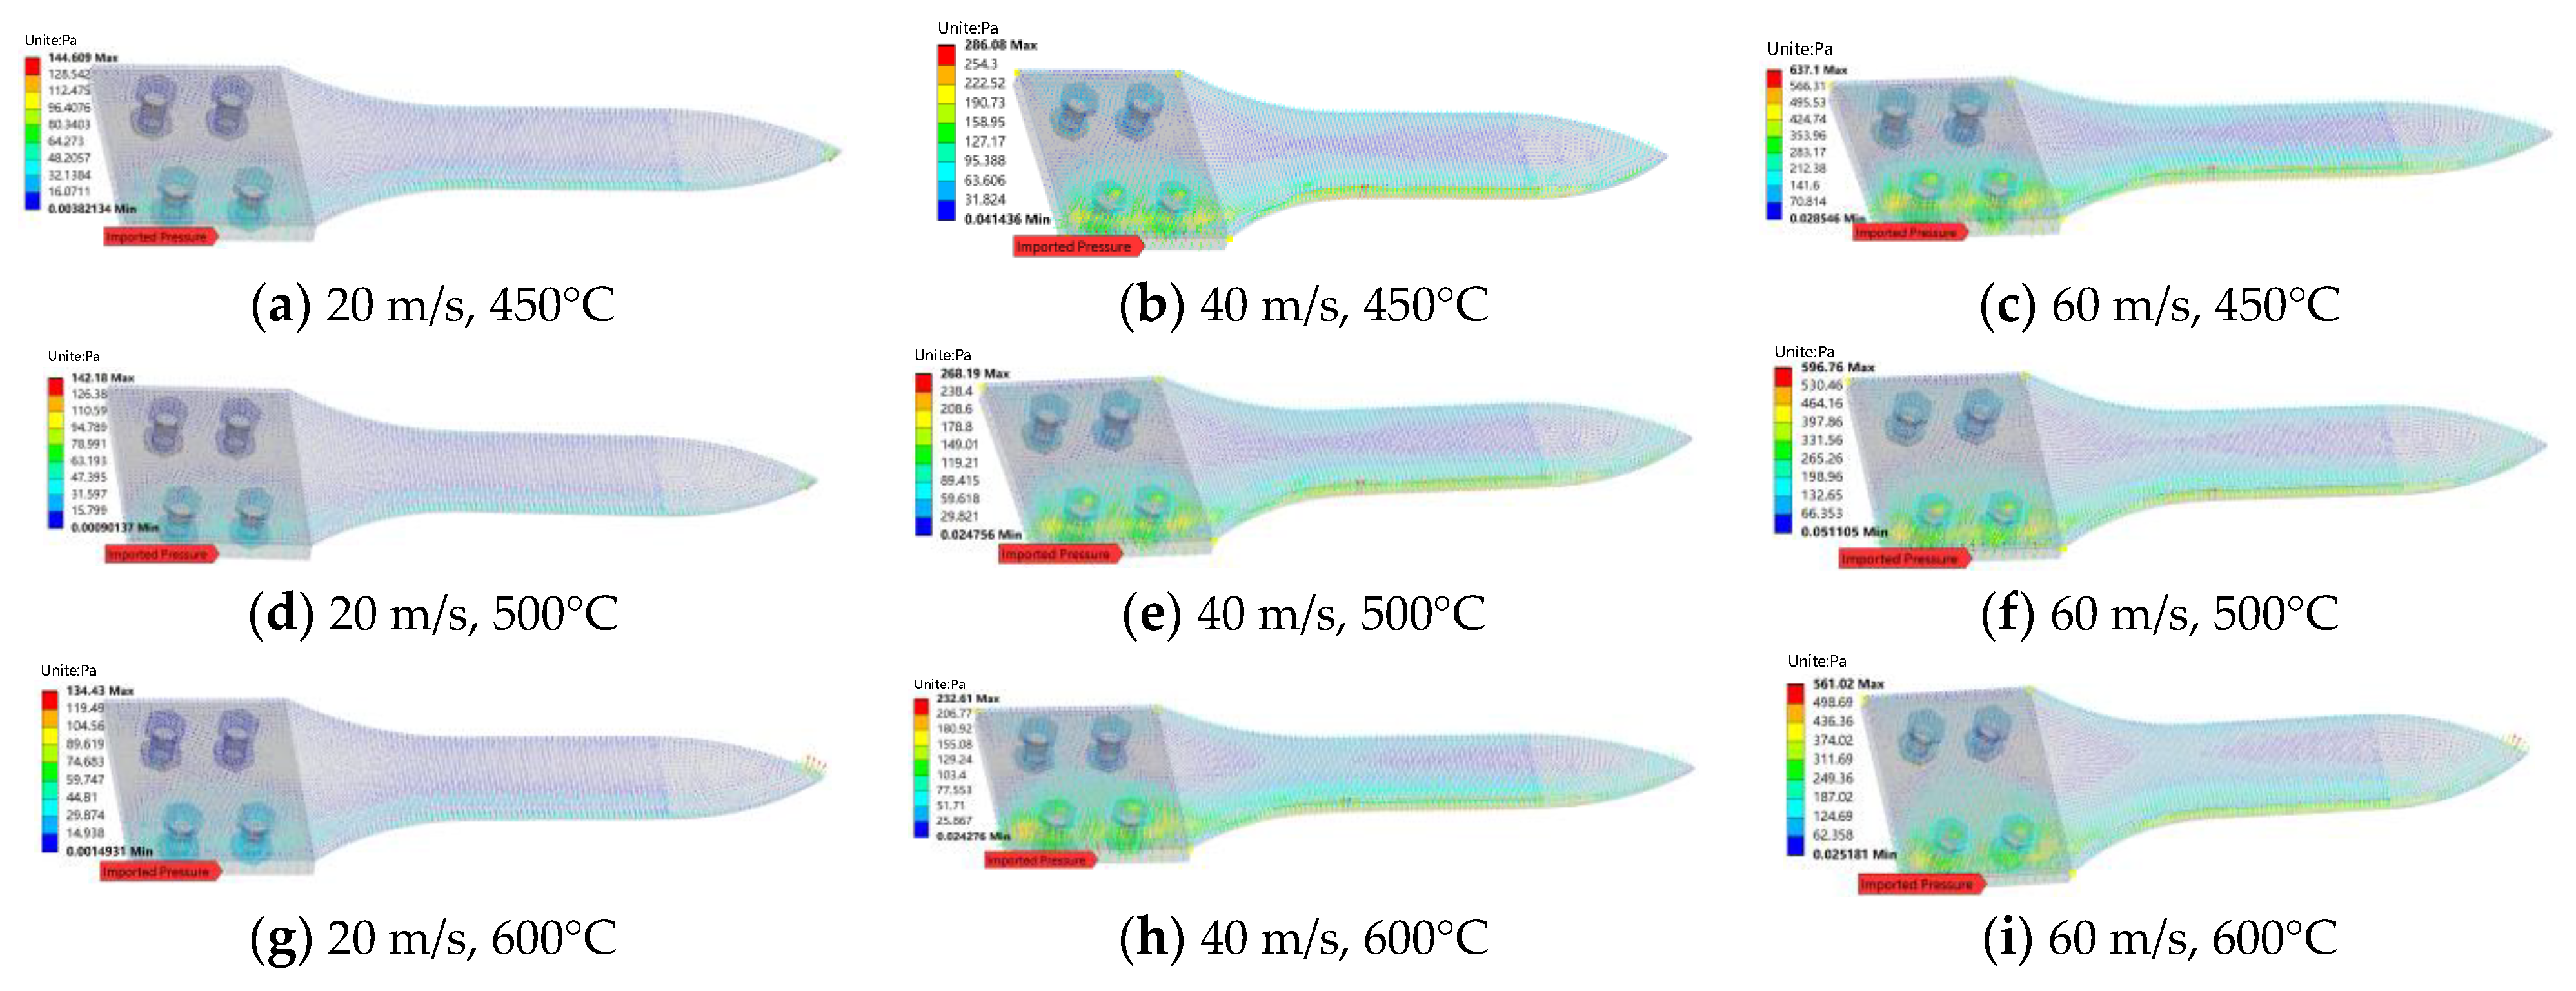
Under the influence of high-speed thermal flow loads, the thin-walled connection structure generates an aerodynamic pressure vector cloud diagram on its surface (Figure 16). The aerodynamic pressure is highest at the entrance of the solid domain, forming a high-pressure region. Due to the discontinuity and mass variation between the test specimen cross-section and the mounting base, the aerodynamic pressure is layered; in this region, it diffuses towards the center. Analysis shows that, at the entrance of the solid domain, high-speed air currents aggregate with a relatively uniform velocity distribution, resulting in a pronounced aerodynamic pressure distribution. As the airflow passes through the central region of the structure to the exit side surface, higher speeds create a low-pressure area.
The aerodynamic pressure pattern correlates with flow speed, observed across temperatures of 450 °C, 500 °C, and 600 °C and at flow speeds ranging from 20 m/s to 60 m/s. It was found that higher flow speed amplifies the aerodynamic pressure regardless of temperature. Furthermore, when the temperature increases at 20 m/s, changing the fluid properties, the surface aerodynamic pressure decreases as the temperature rises from 450 °C to 600 °C, showing a negative correlation. Such behavior suggests that the influence of high-speed hot air flow on aerodynamic pressure should not be underestimated.
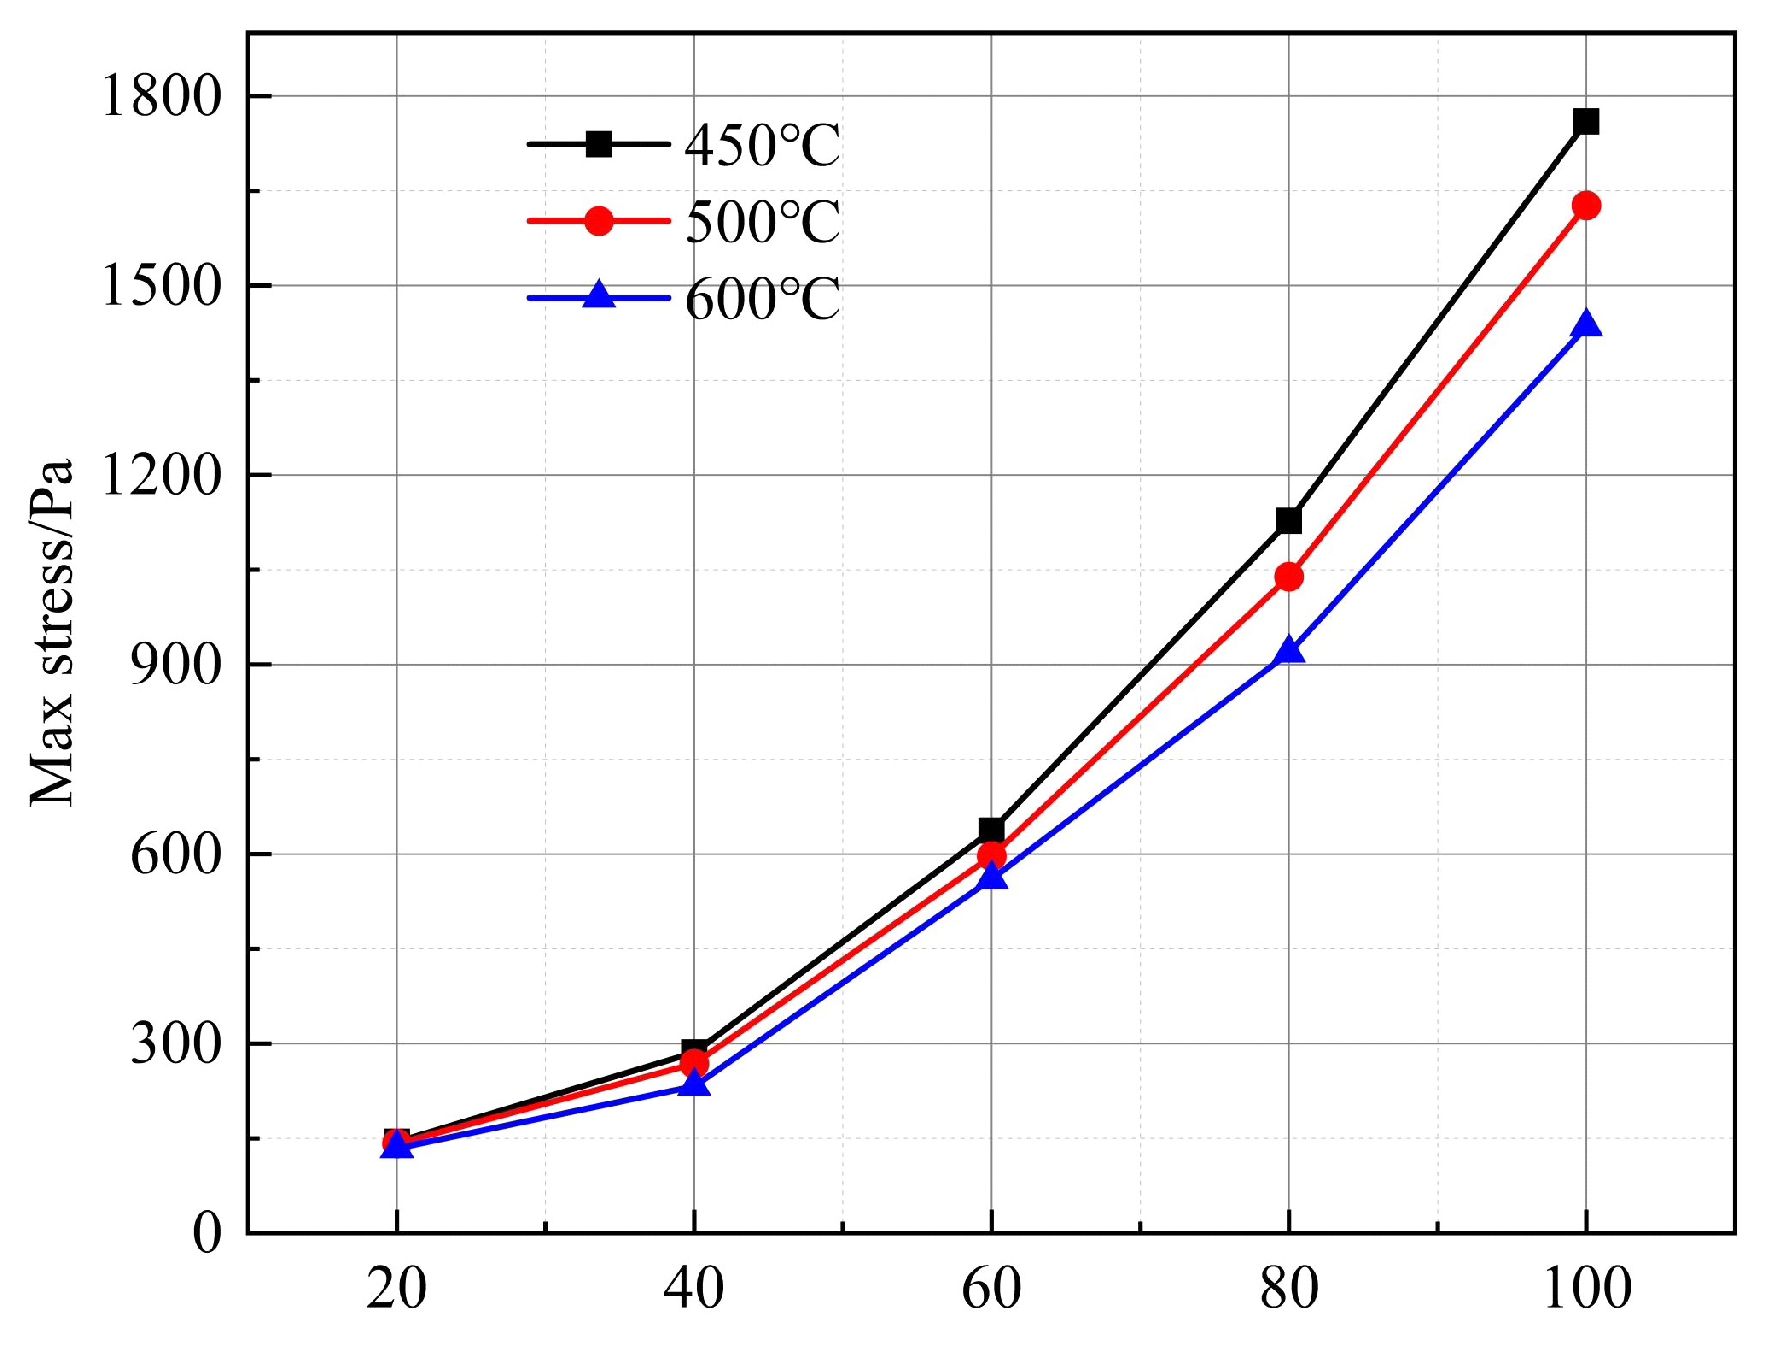
Finally, as shown in Figure 17, at temperatures of 450 °C, 500 °C, and 600 °C, and flow speeds from 20 m/s to 60 m/s, the maximum surface aerodynamic pressures increase by 492.49 Pa, 454.58 Pa, and 426.59 Pa, respectively. They increase with the flow speed; the magnitude of the aerodynamic pressure increase also intensifies.

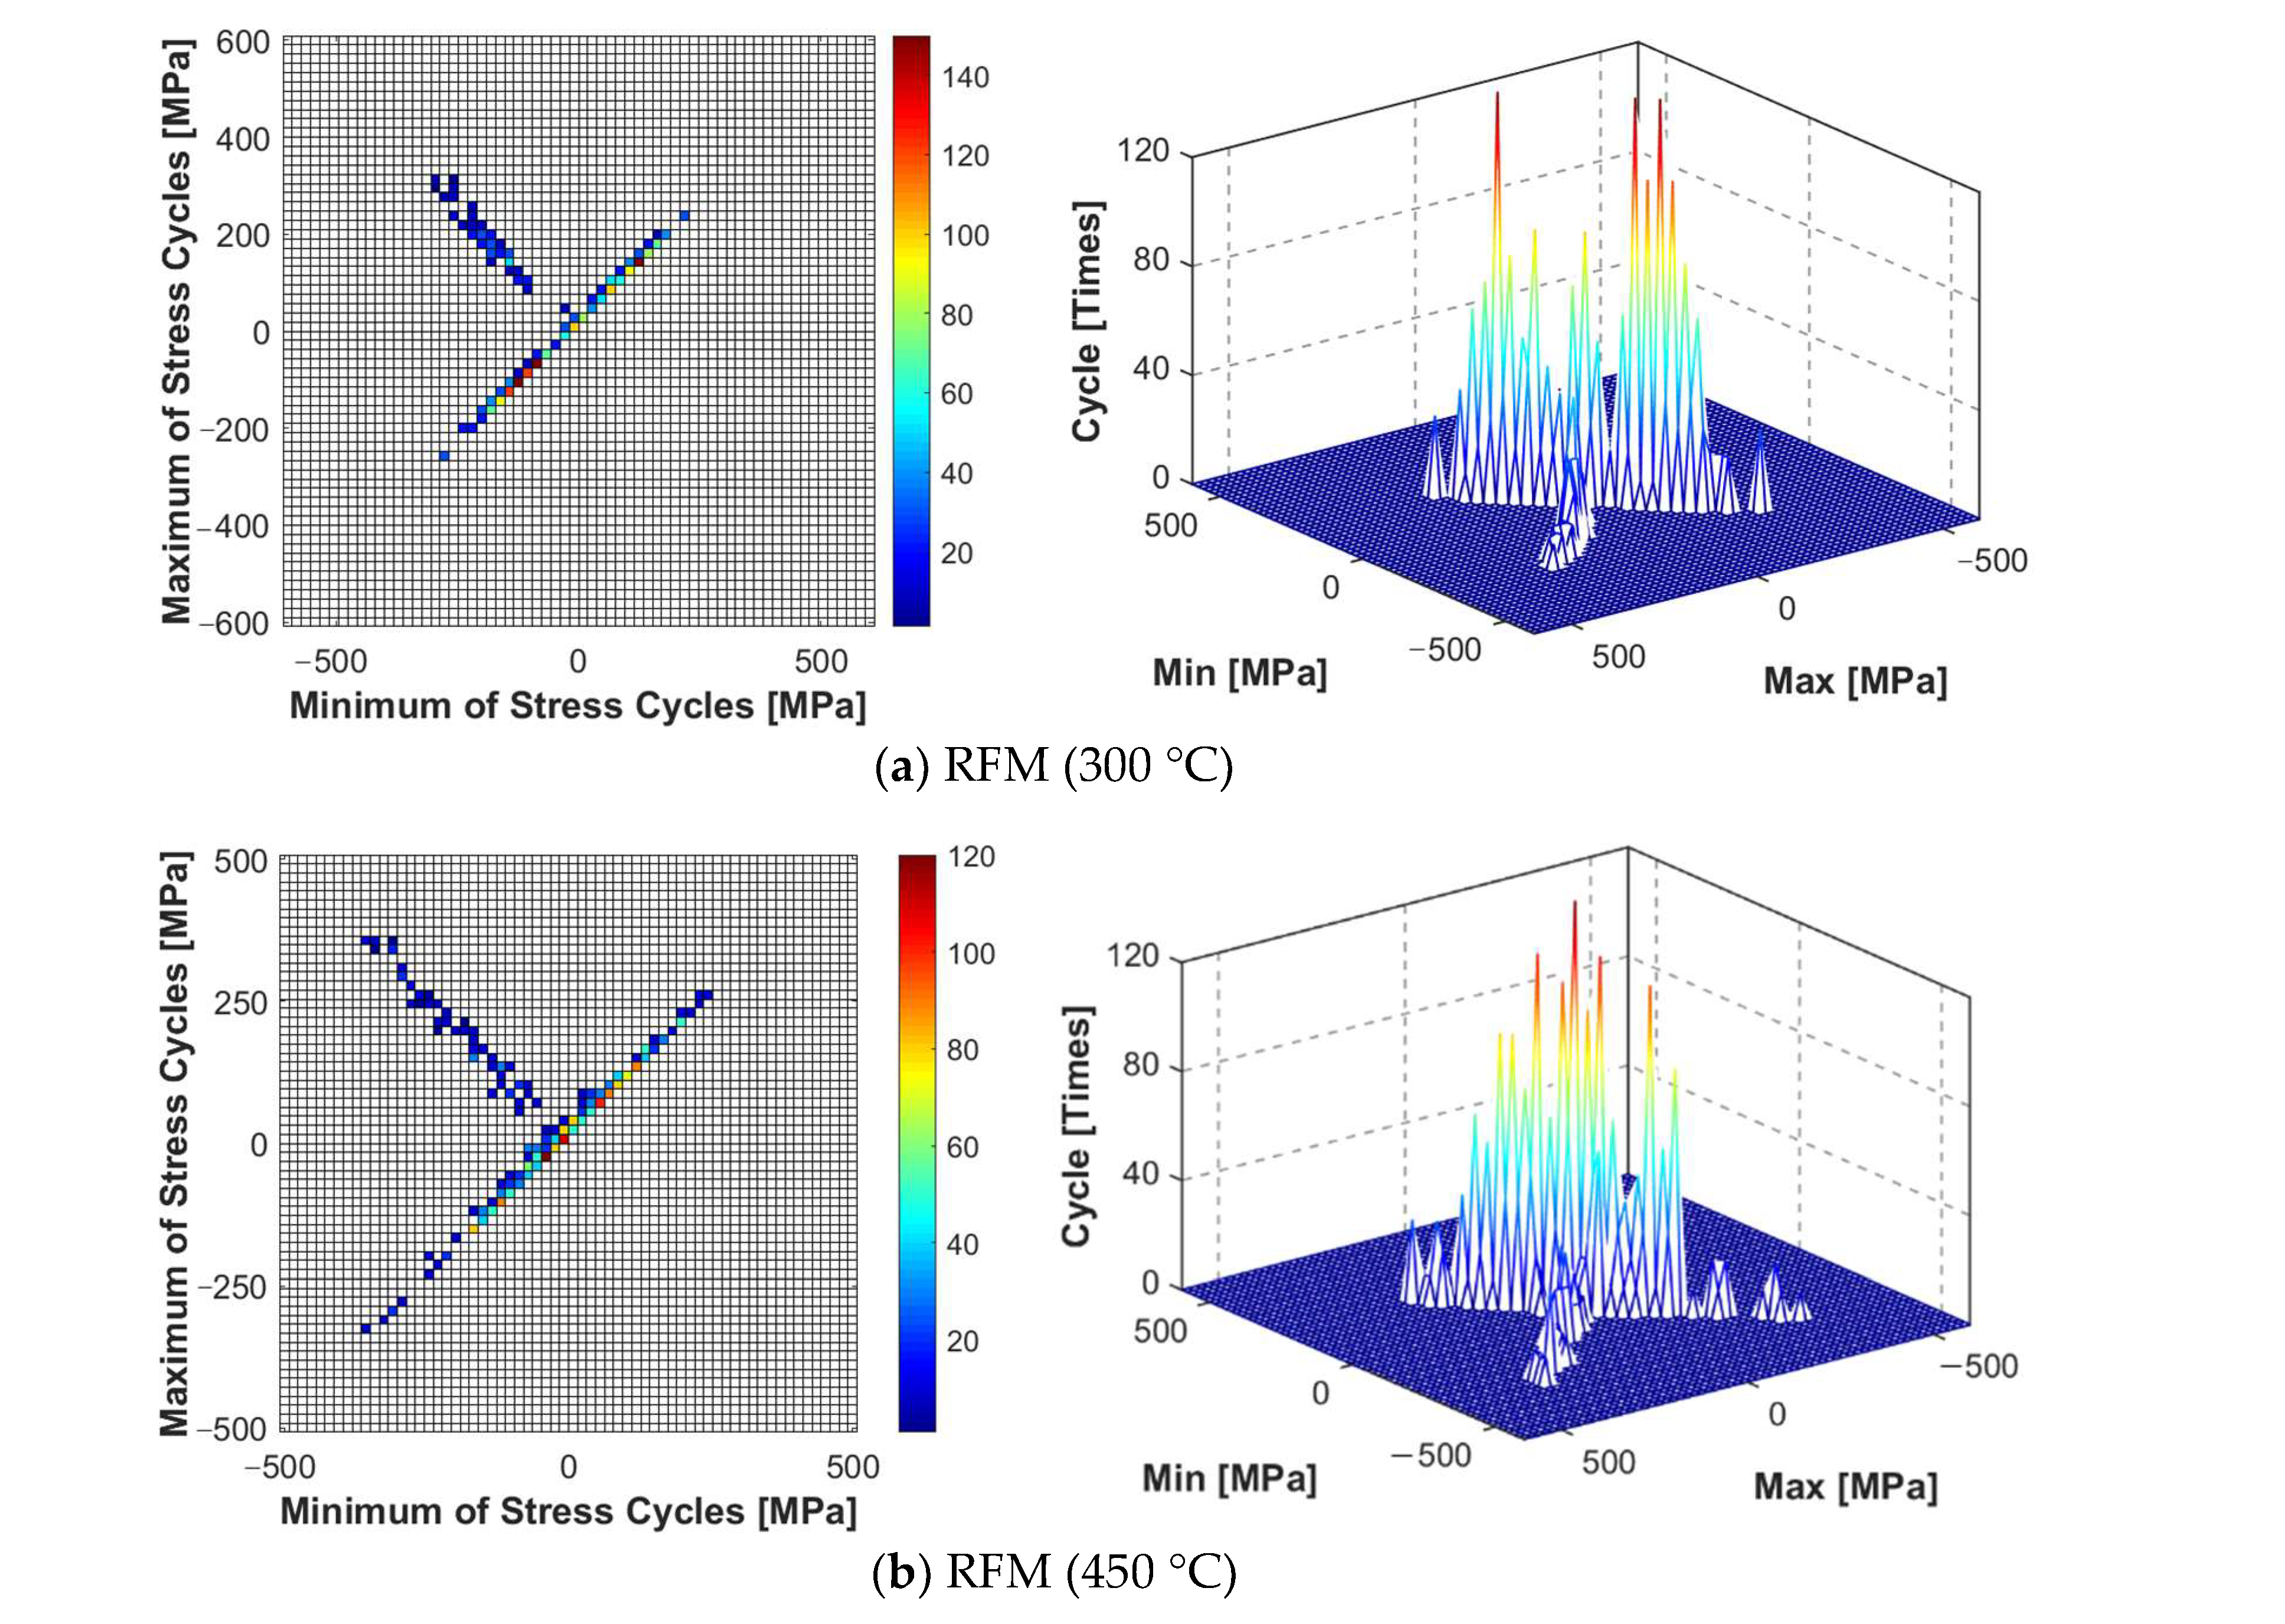
4.2. Change of Peak Stress Response with the Temperature Field
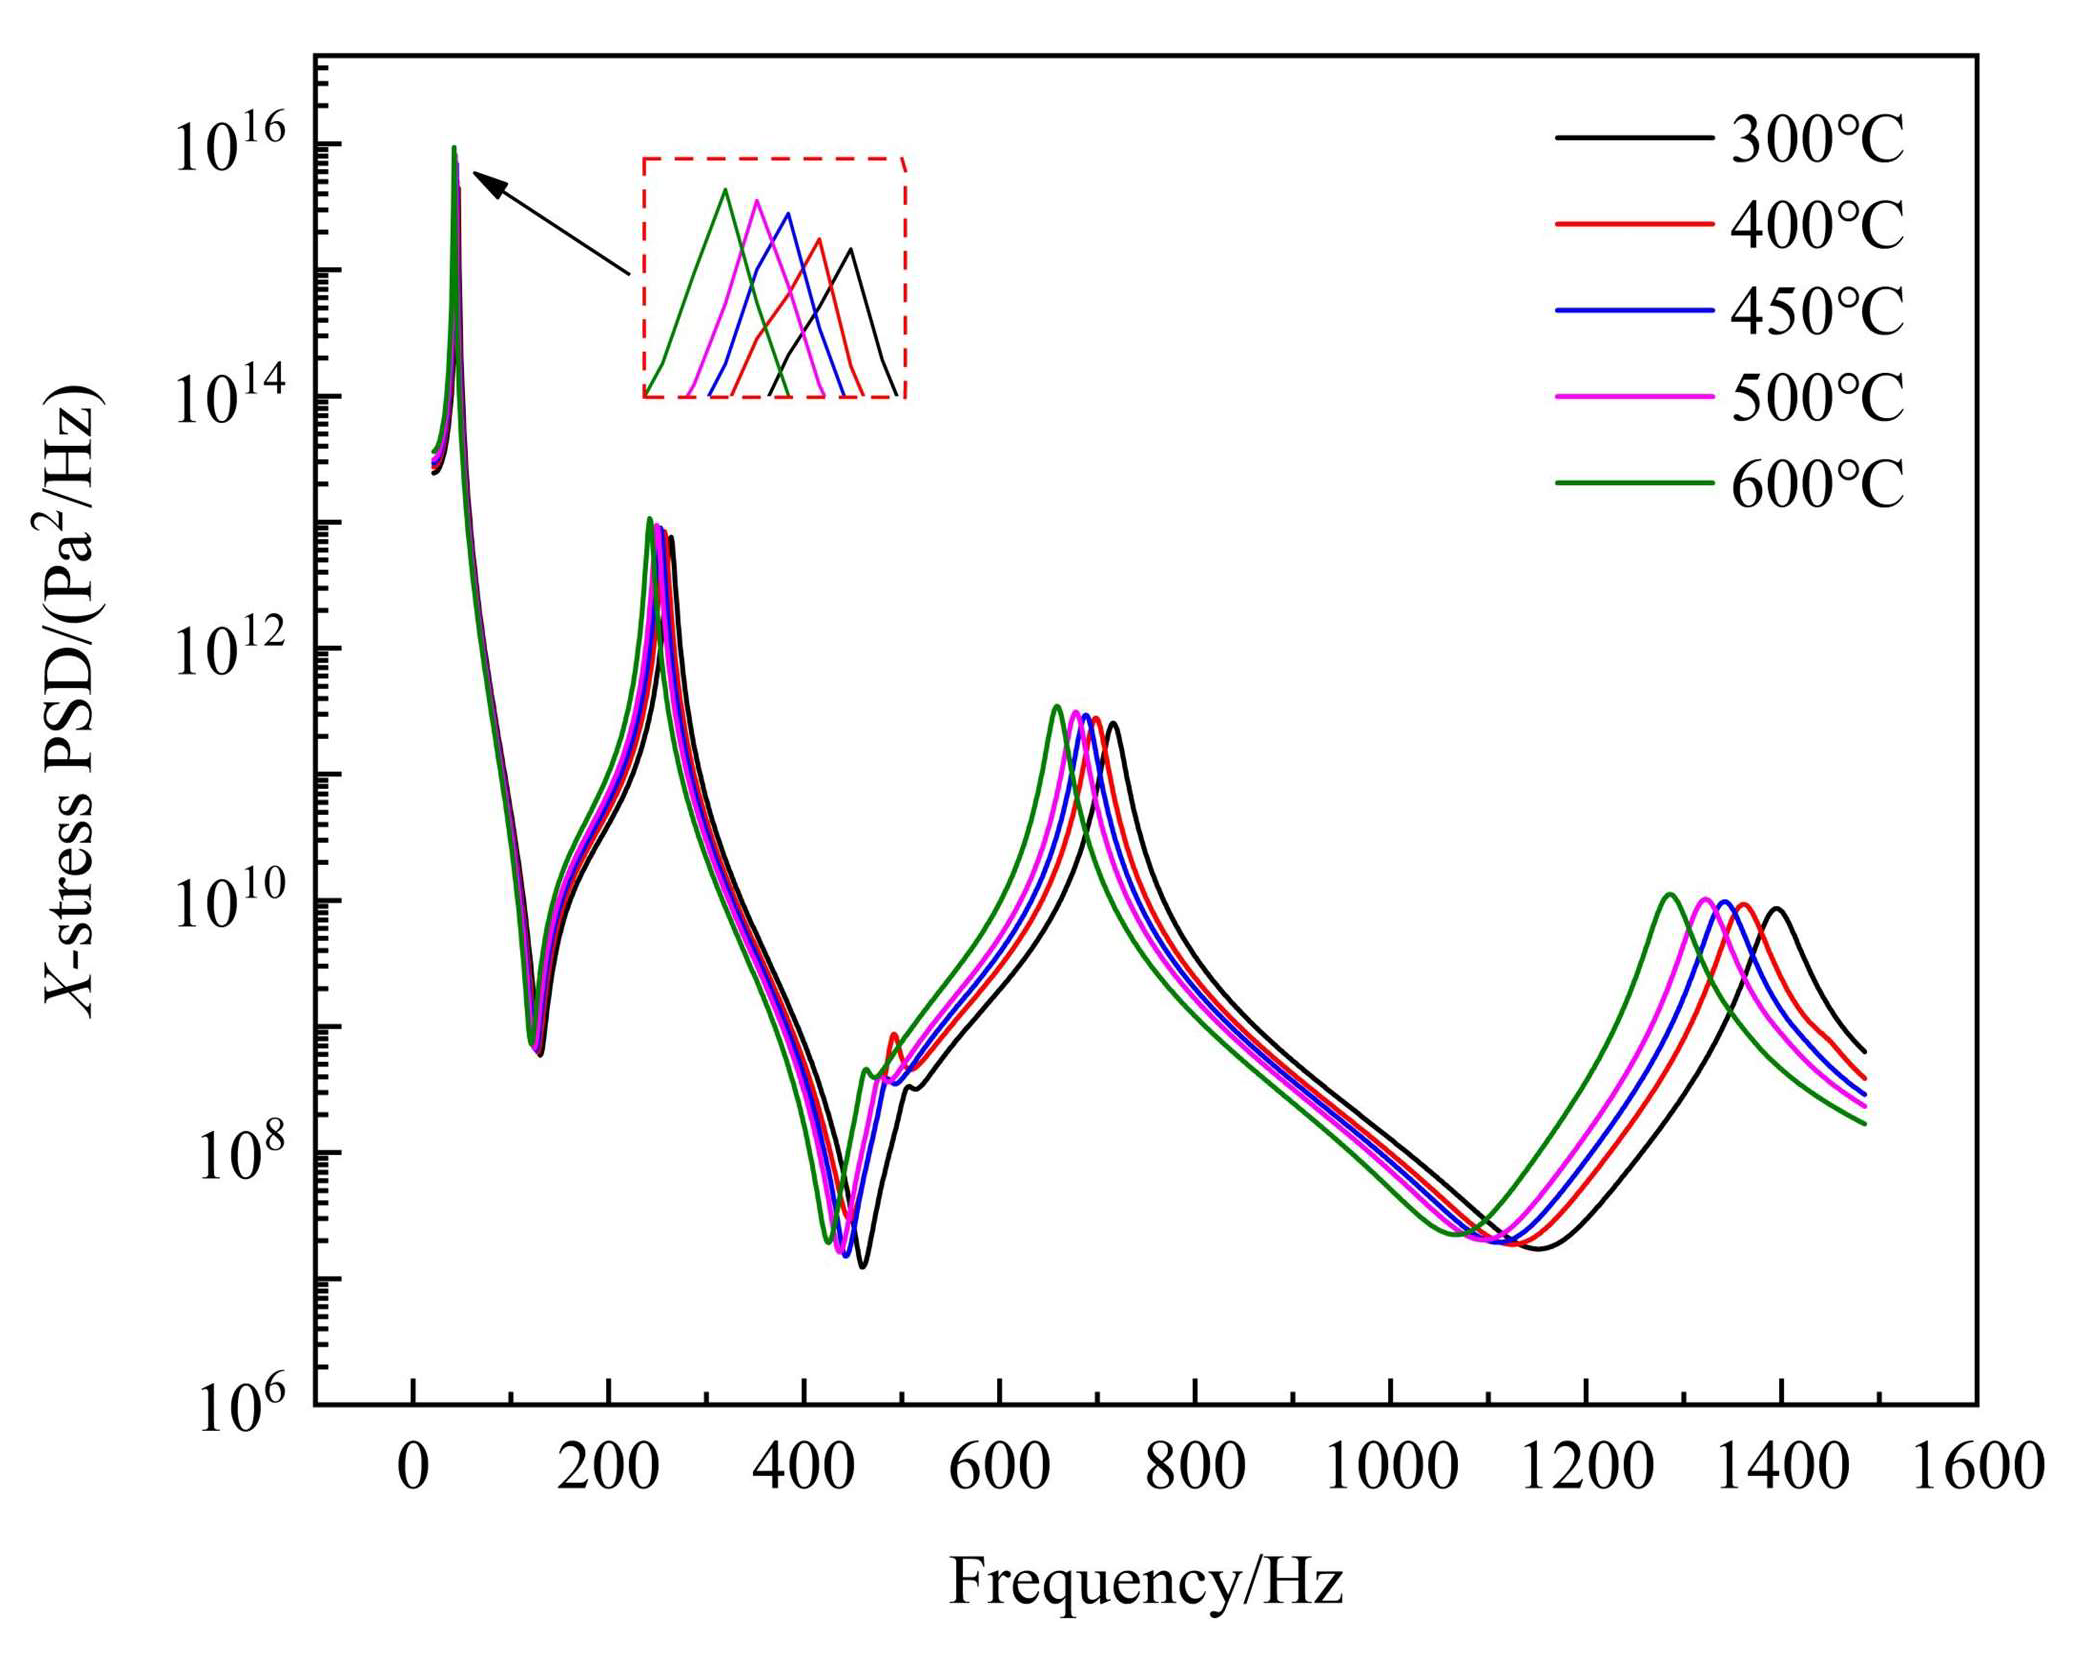
As shown in 
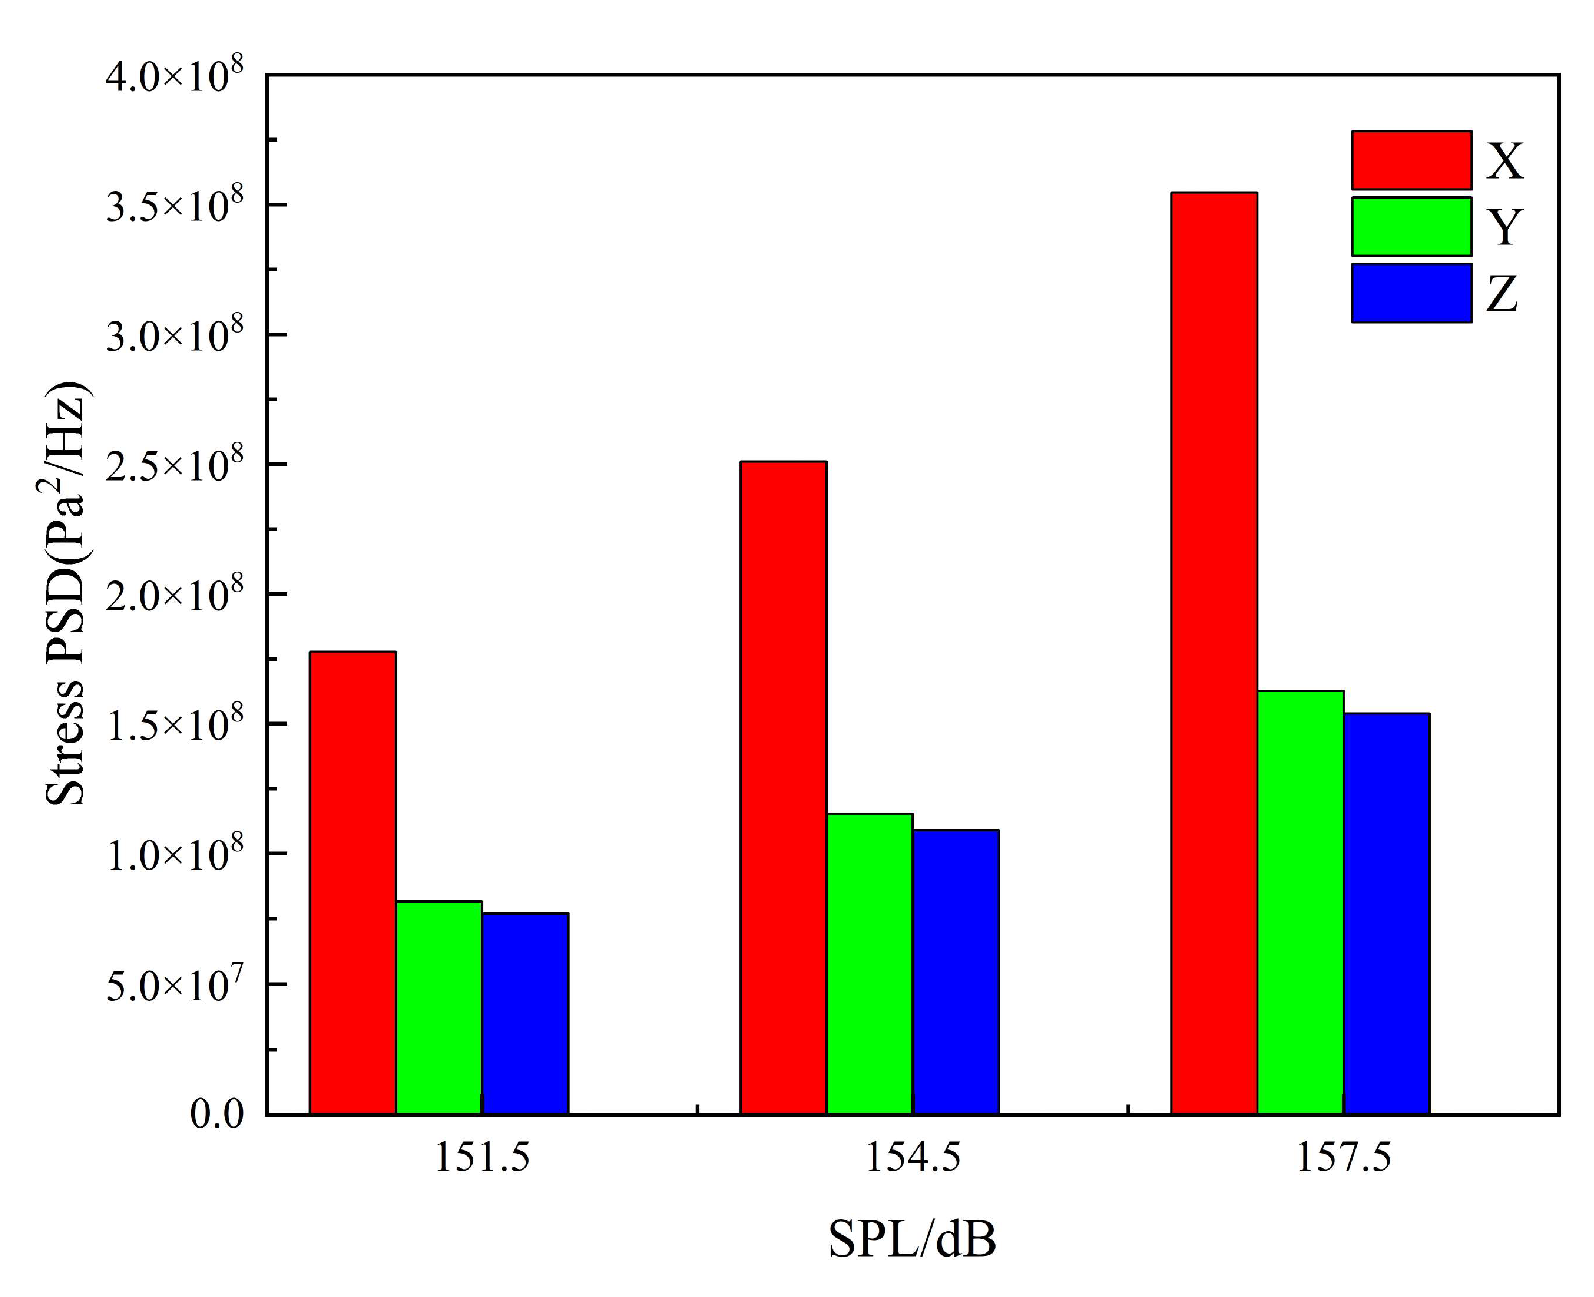
Figure 18, at temperatures between 300 °C and 600 °C, the critical point of the thin-walled connection structure is affected by the X-direction stress. The power spectral density response peaks are primarily concentrated near the first natural frequency. Additionally, the first response value is significantly greater than the high-frequency responses of other orders, indicating that the connection structure might undergo resonance at lower frequencies, potentially causing fracture failure.
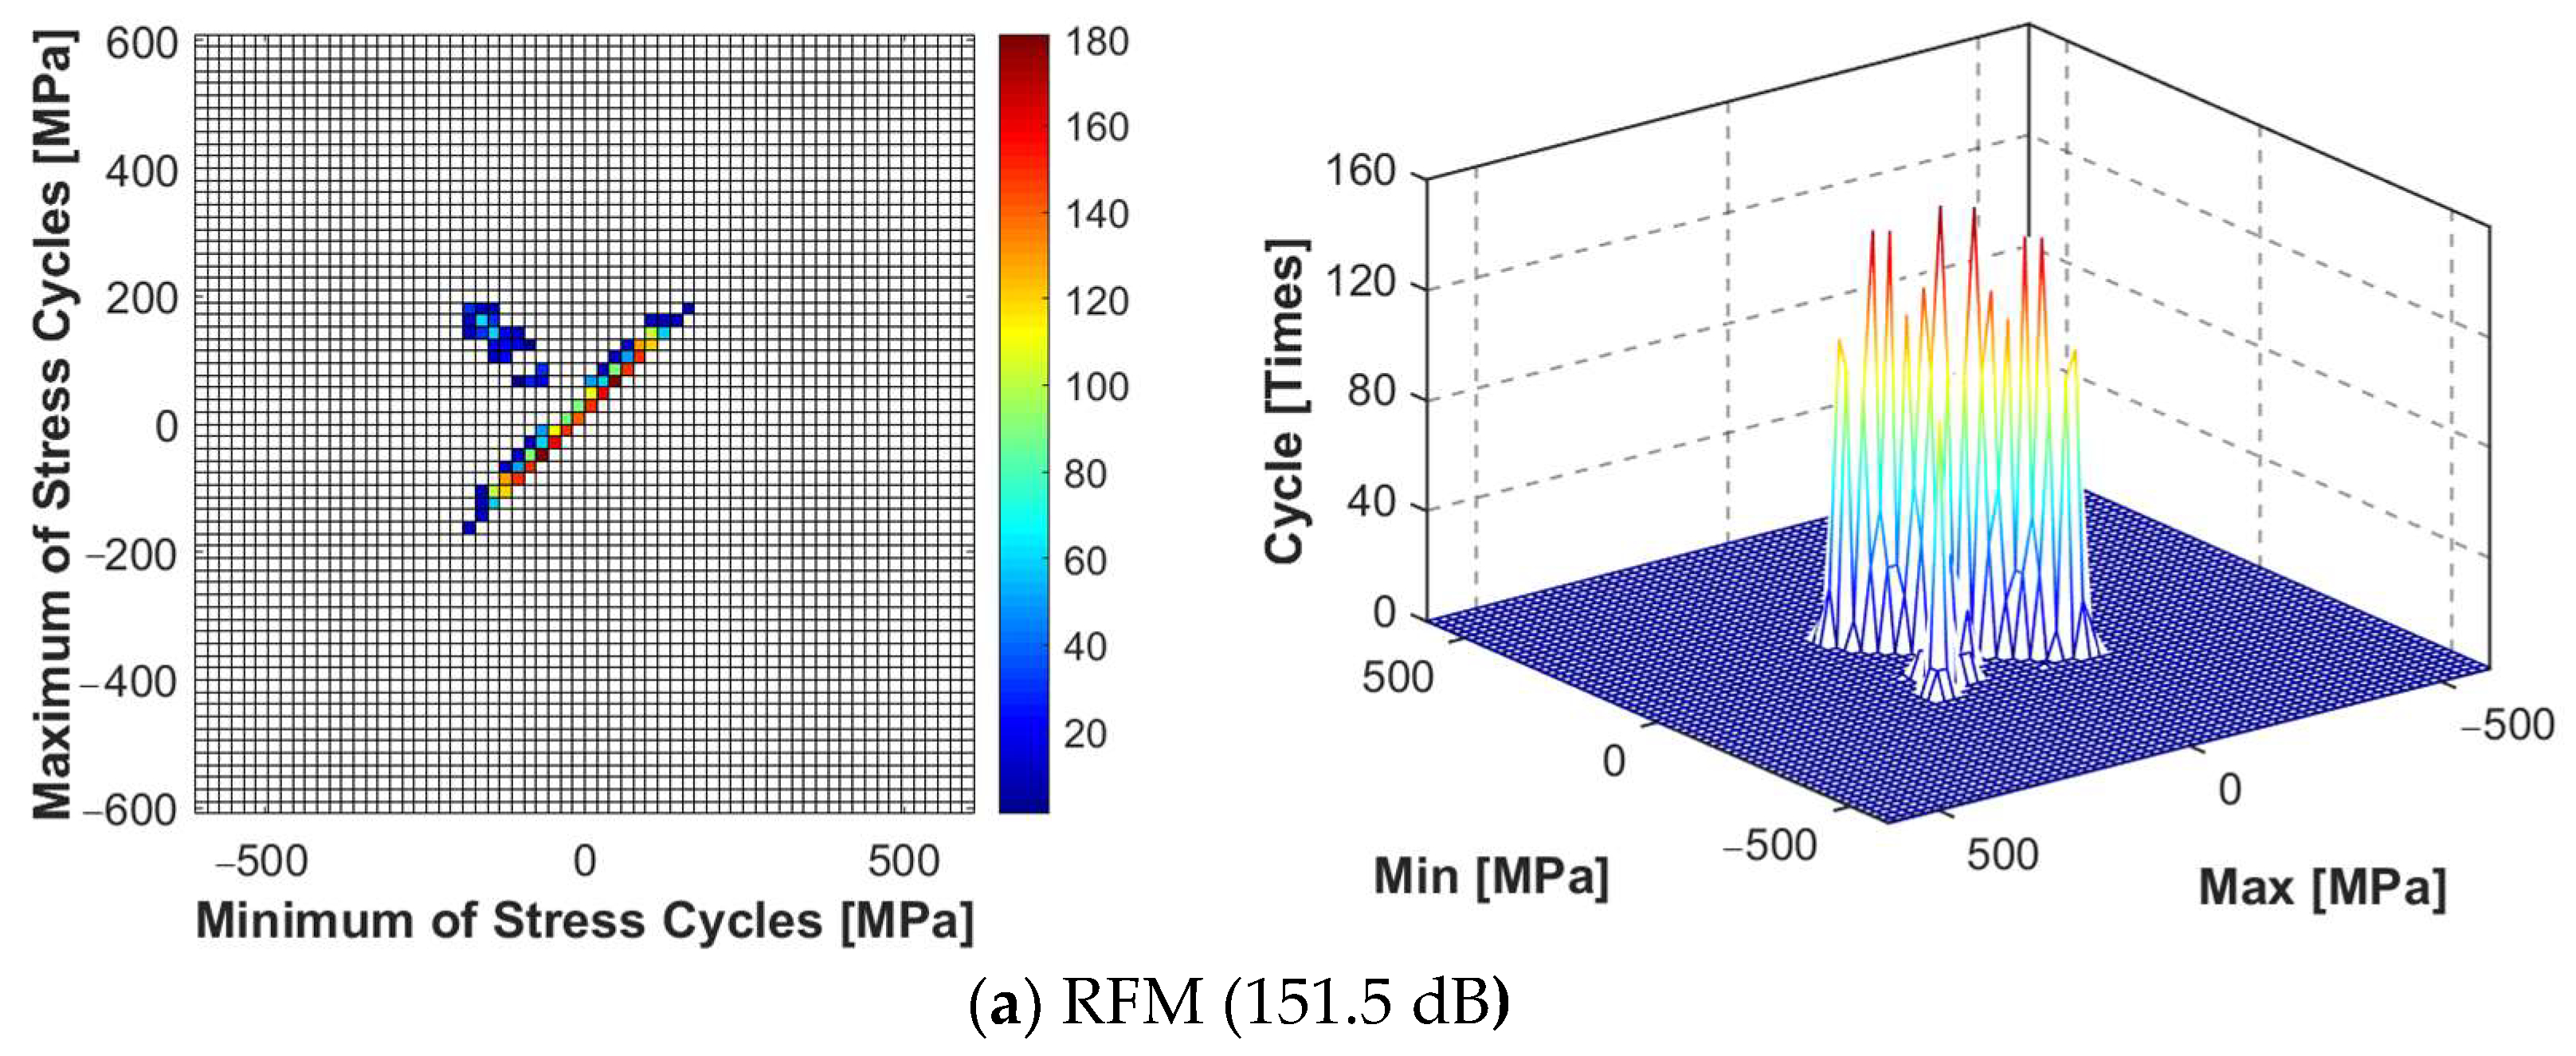
Under 20 m/s airflow, using Gaussian white noise, and wave loading with a sound pressure level of 154.5 dB, the X-direction stress power spectral density response peak is 4.45 × 10¹⁵ Pa2/Hz at 300 °C. Its value at 400 °C is 5.4 × 10¹⁵ Pa2/Hz, 6.98 × 10¹⁵ Pa2/Hz at 450 °C, 8.18 × 10¹⁵ Pa2/Hz at 500 °C, and 9.4 × 10¹⁵ Pa2/Hz at 600 °C. The response peak increases by a factor of 2.11 when moving from 300 °C to 600 °C.
For the same fluid speed and sound pressure, the connection structure response is positively correlated with temperature changes. Since the structure is in a pre-buckling state, as the temperature rises, the structure softens, decreasing the stiffness. Simultaneously, the resonance frequency decreases, causing the peak response curve frequency to shift leftwards. Furthermore, one end of the thin-walled structure is constrained by bolt connections, while the other has greater degrees of freedom due to free boundary conditions, making it less prone to thermal buckling. Additionally, GH188 exhibits excellent heat resistance. For these reasons, the thin-walled connection structure is in a softened state when subjected to a high-speed thermal fluid environment. With an increase in temperature, the response frequencies of the structure decrease, leading to significant nonlinear dynamic responses.

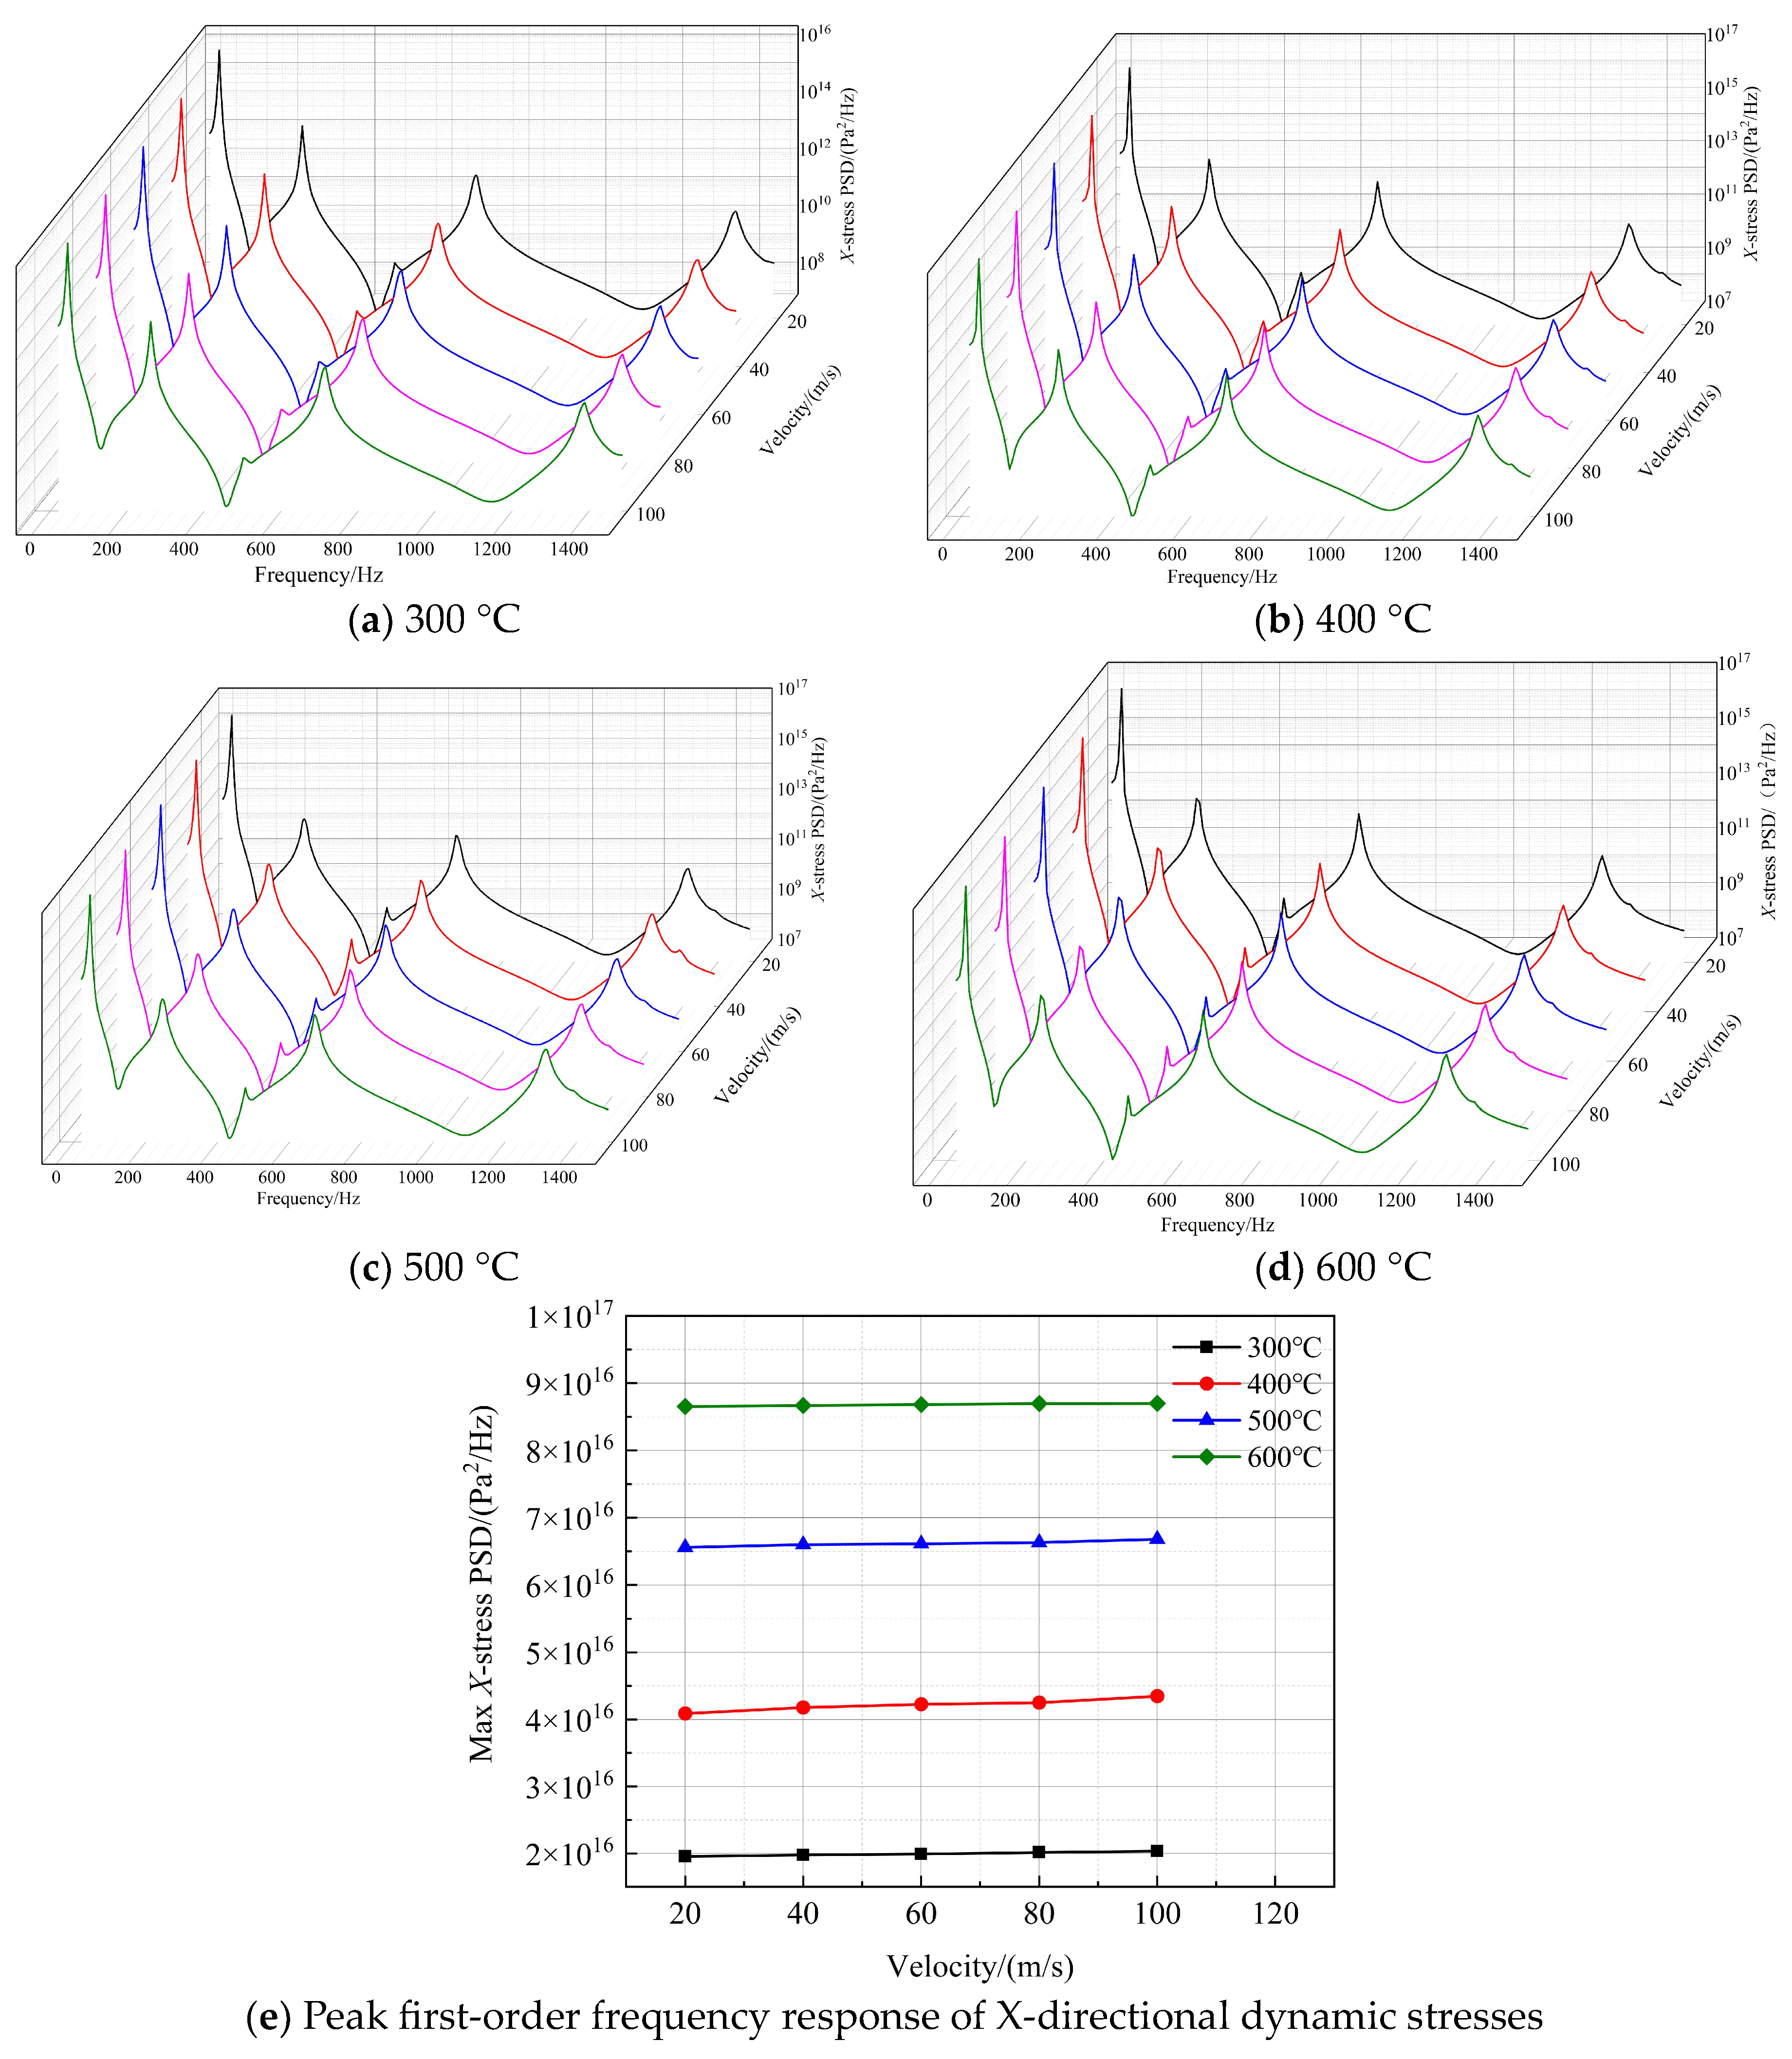
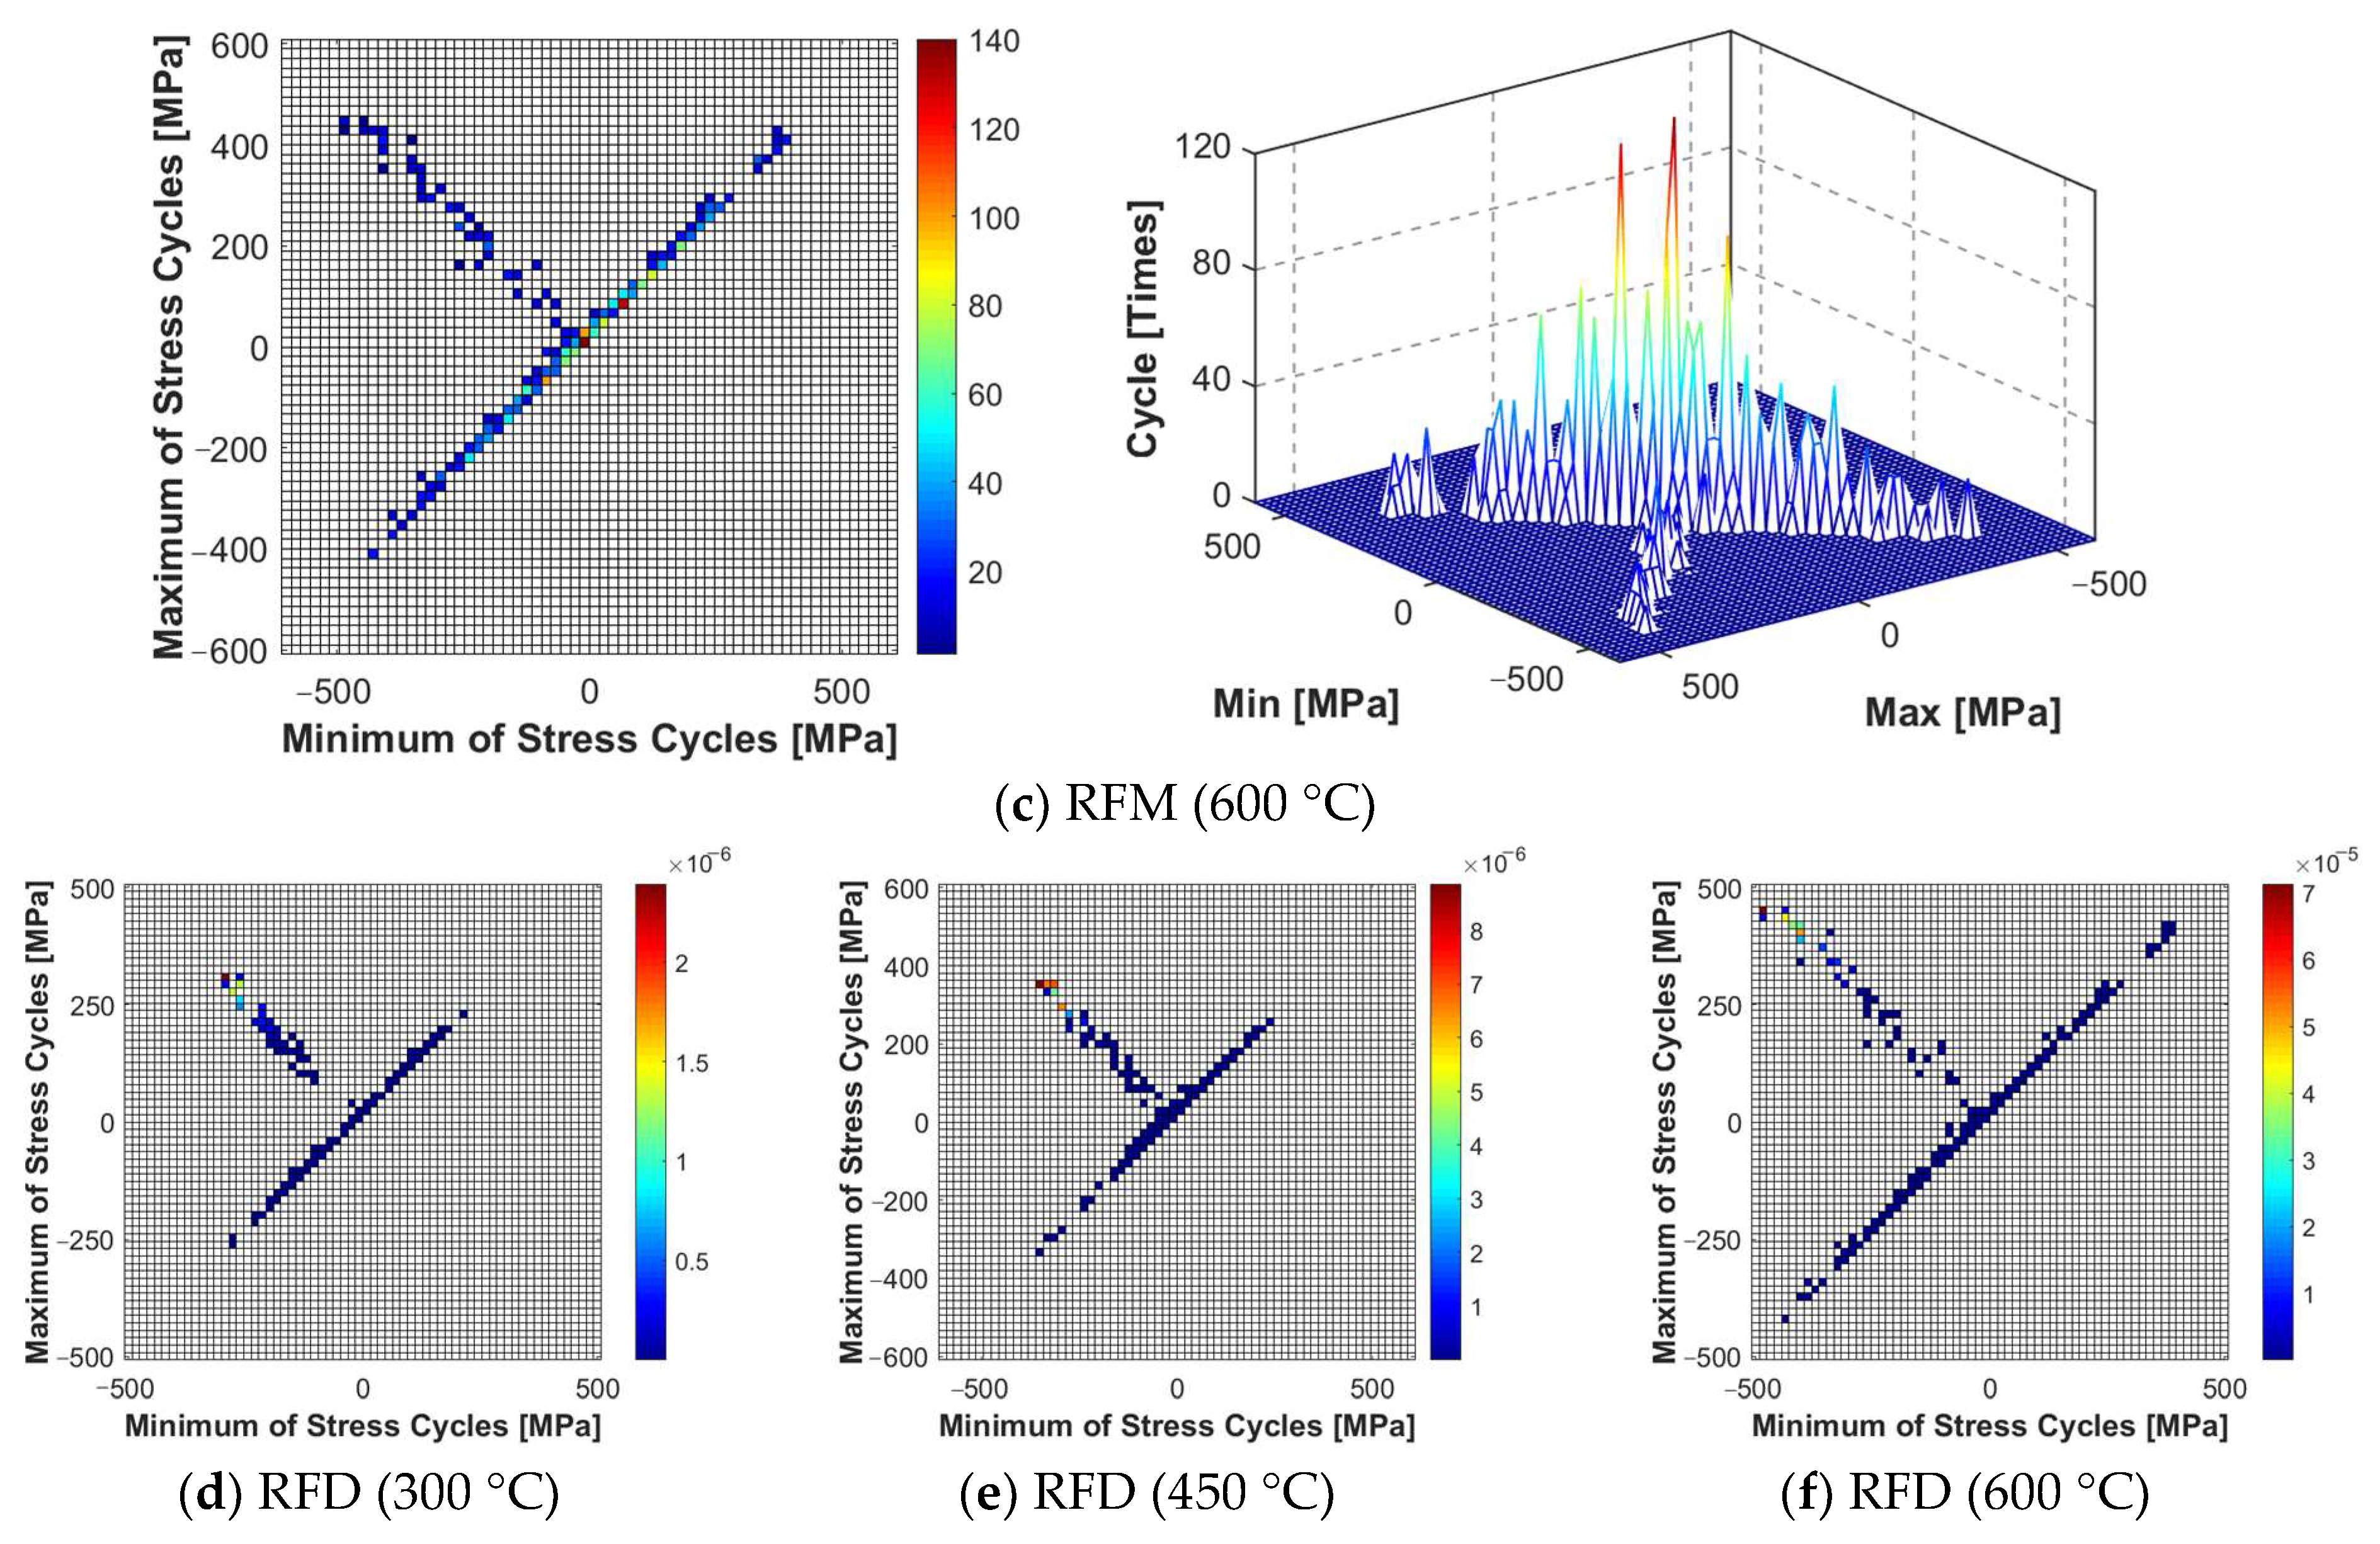
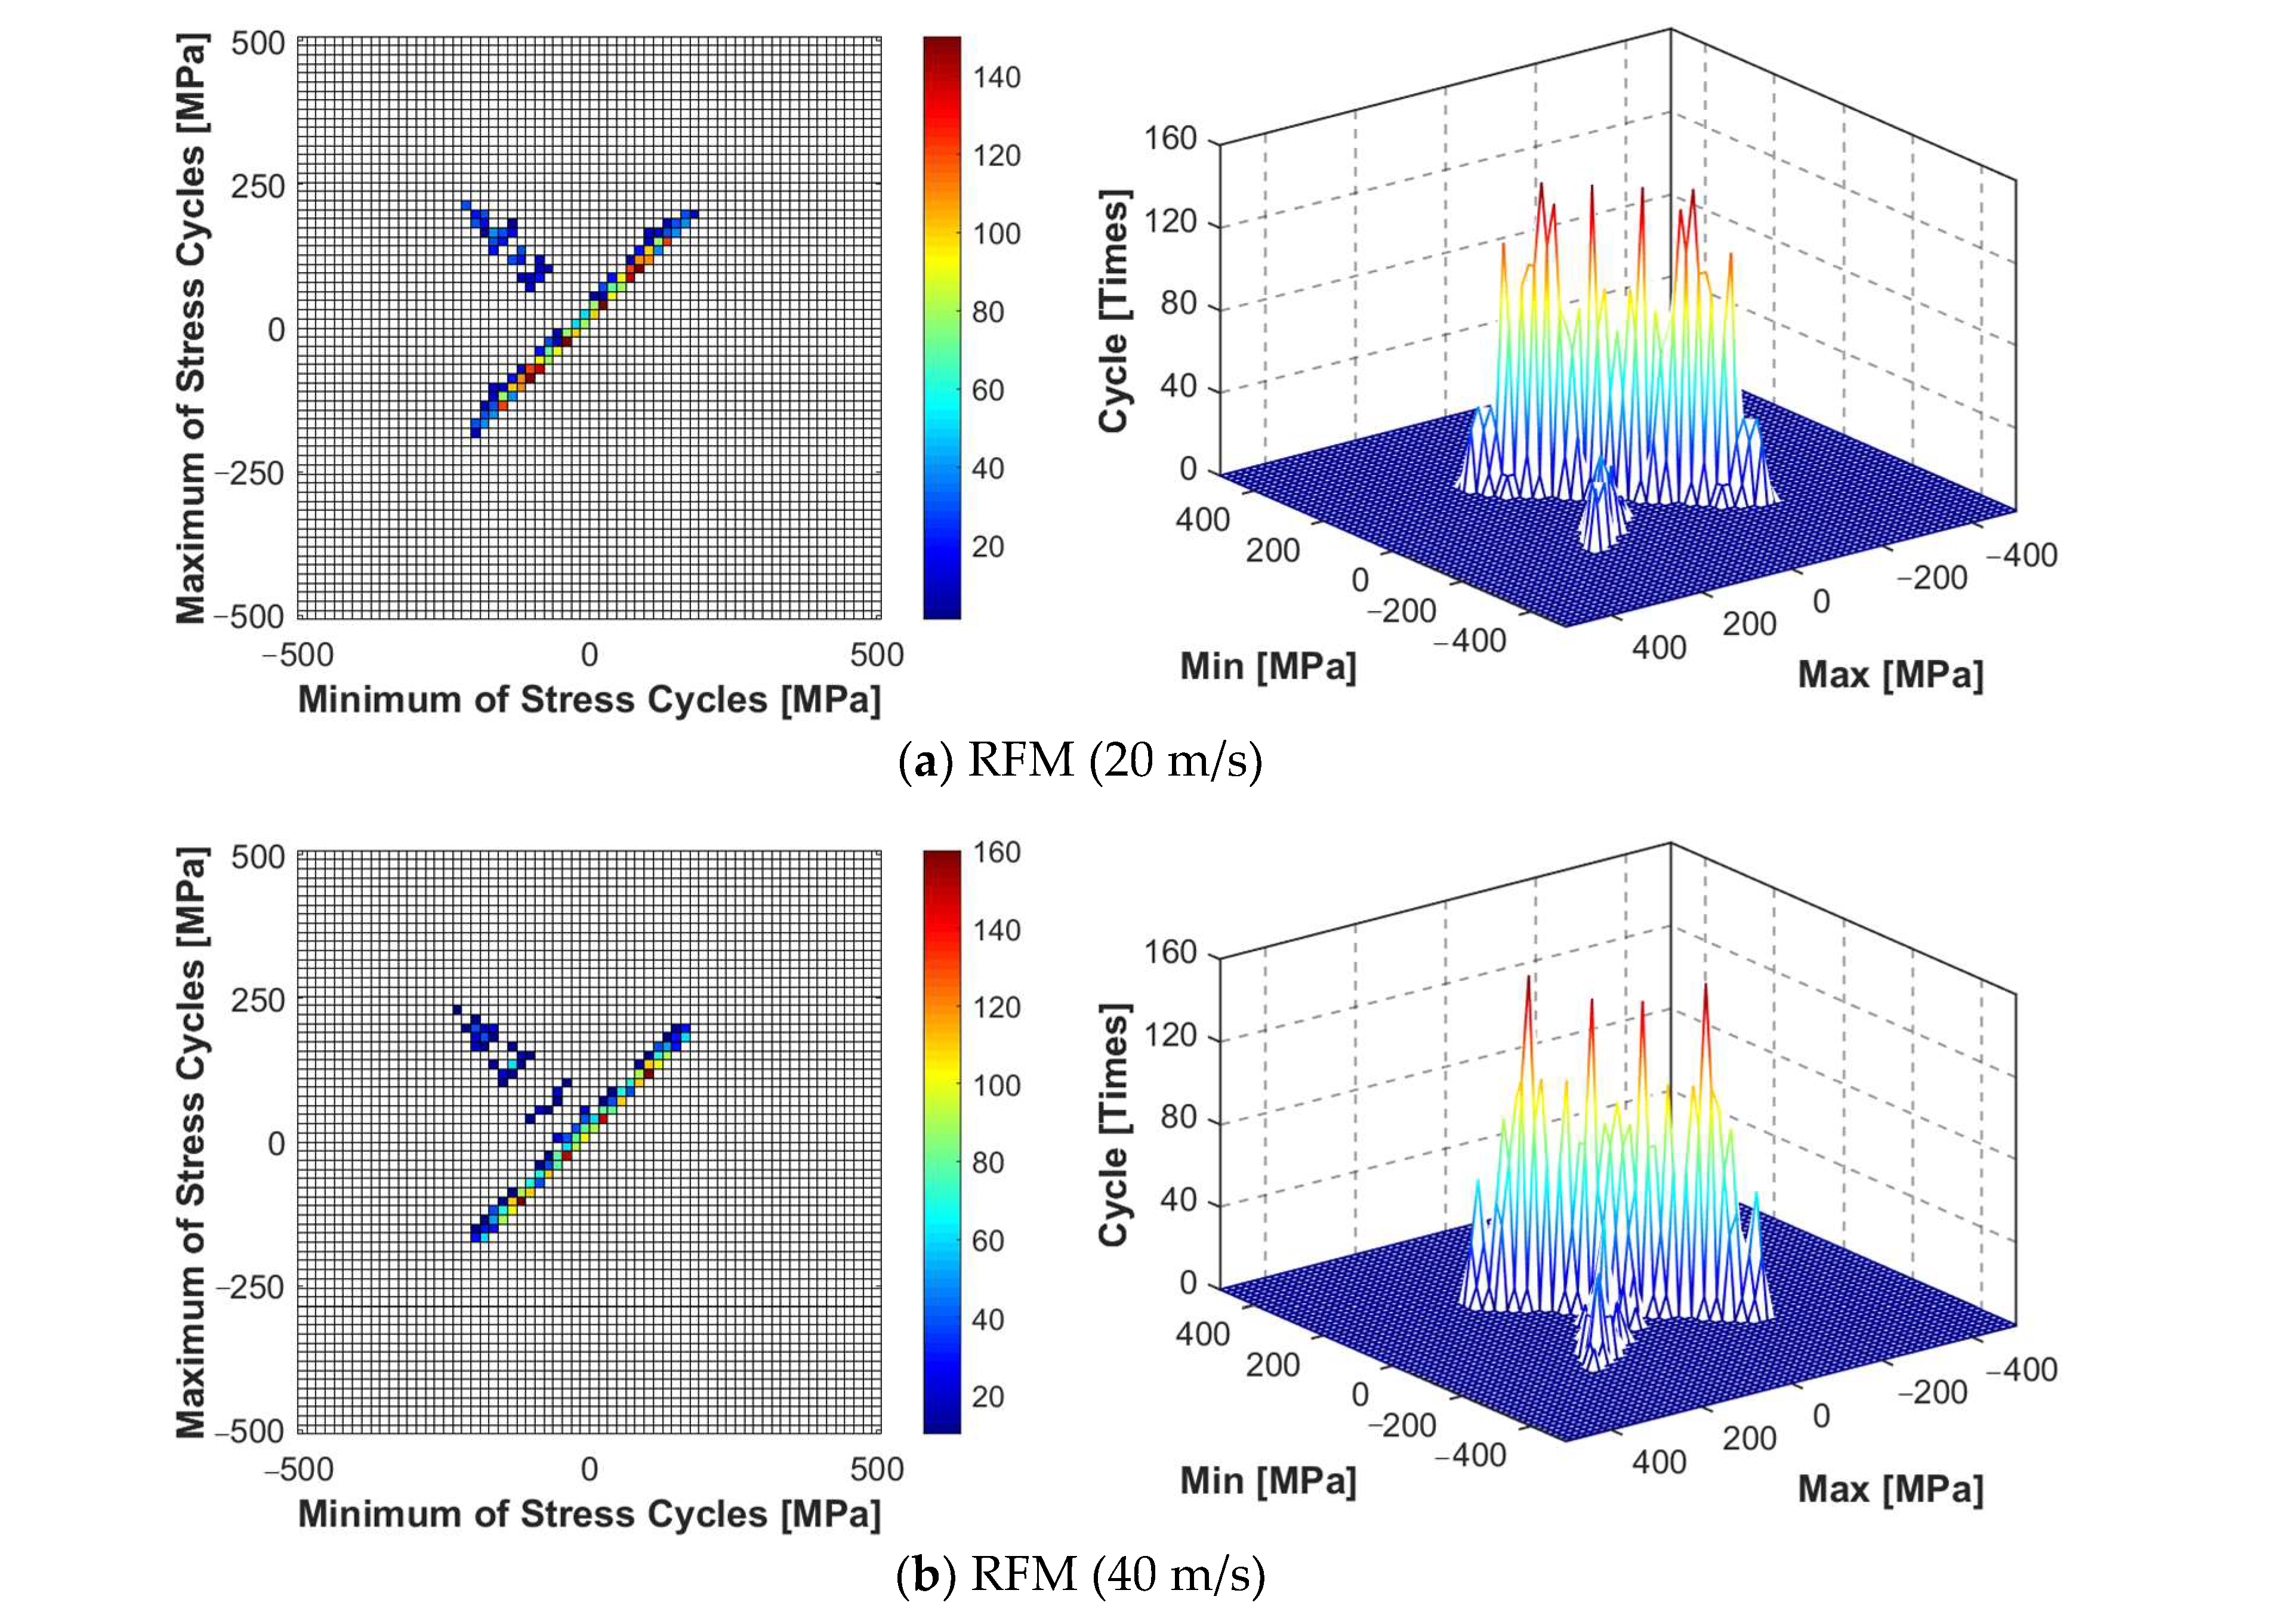
4.3. Change of Peak Stress Response with the Fluid Field

To analyze the variation in structural stress response peaks between 20 m/s and 60 m/s, sound loads at a sound pressure level of 154.5 dB were applied at 300 °C, 400 °C, 500 °C, and 600 °C. The X-direction stress power spectral density response peaks of the thin-walled connection structure are presented in Figure 19. At 300 °C and airflow speeds of 20 m/s, 40 m/s, and 60 m/s, the X-direction stress power spectral density response peaks are 1.96 × 10¹⁶ Pa2/Hz, 1.98 × 10¹⁶ Pa2/Hz, and 1.99 × 10¹⁶ Pa2/Hz, respectively, showing a marginal difference of 0.03 Pa2/Hz across these airflow speeds.
Similarly, at 400 °C and airflow speeds from 20 m/s to 60 m/s, the X-direction stress power spectral density peaks are 4.09 × 10¹⁶ Pa2/Hz, 4.18 × 10¹⁶ Pa2/Hz, and 4.23 × 10¹⁶ Pa2/Hz, respectively, with a difference of 0.14 Pa2/Hz. Further, at 500 °C, their values are 6.56 × 10¹⁶ Pa2/Hz, 6.60 × 10¹⁶ Pa2/Hz, and 6.61 × 10¹⁶ Pa2/Hz, with a difference of 0.05 Pa2/Hz. Finally, at 600 °C, the X-direction stress power spectral density peaks are 8.65 × 10¹⁶ Pa2/Hz, 8.67 × 10¹⁶ Pa2/Hz, and 8.68 × 10¹⁶ Pa2/Hz for the same airflow speeds; the difference is 0.03 Pa2/Hz. After comparing graphs (a) to (d), it is evident that the X-direction stress response variation trend of the thin-walled connection structure under the same temperature conditions is similar at different airflow speeds. This implies that the stress response peak of the thin-walled connection structure is not significantly affected by airflow field changes.

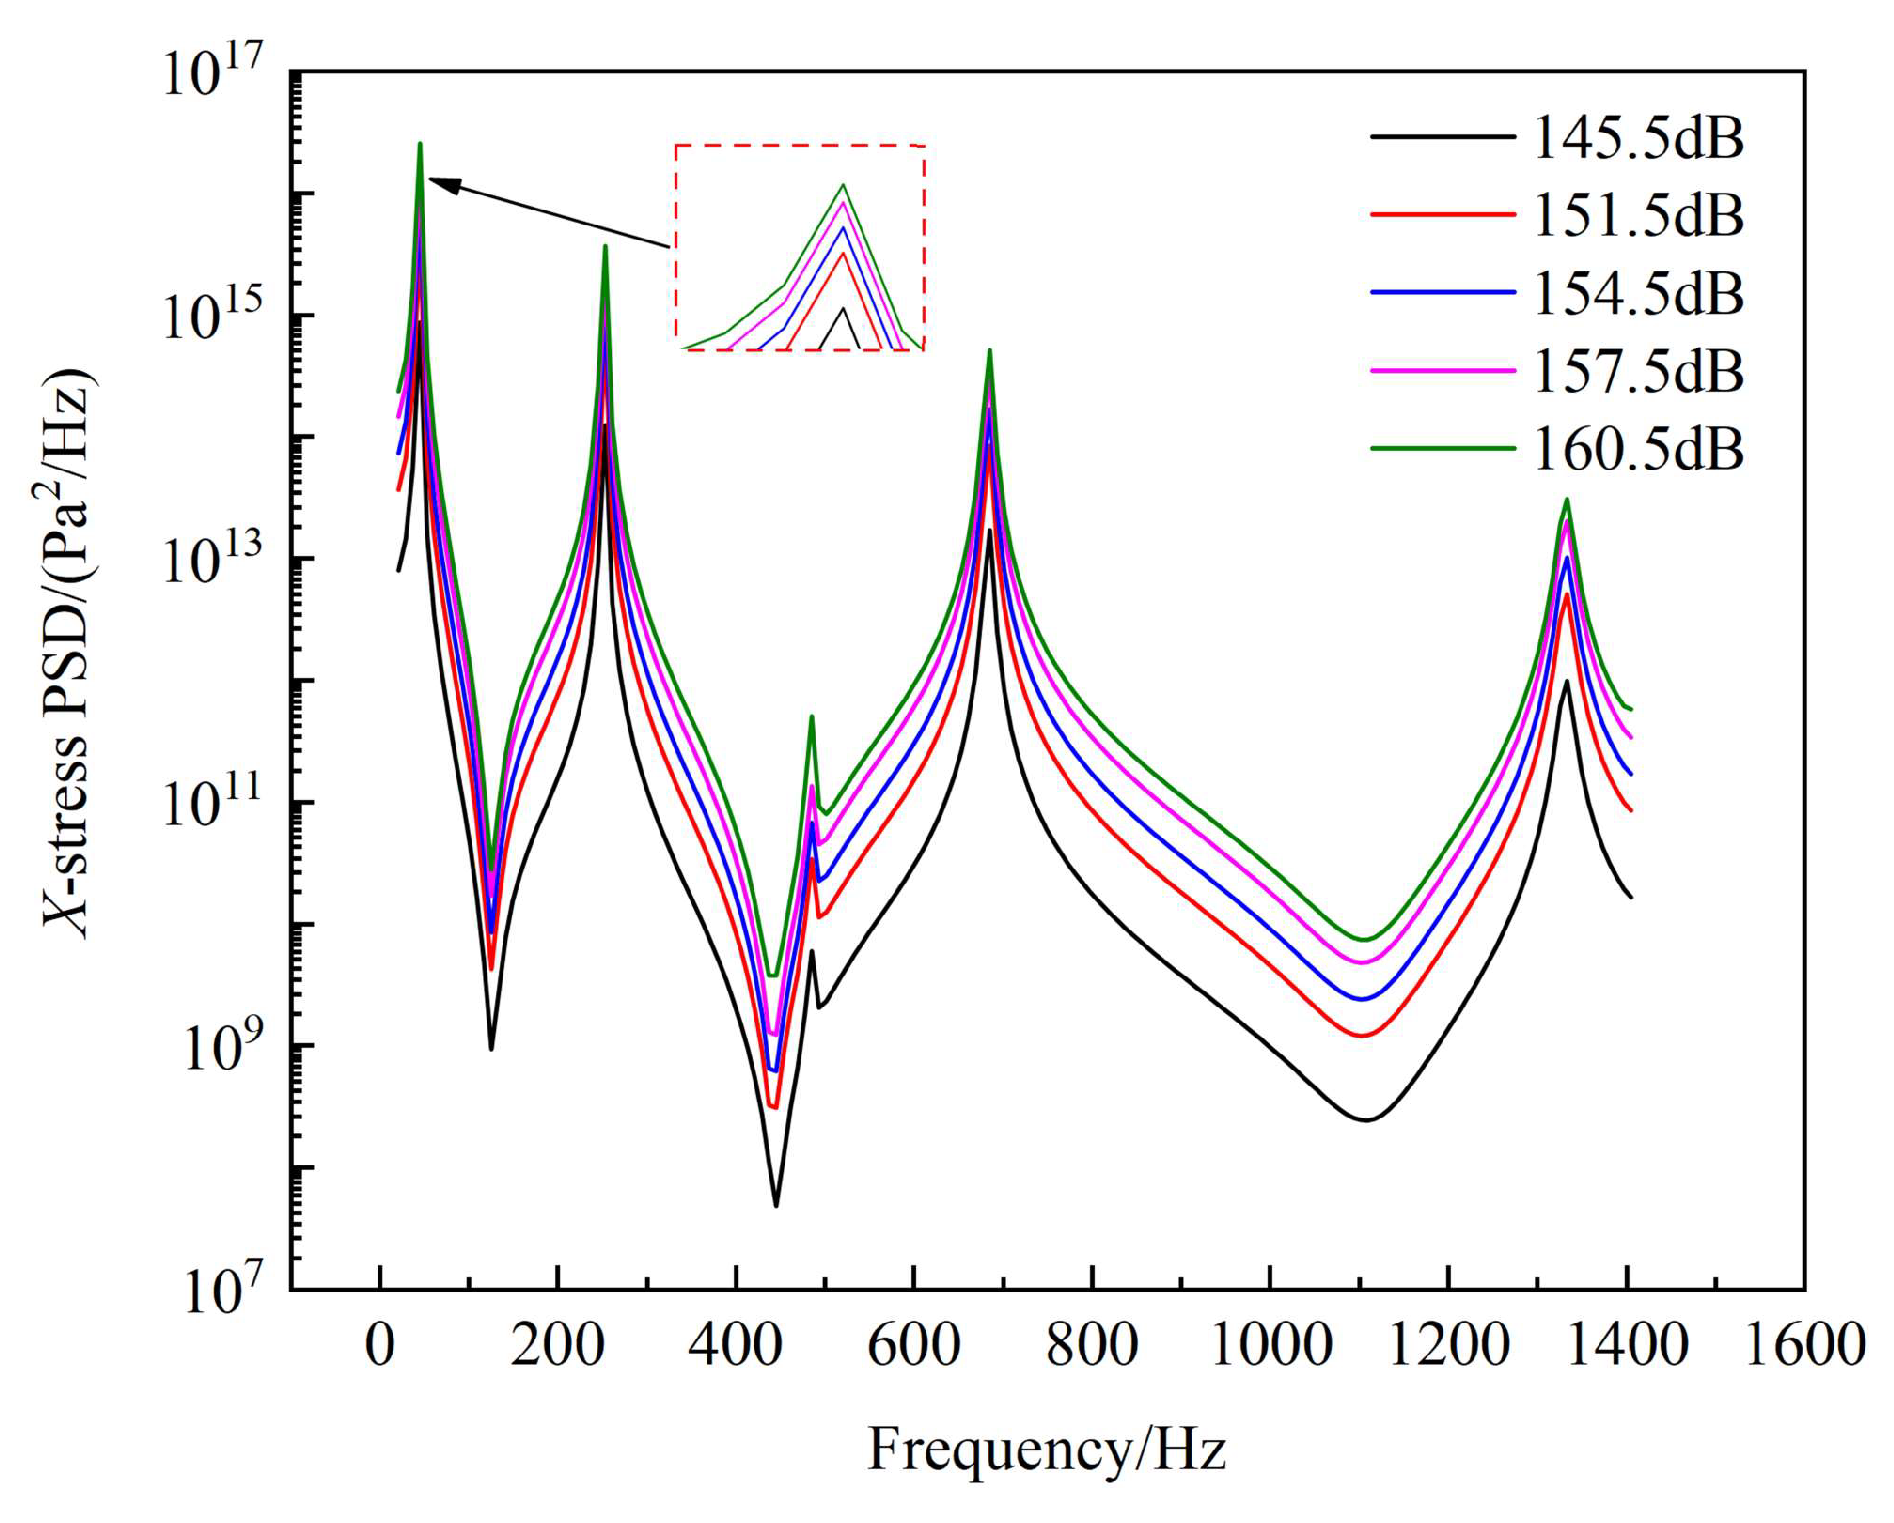
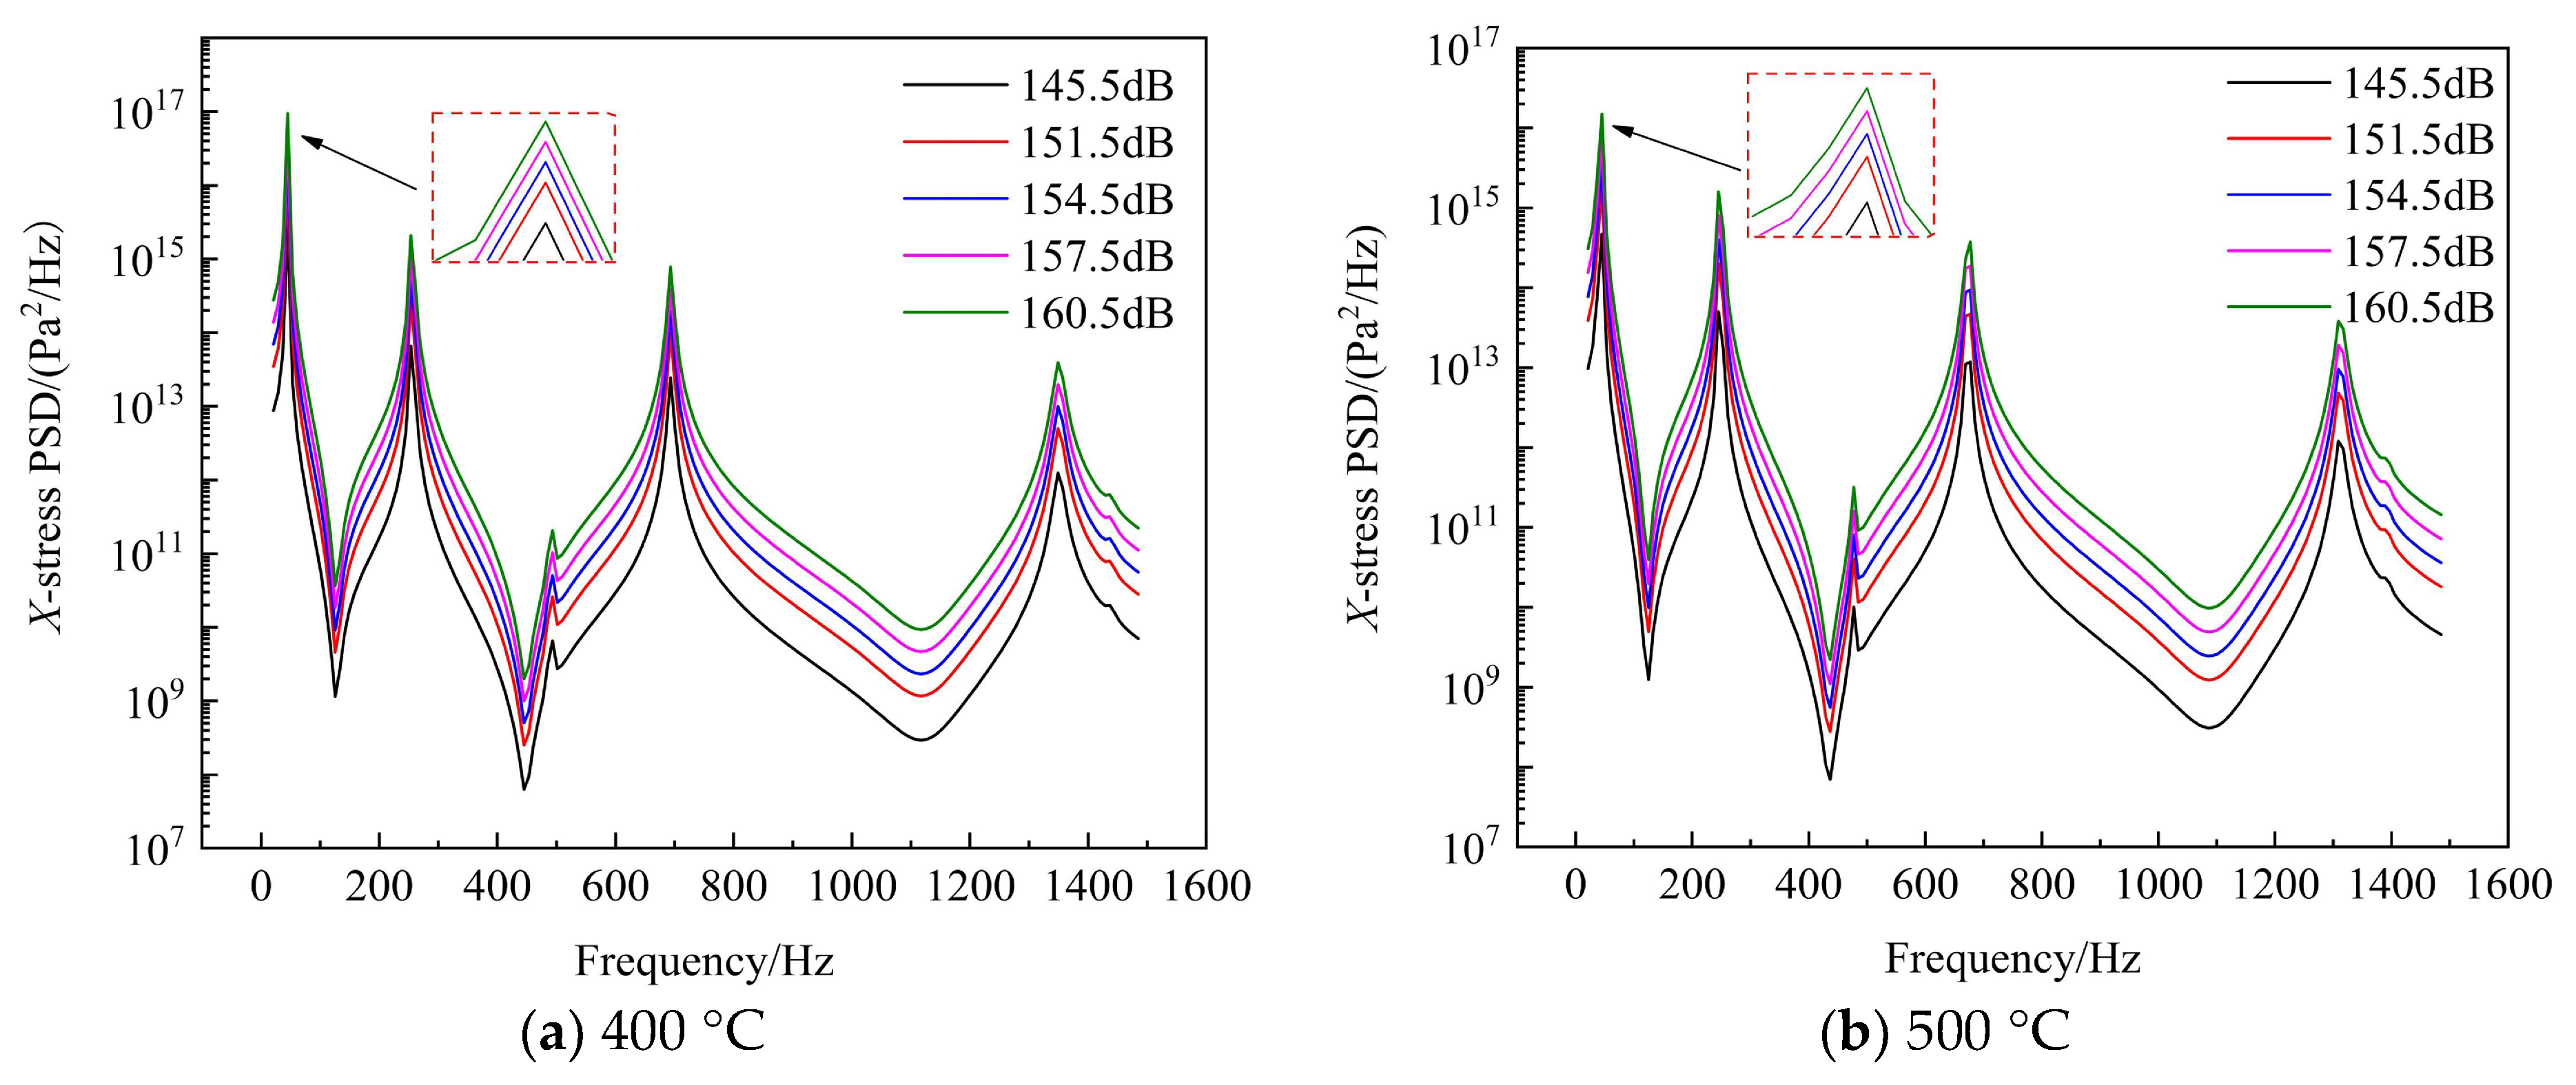
4.4. Changes in Peak Stress Response with Sound Pressure

Figure 20a,b show the X-direction dynamic stress response of the thin-walled connection structure subjected to various sound pressure levels at 400 °C and 500 °C. The acoustic resonance response frequency of such structures is not affected by sound load magnitudes. Hence, their application at constant temperature does not cause a shift in the response peak frequency of the structure. The aforementioned analysis revealed that the dynamic stress response curves at various temperatures follow the same pattern. Taking the 400 °C temperature level as an example, as the sound pressure level increases from 145.5 dB to 160.5 dB, the response peak of the structure increases; the response curve reaches a maximum value near the fundamental frequency. For different sound pressure levels, the first-order response peak values are 2.99 × 10¹⁵ Pa2/Hz, 1.19 × 10¹⁶ Pa2/Hz, 2.37 × 10¹⁶ Pa2/Hz, 4.74 × 10¹⁶ Pa2/Hz, and 9.45 × 10¹⁶ Pa2/Hz. As the sound pressure level increases from 145.5 dB to 160.5 dB, the peak of the stress power density spectrum in the X-direction has an increase of 31.61 times.
Considering the combined impact of different thermal, aerodynamic, and sound loads on the stress power spectral density response, the authors concluded that, for thin-walled structures with bolt connections in the aerospace field, the sound loads have a more prominent influence than thermal and aerodynamic loads. This is especially true when one end of the structure is secured by four bolts to an uneven mounting base and the other end is free. Consequently, it is critical to pay special attention to the fatigue failure of the structure under the influence of such complex coupled loads in the aerospace structural domain, particularly the noise.

5. Prediction of Fatigue Life

5.1. Fatigue Life Variation with Temperature and Fluid Field

The dynamic response results obtained at the critical location of the above-described thin-walled connection structure were statistically analyzed. Based on the time domain signals, an improved rainflow counting method combined with fatigue cumulative damage theory was applied to determine rainflow cycle and rainflow damage matrices at the critical points. This analysis aims to cover the distribution of stress cycle blocks in the thin-walled connection structure under multiple coupled loads and to assess the extent of structural damage.
After analyzing the rainflow cycle matrices at various temperature conditions at a flow velocity of 60 m/s (see Figure 21a–c), it is clear that the cycle blocks are evenly distributed near the matrix main diagonals and off-diagonals. The amplitude of the cycle blocks gradually increases with the temperature, shifting towards the upper-left corner of the matrix, hence becoming more concentrated at the edges. Further, examining the corresponding rainflow damage matrices in Figure 21d–f makes it clear that the damage at the critical location of the structure intensifies with temperature. The damage level increases from 10−6 to 10−5, growing by one order of magnitude, which corresponds to the observed trends in dynamic stress response from the simulation results.
A 600 °C temperature case was taken as an example for studying the rainflow cycle and rainflow damage matrices of the thin-walled connection structure at different flow velocities. A comparison of rainflow cycle matrices given in Figure 22a–c shows that the number of cycles is largely maintained at ~120. When the flow velocity reaches 60 m/s, a slight increase in the number of cycles occurs, primarily concentrated near the main diagonal; it gradually disperses as the velocity increases further. Next, analyzing the corresponding rainflow damage matrices in Figure 22d–f reveals that the cyclic stress at the critical location increases with higher flow velocities, while the damage level is maintained at around 10−7, with a slight increase. Based on this behavior, it is evident that an increase in flow velocity impacts the fatigue damage of thin-walled connection structures and should not be overlooked.
Applying Miner’s theory and the curve of S-N of the GH188 plate, Table 5 provides the fatigue life of the connection structure under the action of different temperatures and flow fields. Notably, the fatigue life of the structure decreases with the increase in temperature. The fatigue life decreases by 4.82 h on average when the temperature increases from 300 °C to 600 °C. Moreover, the average life decreases by 0.33 h when the flow velocity increases from 20 m/s to 100 m/s. When the temperature increases from 300 °C to 600 °C, the corresponding life changes at speeds of 20 m/s, 40 m/s, 60 m/s, 80 m/s, and 100 m/s and result in a decrease of 4.85 h, 4.84 h, 4.83 h, 4.81 h, and 4.75 h, respectively.
The structure fatigue life of the structure significantly decreases under the effect of temperature. When the flow velocity increases from 20 m/s to 100 m/s, at 300 °C, 400 °C, 450 °C, 500 °C, 600 °C, the corresponding life decreases by 0.38 h, 0.35 h, 0.33 h, 0.31 h, and 0.28 h, respectively. The fatigue life of the structure decreases slowly as flow velocity increases.
Figure 23 shows that the fatigue life of the connection structure decreases with the increase in temperature and flow velocity. When the temperature in the thermal fluid environment increases from 300 °C to 600 °C, the life curve slope of the low-temperature effect is more pronounced. Under the increased flow velocity, the structure transitions from the low- to high-temperature area, increasing the aerodynamic pressure generated by the pneumatic load, resulting in a gradual decrease in the overall fatigue life.

5.2. Fatigue Life Variation Rule with Acoustic Loading

To facilitate the result comparison, results for the rainflow circulation and rainflow damage matrix at the critical point were calculated at 151.5 dB and 154.5 dB at 450 °C and 20 m/s, as shown in Figure 24a,b. The maximum stress circulation amplitude increases from 190.5 MPa to 266.7 MPa. Further, the rainflow circulation block obviously disperses and the number of cycles sharply decreases from ~190 to ~150. Analyzing the corresponding rainflow damage matrix Figure 24c,d yields, the damage degree increases from 10−8 to 10−7, by one order of magnitude. The degree of structural damage also increases. The structure breakage due to fatigue via acoustic loading is more significant compared to the effects of temperature and flow velocity.
In Table 6, a comparative analysis between the experimental and simulated fatigue life for two sets of conditions was conducted. At 450 °C and 151.5 dB, the average of the three experimental results is 12.01 h, exhibiting a significant discrepancy compared to the simulated value of 9.55 h, showing an error of 20.48%. Conversely, under the conditions of 450 °C and 154.5 dB, the average of three experimental results is 5.19 h, aligning closely with the simulated value of 4.82 h, yielding a smaller error of 7.13%.
The discrepancies between the experimental and simulated results may be attributed to several factors:
  • Resonance and randomness—high-temperature acoustic fatigue tests can prompt resonance within the specimens and waveguide test section due to intense sound excitation, leading to unpredictable fluctuations in results (i.e., randomness).
  • Assembly imperfections—imperfections in the manufacturing or assembly of the specimens and mounting brackets might cause minor looseness during the testing process due to continuous vibration.
  • Load variations—slight deviations in the angle of incidence when applying the acoustic load through the waveguide test section could affect the results.
  • Simulation limitations—simulated calculations are based on theoretical conditions and have limitations; results can vary between different finite element simulation software.
Through the above-presented analysis, for the observed research object it was determined that the error between the high-temperature acoustic fatigue test and the simulation results is within one order of magnitude. The simulation closely replicates all test conditions and shows a high degree of agreement with the results. The estimated fatigue life is within the accepted engineering range, which fully verifies the credibility and validity of the fatigue life estimation method for bolt-connected thin-walled structures.

6. Conclusions

The outcomes of this study provide a reference for analyzing responses and predicting the lifespan of aerospace vehicle components operating within complex multi-physics coupling loads, particularly in the hot-end sections. The main conclusion of this study is as follows.
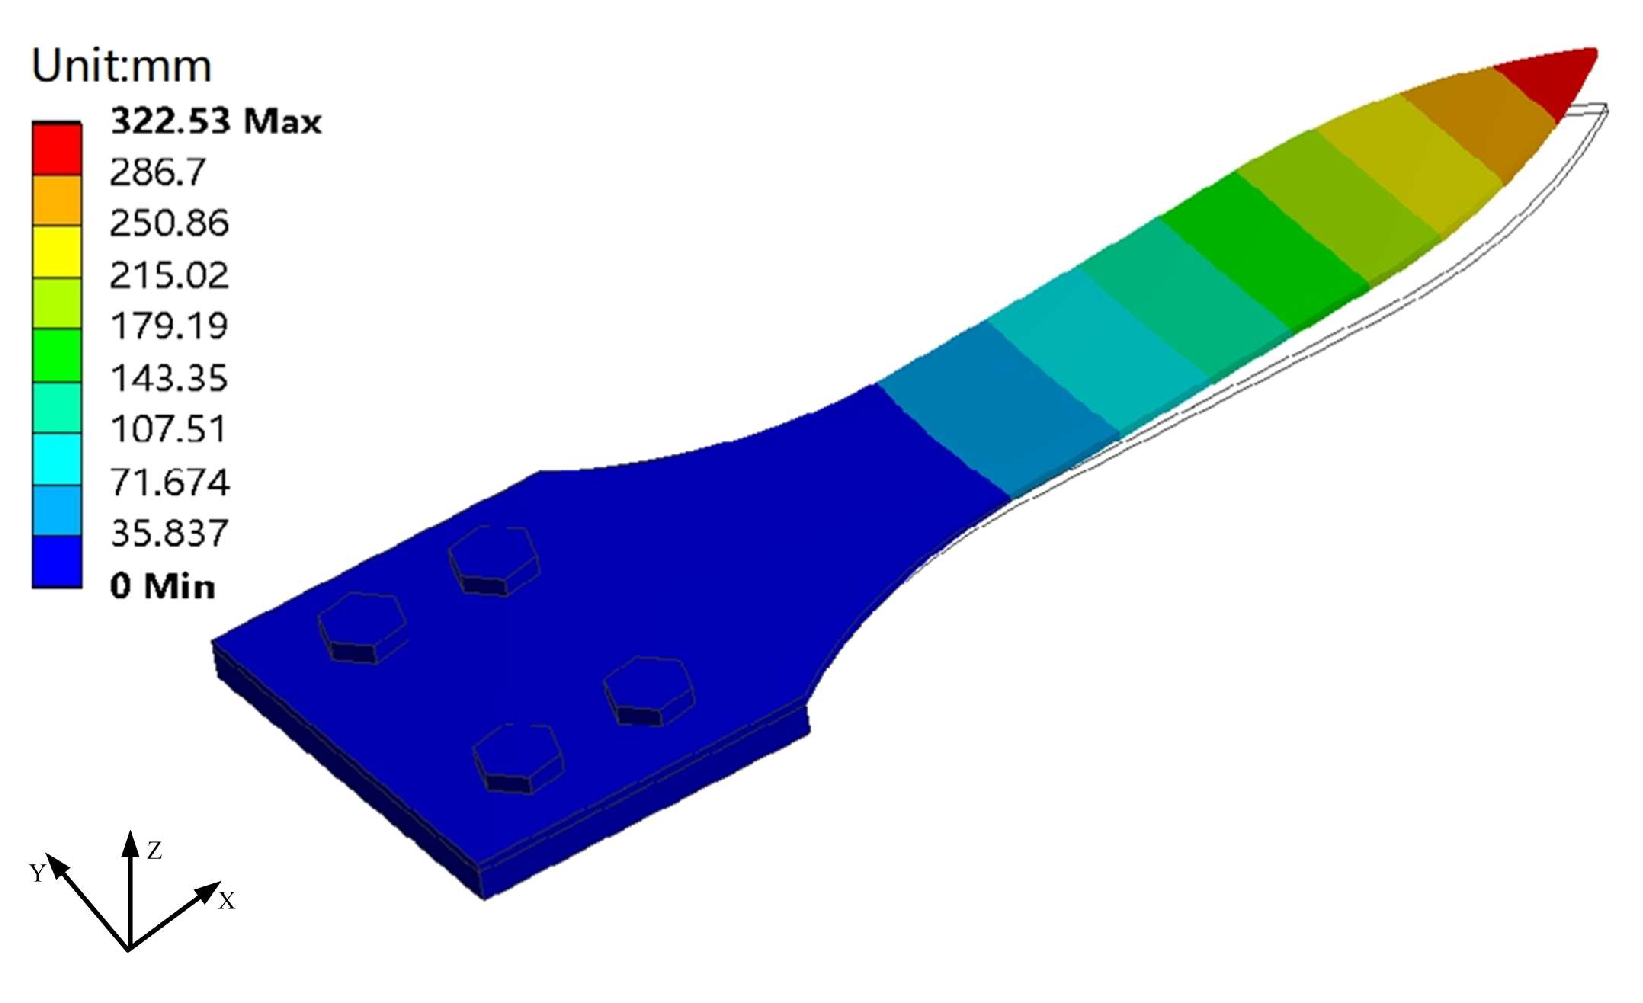
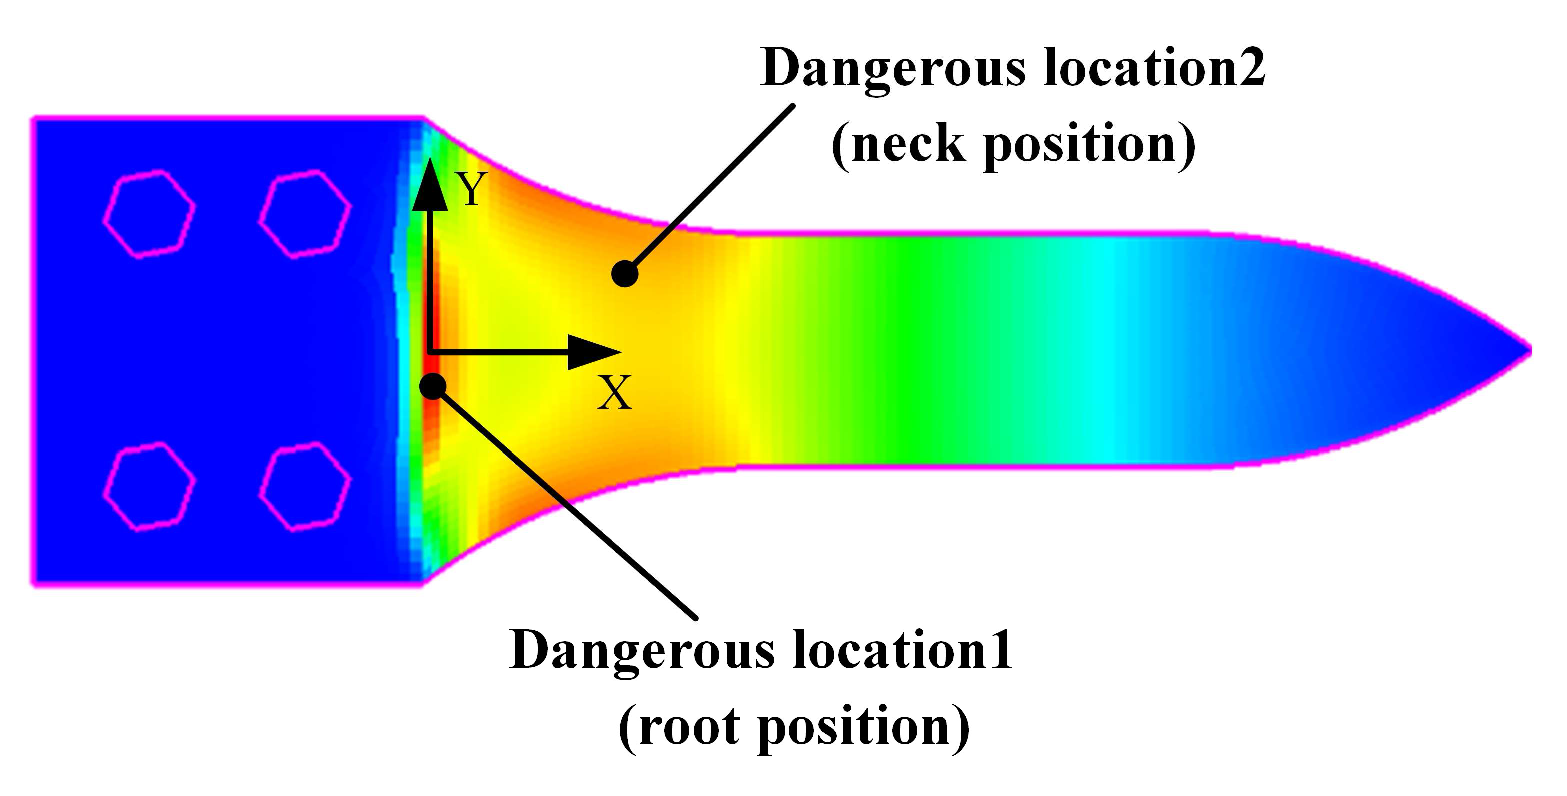
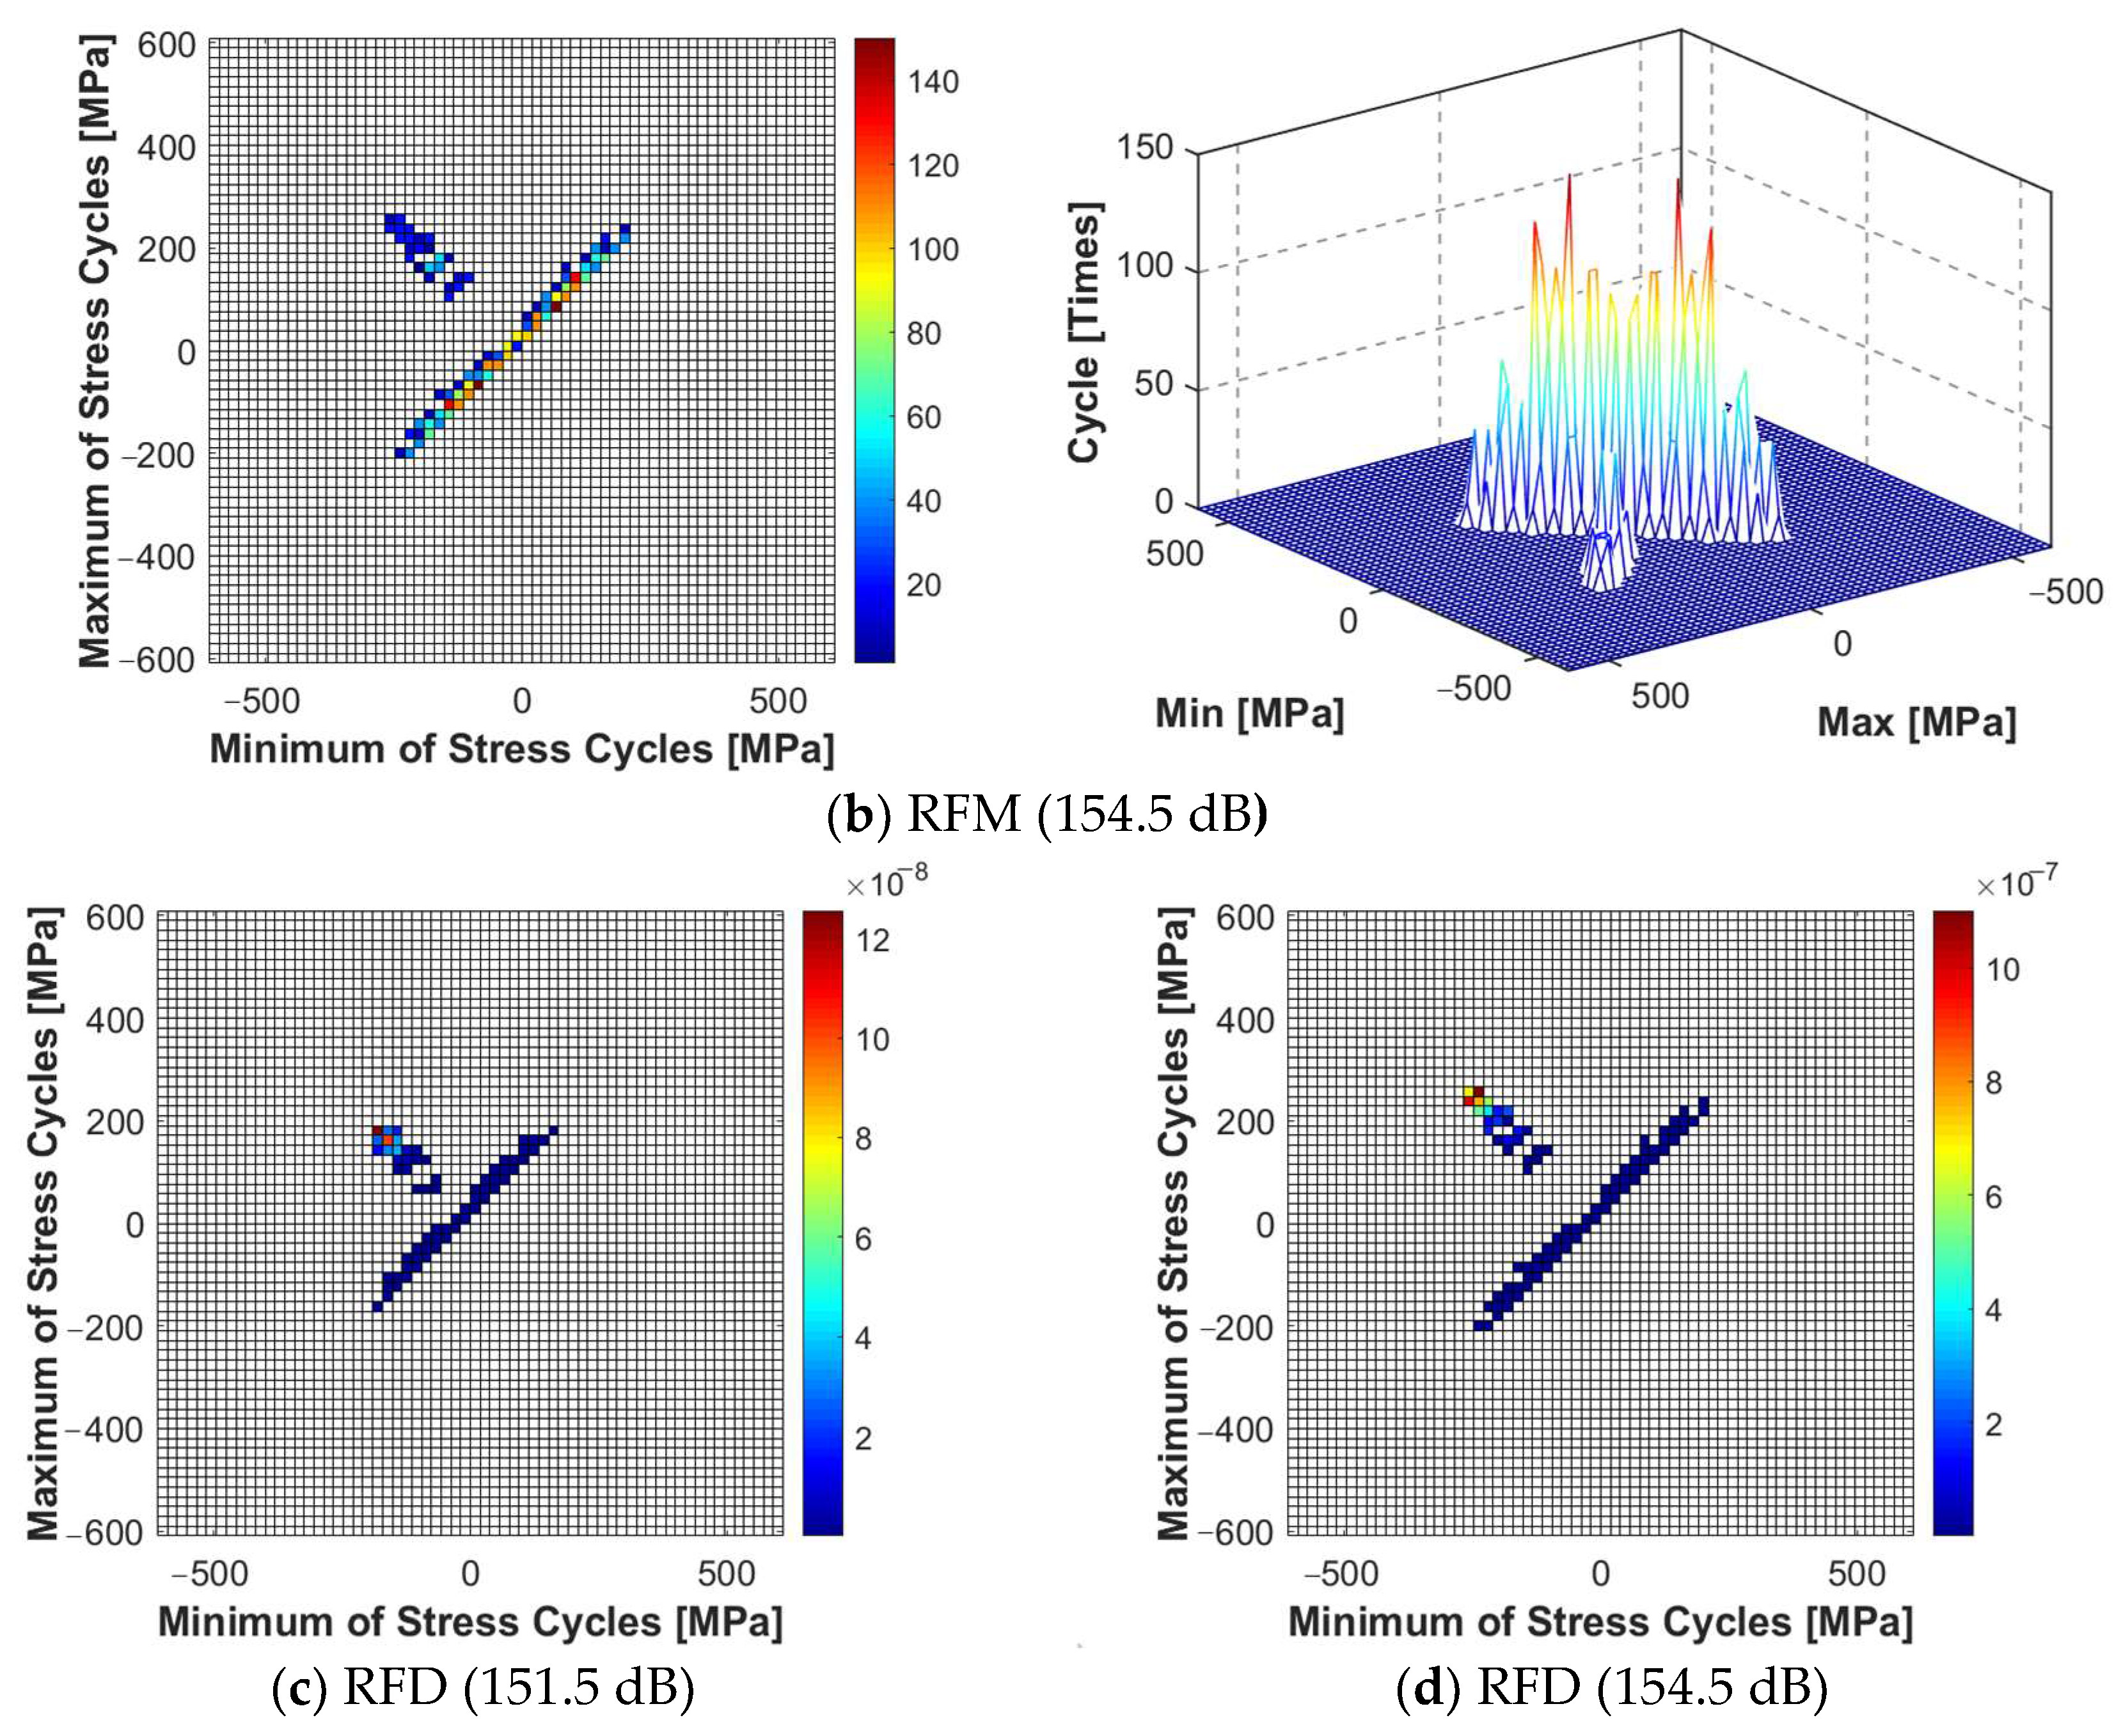
High-temperature acoustic fatigue tests and numerical simulations were conducted on the high-temperature alloy thin-walled plate-load-bearing frame bolted connection structure. The simulation results have shown that the established numerical simulation calculation model can accurately locate the damage on the thin-walled connection structure with a preload force. The damage generally appears at the root and neck positions, which is highly consistent with the test results. The first-order mode frequency of the structure is consistent, and the error is under 0.20%. The prediction level of the dynamic stress response resulting in the X direction is also consistent, and the error is between 1.44% and 2.20%. Furthermore, after using the improved rainflow counting method to calculate the response results, the experimental value of fatigue damage time is within an order of magnitude of the estimated value, with an error between 7.13% and 20.48%. Hence, the reliability and effectiveness of the numerical calculation and fatigue life prediction method are confirmed.
Analysis of temperature distribution and aerodynamic pressure distribution patterns of the thin-walled connection structure under a high-speed heat flow environment has shown how thickness and material variance cause high-speed heat to gather at the bolted connections inlet and outlet sides (from the edge to the center). This generates the envelope dividing line between high and low temperatures at the test piece root. The temperature difference increases with the flow velocity. The pneumatic pressure forms a high-pressure area at the inlet boundary of the connecting structure. Cross-sections of the test piece and the mounting seat are suddenly changed, resulting in discontinuous masses. The pneumatic pressure is stratified and spreads to the center, increasing with the flow velocity. Lastly, as the temperature increases, the fluid parameters change, meaning that the effect of temperature on aerodynamic pressure cannot be ignored.
Based on the coupled finite element/boundary element method, the structure response results were obtained for different thermal-fluid-acoustic loads. The results have shown that the thin-walled structure is in a state of thermal pre-buckling when the bolted connection boundary condition is applied at one end. In the same state, for the same flow velocity and sound pressure level, the response peak value of the critical point increases with the temperature. The response peak value increases 2.11 times from 300 °C to 600 °C. The corresponding peak frequency shifts to the left due to the softening of the structure and the ensuing decrease in stiffness. Within the same sound pressure level and the temperature range, the response peak value of the critical point changes slightly when moving from 20 m/s to 60 m/s. The changing pattern of the response level of the dangerous point is practically the same under different flow velocity. At the same temperature and flow velocity, the peak response value of the critical point changes from 145.5 dB to 160.5 dB, yielding an increase of 31.61 times. Based on the comparison, the acoustic load has a more significant impact on the structural-acoustic and vibration response compared to the temperature and aerodynamic loads.
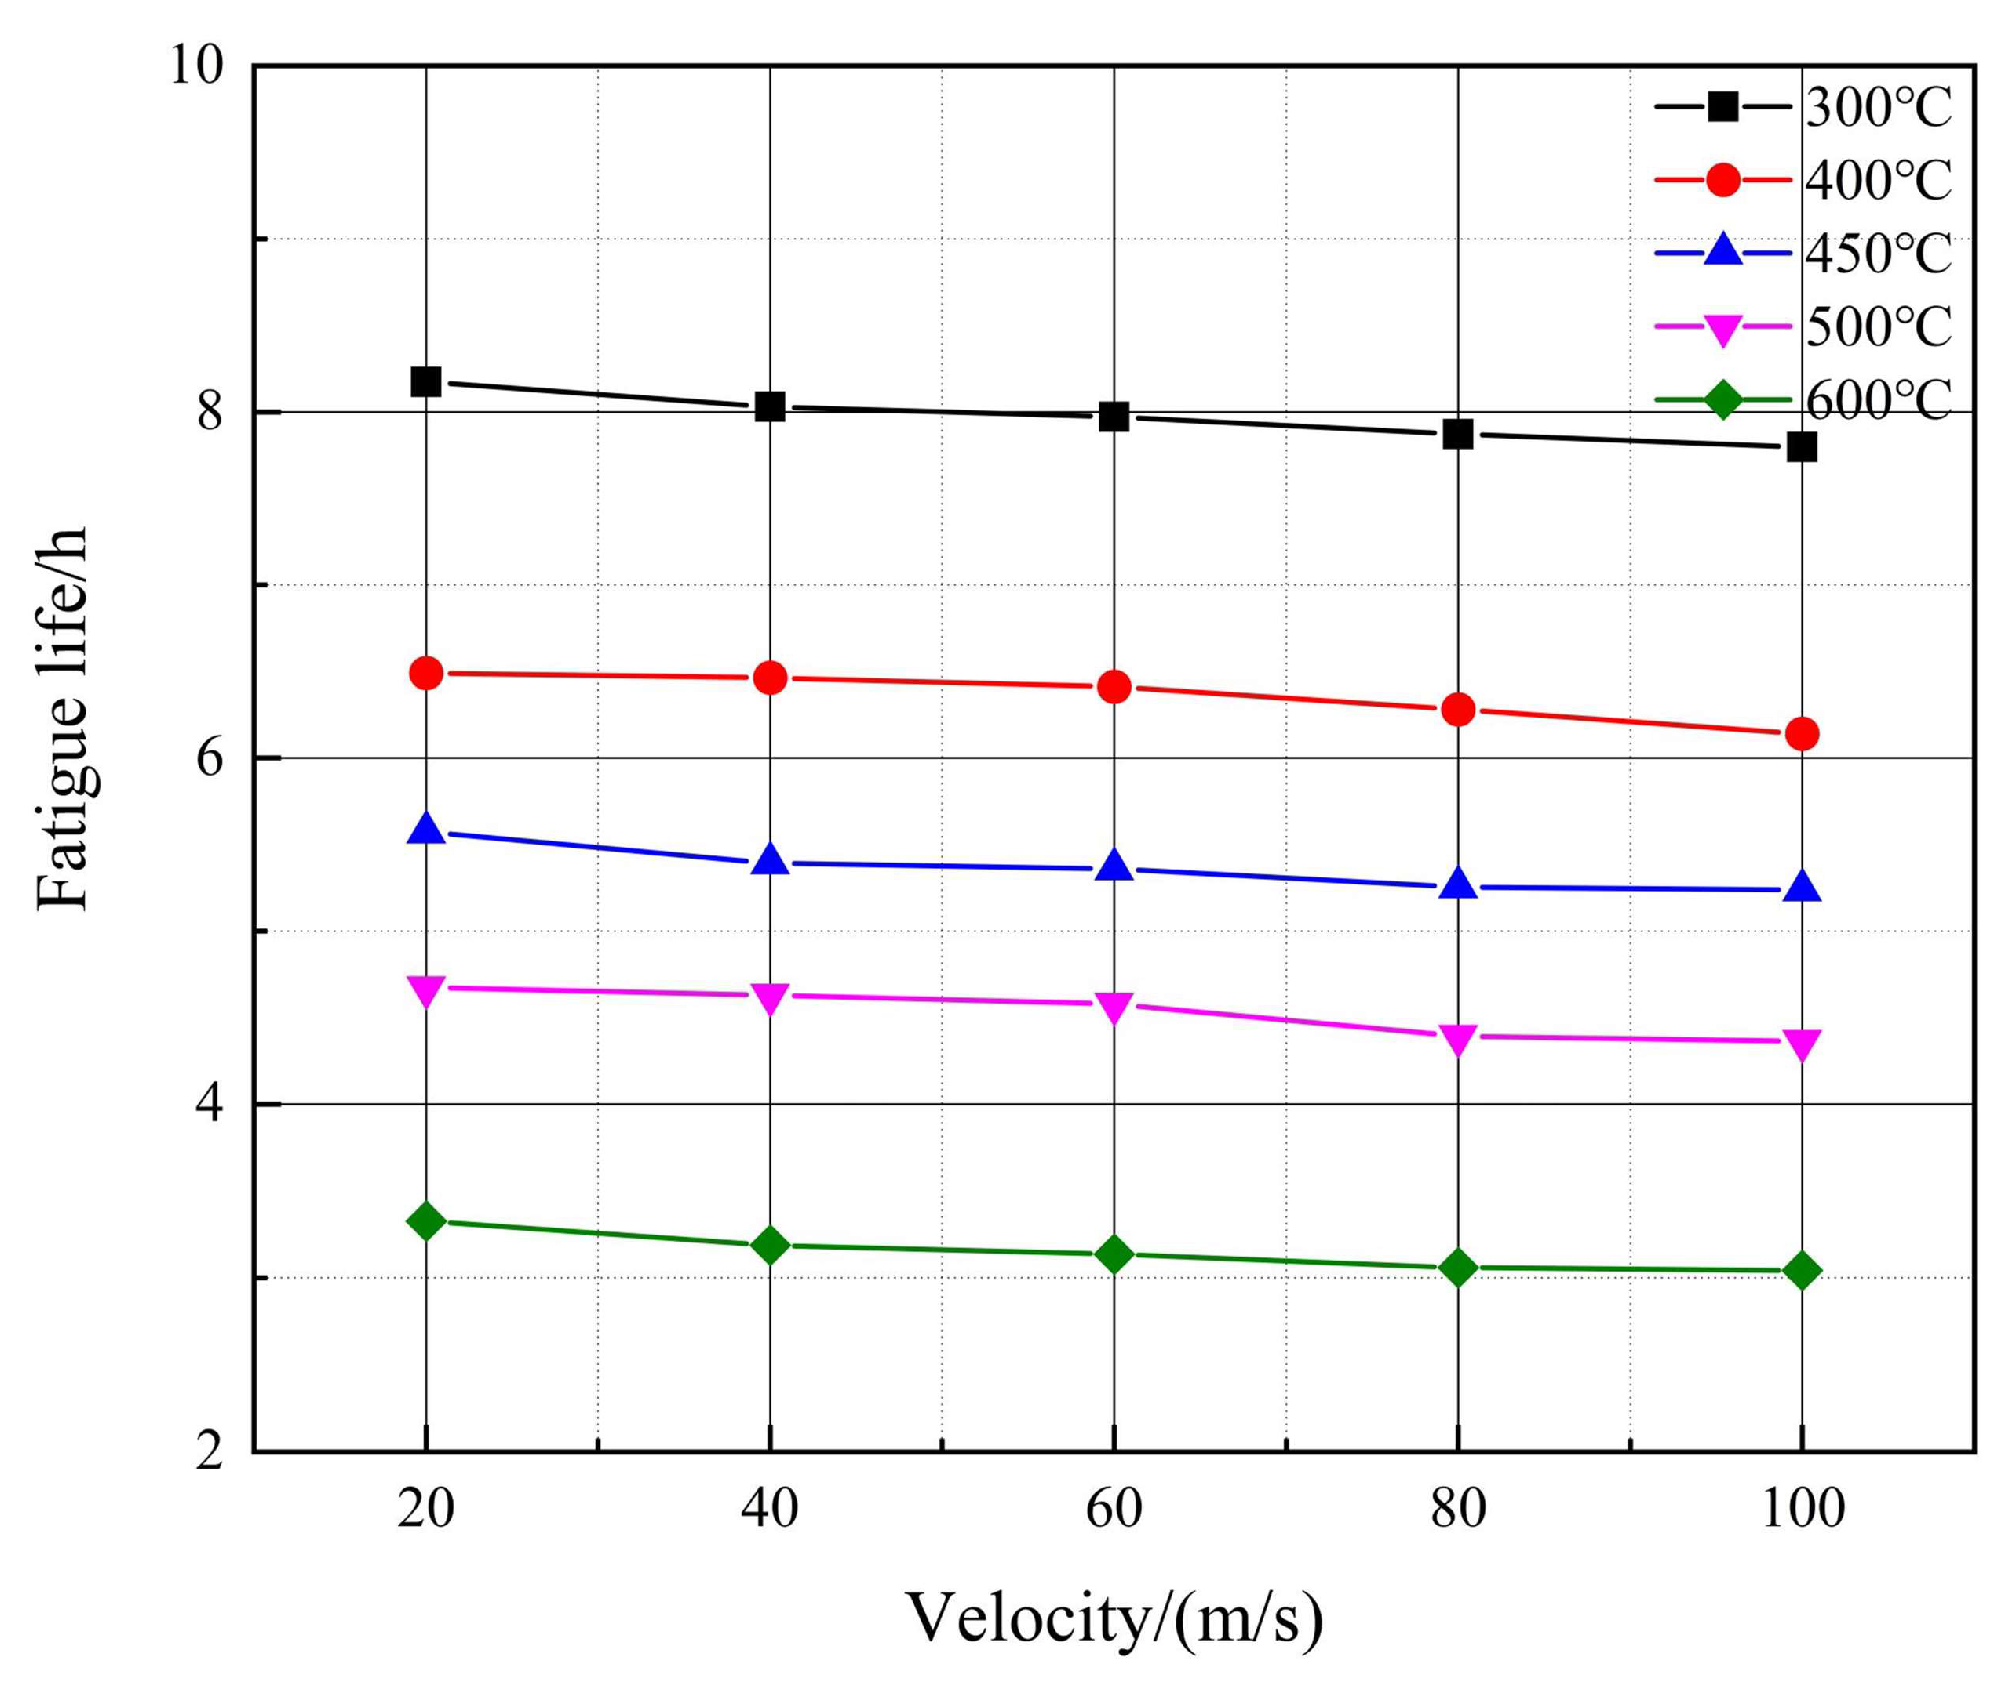
An improved rainflow counting method was used to estimate the fatigue life of the thin-walled connection structure. The results have shown that the fatigue life of the structure decreases significantly as the temperature increases. When the temperature increases from 300 °C to 600 °C, the fatigue life on average decreases by 4.82 h. The flow velocity increases from 20 m/s to 100 m/s, and the average lifespan decreases by 0.33 h. In a heat flow environment, the impact of low temperature on the reduction in fatigue life is more prominent. A comprehensive comparison of structural fatigue life tests and simulation results under thermal-fluid-acoustic loads has shown that the impact of noise load on the life of the connected structure is more prominent than that of thermal and aerodynamic loads.

Author Contributions

Conceptualization, Y.S., X.T. and F.Z.; methodology, Y.S.; software, W.Z.; validation, W.Z. and X.T.; formal analysis, Y.S. and W.Z.; investigation, W.Z. and F.Z.; resources, W.Z. and X.T.; data curation, W.Z.; writing—original draft preparation, W.Z.; writing—review and editing, W.Z., Y.S., X.T. and F.Z.; visualization, Y.S. and W.Z. All authors have read and agreed to the published version of the manuscript.

Funding

This research was funded by Aeronautical Science Foundation of China, grant number “02C54007” and “20151554” and Initiation Foundation Project of Doctor of Liaoning Province, grant number “2022-BS-221”.

Data Availability Statement

The data used to support the findings of this study are available from the corresponding author upon request.

Conflicts of Interest

The authors declare no conflicts of interest.

References

  1. Holzinger, F.; Wartzek, F.; Schiffer, H.-P.; Leichtfuss, S.; Nestle, M. Self-Excited Blade Vibration Experimentally Investigated in Transonic Compressors: Acoustic Resonance. J. Turbomach. 2015, 138, 041001. [Google Scholar] [CrossRef]
  2. Blevins, R.D.; Bofilios, D.A.; Holehouse, I.; Hwa, V.W.; Tratt, M.D.; Laganelli, A.L.; Pozefsky, P.C.; Pierucci, M. Thermo-Vibro-Acoustic Loads and Fatigue of Hypersonic Flight Vehicle Structure; Goodrich Aerostructures Group: Chula Vista, CA, USA, 2009; AFRL-RB-WP-TR-2009-313. [Google Scholar]
  3. Wu, Z.; Ren, F.; Zhang, W.; Kong, F.; Zang, Z. Research advances in thermal-acoustic testing of aerocraft structures. Missiles Space Veh. 2010, 2, 24–30. [Google Scholar]
  4. Ng, C.; Wentz, K. The prediction and measurement of thermoacoustic response of plate structures. In Proceedings of the 31st Structures, Structural Dynamics and Materials Conference, Long Beach, CA, USA, 2–4 April 1990; p. 988. [Google Scholar]
  5. Lee, J. Displacement and strain statistics of thermally buckled plates. J. Aircr. 2001, 38, 104–110. [Google Scholar] [CrossRef]
  6. Lee, J. Displacement and strain histograms of thermally buckled composite plates in random vibration. In Proceedings of the 37th Structure, Structural Dynamics and Materials Conference, Salt Lake City, UT, USA, 15–17 April 1996; p. 1347. [Google Scholar]
  7. Lee, J. Large-amplitude plate vibration in an elevated thermal environment. Appl. Mech. Rev. 1993, 46, S242–S254. [Google Scholar] [CrossRef]
  8. Vaicaitis, R. Nonlinear response and sonic fatigue of National Aerospace Space Plane surface panels. J. Aircr. 1994, 31, 10–18. [Google Scholar] [CrossRef]
  9. Vaicaitis, R.; Kavallieratos, P.A. Nonlinear response of composite panels to random excitation. In Proceedings of the 34th Structures, Structural Dynamics and Materials Conference, La Jolla, CA, USA, 19–22 April 1993; pp. 1041–1049. [Google Scholar]
  10. Dhainaut, J.-M.; Guo, X.; Mei, C.; Spottswood, S.M.; Wolfe, H.F. Nonlinear random response of panels in an elevated thermal-acoustic environment. J. Aircr. 2003, 40, 683–691. [Google Scholar] [CrossRef]
  11. Mei, C.; Dhainaut, J.-M.; Duan, B.; Spottswood, S.M.; Wolfe, H.F. Nonlinear Random Response of Composite Panels in an Elevated Thermal Environment; AFRL-VA-WP-TR-2000-3049; Air Force Research Laboratory: Albuquerque, NM, USA, 2000. [Google Scholar]
  12. Maekawa, S. On the sonic fatigue life estimation of skin structures at room and elevated temperatures. J. Sound Vib. 1982, 80, 41–59. [Google Scholar] [CrossRef]
  13. Arnold, R.R.; Vaicaitis, R. Nonlinear Response and Fatigue of Surface Panels by the Time Domain Monte Carlo Approach; Technical Report; Wright-Patterson AFB: Dayton, OH, USA, 1992. [Google Scholar]
  14. Gasner, J.; Foster, R.; Fujimura, C. Evaluation of thermal management for a Mach 5.5 hypersonic vehicle. In Proceedings of the 28th Joint Propulsion Conference and Exhibit, Nashville, TN, USA, 6–8 July 1992; p. 3721. [Google Scholar]
  15. Jacobs, J.; Gruensfelder, C.; Hedgecock, C. Thermal Acoustic Fatigue of Ceramic Matrix Composite Materials; American Institute of Aeronautics and Astronautics: Reston, VA, USA, 1993. [Google Scholar]
  16. Ng, C.F.; Clevenson, S.A. High-intensity acoustic tests of a thermally stressed plate. J. Aircr. 1991, 28, 275–281. [Google Scholar] [CrossRef]
  17. Blevins, R.D.; Holehouse, I.; Wentz, K.R. Thermoacoustic loads and fatigue of hypersonic vehicle skin panels. J. Aircr. 1993, 30, 971–978. [Google Scholar] [CrossRef]
  18. Jacobson, M.J. Sonic fatigue of advanced composite panels in thermal environments. J. Aircr. 1983, 20, 282–288. [Google Scholar] [CrossRef]
  19. Lee, H.W.; Basaran, C. A Review of Damage, Void Evolution, and Fatigue Life Prediction Models. Metals 2021, 11, 609. [Google Scholar] [CrossRef]
  20. Lee, H.W.; Basaran, C.; Egner, H.; Lipski, A.; Piotrowski, M.; Mroziński, S.; Rao, C.L. Modeling ultrasonic vibration fatigue with unified mechanics theory. Int. J. Solids Struct. 2022, 236, 111313. [Google Scholar] [CrossRef]
  21. Lee, H.W.; Djukic, M.B.; Basaran, C. Modeling fatigue life and hydrogen embrittlement of bcc steel with unified mechanics theory. Int. J. Hydrogen Energy 2023, 48, 20773–20803. [Google Scholar] [CrossRef]
  22. Zou, X.; Guo, D.; Zhang, X.; Qu, C.; Pan, K. Study on Response Characteristcs of Titanium Panel under Combined Thermal/Acoustic/Static Loadings. Tuijin Jishu/J. Propuls. Technol. 2019, 40, 1136–1143. [Google Scholar] [CrossRef]
  23. Li, J.; Wang, J.; Yang, T.; Ji, W. Fluid-thermal-structural study of integrated algorithm for aerodynamically hypersonic heated leading edges. Guofang Keji Daxue Xuebao/J. Natl. Univ. Def. Technol. 2018, 40, 9–16. [Google Scholar] [CrossRef]
  24. Gui, Y.; Liu, L.; Dai, G.; Zhang, L. Research status of hypersonic vehicle fluid-thermal-solid coupling and software development. Hangkong Xuebao/Acta Aeronaut. Et Astronaut. Sin. 2017, 38, 020844. [Google Scholar] [CrossRef]
  25. Gao, J.; Wang, J.; Ma, Y.; Hong, J. Numerical simulation of three dimensional wall temperature of combustor liner based on thermal-fluid-solid coupling method. Beijing Hangkong Hangtian Daxue Xuebao/J. Beijing Univ. Aeronaut. Astronaut. 2011, 37, 300–304. [Google Scholar]
  26. Sha, Y.; Yang, Y.; Tang, X. Acoustic Fatigue Strength Analysis and Experimental Verification of Thin-Walled Connection Structures with Hot Sections under High Temperature Rise Environment. Tuijin Jishu/J. Propuls. Technol. 2022, 43, 342–354. [Google Scholar] [CrossRef]
  27. Wang, J.; Zhao, F.; Sha, Y.; Gu, S. Fatigue life research and experimental verification of superalloy thin-walled structures subjected to thermal-acoustic loads. Chin. J. Aeronaut. 2020, 33, 598–608. [Google Scholar] [CrossRef]
  28. Sha, Y.; Ai, S.; Zhao, F.; Jiang, Z.; Zhang, J. Vibro-acoustic response analysis and fatigue life prediction of thin-walled structures with high speed heat flux. Hangkong Xuebao/Acta Aeronaut. Et Astronaut. Sin. 2020, 41, 206–219. [Google Scholar] [CrossRef]
  29. Sha, Y.D.; Wang, J.; Zhao, F.T.; Luo, L. Vibration response experimental verification and fatigue analysis of thin-walled structures to thermal-acoustic loads. Hangkong Dongli Xuebao/J. Aerosp. Power 2017, 32, 2659–2671. [Google Scholar] [CrossRef]
  30. Chang, X.; Zhou, W. Enhanced Lagrangian-based contact models and their engineering applications. J. Rock. Mech. Eng. 2016, 23, 1568–1573. [Google Scholar]
  31. Xu, D.H.; Hjelmstad, K.D. A New Node-Node To-Node Approach to Contact/Impact Problems for Two-Dimensional Elastic Solids Subject to Finite Deformation; Newmark Structural Engineering Laboratory: Urbana-Champaign, IL, USA, 2008. [Google Scholar]
  32. Cheng, D. Mechanical Design Manual; Chemical Industry Press: Beijing, China, 2007. [Google Scholar]
Figure 1. Bolt connection schematic.
Aerospace 11 00287 g001
Figure 2. Finite element/boundary element modeling.
Aerospace 11 00287 g002
Figure 3. High-temperature acoustic fatigue test rig.
Aerospace 11 00287 g003
Figure 4. Typical bolted connection structure.
Aerospace 11 00287 g004
Figure 5. Test piece installation within the test section.
Aerospace 11 00287 g005
Figure 6. High-temperature acoustic fatigue test’s heating curve.
Aerospace 11 00287 g006
Figure 7. Location of cracks in test pieces of thin-walled connection structures.
Aerospace 11 00287 g007
Figure 8. Geometric dimensions of thin-walled connection structure.
Aerospace 11 00287 g008
Figure 9. Modal vibration pattern cloud diagram (T = 450 °C).
Aerospace 11 00287 g009
Figure 10. Stress response of thin-walled connection structure.
Aerospace 11 00287 g010
Figure 11. Stress power spectral density of thin-walled connection structures.
Aerospace 11 00287 g011
Figure 12. X-directional stress power spectral density at structural hazard location.
Aerospace 11 00287 g012
Figure 13. Computational modeling of the fluid domain of thin-walled connected structural elements.
Aerospace 11 00287 g013
Figure 14. Temperature distribution in thin-walled connection structure.
Aerospace 11 00287 g014
Figure 15. Surface temperature change with flow velocity.
Aerospace 11 00287 g015
Figure 16. Pneumatic pressure distribution of thin-walled connection structures.
Aerospace 11 00287 g016
Figure 17. Pneumatic pressure distribution of thin-walled connection structures.
Aerospace 11 00287 g017
Figure 18. Variation of X-direction stress power spectral density with the temperature at the critical point.
Aerospace 11 00287 g018
Figure 19. Variation of X-directional stress power spectral density with flow velocity at critical points location.
Aerospace 11 00287 g019
Figure 20. Variation of X-directional stress power spectral density with sound pressure level at critical points.
Aerospace 11 00287 g020
Figure 21. Relationships between the rainflow cycle matrix, rainflow damage matrix, and the temperature variation.
Aerospace 11 00287 g021aAerospace 11 00287 g021b
Figure 22. Relationships between the rainflow cycle matrix and rainflow damage matrix with flow velocity.
Aerospace 11 00287 g022aAerospace 11 00287 g022b
Figure 23. Relationship between fatigue life and flow velocity for thin-walled connection structures.
Aerospace 11 00287 g023
Figure 24. The relationship between rainflow cycle and rainflow damage matrices as the sound pressure level changes.
Aerospace 11 00287 g024aAerospace 11 00287 g024b
Table 1. Material properties of GH188 sheet.
Parameter300 °C400 °C450 °C500 °C600 °C
E/GPa208175170165156
υ0.3010.3180.3200.3220.326
α/(10−6 °C−1)11.713.413.713.914.4
ρ/(103 kg · m−3)9.099.099.099.099.09
K/(W·°C−1)15.719.620.124.327.1
Table 2. Fatigue life of thin-walled connection structures.
SPL/dBFatigue Life/h
Test 1Test 2Test 3
151.512.0012.5511.49
154.55.055.365.16
Table 3. First order modal frequency simulation and test results.
SimulationTest 1Test 2Test 3Test AverageError/%
69.7269.7069.8169.9669.820.14
Table 4. X-directional dynamic stress simulation and test results of thin-walled connection structure (T = 450 °C).
SPL/dBX-Stress/MPa
SimulationTest 1Test 2Test 3
151.5 dB177.72172.92177.03175.61
154.5 dB251.04254.51253.19262.38
Table 5. Fatigue life of thin-walled connection structures under different thermal flow conditions.
Temperature/°CFatigue Life/h
20 m/s40 m/s60 m/s80 m/s100 m/s
3008.178.037.977.877.80
4006.496.466.416.286.14
4505.575.395.365.255.24
5004.674.634.584.394.36
6003.333.193.143.063.04
Table 6. Fatigue life test and simulation results of thin-walled connection structures.
Working ConditionFatigue Life/h
Test 1Test 2Test 3SimulationError/%
450 °C, 151.5 dB12.0012.5511.499.5520.48
450 °C, 154.5 dB5.055.365.164.827.13
Disclaimer/Publisher’s Note: The statements, opinions and data contained in all publications are solely those of the individual author(s) and contributor(s) and not of MDPI and/or the editor(s). MDPI and/or the editor(s) disclaim responsibility for any injury to people or property resulting from any ideas, methods, instructions or products referred to in the content.

