Article

Effects of Pitch Stabilization Buffer on the Dynamic Performance of Frame-Type Landing Gear

1
State Key Laboratory of Mechanics and Control for Aerospace Structures, College of Aerospace Engineering, Nanjing University of Aeronautics and Astronautics, Nanjing 210016, China
2
The First Aircraft Institute of AVIC, Xi’an 710089, China
3
Key Laboratory of Fundamental Science for National Defense-Advanced Design Technology of Flight Vehicle, College of Aerospace Engineering, Nanjing University of Aeronautics and Astronautics, Nanjing 210016, China
*
Author to whom correspondence should be addressed.
Aerospace 2024, 11(4), 288; https://doi.org/10.3390/aerospace11040288
Submission received: 7 March 2024 / Revised: 29 March 2024 / Accepted: 4 April 2024 / Published: 9 April 2024

Abstract

:
During the landing and taxiing process of aircraft, the frame-type landing gear (FTLG) usually generates large pitch vibrations under external excitation. Excessive vibration increases localized loads on the landing gear, which may lead to localized failure of the structure. To minimize this undesirable vibration, a passive oil–pneumatic pitch-stabilizing buffer (PSB) is designed in this paper to provide pitch damping. This paper applies the basic principles of dynamics to establish a dynamic model of FTLG considering the influence of PSB. And based on the design of experiments (DOE) method, by changing the filling parameters and structural parameters of PSB, the results of the changes of the frame vibration angle, angular velocity, and landing gear load are obtained, so as to analyze the effects of different parameters on the dynamic performance of the landing gear in the landing and taxiing process. The results demonstrate that increasing the oil damping coefficient of PSB and decreasing the installation angle of PSB on the main strut during the landing period resulted in less frame vibration and lower wheelset load ratios, but increased the landing overloads of landing gears. In the taxiing phase, increasing the PSB air spring stiffness can effectively reduce the frame vibration caused by the uneven road surface. The PSB structural parameters have little effect on the dynamic performance of FTLG.

1. Introduction

In the process of aircraft design and development, the landing gear system design is one of the most critical research issues. The main function of the landing gear is to mitigate the impact load when landing, as well as to support the aircraft fuselage and complete the aircraft maneuvering commands when taxiing [1,2,3,4]. At present, the size of the aircraft gradually develops from small to super-large, and the ground load that the landing gear needs to withstand during the landing and taxiing process is also increasing, so the landing gear needs to further improve its own buffering performance in order to meet the safety requirements [5]. Modern large, heavy-duty airplanes mostly use multi-wheeled FTLG by increasing the number of wheels and changing the layout of the wheels in the form of improving the landing gear cushioning performance. For example, B747, B777, B787, and A380 have adopted six-wheeled FTLG for the main landing gear (MLG) [6,7]. FTLG has a pitch degree of freedom between the frame and the main strut, which leads to pitch vibration of the frame during the landing and taxiing process. Therefore, designers usually add frame pitch stabilizer buffers between the frame and the main strut to attenuate the vibration.
A significant amount of research has been conducted by national and international scholars on the dynamics of FTLG. NASA modeled the ground dynamics of the MLG of the B747 by simplifying it, and this model can be numerically computed to output the load characteristics of different states of the landing gear [8,9]. Li analyzed the landing and taxiing dynamic characteristics of a large aircraft by establishing the equations of motion and concluded that the vertical load of the landing gear when the aircraft is taxiing at a high speed may be greater than the maximum load of the aircraft during the landing process [10]. Zheng analyzed the dynamic performance of different types of FTLG by performing dynamic simulation analysis [11]. Based on the dynamics simulation software, Xia established two kinds of PSB models, passive and active, and analyzed the effects of PSB filling parameters on the landing characteristics of FTLG [12]. Wei et al. proposed an improved landing gear drop-shock dynamics model, which modified the friction mechanics model to more accurately simulate the whole process of the landing gear drop-shock test [13]. Wei et al. completed the landing shock test of four-wheeled landing gear in horizontal landing and tail-sinking landing conditions, and obtained the effect of stabilizer buffer inflation pressure on the landing gear loads [14].
Although the above works have described the dynamic response of FTLG during the landing and taxiing process, they did not focus on the effect of PSB on the dynamic performance of FTLG. Therefore, based on the basic principles of dynamics, this paper establishes the dynamics equations of the six-wheeled FTLG while considering the role of PSB. And using the DOE method, the simulation working conditions considering the effects of PSB filling and structural parameters, respectively, are set up. Based on the experimental design method, the simulation conditions considering the effects of filling and structural parameters of PSB, respectively, are set up to obtain the dynamic response results of FTLG. The effects of different parameters are analyzed according to the simulation results, which provide a reference for the design of PSB.

2. Dynamic Modeling of FTLG

2.1. PSB Design

The PSB performs different functions during the landing and taxiing periods of the aircraft, respectively. Before landing, the frame usually touches the ground at a certain angle with the main strut, which causes the front and rear tires of the landing gear to be unable to touch the ground at the same time. Therefore, the frame produces violent vibrations after landing, and the PSB is intended to reduce the violent vibration produced by the impact of the landing. As for the taxiing process, when the aircraft is taxiing on an uneven road surface, the role of PSB is to provide the frame with appropriate dynamic buffering to balance the front and rear tire loads of the MLG. According to the functional requirements, the installation of the pitch-stabilizing buffer on the landing gear can be determined. As shown in Figure 1, the PSB is arranged between the front end of the frame and the main strut, and is hinged to the end of the strut and the lugs at the front end of the frame, respectively, by means of a connecting joint.
Considering that PSB needs to have certain stiffness and damping characteristics, a passive oil–pneumatic PSB is targeted to be designed, as shown in Figure 2. A PSB is mainly composed of four parts: a cylinder, piston rod, floating piston, and floating oil needle. The floating piston and oil needle divide the PSB into a gas cavity and a number of oil cavities. The floating oil needle and the piston rod are filled with high-pressure nitrogen, which is the gas cavity, and the rest of the chambers are all oil cavities. There is an oil hole at the end of the piston rod, as well as an oil return gap between the piston rod and the floating piston to ensure that the oil can flow freely.
The oil pressure area of the right end of the floating piston is larger than the oil pressure area of the left side, so under the action of oil pressure difference, the floating piston is pressed on the step on the side of the cylinder. A trapezoidal step exists in the center portion of the piston rod, which also causes the piston rod to press against the left end of the floating piston under differential pressure. At this point, the PSB is internally force-balanced and in a neutral position.
Figure 3 depicts the operation of the pitch stabilizer buffer. The compression process is as follows: when the pitch stabilizer buffer is compressed by the external load, the floating piston is under the pressure to the left at this time, so it will be limited to the left side of the cylinder to keep immobile; the piston rod will be sliding to the left along the inner wall of the cylinder. At this time, the piston rod step is detached from the floating piston, and the oil in oil cavity 1 enters into cavity 2 through the oil return gap; then, the oil in oil cavity 2 enters into oil cavity 3 through the holes in the piston rod end. Then, the oil in oil cavity 3 flows into oil cavity 4 from the oil holes on both sides of the floating oil needle, and the oil flows through the holes, forming the oil flow through the oil holes. Then, oil from oil cavity 3 flows from the floating oil needle on both sides of the oil holes into oil cavity 4 and oil flows through the oil holes, resulting in the formation of an oil damping force. The oil in oil cavity 4 continues to push the floating oil needle to the right side of the slide, making the air cavity compressed, resulting in air spring force.
The tension process is as follows: when the pitch-stabilizing buffer is stretched by the external load, the piston rod will drive the floating piston to move to the right due to the action of the trapezoidal step. At this time, the oil return gap is blocked, and there is no oil flow between oil cavity 1 and oil cavity 2; however, the volume of oil cavity 2 is compressed, and the oil will enter into the oil cavity of oil cavity 3 through the oil holes at the end of the piston rod. This is followed by the oil in the oil cavity 3 entering through the same oil holes at the two sides of the floating oil needle into oil cavity 4, which generates the oil damping force; the oil in oil cavity 4 continues to push the floating oil needle to the right side of the sliding, which makes the air cavity compressed to generate the air spring force.
Based on the above discussion, the axial force f p s of the stabilizer buffer in the whole working process includes two kinds of air spring force f p a and oil damping force f p d .
The air spring force f p a expression is:
f p a = A a P 0 V 0 V 0 A a S n P a t m
In Equation (1), A a is the pressure gas area, P 0 is the initial gas cavity pressure, P a t m is the atmospheric pressure, V0 is the initial gas cavity volume, and is the gas variability index.
The oil damping force fpd expression is:
f p d = S ˙ + | S ˙ | 2 ρ o i l A h 3 S ˙ 2 C d 2 A d 2 + ρ o i l A h s 3 S ˙ 2 C d s 2 A n 2 S ˙ | S ˙ | 2 ρ o i l A h 3 S ˙ 2 C d l 2 A d l 2 + ρ o i l A h s 3 S ˙ 2 C d s 2 A n l 2 .
In Equation (2), ρ o i l is the oil density; A h is the pressurized oil area; A d and A d l are the areas of the main oil holes during the positive and negative compression strokes of the snubber, respectively; C d and C d l are the shrinkage coefficients of the main oil holes during the positive and negative compression strokes of the snubber, respectively; A h and C d s are the effective pressurized oil areas of the return chamber and the shrinkage coefficients of the oil holes, respectively; and A h and A h s are the total areas of the oil holes of the return chamber during the positive and negative strokes, respectively. Therefore, the PSB axial force f p s is expressed as:
f p s = f p a + f p d
After completing the PSB structural design scheme, the structural as well as filling parameters are taken and a preliminary set of parameters is designed, as shown in Table 1.

2.2. Modeling of FTLG Dynamics

To make the created landing gear dynamics model match the motion characteristics of the mechanical system in the real situation and facilitate the solution simultaneously, it is necessary to reasonably simplify the landing gear structure. Figure 4 depicts the geometric and force relationships of the components of FTLG.
The fuselage and landing gear connection point is selected as the origin to establish the coordinate system O X Y Z . The Z-axis vertical down is positive, the X-axis is perpendicular to the Z-axis, and the heading is positive. The connecting point of the frame and the main strut is selected as the origin to establish the local coordinate system O X U Y U Z U , and the differential equations of motion (DEM), the geometric equations of motion (GEM), and the force analysis equation (FAE) are established, respectively.
(1)
DEM
The motion of the entire landing gear cushion system is divided into two parts: the motion of the airframe (the outer cylinder of the landing gear and the upper part of the outer cylinder connected to the airframe) and the motion of the inelastic support part (ISP) of the landing gear (the landing gear except for the outer cylinder part). The fuselage motion consists of vertical advection and heading advection, which are given by Newton’s second law:
M Z ¨ = 1 a M g 2 F Z
In Equation (4), M is the mass of the fuselage, a is the ratio of lift to gravity, g is the gravitational acceleration, F Z is the MLG force on the fuselage, and Z ¨ is the vertical acceleration of the fuselage.
The motion of the ISP of the landing gear includes the horizontal translation of the mass of the movable part, the vertical translation, the rotation of the three sets of wheels, and the rotation of the frame. The DEM is as follows:
M U X ¨ U   = F X 2 D 1 2 D 2 2 D 3 M U Z ¨ U   = F Z 2 V 1 2 V 2 2 V 3 + M U g     I C θ ¨ C   = 2 V 1 L f 1 cos θ C 2 D 1 L f 1 sin θ C + 2 V 3 L f 1 cos θ C + 2 D 3 L f 1 sin θ C + F e d s     I 1 ω ˙ 1   = D 1 R δ 1     I 2 ω ˙ 2   = D 2 R δ 2     I 3 ω ˙ 3   = D 3 R δ 3
In Equation (5), M U is the mass of the ISP of the landing gear; X ¨ U is the heading acceleration of the ISP; Z ¨ U is the vertical acceleration of the ISP; I C is the inertia of the frame; θ C is the angle of rotation of the frame; θ ¨ C is the angular speed of rotation of the frame; L f 1 is the distance between the centers of the adjacent wheels; F e is the axial force of PSB; d s is the perpendicular distance between the center of the frame and the axis of PSB; V 1 , V 2 , and V 3 are the vertical loads of the front, middle, and rear wheelsets, respectively; D 1 , D 2 , and D 3 are the heading loads of the front, middle, and rear wheelsets, respectively; I 1 , I 2 , and I 3 are the moment of inertia of the front, middle, and rear tires, respectively; ω ˙ 1 , ω ˙ 2 , and ω ˙ 3 are the angular acceleration of rotation of the front, middle, and rear tires, respectively; and δ 1 , δ 2 , and δ 3 are the compression of the front, middle, and rear tires, respectively.
(2)
GEM
The landing gear’s main buffer compression stroke and compression speed expressions are:
S   = Z Z U / cos θ S ˙   = Z ¨ Z ¨ U / cos θ
In Equation (6), θ is the installation angle between the landing gear and the fuselage.
The main strut longitudinal bending deformation f B and deformation velocity f ˙ B expressions are:
f B   = X U + S sin θ / cos θ f ˙ B   = X ˙ U + S ˙ sin θ / cos θ
The coordinate expressions for the position of the center point of the front, middle, and rear machine wheels in the Z-direction are:
Z 1   = L f 1 sin θ C + Z U Z 2   = Z U Z 3   = L f 1 sin θ C + Z U
The front, middle, and rear tires’ vertical deformation δ i and vertical deformation velocity δ ˙ i are expressed as:
δ i   = Z i + R H , Z i + R > H 0 , Z i + R H δ ˙ i   = Z ˙ i , Z i + R > H 0 , Z i + R H
In Equation (9), i is the tire number, R is the radius of the wheel, and H is the height of the center point of the middle wheel from the ground.
Geometrical relations are analyzed for PSB and can be obtained from the cosine theorem:
L 2 + S e 2   = L f 1 d 2 2 + L 1 2 2 L f 1 d 2 L 1 cos π 2 θ C + θ
Derivatives are obtained by taking derivatives on both sides of the equal sign of Equation (7) simultaneously, then organizing and simplifying:
S ˙ e   = L f 1 d 2 L 1 sin π 2 θ C + θ θ ˙ C L 2 + S e
In Equations (10) and (11), S ˙ e is the PSB’s compression speed, L 1 is the distance from PSB at the main strut installation point to the center point of the frame, and L 2 is the PSB’s original length.
The vertical distance 1 from the frame center point to the PSB axis d s is as follows:
d s = L f 1 1 L 2 + S e 2 + L f 1 d 2 2 L 1 2 2 L f 1 d 2 L 2 + S e
(3)
FAE
The landing gear main strut is analyzed for forces along the normal direction:
N S   = K B f B + C B f ˙ B K B   = 3 E J L S L S L b S 2 C B   = η c M U K B
In Equation (13), N S is the landing gear strut’s normal force; K B is the strut’s normal stiffness; C B is the strut’s normal damping; E J is the cushion strut’s cross-section bending modulus; and η c is the cushion strut’s longitudinal bending vibration structure damping ratio, generally taken as 0.07.
The expression for the axial force F S between the outer cylinder and the piston rod of the landing gear main strut is:
F s = K S S S < S 0 F a + F d S 0 S < S max K S S S max S S max
In Equation (14), K S is the structural limiting stiffness; S 0 and S max are the main buffer initial and maximum compression, respectively; F a is the main buffer air spring force; and F d is the main buffer oil damping force. F a and F d are calculated similarly to Equations (1) and (2) and will not be repeated.
Since both ends of PSB are connected to the main strut and the frame by the articulated form, it can be simplified to the force form of a two-force bar with only axial force. According to the analysis in the previous section, it can be seen that the PSB axial force includes two parts, the air spring force and the oil damping force. In order to facilitate the later solution calculation, the PSB force is simplified to a linear spring damping form, and its axial force expression is:
F e = K e S e + C e S ˙ e
In Equation (15), K e is the PSB equivalent air spring stiffness and C e is the PSB equivalent oil damping coefficient.
After considering the effect of PSB, the forces at the landing gear–fuselage attachment point are analyzed, and the force balance equations are presented:
F X   = F S sin θ N S cos θ + F e sin θ F Z   = F S cos θ + N S sin θ + F e cos θ M y   = N S L a + L s L b S + F e cos ϑ θ L a + L s L b S L 1
In Equation (16), ϑ is the mounting angle between PSB and the main strut, L a is the length of the outer cylinder, L s is the length of the piston rod, and L b is the length of the overlapping portion of the outer cylinder and the piston rod in the fully extended state of the landing gear.
V = 1 + C T δ ˙ f δ D = μ V
In Equation (17), C T is the tire vibration damping coefficient, f δ is the tire static pressure curve function, and μ is the coefficient of friction between the tire and the ground.

3. Dynamic Performance Analysis of FTLG during Landing Process

3.1. Analysis of FTLG Drop-Shock Dynamics

In order to keep the structural elements of the airplane from overloading during landing, the landing gear must be able to effectively absorb the energy generated by the impact. The drop-shock dynamics analysis is intended to verify that the landing gear cushioning system meets the design work absorbed, while also verifying that the overload and strut compression stroke of the landing gear meet the design requirements and that the structural strength meets the expectations. Therefore, before analyzing the landing dynamics of the whole aircraft, drop-shock dynamics analysis is usually performed on a single MLG.
In this drop-shock simulation analysis, a single-chamber oil–gas buffer was selected for the main buffer. To optimize the cushioning effect of the designed buffer, the buffer filling parameters needed to be designed [15]. After repeated iterative calculations, a set of main buffer filling parameters was obtained, as shown in Table 2.
In this paper, the landing gear drop-shock dynamics were analyzed using the imitation lift method. At the moment when the landing gear wheels touched the ground, the lift imitation force began to act to provide a constant lift simulation, and the lift imitation force was canceled when the MLG reached the maximum compression stroke. The FTLG drop-shock simulation parameters are shown in Table 3:
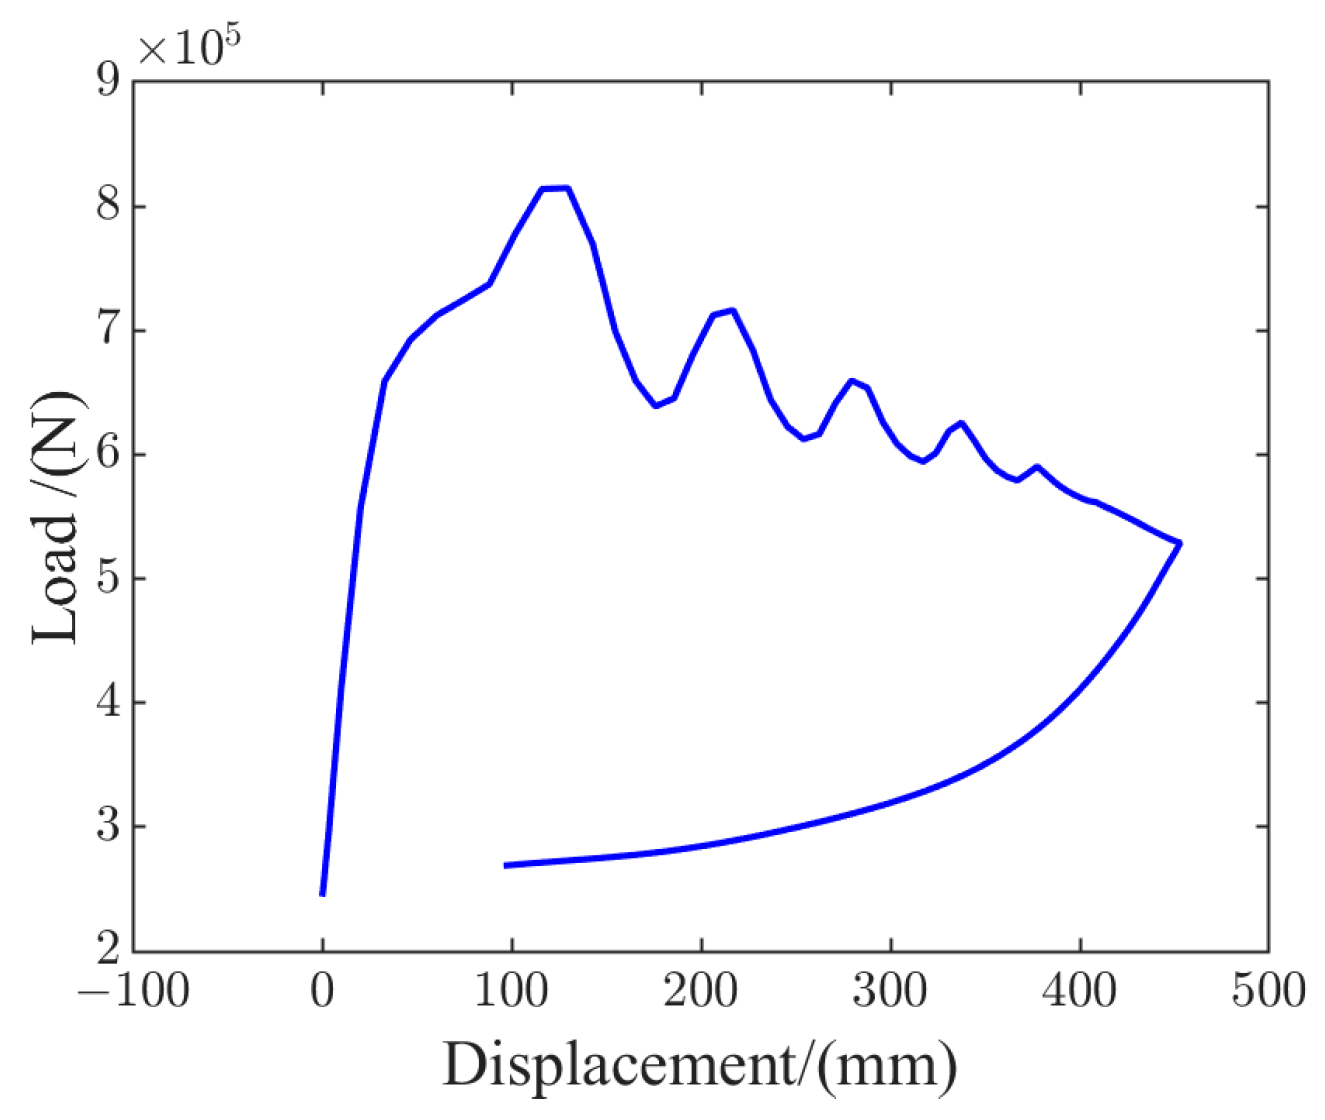
After solving the kinetic calculation, as shown in Figure 5, the main buffer power diagram (main buffer axial load variation with compression stroke) was obtained. It can be seen from the figure that the power diagram was saturated, and the buffer efficiency reached 82.74%, meeting the technical requirement. The maximum compression stroke was 486 mm, not exceeding the permissible stroke.
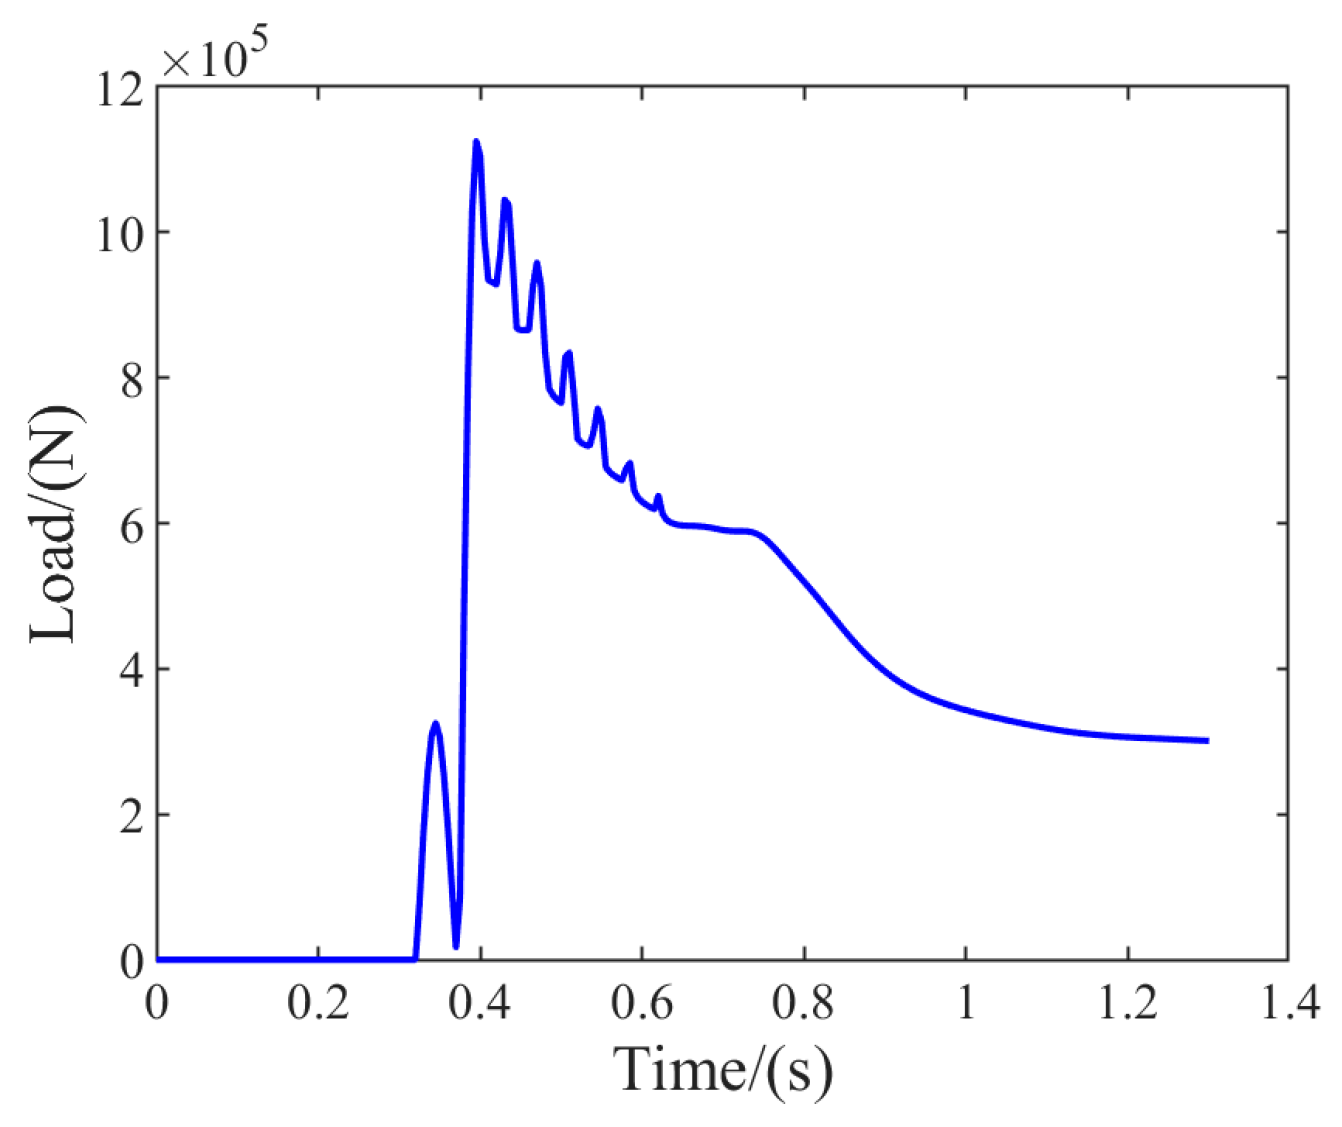
Figure 6 demonstrates the relationship of the vertical load with time during the FTLG drop-shock process. The vertical load reached a maximum value of 967,077 N at 0.4 s. At this time, the maximum vertical overload of FTLG was 1.21, which indicates that the landing shock load was also within the permissible range.
In conclusion, after adopting the above filling parameters, the buffer efficiency, compression stroke, and vertical overload all met the requirements. This indicates that the main buffer has excellent performance and can support the subsequent research and analysis.

3.2. Analysis of Whole-Aircraft Landing Dynamics

The drop-shock dynamics analysis only considers the motion process of a single FTLG, but when the airplane lands, the fuselage can generate pitch and roll motions accordingly. Therefore, it is necessary to establish a whole-aircraft landing dynamics model in order to simulate the real landing situation and to consider the influence of the fuselage posture on the landing loads.
It is assumed that the airplane is in a symmetric landing attitude, which means that the longitudinal plane of symmetry of the airplane is perfectly symmetric and the two MLGs contact the ground at the same time [16]. 
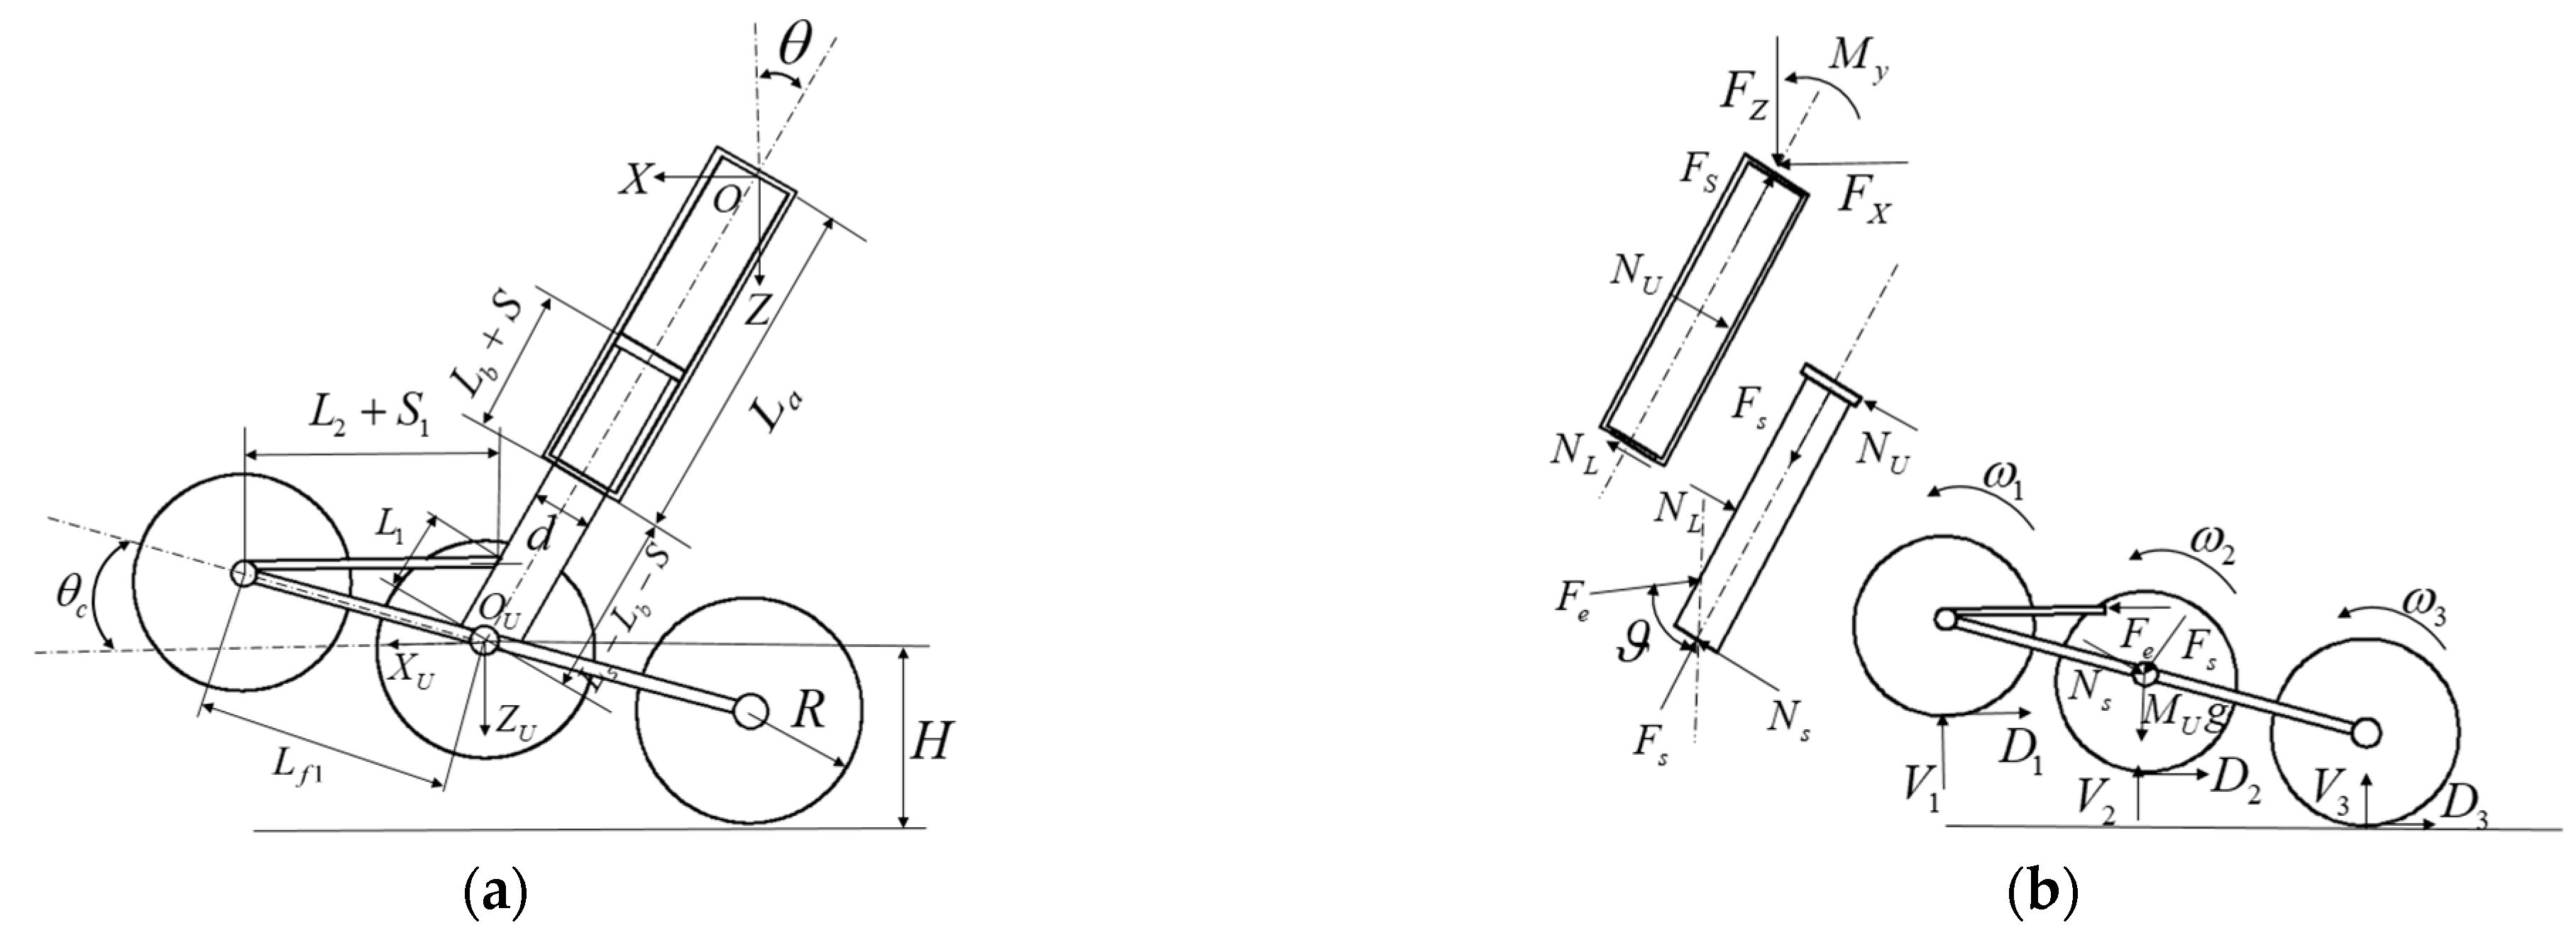
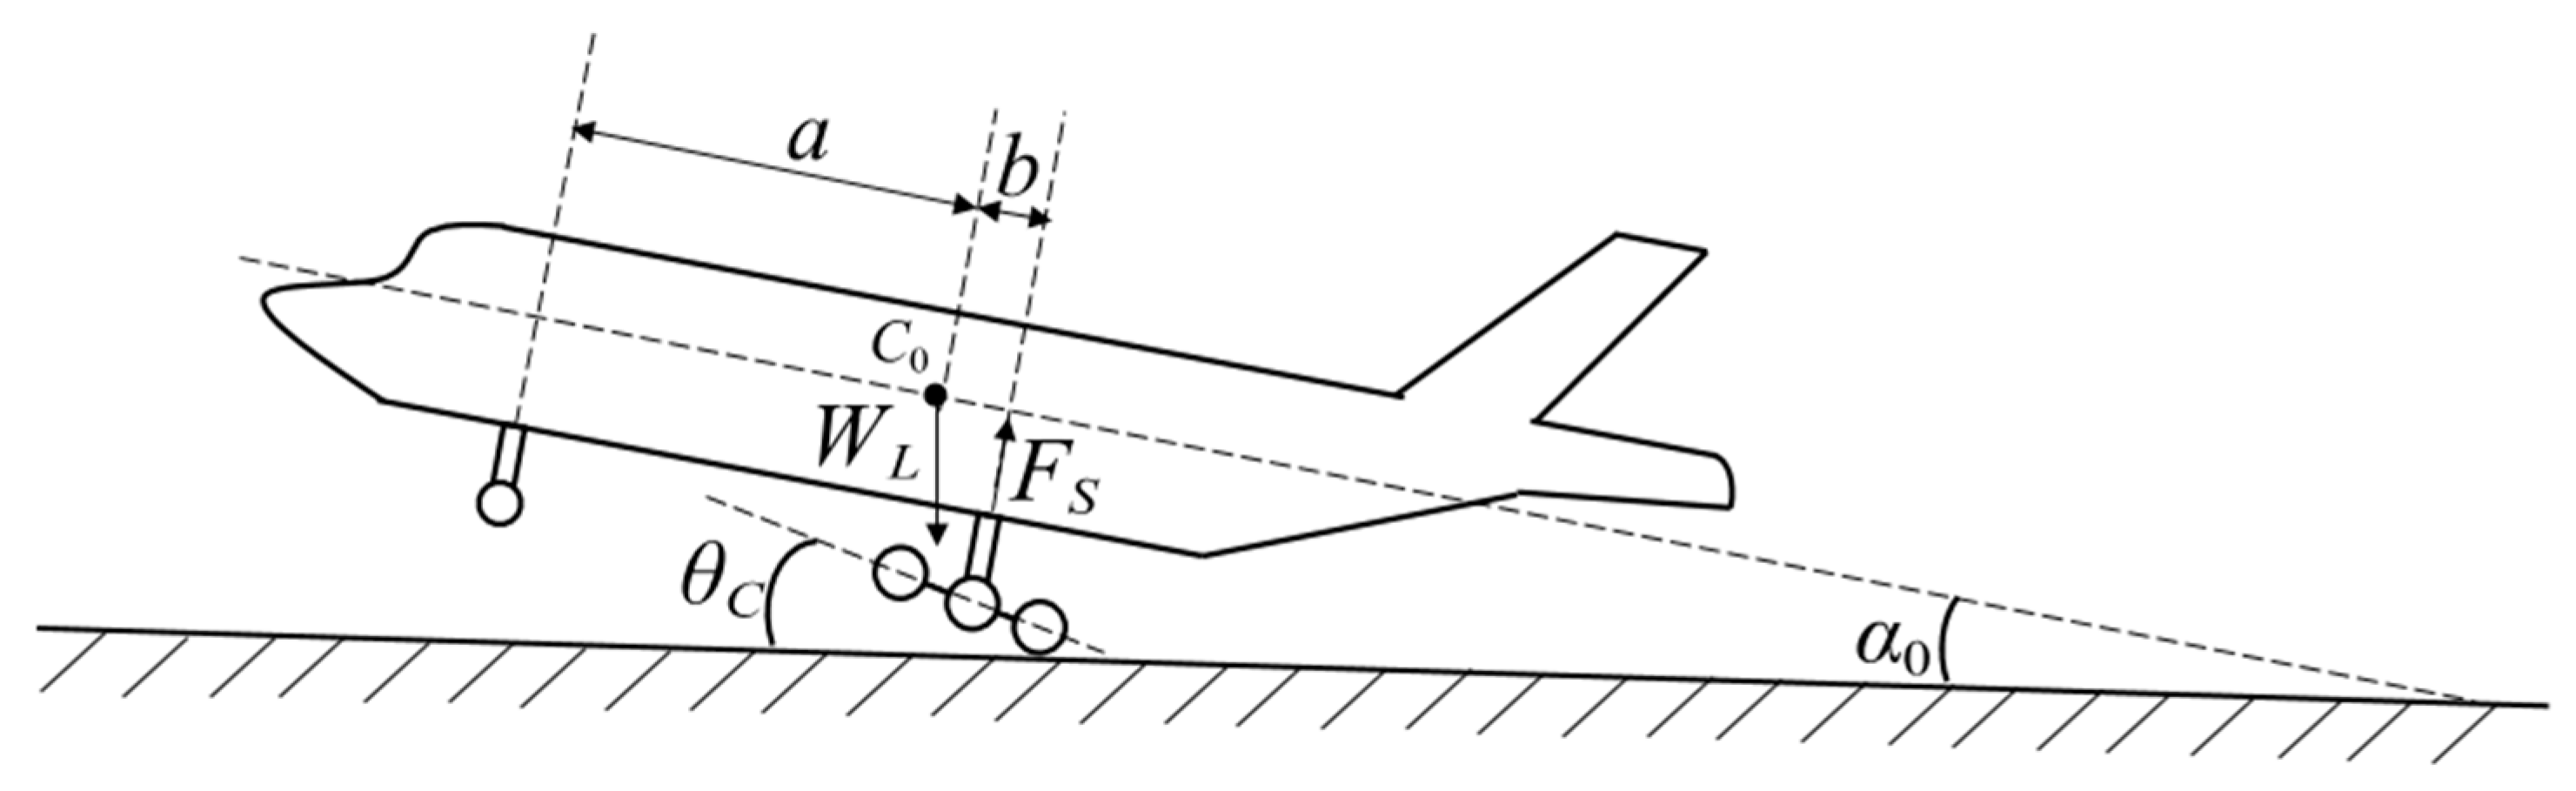
Figure 7 illustrates a side view of the symmetrical landing of the aircraft, C 0 is the center of gravity of the fuselage, F S is the axial reaction force of the main strut, a is the distance from the nose landing gear (NLG) mounting point along the longitudinal axis of the fuselage to the center of gravity, b is the distance from the MLG mounting point to the center of gravity, W L is the design mass of the aircraft for landing, α 0 is the tail sink angle (the angle between the longitudinal axis of the fuselage and the runway’s horizontal surface), and θ c is the frame lift angle (the angle between the frame axle line and the runway’s horizontal surface).
When an airplane lands symmetrically, the fuselage motion needs to consider its own rotational freedom around the lateral axis as well as its translational freedom along the vertical direction. When the MLG touches down, the axial reaction force of the main strut gradually increases, the vertical velocity of the airplane decreases, and meanwhile, the fuselage generates a rotational motion around the transverse axis [17]. Therefore, the dynamical equations of the fuselage landing process are:
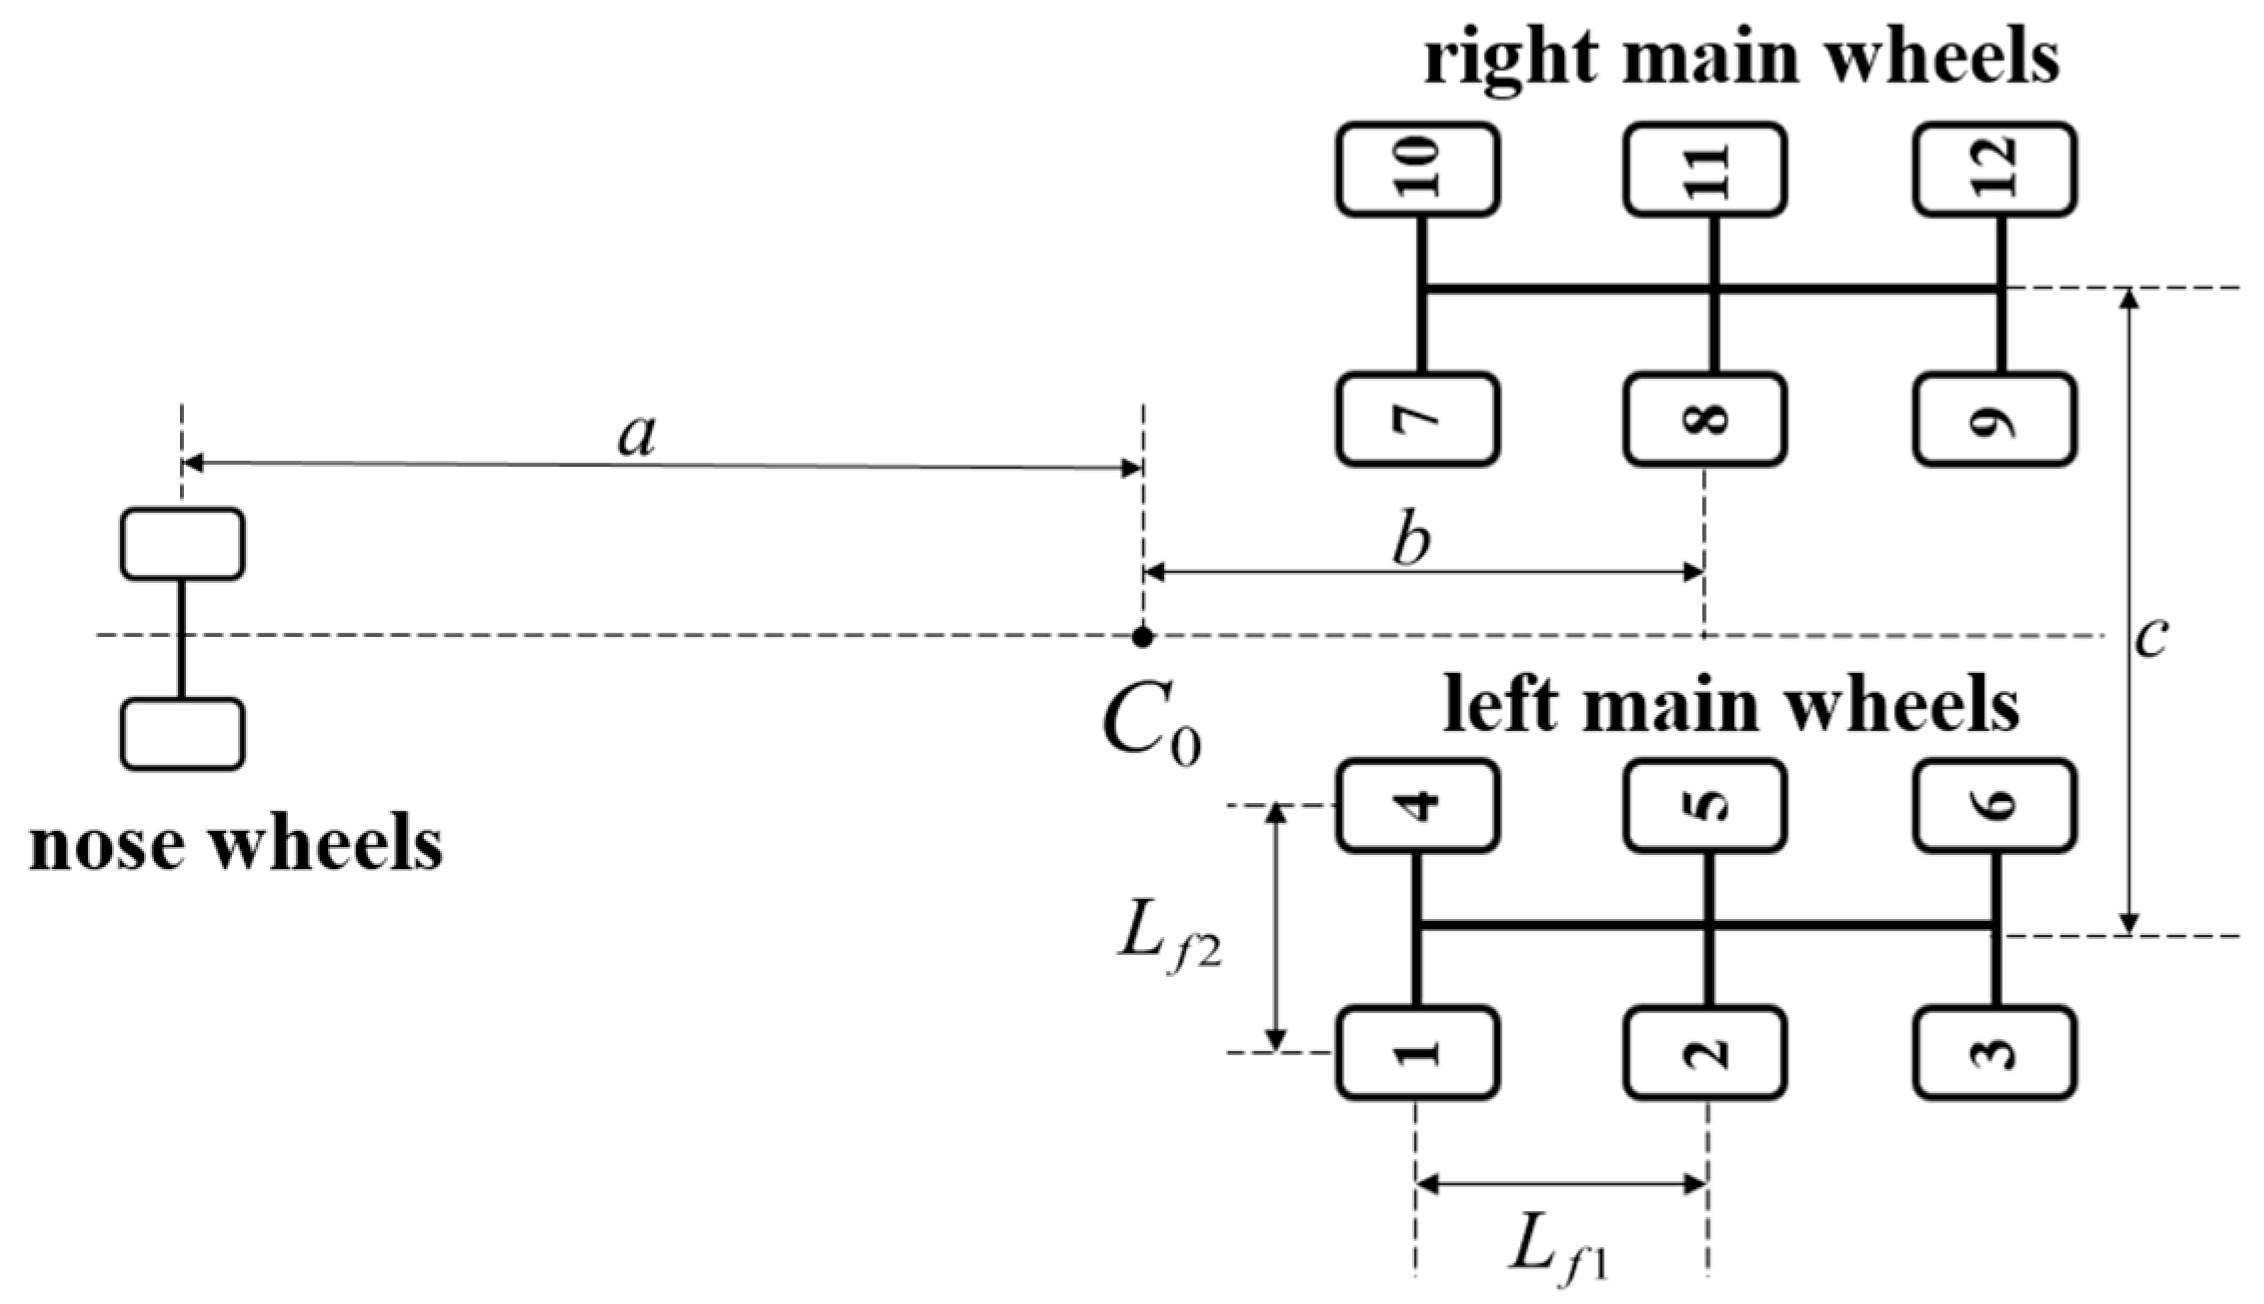
m t 2 z ¨ = 2 F s cos α + W L I y y ω ˙ = 2 b F s
As shown in Figure 8, the wheels are labeled, and the main wheel arrangement dimensions are also labeled.
The overall parameters of the aircraft and the main landing gear mounting dimensions parameters required for this whole-aircraft landing dynamics analysis are shown in Table 4.
After inputting all the parameters, the analysis results are obtained after solving the dynamic equations. Since the aircraft is in a symmetric landing attitude, the left and right MLG dynamics results are basically the same, so only the unilateral MLG dynamic performance can be analyzed (the left MLG is taken as an example in this paper).
(1)
Influence analysis of PSB filling parameters during the landing process.
DOE is a systematic approach designed to help researchers optimize experimental design and improve experimental efficiency and accuracy. The core principle of DOE is to find the main factors affecting the response variable by systematically varying the experimental factors and to observe the changes in the response variable [18,19,20].
The PSB mainly absorbs the energy generated by the violent vibration of the frame at the landing instant through oil damping. Therefore, when designing the test condition based on the DOE principle, the effect of the oil damping coefficient on the dynamic performance of the MLG can be investigated by controlling the air spring stiffness, leaving it unchanged.
Based on the DOE design principle, the first group of simulation conditions is set up with PSB not working, and this acts as a comparison reference group. In addition, two groups of normal PSB working conditions are added. The first group adjusts the filling air pressure to 10 MPa and the diameter of the damping hole to 11.2 mm, which converts the air spring stiffness to 13,000 N/m, and the oil damping coefficient to 107,000 N.s2/m2; the other group keeps the filling air pressure unchanged at 10 MPa and adjusts the diameter of the damping hole of PSB to 10 mm, which allows the damping coefficient to reach 175,000 N.s2/m2. The simulation condition settings are shown in Table 5.
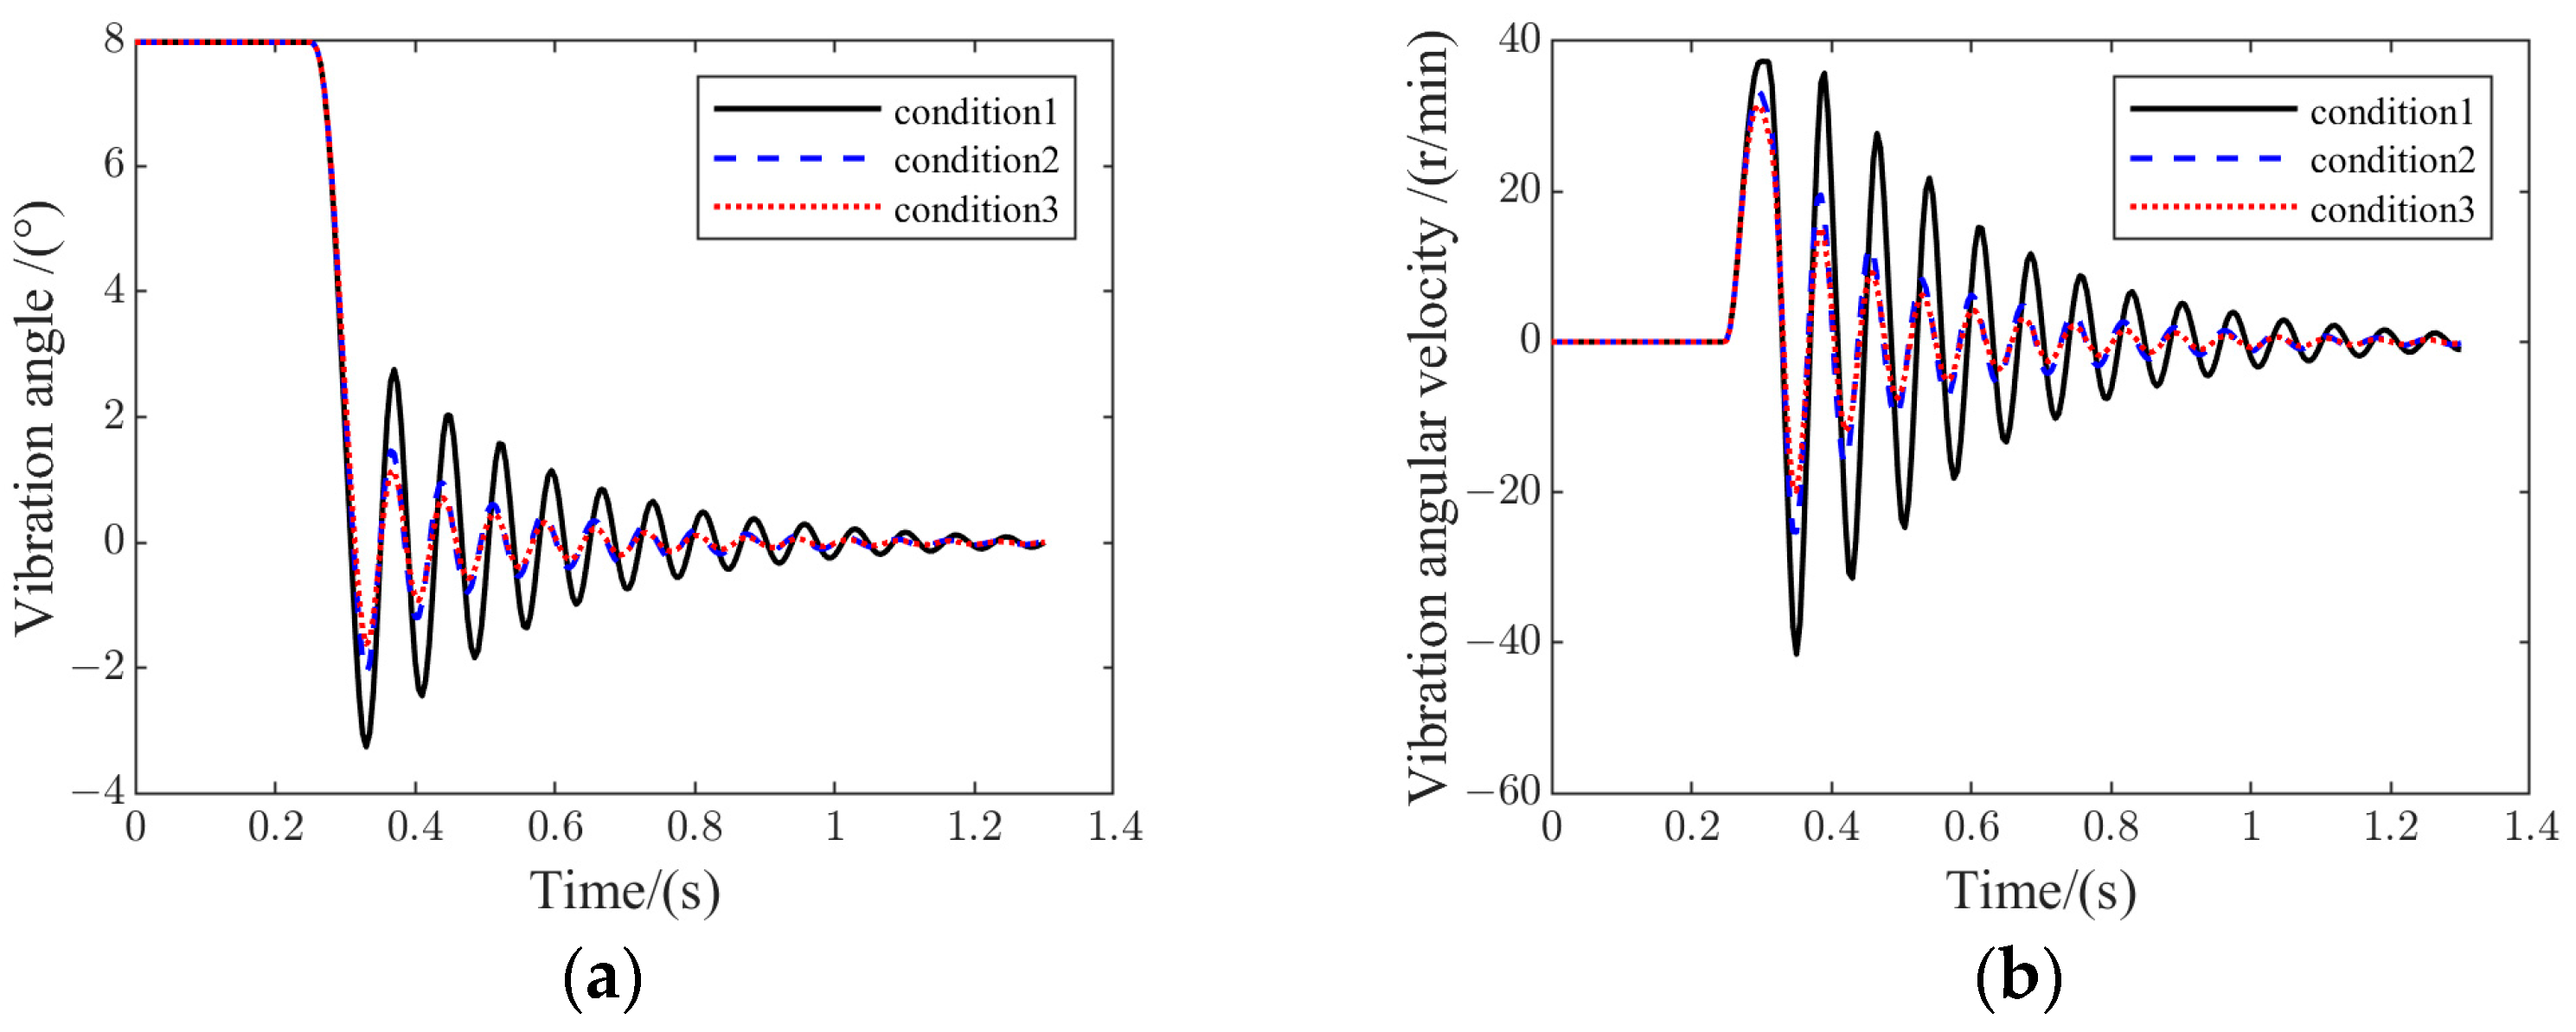
Figure 9 represents the results of frame vibration variation for conditions 1, 2, and 3.
It can be found that the frame vibration angle angular velocity of condition 1 is much larger than that of conditions 2 and 3. The convergence speed is slow, which indicates that when PSB does not work, the frame vibration is intense and the vibration energy is difficult to be absorbed. The comprehensive results of the three conditions show that the amplitude of the frame vibration angle and angular velocity tend to decrease as the oil fluid coefficient becomes larger. This shows that increasing the oil damping coefficient can effectively absorb the frame vibration energy.
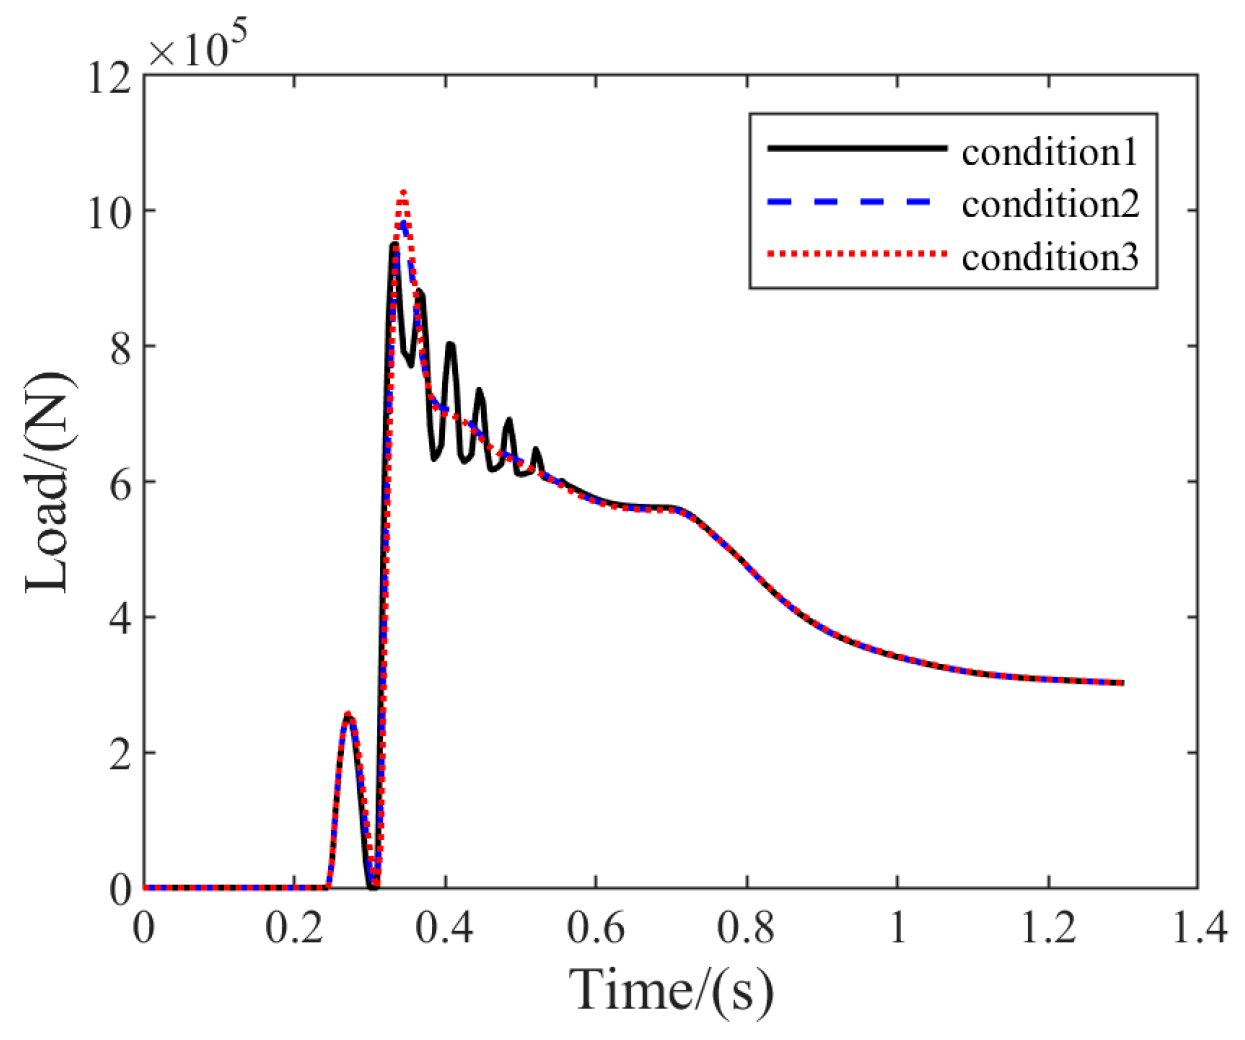
Figure 10 demonstrates the results of the total MLG vertical load variation for conditions 1, 2, and 3.
Combining the results of conditions 1 to 3, it can be seen that the total MLG vertical load increases as the oil damping coefficient increases, and the maximum vertical load increases from 967,077 N under condition 1 to 1,027,700 N under condition 3. This indicates that the increased damping coefficient leads to an expansion of the vertical overload of the MLG.
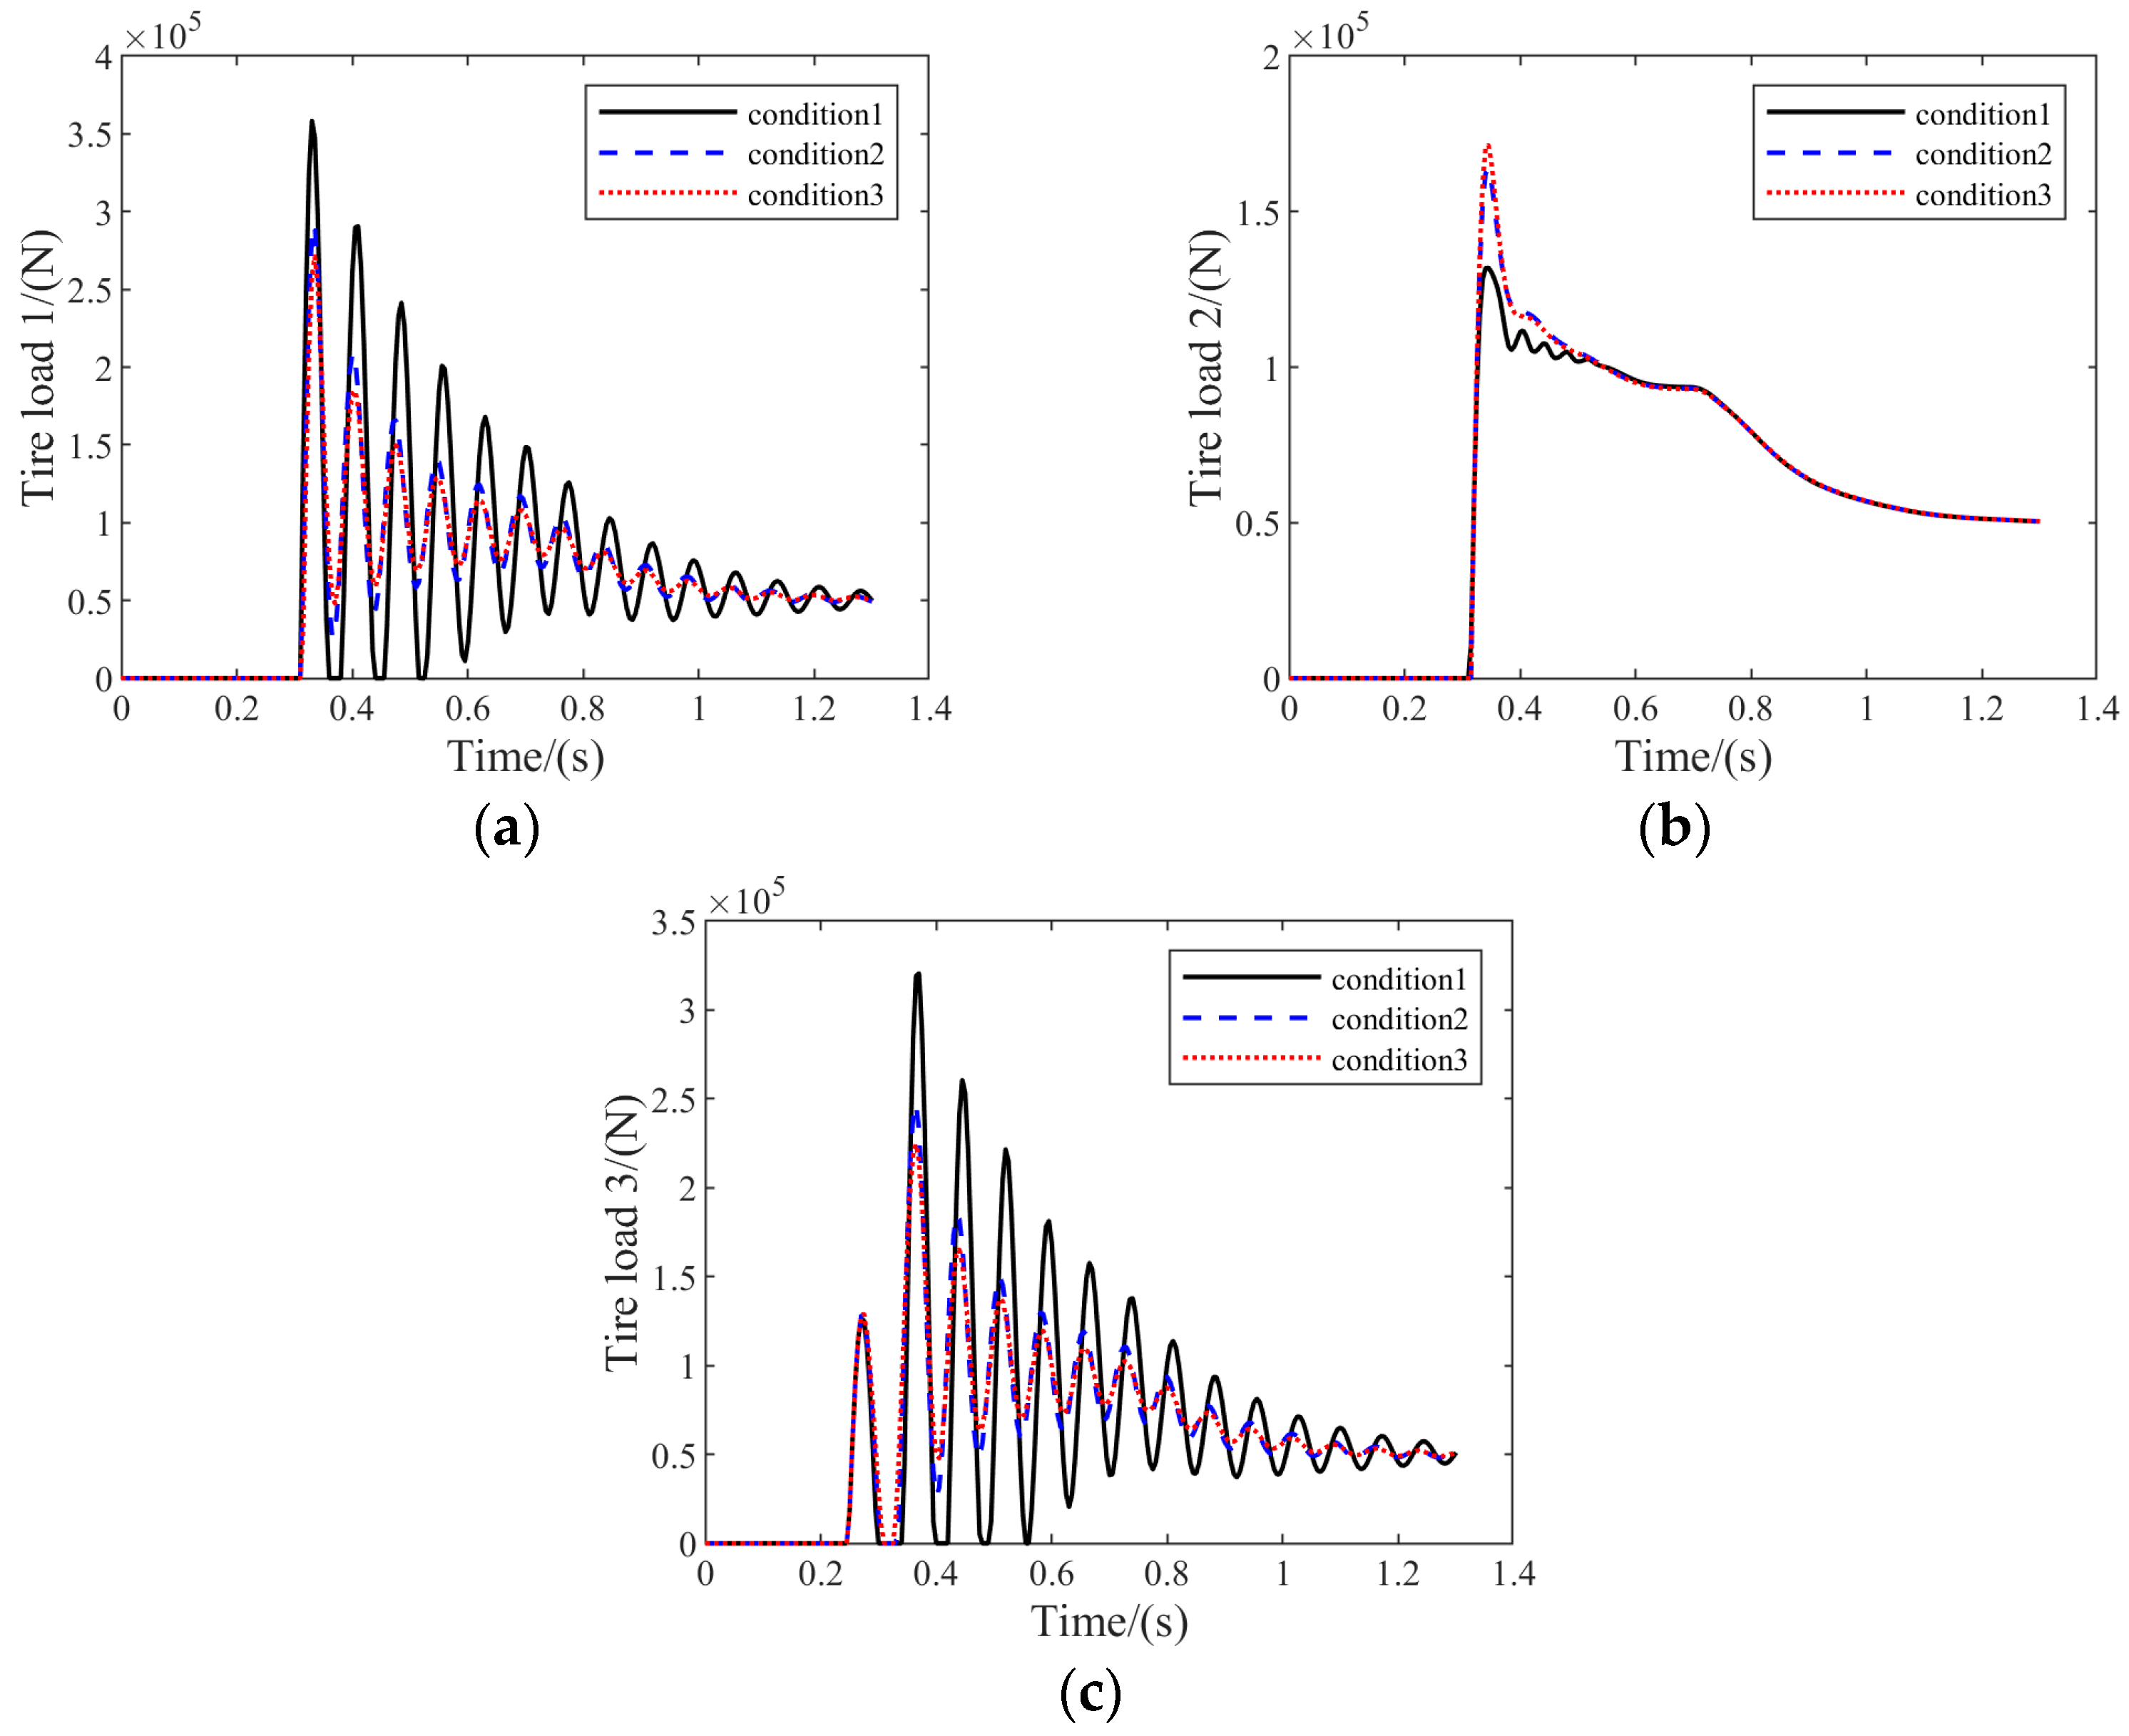
Figure 11 represents the results of variation in the vertical loads of different tires of MLG for conditions 1, 2, and 3.
The ratio of the FTLG front, middle, and rear wheelset loads reflects the frame balance performance; a lower ratio indicates a better frame balance effect. The six tires of FTLG are symmetrically distributed along the frame axis, so the ratio of the three tires’ loads on one side of the frame can be analyzed to characterize the ratio of the wheelset loads. From the analysis results of conditions 1~3, it can be seen that the rear wheel (tire 3) is the first to touch the ground in all conditions because the frame has an 8° head-up angle. In condition 1, due to the absence of PSB, tire 1 and tire 3 have a zero load in the first few oscillation cycles, which indicates that the front and rear wheels jumped off the ground in the landing process. This may seriously affect the structural safety of the landing gear. Comparing the analysis results of condition 2 and condition 3, with the increase in the oil damping coefficient, the ratio of the vertical load of the front wheel group, middle wheel group, and rear wheel group decreases from 4.3:3.3:2.4 in condition 2 to 4.2:3.3:2.5 in condition 3 at the moment of maximum vertical load. This indicates that the increase in the damping coefficient can balance the front and rear tires to a certain extent.
The peaks of the simulation test results for working conditions 1~3 are counted, and are shown in Table 6. It can be concluded that for the aircraft landing stage, the increase in the PSB damping coefficient contributes to suppressing the vibration of the frame, but it increases the MLG overload.
(2)
Influence analysis of PSB structural parameters during the landing process.
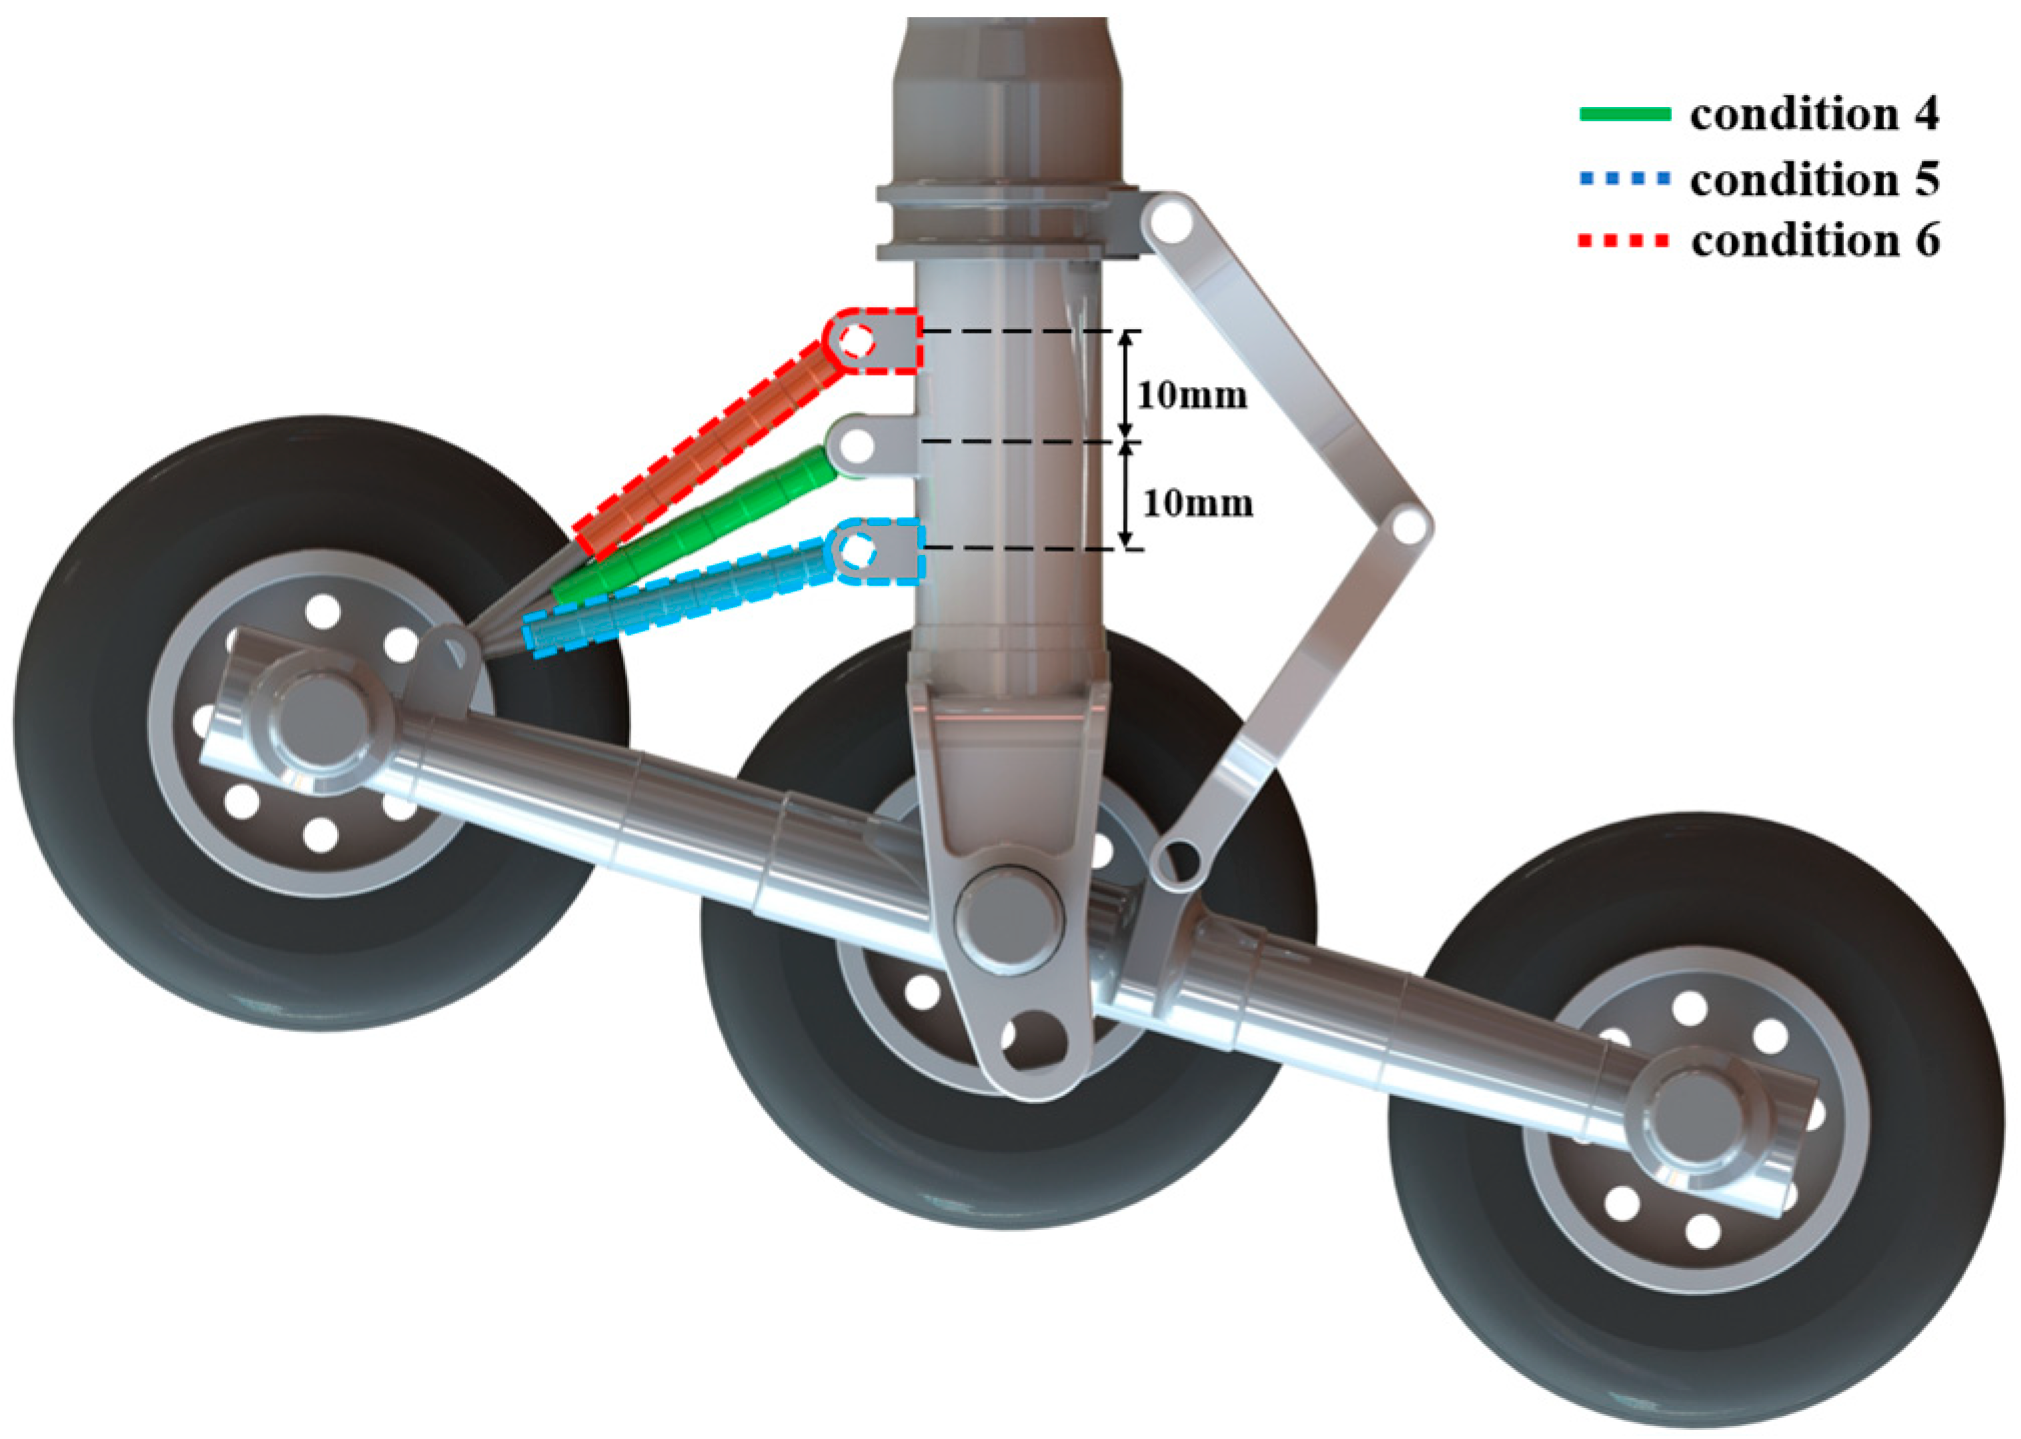
The influence analysis of structural parameters in this paper was achieved by changing the installing angle of the PSB to ensure the regularity of the simulation’s working condition settings. As shown in Figure 12, we kept the installation point of one end of the frame unchanged. Three groups of different conditions were designed by adjusting the installation point of the cylinder end of the PSB on the main strut.
The PSB installation point position cannot be adjusted too much to prevent the compression of the main buffer from causing interference between the cylinder of the landing gear and the PSB. Hence, in the analysis described in this paper, taking the initial installation point of the cylinder of PSB as the reference, the installation point of PSB at one end of the main strut was adjusted upward and downward by 10 mm, and the air spring stiffness and the oil damping coefficient were kept the same as the parameters of condition 4. The simulation conditions were set up as shown in Table 7.
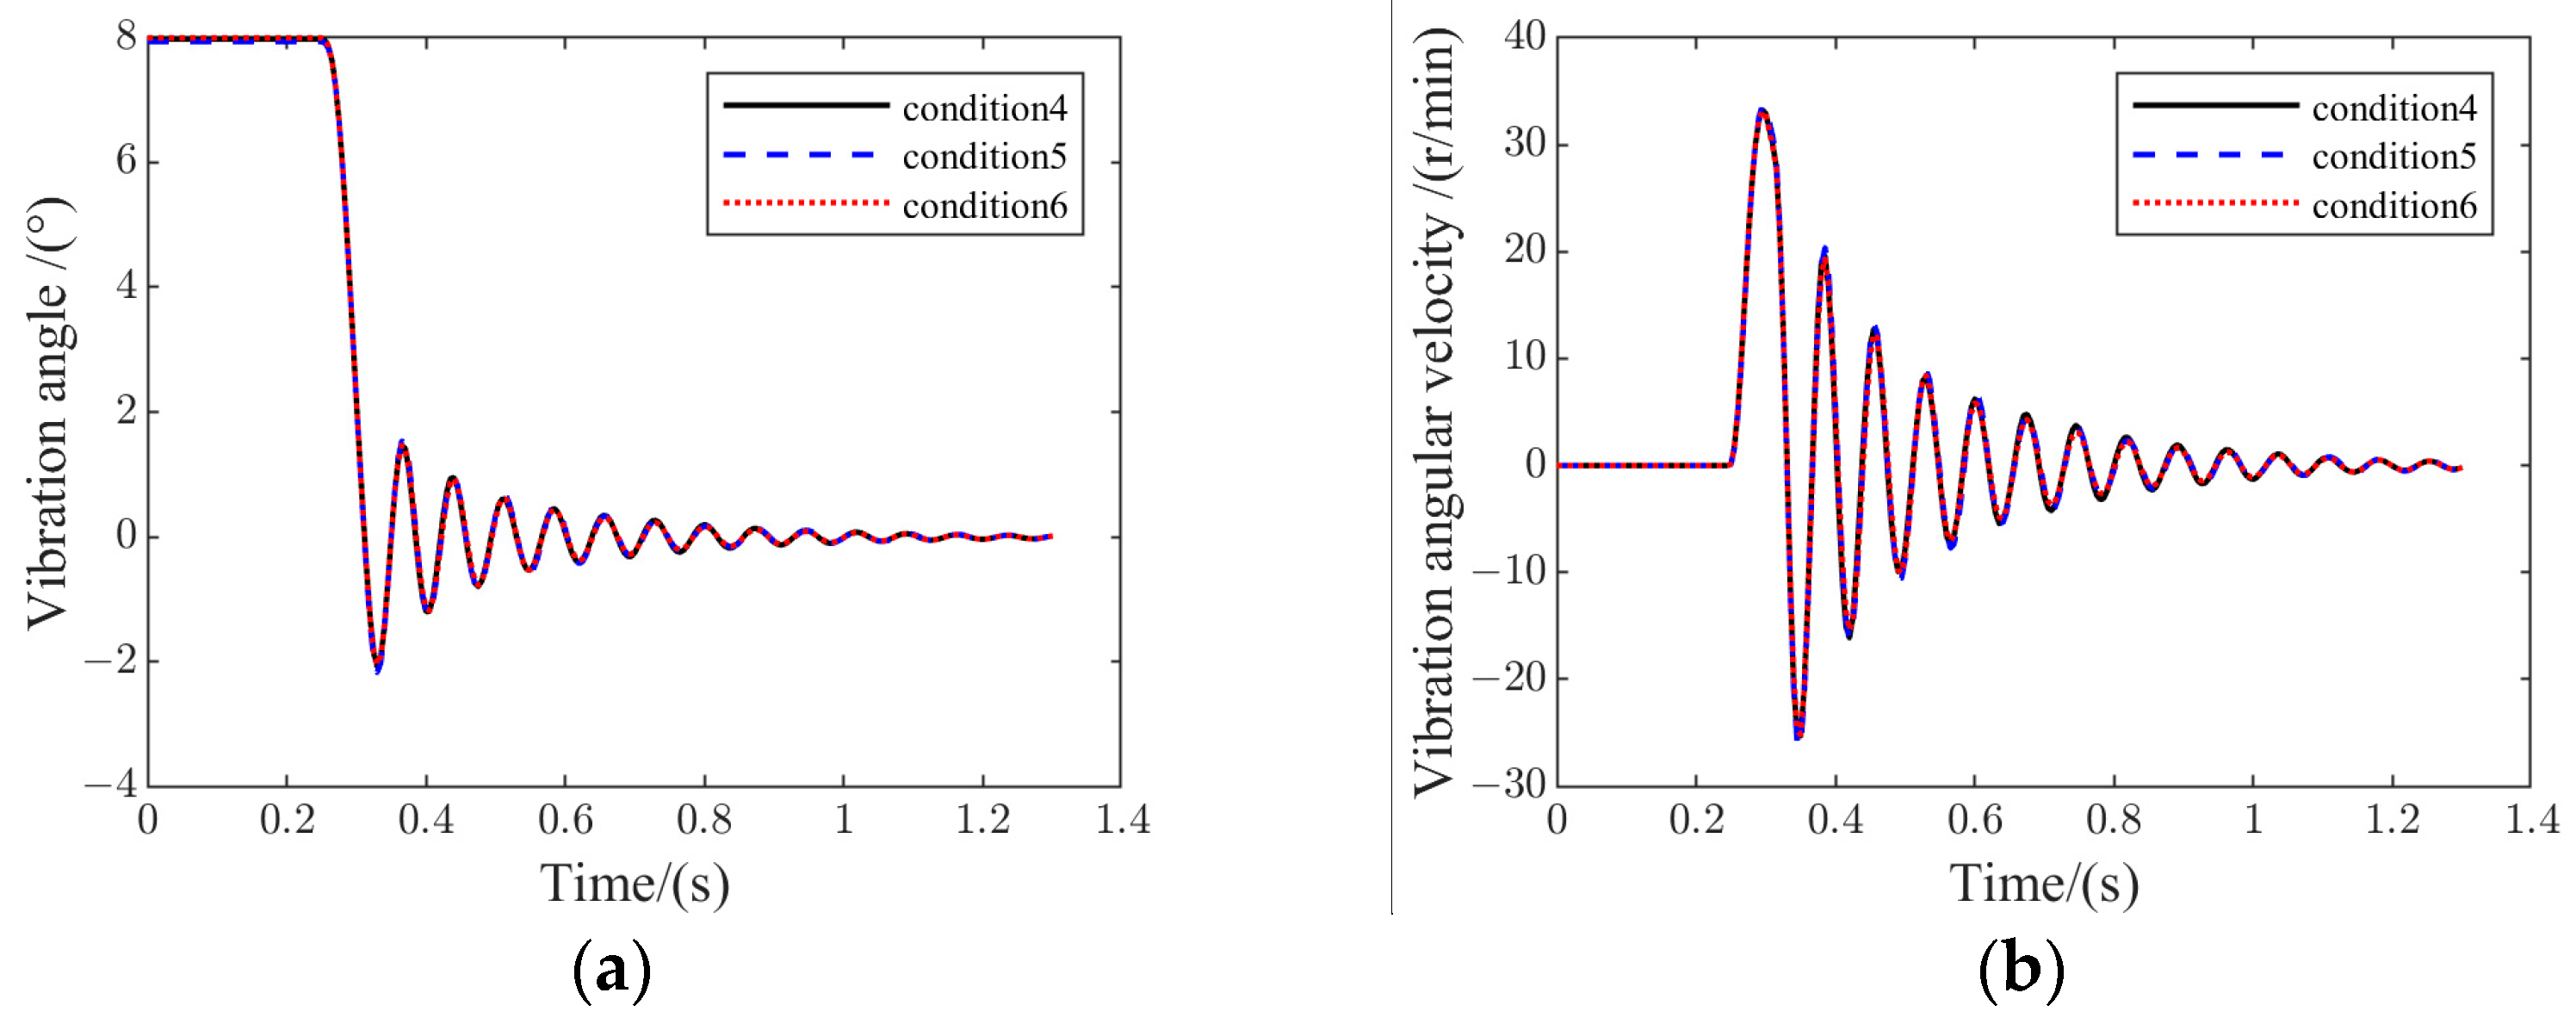
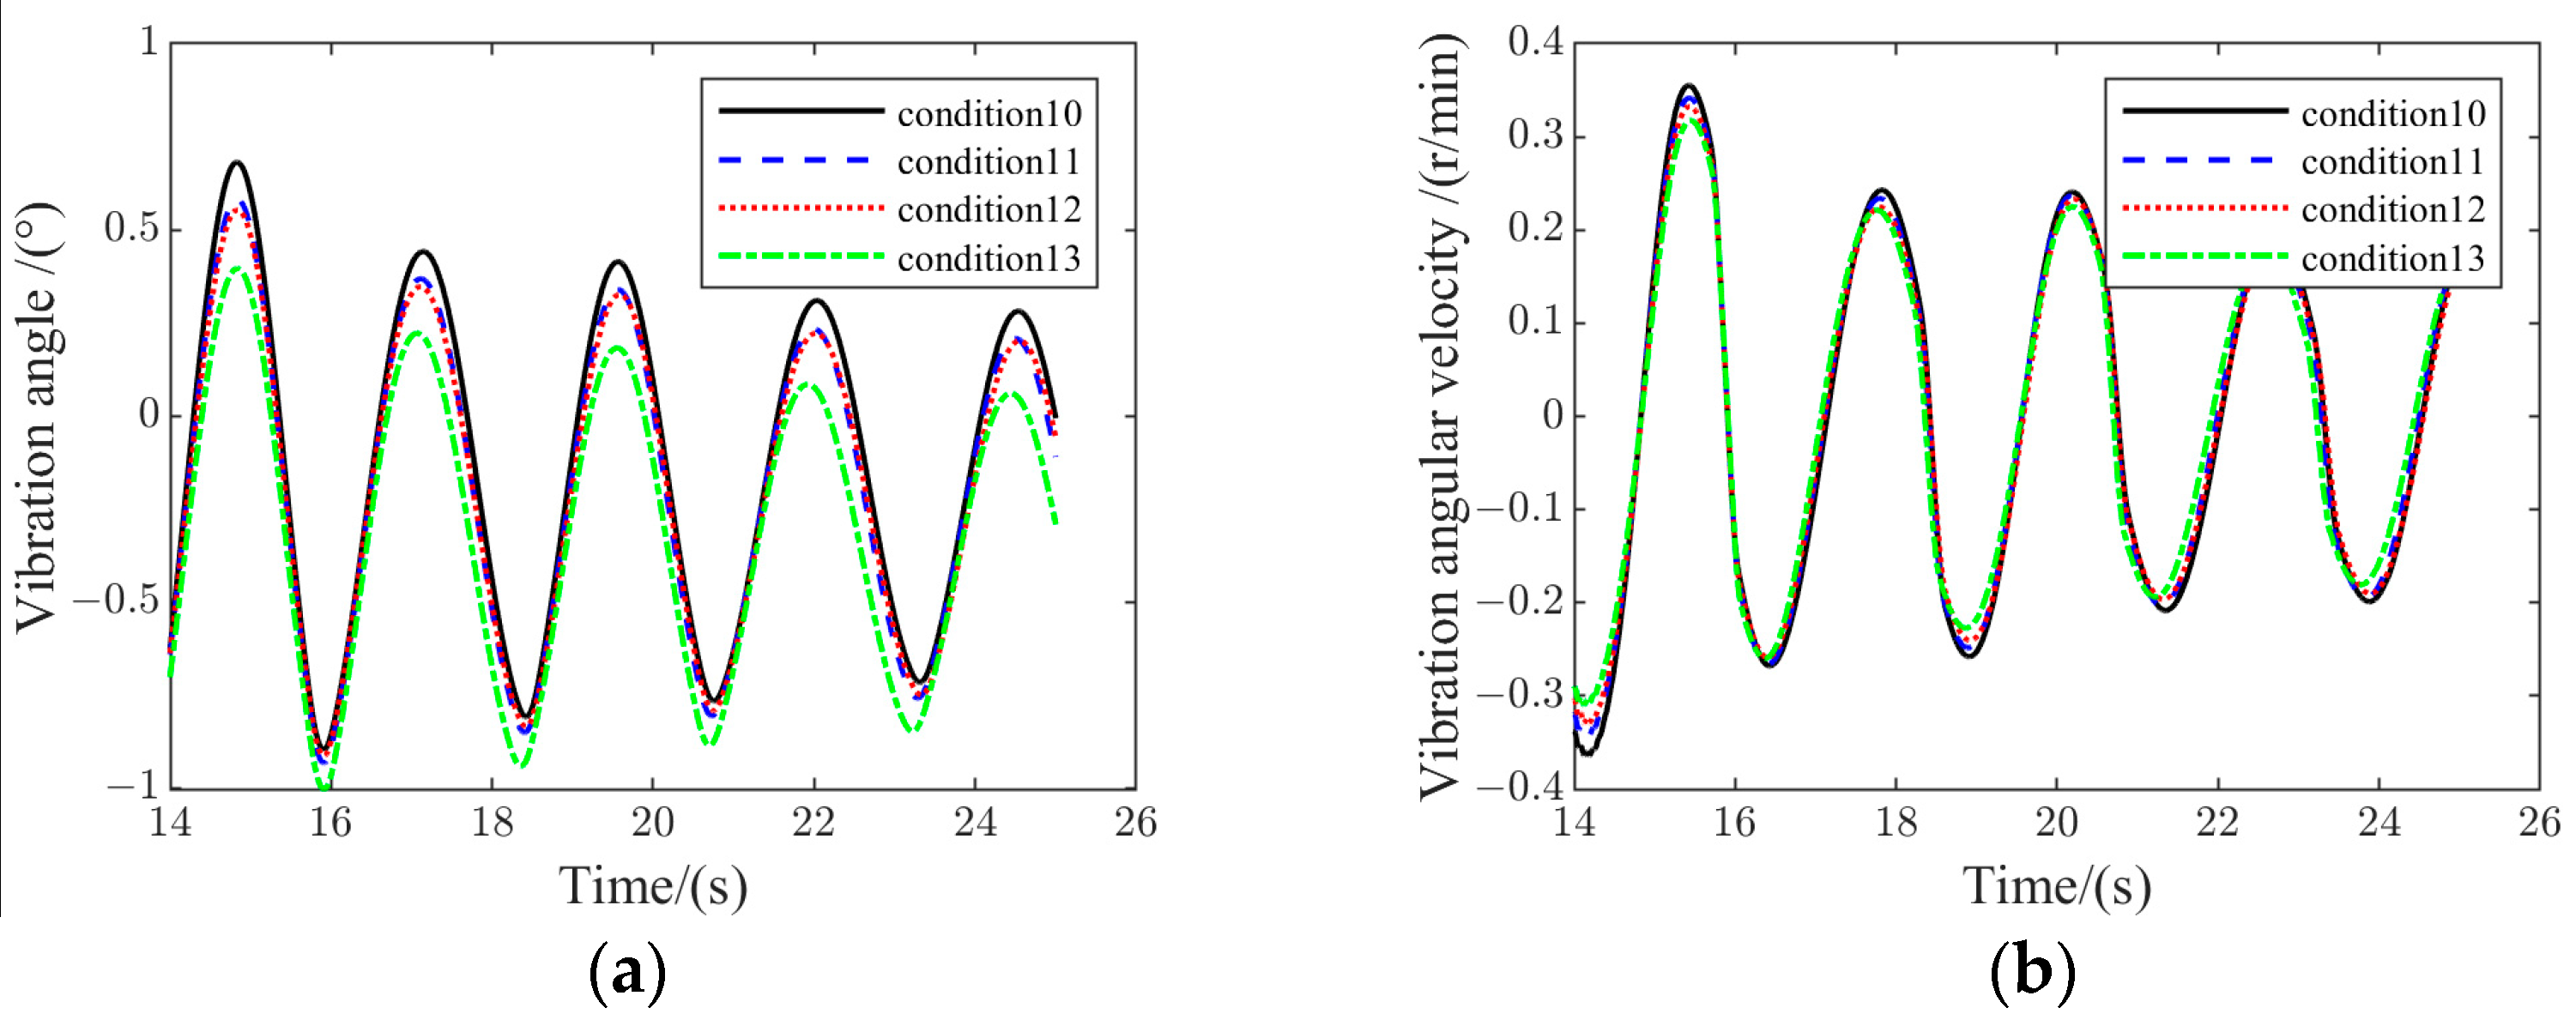
Figure 13 demonstrates the results of frame vibration variation for conditions 4, 5, and 6.
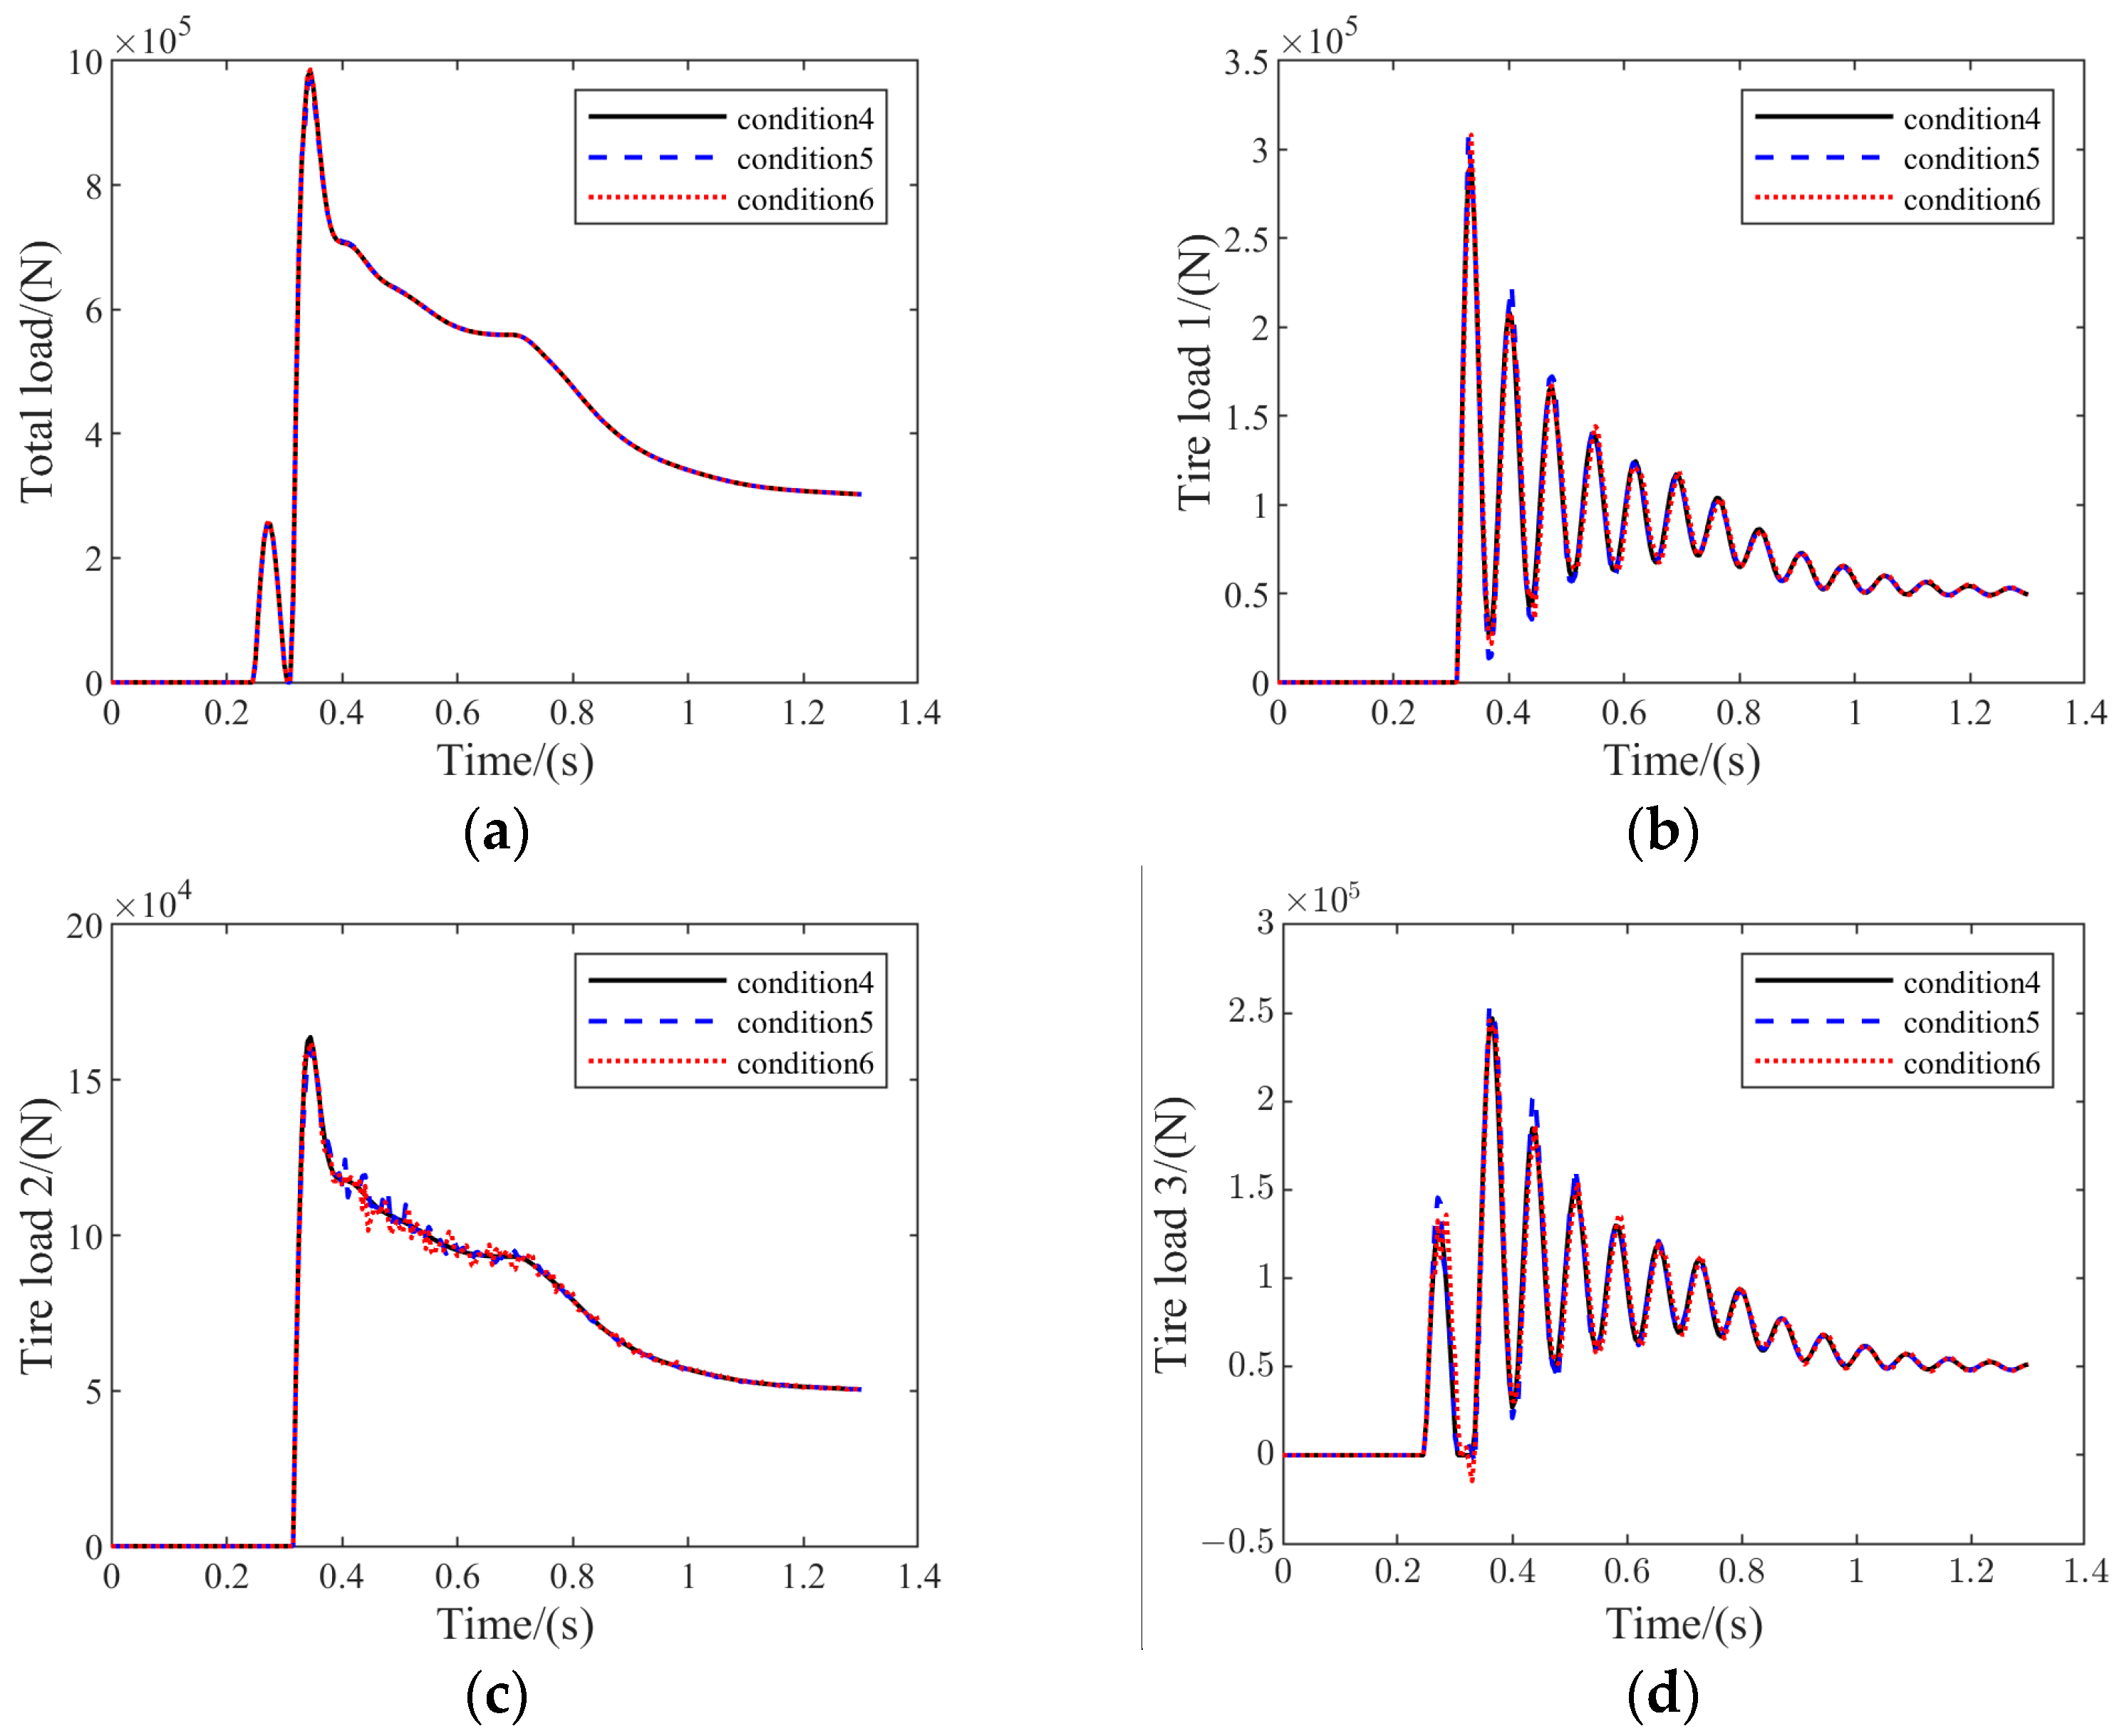
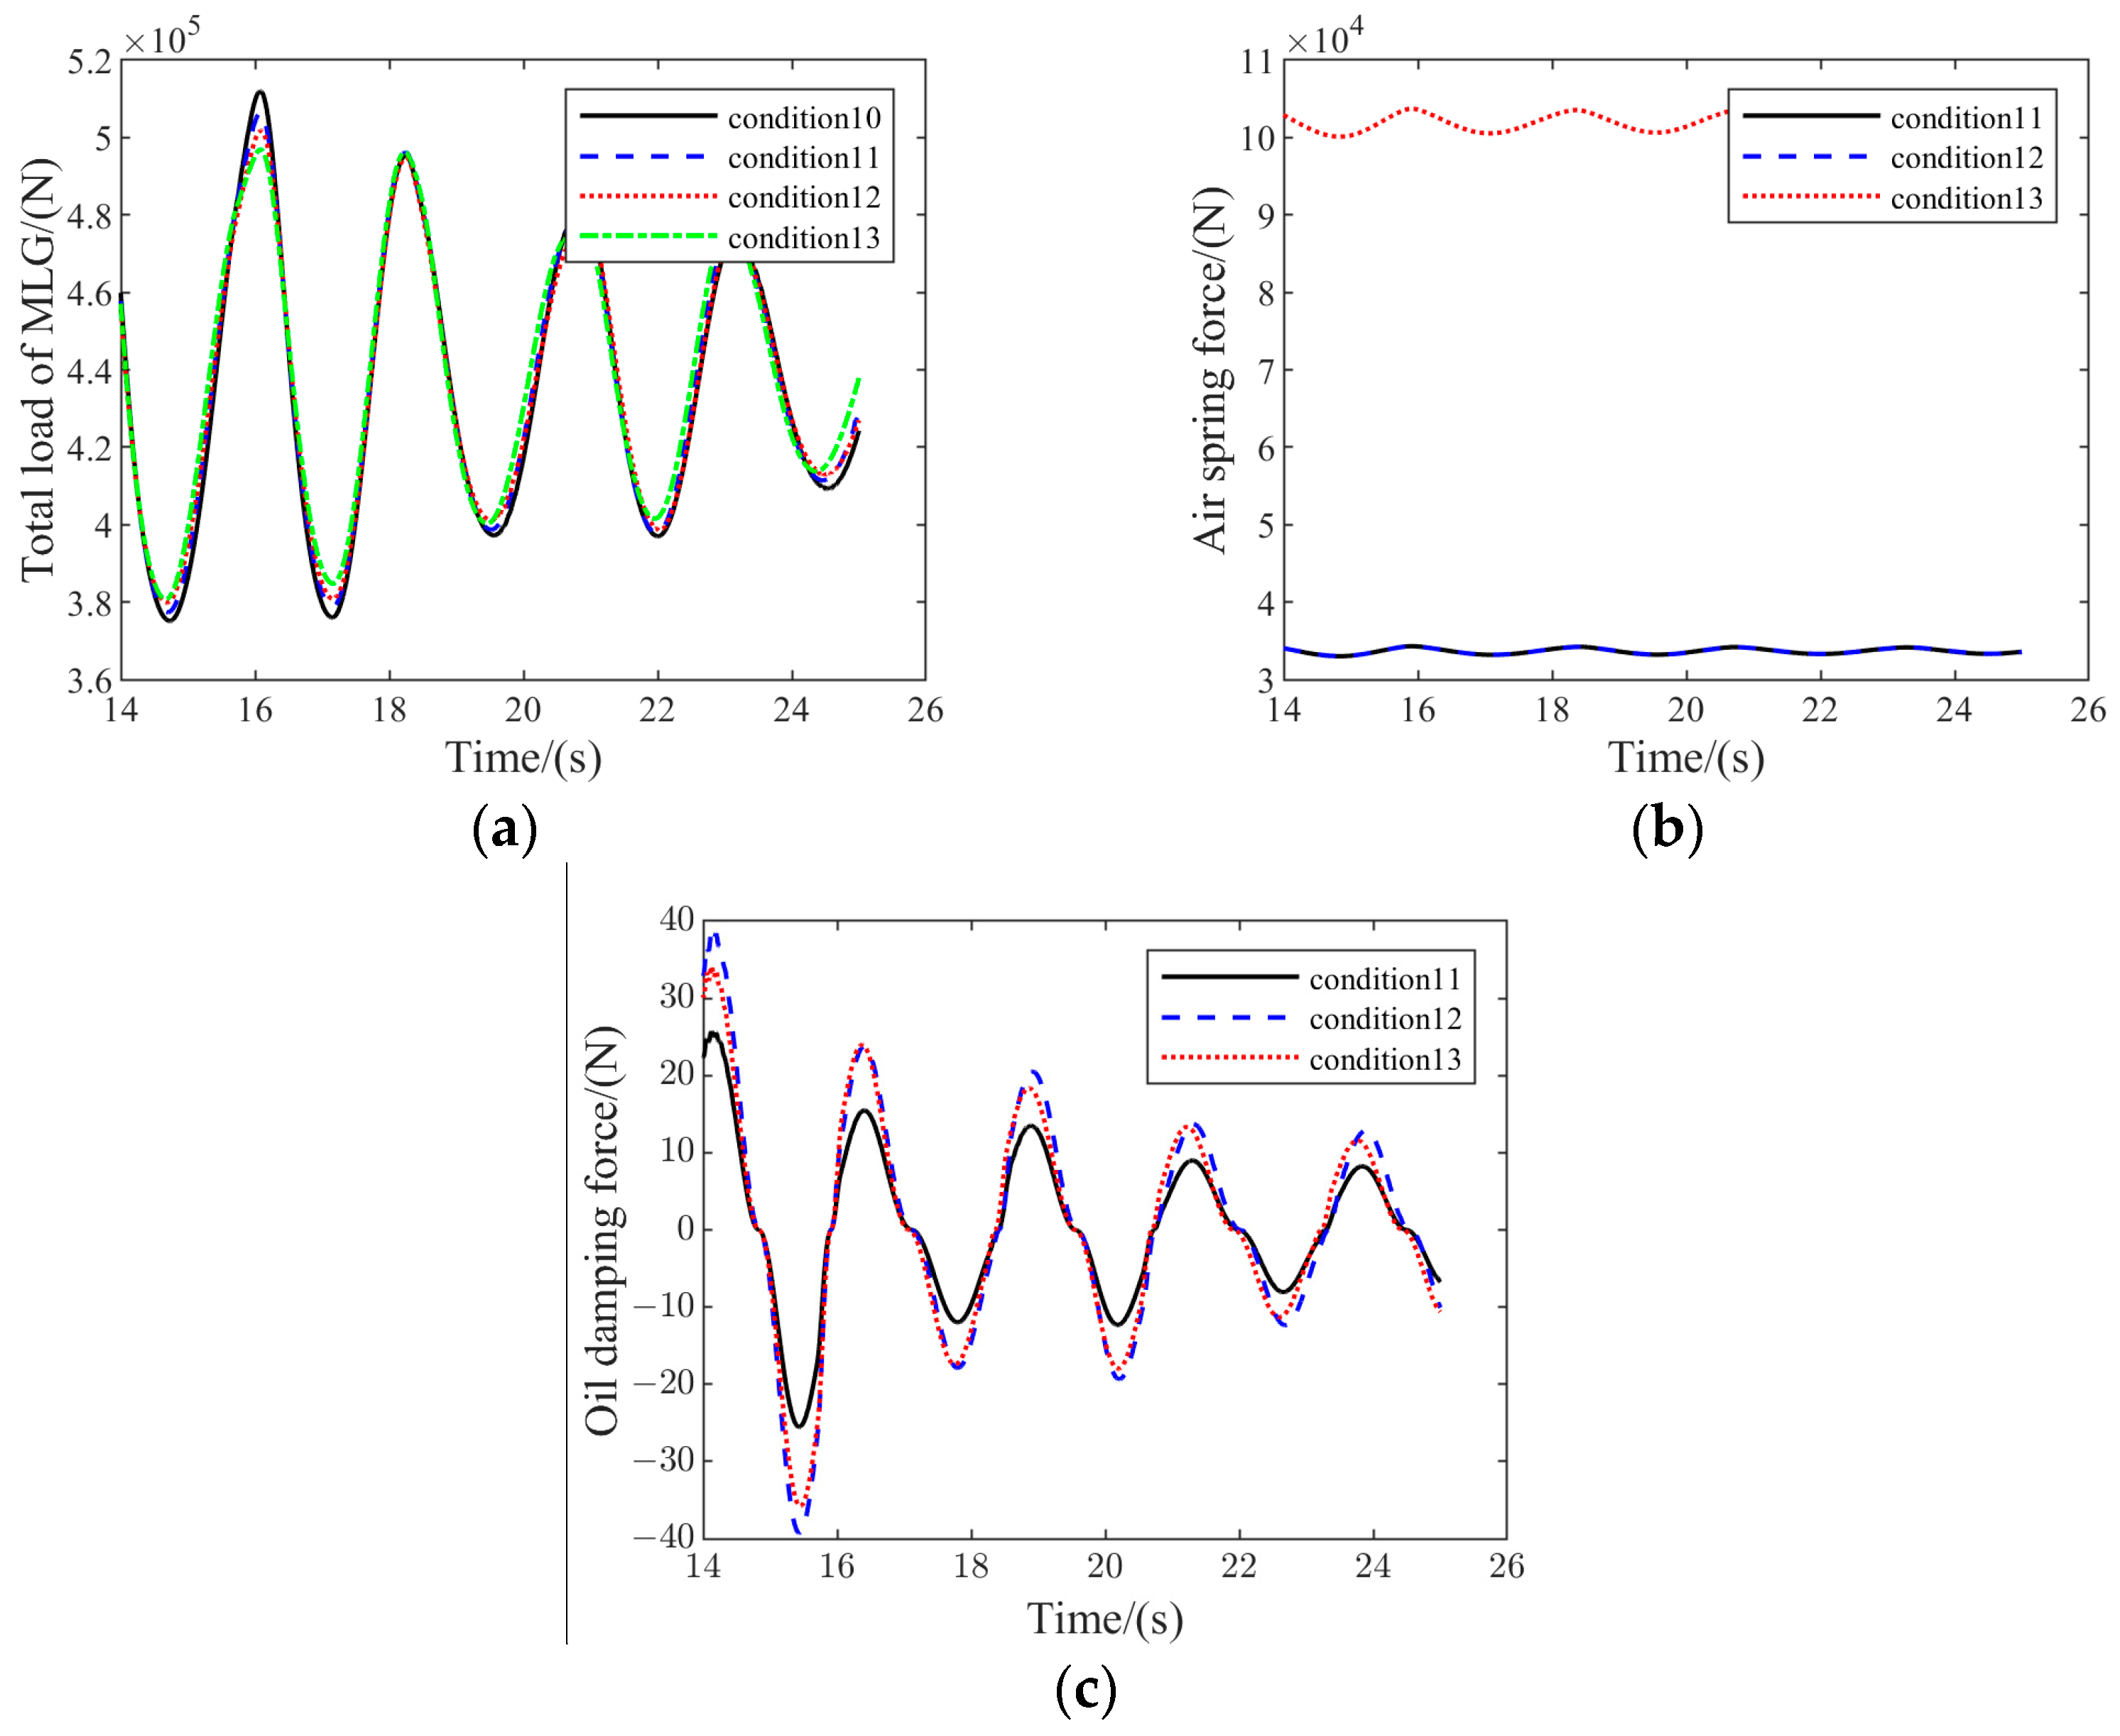
Figure 14 illustrates the results of MLG and tire load variation for conditions 4, 5, and 6.
Figure 14 reveals that the total vertical MLG loads and tire loads also changed to a very minor degree. The ratio of total vertical MLG loads to vertical tire loads tended to increase slightly as the PSB installation point became higher.
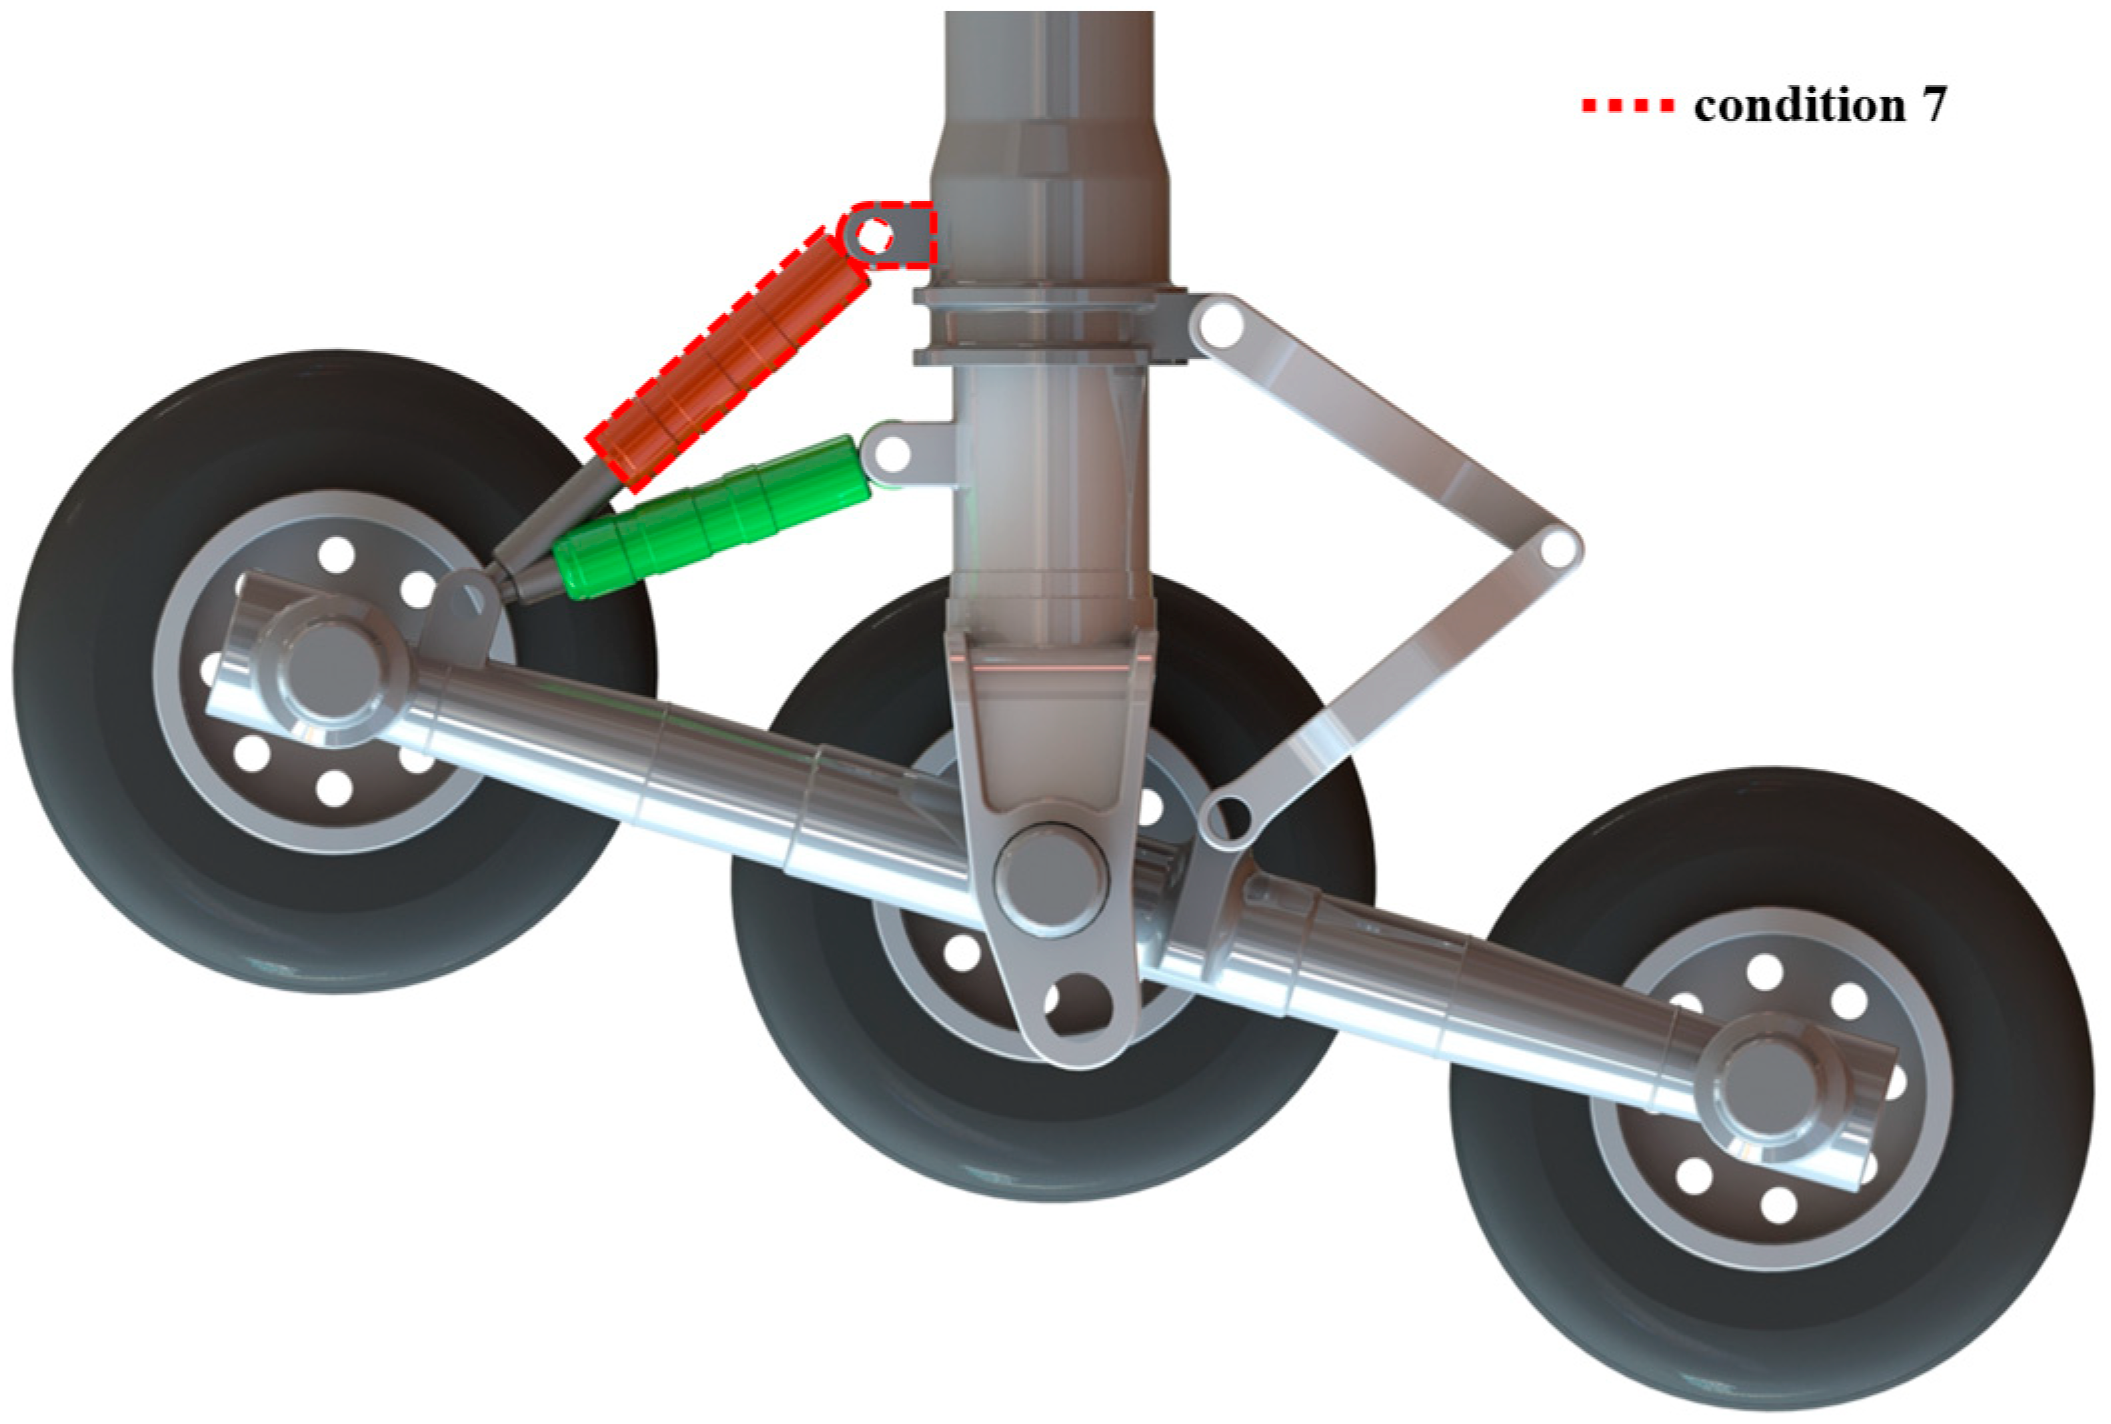
According to the above analysis results, the changes in the frame vibration and load changes were relatively small. This was due to the limitation of the physical structure of the landing gear, whereby the compression stroke of the main buffer was large during the landing process. Thus, the adjustment space of the PSB’s installed position on the piston rod of the landing gear was also limited. To further validate the effect of the PSB installing angle on the dynamic performance of the landing gear, a new condition, 7, as shown in Figure 15, can be added to articulately mount the PSB on the outer cylinder end of the main strut to further reduce the PSB installation angle.
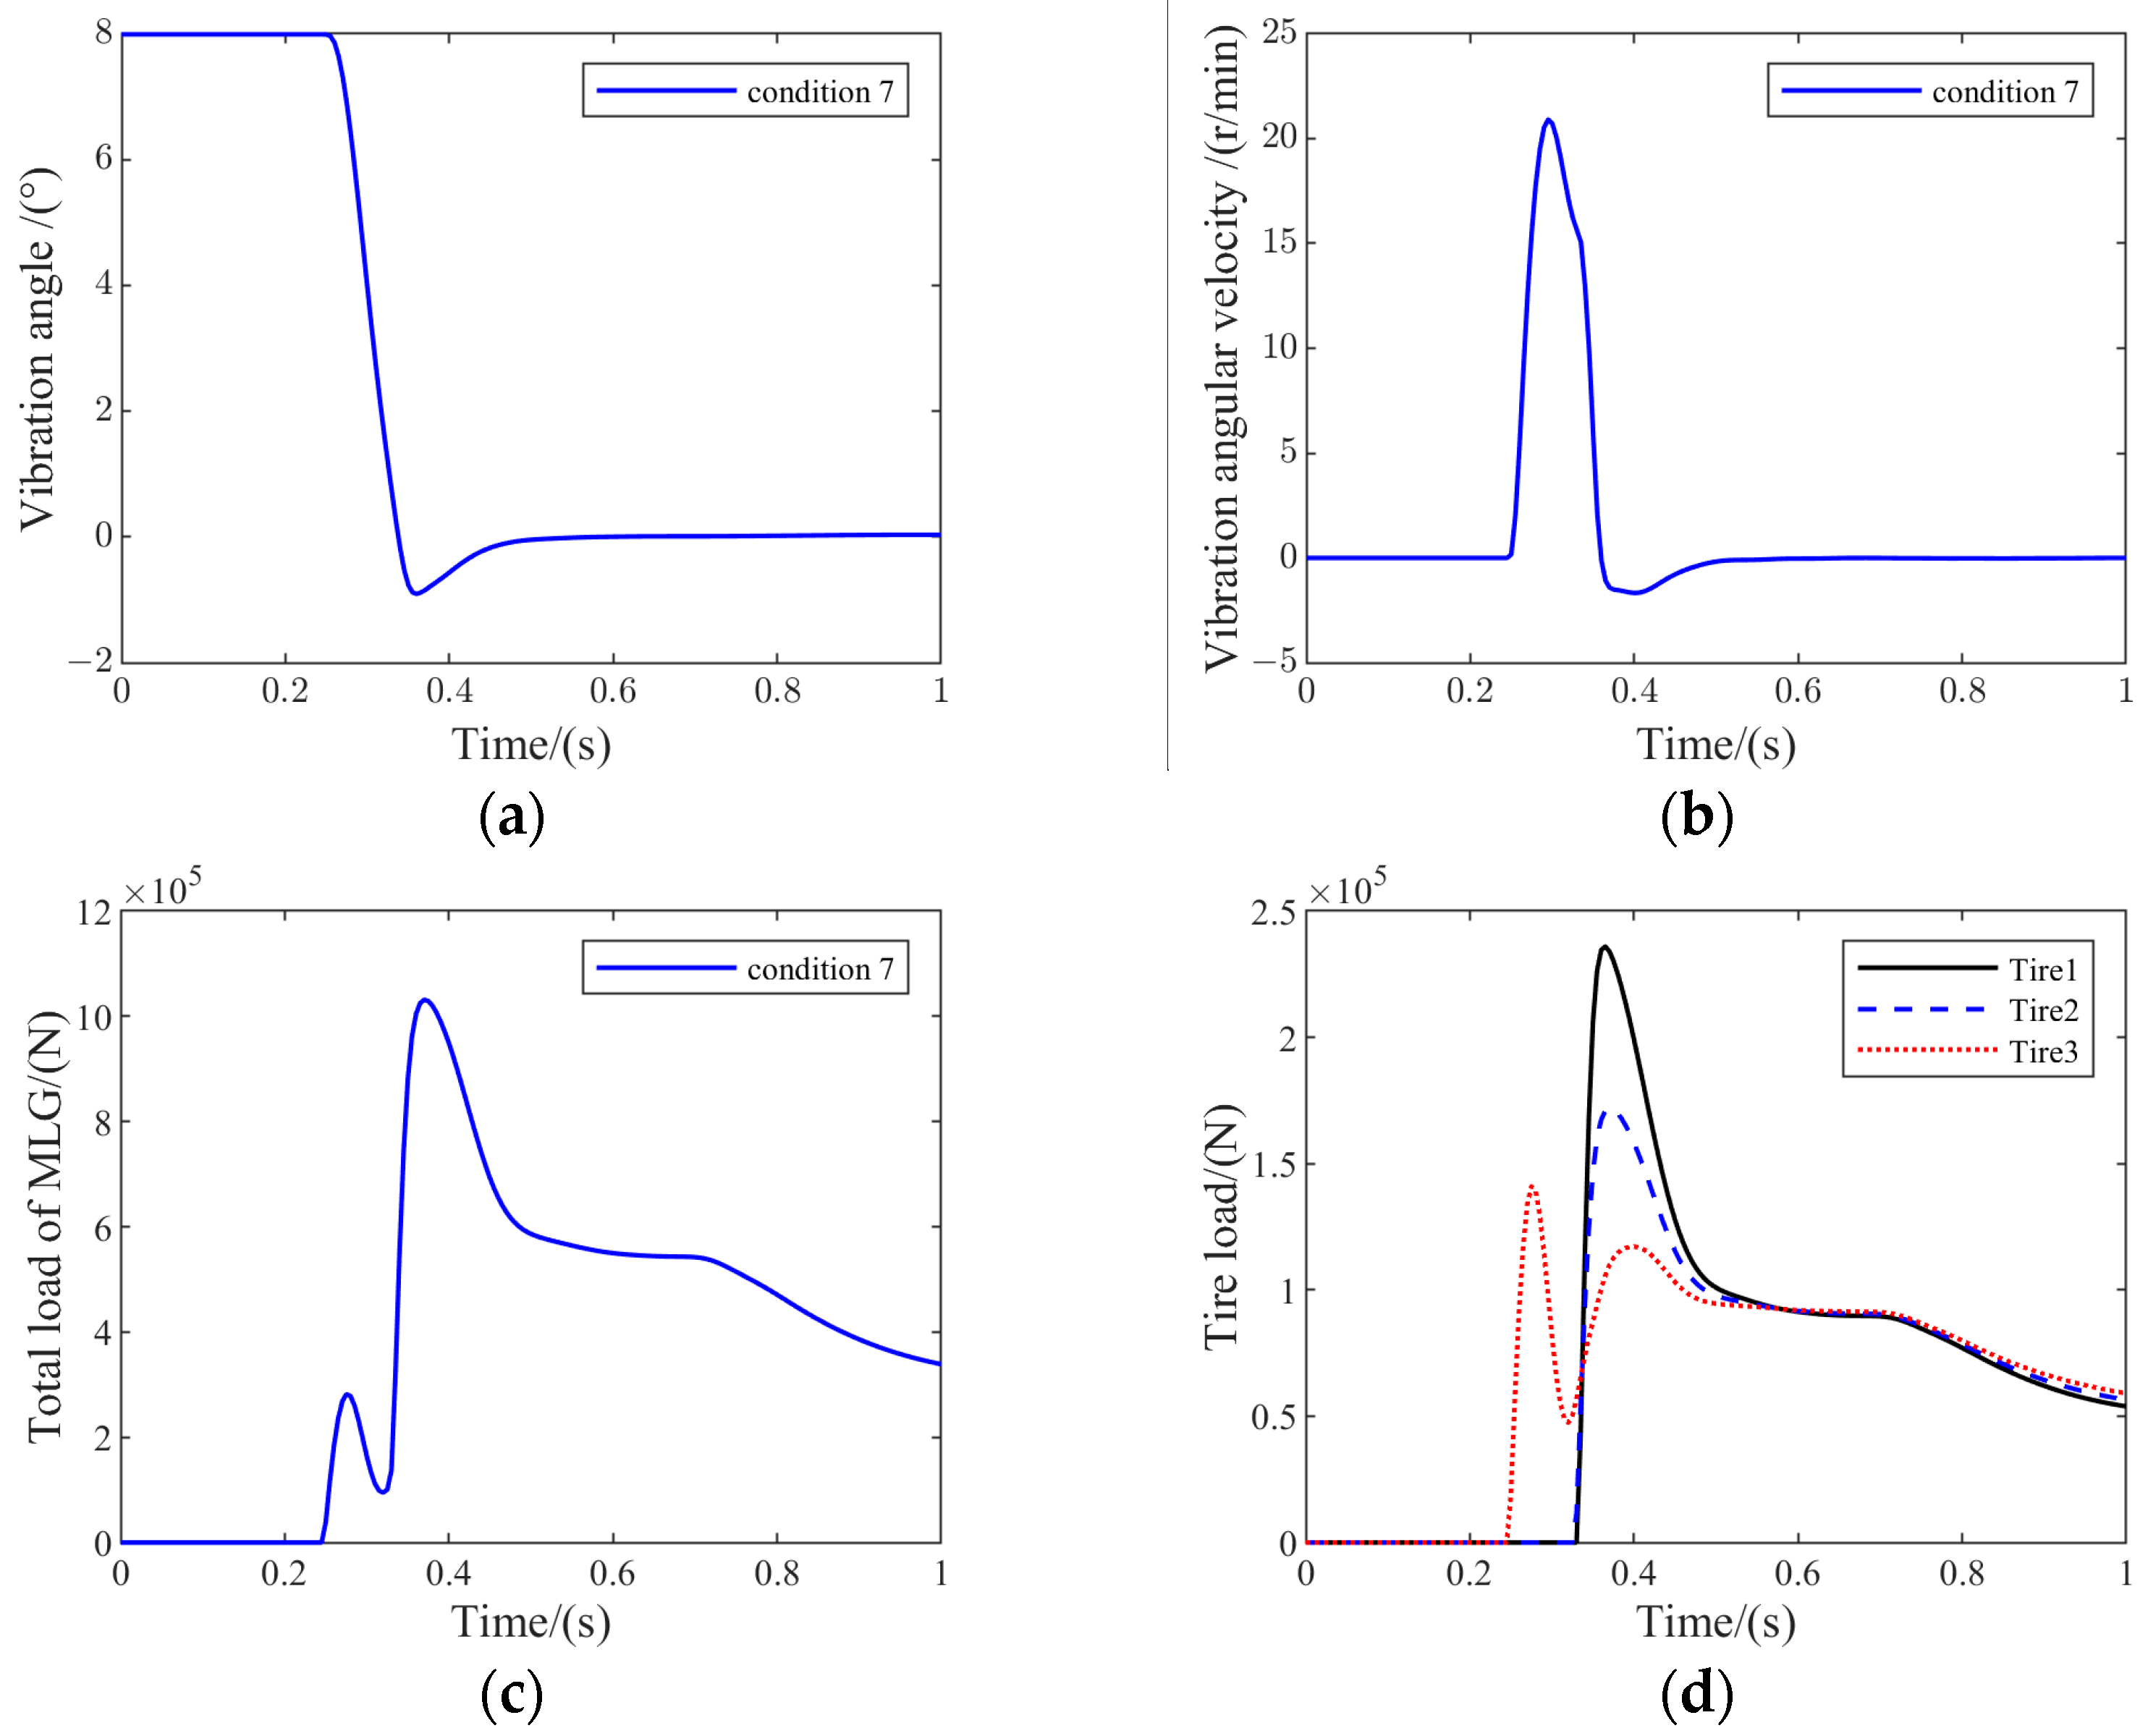
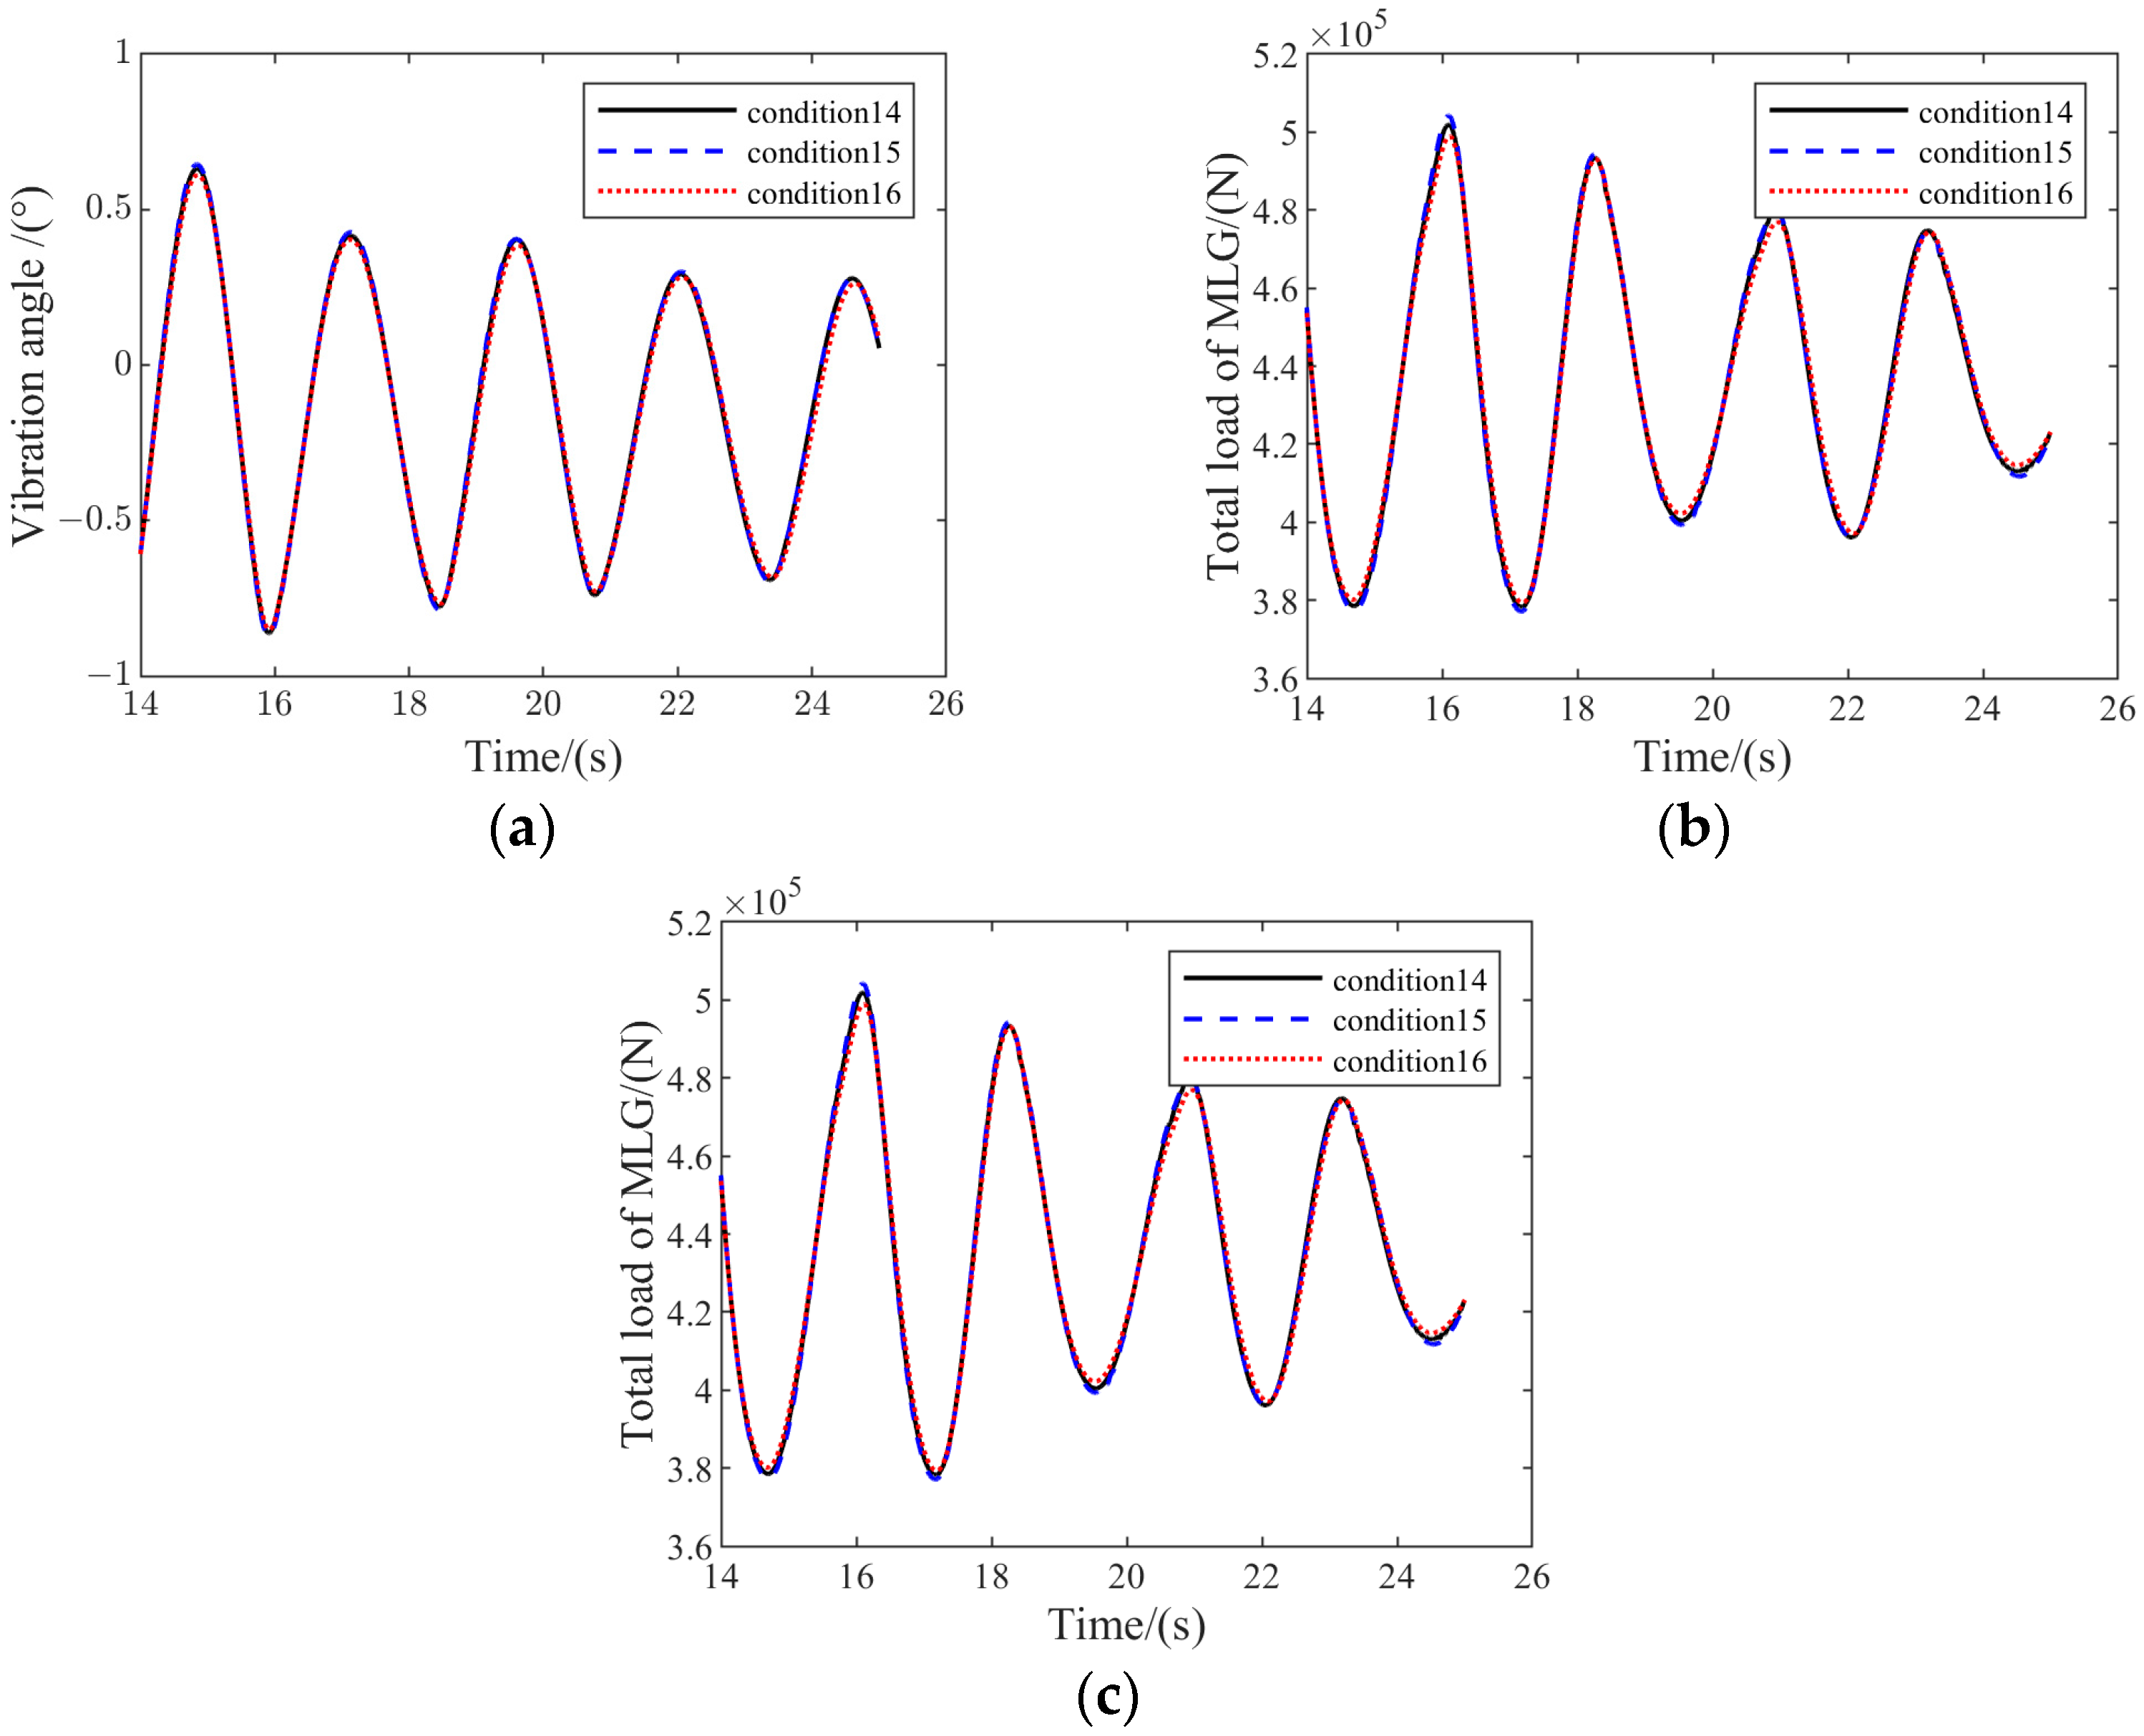
Computational simulation analysis was carried out, and Figure 16 represents the results of the landing gear dynamic performance variation for condition 7.
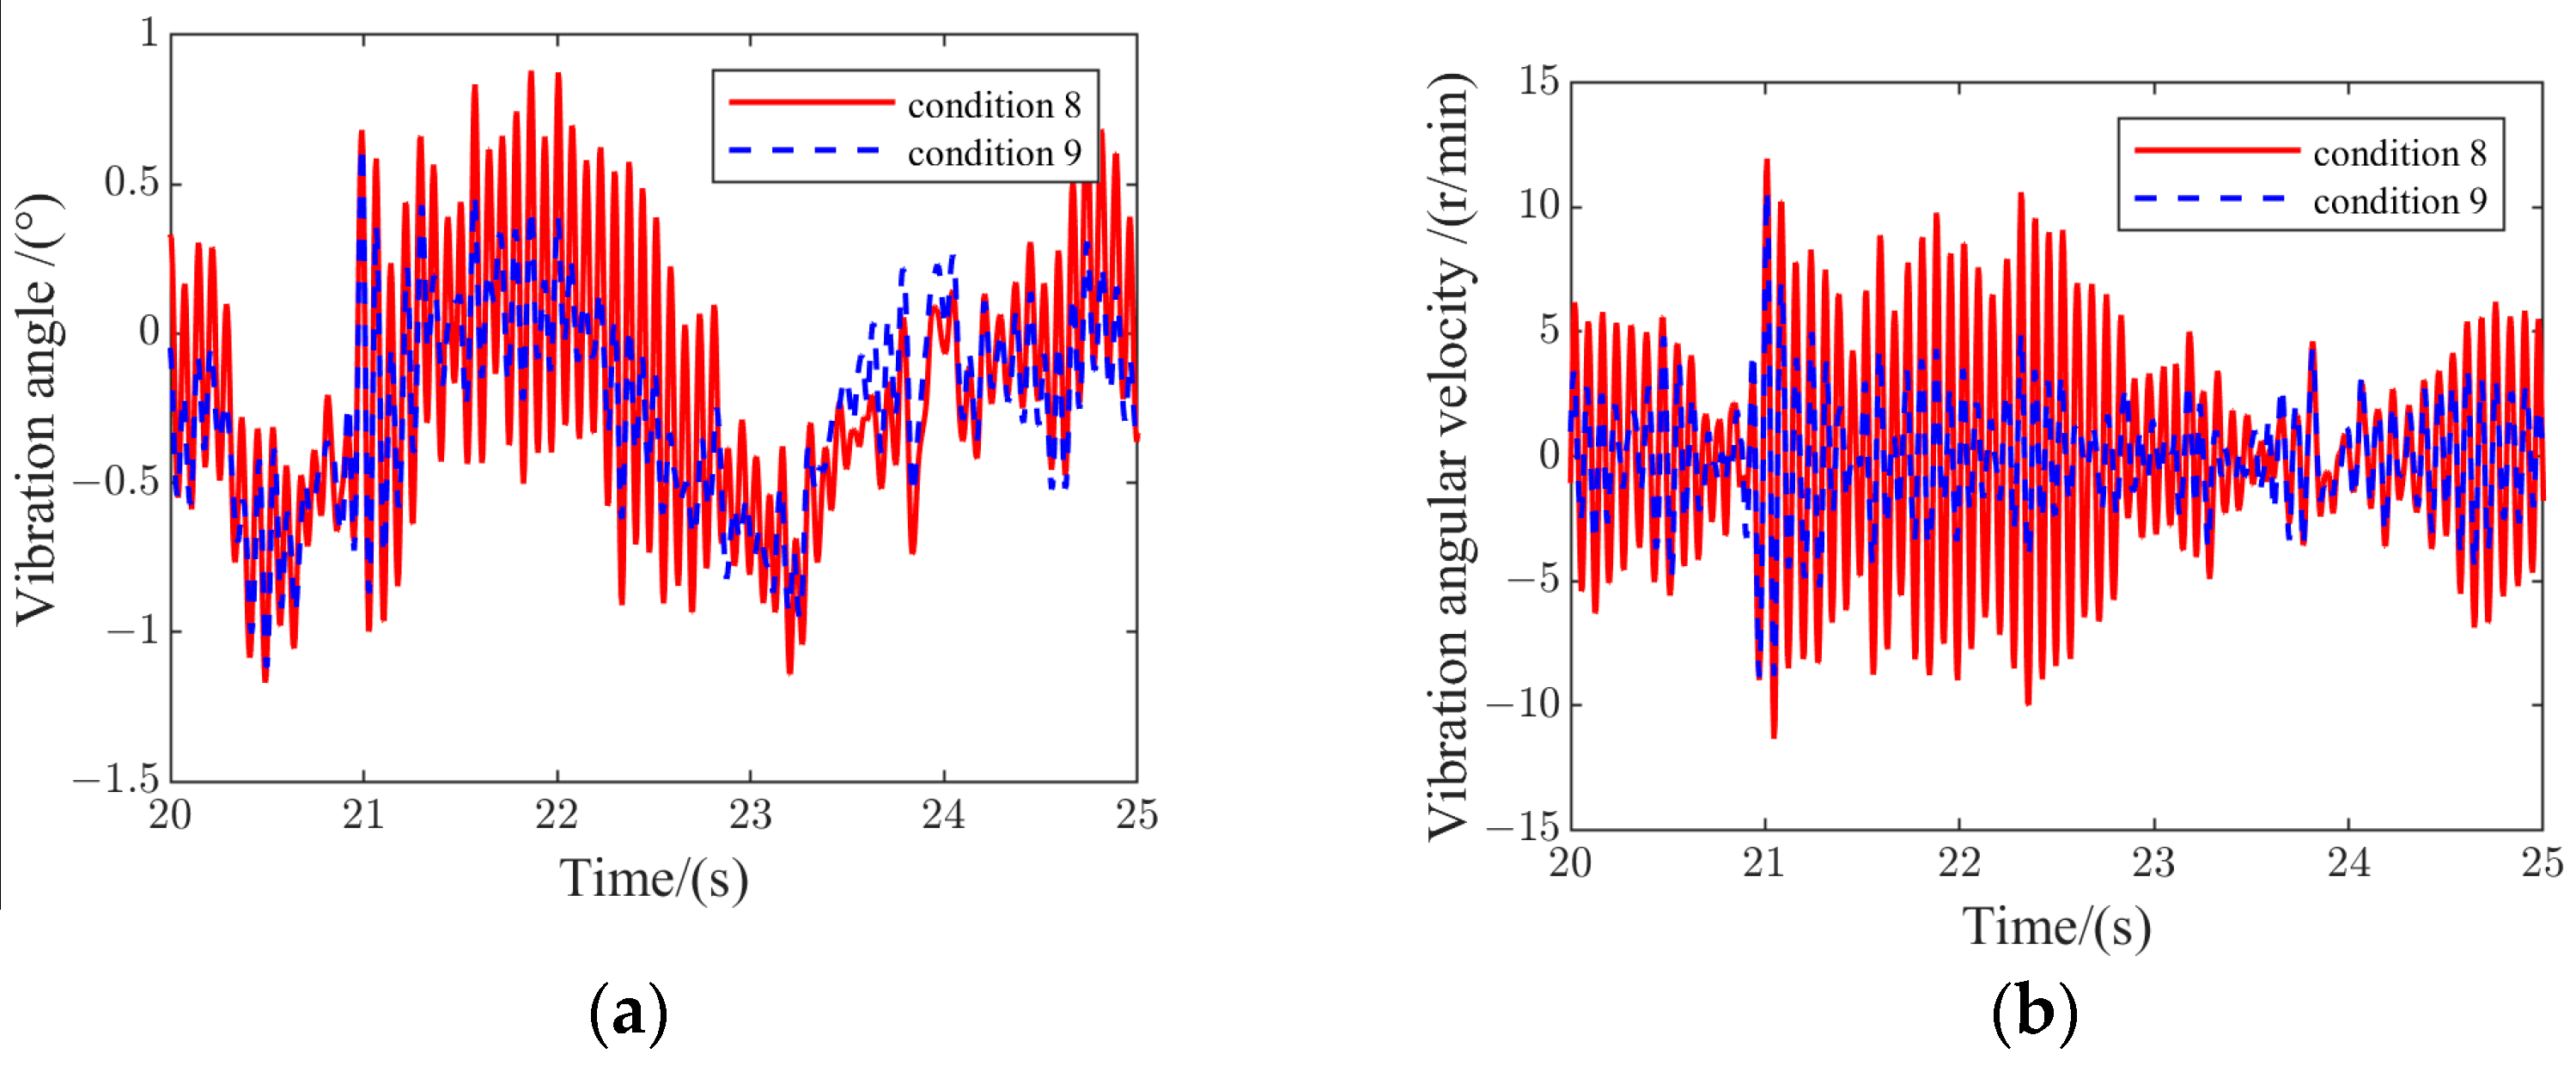
Compared with the analysis results of conditions 4, 5, and 6, the frame vibration angle and the vibration angular velocity of condition 7 were significantly reduced. The maximum head-down angle of the frame was 0.9°, and the maximum vibration angular velocity peak was 21 r/mi. All of them entered into the convergence stage after one vibration cycle, which indicates that there was a significant inhibition of frame vibration at this time. However, with the further reduction in the installation angle, the total vertical load of the MLG also increased significantly, making the vertical overload of the landing gear during landing grow significantly.
The results of the peak values of working conditions 4~7 are summarized as shown in Table 8. It can be seen that the frame stability during airplane landing was related to the PSB installation position. Under the premise that the PSB filling parameters remained unchanged, as the PSB installation angle decreased, the frame vibration angle and angular velocity decreased, and the vibration of the frame was suppressed. Nevertheless, the total vertical load and wheelset load ratio of the MLG increased, which was not conducive to controlling the landing overload of the landing gear and balancing the wheel loads.

4. Dynamic Performance Analysis of FTLG during the Taxiing Process

4.1. Analysis of Whole-Aircraft Taxiing Dynamics on Irregular Runways

When an airplane is taxiing on an uneven road surface, FTLG is stimulated by the unevenness of the road surface, which results in high-frequency pitching vibration of the frame around the articulation point. Such vibration may not only cause the joint parts to overheat, which leads to lead to early failure of the mechanism, but may also affect the maneuvering stability of the aircraft and the safety of the taxiing process. PSB, as a key component connecting the frame and the landing gear strut, can reduce this undesirable vibration phenomenon. This chapter thus investigates the key factors of PSB’s influence on the dynamic performance of FTLG during the taxiing process of the airplane through an analysis of the whole-airplane taxiing dynamics.
The irregular road surface was firstly chosen as the taxiway surface to more clearly demonstrate the vibration attenuation effect of the PSB under the taxiing process of the airplane. Runway 28R in San Francisco, USA provides the runway data currently used by Western Aircraft Corporation, and the height of this runway has obvious randomness in the direction of the runway’s length [21]. Thus, the first 1000 m section of this runway was selected for simulation and analysis, and the change in the runway’s cross-section height is shown in Figure 17.
The parameters required for the analysis of whole-aircraft taxiing dynamics are shown in Table 9, and the rest of the parameters were consistent with the landing dynamics analysis settings.
The primary purpose of taxiing dynamics analysis on the irregular surface was to verify the role of PSB. Still, according to the DOE principle, as shown in Table 10, condition 8 was set without considering the PSB effect; condition 9 was set to consider the PSB effect, and the control PSB filling and structural parameters were kept the same as those of condition 2.
To compare and observe the changes in the results more obviously, a section of the taxiing result curve was selected for comparison and analysis. Figure 18 presents the frame vibration changes during the period of 20~25 s in the analyzed results of conditions 8 and 9.
It can be seen from the results that, with or without the PSB, the changes in the frame vibration angle and vibration angular velocity are very similar; however, in the condition where the PSB works, the amplitude of the frame vibration angle and the vibration angular velocity are much smaller than that of the condition where the PSB does not work. This indicates that the PSB can effectively provide frame pitch damping and attenuate frame vibration when the airplane is taxiing on an uneven surface.

4.2. Analysis of Whole-Aircraft Taxiing Dynamics on Regular Runways

We intended to further quantitatively analyze the degrees of influence of different parameters on the dynamic performance of FTLG of the aircraft during the taxiing process. In this section, which describes taxiing dynamics analysis, the runway is selected as a regular runway (1-cos(x) continuous waveform runway [22]) for simulation analysis. The runway cross-section is shown in Figure 19, with a wavelength λ = 90 m and a crest A m = 260 mm .
(1)
Influence analysis of PSB filling parameters during the taxiing process
The effect of filling parameters was still investigated first. Compared with the landing process of the airplane, the excitation provided by the runway’s unevenness during taxiing was limited, so the degree of frame vibration was reduced, and the damping effect provided by the PSB was be decreased. Thus, for the design of the taxiing dynamics condition, the effects of the PSB’s air spring stiffness and oil damping force were considered simultaneously. Depending on the DOE principle, compared to the landing process condition settings, another condition, 13, considering the influence of air spring stiffness needed to be added: we adjusted the filling air pressure of PSB to 30 MPa and the diameter of the damping hole to 10 mm to obtain the initial air spring stiffness of 84,000 N/m and the damping coefficient of 175,000 N s2/m2. In summary, three simulation test conditions, shown in Table 11, were formulated.
The 14 s~26 s variation curves of the taxiing process were selected for analysis, and Figure 20 illustrates the frame vibration of the aircraft during the taxiing process.
It was found that the frame vibration pattern was similar to the change pattern of the runway profile curve, which indicates that the airplane taxiing results were in line with the actual situation. Through comprehensive observation of the change results of working conditions 10~13, it can be concluded that when the aircraft is in the taxiing stage, with the increase in the PSB’s stiffness and damping coefficient, the frame vibration angle and angular velocity are gradually reduced, and the PSB plays a suppressing role in the frame’s vibration.
Figure 21 represents the results of the load variation of FTLG in the taxiing process from 14 s to 26 s.
The results in Figure 21 show that the MLG vertical load reached its maximum value when FTLG crossed the wave peak. And with the increase in the PSB’s stiffness and damping coefficient, the maximum MLG vertical load had a tendency to decrease. Comprehensively comparing the results of Figure 21, it was found that the change in the air spring stiffness had a more significant effect on the load change, while the magnitude of the oil damping force was very limited. This can be attributed to the small amplitude of frame vibration during airplane taxiing, so the damping effect of PSB was also very weak.
(2)
Influence analysis of PSB structural parameters during the taxiing process
In the taxiing process, FTLG does not need to bear a large landing impact load, the main buffer compression will be significantly smaller, and the adjustable range of the PSB installation angle on the main strut will also be wider. Thus, to highlight the effect of the PSB installation angle more effectively, the initial installation point of the PSB was still taken as the reference and adjusted upward and downward by 30 mm at the installation point of one end of the main strut. The air spring stiffness and the oil damping coefficient were kept the same as the parameters of working condition 11. For the above, we set up the simulation working conditions as shown in Table 12.
Figure 22 exhibits the results of frame vibration variation for conditions 14, 15, and 16.
It can be noticed that the change trends of the frame vibration angle, angular velocity, and total vertical load of MLG were basically the same in all three conditions, and were also basically equal in numerical value. This indicates that the PSB installation angle has less influence on the dynamic performance of FTLG during the taxiing process.
The peak results of the simulation for conditions 10~16 are presented in Table 13. It can be concluded that changing the PSB filling parameters had a greater impact on the frame stability and landing gear load during the taxiing process, while the change in the structural parameters basically had little effect on the dynamic performance of FTLG.

5. Conclusions

(1)
In this paper, a passive oil–air PSB was designed according to the functional requirements of the FTLG in the landing and taxiing phases, and its functional validity was verified by elaborating upon its principles. Moreover, a mathematical model of a set of six-wheel FTLG dynamics, considering the effect of PSB, was constructed by means of geometrical analysis and force analysis of FTLG.
(2)
During the landing period of the airplane, increasing PSB damping or decreasing the PSB installation angle on the landing gear strut can effectively reduce the frame vibration angle and angular velocity, but this also makes the total MLG vertical load and ratio of loads for each wheelset larger. In the taxiing period, the PSB filling parameters had a higher influence on the frame stability and MLG load, and the degree of influence of the air spring stiffness was much greater than that of the oil damping coefficient.
(3)
We comprehensively considered the effects of different parameters of PSB on the dynamic performance of FTLG during the landing and taxiing phases of the airplane. It should be appropriate to increase the air spring stiffness and the oil damping coefficient, as well as to reduce the installation in the PSB design.

Author Contributions

Conceptualization: X.S. and M.Z.; investigation: H.N., X.S., and A.Y.; methodology: X.S. and X.G.; project administration: H.N.; software: X.S. and H.N.; supervision: M.Z. and H.N.; visualization: S.Y. and Y.Z.; writing—original draft: H.N., X.S., and T.L.; writing—review and editing, H.N. All authors have read and agreed to the published version of the manuscript.

Funding

This research was funded by the Fundamental Research Funds for the Central Universities (No. NP2022416) and the Aeronautical Science Foundation of China under Grant (2022Z029052001).

Institutional Review Board Statement

Not applicable.

Informed Consent Statement

Not applicable.

Data Availability Statement

The data presented in this study are available on request from the corresponding author.

Acknowledgments

All authors would like to thank the reviewers and the editors for their valuable comments and constructive suggestions that helped to improve the paper significantly. All authors have read and agreed to the published version of the manuscript.

Conflicts of Interest

The authors declare no conflicts of interest.

References

  1. Norman, S.; Currey. Aircraft Landing Gear Design: Principles and Practices; American Institute of Aeronautics and Astronautics: Washington, DC, USA, 1988. [Google Scholar]
  2. Sforza, P. Landing Gear Design. In Commercial Airplane Design Principles; Elsevier: Berlin/Heidelberg, Germany, 2014; pp. 251–300. [Google Scholar]
  3. She, C.; Zhang, M.; Ge, Y.; Tang, L.; Yin, H.; Peng, G. Design and Simulation Analysis of an Electromagnetic Damper for Reducing Shimmy in Electrically Actuated Nose Wheel Steering Systems. Aerospace 2022, 9, 113. [Google Scholar] [CrossRef]
  4. She, C.; Zhang, M.; Hinkkanen, M.; Yang, Y. An Integrated Design Methodology for Architecture Solutions to Shimmy Reduction Subsystems in All Electric Aircraft. IEEE Trans. Transp. Electrif. 2024. [CrossRef]
  5. Herman, S.; Yang, D. C-5A main landing gear bogie pitching control. J. Aircr. 1971, 8, 912–917. [Google Scholar]
  6. King, J.M. The Airbus 380 and Boeing 787: A role in the recovery of the airline transport market. J. Air Transp. Manag. 2007, 13, 16–22. [Google Scholar] [CrossRef]
  7. McMullin, D.L.; Jacobsen, A.R.; Carvan, D.C.; Gardner, R.J.; Goegan, J.A.; Koehn, M.S. The Boeing 787 Dreamliner–A Case Study in Large-Scale Design Integration. In Proceedings of the Human Factors and Ergonomics Society Annual Meeting; SAGE Publications: Los Angeles, CA, USA, 2008; Volume 52, pp. 1670–1671. [Google Scholar]
  8. Hanke, C.R. The Simulation of a Large Jet Transport Aircraft-Vol.1 Mathematical Model; NASA-CR-1756; NASA Center for Aerospace Information: Wichita, KS, USA, 1971. [Google Scholar]
  9. Hanke, C.R. The Simulation of a Large Jet Transport Aircraft-Vol.2 Modeling Data; US National Technical Information Service N73-10027; NASA Center for Aerospace Information: Wichita, KS, USA, 1970. [Google Scholar]
  10. Li, W. Prelimilary Design of Absorbor System and Analysis of Dynamic Performance for The Heavy Load Aircraft Landing Gear. Master’s Thesis, Nanjing University of Aeronautics and Astronautics, Nanjing, China, 2009. [Google Scholar]
  11. Zhen, L. Conceptual Design of Landing Gear for Heavy Load Aircraft. Master’s Thesis, Nanjing University of Aeronautics and Astronautics, Nanjing, China, 2009. [Google Scholar]
  12. Xia, M. Design and Performance Analysis on Bogie Stabilization System of the Four-Wheel Landing Gear. Master’s Thesis, Nanjing University of Aeronautics and Astronautics, Nanjing, China, 2020. [Google Scholar]
  13. Wei, X.; Liu, C.; Liu, X.; Nie, H.; Shao, Y. Improved model of landing-gear drop dynamics. J. Aircr. 2014, 51, 695–700. [Google Scholar] [CrossRef]
  14. Fang, W.; Zhu, L.; Wang, Y. Landing Performance Study for Four Wheels Twin Tandem Landing Gear Based on Drop Test. Aerospace 2022, 9, 334. [Google Scholar] [CrossRef]
  15. Ahmad, M.A.; Shah, S.I.A.; Shams, T.A.; Javed, A.; Rizvi, S.T.U.I. Comprehensive design of an oleo-pneumatic nose landing gear strut. Proc. Inst. Mech. Part G J. Aerosp. Eng. 2021, 235, 1605–1622. [Google Scholar]
  16. Khapane, P.D. Simulation of asymmetric landing and typical ground maneuvers for large transport aircraft. Aerosp. Sci. Technol. 2003, 7, 611–619. [Google Scholar] [CrossRef]
  17. Chester, D.H. Aircraft landing impact parametric study with emphasis on nose gear landing conditions. J. Aircr. 2002, 39, 394–403. [Google Scholar] [CrossRef]
  18. Jankovic, A.; Chaudhary, G.; Goia, F. Designing the design of experiments (DOE)–An investigation on the influence of different factorial designs on the characterization of complex systems. Energy Build. 2021, 250, 111298. [Google Scholar] [CrossRef]
  19. Luiz, M.T.; Viegas, J.S.R.; Abriata, J.P.; Viegas, F.; de Carvalho Vicentini, F.T.M.; Bentley, M.V.L.B.; Tapia-Blacido, D.R. Design of experiments (DoE) to develop and to optimize nanoparticles as drug delivery systems. Eur. J. Pharm. Biopharm. 2021, 165, 127–148. [Google Scholar] [CrossRef] [PubMed]
  20. dos Reis, G.S.; Larsson, S.H.; Mathieu, M.; Thyrel, M.; Pham, T.N. Application of design of experiments (DoE) for optimised production of micro-and mesoporous Norway spruce bark activated carbons. Biomass Convers. Biorefinery 2021, 13, 1–19. [Google Scholar] [CrossRef]
  21. Gerardi, A.G. Digital Simulation of Flexible Aircraft Response to Symmetrical and Asymmetrical Runway Roughness; Air Force Flight Dynamics Laboratory: Dayton, OH, USA, 1977; p. 0084. [Google Scholar]
  22. Krüger, W.R.; Morandini, M. Recent developments at the numerical simulation of landing gear dynamics. CEAS Aeronaut. J. 2011, 1, 55–68. [Google Scholar] [CrossRef]
Figure 1. PSB working state at different stages: (a) landing stage; (b) taxiing stage.
Aerospace 11 00288 g001
Figure 2. PSB internal structure.
Aerospace 11 00288 g002
Figure 3. PSB working process: (a) compression process; (b) tension process.
Aerospace 11 00288 g003
Figure 4. Relationships of FTLG components: (a) geometric relationships; (b) force relationship.
Aerospace 11 00288 g004
Figure 5. Main buffer power diagram: main buffer axial load variation with compression stroke.
Aerospace 11 00288 g005
Figure 6. FTLG vertical load change: the relationship of the vertical load with time.
Aerospace 11 00288 g006
Figure 7. Side view of the airplane landing.
Aerospace 11 00288 g007
Figure 8. Landing gear tire layout.
Aerospace 11 00288 g008
Figure 9. Frame vibration variation for conditions 1, 2, and 3: (a) frame vibration angle; (b) frame vibration angular velocity.
Aerospace 11 00288 g009
Figure 10. Total MLG vertical load variation.
Aerospace 11 00288 g010
Figure 11. Variation in vertical loads of different tires of MLG for conditions 1, 2, and 3: (a) vertical load on tire 1; (b) vertical load on tire 2; (c) vertical load on tire 3.
Aerospace 11 00288 g011
Figure 12. Change in PSB installation angle during landing process.
Aerospace 11 00288 g012
Figure 13. Frame vibration variation for conditions 4, 5, and 6: (a) frame vibration angle; (b) frame vibration angular velocity.
Aerospace 11 00288 g013
Figure 14. Load analysis results for conditions 4, 5, and 6: (a) total MLG vertical load variation; (b) vertical load on tire 1; (c) vertical load on tire 2; (d) vertical load on tire 3.
Aerospace 11 00288 g014
Figure 15. Condition 7 PSB installation position.
Aerospace 11 00288 g015
Figure 16. Analysis results of working condition 7: (a) frame vibration angle; (b) frame vibration angular velocity; (c) total MLG vertical load variation; (d) vertical load on tires.
Aerospace 11 00288 g016
Figure 17. Cross-section of runway 28R in San Francisco, USA: the variation of runway height with length.
Aerospace 11 00288 g017
Figure 18. Frame vibration variation for conditions 8 and 9: (a) frame vibration angle; (b) frame vibration angular velocity.
Aerospace 11 00288 g018
Figure 19. Cross-section of 1-cos(x) continuous waveform runway: the variation of runway height with length.
Aerospace 11 00288 g019
Figure 20. Frame vibration variation for conditions 10~13: (a) frame vibration angle; (b) frame vibration angular velocity.
Aerospace 11 00288 g020
Figure 21. Variation in load for conditions 10~13: (a) total MLG vertical load variation; (b) PSB air spring force; (c) PSB oil damping force.
Aerospace 11 00288 g021
Figure 22. Variation for conditions 14, 15, and 16: (a) frame vibration angle; (b) frame vibration angular velocity; (c) total MLG vertical load variation.
Aerospace 11 00288 g022
Table 1. PSB design parameters.
SymbolicDescriptionValueUnit
l 0 Neutral position length1038mm
l 1 Full extension length1200mm
l 2 Full compression length1000mm
d f 0 Floating piston diameter150mm
d b 0 Oil hole diameter11.2mm
d c 0 Piston rod pressure oil surface diameter120mm
S a 0 Piston rod pressure area2286mm2
P a 0 Initial air pressure10MPa
Table 2. Main buffer filling design parameters.
SymbolicDescriptionValueUnit
P 0 Initial pressure in gas chamber3.8MPa
A a Area of pressure gas0.066m2
V 0 Initial gas chamber volume0.05m3
A h Area of pressure oil0.053m2
A s Area of oil holes0.0014m2
C d Oil shrinkage coefficient0.8
nAir compression variability index1.1
S max Allowable compression stroke500mm
n s Allowable vertical overload1.8
Table 3. FTLG drop-shock simulation parameters.
SymbolicDescriptionValueUnit
W e f Drop-shock putting quality37,500kg
v s Sinking speed3.05m/s
NWheels’ rotation speed1000r/min
μ Coefficient of friction0.8
θ c Frame lift angle8°
Table 4. Whole-aircraft landing simulation parameters.
SymbolicDescriptionValueUnit
W L Aircraft landing design quality160,000kg
aDistance from center of gravity to NLG2610mm
bDistance from center of gravity to MLG13,390mm
cLeft and right MLG installation point spacing11,600mm
h 0 Vertical height from the center of gravity to the ground3645mm
L f 1 MLG front and rear wheels spacing1200mm
L f 2 MLG left and right wheels spacing1250mm
I L x x Fuselage roll inertia during landing process3 × 106kg.m2
I L y y Fuselage pitch inertia during landing process1.4 × 107kg.m2
I L z z Fuselage yaw inertia during landing process2.4 × 107kg.m2
α 0 Tail sinking angle3°
θ MLG installation angle3°
θ c Frame lift angle8°
v x 0 Fuselage heading speed before landing65m/s
v z 0 Fuselage sinking speed3.05m/s
Table 5. Filling parameters affect the setting of conditions during landing process.
Condition NumberAir Spring Stiffness (N/m)Oil Damping Coefficient (N. s2/m2)
1\\
213,000107,000
313,000175,000
Table 6. Peak statistics of the results of conditions 1, 2, and 3.
Result NameCondition 1Condition 2Condition 3Unit
Frame vibration angle3.22.01.6°
Frame vibration angular velocity3.873.463.25r/min
Total MLG vertical load967,077982,0281,027,700N
Vertical load on tire 1347,934211,492216,202N
Vertical load on tire 2127,566163,671171,279N
Vertical load on tire 30115,849126,053N
Wheelset load ratio7.3:2.7:04.3:3.3:2.44.2:3.3:2.5
Table 7. Structural parameters affecting conditions settings during landing process.
Condition NumberInstallation Point Position (mm)Air Spring Stiffness (N/m)Oil Damping Coefficient (N. s2/m2)
40
5−1013,000107,000
61013,000175,000
Table 8. Peak statistics of the results of conditions 4~7.
Result NameCondition 4Condition 5Condition 6Condition 7Unit
Frame vibration angle2.082.052.020.9°
Frame vibration angular velocity3.483.463.442.2r/min
Total MLG vertical load977,993982,028984,6271,031,116N
Vertical load on tire 1211,580211,492212,586233,560N
Vertical load on tire 2162,998163,671164,104171,852N
Vertical load on tire 3114,417115,849115,622110,144N
Wheelset load ratio4.3:3.3:2.44.3:3.3:2.44.3:3.3:2.44.5:3.3:2.1
Table 9. Whole-aircraft taxiing simulation parameters.
SymbolicDescriptionValueUnit
W n Maximum aircraft parking mass200,000kg
v x 0 Aircraft taxiing speed50m/s
I L x x Fuselage roll inertia during taxiing process3,000,000kg.m2
I L y y Fuselage pitch inertia during taxiing process14,000,000kg.m2
I L z z Fuselage yaw inertia during taxiing process24,000,000kg.m2
Table 10. Irregular runway taxiing dynamics condition settings.
Condition NumberInstallation Point Position (mm)Air Spring Stiffness (N/m)Oil Damping Coefficient (N. s2/m2)
8
9013,000107,000
Table 11. Regular runway taxiing dynamics filling parameters influencing condition settings.
Condition NumberAir Spring Stiffness (N/m)Oil Damping Coefficient (N. s2/m2)
10
1113,000107,000
1213,000175,000
1384,000175,000
Table 12. Structural parameters affect condition settings during taxiing process.
Condition NumberInstallation Point Position (mm)Air Spring Stiffness (N/m)Oil Damping Coefficient (N. s2/m2)
140
15−3013,000107,000
163013,000175,000
Table 13. Peak statistics of the results of conditions 10~16.
Result NameCondition 10Condition 11Condition 12Condition 13Condition 14Condition 15Condition 16Unit
Frame vibration angle0.730.650.630.500.640.630.63°
Frame vibration angular velocity0.0370.0360.0340.0320.0350.0350.035r/min
Total MLG vertical load554,833550,981546,981545,217546,935550,98154,6543N
Vertical load on tire 192,37389,13288,45482,12888,43589,13288,318N
Vertical load on tire 292,51091,74191,00090,67891,21791,74191,153N
Vertical load on tire 392,65994,81294,226100,00994,00094,81293,987N
Wheelset load ratio0.730.650.630.500.640.630.63
Disclaimer/Publisher’s Note: The statements, opinions and data contained in all publications are solely those of the individual author(s) and contributor(s) and not of MDPI and/or the editor(s). MDPI and/or the editor(s) disclaim responsibility for any injury to people or property resulting from any ideas, methods, instructions or products referred to in the content.

