1. Introduction
The exploration of planetary bodies is of paramount importance for the space sector; the different roadmaps [
1,
2] encompass the return of humankind on the lunar surface and then proceeding further on Mars. Before these steps, robotic exploration remains the most valuable way to test key technologies that would reduce the costs and risks of a human mission. The Moon is the closest target for those missions: it imposes facing different challenges in its harsh environment, such as vacuum, reduced gravity, tempeature difference, high radiation level, and interaction with the soil.
The ongoing trend to allow a sustainable lunar exploration is the utilisation of commercial services like the NASA Commercial Lunar Payload Services (CLPS), a program in which different providers offer the possibility of embarking small payloads on a single platform. Along with the payloads that are dedicated to science that can be performed on the Moon, these platforms can host demonstration payloads that will help in the preparation for human exploration. In particular, there is a strong focus on the direct exploitation of the lunar surface material, the regolith, in the framework of in situ resource utilisation (ISRU), namely the extraction and processing of local resources. The investigation areas in this field can be classified, with some representative examples provided, as:
Manufacturing, including techniques like sintering, 3D printing, additive manufacturing… [
3,
4,
5,
6].
Chemical reactions such as oxygen and metals extraction techniques [
7,
8,
9,
10,
11].
Soil handling, collection, and transportation [
12].
Surface mobility and landing [
13,
14].
Interaction of the regolith with surfaces, materials, and mechanisms [
15].
A high confidence level in their knowledge shall be reached before fully relying on ISRU technologies; for this aim, the theoretical studies are often accompanied by experiments to validate the results and prove the maturity of the technologies. As the amount of lunar regolith brought from lunar missions is limited, the large availability of a material that is capable of reproducing the lunar one from a chemical, physical, and mechanical point of view is fundamental.
There are different off-the-shelf simulants, produced by industries and research centres around the world, that do not follow a unique standard; indeed, the fidelity of the simulant and the target properties (physical, compositional…) drive the selection for the different applications and define the accuracy of the results produced during the experiments, as highlighted in the dedicated
Section 2.4. The characterisation of the simulants is essential for defining the real properties to work with during the preparation of the experiments, collection/interpretation of the data, and modelling activities. In the bibliography, the main focus when searching for soil characterisation is on the geotechnical properties [
16,
17]; however, this information is not enough when thinking of the manipulation of the simulant. There is a range of values that cannot be obtained by the producer datasheet, usually focused on composition and particle size distribution.
This paper is focused on the characterisation of a particular lunar simulant, NU-LHT-2M, used in the context of a study on oxygen/water extraction through a solid-state carbothermal reduction currently under development at Politecnico di Milano (PoliMi) [
8,
18]. A holistic approach to characterise a generic soil or simulant (lunar, martian, asteroids) is described, providing an overview of the main properties to inspect and test:
Composition tests: minerals and oxide constituents characterisation.
Physical and mechanical tests: density, granulometry distribution, particle shape, compressibility, shear properties, penetration resistance, moisture content, and optical and electromagnetic properties.
Solid–fluid interaction: permeability, aeration, stability, and variable flow rate.
Thermal tests: phase changes and thermal properties.
These tests are performed with terrestrial technologies working in gravity conditions. Numerical investigations can be conducted to also include the effects caused by reduced gravity [
19].
The results of the tests are presented and compared with the bibliographic data. Some of them explore new interactions—like the solid–fluid interaction, important for the carbothermal process—that have not been deeply investigated so far. Along with the test results, their impact on the carbothermal process and the design of a lunar demonstration plant is presented. Indeed, PoliMi is collaborating with the Italian Space Agency (ASI) to design and build a small demonstrator plant in the context of the ORACLE—
Oxygen Retrieval Asset by Carbothermal Reduction on Lunar Environment mission [
20,
21]—to test the reduction with lunar surface material. The different issues that have emerged from the preliminary analyses can be managed with the aid of the tests conducted on the lunar simulant, providing important guidelines for the design and testing of activities. Most of the considerations that emerged can also be directly applied to other ISRU methods, which share, for example, similar procedures in the regolith handling or composition/state change.
The low-temperature carbothermal process uses a gaseous mixture of hydrogen (H
2) and methane (CH
4), which reacts with the feedstock in the 1273–1373 K temperature range. Carbon monoxide (CO) is mainly produced thanks to the reaction of methane and carbon with most of the oxides and minerals present in the regolith (see
Section 2) [
8]. Two phases are alternated to allow for the removal of deposited carbon from the regolith batch, one with only H
2 flowing and one with the methane–hydrogen mixture. The CO is then processed through a methanation step on a catalytic bed to obtain water and methane that can be recycled with the reaction CO
(g) + 3H
2(g) → CH
4(g) + H
2O(g). Oxygen can be possibly recovered then through an electrolysis step. The regolith is loaded at the beginning of each process cycle in the carbothermal reactor and then discharged to reduce a new batch. The carbothermal reduction process has been tested in the facility available at the Department of Aerospace Science and Technologies (DAER) of PoliMi [
18] with an extensive experimental campaign performed in 2020–2021, the results of which are about to be released to the community. The chosen simulant for the test campaign is the NU-LHT-2M highlands simulant; the simulant selection aim, among those available on the market and better explained in
Section 2.4, is to demonstrate the flexibility of the method with respect to the known hydrogen reduction of ilmenite [
22], present mainly in particular locations [
23].
The article is structured as follows. An overview of the regolith characteristics, mainly from a composition point of view, is provided to understand the kind of material under examination. Then, a brief overview of lunar simulants is included before starting the description of the guidelines and selection criteria for the tests on a generic simulant. The tests selected for the NU-LHT-2M simulant available at Politecnico di Milano are presented in
Section 3. They are deeply described and analysed, clarifying the motivation, the procedure, and then the results. Whenever available, the data are also cross-checked and compared with the lunar regolith data. Some considerations on the demonstration campaign at PoliMi and on the payload that is under design are also integrated. Finally, the findings are summarised in
Section 5.
3. Characterisation of the Lunar Simulants: General Guidelines and Tests Selection
Once the final user has identified the requirements for their application, it is possible to pick up one of these off-the-shelf simulants. This section presents the guidelines for the characterisation of the main properties of a generic simulant (Moon, Mars, asteroid…), associating the properties to the most common tests available. These kinds of tests not only have the aim to verify the producer data but can serve two purposes: The most practical one is that some tests are not covered by the simulants producers. Then, during the simulant usage, it may be necessary to make comparisons between the simulant properties before and after a process or manipulation; therefore, it is useful to have, for a valid comparison, the data obtained on the same apparatus before and after the tests, without using only the ones from data sheets or bibliographic data. Of course, these last data are useful for understanding if the test is correctly settled and the values are close to the expected ones.
Table 3 indicates, for a generic simulant, the main properties to be investigated, the tests that can be performed to fulfill the purpose, and an indication of the simulant utilisation context. The list is not exhaustive for peculiar applications [
36,
37], but it can provide a complete overview for applications that range from physical–chemical manipulation to handling and interaction with the materials.
The user, according to the application of interest, selects the tests to perform. Then, the second driver is the level of accuracy of the data related to the application: as an example, for the production of a DEM model for which the particle size distribution is essential information, it may be better to ask for a laser diffraction test than a sieving test.
3.1. Test Campaign Overview on NU-LHT-2M Simulant at PoliMi
Among the tests proposed in
Table 3, only some of them are carried out in the context of the ongoing research at PoliMi. They are summarised in
Table 4, indicating the acronym and the specific facility in which they are performed, codified as follows:
[F-01]: Earth and Planetary Physics Laboratory (EPP-Lab), Università degli Studi Roma Tre. Via della Vasca Navale, 84—00146 Roma (RM), Italy.
[F-02]: RDLAB137 Srl. Via Andrea Solari, 32—20144 Milano (MI), Italy.
[F-03]: Chemical Laboratory Di Landro s.a.s. Via Arturo Toscanini, 18—26013 Crema (CR), Italy.
[F-04]: CMIC Polimi, Department of Chemistry, Materials and Chemical Engineering “Giulio Natta”. P.zza Leonardo da Vinci, 32I—20133 Milano (MI), Italy.
[F-05]: DAER Polimi, Department of Aerospace Science and Technology. Via La Masa, 34—20156 Milano (MI), Italy.
[F-06]: DMEC Polimi, Material Analysis Laboratory, Department of Mechanical Engineering Polimi, Via La Masa 1—20156 Milano (MI), Italy.
The tests are performed to characterise the NU-LHT-2M simulant mainly for the chemical process, but also to start the derivation of the main data needed for the material handling and interaction with the materials. Indeed, the development of a lunar payload will face problems related to the regolith transportation, sieving, loading, and discharging. To this end, the tests that can provide useful data for understanding the process, namely the composition tests, are performed both before and after the process. The other tests are instead mainly performed on the virgin simulant to have a first set of data for the investigation. The approach in general is incremental, starting from the basic tests to obtain the core information to then plan, if needed, a second test with more precise investigations.
A strong focus is placed on the compositional tests to obtain the mineralogical, oxides, and element data. When a chemical process is involved, it is important to identify if the species that are prone to reacting from a theoretical point of view are the ones that undergo the reaction. ICP-OES can help identify the relative presence of the oxides in the simulant. XRD is preferred to XRF as the former can determine the presence and amounts of mineral species in a sample, as well as identify phases. In contrast, XRF instead provides the chemical composition of a sample but does not indicate what phases are present.
The grains are then studied from a dimension and shape point of view to assess the possible changes before and after the process. The data are matched with the DSC test, which investigates the phase transitions. It is important to identify these modifications when working with applications that require major temperature changes; with a change of tens of degrees, the simulant can pass from a powder that can be easily handled to a sintered block that is difficult to remove. At this stage, sieving and SEM tests can provide a sufficient level of understanding of the main features of the grains.
The solid–fluid interaction is crucial in the PoliMi carbothermal process as it is necessary to ensure the penetration of the reacting gases in the solid batch and to assess the possibility of exploiting a fluidised bed or fixed one. These tests are useful in all applications that exploit a gas to collect the regolith, as in the
Touch-and-Go Sample Acquisition Mechanism (TAGSAM) of the OSIRIS-REx mission [
38]. The density and compressibility, inspected in the same fashion, are tested with a helium pycnometer due to its availability at [F-01].
Finally, a problem in common with most of the ISRU methods is the soil handling and dust interaction with the components. The cohesion and friction angle, tested through a shear cell (enough at this stage of the investigation), are evaluated, as well as the electromagnetic properties, inspected by dielectric spectroscopy.
Regarding the other tests, the moisture content is not of interest as the tests will be performed with a dried simulant to ensure that the extracted water does come from the minerals. The thermal properties are instead assumed as given because the reduced masses (maximum 1 kg), tubular geometry of the reactor, and test procedures (waiting times respected) assure the simulant to be uniformly heated up to the given temperature. However, it is not excluded to perform them, together with the penetration resistance test and the tribological properties, in the optic of soil modelling and understanding of the regolith effects on the plant surfaces.
4. Characterisation Tests on the NU-LHT-2M Simulant
The tests on the chemical, physical, mechanical, and thermal properties and the solid–fluid interaction are described in the following sections; they are all correlated with their motivation, a description of how the test is performed, and a discussion of the results. A comparison with the lunar regolith data is also offered whenever available. The bibliographic values of the thermal properties of the regolith are also presented in brief for completeness.
4.1. Composition Tests
This section introduces all simulant composition-related tests; the aim is to characterise the presence of different chemical elements, species, and aggregation states. These tests are fundamental in the framework of the low-temperature carbothermal reaction experimental campaign to have a footprint of the reduction and help in the chemical modelling, which is also helped by the repetition of some of the tests both before and after the carbothermal process.
4.1.1. Inductively Coupled Plasma–Optical Emission Spectrometry Technique (ICP-OES)
The material composition check is performed through ICP-OES; it is important to have a clear idea of the species that may be involved in the reaction. The technique provides the correct inputs in terms of oxides and minerals to be used for the modelling. In view of making a comparison of the results before and after the reaction, it can help to have a quantitative value regarding the species that reacted.
The technique consists of giving plasma energy to a sample, the atoms of which are excited. When the excited atoms return to a low-energy position, emission rays are released, and those corresponding to the photon wavelength are measured. By analysing the spectrum, it is possible to determine the element type and also obtain information about its abundance, measuring the ray intensity. The sample has been mineralised with an acid attack supported by microwaves with alkaline fusion.
The results confirmed the composition declared in the documentation of the simulant provider.
Table 5 shows the composition in mass for the oxides and the ICP-OES results in terms of the element percentage in mass, along with a comparison with the Apollo 16 reference values.
It can be noticed that the simulant and regolith have some small differences in the oxide percentages, which do not compromise the goodness of the material used to make the experiments. This difference is expected according to the goal of the production of the simulant and is more focused on the minerals than on the composition of the oxides. The sensitivity of the test apparatus did not allow for the identification of the elements under 1% concentration, while the other species were correctly detected. The results are not as close to the expectations as those of the oxides, so they have to be handled with precautions.
4.1.2. X-ray Powder Diffraction (XRD)
The XRD analysis identifies the minerals contained in the specimen. The test is performed on the virgin (i.e., not processed) simulant, repeating the test with different granulometry ranges, and it is also performed on the reacted simulant. The identification of the minerals that are more prone to react can help in the modelling of the process as well as in the selection of the optimal landing site or a particular regolith pre-processing, with the separation of the most reactive minerals.
This test consists of a beam emitted by an X-ray tube that hits a sample, rotating with a certain angular velocity (to maintain the ray focused), and a detector that moves in a circle around the sample; its position is recorded as the angle and, at each step, the X-ray intensity is stored as a count. In some instruments, the X-ray tube rotates instead of the sample. This generates an X-ray diffraction pattern that helps in the identification of the species present in the sample; indeed, each element has a particular fingerprint, determined by the combination of positions and the intensity of the peaks. Thanks to this last parameter, it is also possible to create a quantitative phase analysis; calibration is needed because of the efficiency of the different species in X-ray diffraction.
Test #1 [F-04]
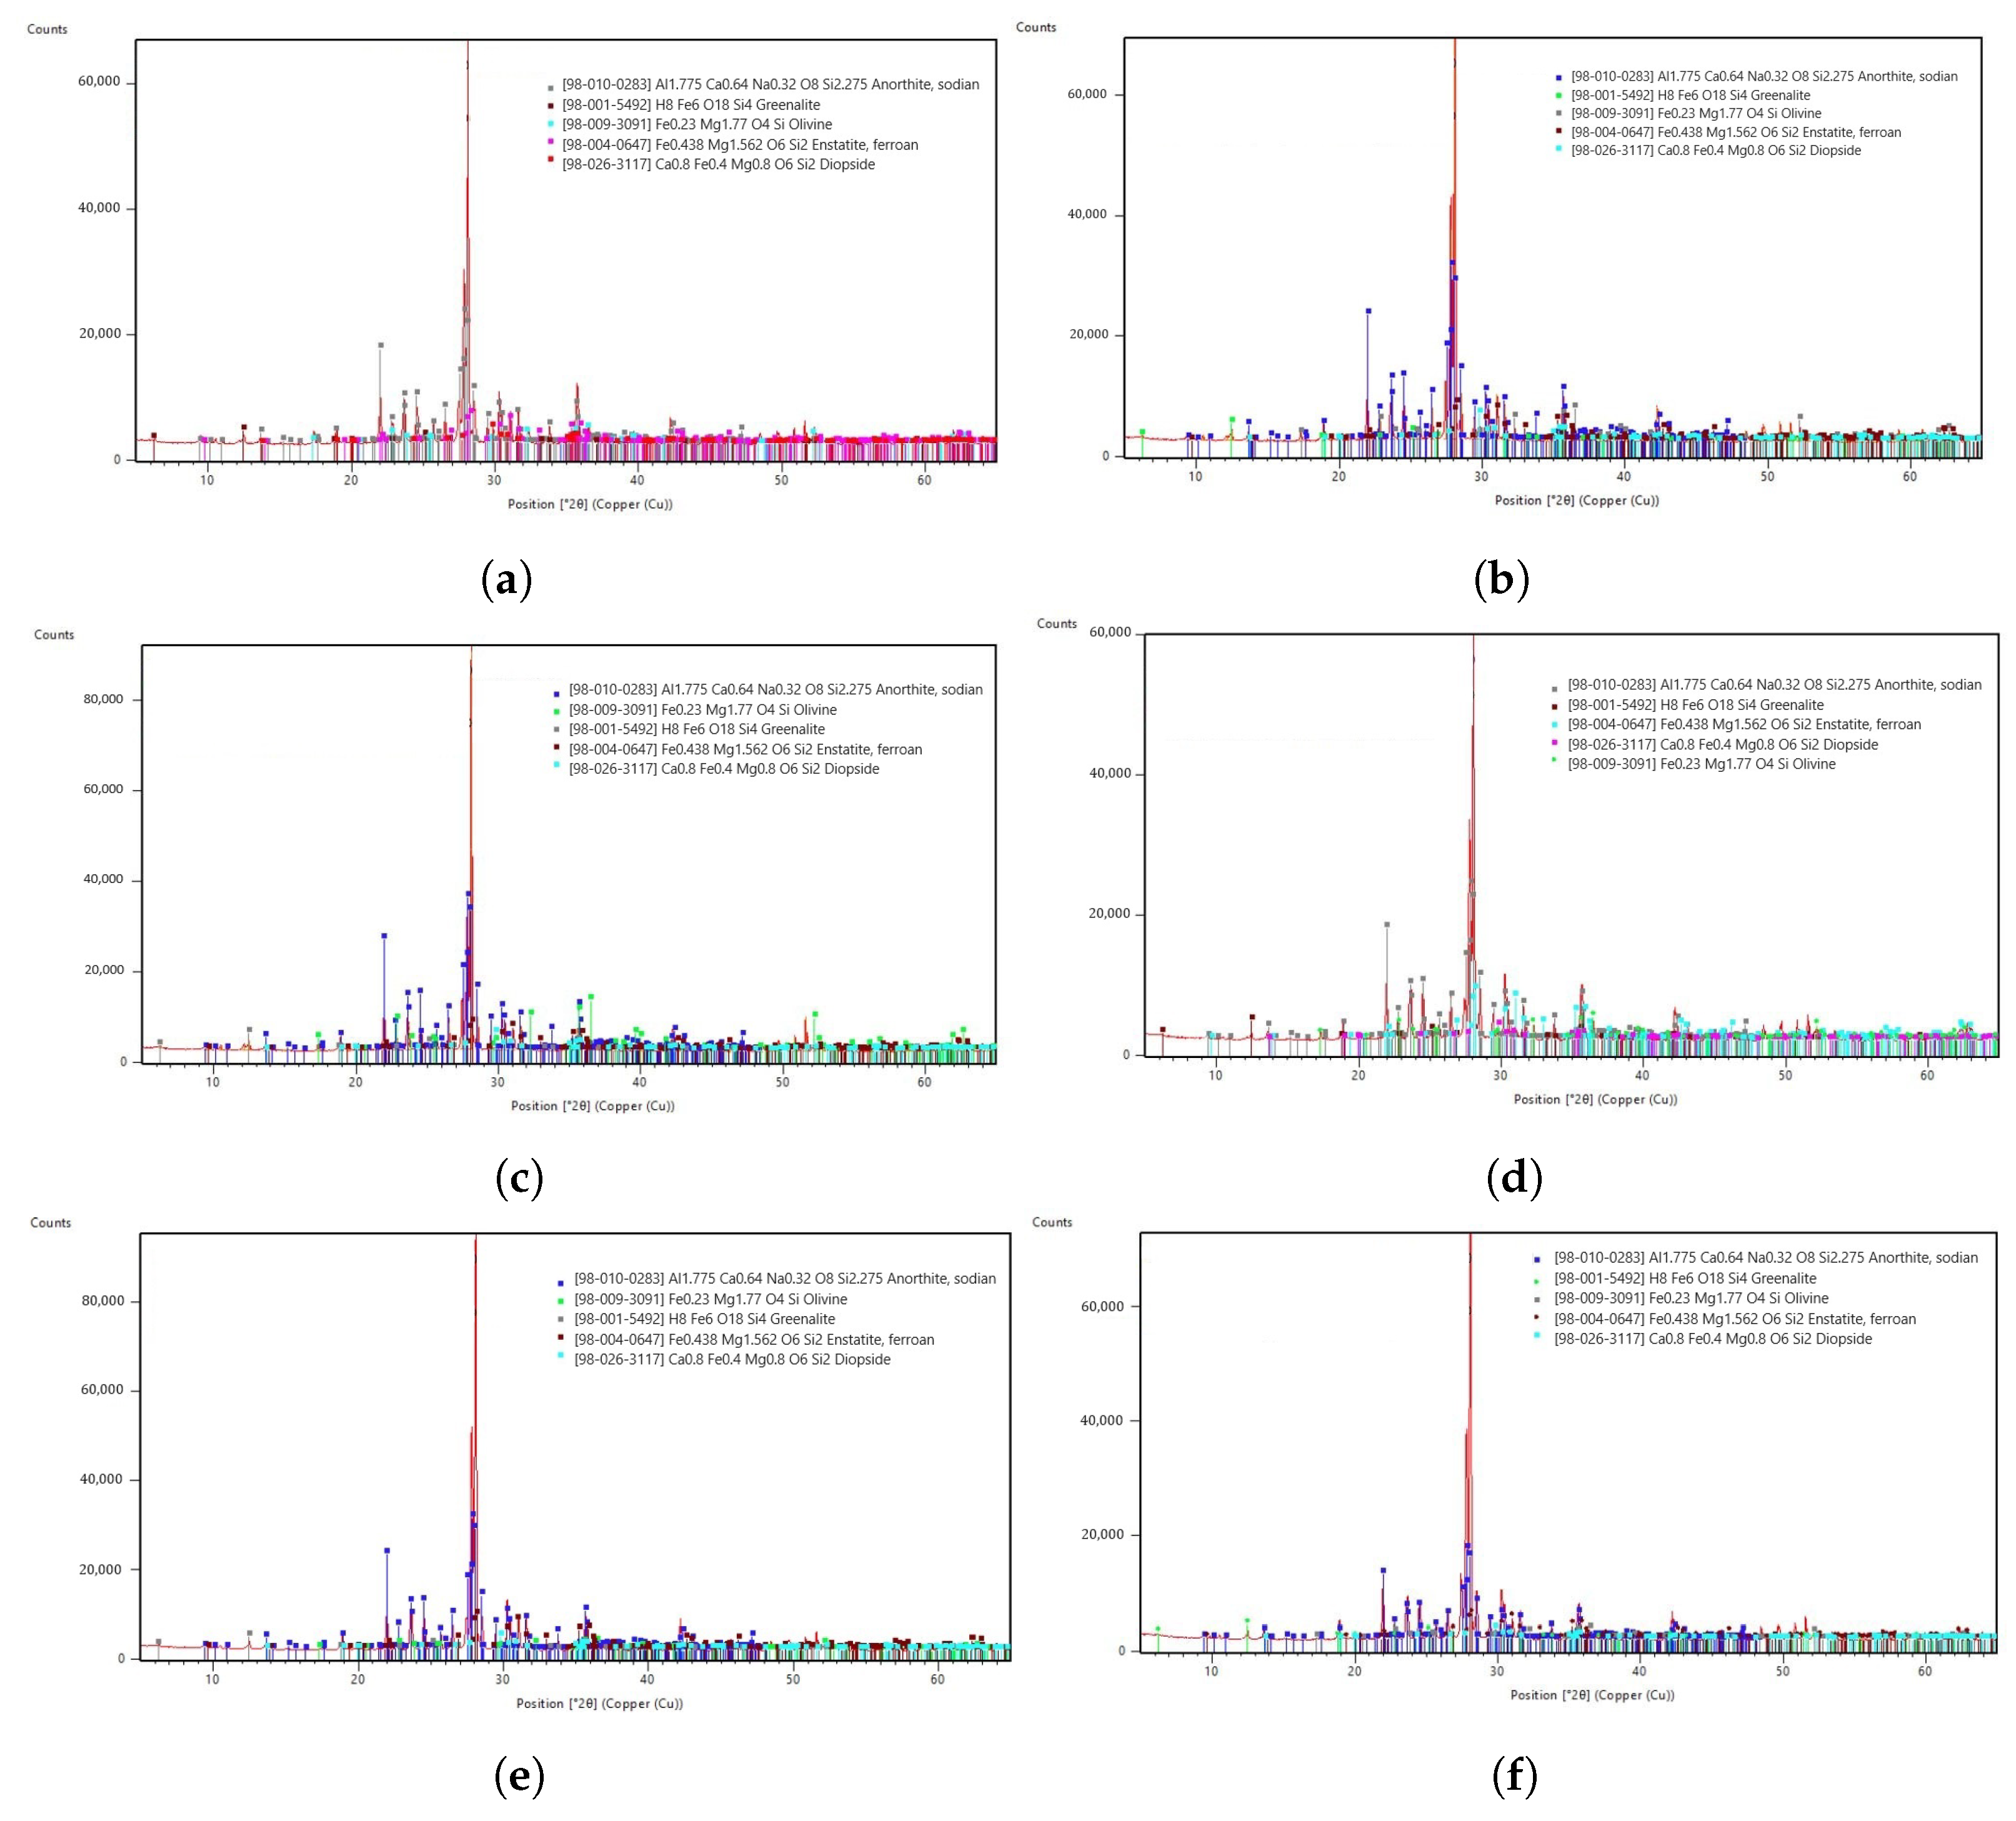
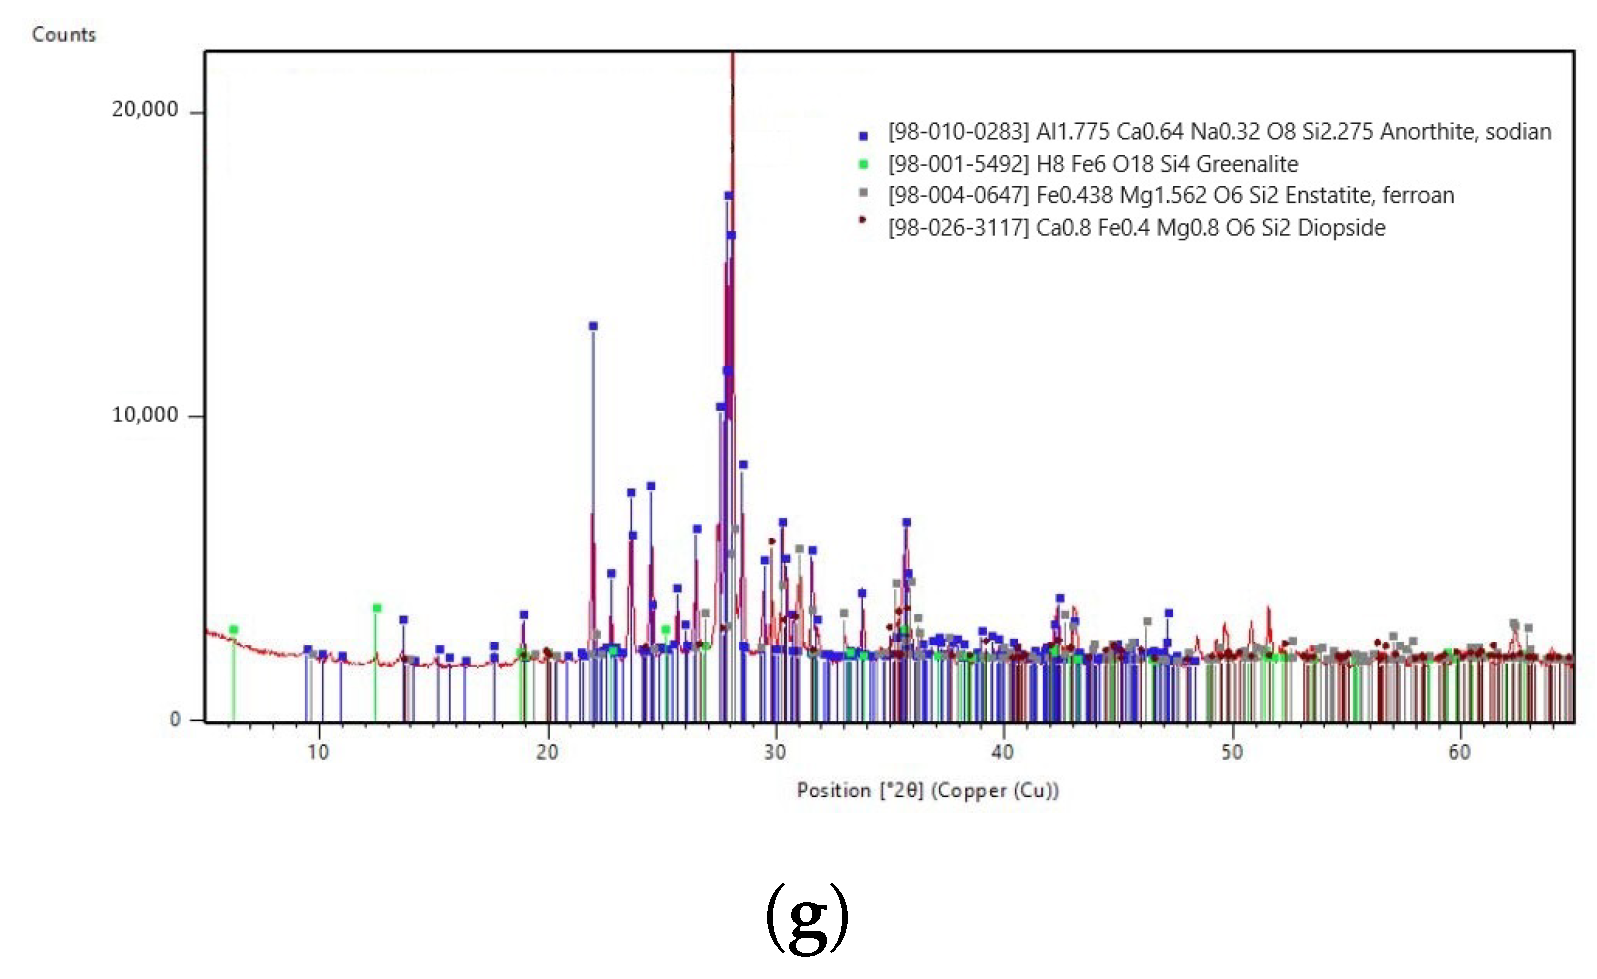
In
Figure 1, the spectrograms are plotted for the different grain size intervals. Five main minerals were taken into consideration: anorthite (sodian), greenalite, olivine, enstatite (ferroan), and diopside. Comparing the spectra, it can be noticed that the main peak occurred at the same angular position, which was also followed by the other high peaks in the 20–40 position (2
) range; actually, they mainly corresponded to the anorthite diffraction pattern, and their intensity, i.e., the number of counts, reflected its abundance (see
Table 1). Regarding the other peaks, the number of counts was very similar in all measurements, highlighting a substantial homogeneity in composition in all size intervals. A small note can be presented on olivine: its presence was slightly enhanced in the 75–150 μm interval, whereas it was not present in the biggest particles (>400 μm). Finally, greenalite and enstatite were not directly present in the regolith composition (
Table 1), but they contributed to the number of elements and oxides present in the simulant.
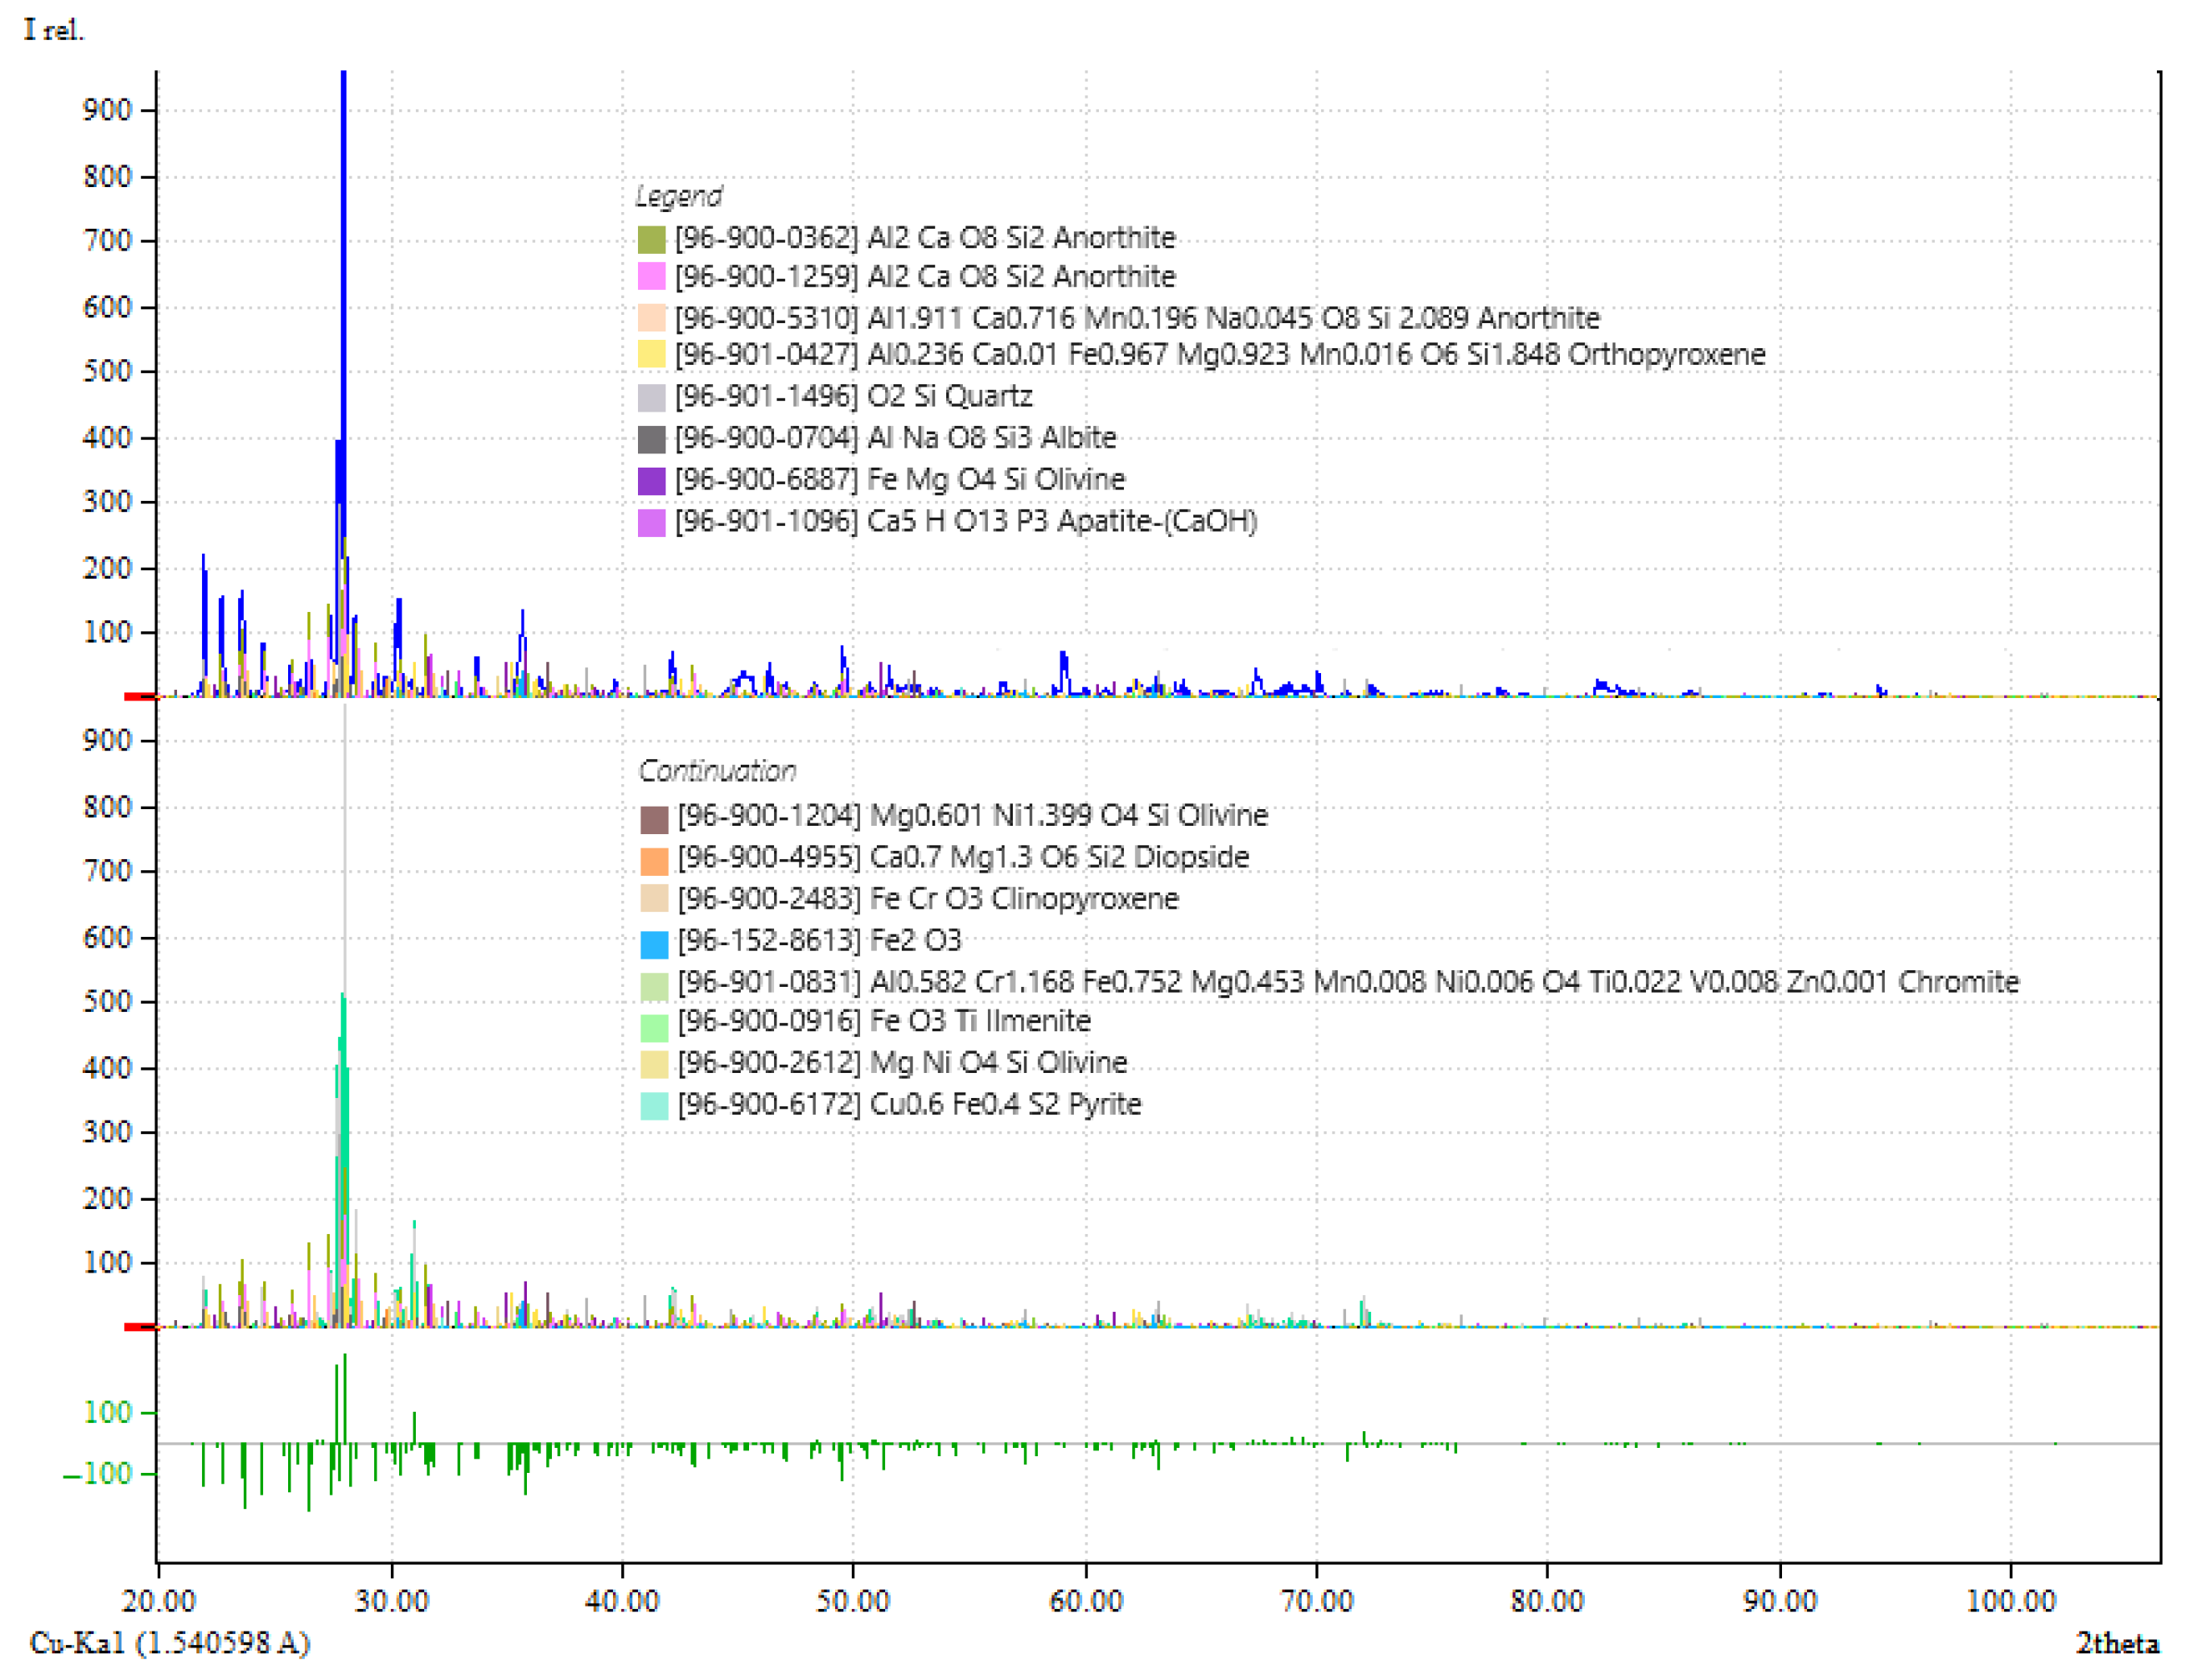
Test #2 [F-06]
XRD analyses were also performed to compare the virgin simulant with the one that underwent the solid-state carbothermal reduction with methane. These analyses were performed with an XRD Rigaku SmartLab SE device. The powder diffractometer used a Bragg–Brentano geometry, and the
and
radiations adopted had wavelengths of
and
. The post-processing of the results was performed using Match!
®v3.15software by Crystal Impact (
https://www.crystalimpact.com/match/ (accessed on 7 April 2024)). The spectra were analysed by looking for a set of minerals that should be present in the NU-LHT-2M simulant [
30]; the same set was adopted in the two analyses.
Figure 2 shows the results of the comparative analyses performed on virgin and processed NU-LHT-2M simulant (temperature 1373
, alternation of 85H
2/15CH
4 mixture with H
2 for 11
): all peaks were identified in the 2
q = 20–120° range for both samples with the given set of minerals.
Table 6 lists the identified minerals and their percentage contributions in the two spectra. There was a general decrease in most of the minerals from the virgin sample to the processed one, while anorthite and albite seemed to not react in the temperature range of interest, as their percentage contribution increased between the virgin and processed samples.
4.1.3. Scanning Electron Microscopy (SEM) with Energy-Dispersive X-ray Analysis (EDX)
These tests provide detailed high-magnification images of the sample, elemental identification, and quantitative composition information using a focused beam of electrons to produce images of a sample surface topography. SEM analyses were performed on non-processed simulants but also on samples that underwent the carbothermal reduction. For the virgin material, it was complemented with EDX to obtain an additional understanding of the surface material, acquiring the elemental composition of the sample. The processed samples were analysed after each test performed in the 2020–2021 experimental campaign on the terrestrial ISRU demonstrator developed at PoliMi DAER [
18]. This is useful for assessing the impact of the process and different parameters by examining the dimensions and shape of the grains and their peculiarities.
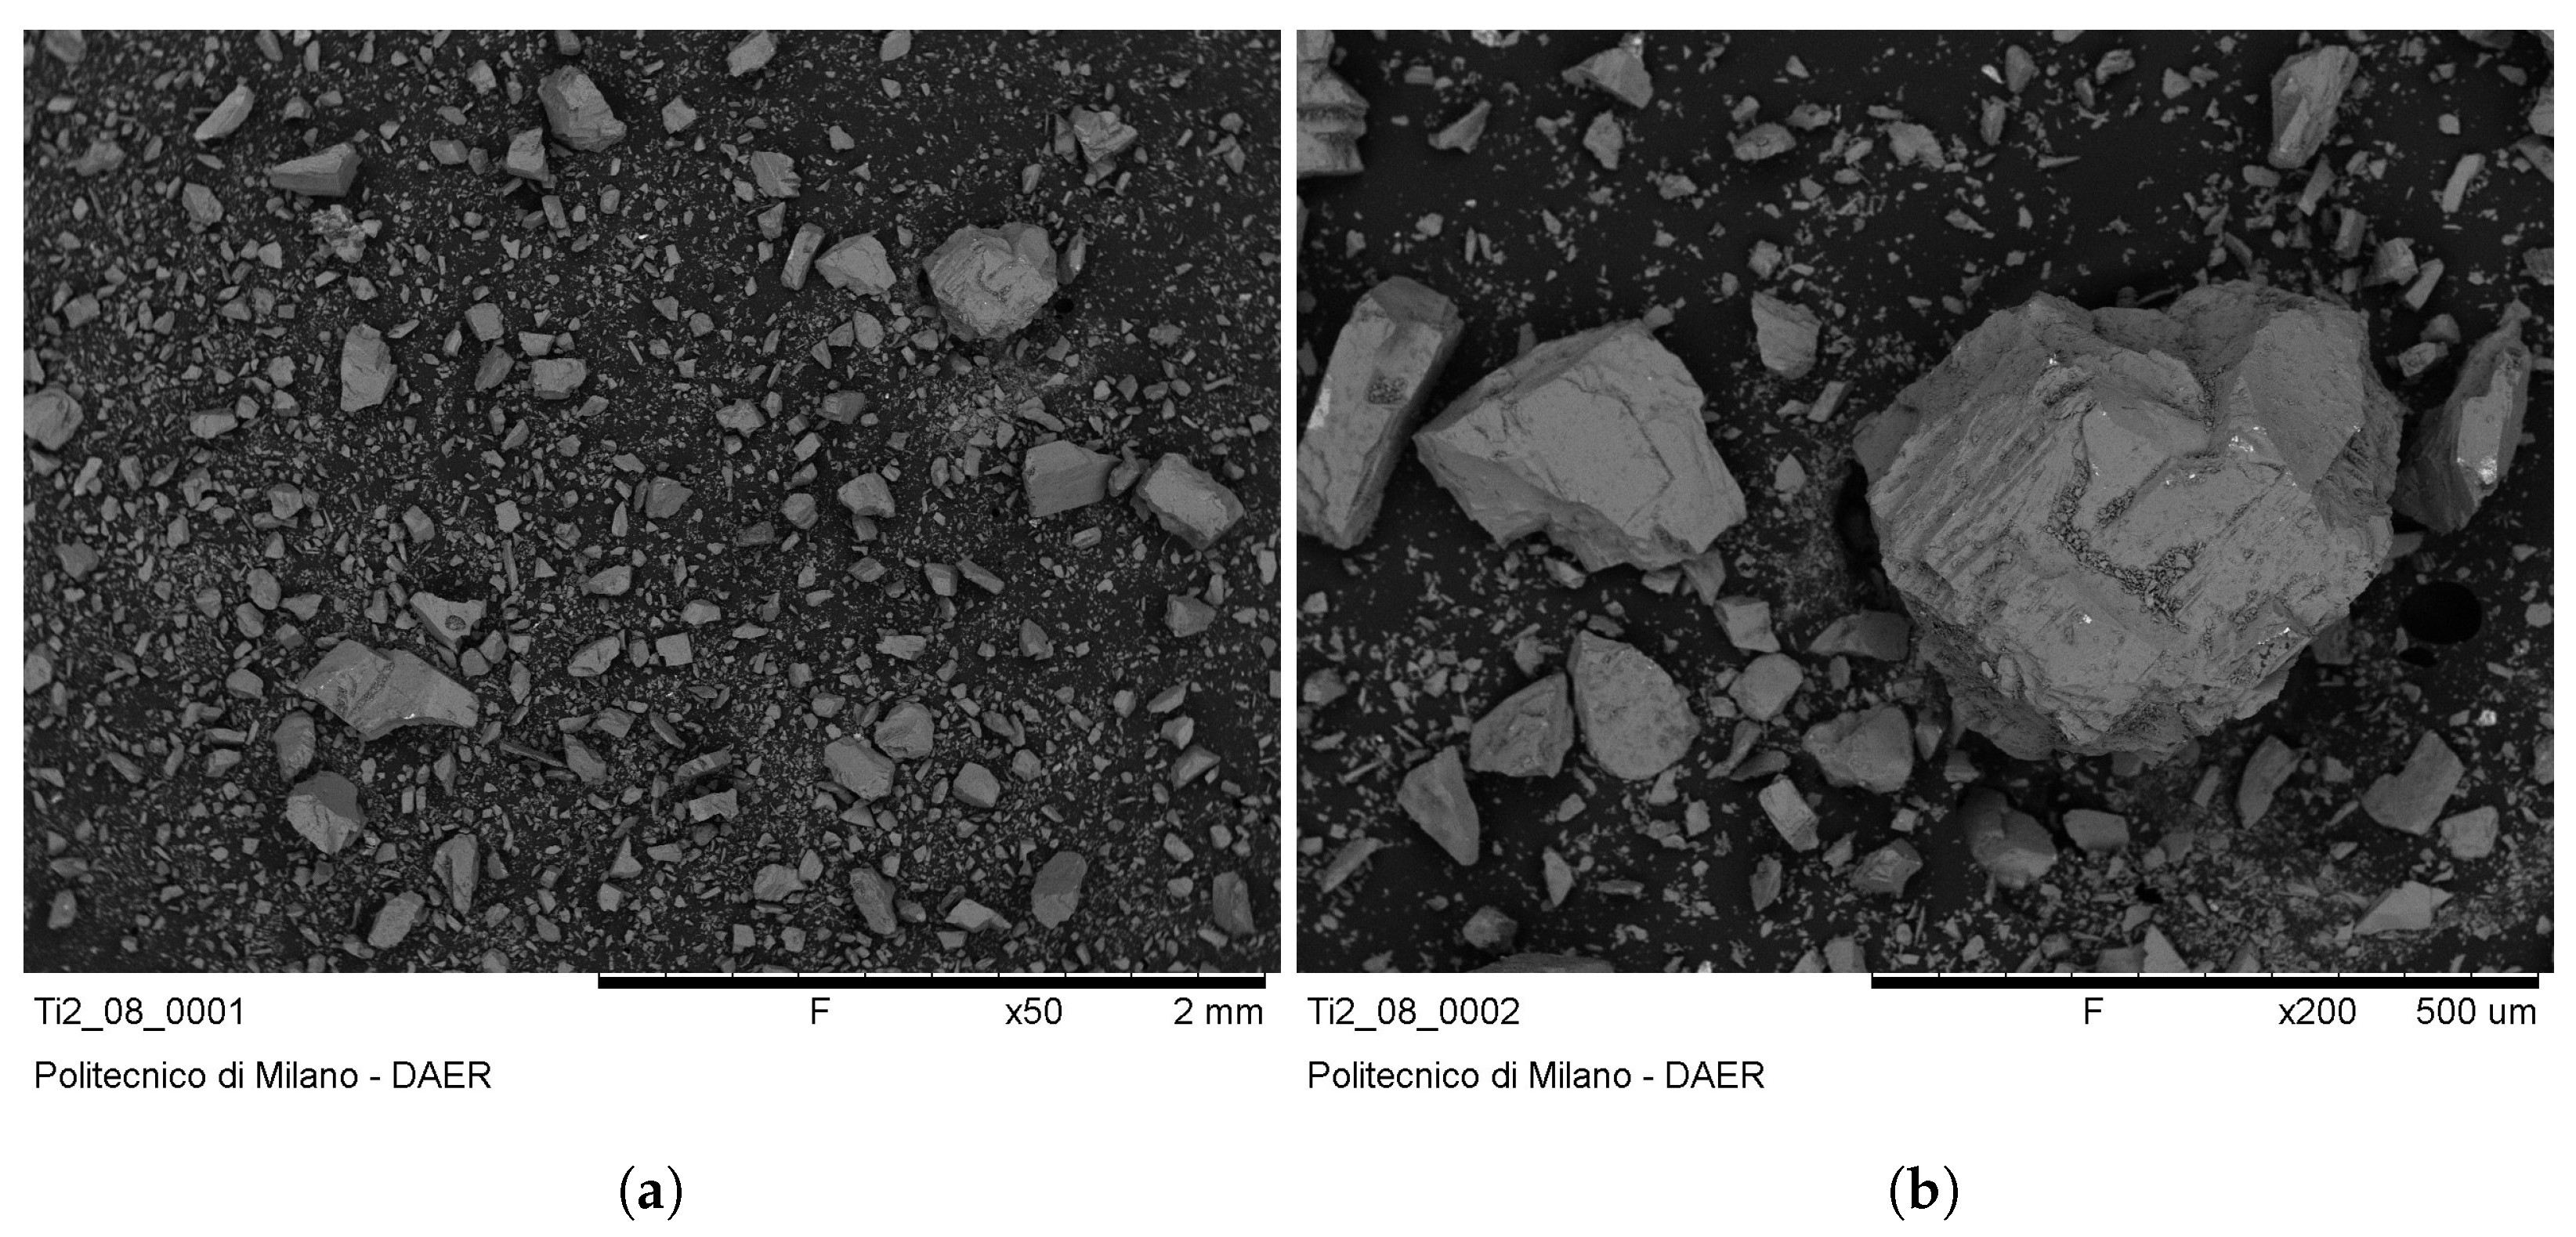
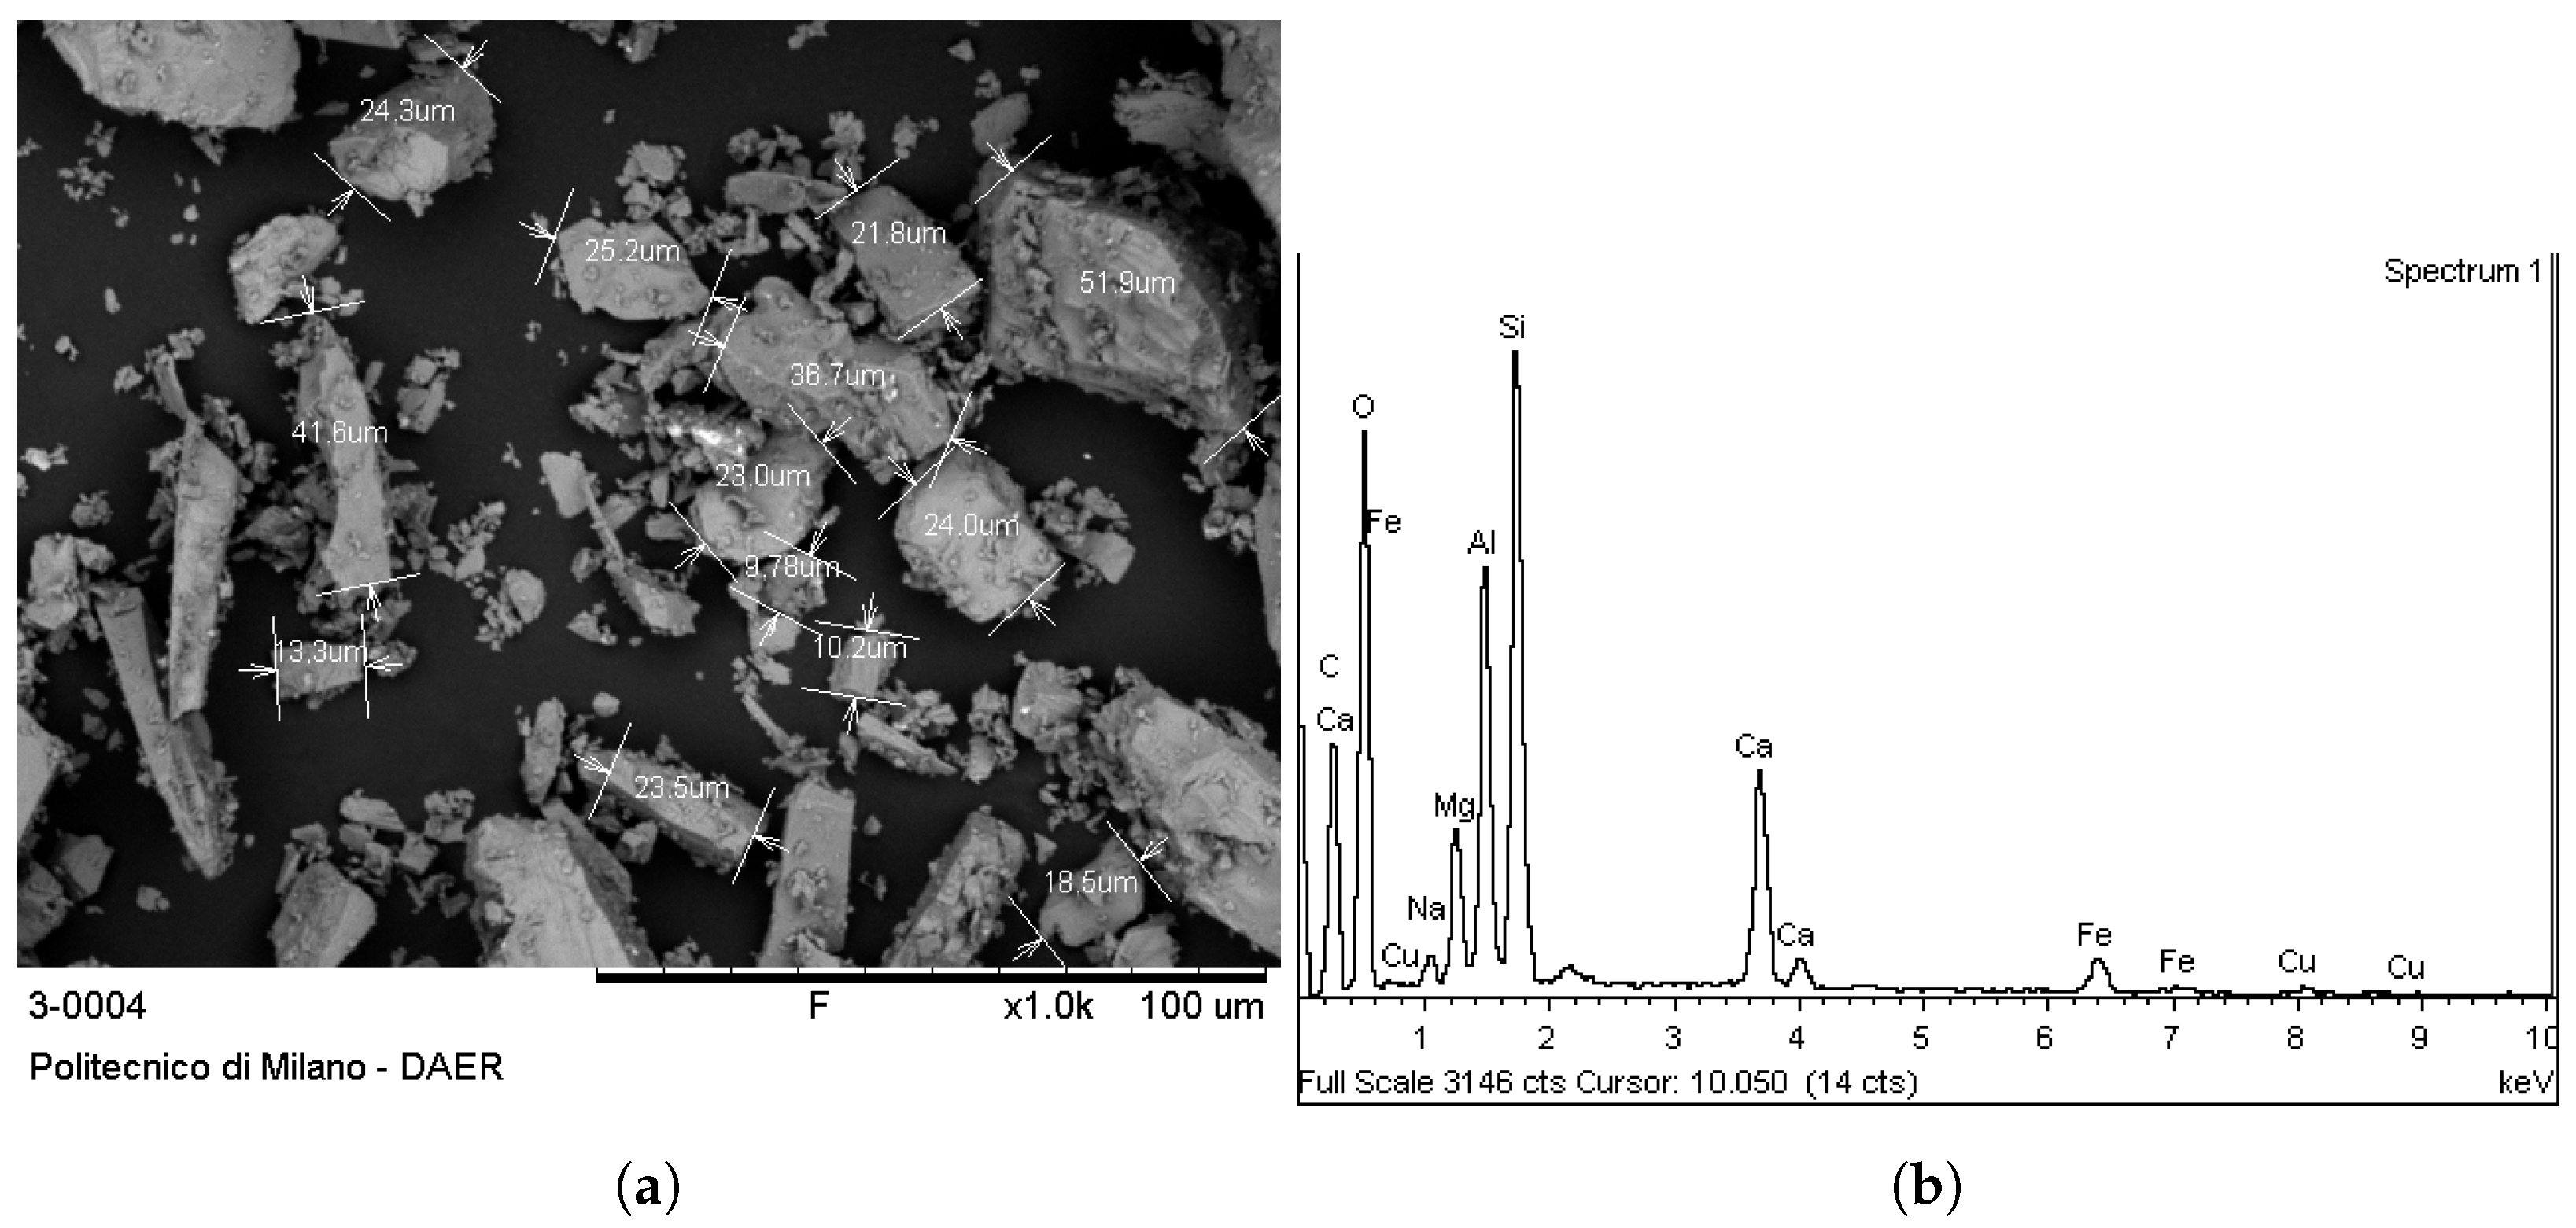
Looking at the virgin material, three images with different magnifications are reported in
Figure 3a,b and
Figure 4a. In the latter, the measure of the grains is also reported. The EDX probe detected most of the elements, as reported in
Figure 4b, with results that were comparable with the ones reported in
Section 4.1.1. The images, in particular the last one, instead show the complex fragmented nature of the regolith plus the variety of grain sizes present; this will have effects on the degree of compactness that can be reached due to the difficulty of the grains to settle in a more organised way. However, this feature helps the gas mixture to permeate the batch. With higher magnification, it would have been possible to appreciate the difference in the depositional features of the grains as the simulant did not undergo exposure to any lunar surface phenomena. This may cause the introduction of an efficiency, caused by the contact between the gas and the solid, as some sites may be more accessible than others.
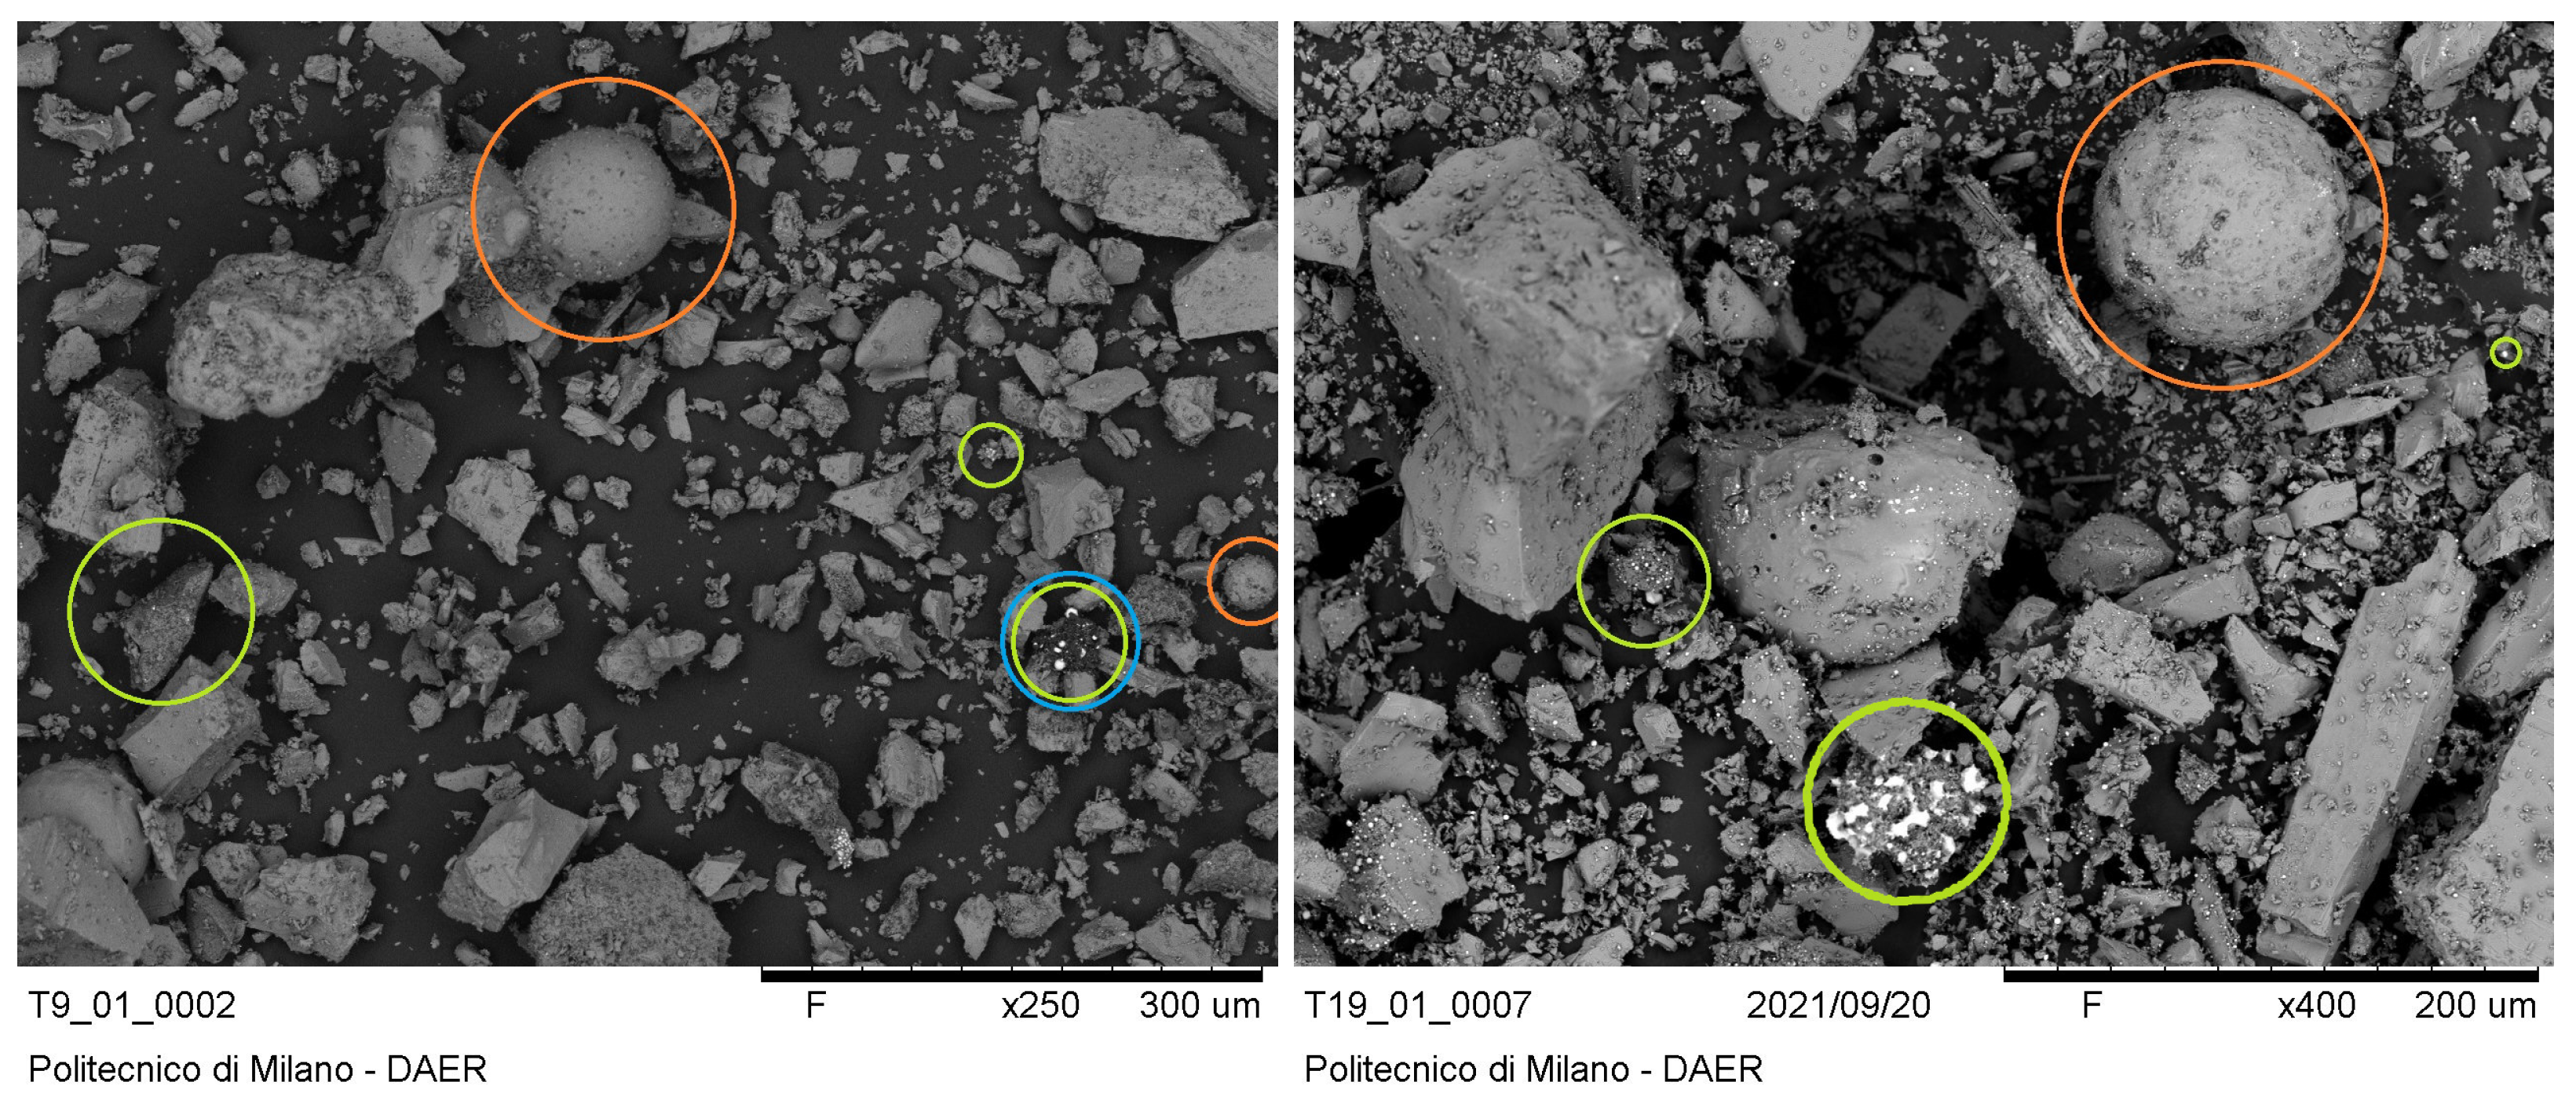
The appearance of processed samples differed from the virgin ones. In
Figure 5, three features that are not present in the virgin simulant are identified: spherical elements that can be related to the presence of silica; dark agglomerates covered by coke; and agglomerates with bright elements that can be linked to the presence of earth alkaline materials.
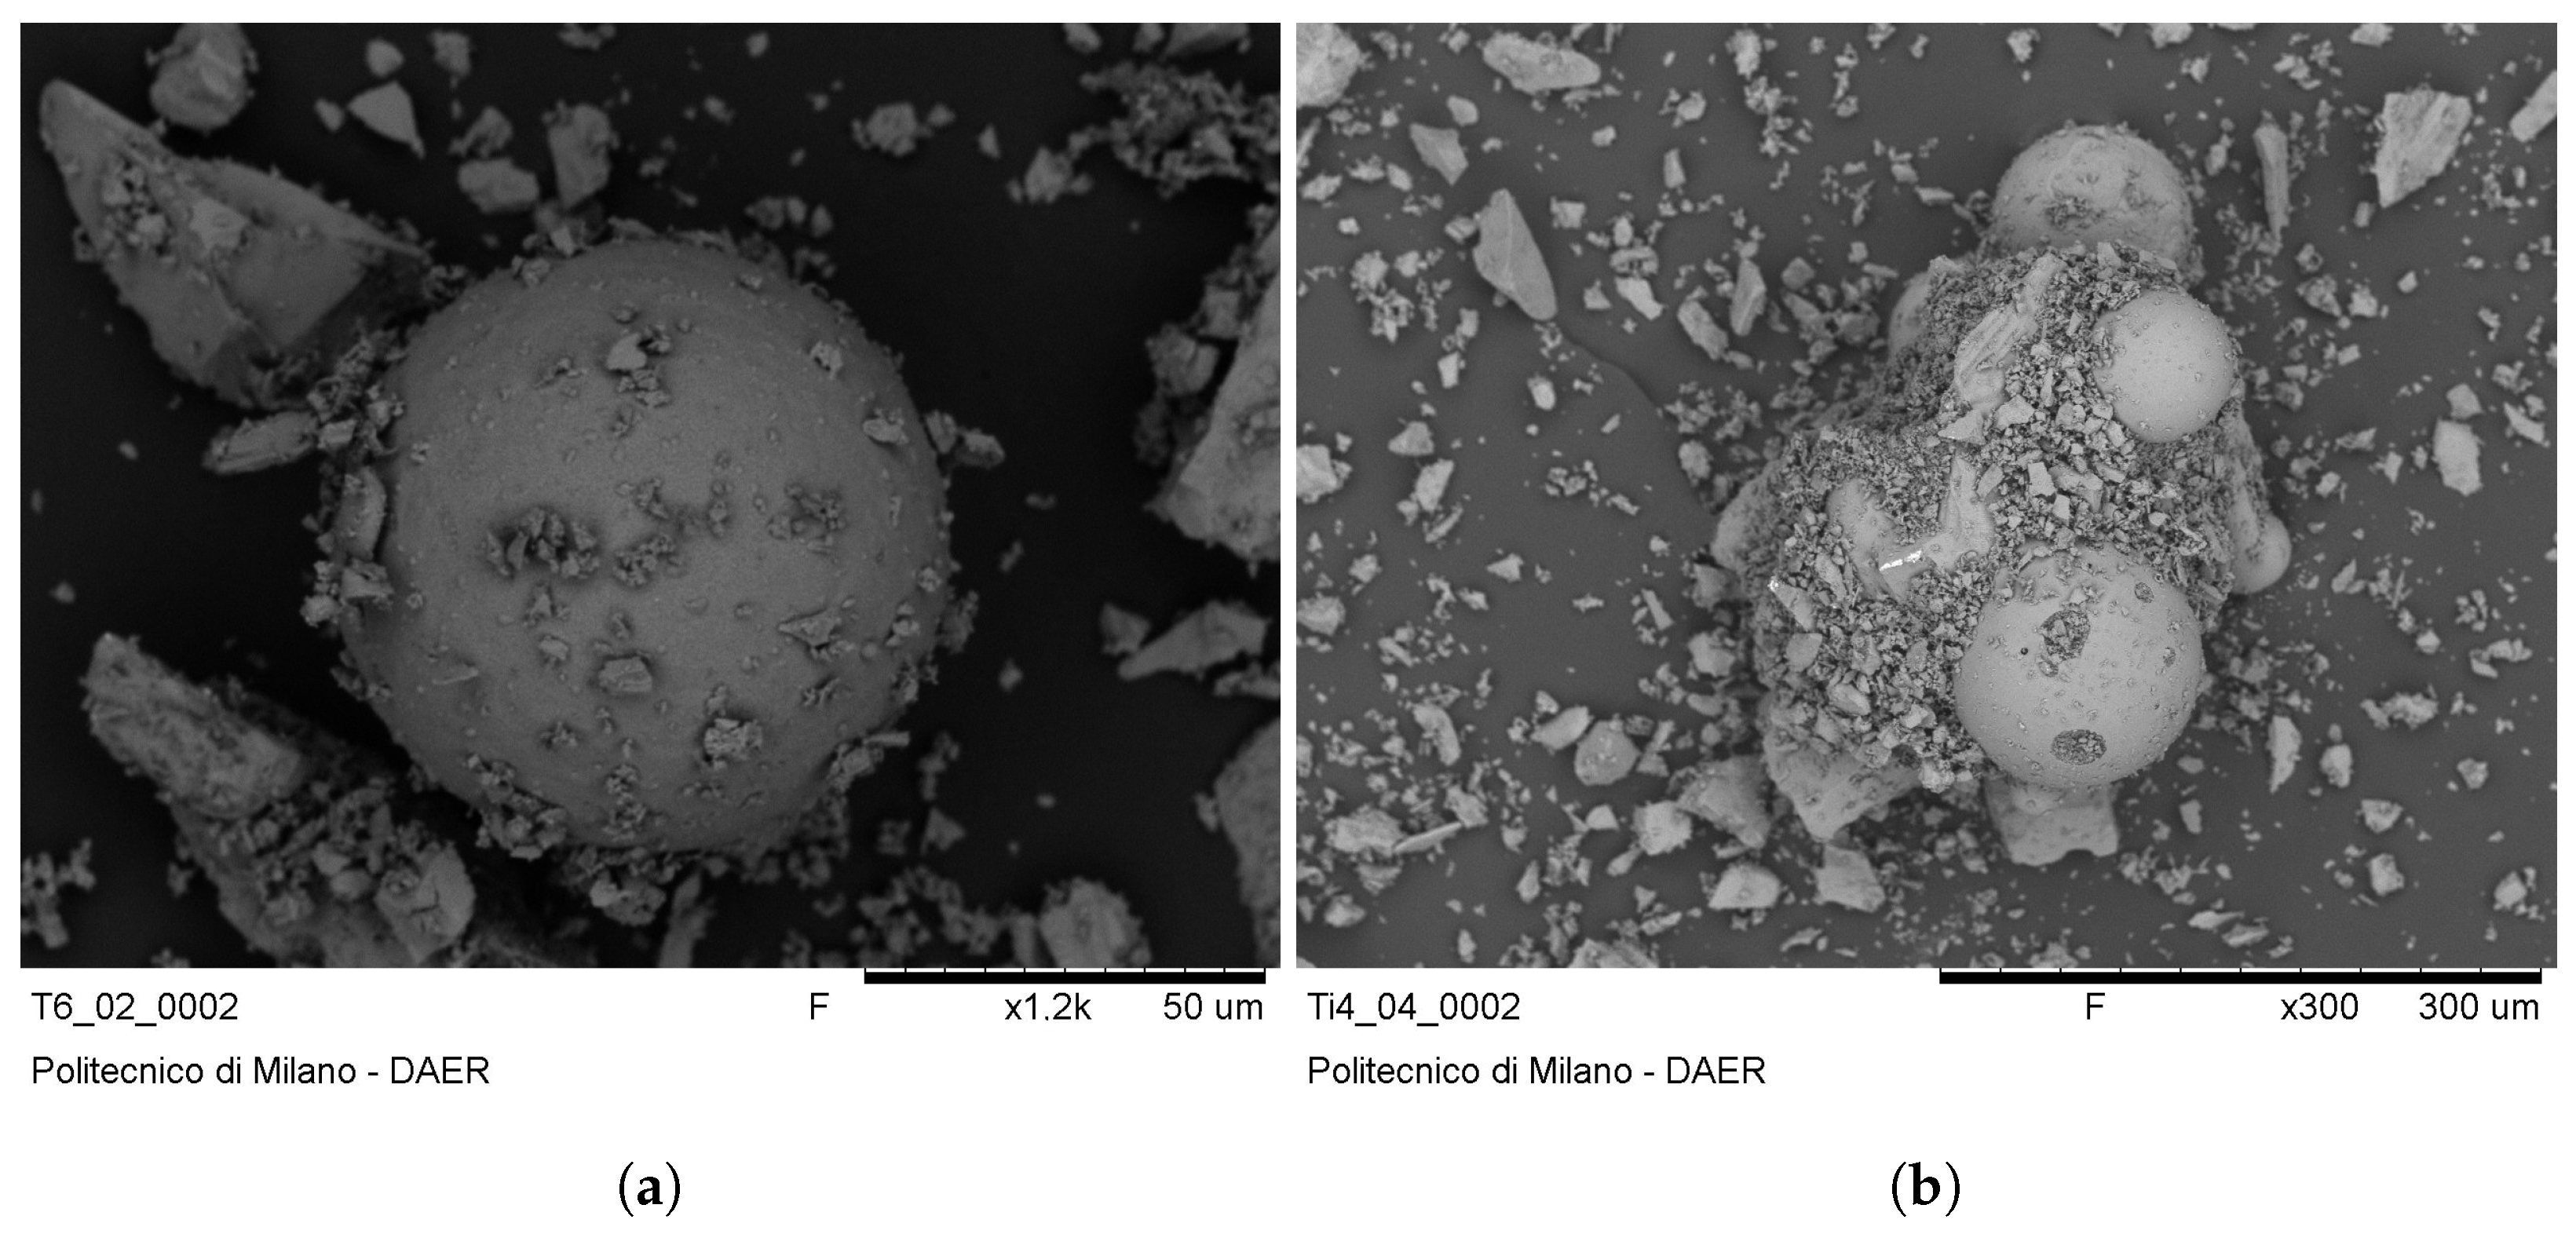
Silica spheres, as shown in
Figure 6, are the typical footprint of the solid-state carbothermal reduction of the simulant with methane. They can be easily found in all processed samples, with diameters in the range of 20–270 μm. They are more frequent in the samples reduced at higher temperatures and in those taken from the centre of the simulant batch rather than from the samples near the furnace walls; this means that their formation is enhanced at higher temperatures. The spheres can be both standalone (
Figure 6a) or connected to other fragments (
Figure 6b), and they are often covered with fine dust.
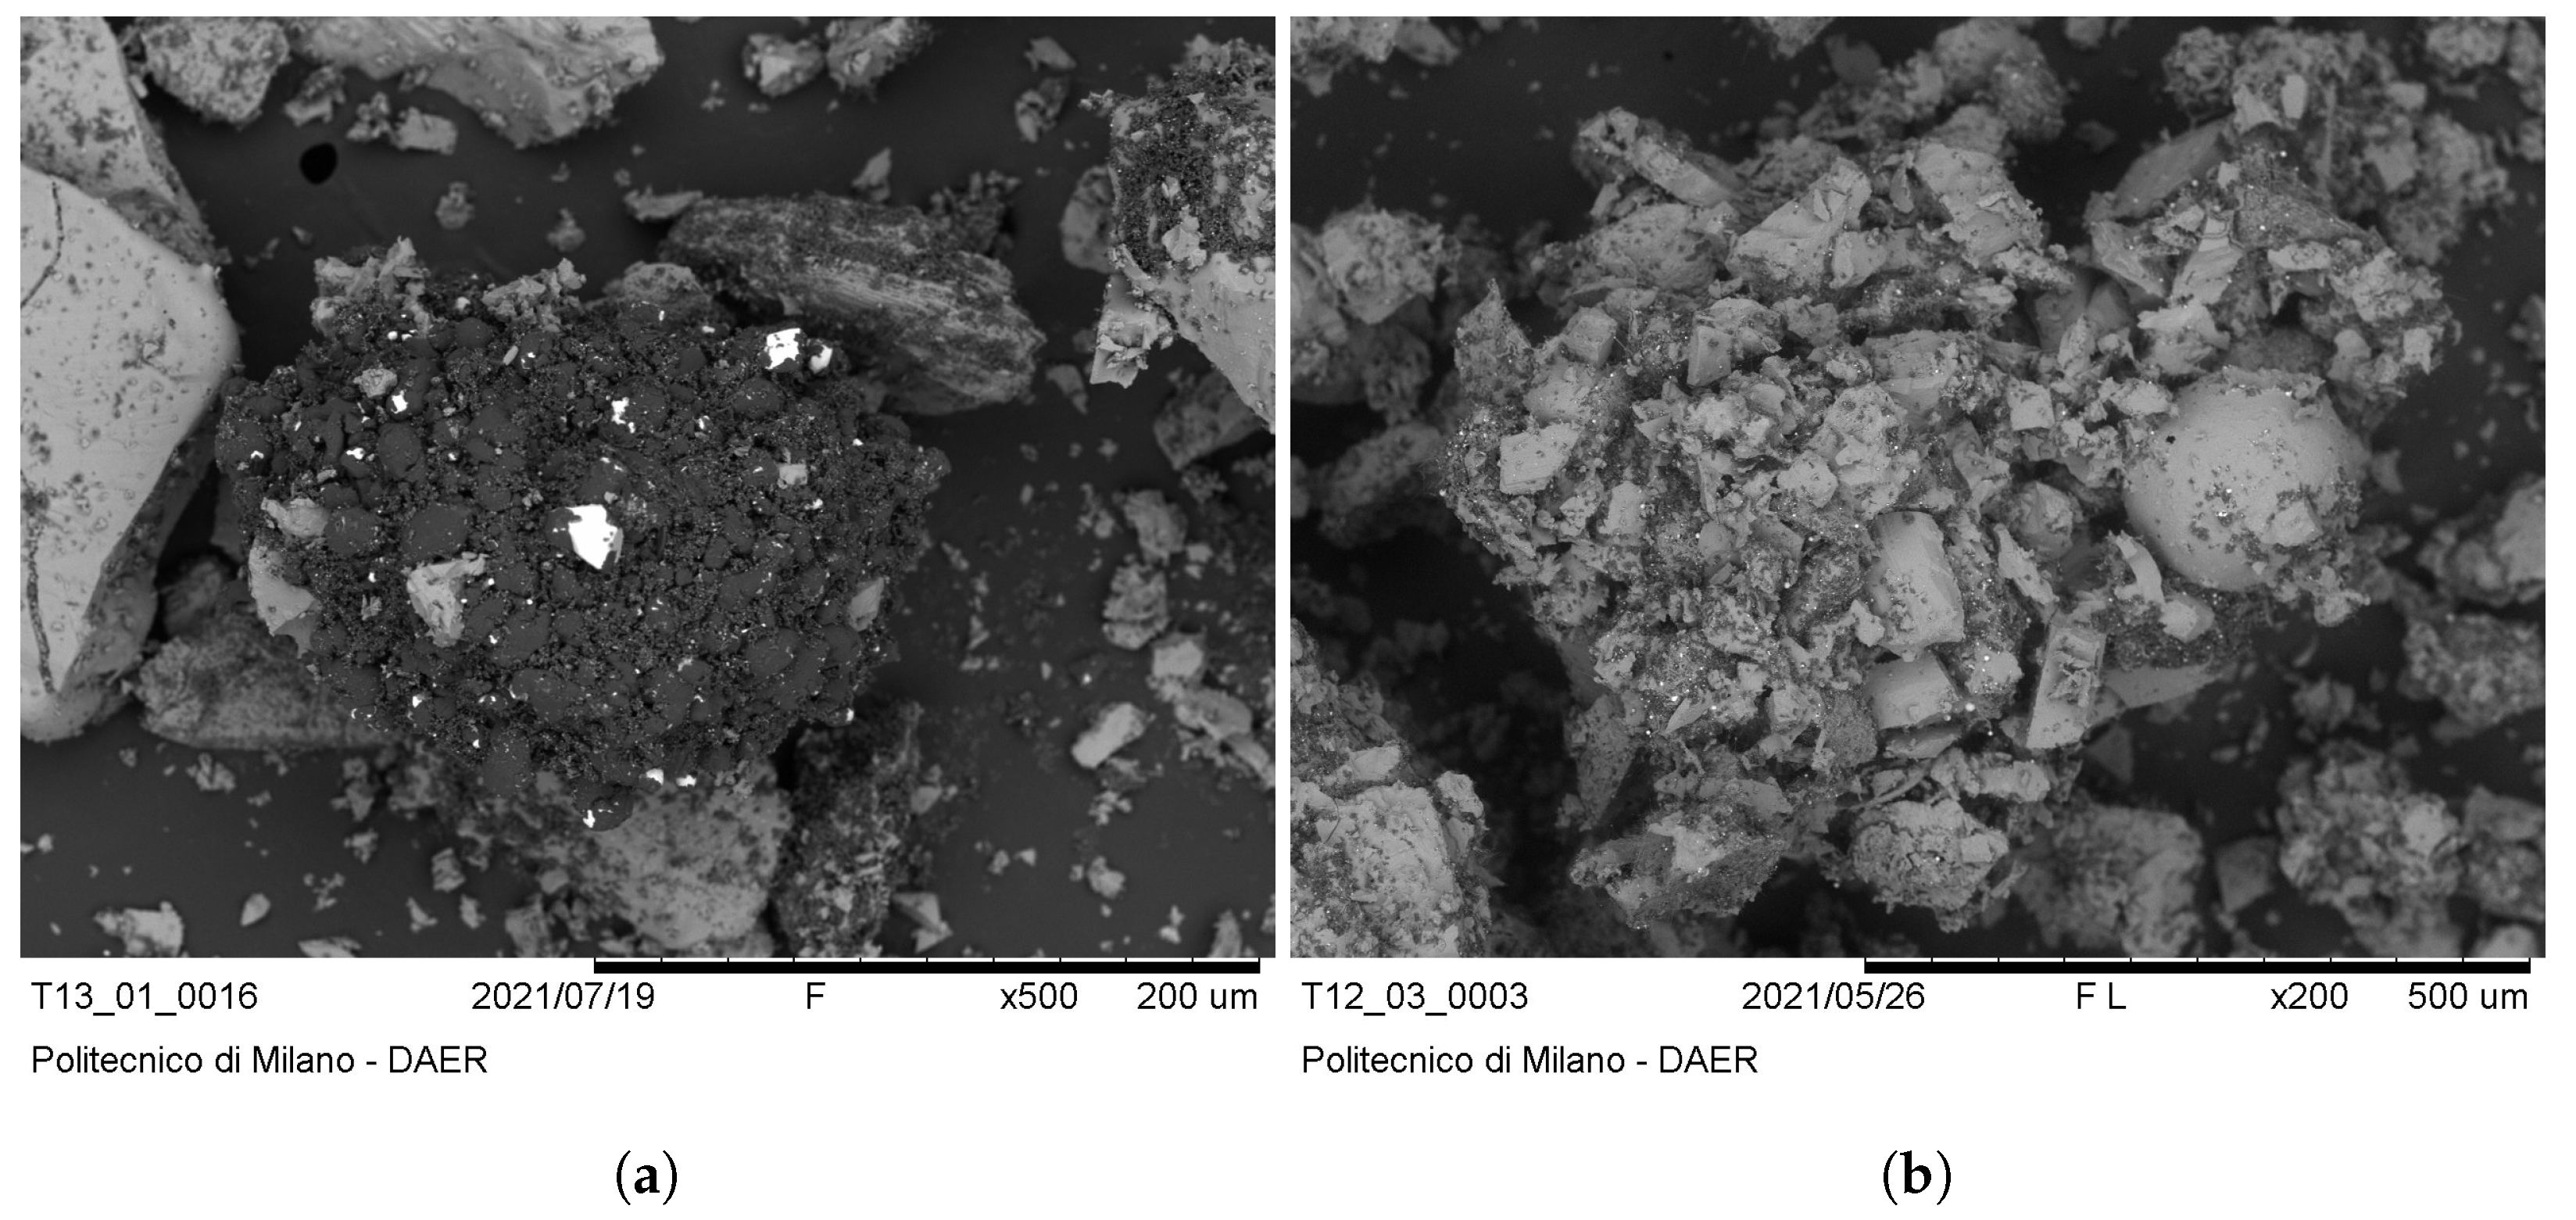
Coke agglomerates were present in the samples processed with temperatures above 1373 K and with methane percentages of 15% in the inlet flux as they derive from the methane dissociation. The agglomerates are dark, as in
Figure 7a, and have dimensions in the 1–100 μm range. They are often covered by bright dots, which are related to the presence of earth alkaline elements. Coke is also visible in the form of fine (≤ 5 μm) dark dust that covers some elements or regions in the samples.
In samples that reacted at 1423–1473 K temperatures close to the melting interval of the simulant, agglomerates of all previously described elements with fragments were present, as shown in
Figure 7b. Their dimensions are in the 100–300 μm range and are caused by the local melting of the simulant.
4.2. Physical Tests
To understand the behaviour of the powder from a mechanical and electrical point of view, the following physical tests were performed. These were fundamental for highlighting the possible complexities from an operational standpoint to lead to as smooth as possible regolith handling during all plant process steps.
4.2.1. Sieving
The characterisation of the grain size distribution helps to understand, compared with the SEM/XRD results after the reaction, which particle portion is more reactive and whether agglomerates are formed during the process. Furthermore, it can drive the definition of the pre-processing procedures in the lunar environment to define if grinding is needed to enhance the water production or if this passage can be avoided, reducing the complexity of the system; indeed, this step may also include some pre-treatment procedures and a high energy consumption in a power-limited environment [
39].
The sample granulometry has been performed by mechanical sieving, usually consisting of agitating the soil samples placed on different sets of sieves, each arranged in decreasing sizes, and then measuring the amount of particles blocked at each step.
The test result is reported in
Table 7, showing the weight percentage for the different granulometric fractions.
On the Moon, the grain size characteristics are defined by the mechanical processes responsible for its formation. Meteoroid and micrometeoroid bombardment have these effects on the soil: reduction of lunar rocks and their debris to fine particles (comminution), bonding of the particles together to form agglutinates thanks to the action of pressure and temperature (agglutination), and finally, mixing of different soils produced under different conditions in case of large impacts. The mean grain size ranged from 40 μm to 80 μm, most of which fell in the 45–100 μm interval (as in [
26]). In
Table 7, the upper and lower limits of the grain size distribution of the Apollo landing sites are indicated. It must be pointed out that, in general, the results of the test are in line with the regolith data, being closer to the lower bound for most of the intervals while having a strong presence of the particles in the 75–150 μm interval. The average could not be properly evaluated due to the missing upper boundary, but considering 0.8 mm as indicated before, the average was 96.8 μm. However, looking at data from other bibliographic references [
40], it can be highlighted that different samples have a mean grain size between 44 and 78 μm, so the distribution in the regolith is pushed to the low-grain size fraction. This can have positive effects on the available contact area.
4.2.2. Density Evaluation
Two different density measurements can be performed: The true density of the grains and the bulk density, defined as the mass over volume of the batch, including the voids among the particles. These two values of density provide different information that can be used for different purposes: The former provides a physical quantity of the grains; and the latter can instead indicate how the grains are organised. Through this article, it is possible to notice that the bulk density had more relevance than the true density for this particular application. However, the knowledge of this latter one is fundamental for the computation of some properties like the void factor, used for example in
Section 4.3.1 for the pressure drop produced by the batch. As a consequence, the main concern was to have a reference value to use for the tests and simulations here on Earth with the lunar simulant to be then prepared for the in situ experiments with the identification of the expected boundaries from the bibliographic data.
A helium pycnometer (Micrometrics Accupyc 1340) was used, which is a non-destructive technique that uses inert gases as movement media. The true density result obtained was accurate and reproducible. Two samples, called sample 1 and 2, were analysed; they were picked up after mixing the simulant present in the provided batch. The mass inserted in the measurement cell is arbitrary according to the limits given by the position of the injection and discharge holes of the gas.
The results indicate for Sample 1 ( g) an average true density of g/cm3 with a standard deviation of g/cm3; for Sample 2 ( g), the results indicate an average true density of g/cm3 with a standard deviation of g/cm3. The measured volumes are, respectively, 15.1539 ± 0.0056 and 12.9994 ± 0.0062 . The measures are obtained by repeating the measurement per sample ten times at a temperature of .
The values for lunar soils ranged from 2.3 to >
g/cm
3; in particular, the basalt particles had a true density >
g/cm
3, agglutinates and glass from 1 to
g/cm
3, and breccia from 2.9 to
g/cm
3. The usually recommended value is
g/cm
3 for general scientific engineering analysis, as reported in [
28,
41], leading the obtained results to generally agree with the expected ones.
In tests like the compressibility one presented in
Section 4.2.3, it is possible to also obtain the measure of the bulk density. Its value, around
g/cm
3, is in line with the expected one, i.e., that for the Apollo 16 ranges from 1.47 to
g/cm
3. Other tests performed by other facilities according to the standard specified by ASTM (1991), commonly used by the geotechnical engineering community to guarantee the comparability of the results, identified a simulant bulk density between 1.367 and
g/cm
3 [
42]. During the tests performed at PoliMi on the demonstrator plant [
18], it was important to determine the bulk density obtained with the chosen pouring procedure. Indeed, a different compaction level may influence the reduction process, and the knowledge of the value obtained can help in the definition of the procedures to make the batch more or less compressed. The bulk density value was assessed with the following procedure: a known control volume was selected and weighted; the simulant pouring procedure was reproduced (a funnel was used to convey the regolith in the reactor); the new mass was measured to evaluate the mass of the simulant inserted; and the density was computed with its definition (mass over volume). The procedure was repeated three times, leading to a NU-LHT-2M bulk density in the range of 1.303–1.327 g/cm
3. The obtained value is low and in line with the expectations, as no particular compaction procedures were applied after the pouring with the funnel.
If tests must be performed on the handling of the soil, the lunar simulant has to be conditioned to reach a bulk density similar to the ones highlighted before; as stated in
Section 4.2.3, a simple compression is enough to enter the expected range, while a shaking procedure can help in reaching the upper limit. Indeed, for the lunar plant, the variation of the bulk density from the collection to the insertion in the reactor imposes a constraint not only on the movimentation and pouring methods, but also on the measurement one. Regarding this last aspect, having the boundaries of the bulk density variation can help in the definition of the most appropriate mass measure technique; if it is not possible to directly insert a scale, a volume measure is the other possibility, with the uncertainties deriving from the unknown precise true and bulk density. Regarding the pouring, there is instead an ongoing analysis that aims at identifying the effects of a fluidised bed on the process yield with respect to a compressed batch; the trade-off among contact area, temperature distribution, pressure drop, and volume utilisation will tell which is the best strategy to adopt. To this end, the next sections analyse both the compression strategies and the solid–fluid interaction.
4.2.3. Oedometer Test
This test measures the bulk density variations with different normal stresses applied. It must be pointed out that this is a terrestrial value, as on the Moon, no atmosphere can interfere with the compaction procedure. This information is important to tune the possible compaction procedures and see which are the operative limits. As previously said, as compaction can have effects on the process yield, the assessment of the compression that can be reached with different methods was conducted. Furthermore, these tests are also useful for other applications that need, for example, the production of sintered cathodes or bricks [
43] or for the landers/rovers and soil interaction [
13].
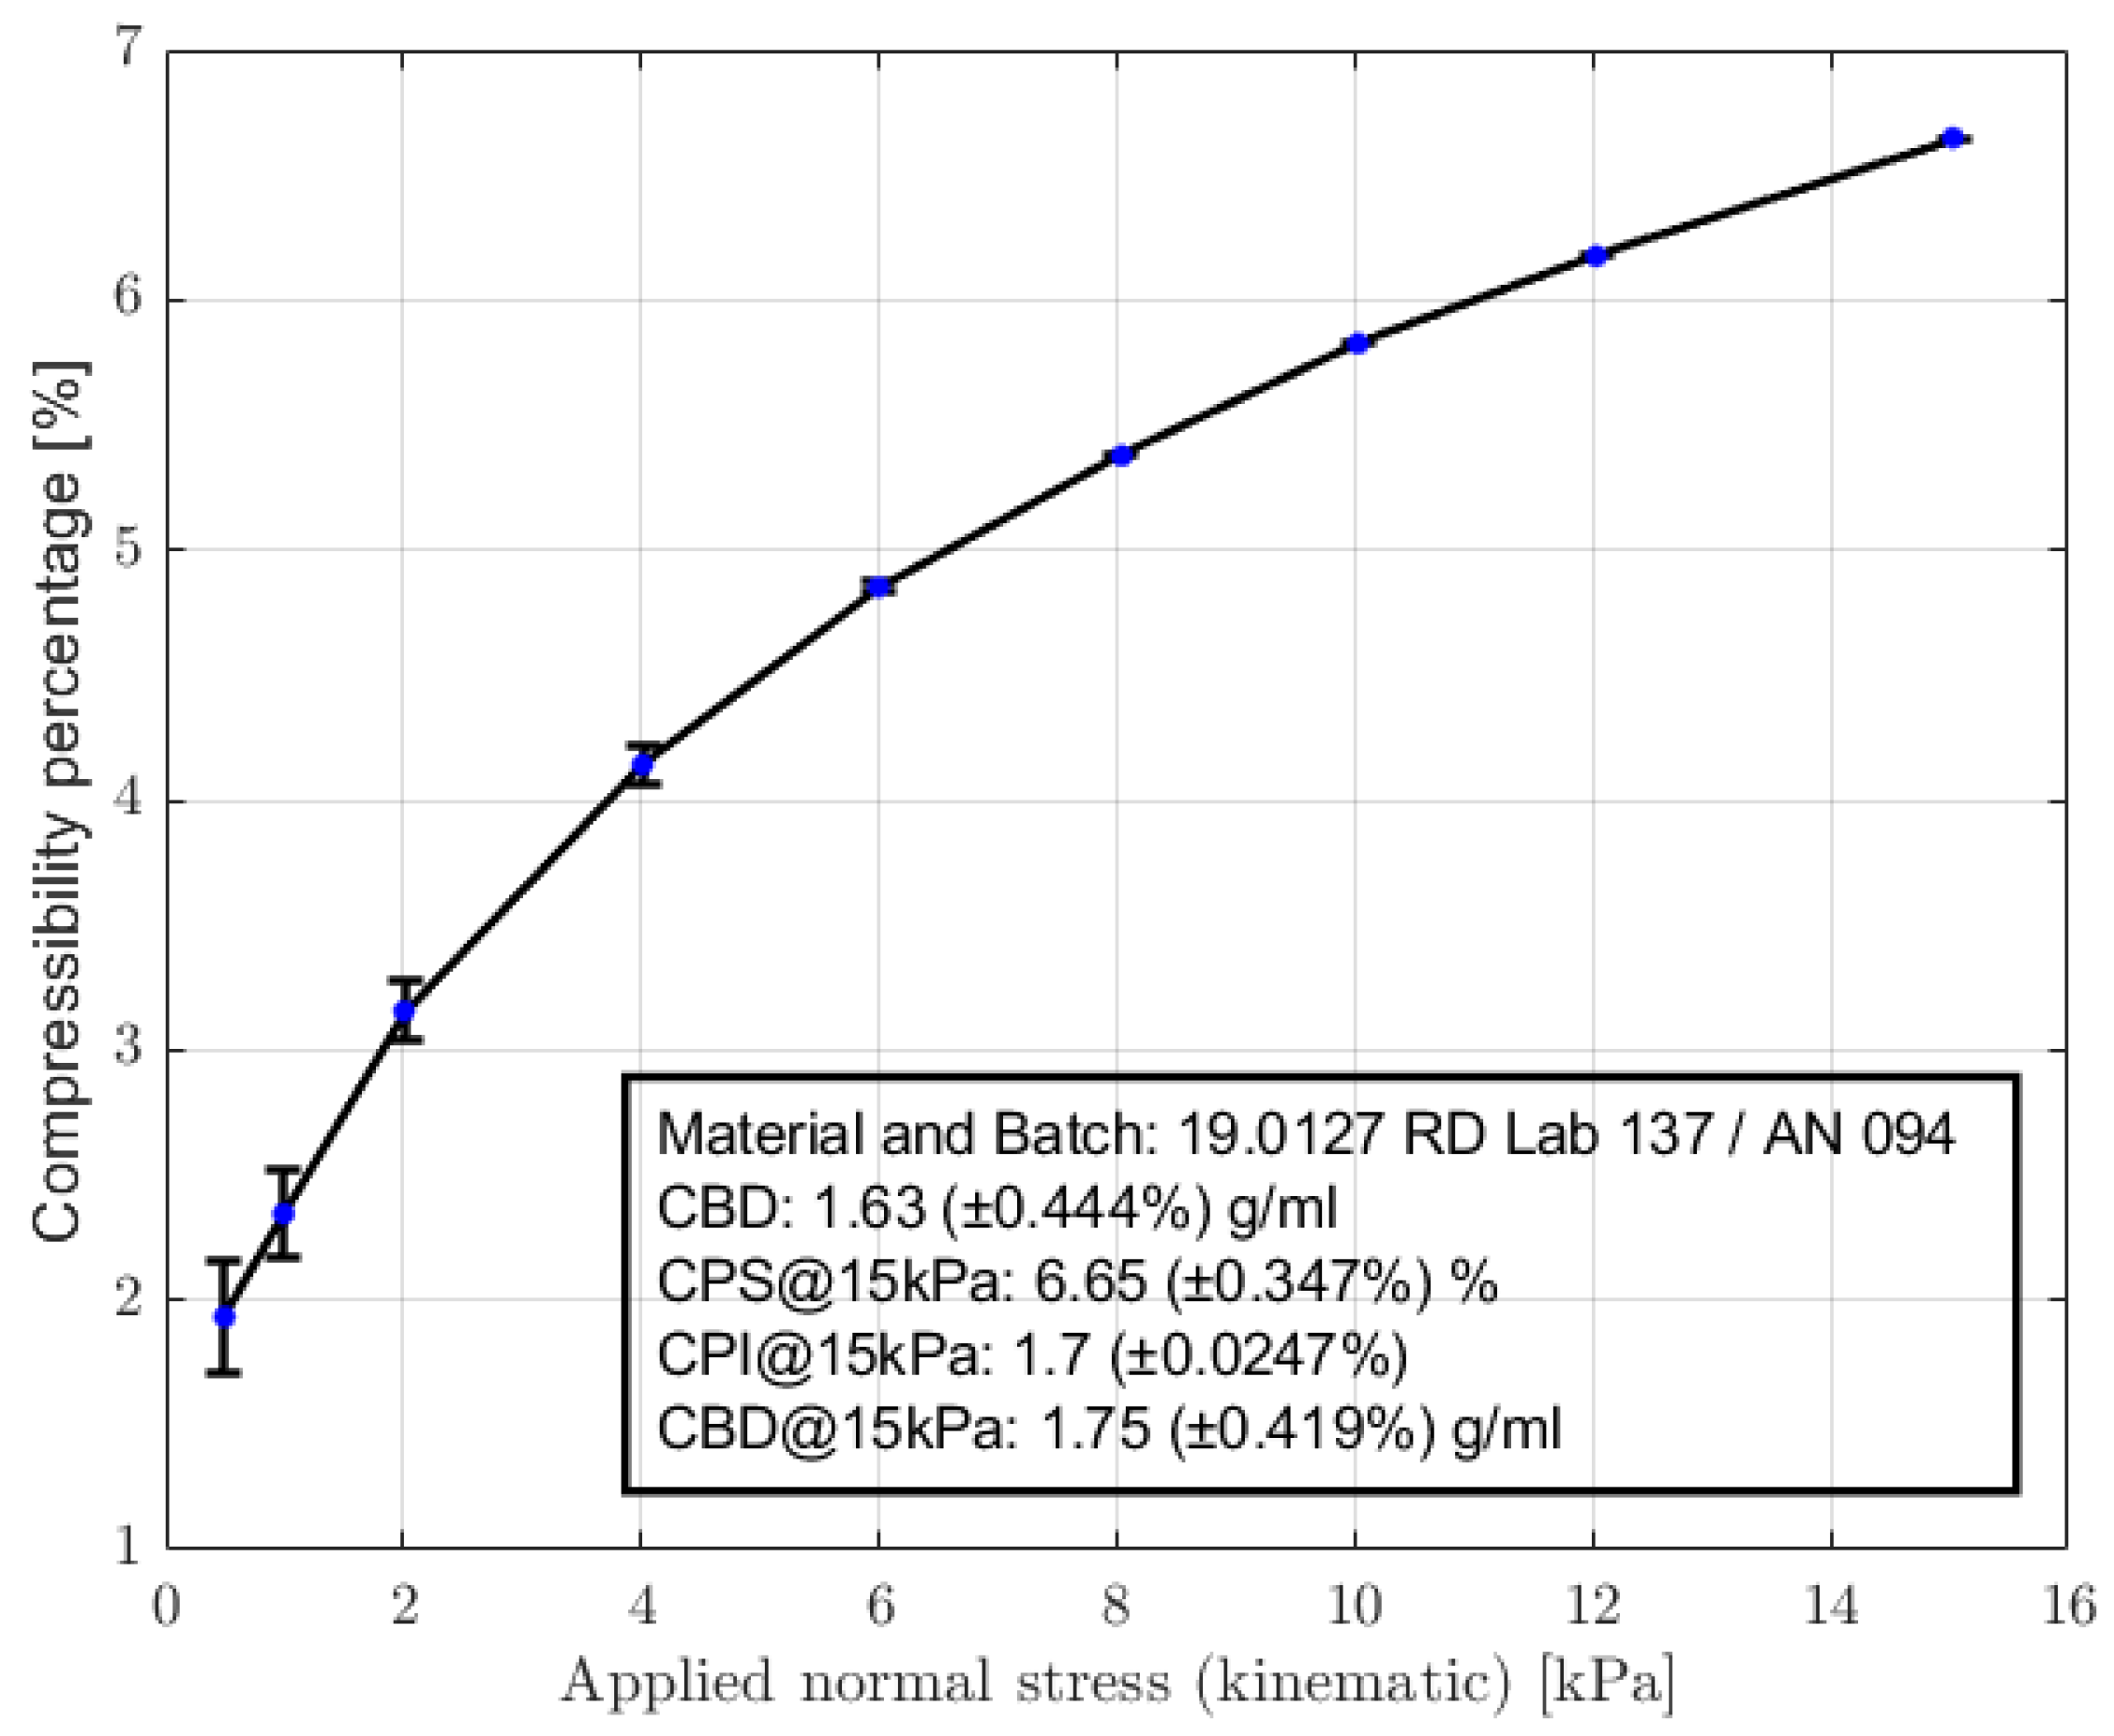
During all tests performed at [F-02], the FT4 powder rheometer, Freeman Technology, was used to characterise the simulant. To compress the sample, a piston was used, which had a fine mesh that allowed the air contained in the voids to come out. The distance travelled by the piston was measured and converted into a volume variation. The test generated four parameters: CBD (conditioned bulk density): density of the sample, evaluated as mass over volume; CPS% (compressibility percentage over stress): percentage variation of the bulk density with different normal stress applied; FBD (final bulk density): The density is evaluated as the ratio between the mass and the volume after the compression; and CPI (compressibility index): evaluated as the ratio between FBD and CBD. A value close to one indicates a low compressible powder.
In
Figure 8 the behaviour of the compressibility percentage with respect to the applied stress is reported. The starting point is a density of 1630 kg/m
3, which is in line with the expected ranges of the lunar regolith reported in the previous paragraph, while the final reached density is 1750 kg/m
3, close to the upper limit. The curve reduces its slope with the increase in the stress applied, as expected from a powder material; the first part of the curve can indicate the initial re-organisation of the grains with the partial removal of the air that is trapped in the sample. This air is able to flow outside thanks to the mesh embedded in the piston. In the second part of the curve, these phenomena instead start to reduce, and the grains approximate their final configuration, wherein the particles are interlocked before starting comminution; in the range of stresses applied during this test, no failure phenomena were observed.
The manipulation of these data, with the results reported in
Table 8, is interesting for comparison with the bibliographic data. Indeed, it is necessary to define the compression index as in Equation (
1), i.e., the decrease in the void ratio (
e) that occurs when the stress (
) is increased by an order of magnitude.
Equation (
1) leads to values of 0.3 for loose regolith and from 0.01 to 0.11 for the dense one; a typical value can be 0.5, as in [
41]. The values from the available data were extracted considering an arbitrary volume of 1 m
3 and how it varied when stress was applied. Then, the bulk density in each point was evaluated considering a mass of 1630 kg, coming from the initial bulk density value, 1630 kg/m
3 provided in the test results. Thus, the void ratio can be evaluated with the total and simulant volumes or with the associated densities as
, in which
is the true one evaluated in the density (
Section 4.2.2),
kg/m
3. Then, applying Equation (
1) the compression index can be found; as it can be seen in the last row of
Table 8, this is in line with the values for a dense regolith (0.01–0.11), showing low compressibility, an index of the efficient packing, and the absence of trapped air, which serves as confirmation of the low cohesive nature of the soil. This aspect is also highlighted in the CPI index of 1.07 at 15
, provided in the given results, where being close to 1 indicates a low compressible powder. The FBD at 15
can be used to cross-check the bulk density value evaluated in the elaboration of the data: its value was 1750 kg/m
3.
This test indicates that the application of vertical stress does not providee particular benefits; indeed, the increase in the bulk density was about 7%. A shaking procedure, like the one described in [
44], is more effective as the bulk density can be brought from 1630 to 2100 kg/m
3, providing a 29% increase; this value varies, among other parameters, with vibration frequency and profile.
4.2.4. Shear Cell
The shear properties are important for understanding how a consolidated and at-rest powder behaves when it is forcibly induced into motion, a common operation in most of the ISRU processes. Furthermore, cohesion and friction angles are among the basic values to insert when simulating a material. For example, a simulation campaign with DEM is ongoing to test the pouring procedures into the carbothermal reactor under design for the ORACLE payload described in the introduction, for which those values are required. The air present in the interstices of the simulant affects the results, which have to be considered with a certain margin when applied to the lunar environment.
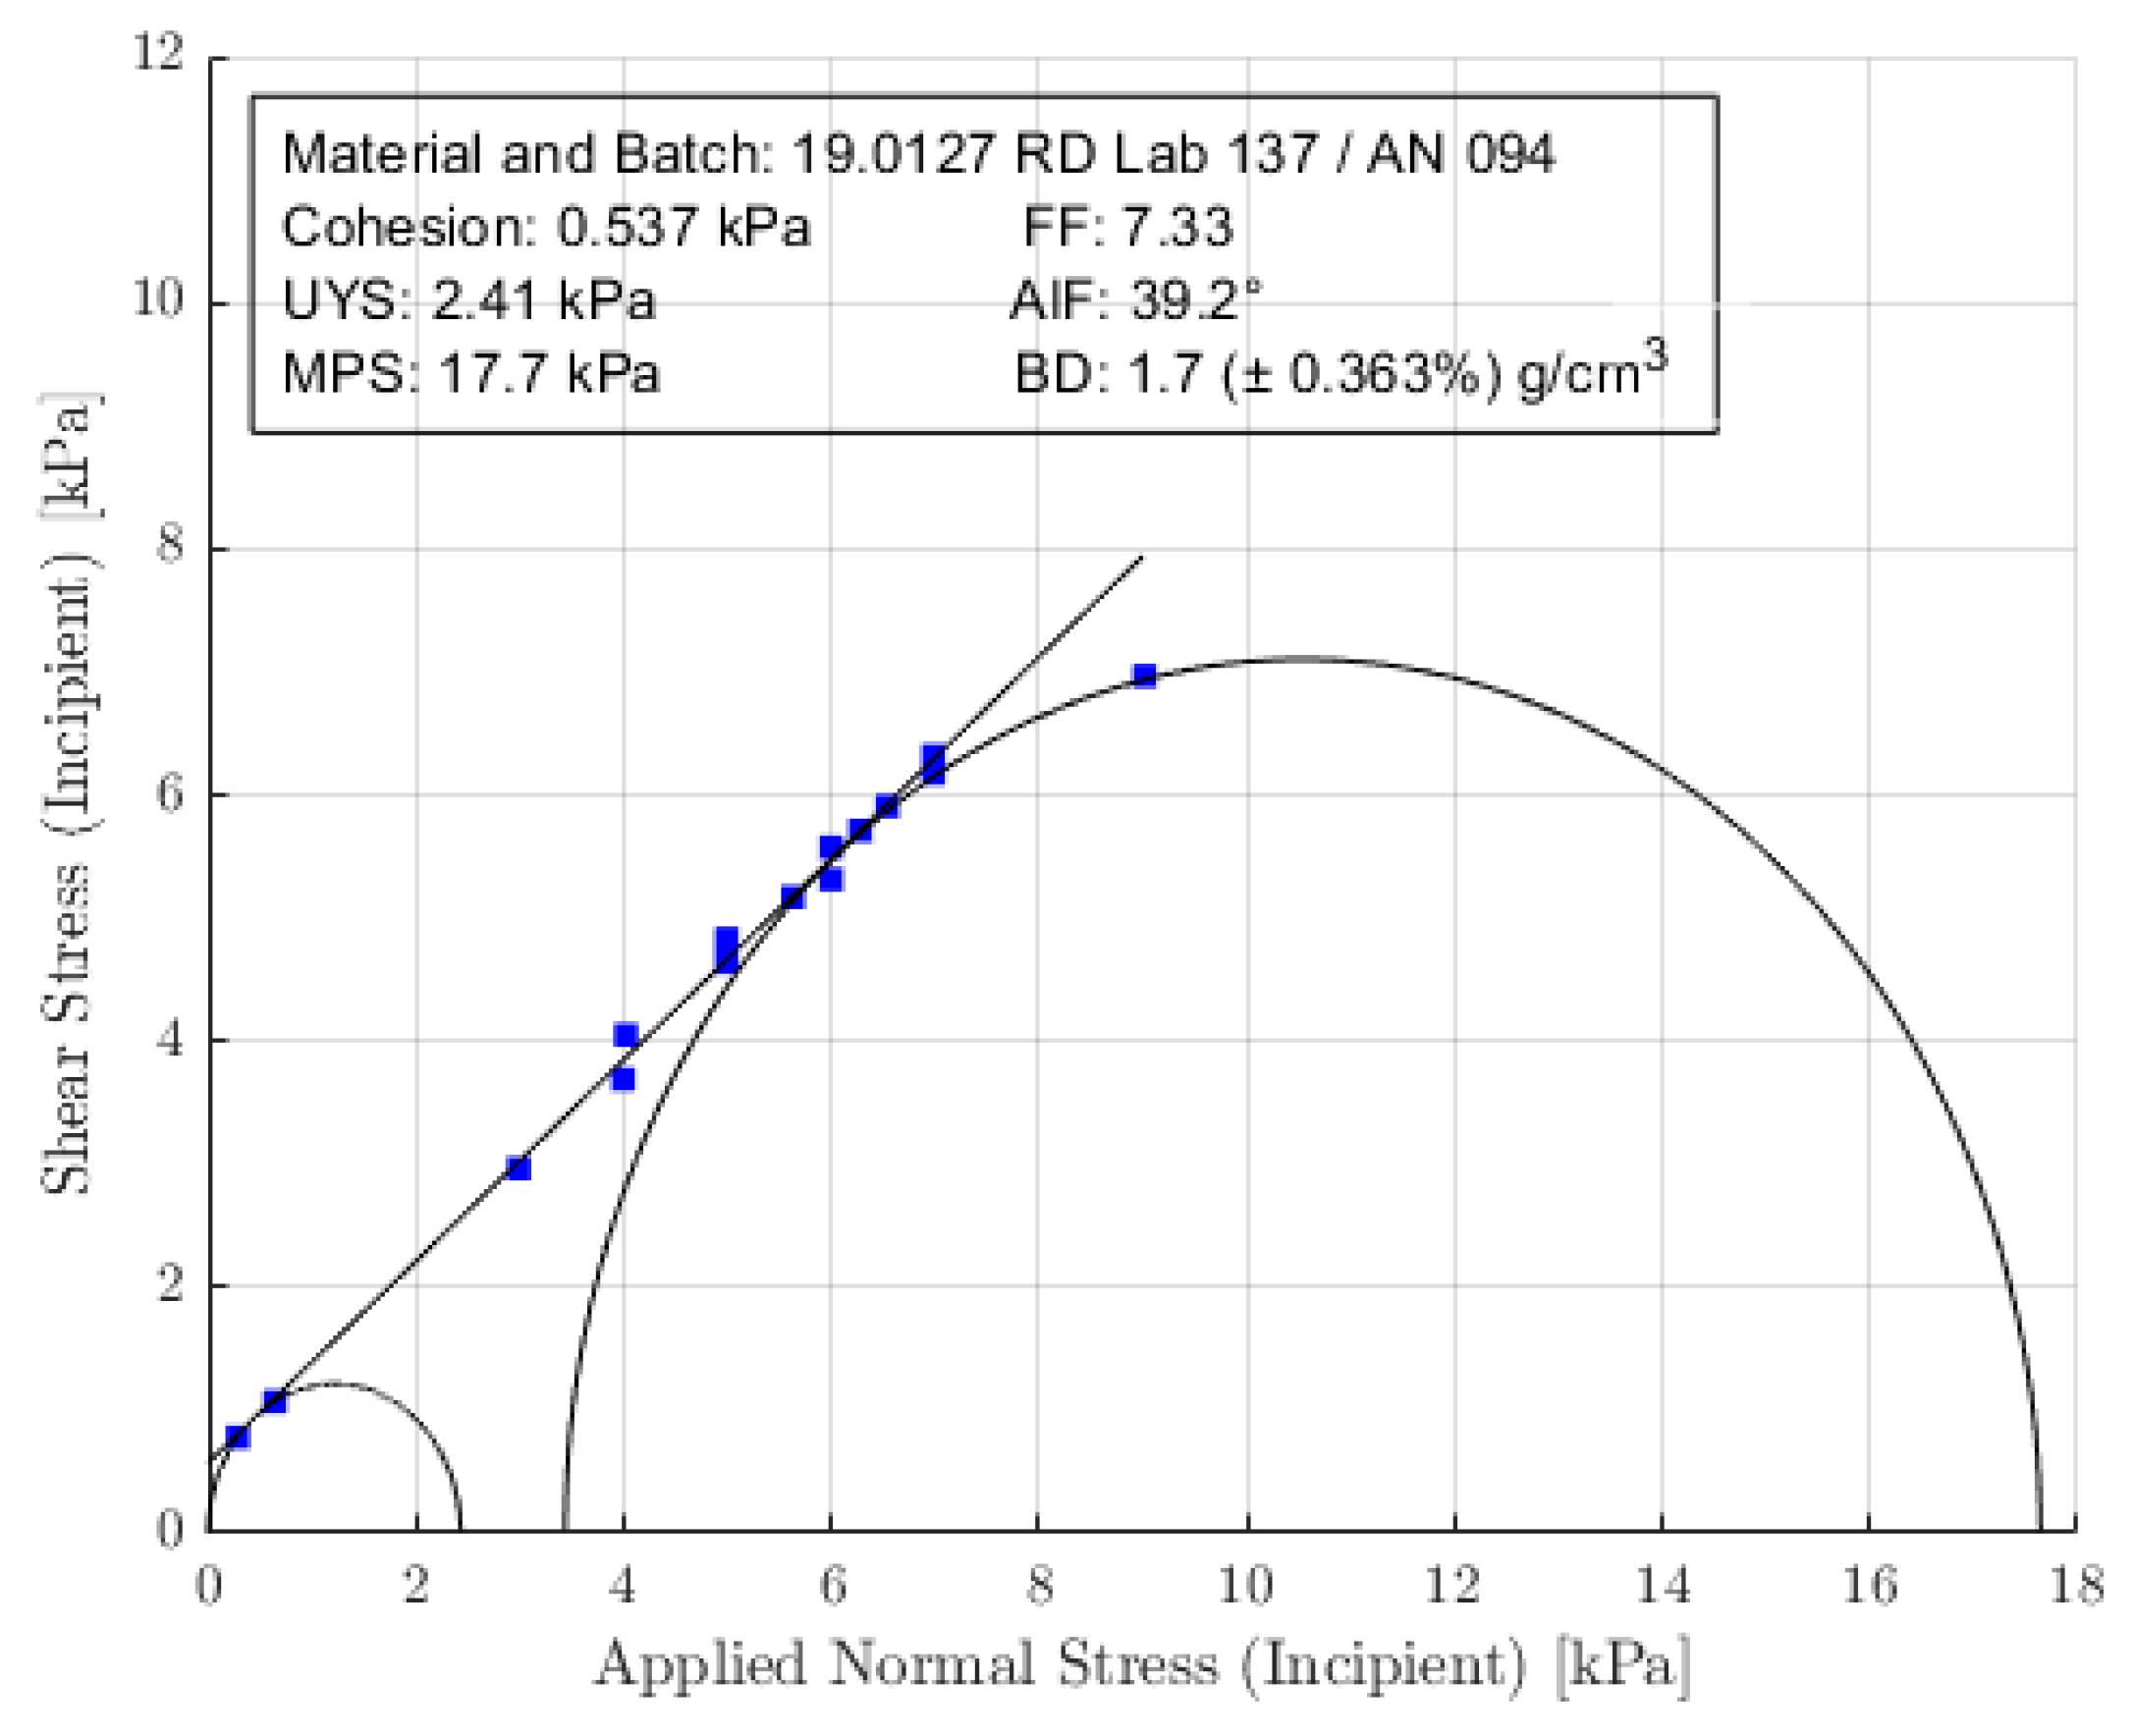
In this test, the instrument induced both a normal compression stress and a shear stress. The powder was firstly compressed at 9 kPa. A patented geometry called shear cell (ASTM standard D7891), which has small blades placed radially, penetrates normally with respect to the levelled powder bed and induces a controlled normal stress. Once the desired normal stress value is reached and maintained for a few seconds, the head of the shear cell starts to slowly rotate, inducing a shear stress; in this way, a powder substrate is created and, subjected to the shear forces, tends to flow on the below powder bed. The shear stress increases until the powder bed opposes the rotation; when this yields or starts to rotate, a maximum is registered, followed by a fall of the shear stress value. The peak is called the yield point, and by plotting it at different normal stresses, the yield locus is obtained, as reported in
Figure 9. The obtained data can be analysed with the application of Mohr’s circles, built with the following procedure: The best-fit line that interpolates the yield points is traced, and the y-intercept is found. The semi-circumference passing through the origin and tangent to the best-fit line is the minor Mohr’s circle, while the major Mohr’s circle is also tangent to the line but intersects the pre-shear value, which was at 9 kPa in the obtained results. The generated data are the following ones. C (Cohesion): The theoretical shear stress point in the absence of the normal stress. A high C value indicates that it is difficult to induce the motion by applying purely shear stresses. UYS (Unconfined yield stress): The highest x-axis intercept of the minor Mohr’s circle. An elevated value means that the powder bulk is capable of maintaining its structure more efficiently after a consolidation, whereas a low value indicates that the yield of the structure is more probable after the removal of the forces acting on it. MPS (Major principle stress): The highest x-axis intercept of the major Mohr’s circle. A high MPS indicates that the powder behaves more as a solid than as a liquid. FF (Flow function): A parameter evaluated as the ratio between MPS and UYS. If F
4, the powder is prone to flow, while lower values indicate a higher resistance to movement. AIF (Angle of internal friction): It is the angle created between the best-fit line and the x-axis. High values mean elevated friction between the powder layers. BD (Bulk Density): The ratio between mass and volume.
The results are displayed in
Figure 9. Following the previous tests, the cohesion value was low. This value was also confirmed by the Apollo 16 range of compressibility values of 0.25–1.3 kPa. Furthermore, the low compressibility implies that the consolidation for direct pressure does not significantly change the flowability properties of the sample (F
4). The elevated value of MPS is linked to the high energetic provision necessary to consolidate the powder, while the low UYS indicates that, after consolidation, the powder flows again with a not-so-high energetic provision. The high value of AIF is in accordance with the presence of important friction phenomena among the particles and mechanic blockage.
To compare the data with the regolith one, a small passage through the Mohr–Coulomb equation reported in Equation (
2) must be performed, in which
is the shear strength [
,
is the normal stress [
,
c is the cohesion [
, and
is the friction angle [°].
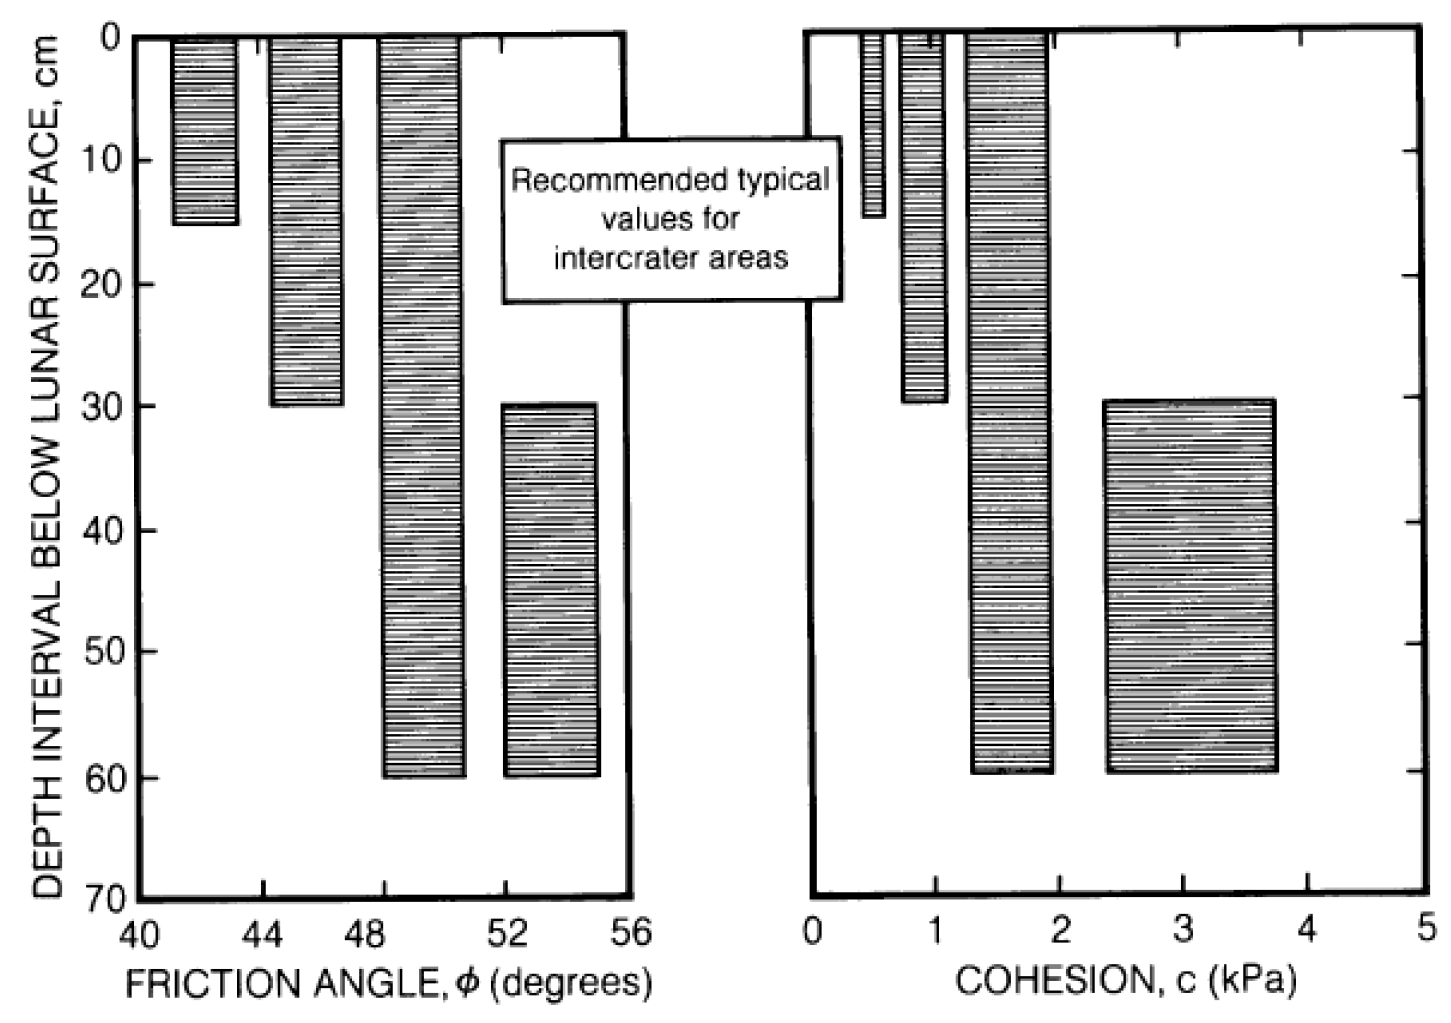
Reversing the equation to find the friction angle and testing three couples of x-y values, i.e., (3, 3), (6, 5.5), and (7, 6.5) kPa to reduce problems associated with the experimental data, the results for the three cases are 38.97°, 39.39°, and 40.26°.
Comparing such friction angles with the expected values in
Figure 10, the angle value is slightly lower. Furthermore, in the previously cited work [
42], this kind of test was performed as well; even if the stresses applied were higher, when computing the friction angle, the value oscillated from 36° to 40.7°, according to the average bulk density (from 1.648 to 1.869 g/cm
3). They confirm that for the simulant, the values are lower than the expected ones.
4.2.5. Dielectric Spectroscopy
This test is performed to evaluate the material response to an applied electric field and thus the capability of the soil to be charged and for how long this charge is maintained; this is helpful in the evaluation of the effects of the dust that may remain on the mechanism and in the definition of the discharge phase, as it may be needed to proceed gently in order not to provoke a dust cloud that is electrically charged.
Before proceeding to the dielectric spectroscopy, the sample was subjected to a drying procedure to make it anhydrous so as to eliminate all the eventual effects due to the humidity present inside. The two samples, already used for the true density evaluation with the pycnometer, were maintained at
for more than one hour in vacuum conditions. In the heater, two Pt100 thermal probes were present, one of which was placed on the sample to control its temperature. Then, the dielectric spectroscopy was performed with an impedance analyser in the range of 20 Hz–1 MHz: two measures were conducted on Sample 1. It used a capacitive cell with parallel planes fully realised in AISI 316 steel. This cell was filled with the treated sample and then subjected to a thermal cycle in the climate chamber (Angelantoni DY340C); the temperature of the sample was monitored with a Pt100 installed on the free surface of the cell, directly on the sample. The thermal cycle consisted of cooling from ambient temperature to 200
with a maximum rate of
K/min followed by maintenance at 200
for two hours, then a free return to ambient temperature with the machine turned off. The plots of the results can be found in the reports included in [
45].
Analysing the conductivity, the reference values of regolith in the total absence of water, at 300 K in darkness, are very low and range from 10
−14 to 10
−9 S/m [
41]. The tested sample had values slightly higher than expected, ranging from 10
−8 to 10
−5 S/m.
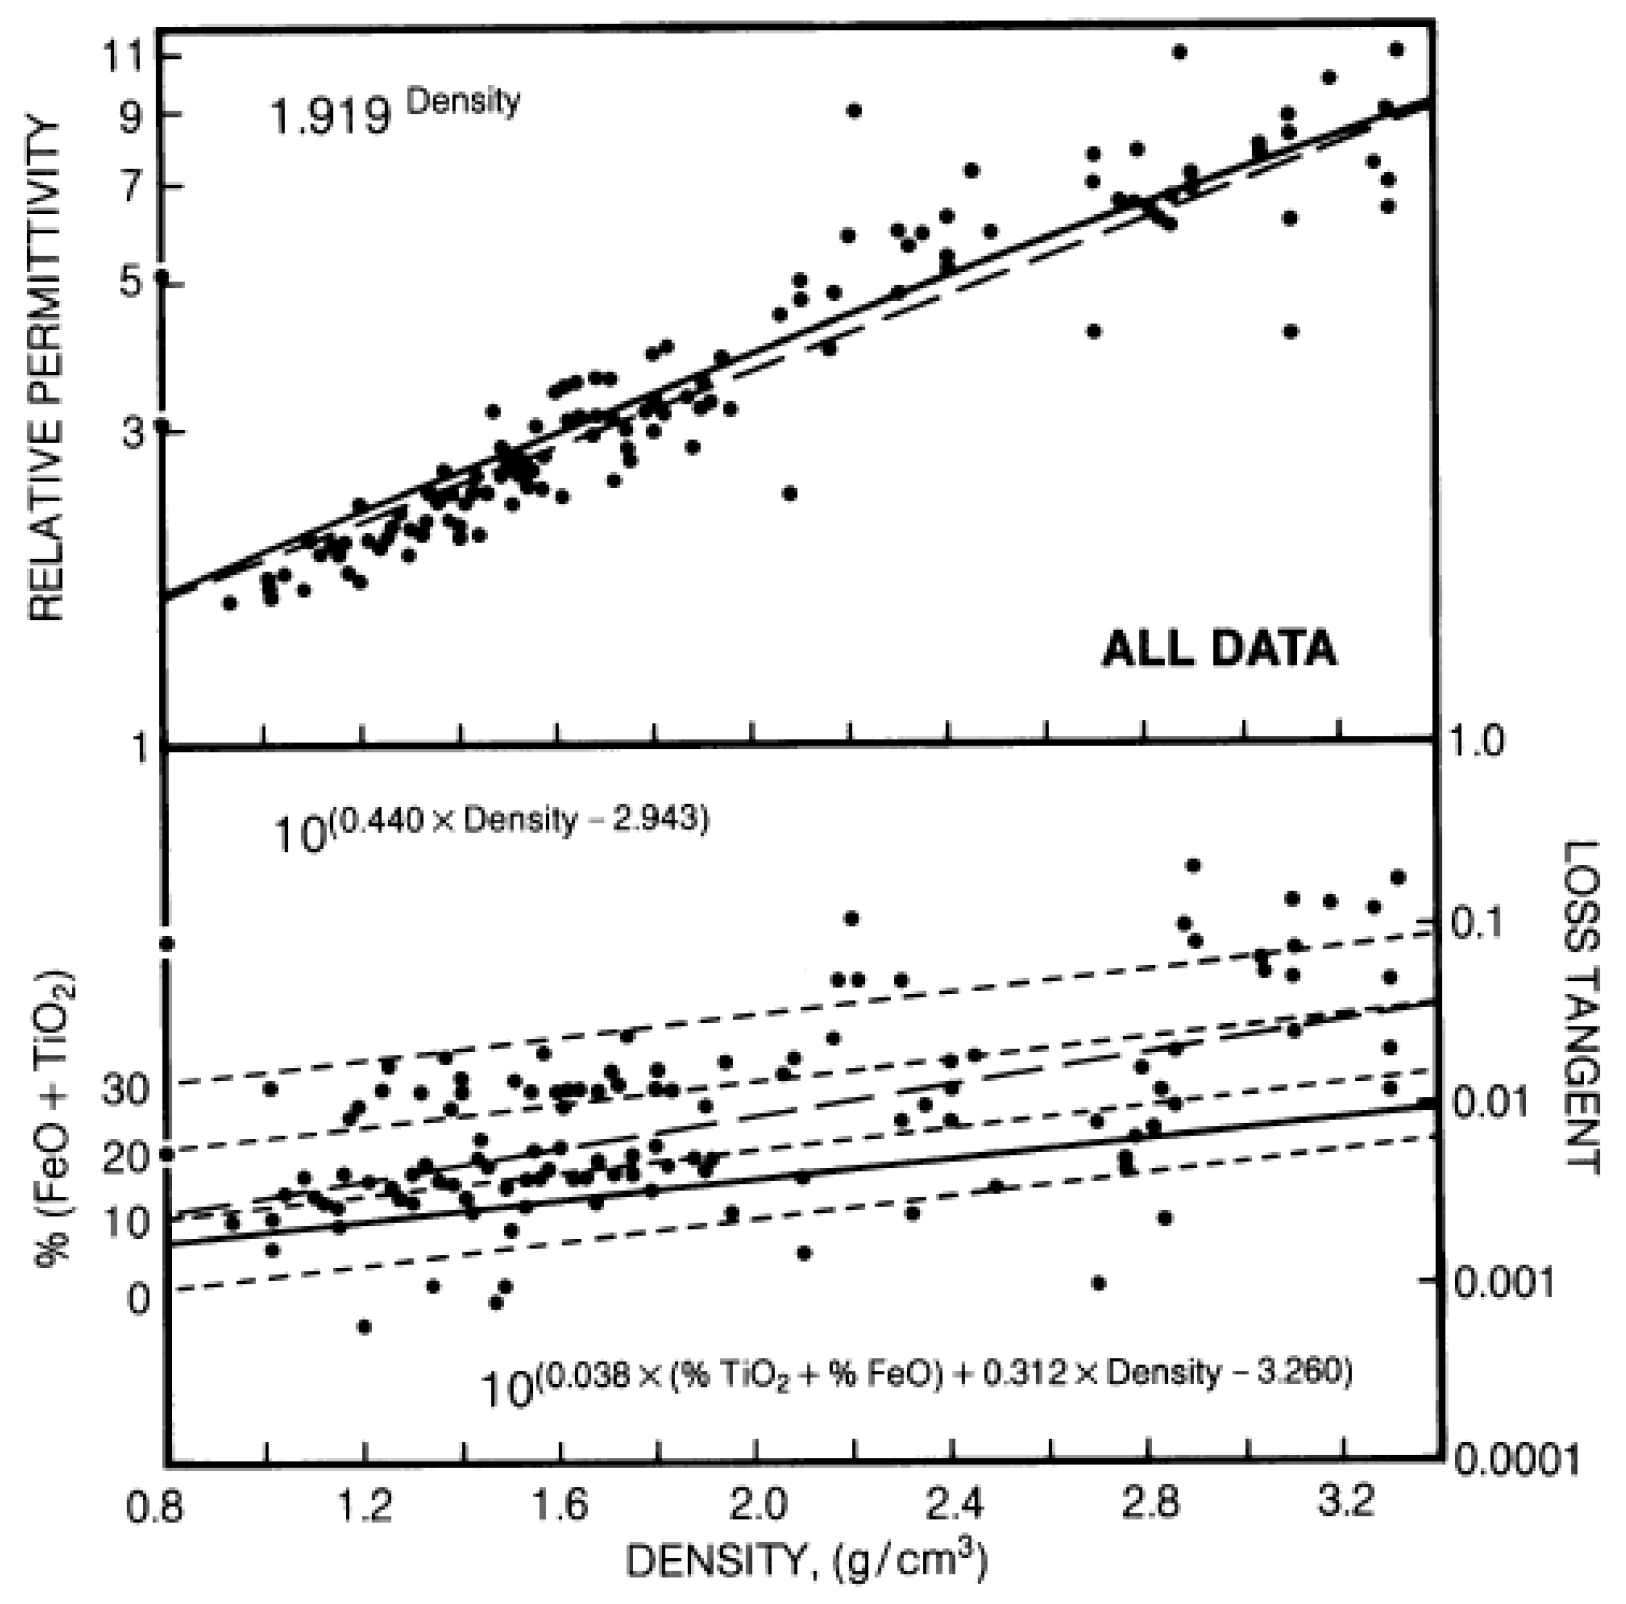
Regarding the dielectric permittivity, which measures the ability of a material to keep electrical charges physically separated by a distance, the test evaluated the relative permittivities (real and imaginary parts).
Because in
Figure 11, which represents the regolith data, the loss tangent is expressed instead of the imaginary part of the permittivity, it is possible to evaluate the parameter as shown in Equation (
3);
is the angular frequency,
and
, respectively, are the real and imaginary parts of the permittivity in
i.e., the available relative ones are multiplied by the vacuum dielectric permittivity), and
is the conductivity.
The used set of data are:
At 253 temperature: frequency = Hz; = 4.6 [-]; = 0.28 [-]; = . The result is a relative permittivity of 4.6 and a loss tangent of 0.099945.
At 253 temperature: frequency = Hz; = 4.1 [-]; = 0.08 [-]; = . The result is a relative permittivity of 4.1 and a loss tangent of 0.032.
At 197 temperature: frequency = Hz; = 4 [-]; = 0.01 [-]; = . The result is a relative permittivity of 4 and a loss tangent of 0.00699.
Compared with the expected results of [
41], in
Figure 11, at a bulk density of
g/cm
3 (see
Section 4.2.2) and around 5% FeO + TiO
2 (see
Section 4.1.1), the values of the simulant were slightly higher than those of the regolith in the first temperature considered, while they were closer at the lowest available temperature; indeed, regolith has a relative permittivity of 3 and a loss tangent of 0.008.
These low-conductivity and low-loss tangent values indicate that the lunar regolith is transparent to electromagnetic energy, so that for example, RF communications can also pass through low hills; the soil is readily chargeable and will remain charged for long periods [
41]. Visible effects of these considerations are also the presence of dust at high altitudes and horizon glows [
46,
47]. This last effect is moreover present at lunar sunrise and sunset areas and causes the levitation and motion of the particles.
Therefore, these results impose different constraints regarding the operations in the lunar environment, as is already known from previous surface missions. The problem of the dust and its capability to remain attached to the exposed surfaces and clog the mechanisms has to be considered when designing the excavation, transport, and discharge mechanisms of the regolith. Indeed, precautions to protect the mechanisms and an adequate redundancy have to be considered in the preliminary design.
4.3. Solid–Fluid Interaction Tests
Gases are the fundamental reactants in the carbothermal process. Their interaction with the regolith needs to be deeply understood and assessed to maximise the effectiveness of the reactions and avoid leaving portions of the regolith unreached by the gases.
4.3.1. Permeability
This test measures the permeability of the sample, that is, how capable it is of making a fluid flow through itself. The capability to permeate the sample is essential, firstly to make the gases get in touch with the particles without following preferential paths and then not to produce a pressure drop that is not sustainable. The data are collected directly on the plant at PoliMi [
18] to assess the values in the tested conditions.
The furnace available was an EVZ 12-600B from Carbolite that could host a 60 mm diameter tube (internal diameter 50 mm) with an available heated length of 600 mm. Two pressure transducers were placed upstream and downstream of the reactor [
18]. The measured pressure drop without the simulant inserted, given mainly by the flashback arrestor inserted in the line, was 25 mbar. A total of 1 kg of dry simulant was poured in the furnace and maintained at the centre thanks to an alumina filter and a thin layer of SuperWool
® paper. The batch, the height of which was
m, was then heated at 1273
, and a 85H
2/15CH
4 mixture was flown at 0.5 L/min.
The result was a measured differential pressure, with respect to the ambient one, of 180 and 110 mbar on the two pressure transducers; subtracting the line losses previously indicated, the pressure drop given by the simulant was 45 mbar.
Darcy’s law in Equation (
4) can be used to evaluate the permeability
k [m
2] of the batch. The higher the value, the easier it is to make the air flow.
Q is the flow rate [m
3/s];
A is the cross-sectional area [m
2], the one correspondent to the reactor diameter;
L is the batch length [m];
is the pressure drop in [Pa]; and
is the dynamic viscosity (
[
). In turn, the
are evaluated through Sutherland’s law
, with
being the Sutherland constant, and the 0 pedex indicating a reference condition for both viscosity and temperature
T.
The permeability value reversing the equation is
×
. Comparing this number with the 1−7 × 10
−12m
2 expected from the regolith at 25 cm depth [
48] or from similar studies on simulants [
49,
50,
51], there is only one order of magnitude difference. This can be mainly explained from a compaction point of view as the bulk density of the poured regolith is pushed to the lower boundary of the intervals indicated in
Section 4.2.2, while in the cited bibliography, the values are higher. However, the value can be considered low and representative of a scarce permeability.
Pressure Drop Preliminary Modelling
To preliminarily evaluate the pressure drop across the simulant batch in different operative conditions, a model based on the available furnace was implemented. The pressure drop Equation (
5)
is suited for one-dimensional models, while Equation (
6)
represents the expression for the friction factor
f elaborated by Ergun; there are other expressions in the literature dependent on the application, but this one can be considered to be representative of the system for preliminary evaluations, as reported in [
52].
is the mixture density evaluated as
, with
P being the pressure [
,
being the molar fraction,
being the molar mass of the
ith species, and
R being the universal gas constant.
G is instead the mass flux, calculated as
, with
v being the velocity [
obtained from the total molar flux.
is the characteristic length of the sphere, i.e., the diameter [m], while
is the void factor [-]. Finally, the Reynolds number
is evaluated as
[-].
As this is only a preliminary evaluation, it is assumed that all quantities are constant along the reactor and are equal to the initial ones.
Table 9 reports the useful parameters to use in the equations.
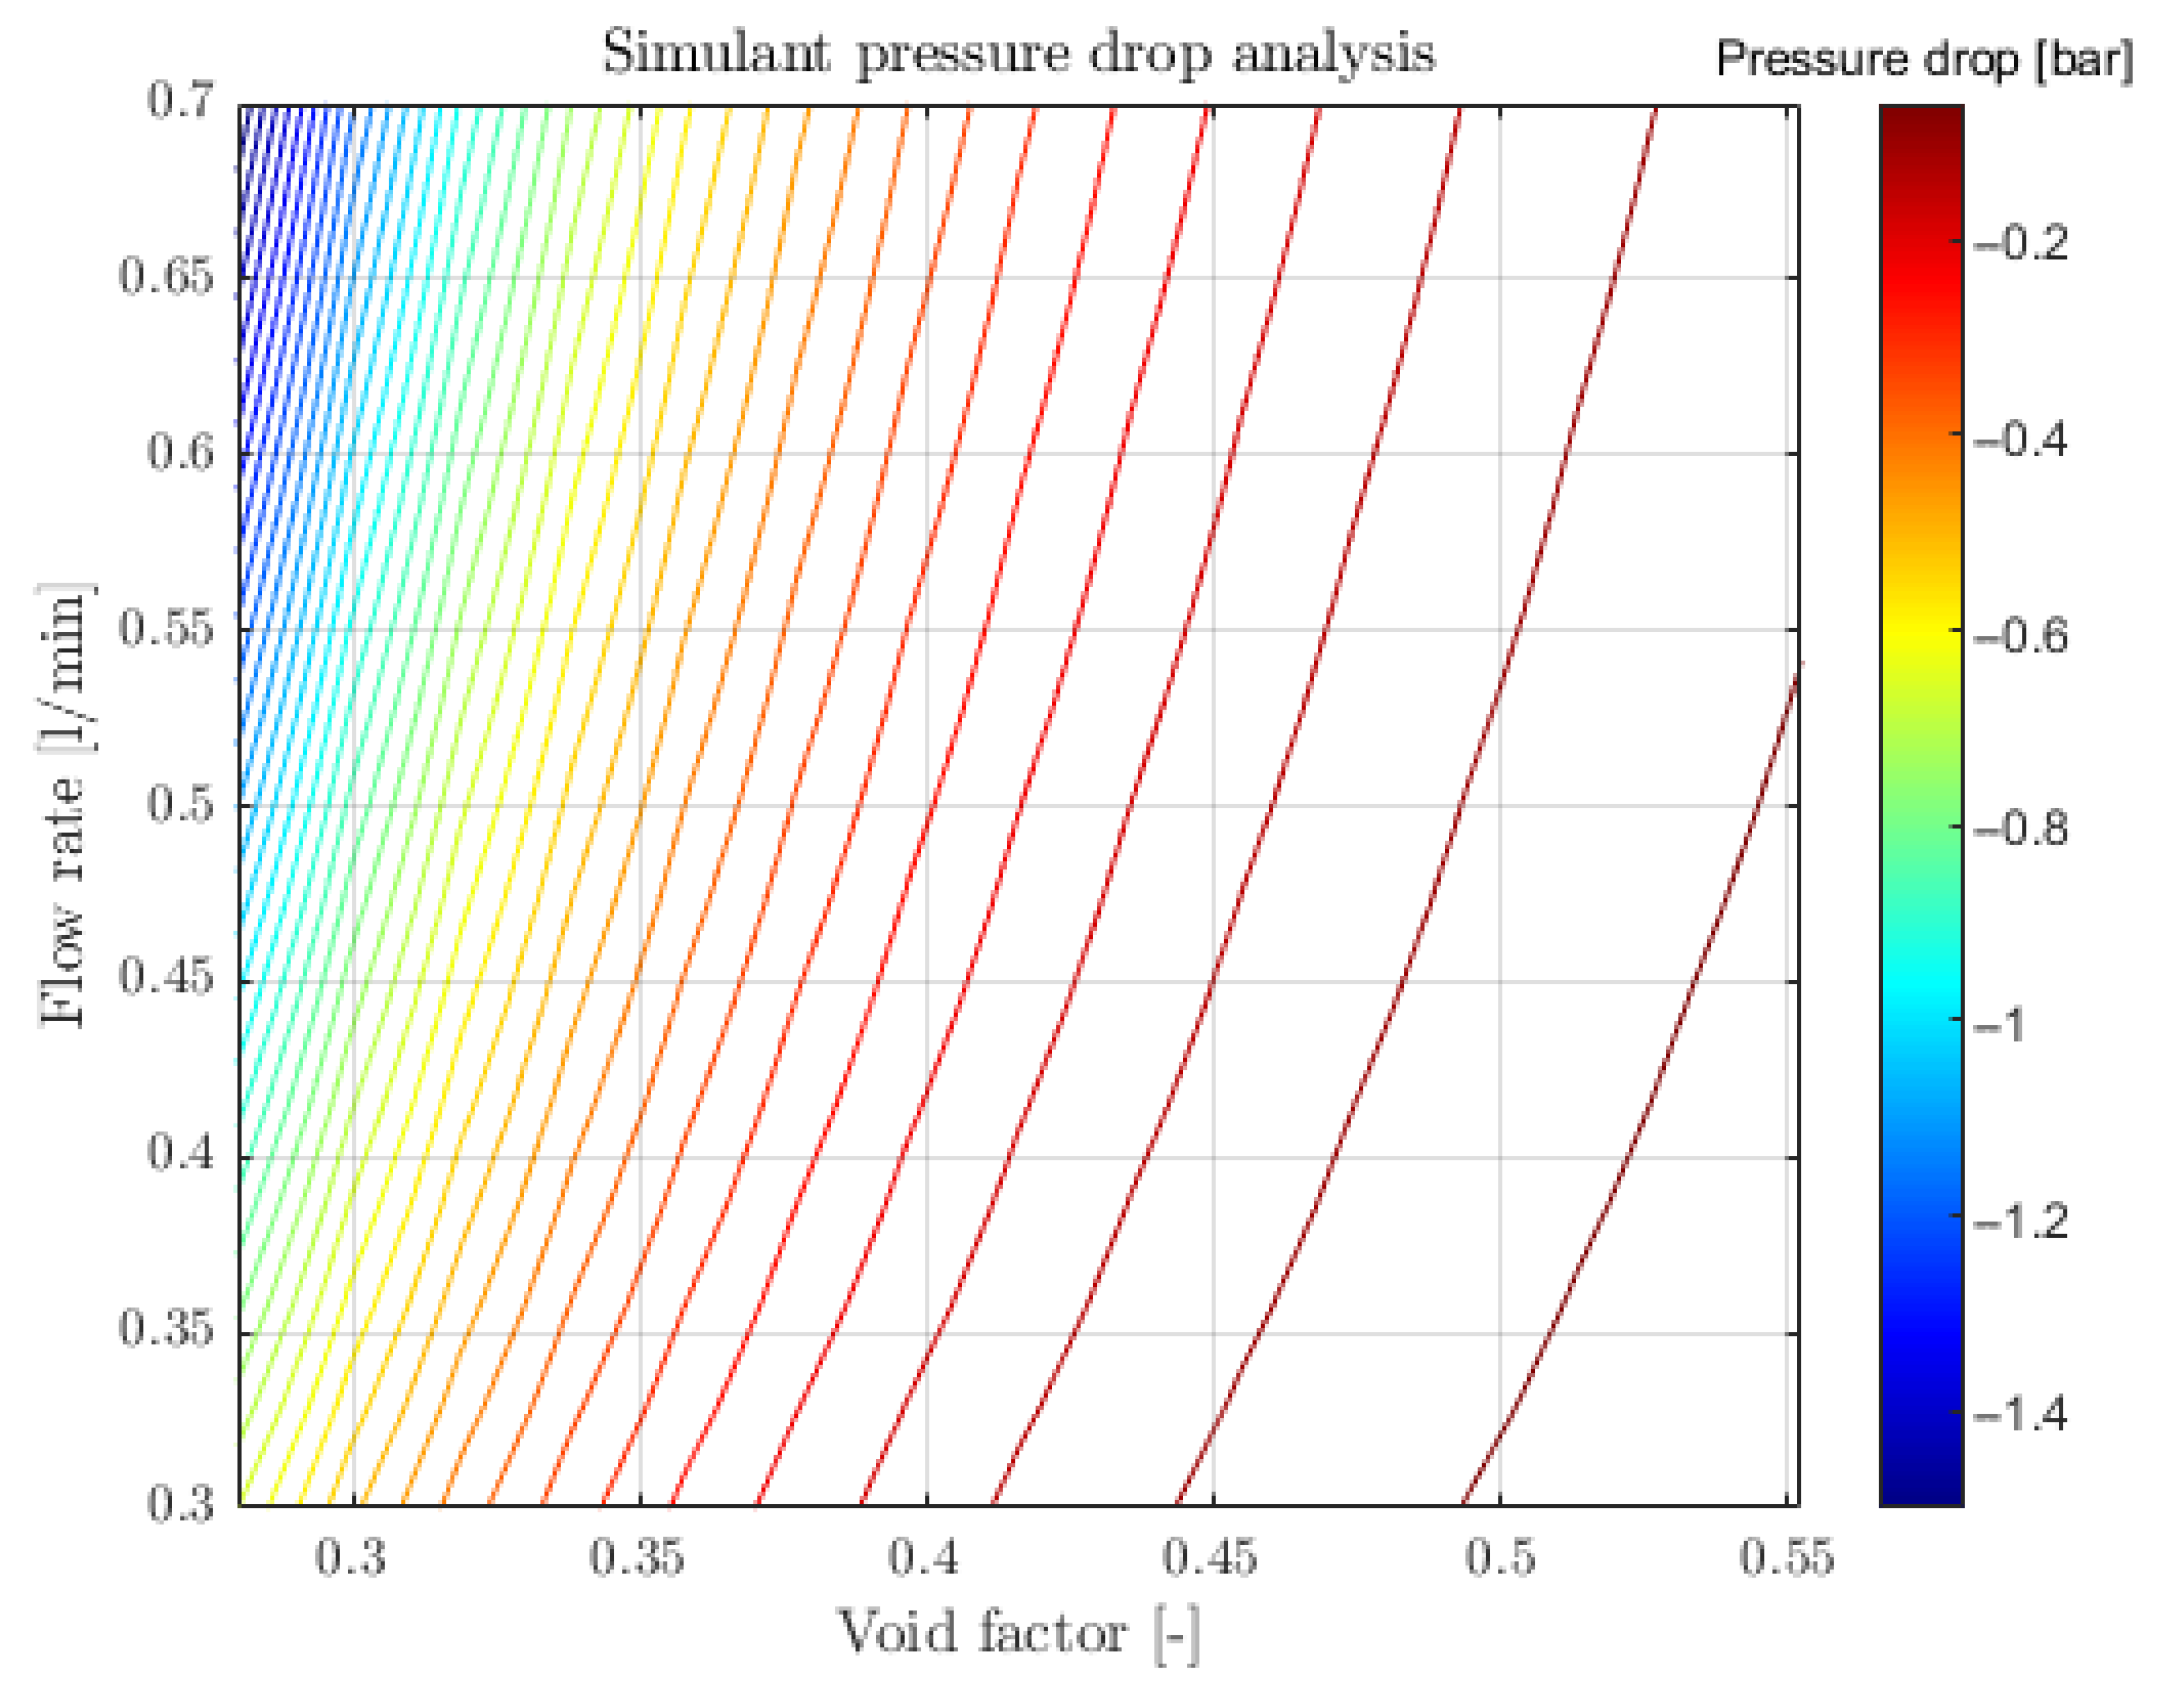
The study was parametric, making the flow rate vary from 0.3 and 0.7 slm and the void factor vary from 0.28 (compressed) to 0.5524 (laboratory), as evaluated in
Section 4.2.2. The resulting contour is displayed in
Figure 12. The point used to compute the permeability is at a void factor of 0.5524 and flow rate of 0.5 L/min, which produces a pressure drop of 49
. Considering the approximations on the granulometry, the viscosities, and 1-D equations, the computed value is comparable with the measured one. The conditions at a high flow rate and low void factor are those producing higher pressure drops. An acceptable region remains on the yellow right side of the plot. The permeability is evaluated with Equation (
4), producing values in the range of
×
–
×
in line with the expected ones.
4.3.2. Aeration
The rheological properties of a powder are highly influenced by the presence of air in the powder bed. The quantity of air trapped in the bulk influences the interaction among the particles and, as a consequence, how they move one with respect to the other. For the carbothermal plant, the results obtained are useful for understanding the capability of the bed to reach a fluidisation condition, as well as the possible outflow of the particles. The results then have to be manipulated to also include the effects of the reduced gravity, and this is an ongoing activity at PoliMi. The same results can also be used in the previously mentioned systems (e.g., pressure-aided collection systems) and processes (e.g., high-temperature carbothermal reduction).
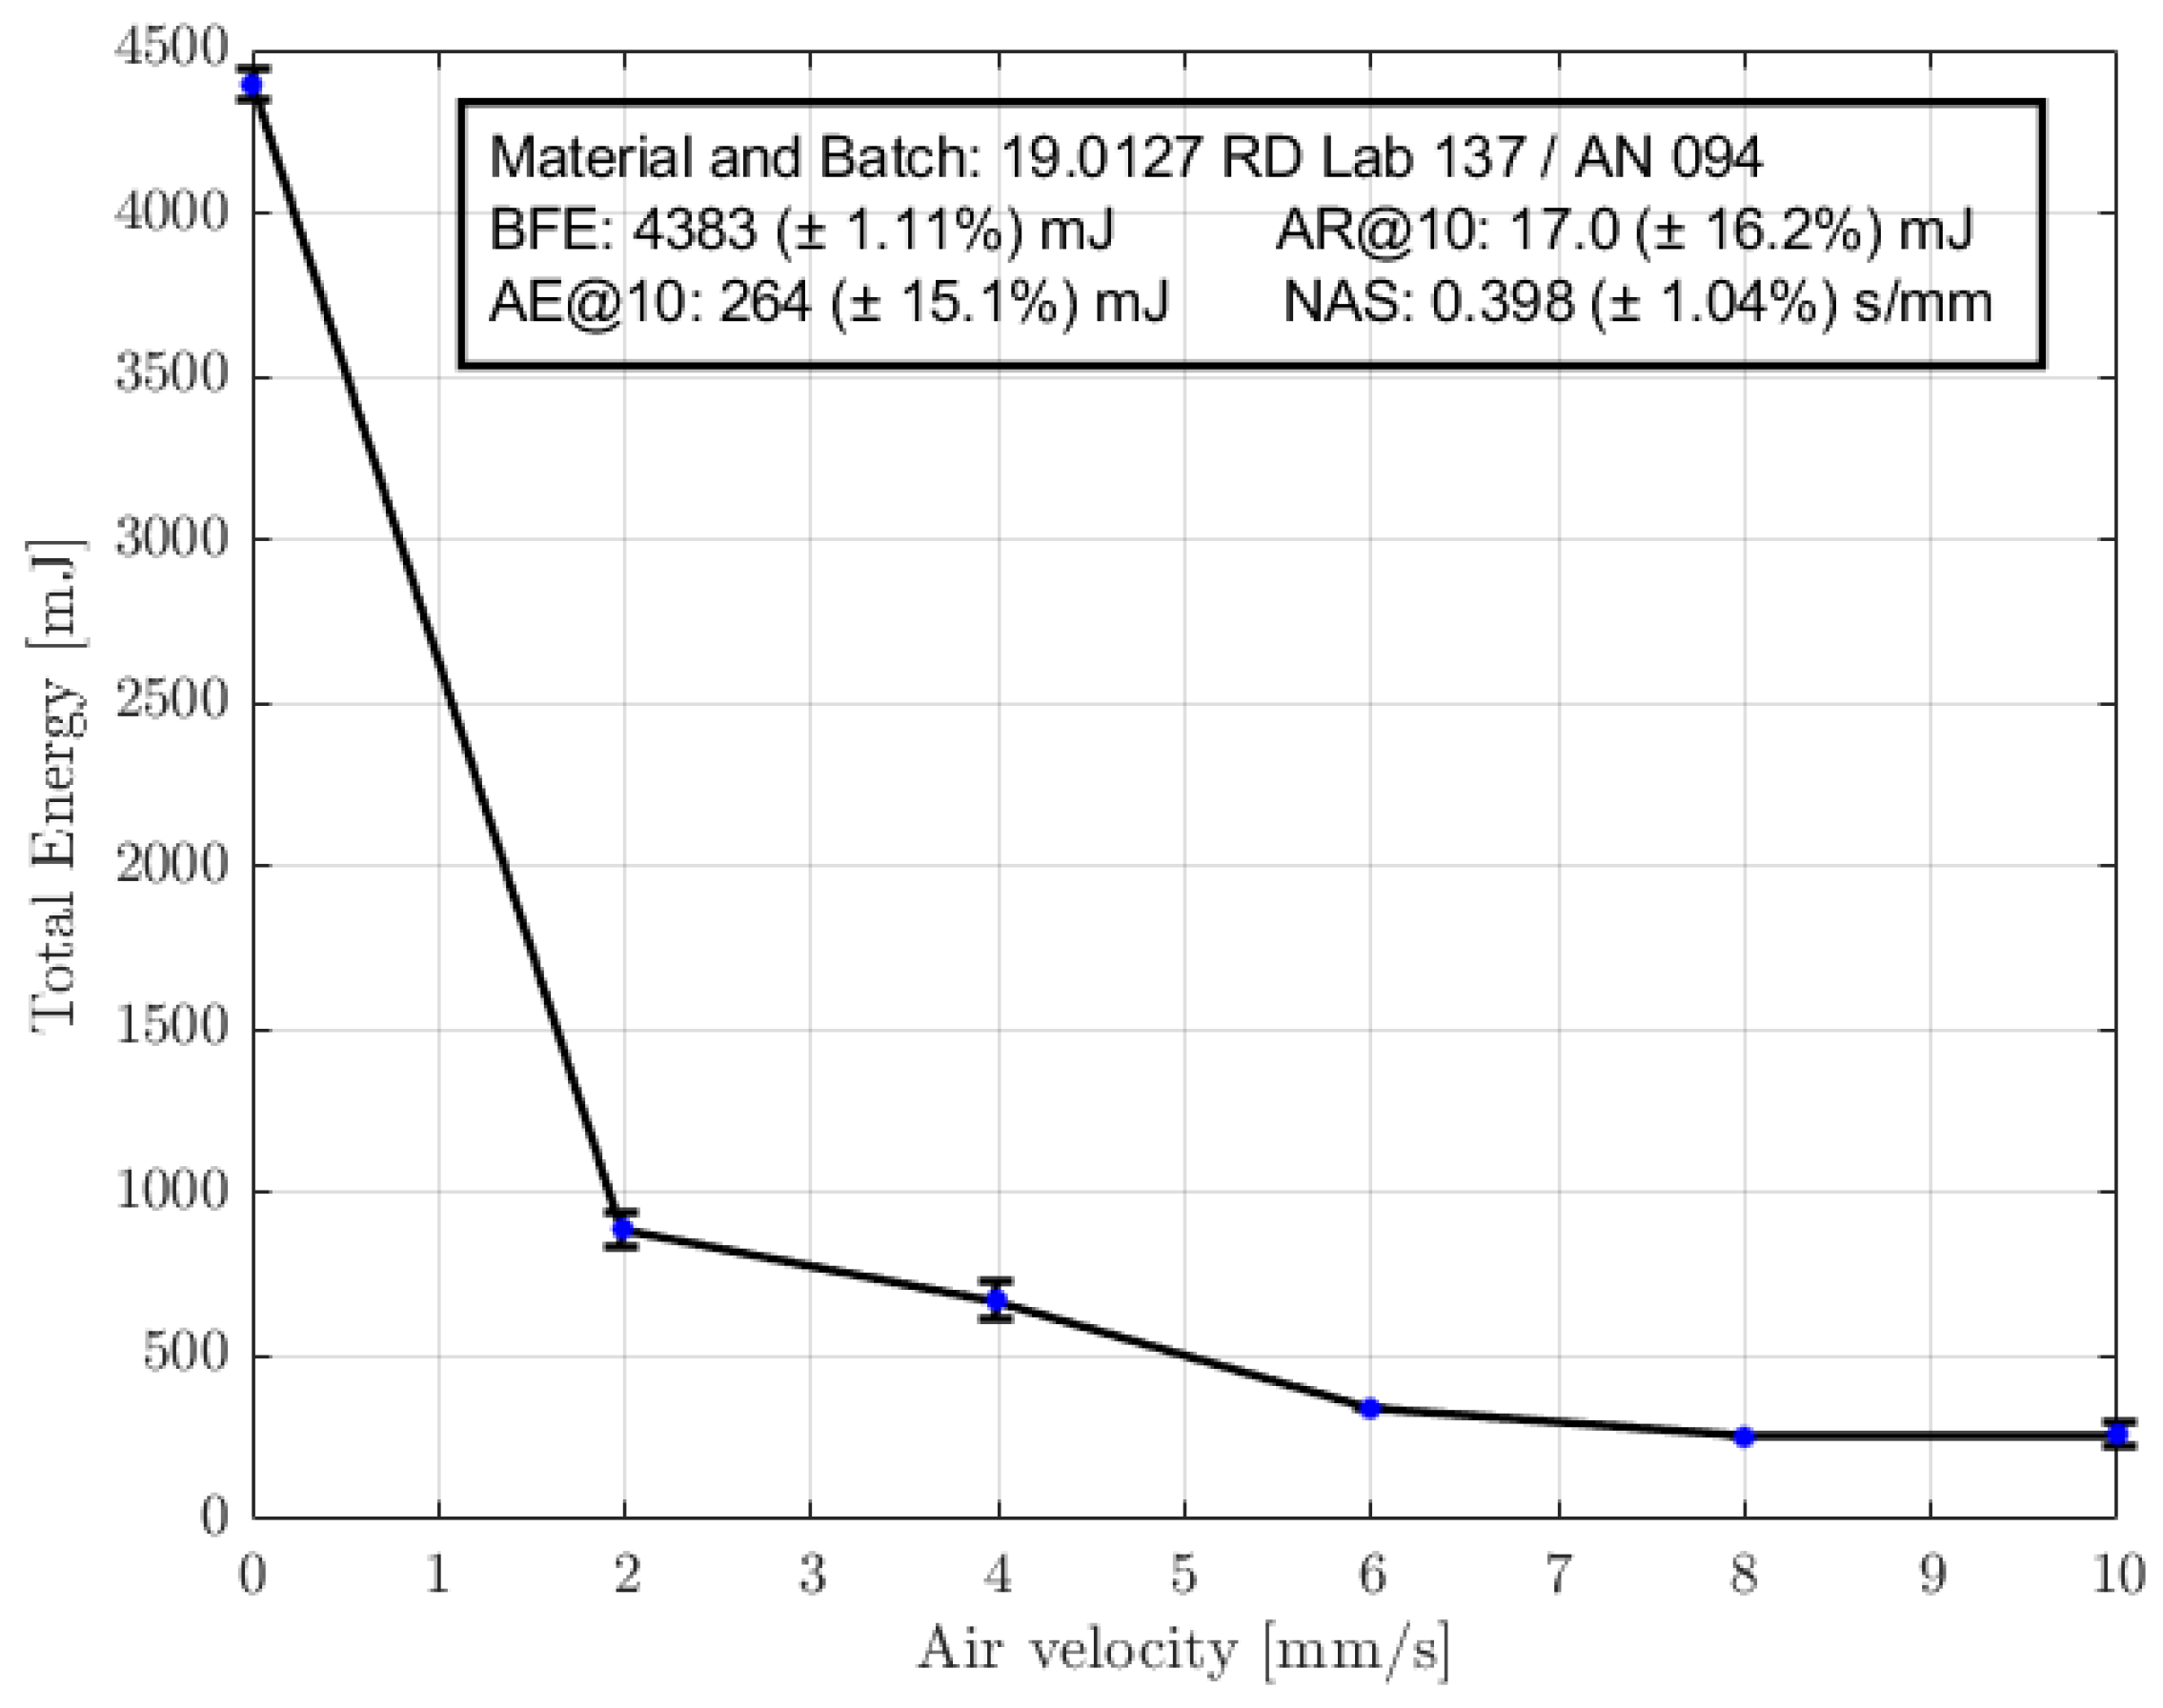
The aeration test introduces air on the basis of the powder bed and evaluates how the flowability properties behave, measuring the change in terms of energy at increasing air velocity. The effects are dependent on different factors, such as the cohesive nature of the powder, particle shape, superficial texture, and density. The test generates different parameters. BFE (Basic flowability energy): The energy necessary to induce powder motion without air introduction. AEx (Aerated energy): The energy necessary to induce powder motion with a constant air velocity; AEx < 10–20 mJ indicates that the powder fluidises completely at the applied air velocity, while a high value is the index of a cohesive powder. ARx (Aeration ratio): evaluated as the ratio between the flowability energy at a certain air velocity and the energy without air flow. NAS (Normalised aeration sensitivity): it represents the sensitivity of the powder to air velocity changes; the variation of the flowability energy is normalised over the variation of the applied air.
The test results in
Figure 13 highlight that the energy necessary to move the powder drastically decreases with the air intake. Even if it is not possible to talk of fluidised powder, the fact that the total energy is 90% lower in correspondence of a 10 mm/s air flux means that in non-static conditions, the powder is not cohesive and particles interact mainly with friction and mechanical phenomena and less with electrostatic charging or Van der Waals forces.
In the demonstration plant at PoliMi with an inlet flow rate between 0.3 and 1 slm, in the region heated at 1373
, a velocity of 12 and 41 mm/s, respectively, was produced. Some precautions like filters shall be adopted to stop the particle flow; thus, the low energy required to transport the particles can make the superficial particles detach from the reactive batch. This aspect has also been verified experimentally, as without any filtering pipe, clogging occurs. In the case of reduced masses, like those involved in the in situ demonstration (30–90 g), the reduced lunar gravity will increase the bed fluidisation effects, which might impact the batch deposition in case of multiple reactions. Indeed, the two main strategies for the demonstration are the following ones: discharging the reactor after each test; and loading the new batch on top of the reacted ones. An experimental campaign is taking place to test the effects of this second strategy on the process [
21], however, if no fluidisation effects are observed on Earth, this possibility is not excluded on the Moon. As a consequence, a trade-off between the increase in mass given by a discharging mechanism (difficult due to a limited mass budget of 15 kg) and the effects on the process given by the stacking strategy has to be performed.
4.3.3. Stability and Variable Flow Rate
This test is a combination of two different tests conducted in sequence: The stability and the variable flow rate (VFR), continuing the investigations started with the aeration test with the same aim.
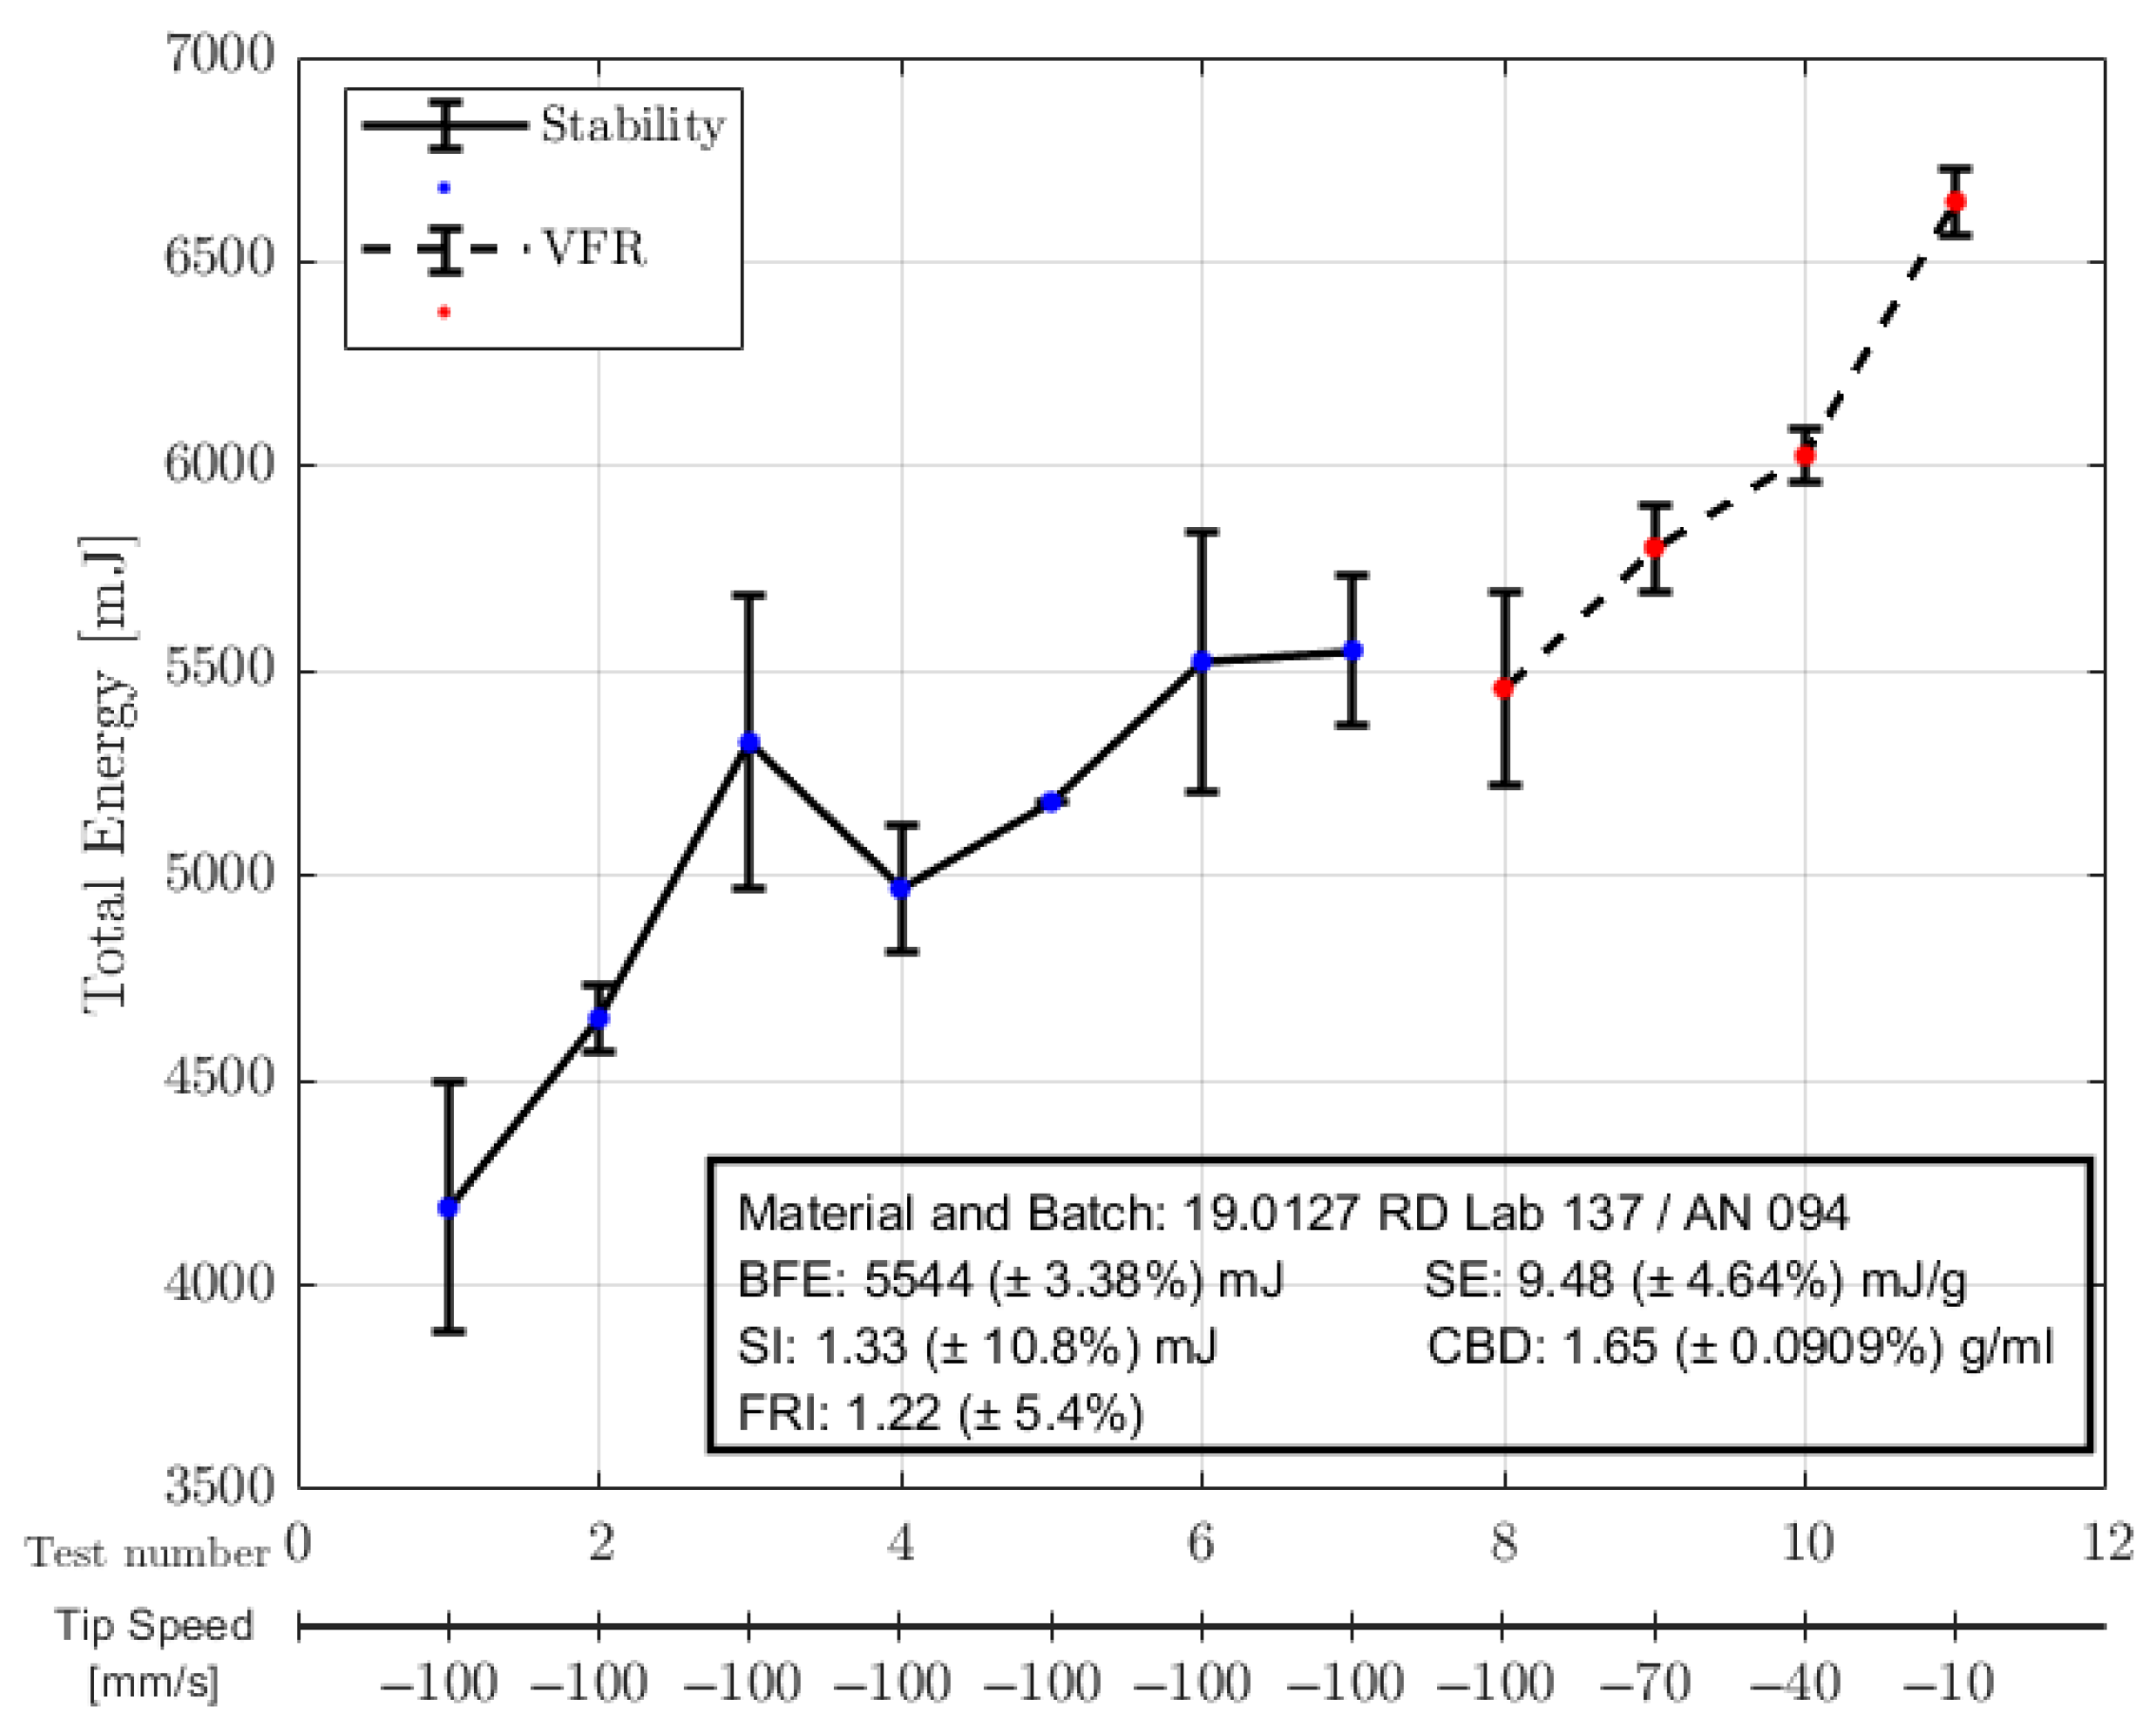
The stability test consists of the alternation of seven conditioning and seven analysis cycles, and it is used to evaluate the scale and nature of how the powder modifies after a forced motion. During the test, the velocity of the flux is maintained to be constant; every change in the energy needed for the motion is only due to a variation in the flowability properties of the sample during the test. The entity of this variation provides an estimate of the powder stability. The test generates the following parameters. BFE: The energy required to move the powder under flux conditions, not for gravity, in a confined environment. For a stable sample, the value is registered in the last cycle (number 7). SI (Stability index): The measure of the stability of the powder during the test, evaluated as the ratio between the energy of the last cycle and the first one. SE (Specific energy): The energy necessary to induce a flux for gravity fall, i.e., the resistance of the powder to flow in non-confined situations, for example, when it falls to fill a cavity. This flowability property is obtained by making the blade rotate during the ascension, which is capable of gently lifting the powder that suddenly falls for gravity without other constraints. CBD: Conditioned bulk density of the sample, evaluated as mass over volume.
In the VFR test, the powder is instead initially moved at the standard velocity of 100 mm/s, the same velocity as the stability test one, while the needed energy is registered. For the following cycles (points 9–11 in the resulting plot in
Figure 14), the flux velocity is reduced to see its influence on the rheology of the powder. The generated parameter is the FRI (flow rate index), which measures the sensitivity of the powder as a function of the movement velocity; it is evaluated as the ratio between the energy of the test executed at the highest velocity and the one at the lowest velocity.
In the graph in
Figure 14 the points 1–7 refer to the stability and points 8–11 refer to the VFR.
The sample shows high BFE values, so the powder requires a lot of energy to be forcibly moved into a confined environment. This confirms the fact that the simulant has heterogeneous dimensions and important friction and blockage phenomena. The fact that the energy increases in the stability plot may be correlated to sedimentation and segregation phenomena. The SI value of higher than 1.1 is characteristic of powders with low stability when in motion. The SE is high because of the friction phenomena among particles and the mechanical blockage.
4.4. Thermal Properties Tests
This last block of tests presents the fundamental characterisation of the phase changes through a DSC analyiss. For completeness, only a brief overview of the other thermal properties is reported as explained in
Section 3.1.
4.4.1. Differential Scanning Calorimetry (DSC)
The DSC analysis is important for evaluating the species that in some way undergo a variation due to the temperature increase, which are to be filtered out with respect to the species that reacted. It can also help in the evaluation of the expected agglomerates.
This is a technique that measures the heat flux, i.e., the power, to provide a sample subjected to a programmed temperature cycle in a specific atmosphere. Then, the difference between this value and the value of heat flux without the powder is evaluated. The heating and then cooling allows for the detection of transitions such as melts, glass transitions, phase changes, and curing.
In
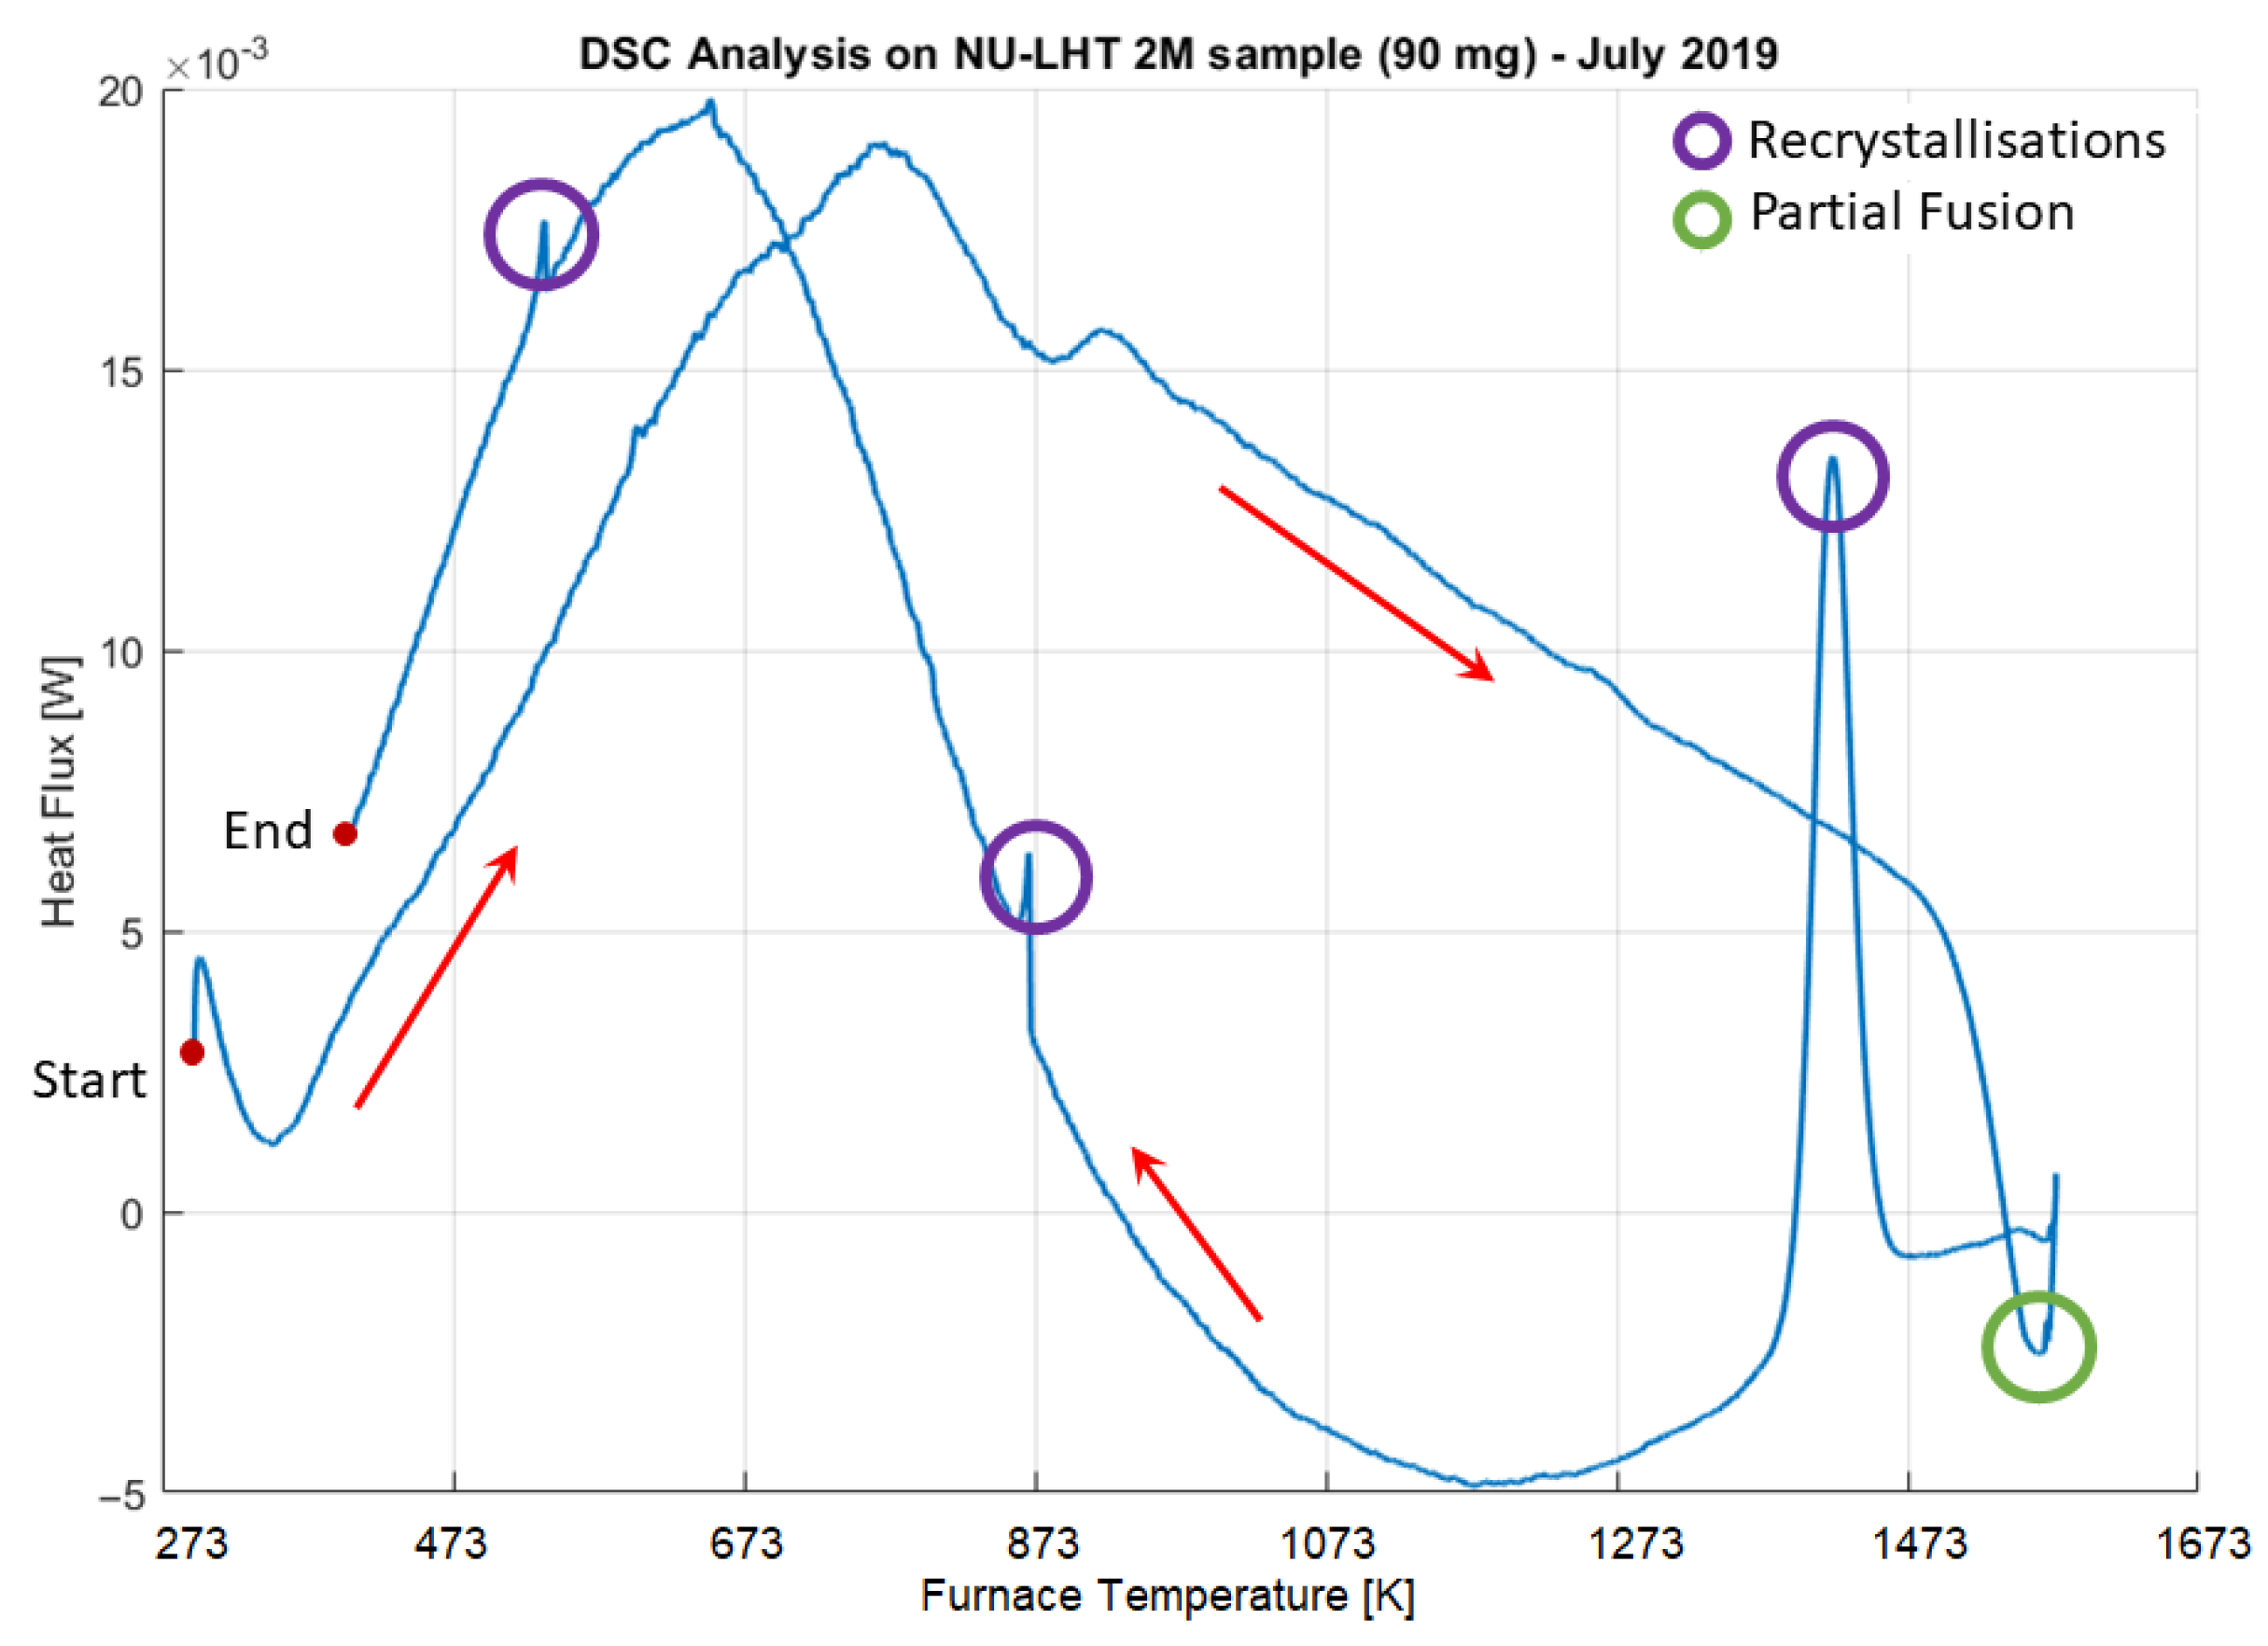
Figure 15, the results of the test performed on a 90 mg sample in a temperature interval of 273–1573 K are reported, with a first heating phase followed by a controlled cooling one. There are a few interesting points: The first is around 923
, which can be the melting of a metastable species followed by crystallisation of the stable one; the second is around 1573
, in which there is a partial fusion; then, three shows recrystallisation at 1423, 873, and 548
. It is interesting to analyse among the different species present in the simulant which ones can correspond to the observed behaviours, as suggested in [
56].
SiO2: -quartz/-quartz transition at 848 ; after 1140 , the crystal becomes metastable.
Fe2O3: -crystal/-crystal transition at 980 .
Melting points: TiO2 in Anatase forms at 1299 . P4O10 at 842 . FeO at 1650 . Na2O at 1400 .
K2O decomposes at 1154 , becoming metastable.
Some minerals start to decompose in this range: Fe2SiO4 at 1500 ; NaAlSi3O6 at 1400 ; CaMgSi2O6 at 1650 .
Certainly, the entity of the transitions reflects the amount of species present in the sample; the main peaks and valleys seem to correspond to the silica crystal transition. The other partial fusion and following recrystallisation are probably due to the compounds containing iron. No correspondence is found in the literature data for the recrystallisation close to the ambient temperature conditions.
4.4.2. Expected Agglomerates
The values found can also provide a hint about the agglomerates that are expected after exposure to high temperature. The interesting crystal transitions are reported in order to compare the data that will be provided in future analyses for the reacted simulant. The involved species are [
56]:
Melting and fictive boiling point. Al: 933 -. K: 338/1043 K. Mg: 922/1378 K. Na: 370/1177 K.
Ca: -crystal/-crystal transition 737 , melting at 1123 .
P sublimates at 707 .
Mn: -crystal/-crystal transition 990 ; -crystal/-crystal transition 1360 ; -crystal/-crystal transition 1410 .
Fe: -crystal/-crystal transition 1184 .
4.4.3. Bibliographic Thermal Properties of the Regolith
To complete the overview of the regolith properties, in this paragraph, the expressions retrieved from the literature are reported. A dedicated experimental campaign on the simulant is needed to assess if there are noticeable differences or not. A mixed approach that uses both DSC and PPMS analyses can be considered [
57].
Regarding the heat capacity, according to the NASA study regarding the thermal properties of lunar regolith [
58], the heat capacity can be expressed as
.
The thermal conductivity, is instead dependent on different factors, such as the composition, temperature, and compactness of the mixture, so it is quite difficult to evaluate. In the study previously cited [
58], the thermal conductivity of the lunar regolith can be expressed as
×
×
.
5. Conclusions
This article presented the guidelines for performing the characterisation of a generic simulant or planetary soil, indicating an extended set of tests that include the definition of the compositional, physical, mechanical, and thermal properties and the solid–fluid interaction. These guidelines were applied to a particular case study, the NU-LHT-2M lunar simulant used in the context of a low-temperature carbothermal reduction for oxygen production, under study at Politecnico di Milano. The results of the tests were analysed, and different considerations on the process, using the demonstrator plant, and on the technology, considering a lunar demonstrator payload, are pointed out. A brief overview of the results is reported here.
The suitability of the simulant in terms of composition and granulometry was confirmed, with a slight difference in the average particle size. Using the density measurements, both the true and the bulk ones, the void factors in different configurations (coarse, shaking compaction, axial compaction) were evaluated, ranging from 0.55 to 0.28 in the most compact configuration. This value had consequences on both the process and regolith management (e.g., mass/volume measurement, reactor volume). The particle interaction can be better understood by looking at the high-magnification images; indeed, the complex fragmented nature of the simulant plus the variety of grain sizes present prevents them from settling in a more organised way. However, this is a feature that helps in the solid–fluid interaction; the pressure drop was studied to find the limiting values. The aeration test instead provided a requirement on the protection of the fluidic properties of the plant and imposed the start of an investigation on the bed fluidisation effects in the case of low masses, like those involved in the in situ demonstration (30–90 g). The tests on the mechanical and electromagnetic properties of the simulant provided results that were generally similar to the regolith ones. The regolith–materials interaction must be faced during material handling on the Moon to prevent clogging or obstructions. Finally, the DSC test offered an important point of view regarding the expected agglomerates after the reaction to better read the processed batch test results.


