1. Introduction and Literature Review
Extendible tape-spring booms are a kind of new deployable mechanism which are usually used on astrovehicles, especially for large-scale or/and high-power spacecrafts, for instance, solar panels for space stations, high-precision antennas for observing satellites, large-area solar sails for interstellar traveling vehicles, large-scale star shaders for heavy-caliber space telescopes, etc. This is thanks to their incomparable advantages such as their light weight, large deployment scales and high fold rates. In view of these application scenarios, tape-spring booms are commonly used in conjunction with flexible membranes for forming planer space structures, and combining them with membrane structures could fully utilize the advantages of tape-spring booms [
1,
2,
3,
4].
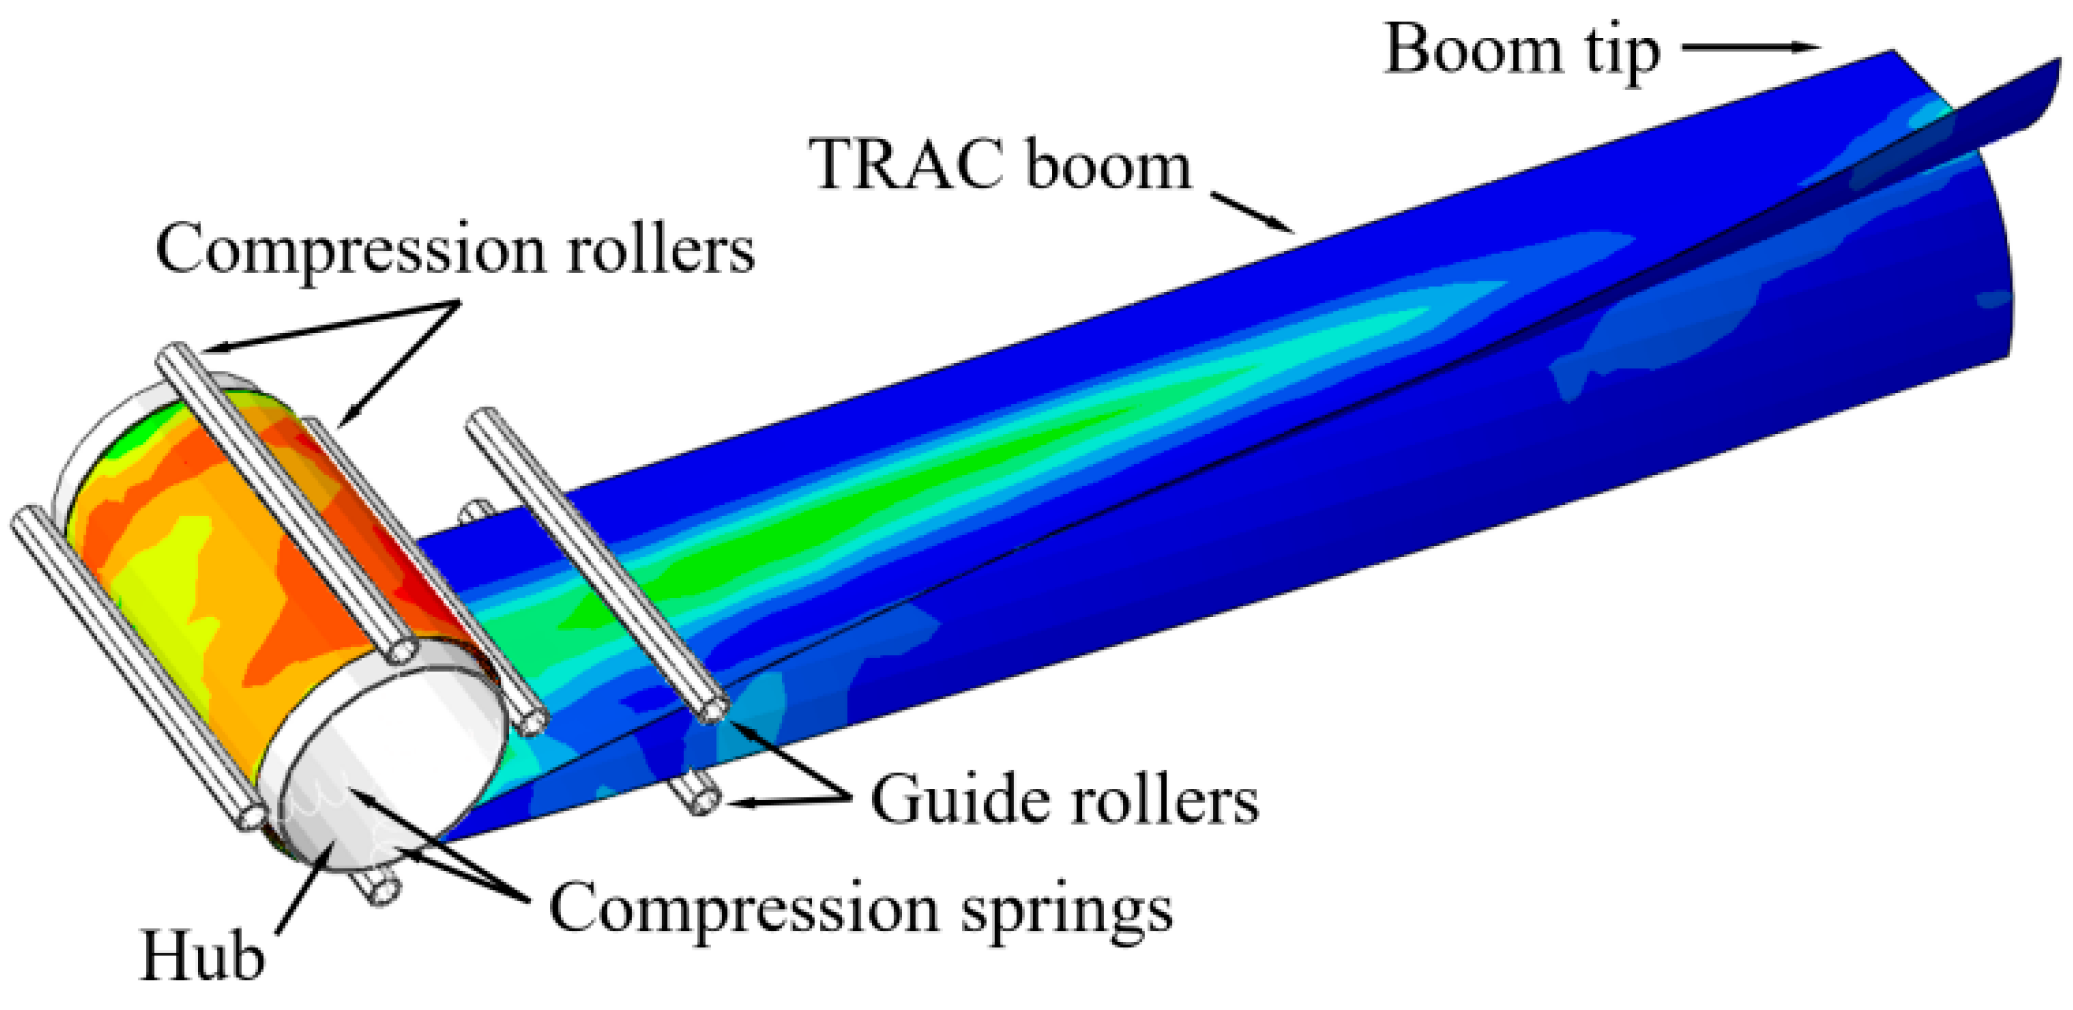
To better illustrate the deployment and deformation of a tape-spring boom, a diagram of a STEM (storable tubular extendible member) tape-spring boom with a circular cross-section (which was the boom’s initial configuration when invented, see refs. [
5,
6]) is shown in
Figure 1. From the figure, it can be observed that the boom is stowed and deployed like a carpenter’s steel measuring tape, and the curvature directions of the boom’s stowed and deployed state are orthogonal. Usually, some restraint mechanisms are introduced into a boom’s deployer to help it unwind and extend stably and robustly (see the booms with common restraint mechanisms in
Figure 2 for more details).
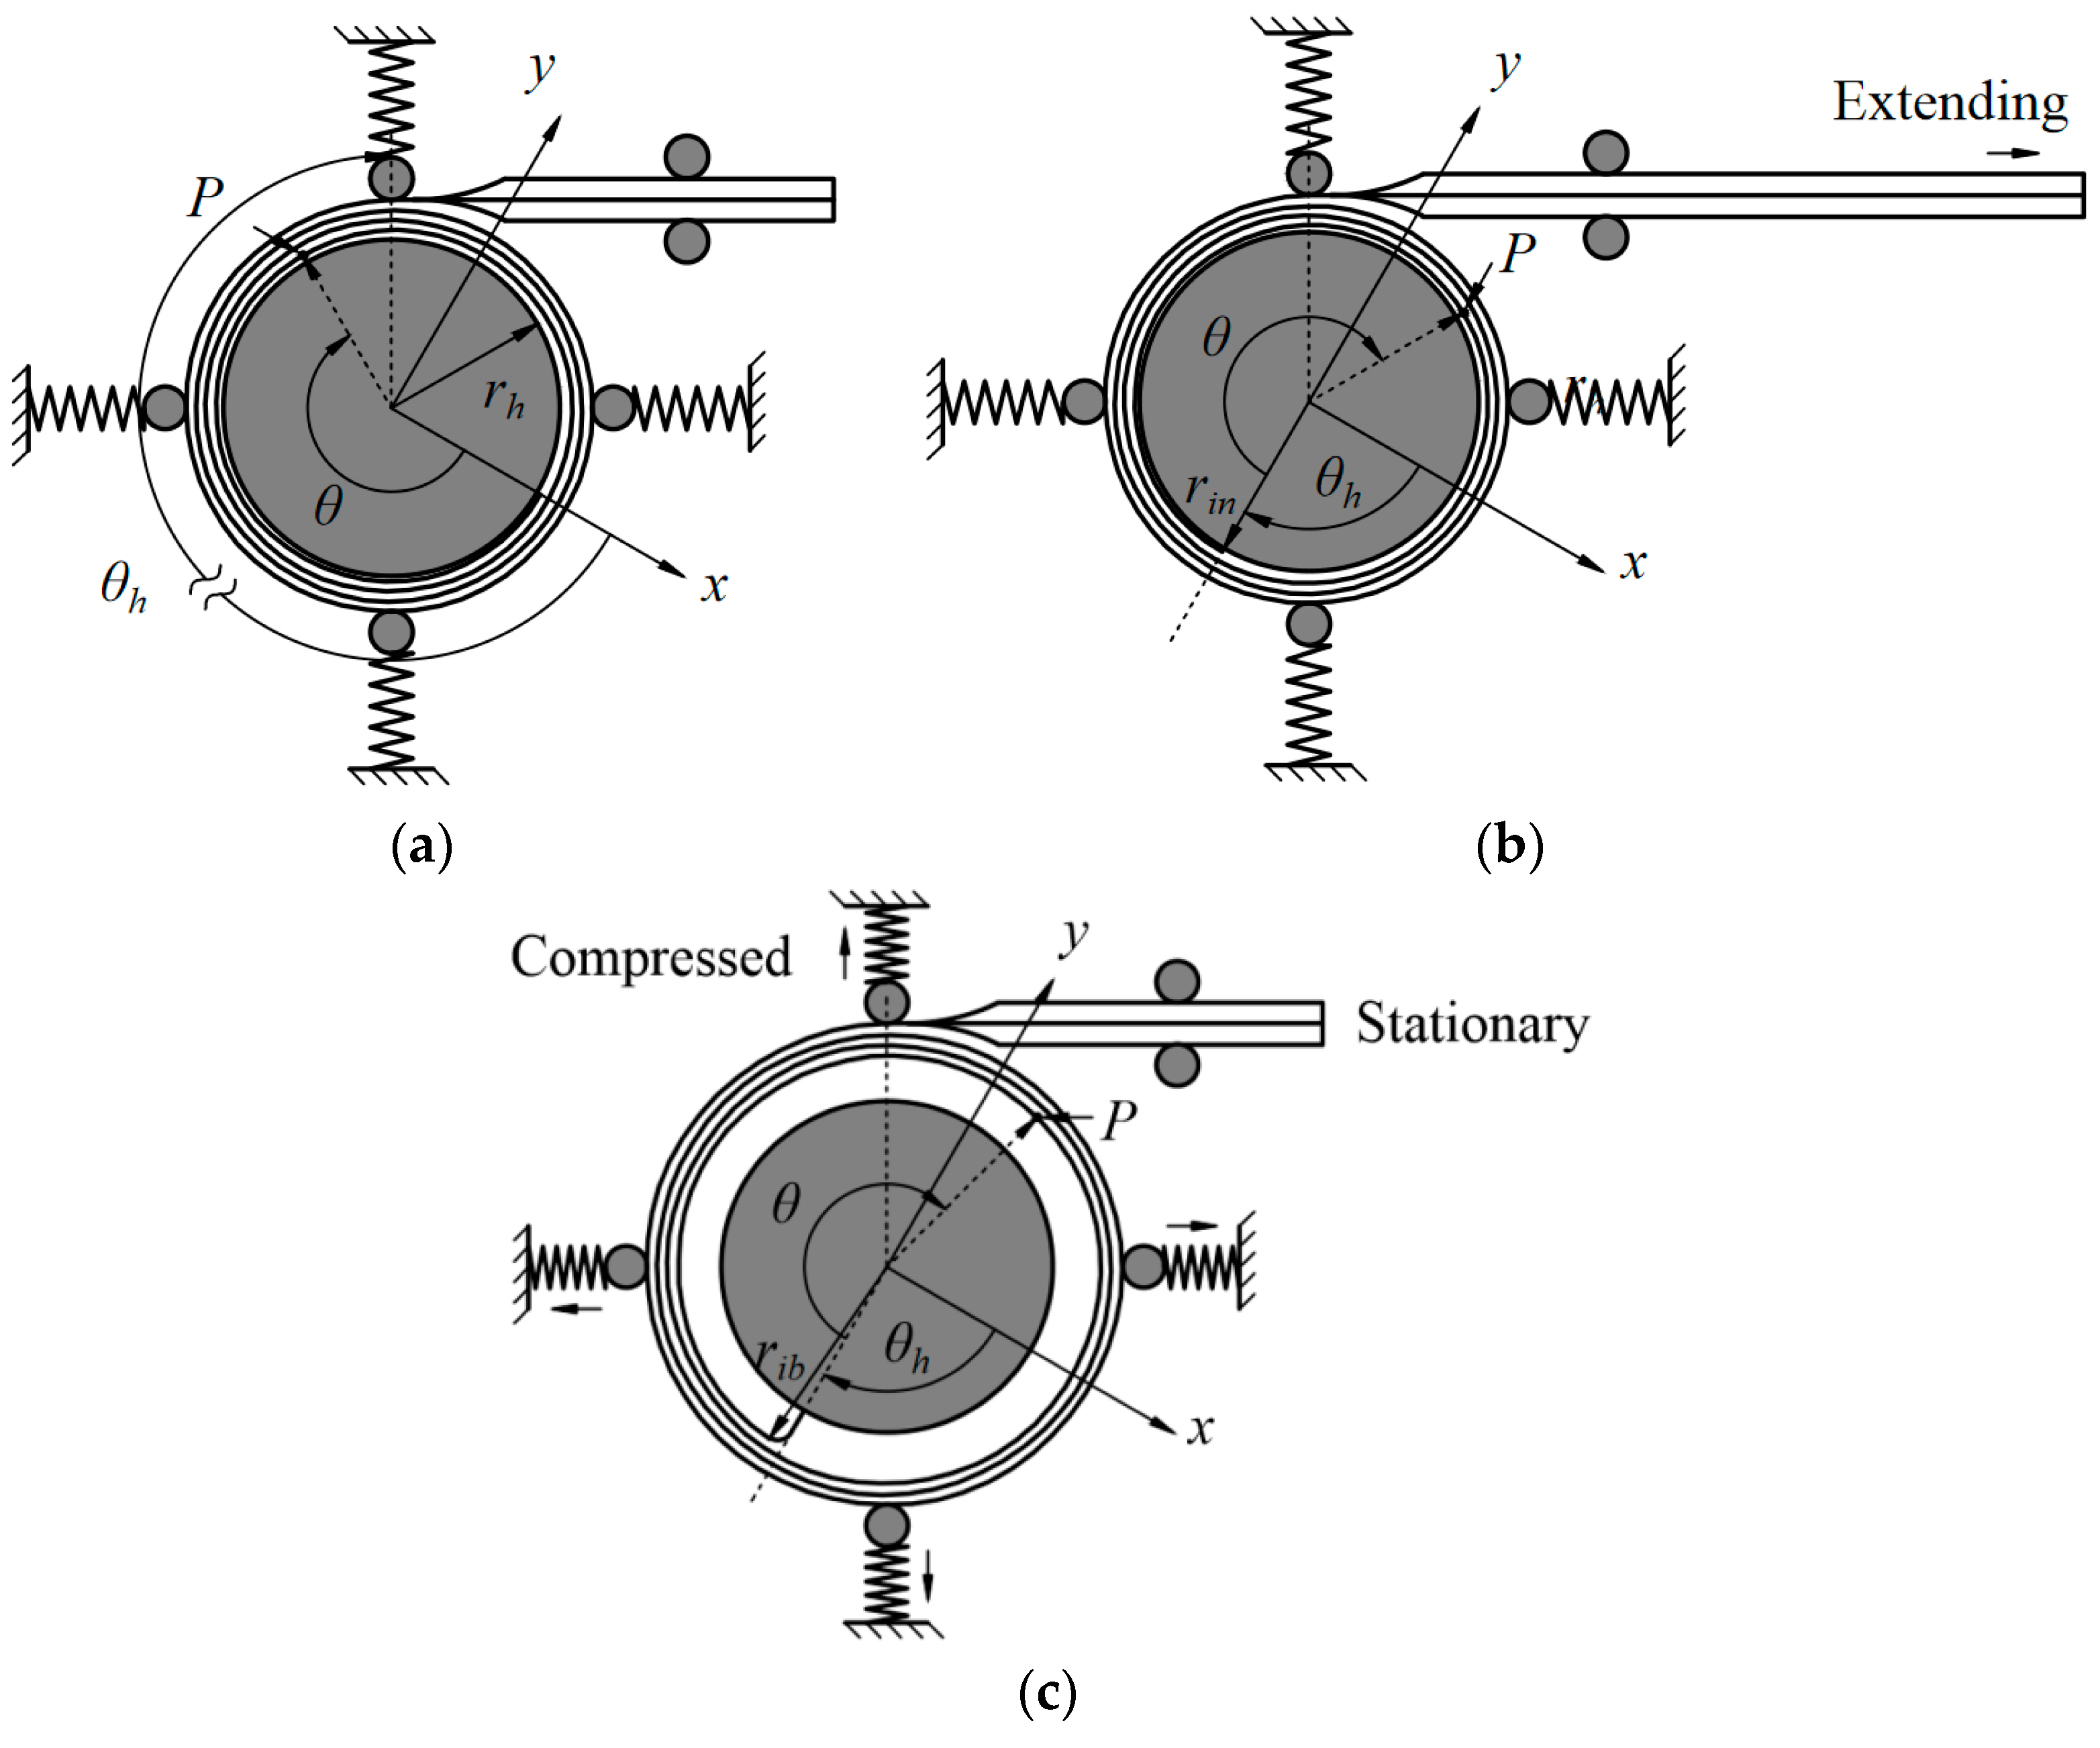
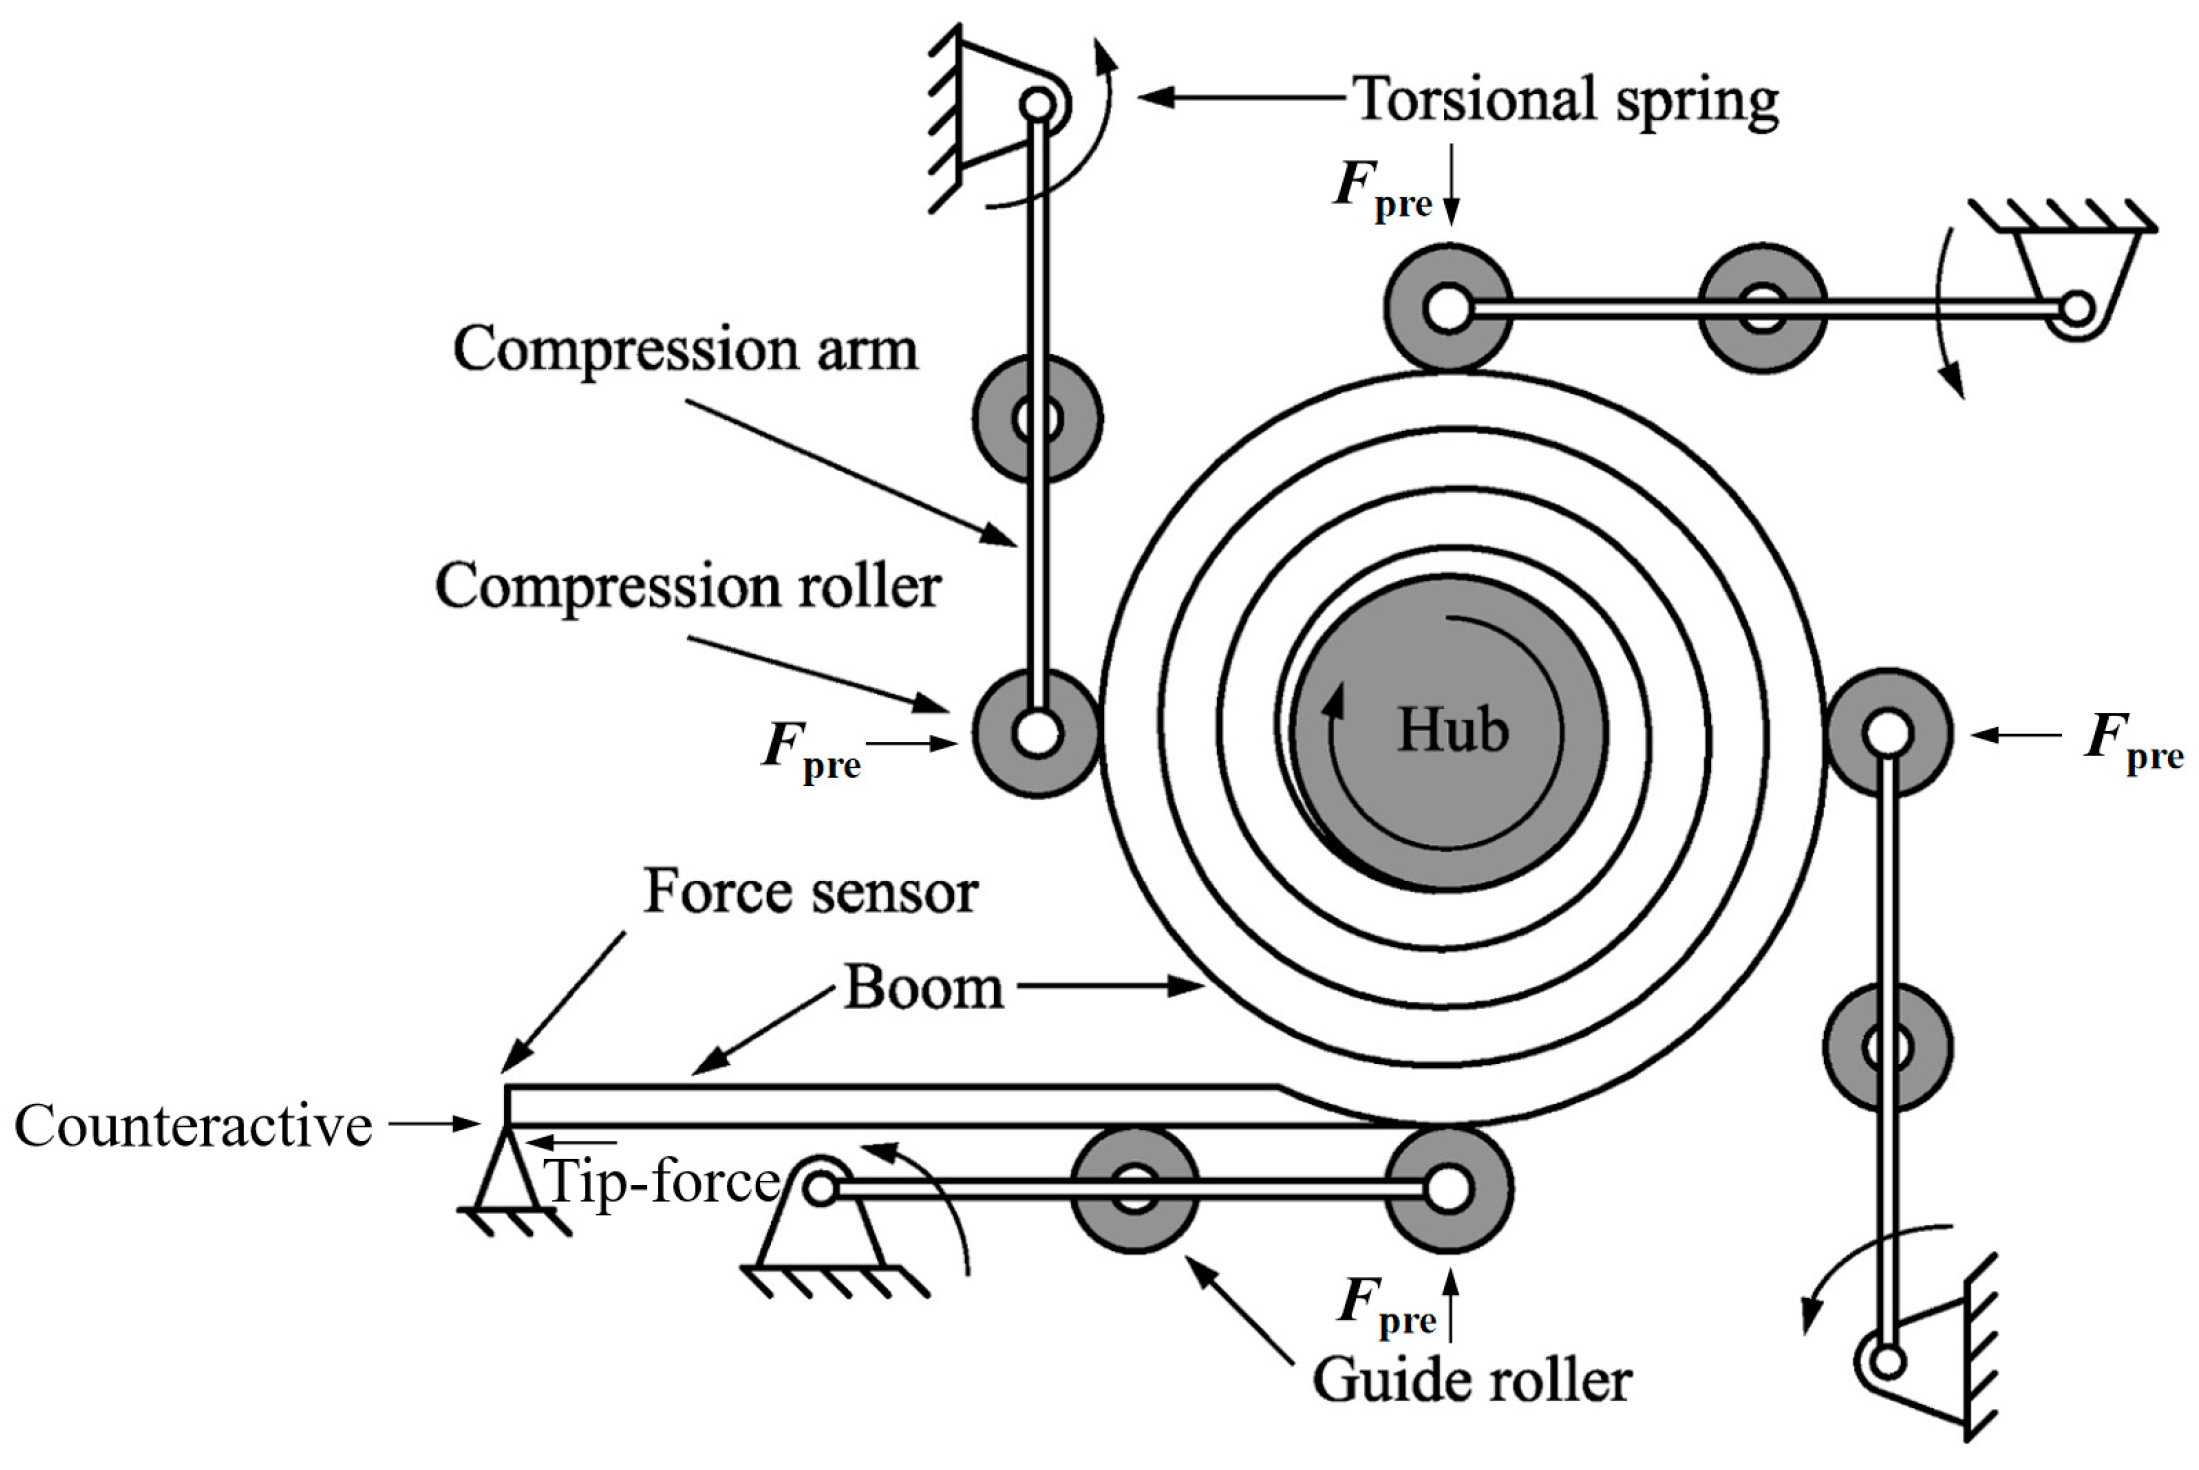
The two upper sub-figures in
Figure 2 present a commonly used restraint mechanism. In this figure, the boom is tightly coiled on the central hub (which is under the control of an electric motor) and the root is fixed on the hub. Four spring-loaded rollers are distributed around the coiled section, affording compression in this region, while two guide rollers designate the extending direction of the boom tip. When the boom is deployed, the tip extends outwards continuously with a corresponding rotation velocity on the hub, and no gap appears between the boom coil and the hub. This deployment process is an ideal deployment mode, which is called normal deployment. However, when a relatively high load acts on the tip, the tip will be prevented from extending outwards, yet the hub can still rotate under the drive of the motor (lower sub-figures in
Figure 2). In this case, the boom’s coiled section would expand inside the deployer and the springs would be compressed. This case is a failure deployment mode which is called blossoming. On this occasion, if the hub still continues to rotate, the coiled section would be fully inside the deployer, and finally it would become stuck and damaged inside the deployer. Therefore, blossoming is a severe failure mode which must be strictly controlled, and further, the key issue is to find the maximum tip load that a boom could withstand before blossoming, which could also be regarded as the maximum driving force a boom could withstand during deployment. Based on this, Hoskin and Jarman established an analytical model of a STEM tape-spring boom manufactured by CuBe for analyzing blossoming issues [
7,
8,
9]. The maximum tip load the boom could withstand before blossoming occurred was acquired through this research. In Hoskin’s analysis, the pressures between the boom’s adjacent coil layers loaded by the compression springs were defined to have an identical value as the force on the compression roller’s spring. This flaw was further remedied by Wang and Viquerat through proposing a semi-empirical formula based on a numerical analysis [
10].
Figure 2.
Diagrams for a boom’s normal deployment (upper) and blossoming (lower) process [
8].
Figure 2.
Diagrams for a boom’s normal deployment (upper) and blossoming (lower) process [
8].
Early tape-spring booms were commonly manufactured from isotropic materials, especially metals such as steel and CuBe. Recently, with the deployment of composite materials, tape-spring booms made from FRP (fiber-reinforced polymer) composites have appeared in recent years, as these booms have a better deploying stability and a higher design flexibility. Hence, it was also necessary to investigate the blossoming issues of composite tape-spring booms. Based on CLT (Classical Laminate Theory), Wang and Viquerat established an analytical model of an FRP tape-spring boom and further analyzed the blossoming behaviors of a composite laminated boom [
11]. Moreover, through carrying out a parametric study, the compound of the boom’s driving force was investigated and an effective method for improving the boom’s driving force was given as well.
More recently, apart from STEM booms with semi-circular cross-section configurations, other deployable booms, such as CTM (Collapsible Tubular Mast) booms with lenticular cross-sections and TRAC (Triangular Rollable And Collapsible) booms with triangular cross-sections, were also invented for specific applications. Through comparing the properties of booms with different cross-sections, it was found that if the booms had the same stowed volumes and deployed lengths, the STEM booms with unibody constructions obviously have the highest deployment reliability; however, at the same time, they have the lowest bending stiffness (see
Figure 3) [
12,
13,
14]. Meanwhile, CTM booms with closed (lenticular) cross-sections have the highest twisting stiffness and a relatively neutral bending stiffness (depending on the bending directions), and the TRAC booms with the most scattered cross-section configurations have the highest bending stiffness when deployed, although their twisting stiffness was lower than that of STEM and CTM booms because of the open and scattered cross-sections. Nevertheless, TRAC booms still have great application potential in large-scale boom–membrane scenarios which have high bending stiffness or fundamental frequency requirements. Furthermore, as a new generation of tape-spring mechanisms, TRAC booms made from FRP composite laminates were regarded as vital research objects in recent investigations, especially by NASA, and the prototype of a boom–membrane structure deployed and supported by TRAC booms was launched into space and deployed successfully years ago (
Figure 4) [
15,
16].
In brief, as next-generation tape-spring mechanisms, TRAC tape springs (FRP composites especially) have attracted increasingly more attention in recent years. Meanwhile, blossoming is a severe failure during a boom’s deployment process. This paper is mainly aimed at analyzing the blossoming behaviors of a composite TRAC boom.
Section 2 establishes the analytical model of an FRP TRAC tape-spring boom based on CLT and the energy method. The normal deployment and blossoming behaviors are investigated in
Section 3, and the maximum tip load (i.e., driving force) a boom could withstand is finally acquired in this section. For the sake of verifying the theoretical model and analysis, a numerical model was built in
Section 4 and the results from the analytical and numerical models were compared (the modeling and analysis methods of the numerical model were verified through a comparison with the experimental data in our former study, which were published in ref. [
17]).
Section 5 concludes the paper. The research from this paper can give more guidance for the design of composite TRAC tape-spring booms and the corresponding restraint mechanisms.
2. Strain Energy Model Establishment of a TRAC Boom
For a better understanding of the deformation behaviors of composite TRAC booms, an analytical model of a TRAC boom was first established. From the diagram in
Figure 1, it can be seen that the interaction of the boom infinitesimals was complicated during the deployment process, and it was difficult to establish the model through a mechanical analysis. Hence, a strain energy model was considered for describing the boom’s deployment/blossoming behaviors in this paper. In terms of a boom during deployment, the boom’s configuration could be divided into three regions for ease of investigation: the fully deployed region (with no strain energy stored), the transit region (also called the
ploy region, with partial strain energy), and the fully coiled region (with full strain energy). Obviously, for building the boom’s strain energy model, the fully deployed region can be ignored, and the fully coiled region should be considered in the analysis. In the case of the ploy region, because the linear energy density is constant during the boom’s deployment and blossoming process, the energy stored in this part can also be ignored in the analysis [
18]. In short, the coiled region is the only part that needs to be considered.
Based on Classical Laminate Theory (CLT), the elastic behaviors of the FRP boom laminates can be described through an ABD matrix as [
19]:
which could be presented more compactly as:
where the definitions of the parameters in Equations (1) and (2) are same as those commonly used in CLT.
According to the constraint mechanisms commonly used in tape-spring booms (shown in
Figure 2) and the laying types of boom laminates usually applied (symmetric or anti-symmetric), the ABD matrix can be simplified to [
20]:
Equation (3) presents the elastic behaviors which cause the boom’s bending and stretching energy, respectively. Based on the theory of elastic mechanics, the bending and stretching energy can be described through [
21]:
in which
b is the path length along the boom’s cross-section.
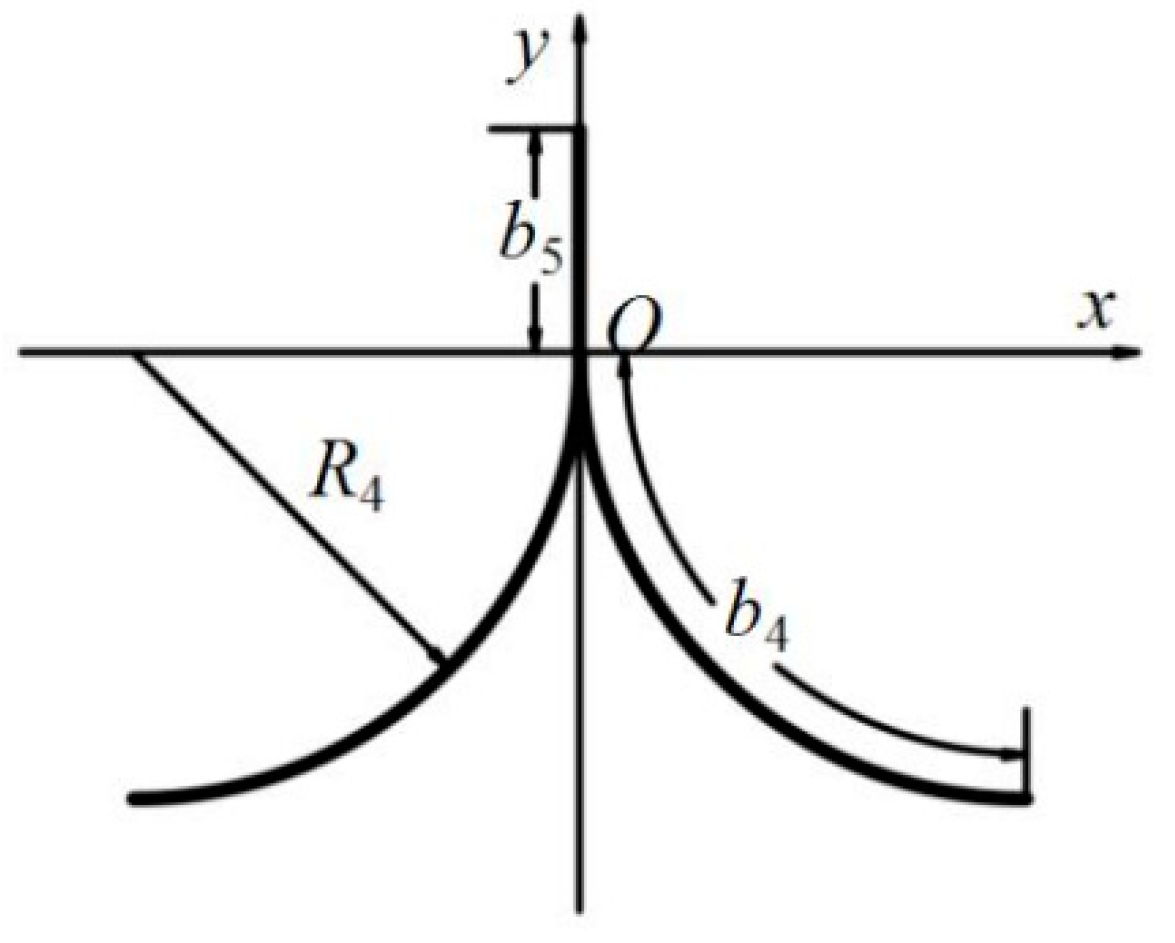
Figure 5 and
Figure 6 show the diagrams of a TRAC boom, and the parameters are marked on the corresponding parts of the figures. The cross-section configuration was symmetric around the
y-axis (see
Figure 5) and
O is the junction point of the bond section (
b5) and the separated section (
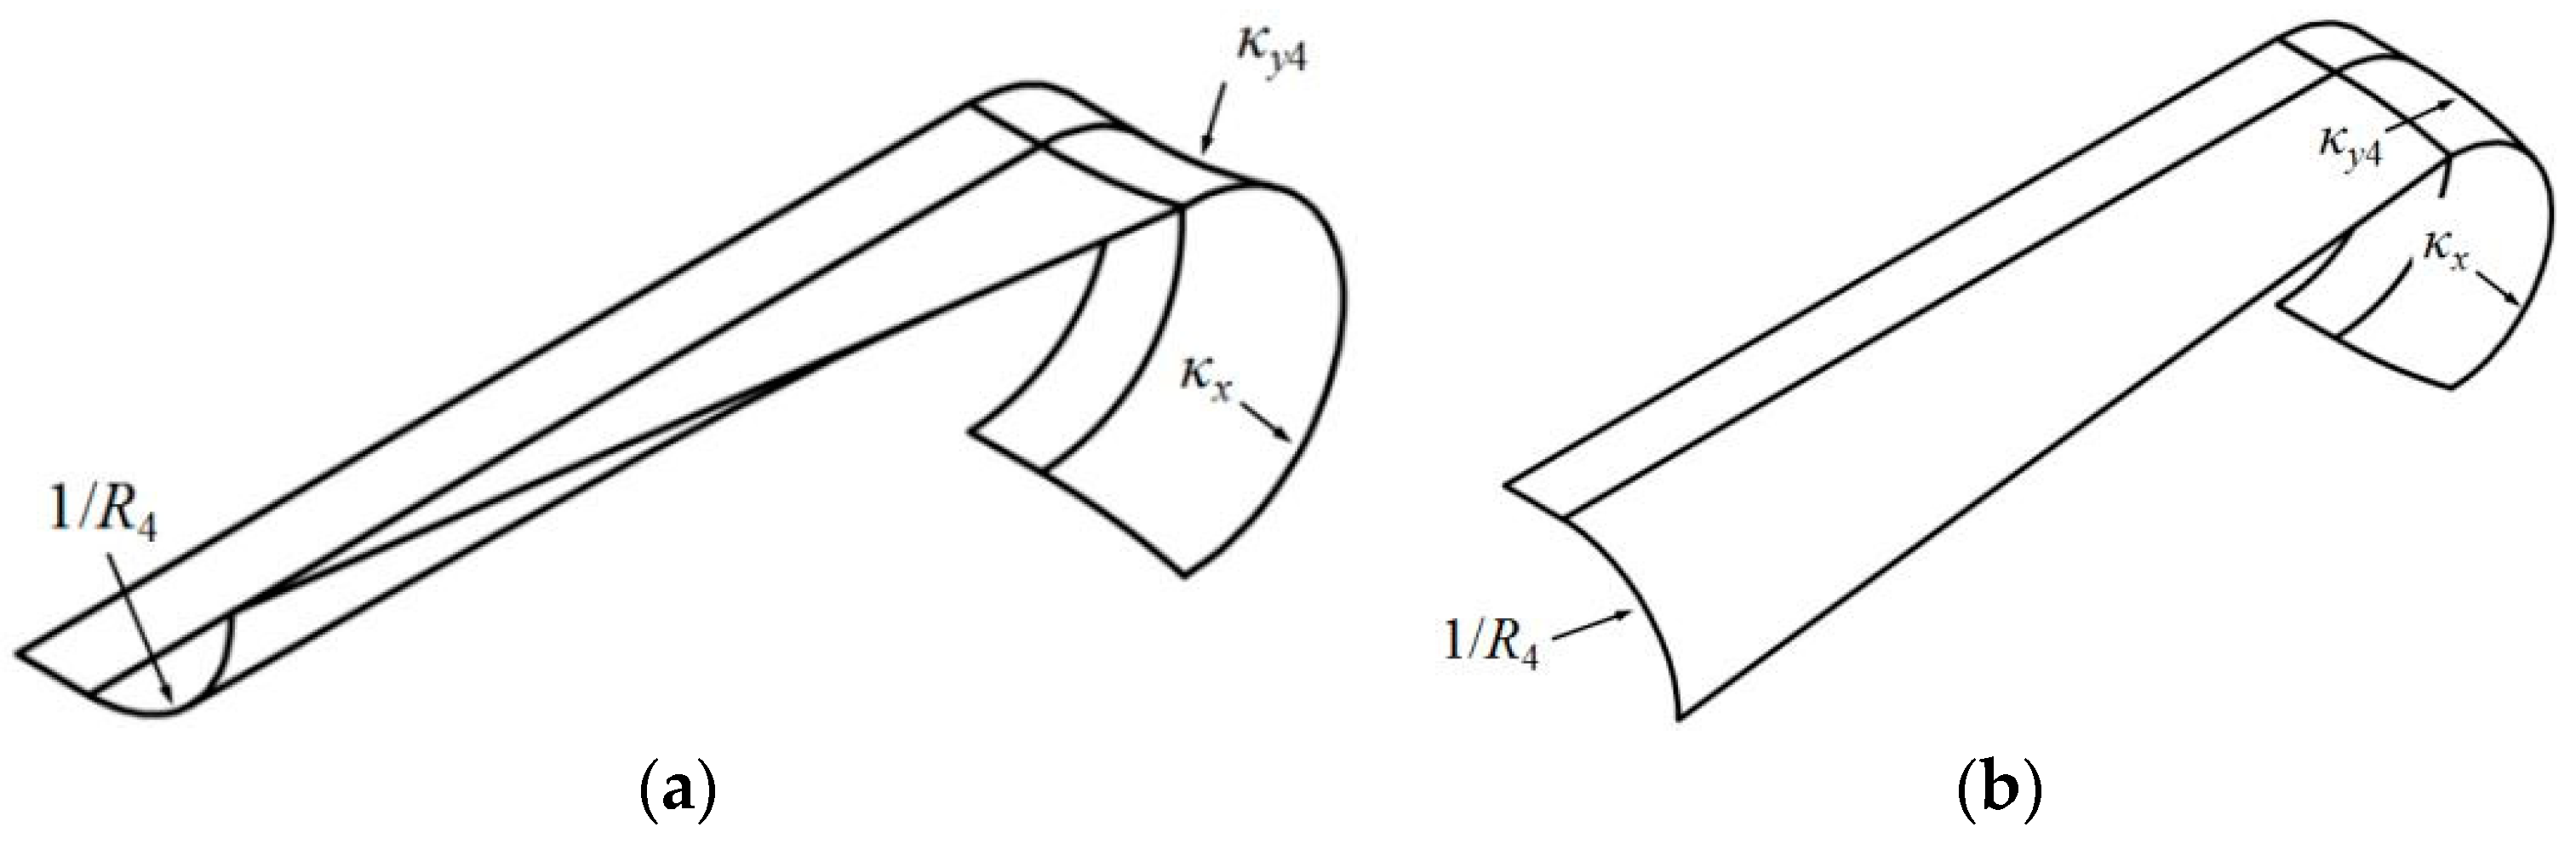
b4). The bending strain energy is caused by two sorts of boom variations, flattening and coiling, while the bond section only contains coiling energy. In terms of the flattening behavior, the deformations of the two slides from one TRAC boom are wholly the same (
κy4 − 1/
R4) because of symmetry. However, in the case of the coiling variation, the deformations of the two slides are opposite (see
Figure 6), which are commonly called
equal-sense coiling and
opposite-sense coiling. Through investigating the deformations of the two symmetric slides, it was concluded that the coiling deflections of the two slides were the same (both
κx) and the tensile deformation of the outer slide was the same as the compressive deformation of the inner slide. Therefore, the bending strain energy stored in the two TRAC slides was the same, and the bending strain energy per unit length of one boom slide is expressed as:
Apart from the bending energy, the stretching energy was caused by the boom’s residual curvatures after coiling (
κy4 in
Figure 6).
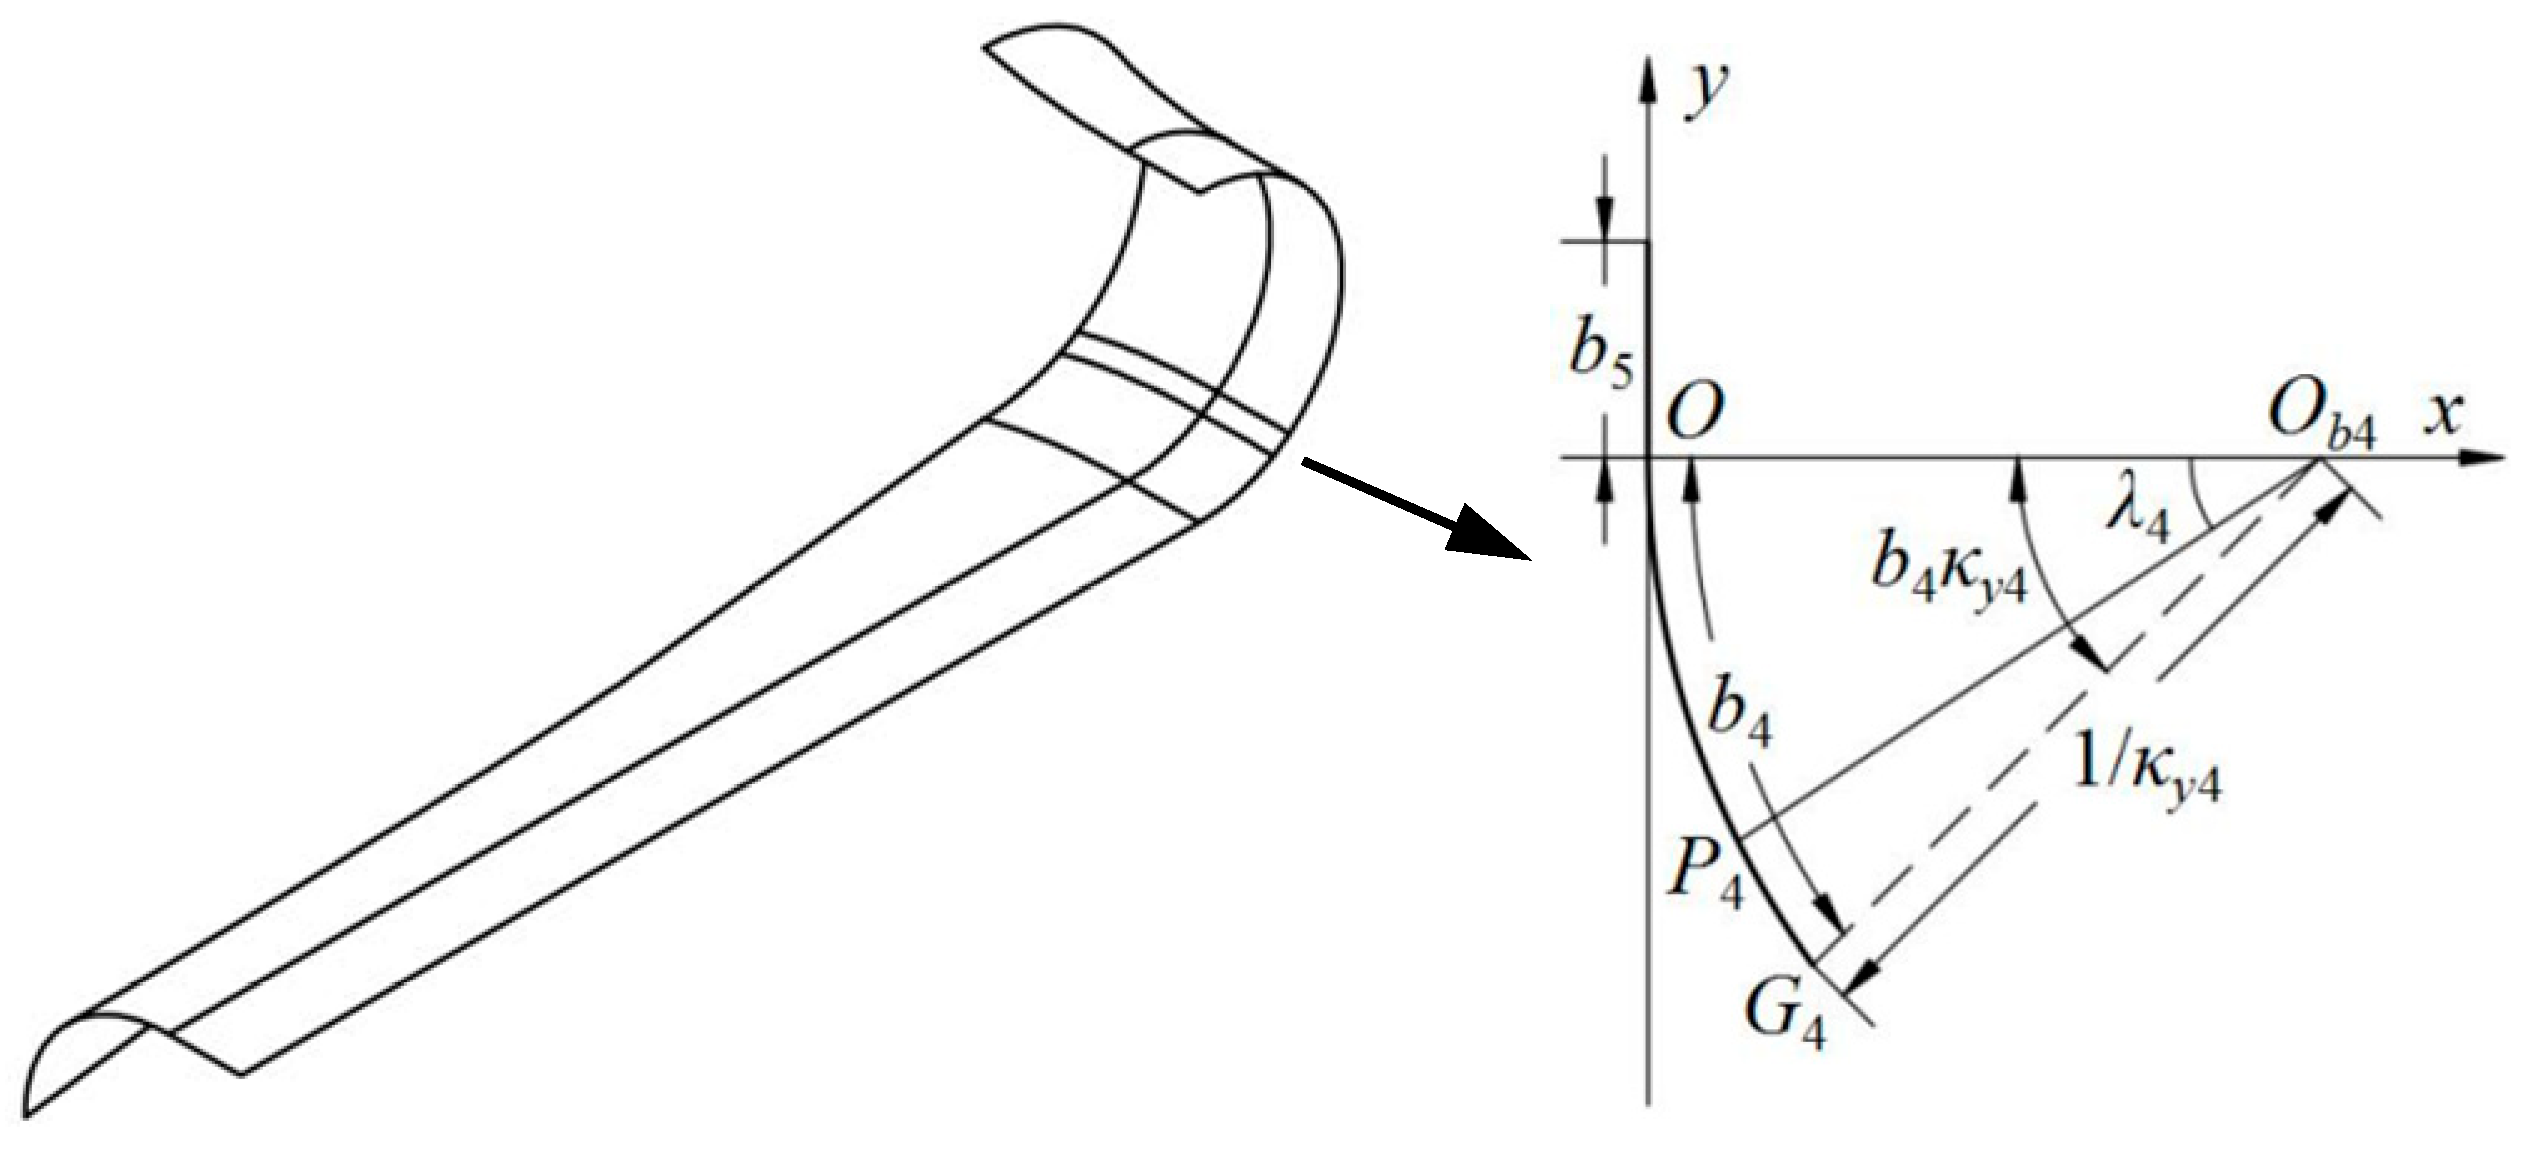
Figure 7 presents the diagram of the residual curvature (
κy4) for one TRAC slide (opposite-sense bending was selected as a representative), in which the
y-axis is the neutral surface of the whole boom.
Ob4 is the circle center of arc
OG4, while
P4 is a point on the arc. According to a geometric analysis of
Figure 7, the distance between point
P4 and the neutral surface (
y-axis) is:
Combining Equations (4) and (6), the stretching energy per unit length (one slide, opposite-sense bending) can be given as
Figure 7.
Stretching energy analysis of one TRAC slide.
Figure 7.
Stretching energy analysis of one TRAC slide.
Resembling the bending energy analysis, the stretching energy stored within the two symmetric slides was also the same (the only difference was that the stretching energy from opposite-sense/equal-sense coiling was caused by stretching/compression deformation, respectively). By combining Equations (5) and (7), the TRAC boom’s total strain-energy per unit length (full model) was acquired through:
In Equation (8),
κy4 is a dependent variable whose value can be acquired through the minimum energy principle:
From Equation (9), the minimum strain energy per unit length
emin-TRAC was also acquired. For acquiring the strain energy of the whole TRAC boom (only the fully coiled region needs to be considered as previously mentioned), integration along the boom’s longitudinal cross-section was performed:
in which
θw and
θh are the hub’s initial state angle and the angle turned from the initial state, respectively,
ri is the curvature radius of the boom’s innermost coil layer, and
a is the coil pitch per unit angle (see the blossoming analysis parts and
Figure 8 in
Section 3 for more details) which can be expressed as:
where
t is each coil layer’s thickness.
3. Normal Deployment and Blossoming Analysis of a TRAC Boom
Based on the strain energy model established in
Section 2, the TRAC boom’s deploying and blossoming behaviors were investigated through analyzing the release of the strain energy.
In the boom’s normal deployment process, the strain energy is released because of the decrease in the coiled region’s length (i.e., the decrease in the boom coiled angle (
θw −
θh), see
Figure 8a,b). Therefore, the boom’s normal deployment torque can be presented as:
where
rin is the radius of the coil’s innermost layer in the normal deployment process (
).
For the boom’s blossoming process, as the tip was stationary due to the excessive load, the coiled region expanded in the deployer (with an increasing
ri, written as
rib (
θh) in this case, which is a function of
θh), while the length of the coiled region was constant (see
Figure 8a,c). Therefore, the boom’s strain energy was released through decreasing the curvatures of the coiled region. Meanwhile, the springs were compressed, and some energy was dissipated by the friction caused by the relative movement of adjacent coil layers. Hence, the torque that is generated at the boom root keeping the boom from blossoming can be expressed as:
where
Eb-TRAC,
Es-TRAC and
Wf-TRAC are the boom strain energy, the spring strain energy and the work performed by the friction, while
Tb,
Ts and
Tf are the torques caused by the respective terms.
3.1. Tb Analysis
According to the geometry of the boom’s initial state, the full length of the boom’s coiled region can be acquired from:
As the boom’s coiled length is constant during the whole blossoming process, the length during blossoming can also be expressed as:
Through combining Equations (14) and (15), rib (θh) can be acquired.
Combining Equations (13) to (15), the torque caused by the boom’s strain energy can be presented as follows:
3.2. Ts Analysis
Based on the spring’s strain energy formula, the energy input into the compression springs (altogether) can be given as:
where
nr,
k and
rpre are the number of springs, the spring stiffness and the spring pre-deformation (each), respectively. In this equation, Δ
r is the compressive deformation of each spring (the deformations of the four springs were considered the same), which is a function of
θh (written as Δ
r (
θh)). During the blossoming process, Δ
r (
θh) can be further presented as:
By combining Equations (13), (17) and (18), the torque caused by the compression springs is:
where
Fr (
θh) is the entire force of each spring, which can be further acquired by:
3.3. Tf Analysis
Before analyzing the torque caused by the friction, the whole contacted length of the boom’s coiled region (
lcon) should be determined. From the geometry of the coiled region,
lcon is a function of
θh, presented as:
Combining Equations (13) and (21), the torque caused by the friction can be given as:
in which
μ is the friction coefficient between the coil region surfaces and
N (
Fr) presents the total pressure between the adjacent layers of the coiled region. In analogy with the previous work in ref. [
10],
N (
Fr) can be found from a semi-empirical formula acquired from numerical analysis:
3.4. Tip Force Analysis
Through the analysis of a boom’s normal deployment and blossoming processes, the boom’s normal deployment torque and the torque for keeping the boom from blossoming have already been acquired. According to the force and torque balance at the boom tip, the boom’s tip load can be expressed as:
which can be further presented as:
In the analysis in this section,
Ft is the force when the boom is deployed or blossomed at a given position. However, blossoming failure should be prohibited during a boom’s deployment process, and hence the maximum tip load a boom can withstand (i.e., the maximum driving force) should be lower than
Ft at any point of the deployment. In other words,
4. Numerical Analysis and Practical Verification
For the sake of providing a verification of the analytical model, a numerical model was established in Abaqus 6.14 FEM software. The establishment process of the numerical model was the same as that used for the composite CTM boom model in ref. [
17], which was verified by a comparison with the corresponding experimental results in our previous investigation.
The contour of the composite FRP TRAC boom is shown in
Figure 9, in which the geometric and laminated parameters (listed in
Table 1) were selected for mimicking those used for InflateSail launched in 2015 [
22]. In the numerical model, S4R shell elements were considered for use, as the boom’s configuration was a thin-walled structure, and quadrilateral meshes were selected because of the geometry. The boom’s cross-section (each slide) was divided into twenty meshes from the mesh refinement to comprehensively consider the calculation amount and numerical accuracy. A rigid constraint was introduced for the central hub and the compression/guide rollers around it since the stiffness of these parts is so high that the deformations could be ignored during the analysis (the radii/thicknesses of the rollers were selected appropriately with the scale of the mechanism, set as
Rr = 5 mm/
tr = 1 mm, while the hub thickness was
th = 1 mm). In terms of the introduction of the composite properties, since fabric laminates [±50 °F/0°]
s (which were used in the corresponding experiment in ref. [
17]) could not be introduced into an Abaqus model, the lay-out [−50°/+50°/0°]
S was used to mimic [±50 °F/0°]
s in this paper (the feasibility of this approach had been verified in our previous work in ref. [
17]). General contact was introduced throughout the whole numerical process based on the simulation experience.
Please note that the definitions of the material parameters in
Table 1 (which have not been defined above) are
Ef,
Em, and
Gf,
Gm is the elastic/shear modulus of the fiber/matrix;
νf and
νm are the fiber/matrix Poisson’s ratio;
tf,
tUD and
Vf,
VUD represent the thickness/volume fraction of the FRP fabric/unidirectional layer;
ϕf and
ϕUD show the porosity of the laminate fabric/unidirectional layer;
μ represents the fraction coefficient of the coil’s surface; and
Er and
Eh are the elastic modulus of the rollers/hub. Note that the boom’s geometric parameters in
Table 1 (
R4,
b4 and
b5) are the same as those shown in
Figure 5, while the definitions of the boom’s composite laminate parameters are in accordance with those commonly used for laminate materials.
According to the summary in
Section 3, the maximum driving force (
Fm) that a boom can withstand should be lower than the lowest tip force (
Ft) at any point during the whole deployment (Equation (26)). However, the lowest tip force values during the
deployment process were discrete points which were difficult to verify. In view of this, the numerical study aimed at analyzing the boom’s
blossoming process, mimicking the experimental method in refs. [
10,
11] shown in
Figure 10. Meanwhile, the maximum driving forces
Fd under each
Fpre are also marked in the sub-figures for a better understanding (
Fd is at the beginning of the blossoming process according to the analysis, and the negative values in the figures correspond to retraction forces on the boom tip). In
Figure 10, the boom is tightly coiled on the central hub and the rollers around it are compressed on the coil at the initial state. Apart from the normal deployment process, the boom tip was fixed from the initial state to the end, while a force sensor was introduced on the tip. Afterwards, the hub was rotated using a motor (clockwise in
Figure 10) for one turn to make the boom start blossoming, while the force sensor measured and recorded the values of the tip force (
Ft) during the whole blossoming process.
For the sake of imitating the experimental blossoming process in
Figure 10, the corresponding numerical analysis steps were selected. Three steps were introduced during the analysis, where the first two steps were used for tightly coiling the TRAC boom on the central hub and removing all the auxiliary restraints introduced for modeling. The third step was used for analyzing the boom’s blossoming process by reversing the central hub. In these steps, implicit analysis was used for the first two steps to acquire smooth structural deformations, while the third step was explicit for avoiding simulation abortion. The details of the numerical analysis steps are as follows:
Step 1 flattened the TRAC boom slides through introducing shell edge loads, while a pressure (perpendicular to the boom surface) was enacted near the boom root to press the root on the hub. The root was finally fixed on the central hub at the end of this step.
Step 2 removed all loads introduced in Step 1 and rotated the central hub for five turns to coil the TRAC boom on the hub (quasi-static analysis).
Step 3 fixed the boom tip and reversed the central hub for one turn (revolving speed vr = 2π rad/s by the explicit method based on numerical experience in former investigations). The contour-acting force on the fixed point was recorded during reversing to performed a comparison with the corresponding analytical results. Note that the spring-loaded compression rollers were introduced at the beginning of this step.
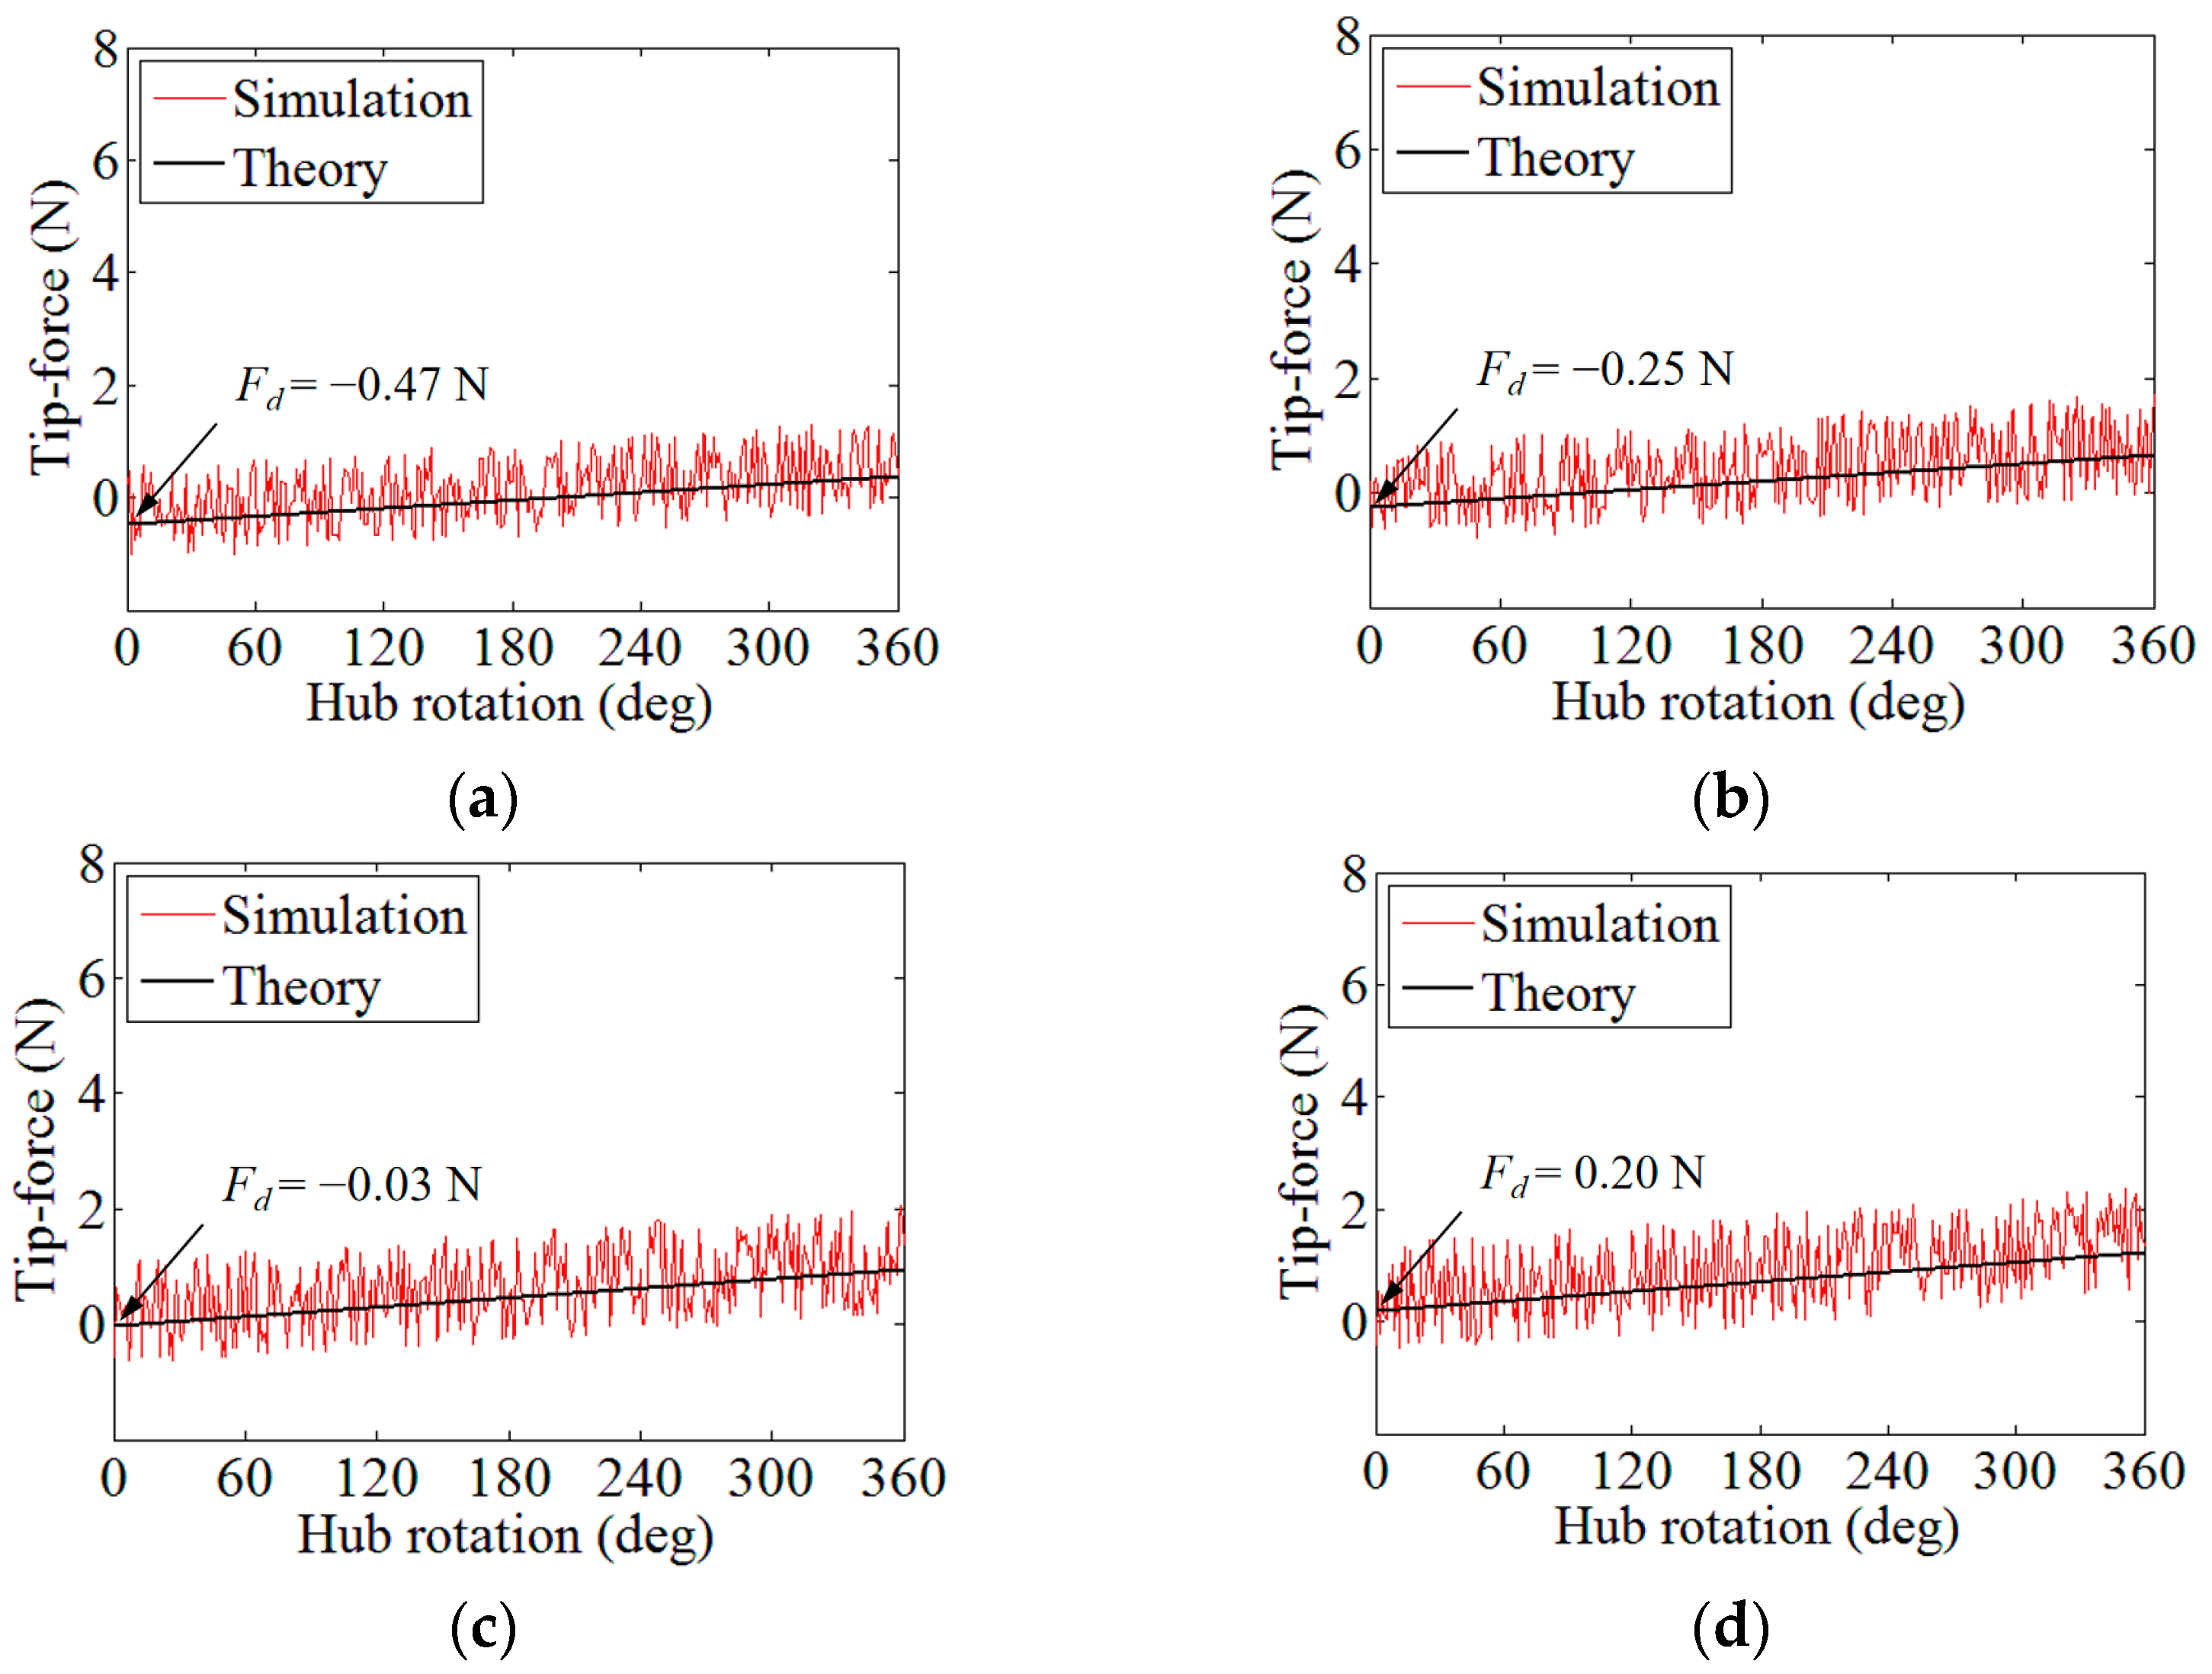
The contour-acting forces (i.e., the boom tip force) recorded in Step 3 are shown in
Figure 11 (red lines). To confirm the verification, the results with a pre-load
Fpre ranging from 1 N to 4 N are presented in the figure as well. The corresponding analytical results were acquired from Equation (25) through changing the parameter
θh from 0 to 2
π. For the ease of making a comparison, the analytical results with
Fpre from 1 N to 4 N are also listed in
Figure 11 (black lines).
According to the plots in
Figure 11, it can be observed that the numerical results were scattered around the analytical ones. Therefore, the analytical method for solving a TRAC boom’s maximum driving force was feasible and correct. Meanwhile, the numerical plots appeared fuzzy since the explicit step (Step 3) in the simulation was not as stable as the static analysis steps; yet, nevertheless, it could still be considered that the results generally matched with each other. Moreover, through comparing the sub-figures with different
Fpre values, the results of the tip force (
Ft) were not obviously distinct, while the discreteness of the numerical plots increased with the growth in
Fpre because of the increase in the coil friction. From this, it could be observed that increasing the force on compression rollers (
Fr) was not an effective way to improve the boom’s tip force. Specifically, the slight change in the tip force under different
Fpre values was also caused by the change in the friction. A higher
Fpre led to a higher
N(
Fr), which enhanced the value of
Tf in Equation (22). In addition, note that the results near the start of the blossoming process (especially when
Fpre = 1 N or 2 N) were below zero, which means that the tip was retractive in these cases. This situation was caused by the boom’s extra small coiled radius (smaller than the boom’s natural coiled radius, see refs. [
15,
23] for more details), yet such a case did not affect the accuracy of the results.
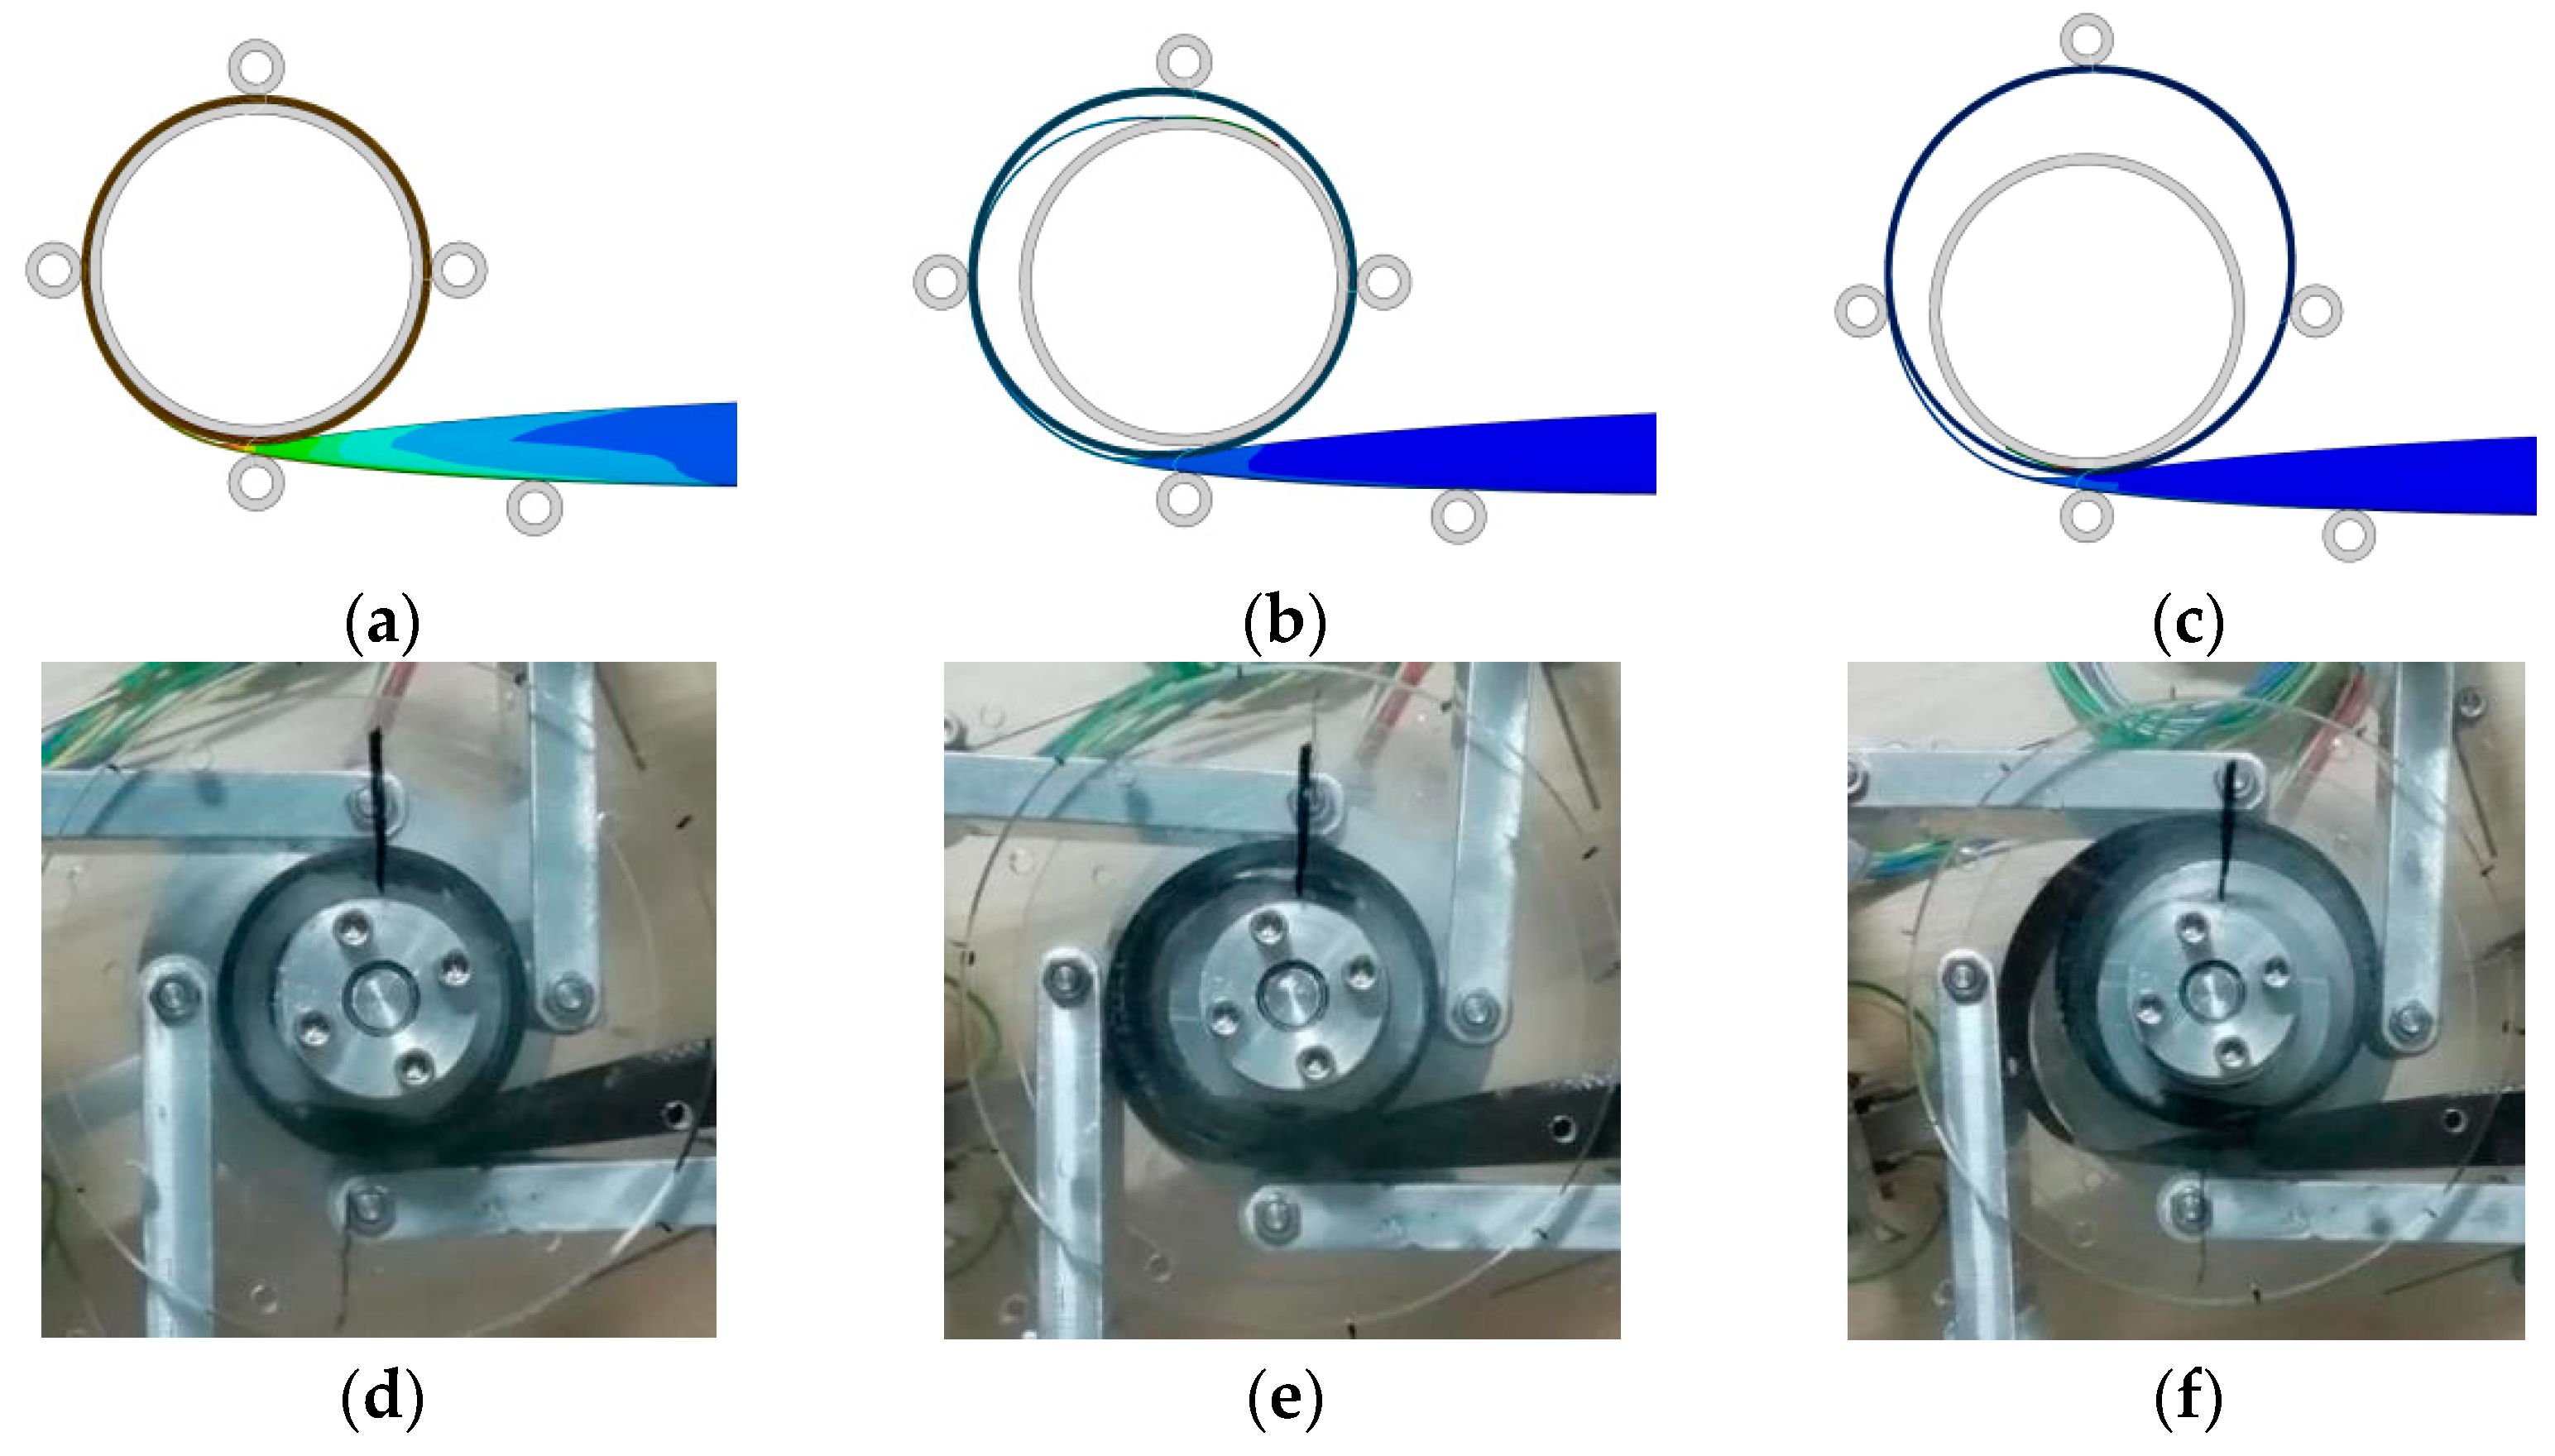
Commonly, the results from numerical methods are further verified by a comparison with some experimental data for providing practical verifications. However, the method of model establishment and the blossoming analysis for the numerical model in this paper was the same as that used in ref. [
17], which was verified through experimental study. For a better illustration, the comparison of numerical and experimental results is shown in
Figure 12, and the corresponding configurations matched well in the verification. In conclusion, the analytical method proposed in this paper is able to acquire the maximum driving force a TRAC boom could withstand.
5. Conclusions and Discussion
Extendible tape-spring booms are a kind of new-generation deployable mechanism widely applied in aerospace technologies. In recent years, with the rapid development of composite materials, tape-spring booms manufactured from FRP laminates have replaced traditional isotropic booms usually made of steel or CuBe for acquiring lightweight structures and better design flexibility. The boom cross-section configurations commonly used are as follows: STEM, CTM and TRAC booms. TRAC booms have a higher bending stiffness after unwinding, since their deployed configuration is more discrete than the others. Blossoming is a failure mode that often occurs during a boom’s deployment process, and is caused by an excessive load acting on the boom tip.
To ensure that the mechanism deploys normally, this paper aimed at acquiring the maximum tip load an FRP laminated TRAC tape-spring boom could withstand before blossoming (i.e., the boom’s maximum driving force). Through establishing a strain energy model of a TRAC boom, the maximum driving force was obtained via an analytical method. Moreover, a numerical study was carried out to perform a comparison and verify the correctness of the analytical results, and the modeling and analysis method of the numerical model was verified by a comparison with experimental data from a previous investigation. According to the results comparison in this paper, the analytical method was able to predict the maximum driving force of a TRAC boom. Meanwhile, from the numerical results, a higher roller force could make the plots more variable because of the higher friction introduced; however, the plots were still generally scattered around the analytical results. Furthermore, it could also be observed that the compression force from the surrounding rollers had a slight effect on the boom’s tip force. Therefore, increasing the roller force was not an efficient way of improving the value of a boom’s driving force.
From the study in this paper, it could be seen that the payload acting on the boom tip should always be lower than the boom’s maximum driving force during the whole deployment process for ensuring that the boom extends normally. Based on the theoretical analysis, for the boom’s parametric design, the driving force can be improved through changing the key geometric or laminate parameters in the analytical model. In terms of the boom’s real-world applications, vibrations from the controlling motor would decrease the friction between the adjacent coil layers, and thus a higher driving force margin should be considered in practical cases. In brief, the investigation in this paper can provide more guidance on the design of FPR composite laminate TRAC tape-spring booms and the corresponding deployer facilities, especially for avoiding deployment failures.


