Abstract
Efficient control of flow separation holds significant economic promise. This study investigates flow separation mitigation using an experimental platform featuring a combination of passive and active actuators arranged in a matrix configuration. The platform consists of 5 × 6 hybrid actuator units, each integrating a height-adjustable vortex generator and a micro-jet actuator. Inspired by the distributed pattern of V-shaped scales on shark skin, these actuator units are strategically deployed in a matrix configuration to reduce flow separation on a backward-facing ramp. Distributed pressure taps encircling the hybrid actuators monitor the flow state. Parametric analyses examine the effect of different control strategies. By adopting appropriate passive and active actuation patterns, effective pressure recovery on the ramp surface can be achieved. The most significant flow control outcome occurs when the actuators operate under combined active and passive excitation, harnessing the benefits of both control strategies. Particle image velocimetry (PIV) results confirm a notable reduction in flow separation under the best-controlled case. These findings suggest a promising future for flow control devices employing combined passive and active actuation in matrix-like configurations.
1. Introduction
Turbulence control presents significant economic and environmental advantages in various modes of transportation. In the context of high-speed trains, aerodynamic drag becomes especially pronounced, comprising 75–80% of the total drag at speeds of 300 km h−1 [1,2,3]. This proportion escalates to over 90% as the train accelerates to 400 km h−1 [4,5]. In passenger cars, aerodynamic pressure drag also emerges as the primary concern [6,7,8]. This type of drag accounts for 90% of the total aerodynamic drag, with 80% of its impact concentrated in the car’s rear section [9]. Notably, one of the primary sources of aerodynamic drag in passenger cars is the flow separation near the vehicle’s rear end, where detached airflow often leads to significant energy losses [10].
A wide spectrum of flow control techniques has been effectively employed in both academic and industrial configurations to mitigate flow separation [11]. Passive control devices, such as vortex generators [12,13], dimples [14,15], flaps [16], and transverse grooves [17], have demonstrated efficacy in controlling separation across various flow configurations. A recent study by Viswanathan [18] conducted a parametric analysis to investigate the impact of different vortex generators on car drag reduction under varying yaw angles. The rapid evolution of actuator design and manufacturing technologies has elevated active flow control to a prominent research area. A comprehensive survey of active actuators can be found in Cattafesta and Sheplak [19]. Fluidic oscillators [20,21], synthetic jets [22,23], plasma actuators [24,25], and pulsed jets [26] have been successfully deployed in various flow configurations, resulting in significant advancements in separation control. Despite the additional energy investment required, the promising performance, flexibility, and robustness of active control methods have rendered them a popular choice for flow control applications [27].
Synergizing active and passive flow control devices represents a promising future for more effective flow control outcomes. In Yagiz et al. [28], a 5% reduction of aerodynamic drag was achieved in a 2D airfoil by combining bump and jet actuation. This combined approach yields significantly better results compared to either form of flow control strategy alone. Similarly, Liesner and Meyer [29] simultaneously applied boundary layer fences and suction actuation in a compressor cascade to reduce energy loss, demonstrating the effectiveness of combining both flow control strategies. However, for these pioneering studies, passive and active control devices were deployed independently and lacked effective integration. The potential for achieving even more promising flow control outcomes with minimal energy investment could lie in the development and application of hybrid passive and active actuators, which are capable of performing active control based on passive control results. By integrating both active and passive strategies, these hybrid actuators have the potential to perform more effective flow control.
Currently, academic flow control experiments and simulations primarily focus on canonical configurations, utilizing a limited number of sensors and actuators [30,31,32,33,34,35]. However, the inherent complexity of industrial flow configurations necessitates the expansion of sensor and actuator dimensions. This entails deploying a large number of actuators and sensors in the flow control plant. Pioneering studies have showcased the effectiveness of distributed flow control approaches. For instance, in wind energy applications, many vortex generators have been extensively deployed on wind turbine blades to enhance aerodynamic performance [36]. Similarly, in the active flow control of bluff body wakes, hundreds of micro-jet actuators have been employed to manipulate wake structures and reduce drag [26].
This study introduces the design and validation of a flow separation control device comprising hybrid passive and active actuators arranged in a matrix configuration. These hybrid actuators possess the capability to simultaneously execute passive and active flow control, thereby maximizing control effectiveness. We integrate 30 hybrid actuators on the surface of a backward-facing ramp in a matrix configuration, accompanied by 42 neighboring pressure taps to monitor pressure recovery on the ramp surface. By individually controlling the excitation state of each hybrid actuator, this experimental setup enables localized flow control refinement both passively and actively. In this investigation, we conducted a parametric study to assess flow control performance under various uniform arrangements. While appropriate passive control proved effective in enhancing pressure recovery on the ramp surface, the combination of passive and active control yielded more pronounced flow control performance. Particle image velocimetry (PIV) results confirmed a significant reduction in flow separation under the best-controlled case. These promising findings highlight the substantial potential of advanced flow control utilizing hybrid passive and active actuators in a distributed configuration. By combining the strengths of both control strategies, these experiments represent a paradigm shift from using a few actuators to employing distributed, matrix-wise actuators with hybrid passive and active capabilities. This shift marks a significant advancement in the field of flow control.
This manuscript is structured as follows. We present the design of the experimental platform in Section 2, which includes the hardware configuration (Section 2.1), the flow control objectives (Section 2.2), and other experimental instrumentation (Section 2.3). A comprehensive aerodynamic characterization of the baseline flow profiles is detailed in Section 3.1. The results of the parametric study of the experimental plant are outlined in Section 3.2, which encompasses a thorough comparison of various purely passive and hybrid (passive + active) control patterns, along with an analysis of the flow field under the best-controlled case. Finally, we conclude with a summary and outlook in Section 4.
2. Methodology
2.1. Separation Control on a Smooth Ramp Using Hybrid Passive and Active Actuators in a Matrix Configuration
One key innovation in this study is the development of an experimental separation control platform that integrates hybrid passive and active control, forming an actuator matrix. Conceptually, by arranging the hybrid actuators in a matrix configuration and controlling the actuator elements individually, each actuator should be capable of mitigating flow separation at its respective location by employing the locally suitable strategy. In scenarios where flow separation is absent, these actuators should remain flush with the profiled ramp wall, thereby avoiding interference with the flow field or generation of additional disturbances. However, when flow separation occurs, these actuators can initially function as purely passive devices, mitigating flow separation without requiring additional energy investment. Building upon the effectiveness of passive control, the hybrid actuators can then employ additional active control to further enhance the flow field, leveraging the combined benefits of both passive and active control strategies if necessary.
Based on these key design principles, we develop the experimental platform to address the flow separation control problem using a backward-facing ramp model. This classical model has been extensively studied in previous works, such as [37,38,39,40], among others. Reducing flow separation and recirculation in this simplified model holds significant implications for industrial flow applications. The potential of passive devices such as vortex generators [41,42,43] and active devices such as microjet actuators [44,45,46,47,48,49] to the effective ramp separation control have been successfully demonstrated in the state-of-the-art experiments and numerical simulations. The current research adopts a smooth backward-facing ramp profile initially proposed in [40]. According to this pioneer work, the mathematical expression of the smooth ramp profile is defined as follows:
In this equation, x and y represent the streamwise and wall-normal directions, respectively. The step height H is set to 50 in the current implementation. The shape factor is chosen to ensure that the maximum slope is 35°.
Figure 1 presents the three-dimensional schematics of the experimental platform based on the ramp model described in Equation (1). The platform consists of the 5 (streamwise) × 6 (spanwise) hybrid actuator matrix and the staggered sensor matrix on the ramp surface. The design follows a modular approach, as depicted in Figure 1a. Each module comprises five equidistantly arranged hybrid actuators along the ramp profile. To accommodate complex inner and outer geometries, these actuators are fabricated using 3D-printing techniques. Each actuator takes the shape of a triangular prism, with its top surface conforming to the local ramp profile. At the bottom of each actuator, a stepper motor is installed to control the actuator’s movement in the vertical direction. When the actuator’s top surface coincides with the ramp profile, it remains inactive. Additionally, the actuator can function as a passive vortex generator when lifted up. These triangular prisms are capable of producing a pair of counter-rotating vortices from the sharp leading edge. The effectiveness of a similar configuration has been validated in previous works, such as [18,50]. The motion of the hybrid actuators is quasi-static, allowing for the creation of different passive actuation patterns by assigning different heights to the actuators. The actuator dimensions, as well as the number of actuators, are designed based on the size of the stepper motors, which are mounted under the ramp surface, as well as the design principle to maximize the number of actuators that can be accommodated on the ramp body. The height of each actuator can be adjusted between 0 and 10 . A height of 0 indicates that the actuator is inactive and flush with the ramp surface, while a maximum height of 10 exceeds the boundary layer thickness () of the incoming flow.
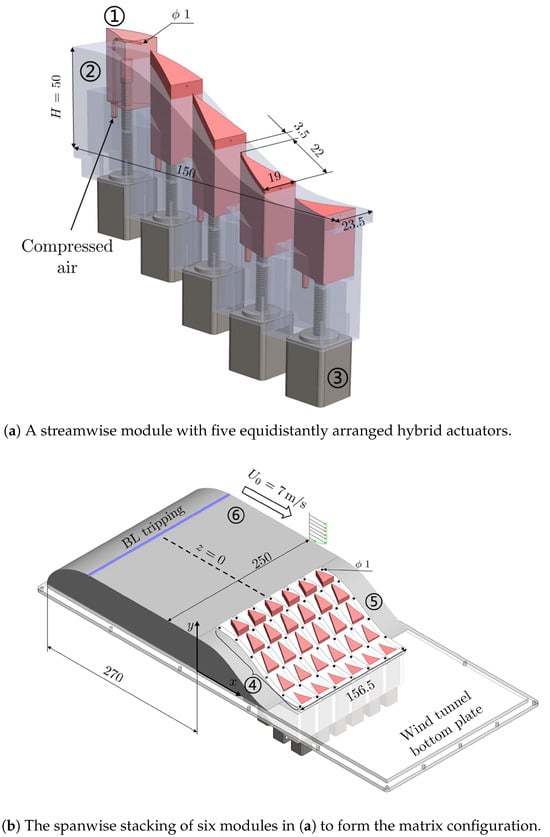
Figure 1.
The experimental configuration of the flow control device comprising hybrid passive and active actuators arranged in a matrix configuration. Key components are listed from ① to ⑥. ①: A hybrid actuator integrating a vortex generator and an encompassed micro-jet. ②: The ramp base. ③: A stepper motor controlling the height of the actuator. ④: Pressure taps for static pressure measurements on the ramp surface. ⑤: The fixed ramp profile near the side wall. ⑥: The front body with a boundary layer tripping device in the wind tunnel test section. Key design parameters are also provided for reference (unit: ).
To enable active control, each actuator is equipped with an interior air tubing fabricated using 3D printing. The tubing features an inner diameter of 1 , with its injection outlet positioned 2 below the actuator’s top surface. The tubing inlets of all elements in the actuator matrix are connected to a pressure vessel maintained at a constant gauge pressure. This configuration allows the actuators to generate high-momentum micro-air jets in the downstream direction. We adjust the supply air pressure to ensure a consistent volumetric flow rate of 60 L min−1 when all micro-jets are activated simultaneously. To regulate the on–off state of each micro-jet promptly, high-frequency solenoid valves (Festo, MHE2-MS1H) are connected between each actuator and the compressed air supply. These solenoid valves have the capability to operate at frequencies ranging from 0 to 200 , enabling steady blowing, periodic blowing, and even more complex actuation patterns.
As depicted in Figure 1b, the hybrid actuator matrix is achieved by stacking a total of six modules in the spanwise direction. This configuration results in a total of equally spaced actuators on the ramp surface. In addition to the actuators, we incorporate a staggered distribution of pressure taps, arranged in a grid of 6 (streamwise) × 7 (spanwise) around the hybrid actuators. Each pressure tap is positioned at the center of the neighboring actuators and has a diameter of 1 . To monitor the pressure distribution on the ramp surface, all pressure taps are connected to a HangHua PSU pressure scanner using plastic tubing, each 30 long with an inner diameter of 2 . With this setup, the experimental platform can execute passive, active, or hybrid control commands while simultaneously evaluating the wall pressure distribution under the corresponding control commands.
The assembled actuator and sensor matrices are installed in the test section of an open-loop wind tunnel. To promote uniform incoming flow, a front body with a streamlined leading edge is positioned in front of the module assembly. Additionally, a boundary layer tripping device is installed upstream to induce a fully turbulent boundary layer at the ramp leading edge. To mitigate the influence of strong wall effects, the actuators are not deployed near the side walls of the wind tunnel. Instead, solid ramp profile modules are utilized to fill the corresponding regions. For this study, the freestream velocity is set to 7 m s−1. This velocity corresponds to a Reynolds number of 23,000, based on the height of the ramp.
A control system based on LabVIEW is developed to orchestrate the actions of the hybrid actuator matrix according to user-defined commands. The control system is implemented on a PXIe-8840 Real-time system. To achieve the desired heights of the actuator matrix and on–off states of the micro-jets, an NI PXI-6509 digital I/O module is employed. This module provides the necessary digital ports to send digitized control signals to passive and active devices, enabling precise actuation of each element. For data acquisition, an NI PXI-6225 module is utilized. This module collects voltage signals obtained from the pressure scanner. These voltage signals can be converted into pressure readings through a meticulous in situ calibration process. In subsequent discussions, the vortex generator height and micro-jet on–off state are denoted by and , respectively, where . This setup ensures accurate control and data acquisition for the experimental platform, enabling detailed analysis of the flow control performance.
2.2. Flow Control Problem Formulation
One main objective of this study is to investigate the effects of different passive and active flow control patterns using the proposed hybrid actuator matrix. In this study, we focus on steady-state passive and active control laws, which can be parameterized as follows. For passive control, we discretize the height variable into five possible values, allowing each actuator to switch between 0 , 2 , 4 , 6 , and 8 . For active control with constant blowing, the active parameter represents the on–off status of the i-th micro-jet.
To assess flow control performance, we define a cost function based on the pressure distribution on the ramp surface. To represent separation reduction and pressure recovery on the ramp surface, we mathematically define the cost function as:
In this equation, represents the pressure in the freestream, and is the time-averaged pressure distribution on the ramp surface S. We also define a non-dimensionalized cost function (denoted as ) based on the ratio between and the baseline cost function obtained under the unforced case:
Here, a positive value of indicates a negative pressure recovery, implying that the flow field becomes deteriorated. Conversely, a negative value of signifies an improvement in separation control. This non-dimensionalized cost function will be adopted in the following discussions.
2.3. Experimental Setup and Instrumentation
In this study, a parametric study consisting of 120 test cases is performed to assess the effectiveness of flow control outcomes under various control strategies. To simplify the control laws, the hybrid actuators on each spanwise row are assigned uniform control commands. Initially, purely passive control is applied to the hybrid actuators, where these elements act solely as passive vortex generators at different heights. We consider combinations of single rows, two neighboring rows, three neighboring rows, four neighboring rows, and all five rows lifted up at a uniform height h above the ramp surface. Four different heights ranging from 2 to 8 are chosen, and this results in a total of 60 purely passive test cases.
The parametric examination of passive + active control is conducted by adding additional uniform, steady micro-jet activation to each purely passive case. For each case, pressure data are recorded for 20 at a sampling rate of 2048 , and the non-dimensional cost function is calculated according to Equation (3) from the sampled pressure signals. These results will be used to analyze the effectiveness of flow control in each parametric case and the results will be discussed in the following section.
Based on the results of parametric flow control experiments, several flow measurement techniques are employed to characterize the baseline and controlled flow fields. One such technique is the use of hotwire anemometry to characterize the boundary layer profile at the leading edge of the ramp (). The hotwire system used in this study comprises a single-wire boundary layer probe and a CTA-02 anemometer from HangHua Inc. The boundary layer profile between and is measured by installing the hotwire probe on a 2D traversing system. Data acquisition is performed using an NI USB-6009 DAQ card, with a sampling rate set to 2048 and a measurement time of 20 at each location. To ensure accurate velocity readings, the hotwire anemometry is calibrated in situ by recording the output voltage of the hotwire at a range of incoming velocities. A fifth-order polynomial fitting is then applied to establish the relationship between flow velocities and mean output voltages. The in situ calibration concludes an overall uncertainty of less than 1.5% considering probe alignment, curve-fitting, calibration flow, temperature and pressure variations, and A/D conversion [51].
Particle image velocimetry (PIV) is also employed to measure the velocity fields on different streamwise planes aligned with the spanwise locations of the pressure taps. A planar PIV configuration is set up to obtain two-dimensional velocity fields on these planes. Two cameras are positioned side-by-side to maximize the field of view (FoV) in the streamwise direction. Seeding particles, generated by an Antari fog machine with an average size of approximately 0.2 μm, are illuminated by a dual-cavity Nd:YAG laser with a wavelength of 532 . For each measurement plane, a total of 3000 image snapshots are acquired at a sampling rate of 12 . The acquired image pairs are subsequently post-processed using a standard multi-pass routine to calculate velocity vectors, ensuring a spatial resolution of approximately 0.5 mm for all measurements. Uncertainty analysis is performed based on the cross-correlation statistics during the calculation of velocity vectors [52], suggesting an uncertainty less than 0.1 m s−1 for all PIV measurement campaigns. Key parameters for flow measurement techniques are concluded in Table 1.

Table 1.
Key parameters for flow measurement techniques.
3. Results and Discussion
3.1. Characterization of the Unforced Flow
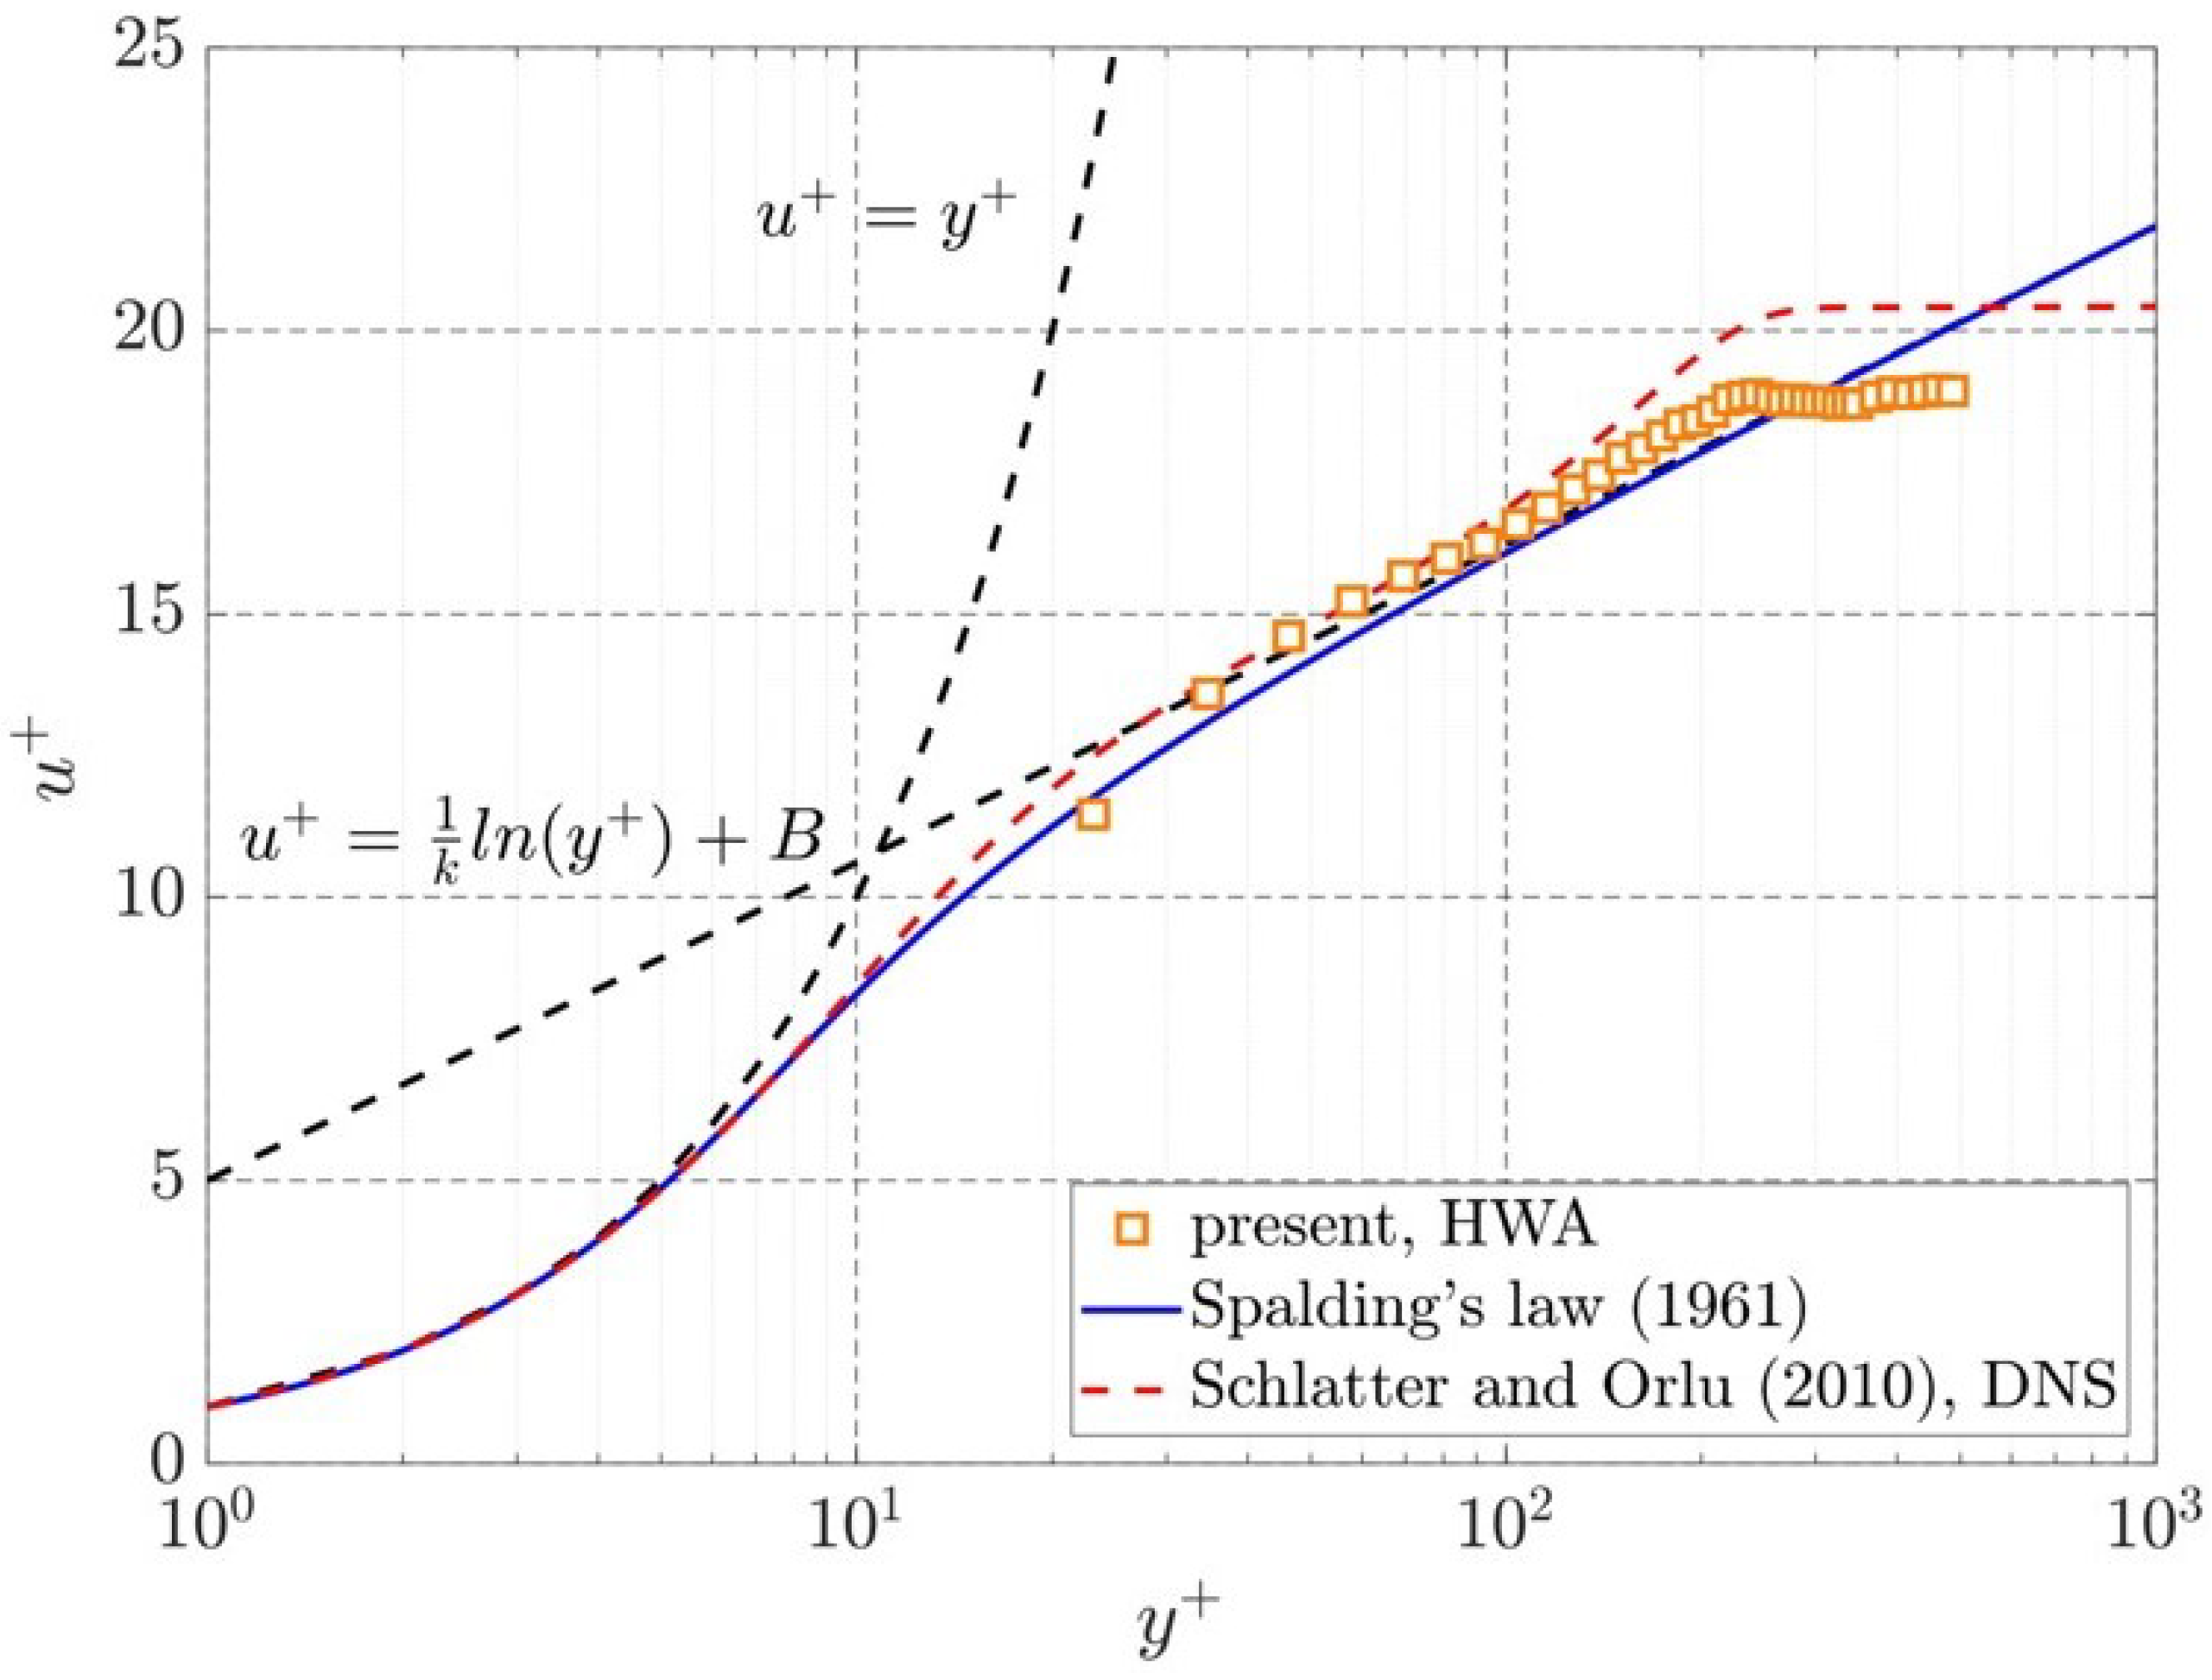
We commence our investigation with an examination of the initial flow boundary layer, which plays a pivotal role in the subsequent flow separation downstream, as highlighted by Hildebrand et al. [53]. The boundary layer profile at the leading edge of the ramp () is carefully measured using the hotwire anemometry coupled with a traverse system, facilitating scanning in the wall-normal direction. Figure 2 illustrates the streamwise velocity profile in the inner scaling region, often referred to as the “law of the wall” region. To provide a comprehensive perspective, we impose the theoretical solution proposed by Spalding [54], utilizing standard parameters and . The non-dimensionalized velocity profiles confirm the turbulent state of the boundary layer, with a logarithmic layer extending to approximately . This boundary layer profile corresponds to a momentum boundary layer thickness of mm, yielding a Reynolds number of based on the momentum thickness. Remarkably, an excellent agreement is observed between the experimental profile and the DNS simulation results at extracted from Schlatter and Örlü [55] under zero pressure gradient conditions. It is noteworthy that due to the minimum distance maintained between the hotwire sensor and the wall ( 1 ), the region below remains unmeasured in the hotwire measurements. Consequently, the viscous sublayer, typically characterized by , can not be resolved from the current hotwire measurement campaign.
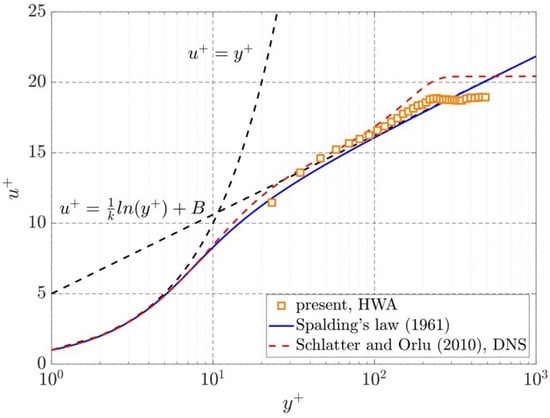
Figure 2.
Boundary layer profile at the leading edge of the ramp and under the unforced case. The theoretical curve from Spalding [54] and the DNS data from [55] at a similar are also presented for a comprehensive comparison.
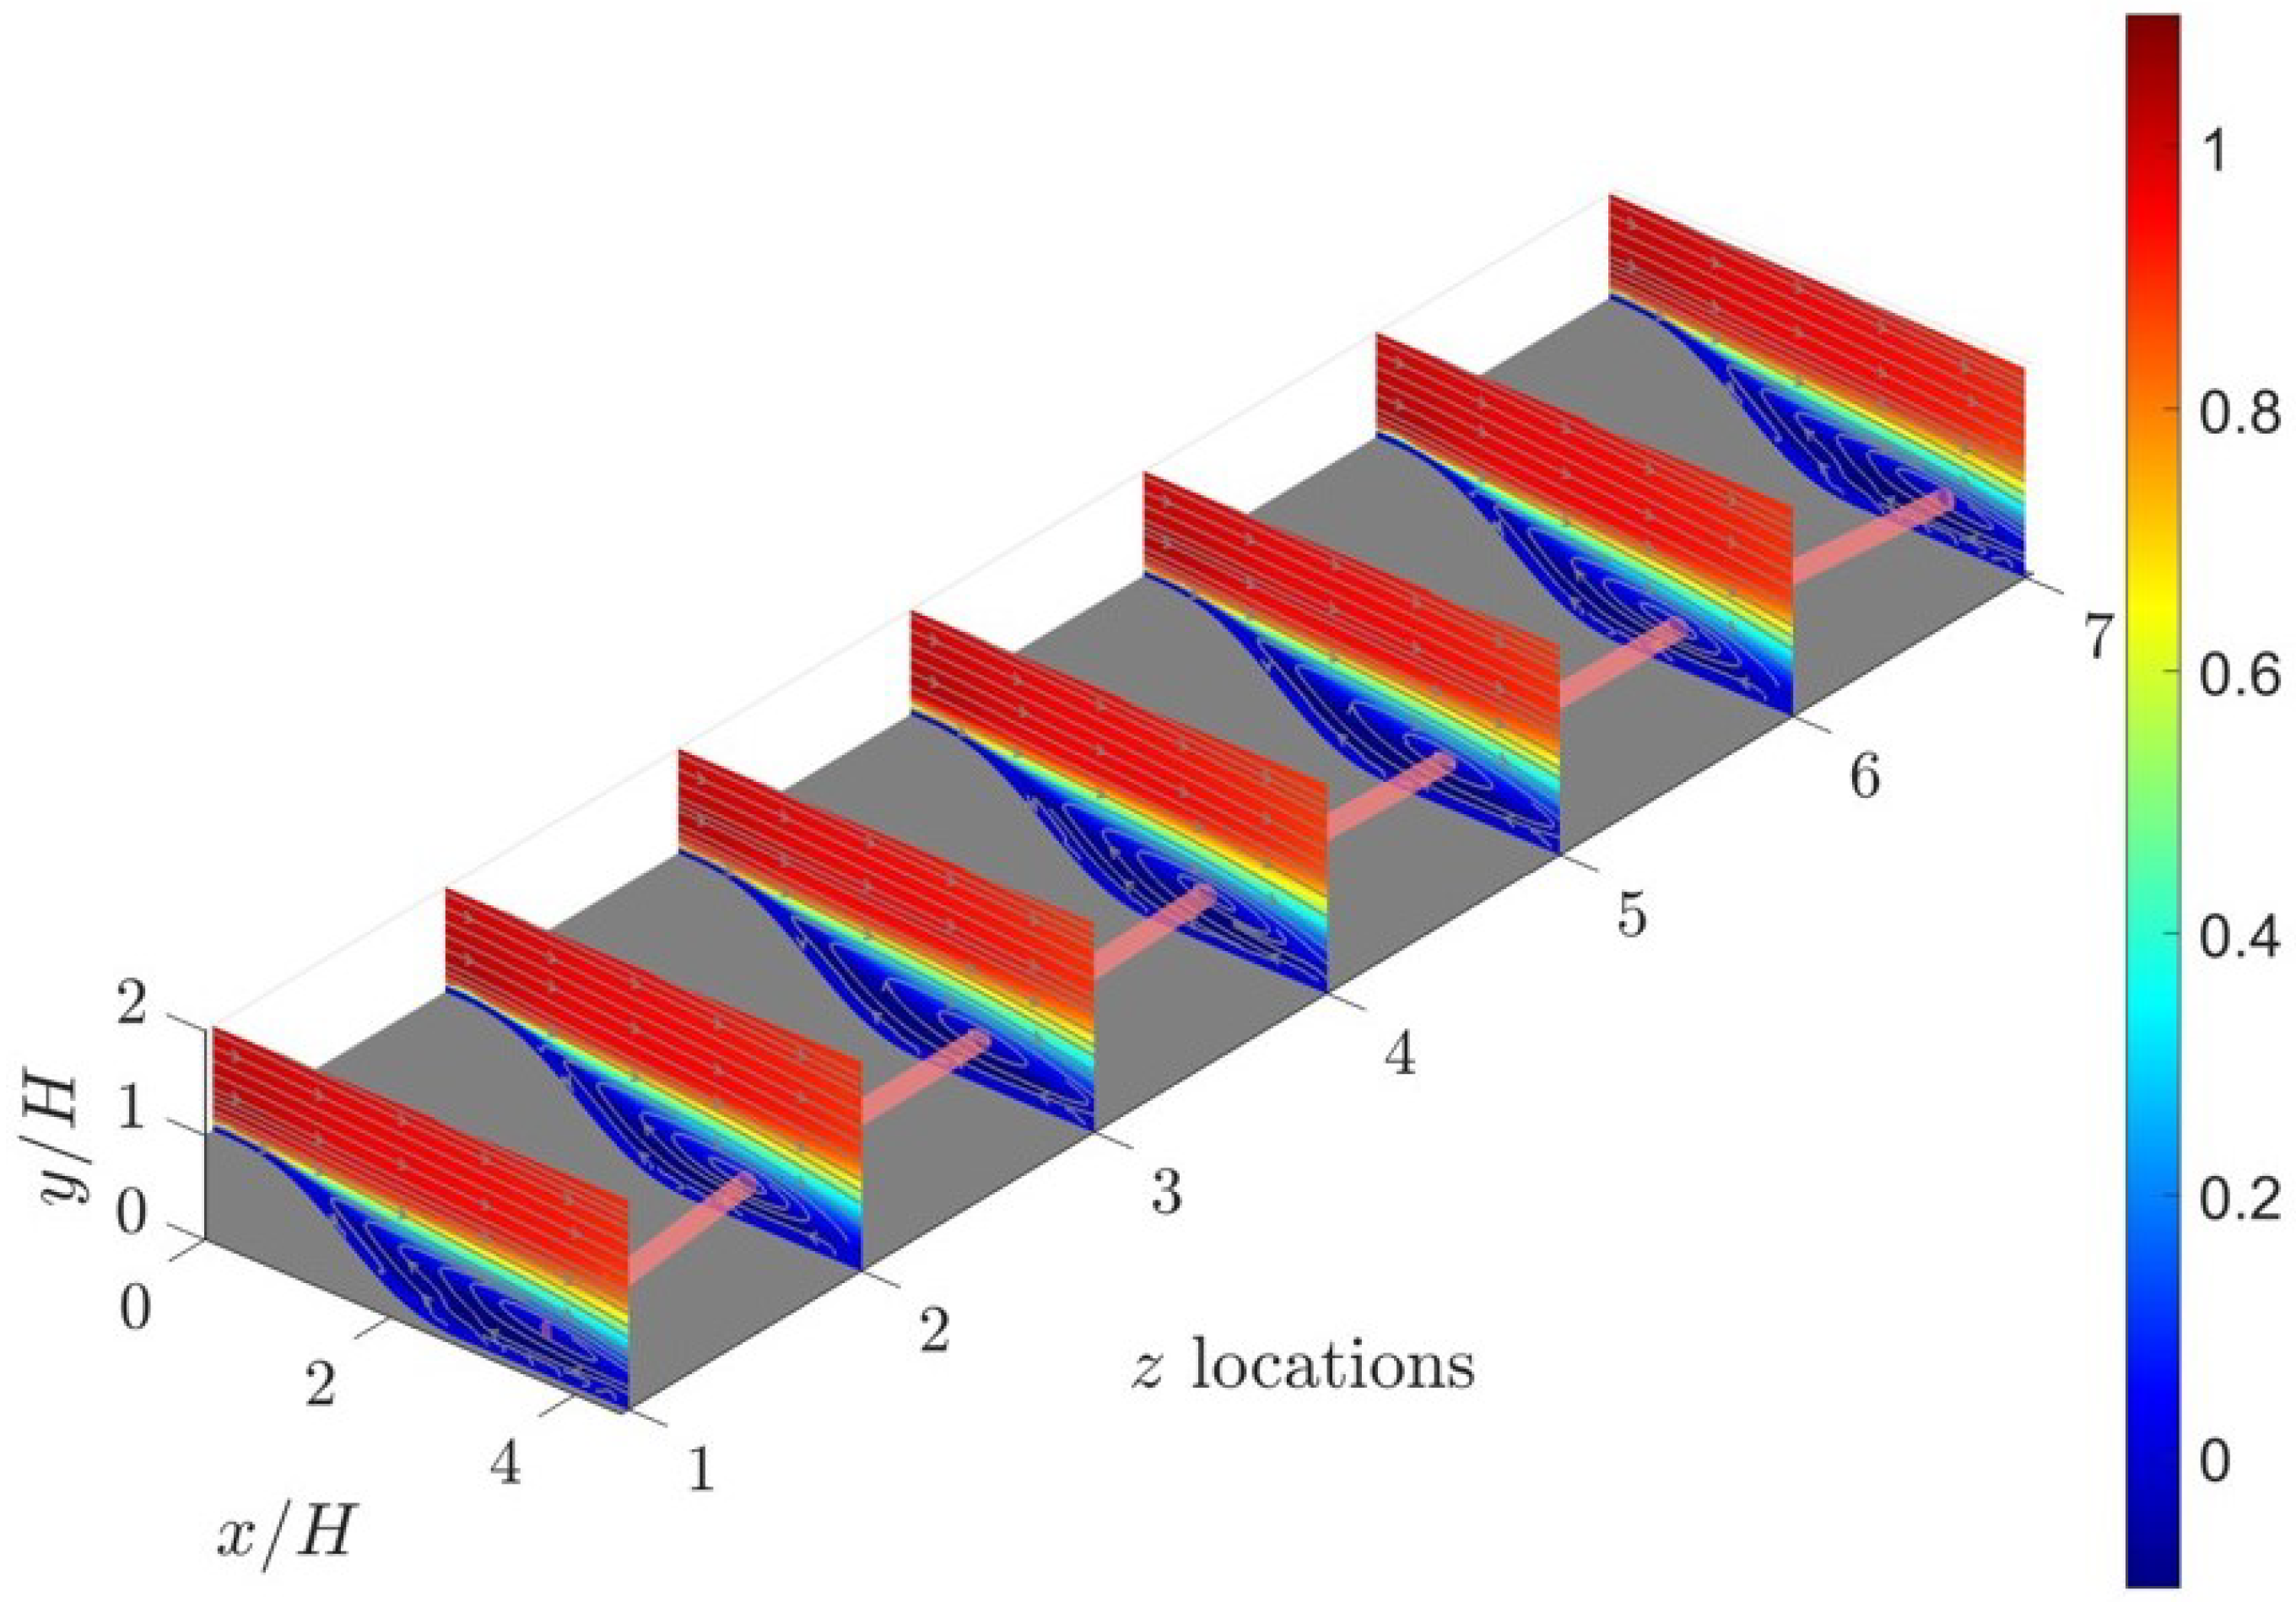
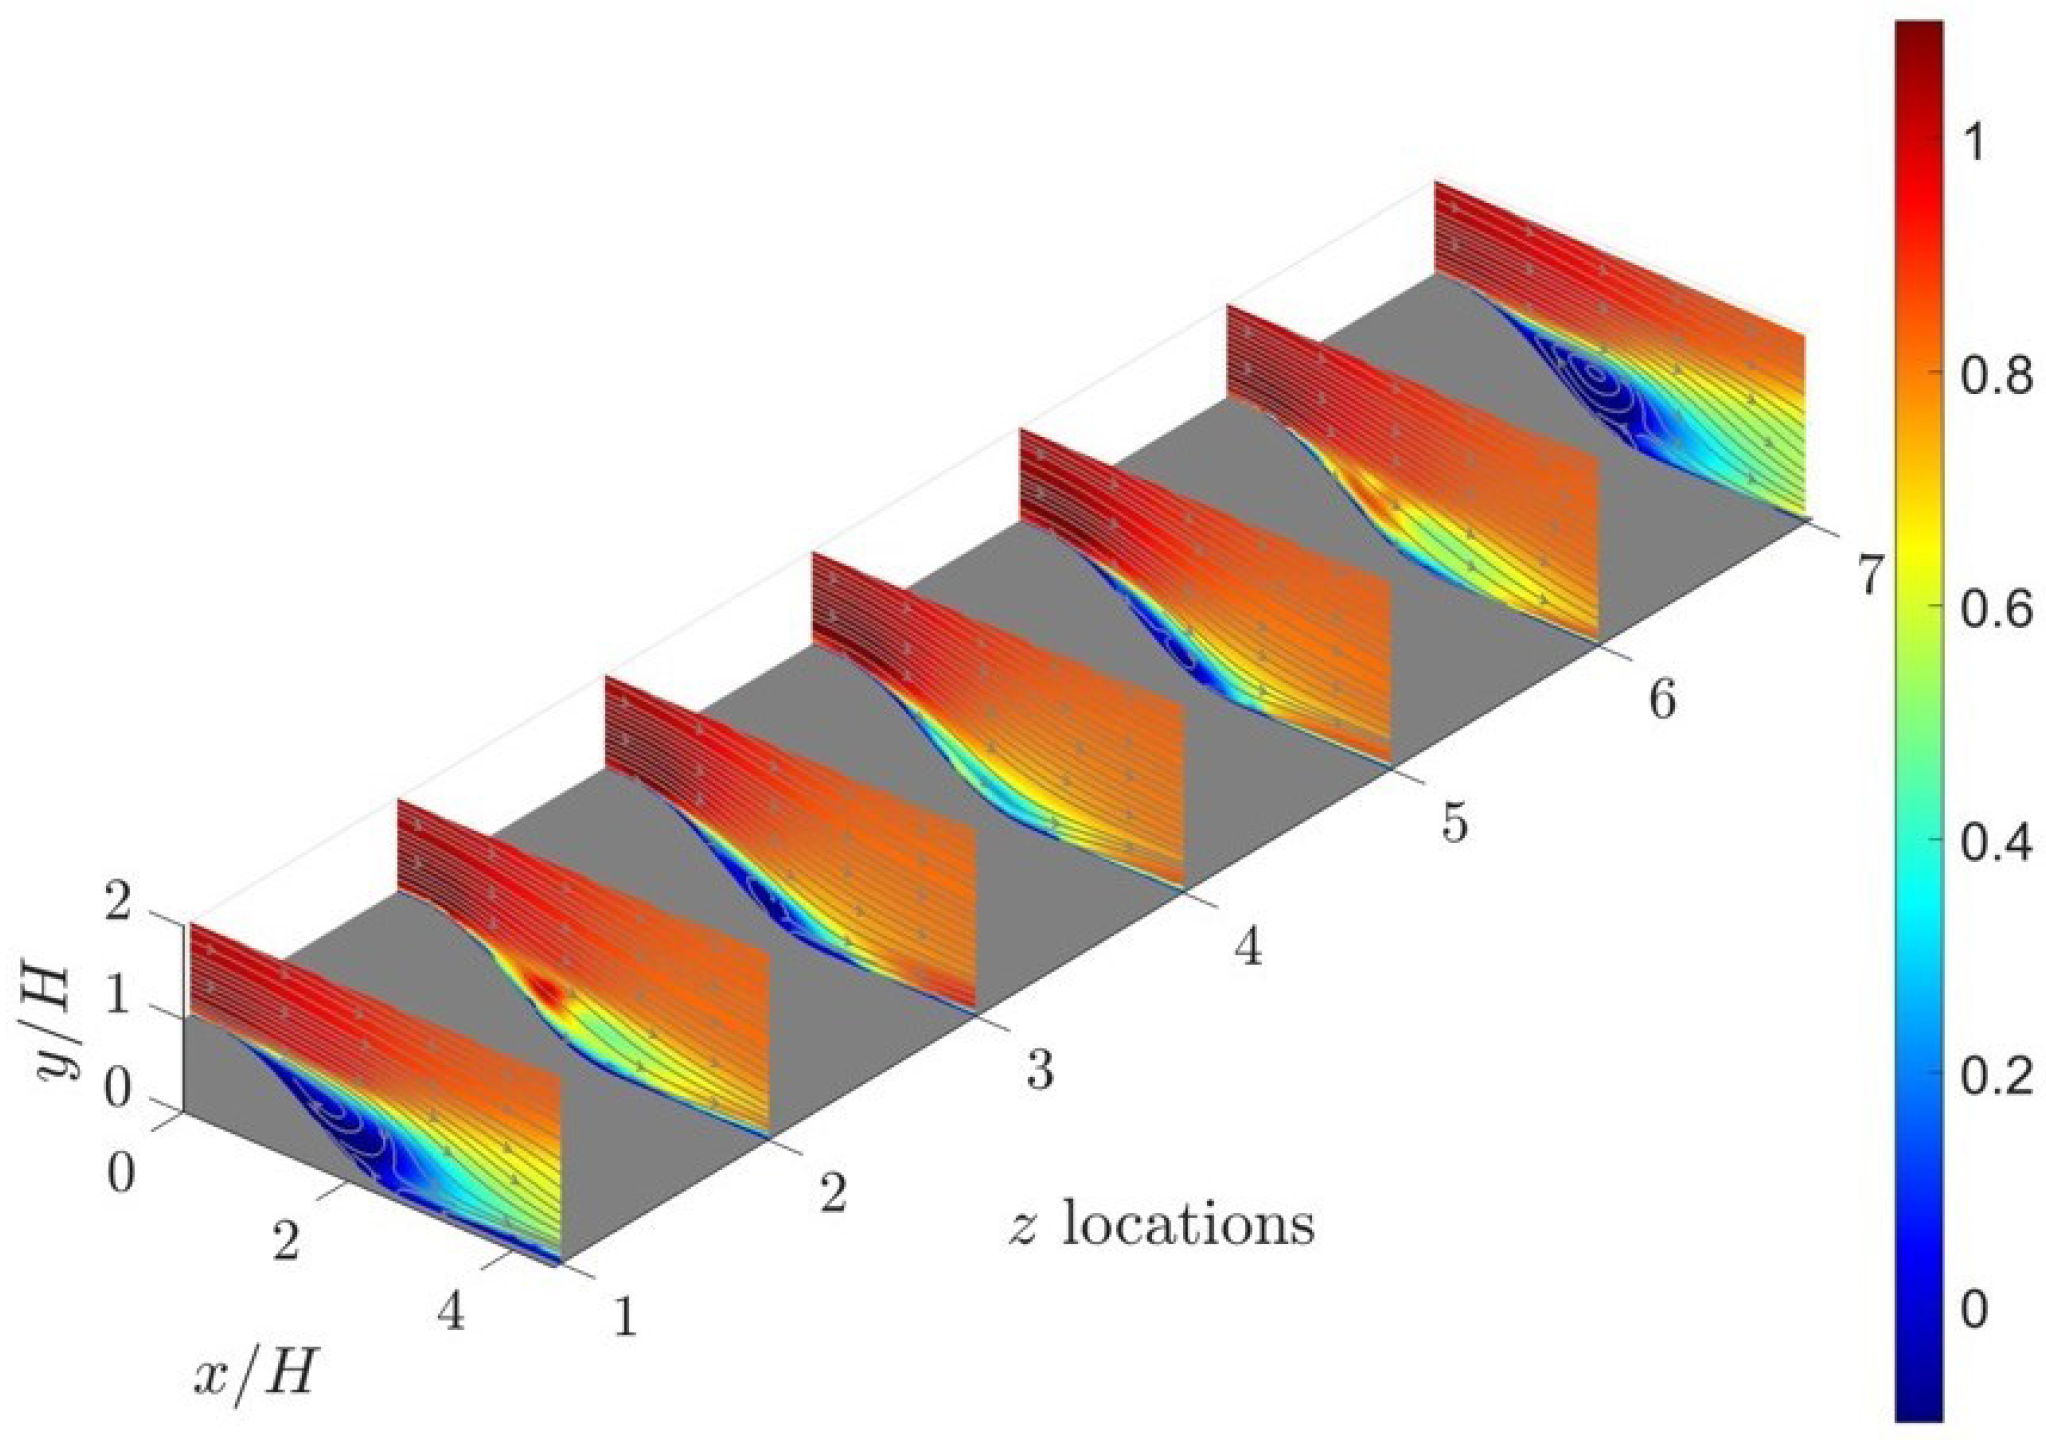
To investigate the flow separation characteristics in the baseline flow, a series of 2D PIV measurements are conducted in this study. Figure 3 offers a comprehensive three-dimensional portrayal of the velocity fields captured at seven equally spaced spanwise locations. These measurement planes are aligned with the positions of the pressure taps in the experimental setup, with a spacing of H between consecutive streamwise measurement planes. In addition to presenting velocity contours, 2D streamlines are superimposed on each measurement plane to visualize flow separation and recirculation phenomena. Notable similarities are evident across these planar velocity profiles, including the expansion of shear layers and the occurrence of flow recirculation. To capture the vortex core within the recirculation region, a vortex identification method proposed by Graftieaux et al. [56] is employed to extract the core locations on all measurement planes. These core locations are then connected by a red thick tube in the figure. The distribution of vortex cores exhibits strong symmetry about , with the locations of vortex cores shifting further downstream as the measurement planes approach the side walls.

Figure 3.
Streamwise velocity contours and the superpositioned 2D streamlines measured at 7 spanwise locations with particle image velocimetry (PIV). The spanwise planes are aligned with the locations of the pressure taps. The z locations 1 to 7 correspond to −1.8, 1.2, 0.6, 0, 0.6, 1.2, and 1.8, respectively. The red tube connects the vortex core locations on each measurement plane.
In addition, we investigate the turbulence characteristics of the unforced flow using proper orthogonal decomposition (POD, [57]) applied to the recorded velocity snapshots. Due to strong similarities among spanwise directions, we focus on presenting results from velocity snapshots measured along the centerline of the model (). Following the snapshot version of POD [58], where each velocity snapshot at time instance is expanded as the ensemble-averaged mean velocity plus the linear combinations of orthonormal basis functions and the corresponding modal coefficients :
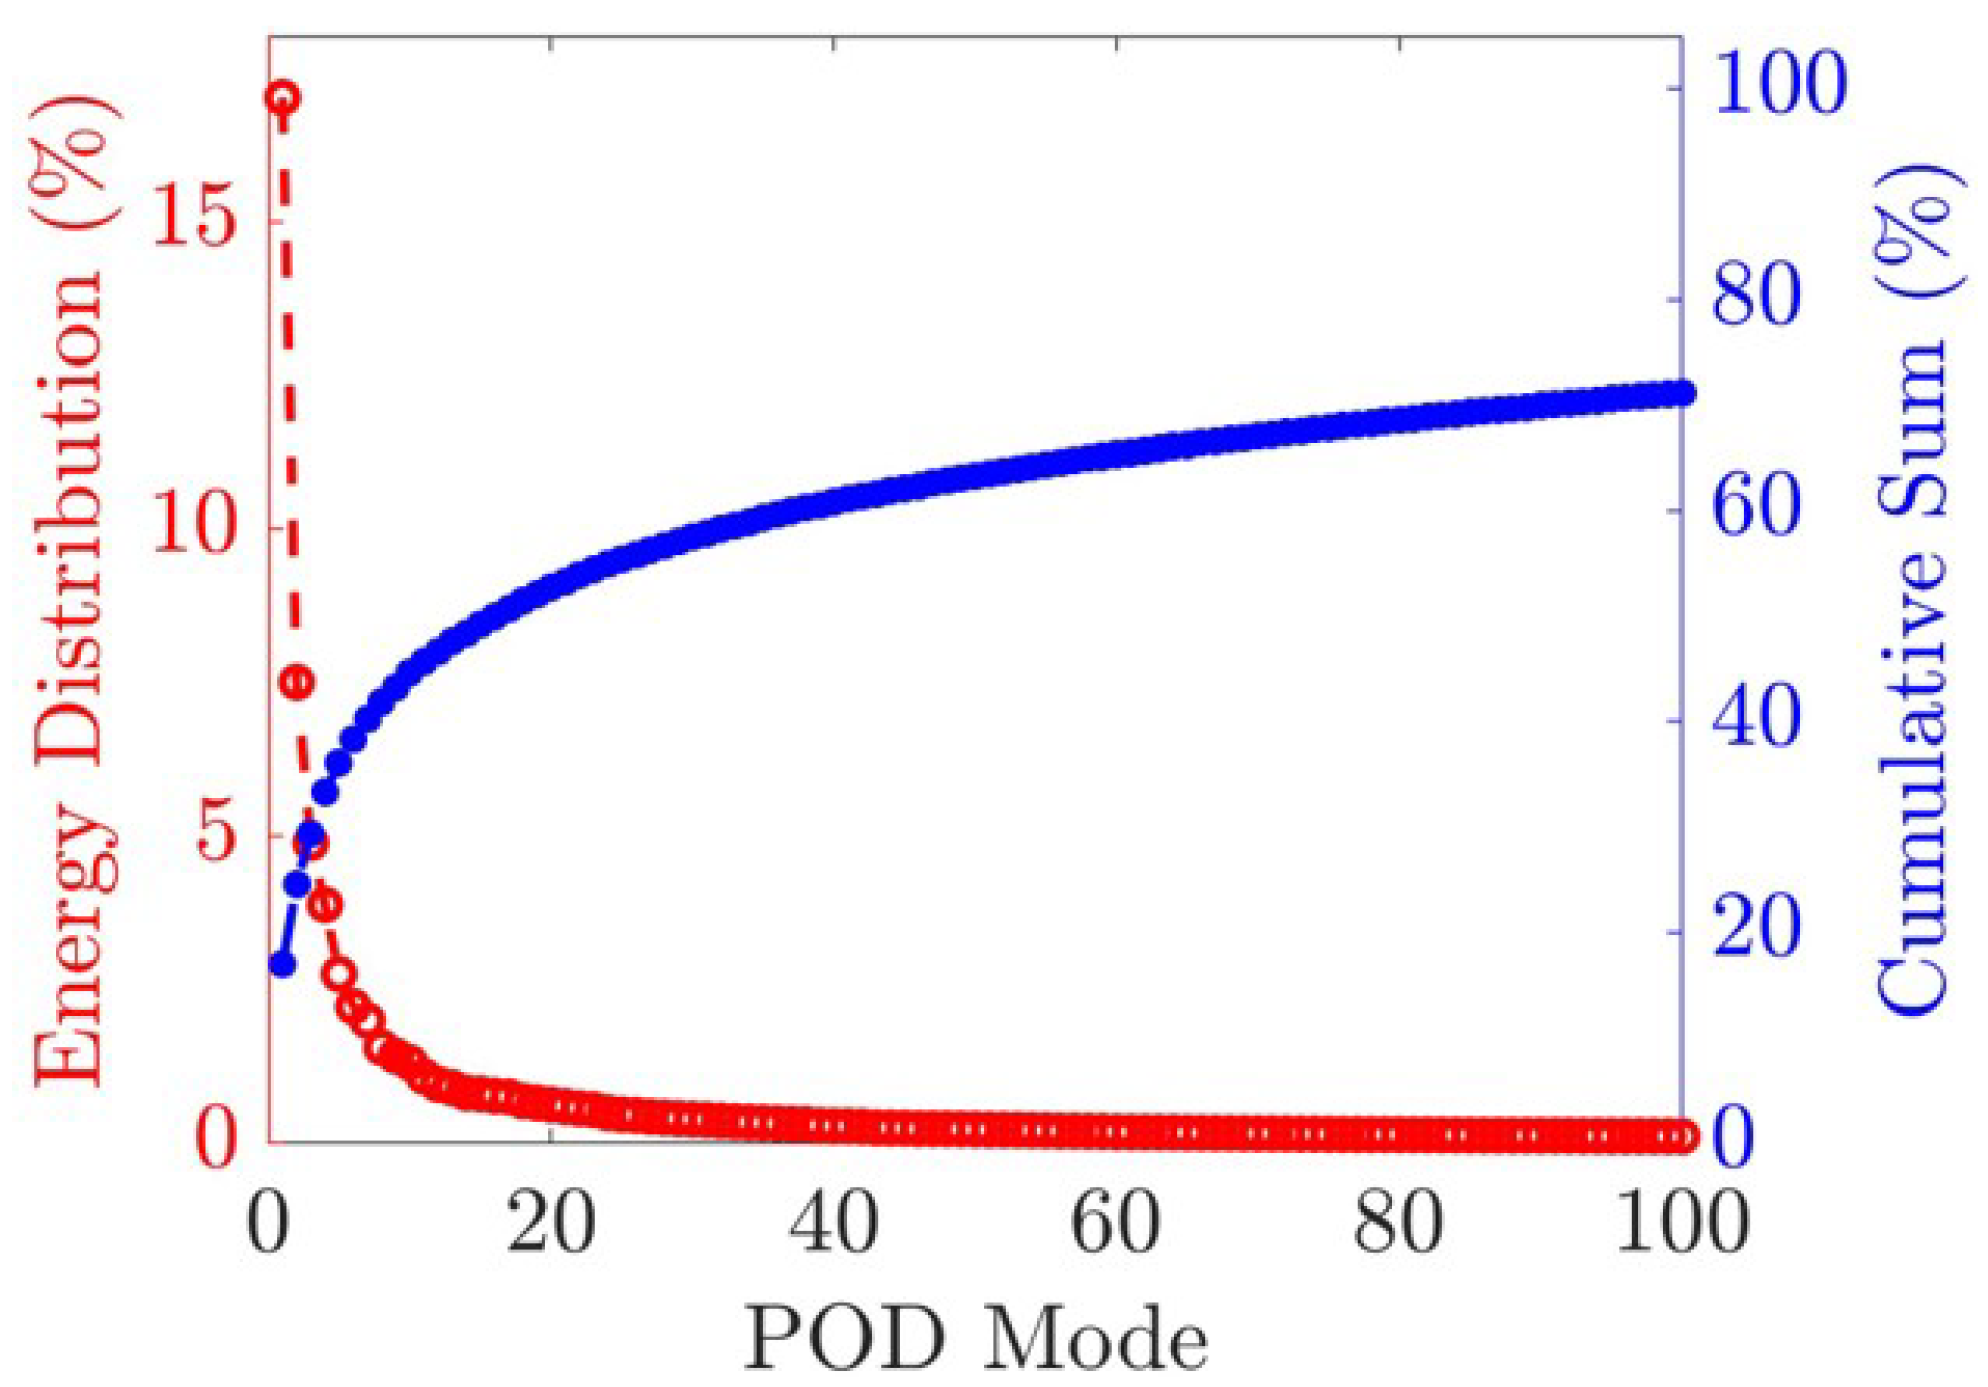
Here, m denotes the m-th POD mode, and M represents the truncation of the leading POD modes. The contribution of the first 100 POD modes to the turbulent kinetic energy, as well as the cumulative sum, are presented in Figure 4. Notably, the first POD mode captures approximately 17% of the turbulent kinetic energy (TKE), while the second and third POD modes contribute only 7.5% and 5% of the TKE, respectively. Similar observations are reported in prior studies such as Kourta and Gilliéron [9] for a straight ramp profile and Thacker et al. [59] for the rear slant of an Ahmed body.
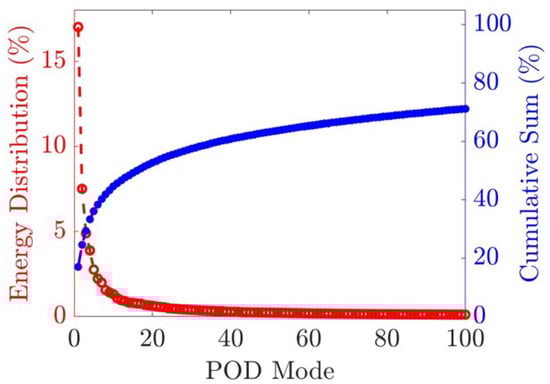
Figure 4.
Energy distribution of the first 100 proper orthogonal decomposition (POD) modes (red) and the cumulative sum (blue).
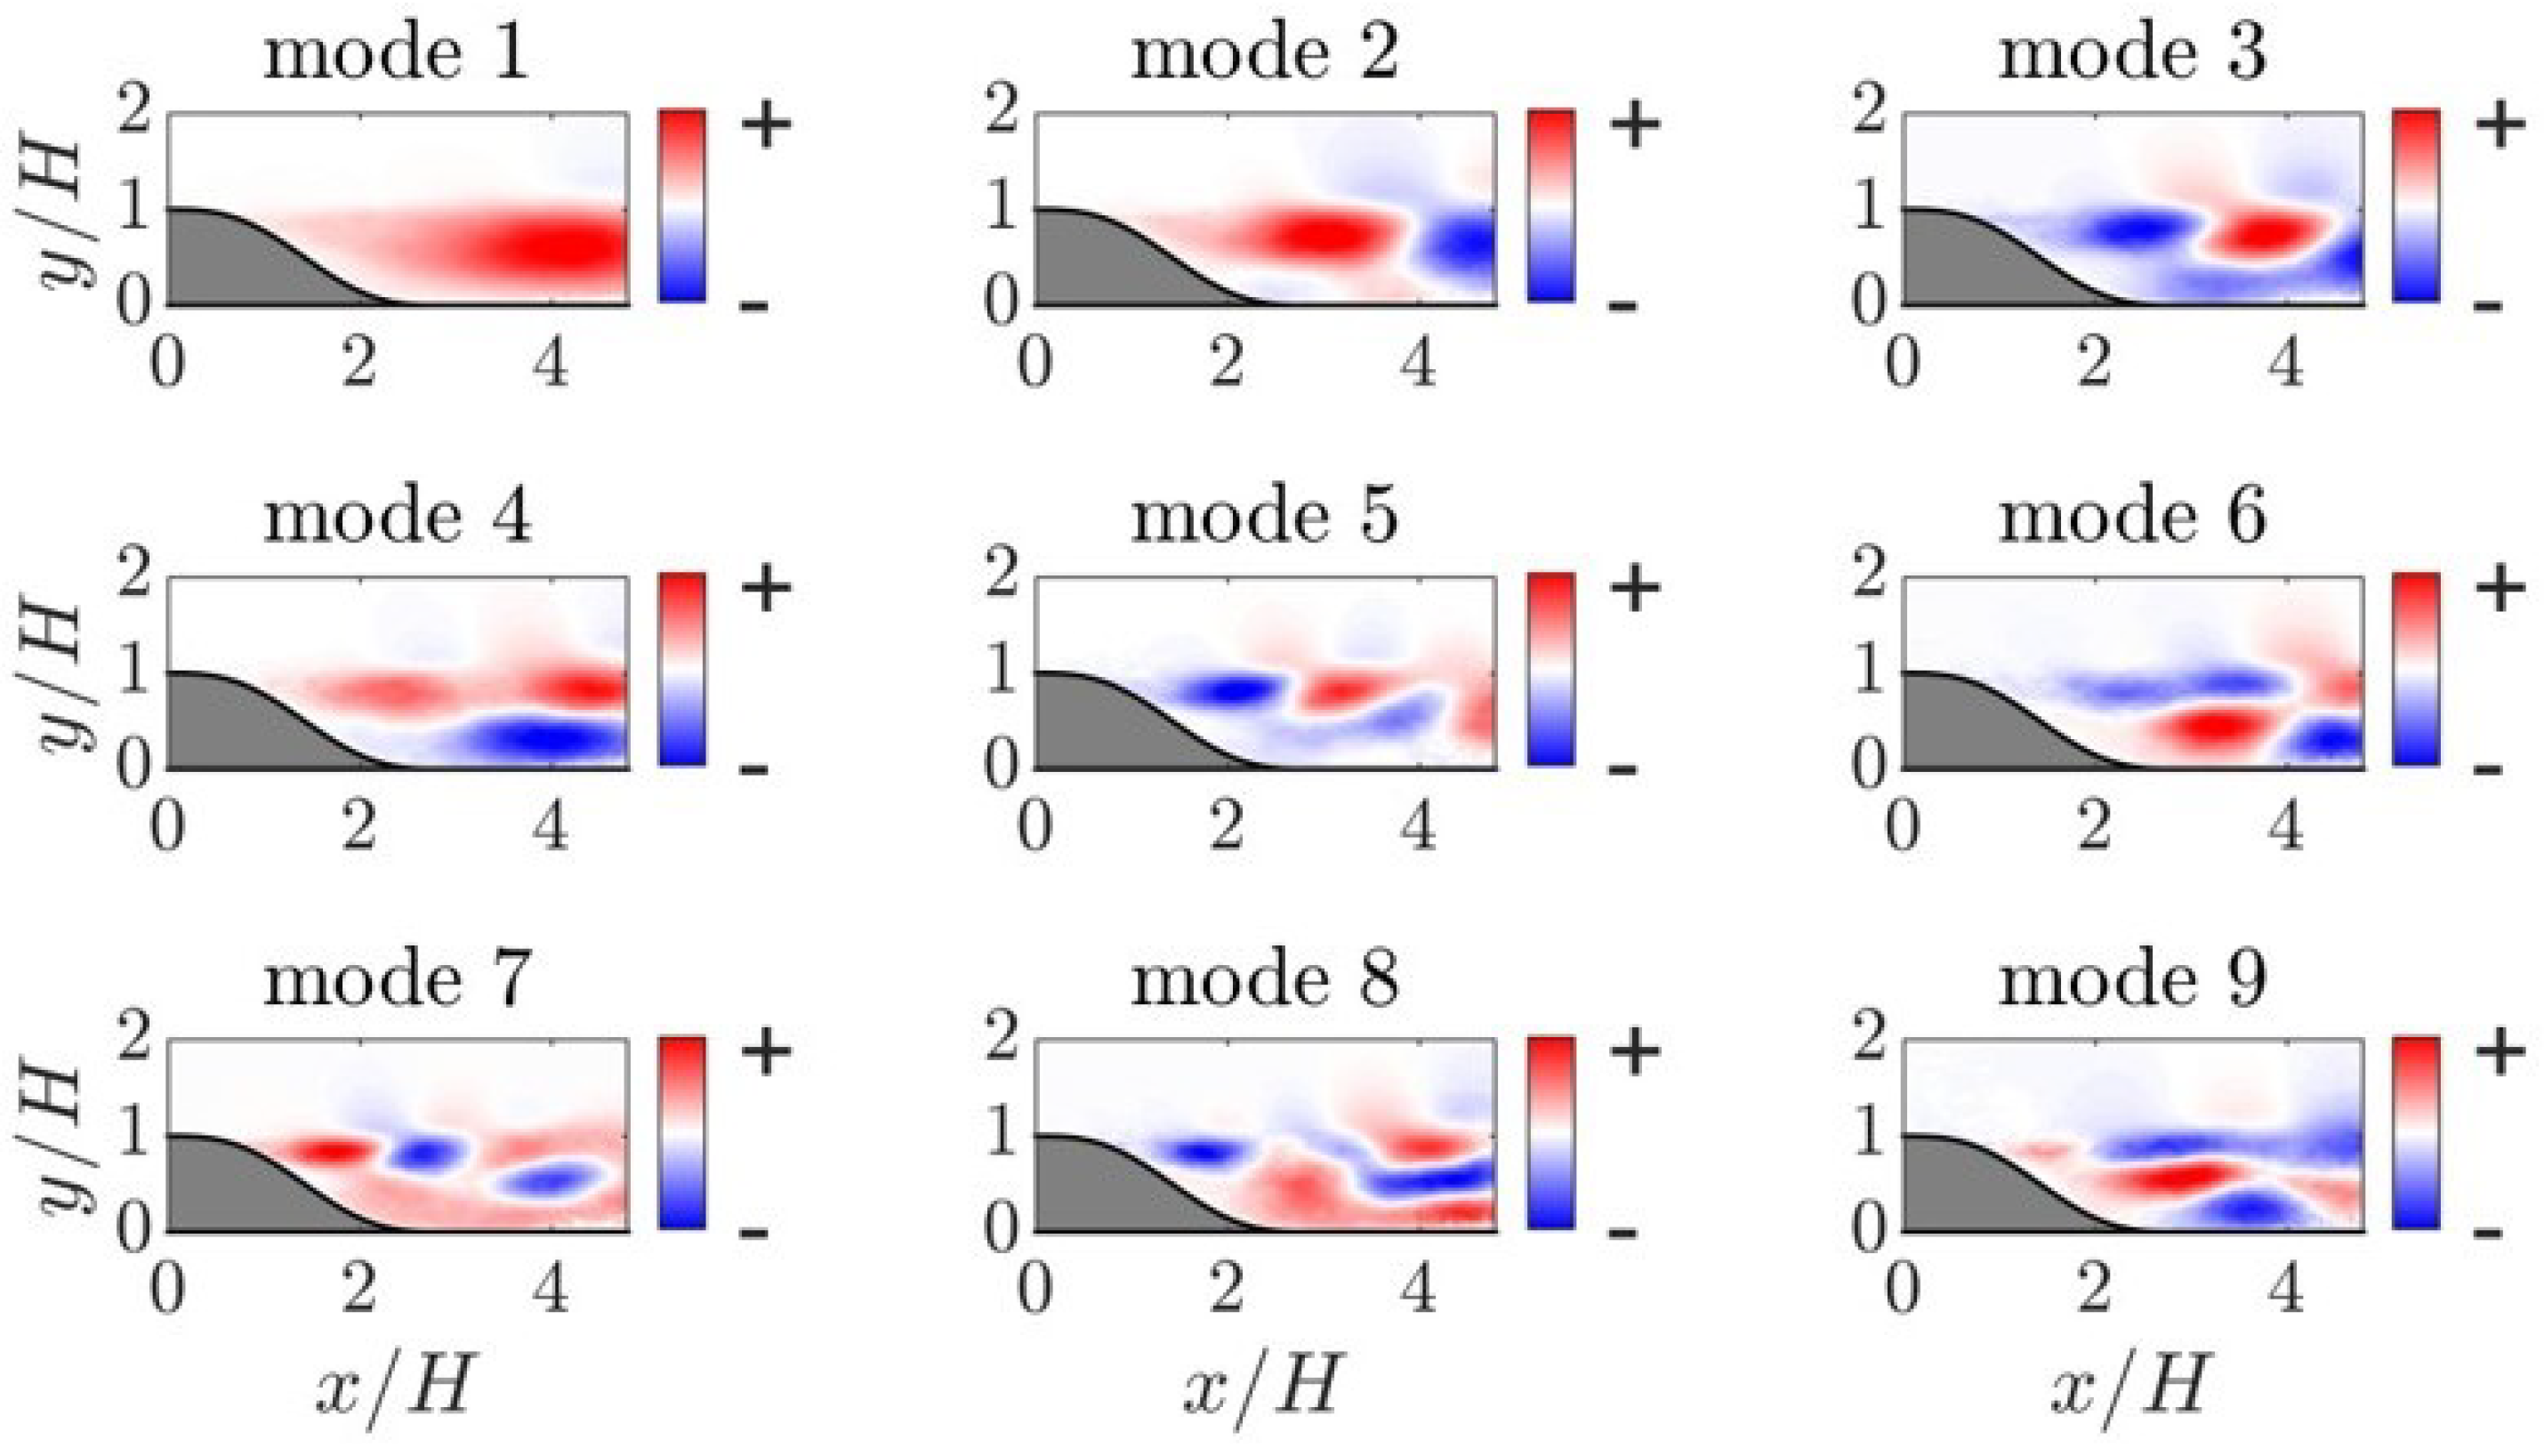
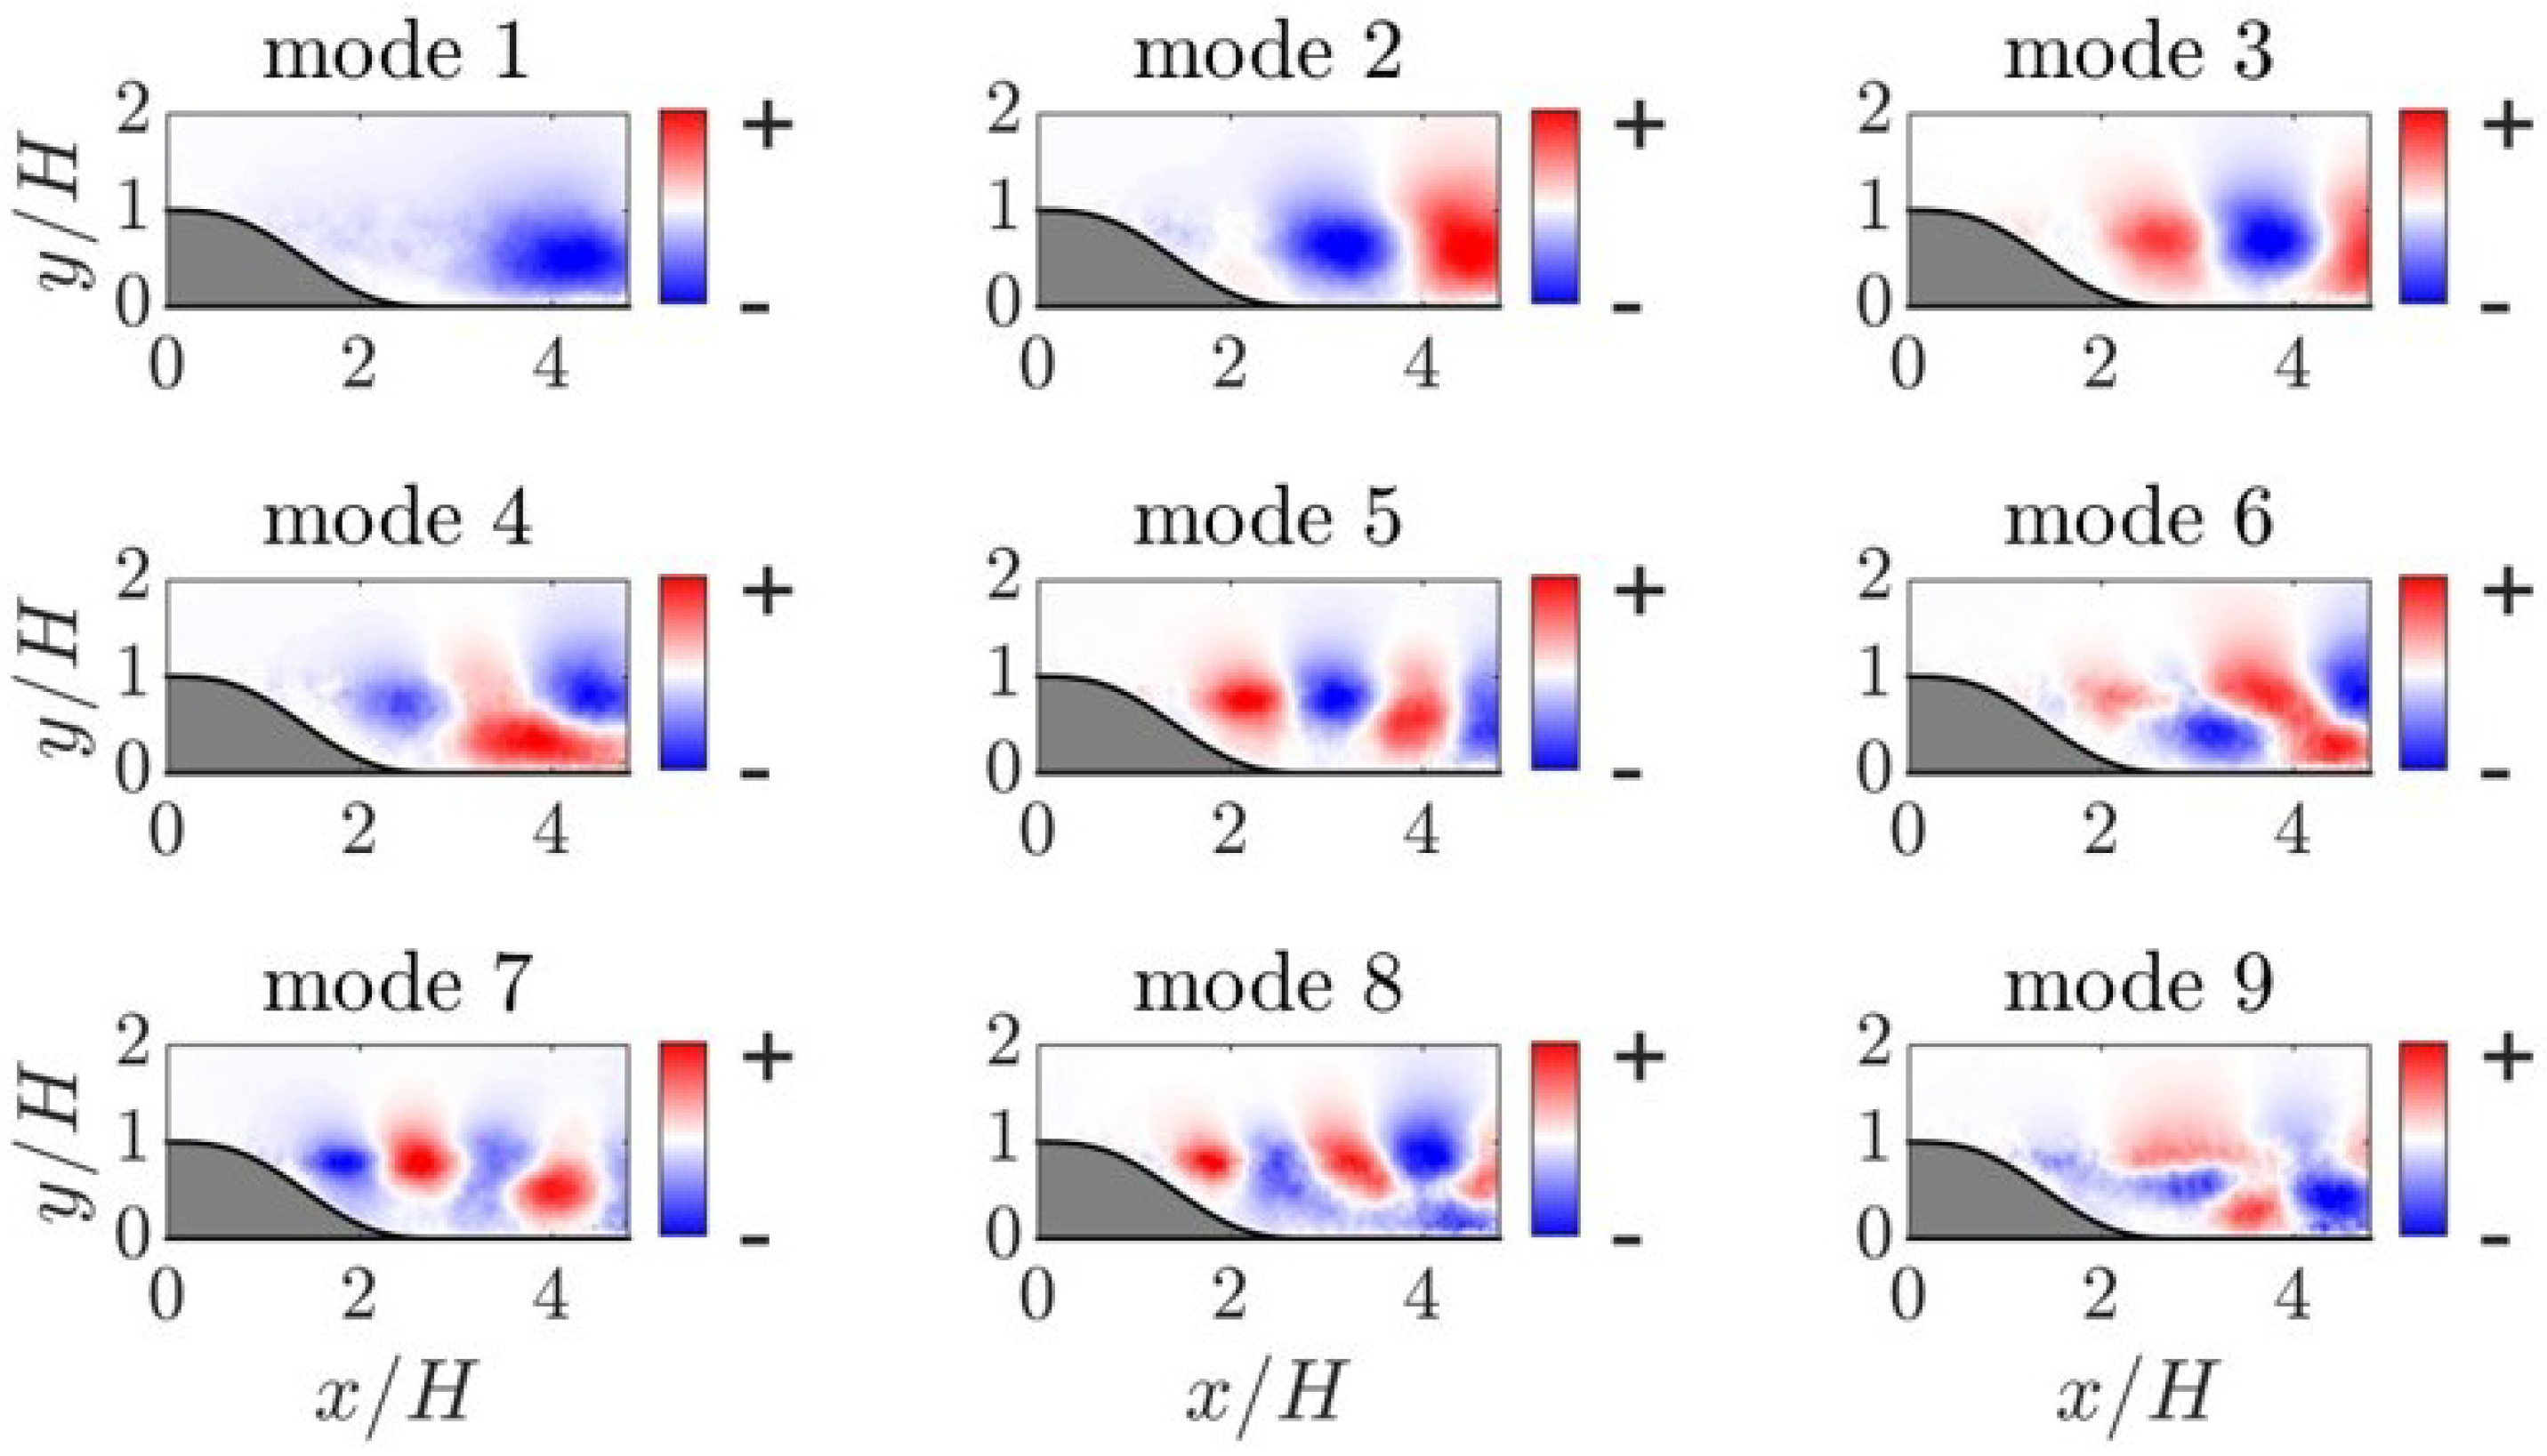
Figure 5 and Figure 6 illustrate the streamwise and wall-normal components of the first nine POD modes. The first POD mode captures large-scale fluctuations inside the recirculation region, as extensively discussed in Kourta et al. [39]. In their work, they demonstrated that a low-order reconstruction combining the mean velocity and the first POD mode reveals the flapping motion of the recirculation region. Modes 2 and 3 depict a pair of wave-like turbulent structures in the flow, representing turbulence convection at two orthogonal phases. These modes exhibit the largest-scale turbulent structures primarily residing within the shear layer. Higher-order modes also feature alternating positive/negative structures within the shear layer, albeit with smaller turbulent structures. These turbulent mechanisms, including the vertical flapping motion of the recirculation region and the downstream convection of large-scale coherent structures inside the separated shear layer, align closely with discussions in previous studies such as Cherry et al. [60], Kiya and Sasaki [61], Largeau and Moriniere [62].

Figure 5.
The streamwise component of the leading proper orthogonal decomposition (POD) modes.
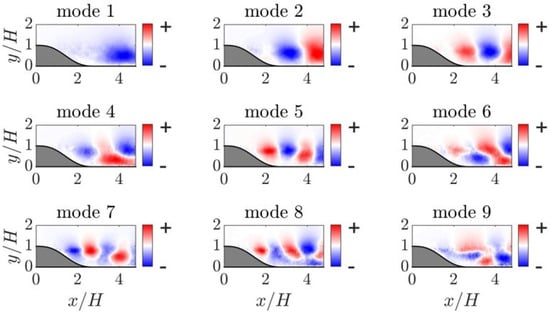
Figure 6.
The wall-normal component of the leading proper orthogonal decomposition (POD) modes.
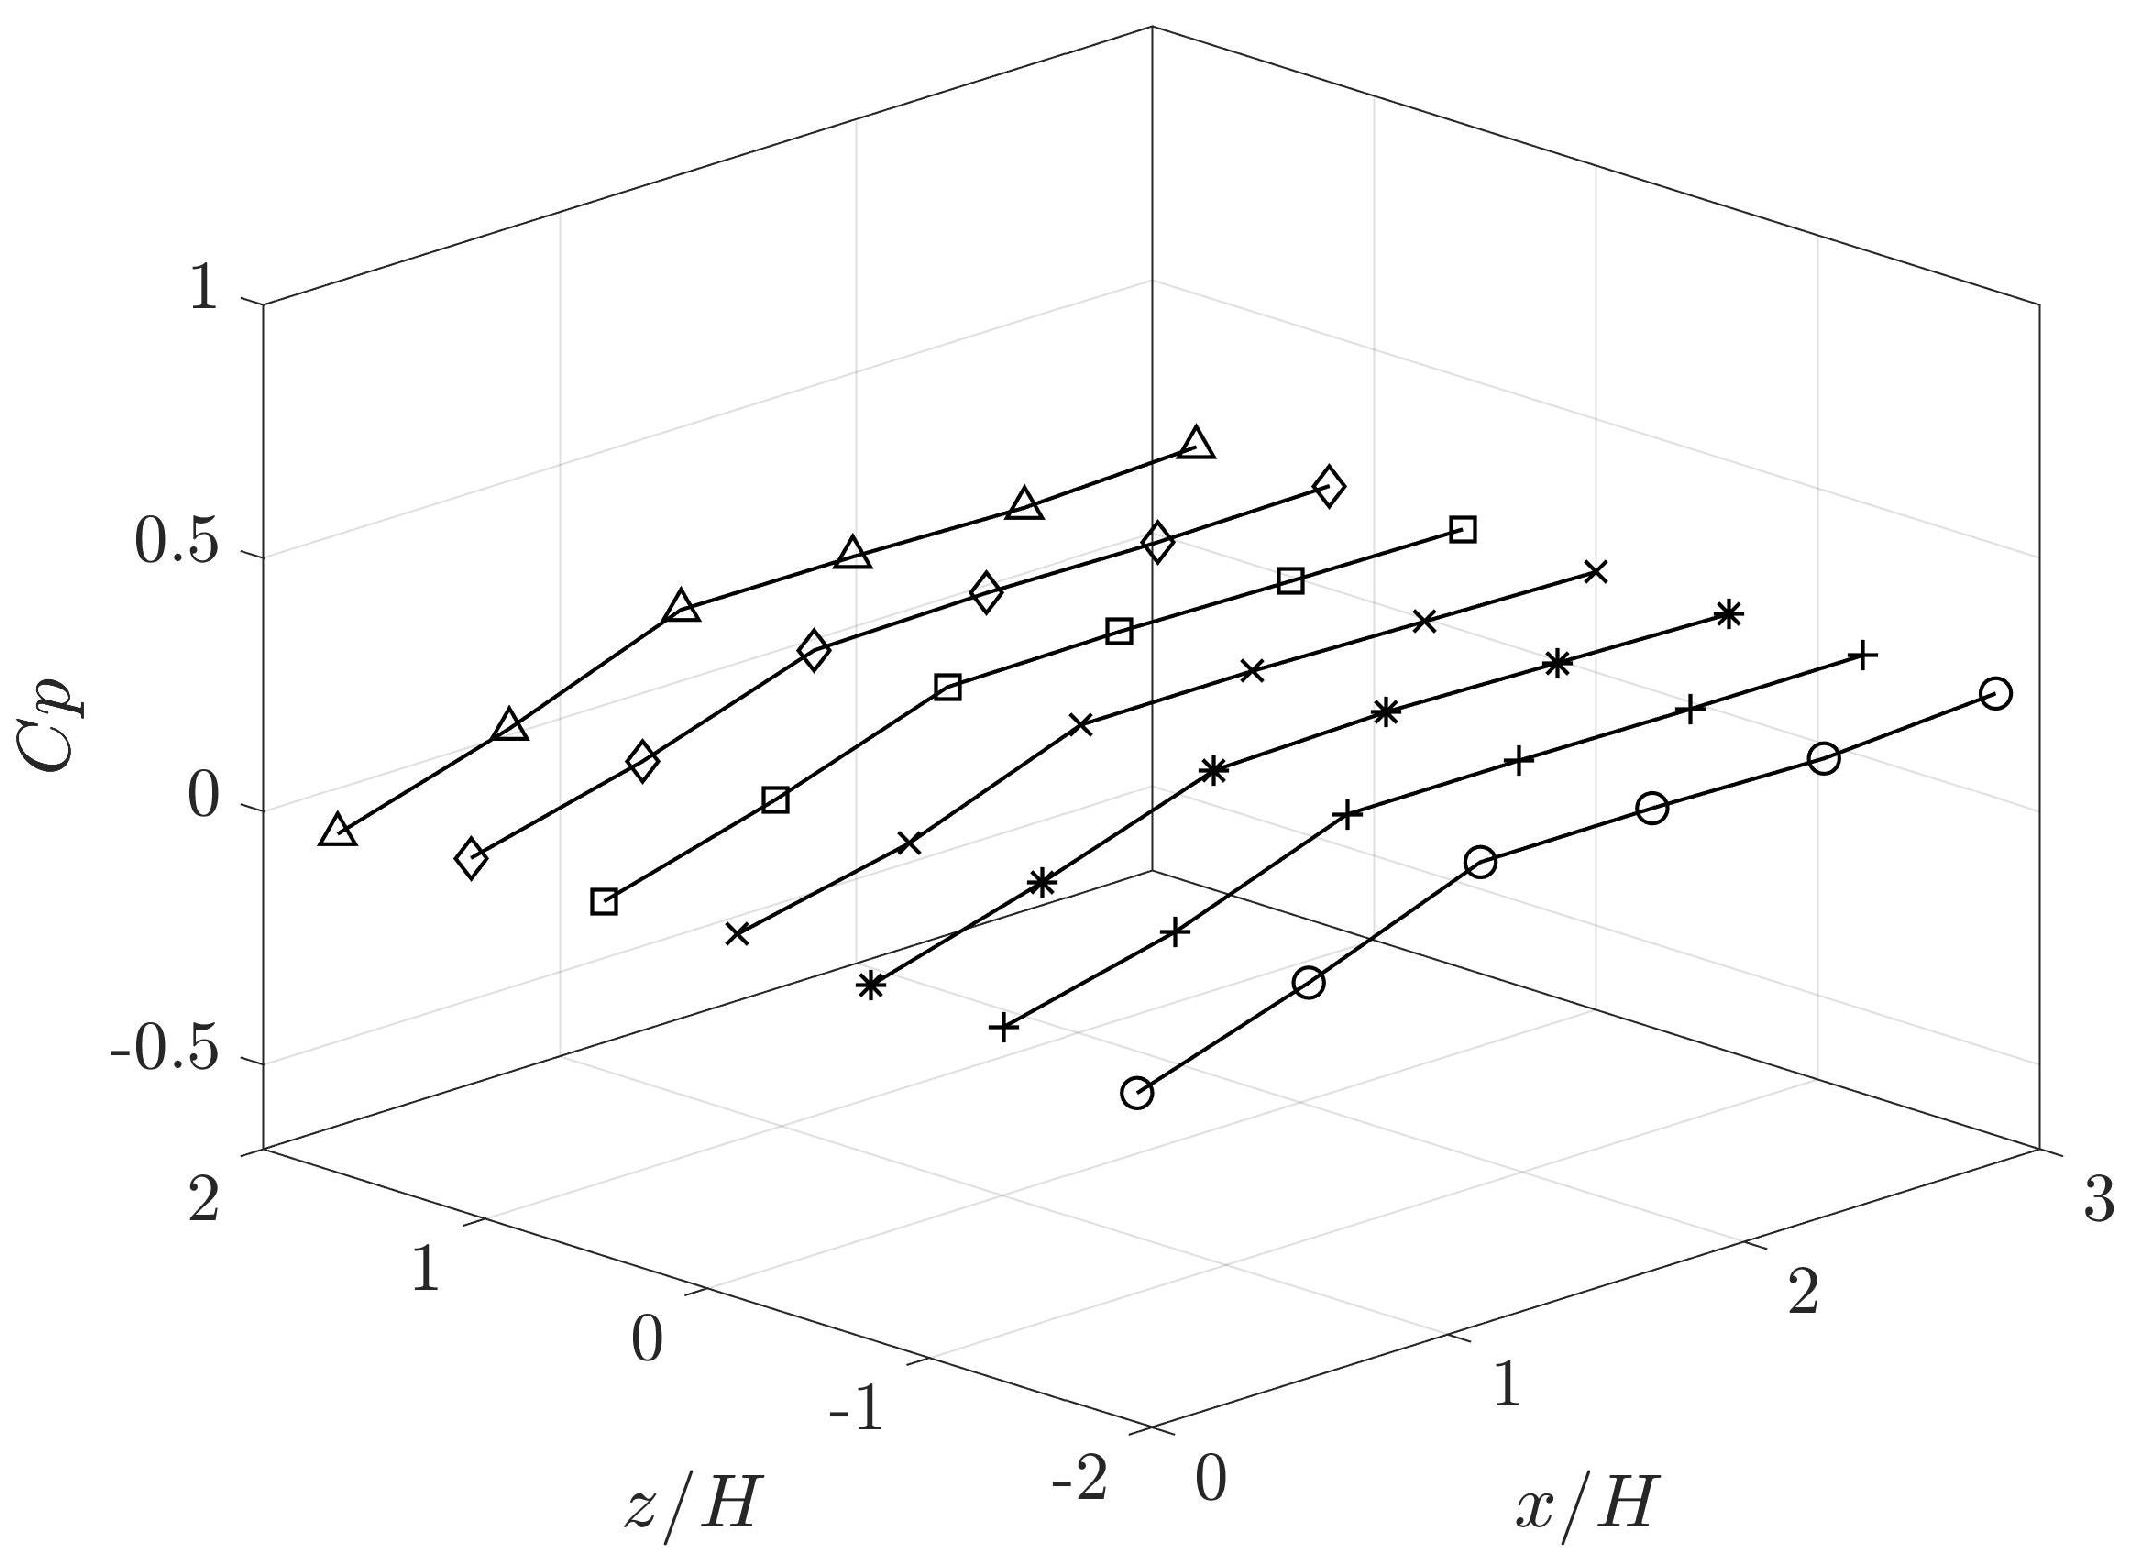
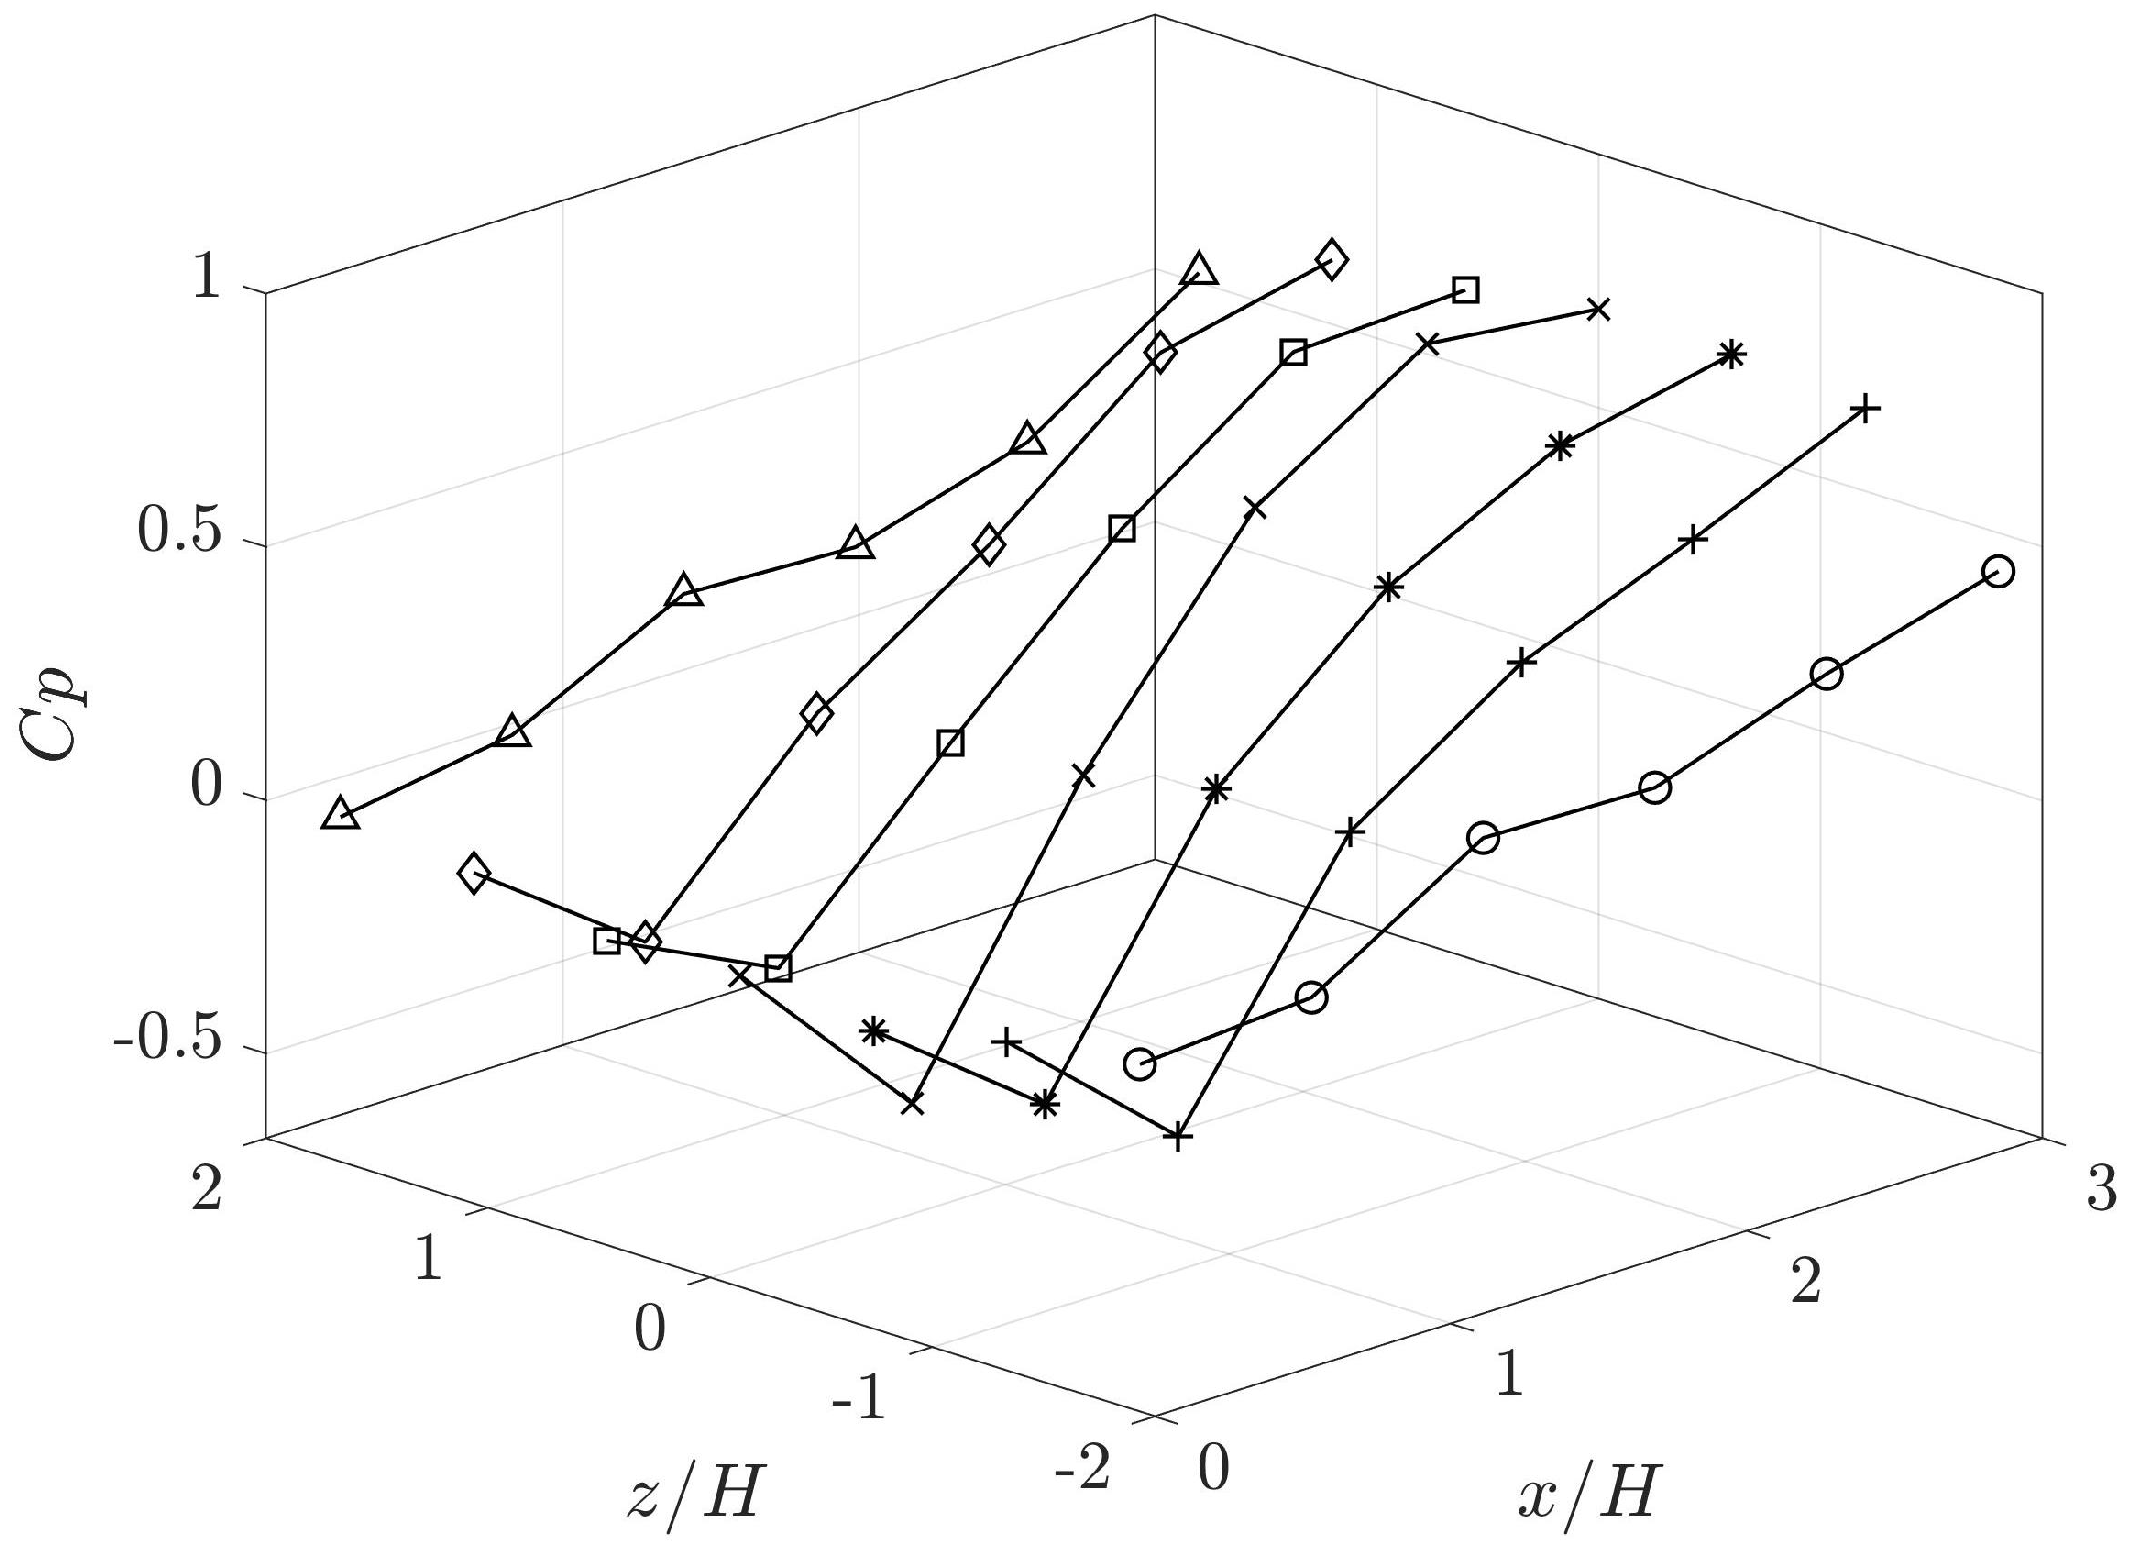
The pressure coefficient () profiles on the uniformly distributed pressure taps on the ramp surface are depicted in Figure 7. Notably, there are strong similarities observed in the pressure profiles across all measured spanwise locations. Near the ramp leading edge, the pressure coefficients remain close to 0 across all spanwise positions. Moving downstream of the ramp, the pressure gradually increases, reaching its maximum value () between and . With the implementation of hybrid passive and active actuators aimed at reducing pressure separation on the ramp, further enhancement of the downstream surface pressure is anticipated.
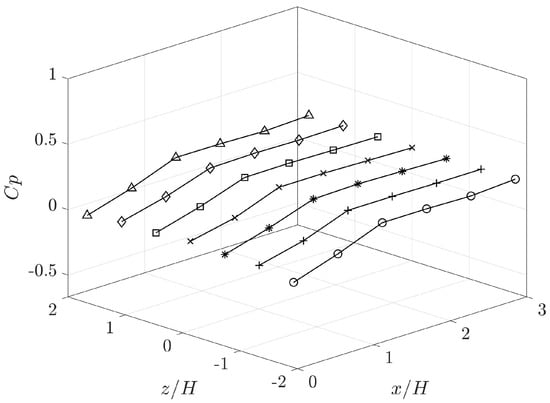
Figure 7.
Pressure distribution on the ramp surface under the unforced case. Different symbol lines represent different spanwise locations.
3.2. Parametric Study on Hybrid Passive–Active Actuators for Ramp Separation Control
This subsection delves into the parametric study of flow control outcomes using a hybrid actuator matrix within our experimental platform. We explore a total of 120 parametric actuation control configurations to assess their impact on pressure recovery along the ramp surface. These configurations consist of 60 purely passive and 60 passive + active control commands. Furthermore, we compare the pressure distribution and flow fields on various streamwise planes with those of the unforced case.
Figure 8 depicts the results of the parametric study conducted under purely passive actuation of the actuators. The parametric configurations are systematically arranged to ensure uniform operation within each spanwise row. We evaluate the effectiveness of single-row, double-row, …, to all-row actuations, yielding a total of 15 distinct actuation arrangements. Each arrangement is tested with the selected rows, highlighted in red, positioned at four different heights ( 2 , 4 , 6 , 8 ), resulting in a total of 60 test cases. As outlined in Section 2.2, a negative cost function signifies improved pressure recovery on the ramp surface, while a positive indicates increased pressure loss. Among the single-row actuation scenarios, activating the second row at a height of 8 emerges as the most effective flow control strategy, leading to a remarkable 36% pressure recovery compared to the unforced case. Conversely, activating the first row results in signified pressure loss as the actuator height increases. In other single-row instances, actuation patterns yield negligible flow control enhancements. Interestingly, similar trends are observed in multi-row actuation results. Initiating flow control with the second row consistently yields improved performance as actuator height increases. Conversely, incorporating the first row leads to progressively poorer outcomes with increasing height. Actuating downstream rows, excluding the first and second, has minimal impact on flow control performance across all cases. Optimal flow control performance is achieved when the second and third rows are raised to the maximum height of 8 . Under this configuration, purely passive devices effectively mitigate flow separation and enhance ramp surface pressure recovery by 43% compared to the unforced case.
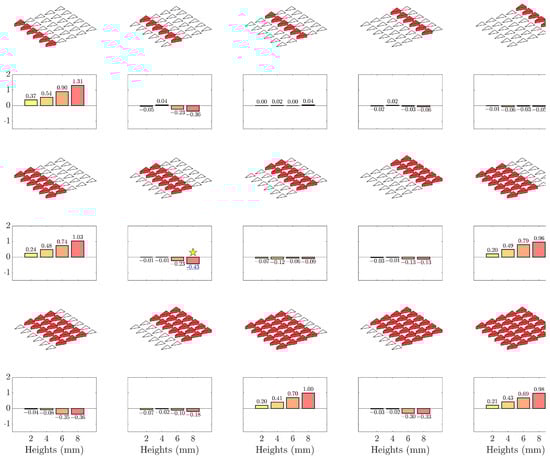
Figure 8.
The parametric results of different purely passive control laws from the actuator matrix. The activated hybrid actuators are denoted in red. For each arrangement, flow control outcome at 4 different actuator heights are evaluated. The best flow control result is denoted by a yellow star in the figure.
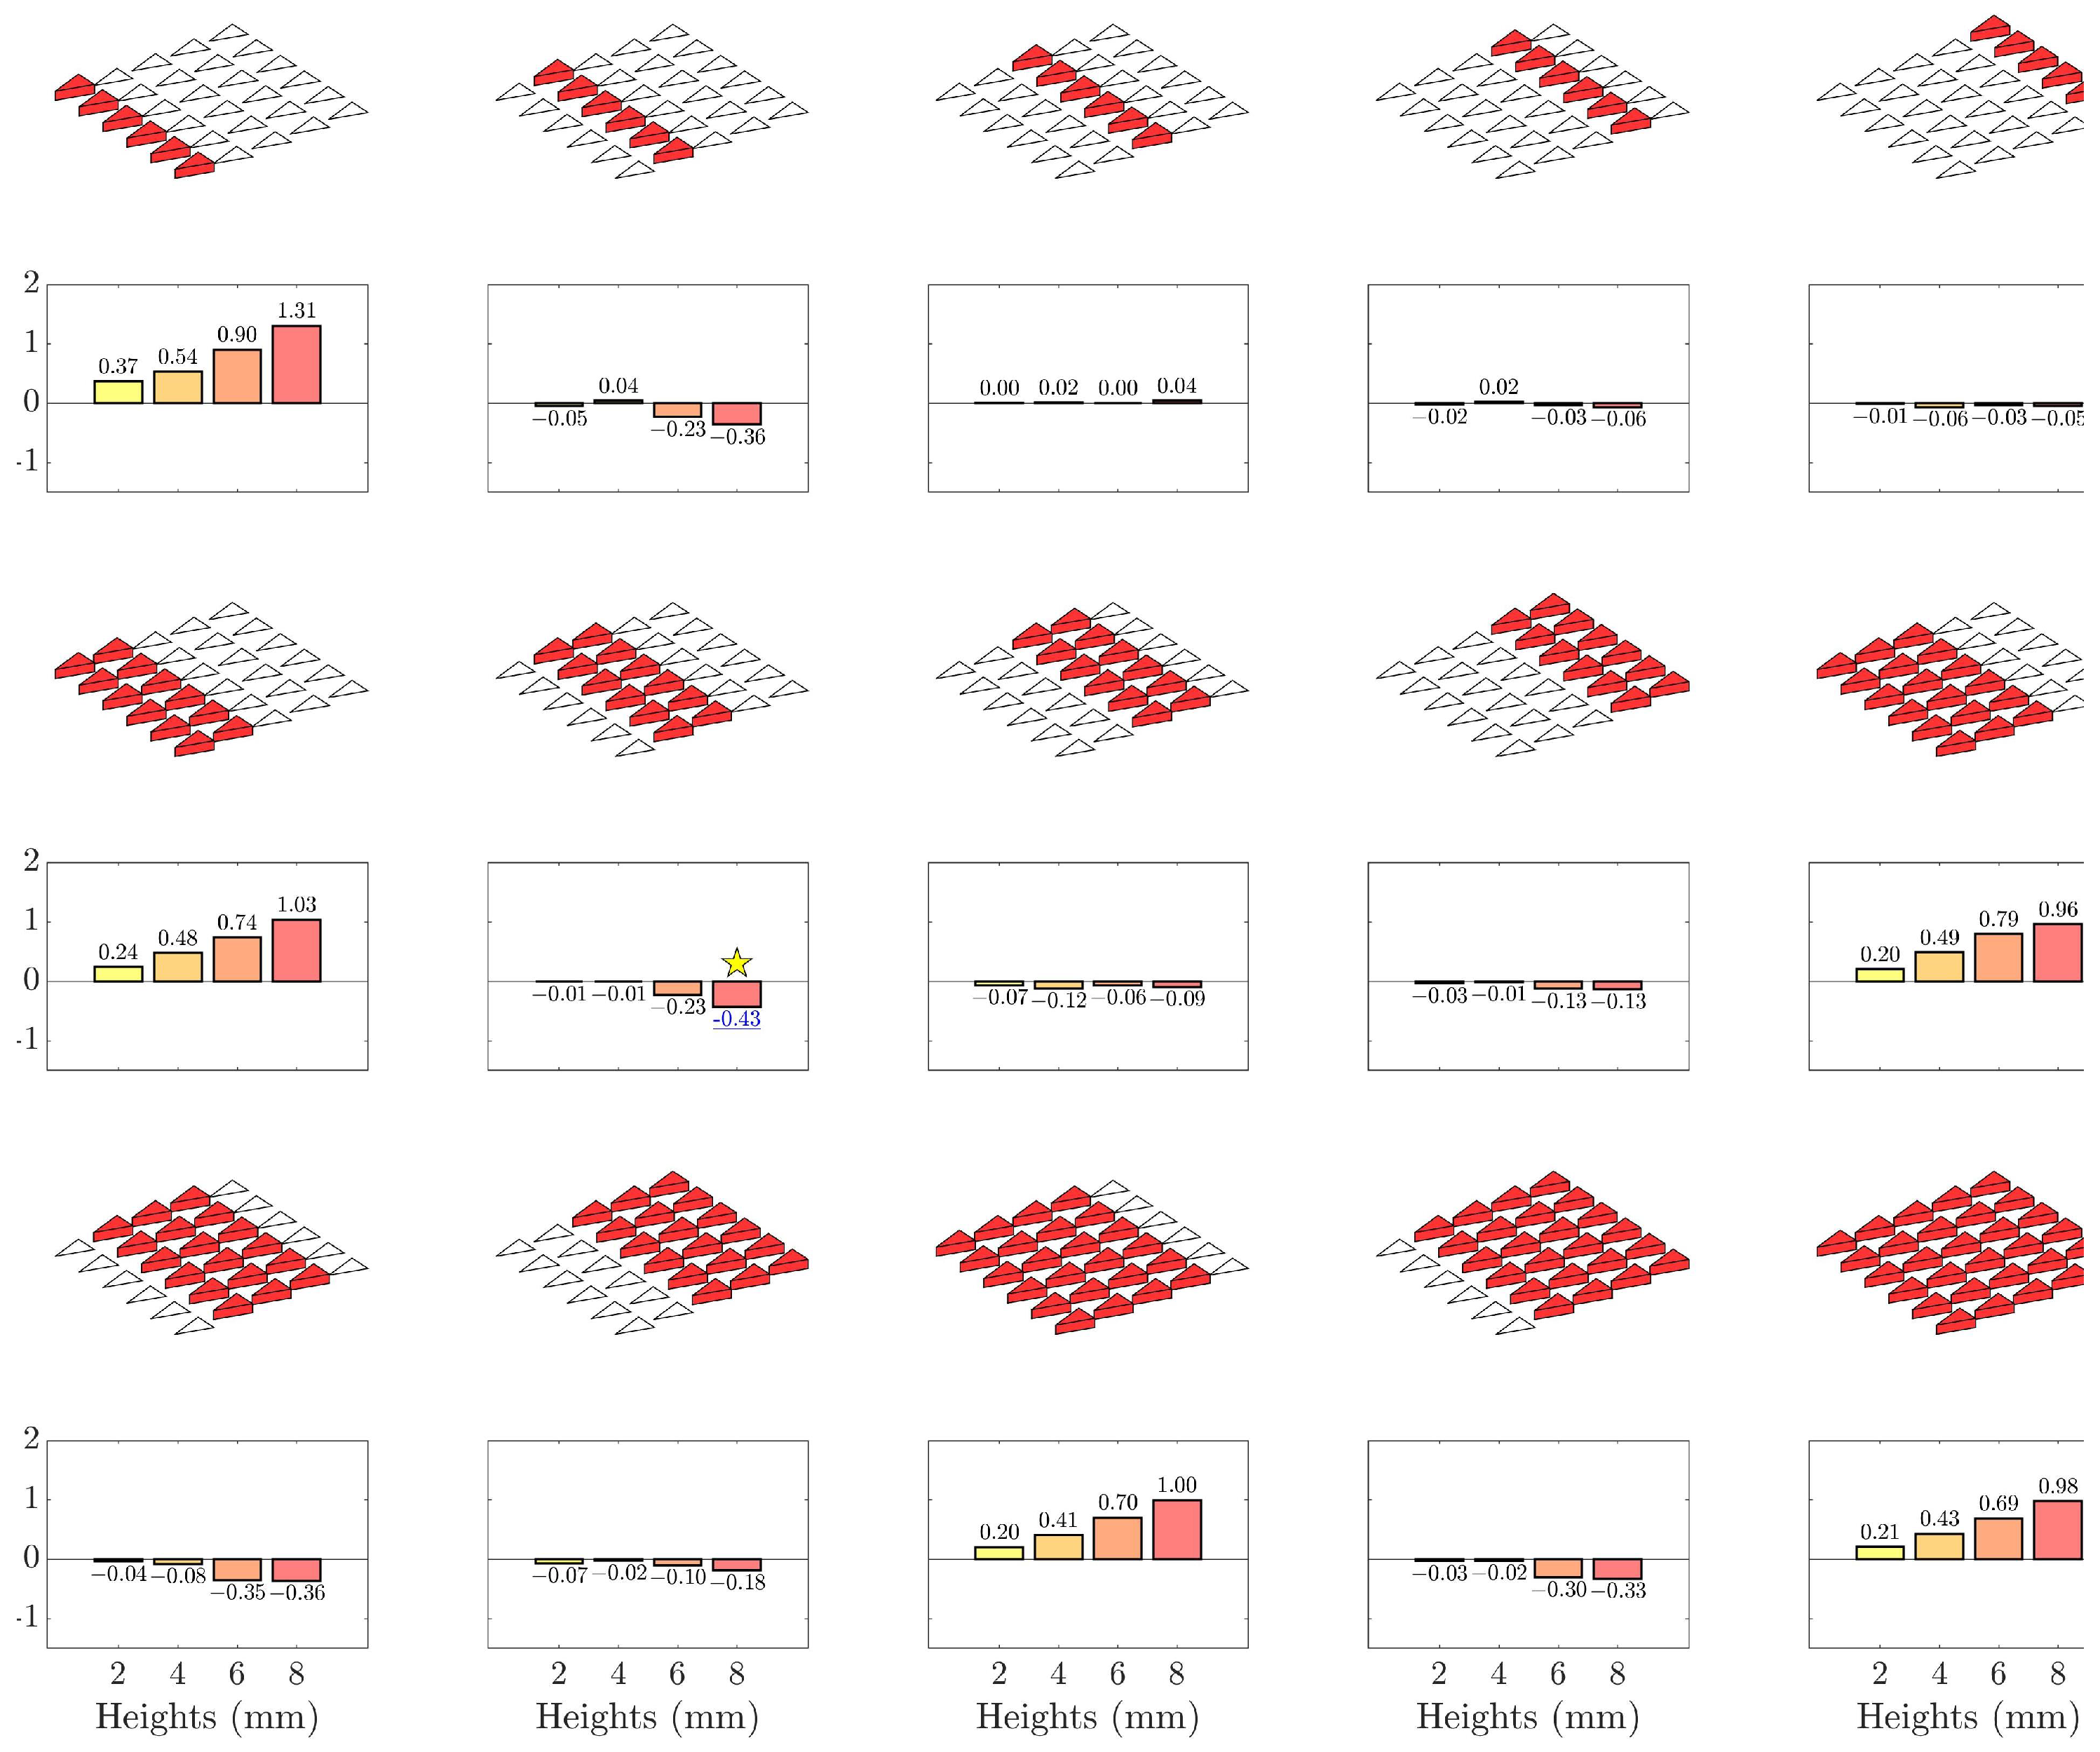
Similarly, the impact of hybrid passive and active actuation is assessed by integrating simultaneous active control into each parametric pattern. Figure 9 illustrates the flow control outcomes when the actuators execute both passive and active controls. We utilize the parametric patterns enumerated in Figure 8 and introduce additional, uniform micro-jet actuations in each case. For clarity, active control applications are denoted by green dots on top of the corresponding actuator units. Regarding single-row actuation patterns, noteworthy pressure recovery is observed when the first row is blowing at a minimum height of 2 . However, as the actuator height increases, the performance of first-row blowing progressively deteriorates. While the activation of the second row leads to significant pressure recovery in the passive-only scenario, negligible flow control effects are observed at all heights when active control is added. The remaining single-row actuation patterns result in additional pressure losses compared to the baseline case. In the case of hybrid flow control with multiple rows, including the first row at 2 , consistently produces promising results. Furthermore, the most favorable flow control outcome is observed when the first two rows are activated at 2 , yielding a remarkable 91% pressure recovery compared to the baseline case. These findings suggest that active control from the first row at the minimum height consistently ensures flow control effectiveness. However, as the actuator height increases, the effectiveness of flow control diminishes. Multi-row control patterns that commence with the second row also guarantee pressure recovery at various heights. Nevertheless, actuation patterns excluding the first two rows only yield negligible effects on ramp wall pressure recovery.
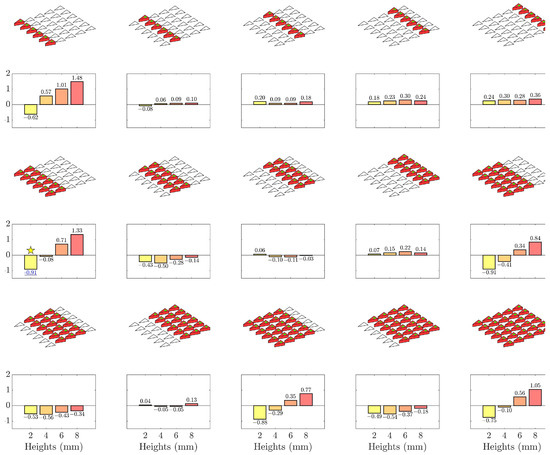
Figure 9.
The parametric results of different passive + active control laws from the actuator matrix. The activated hybrid actuators are denoted in red, and the green dots on top of these actuators indicate simultaneous active control. For each arrangement, flow control outcome at 4 different actuator heights are evaluated. The best flow control result is denoted by a yellow star in the figure.
Comparing the parametric control laws in Figure 8 and Figure 9 provides a deeper insight into the effects of passive and active actuations in this innovative experimental setup. The inclusion of active control introduces notable changes in the performance of previously effective actuation patterns in the passive-only case, and vice versa. For instance, the effects of the first and second rows differ significantly between the passive-only and passive+active modes. These observations suggest that isolating the impact of active and passive control when designing effective flow control strategies can be challenging. Furthermore, as more complex parametric patterns are included in actuator arrangements, more intricate dynamics may emerge.
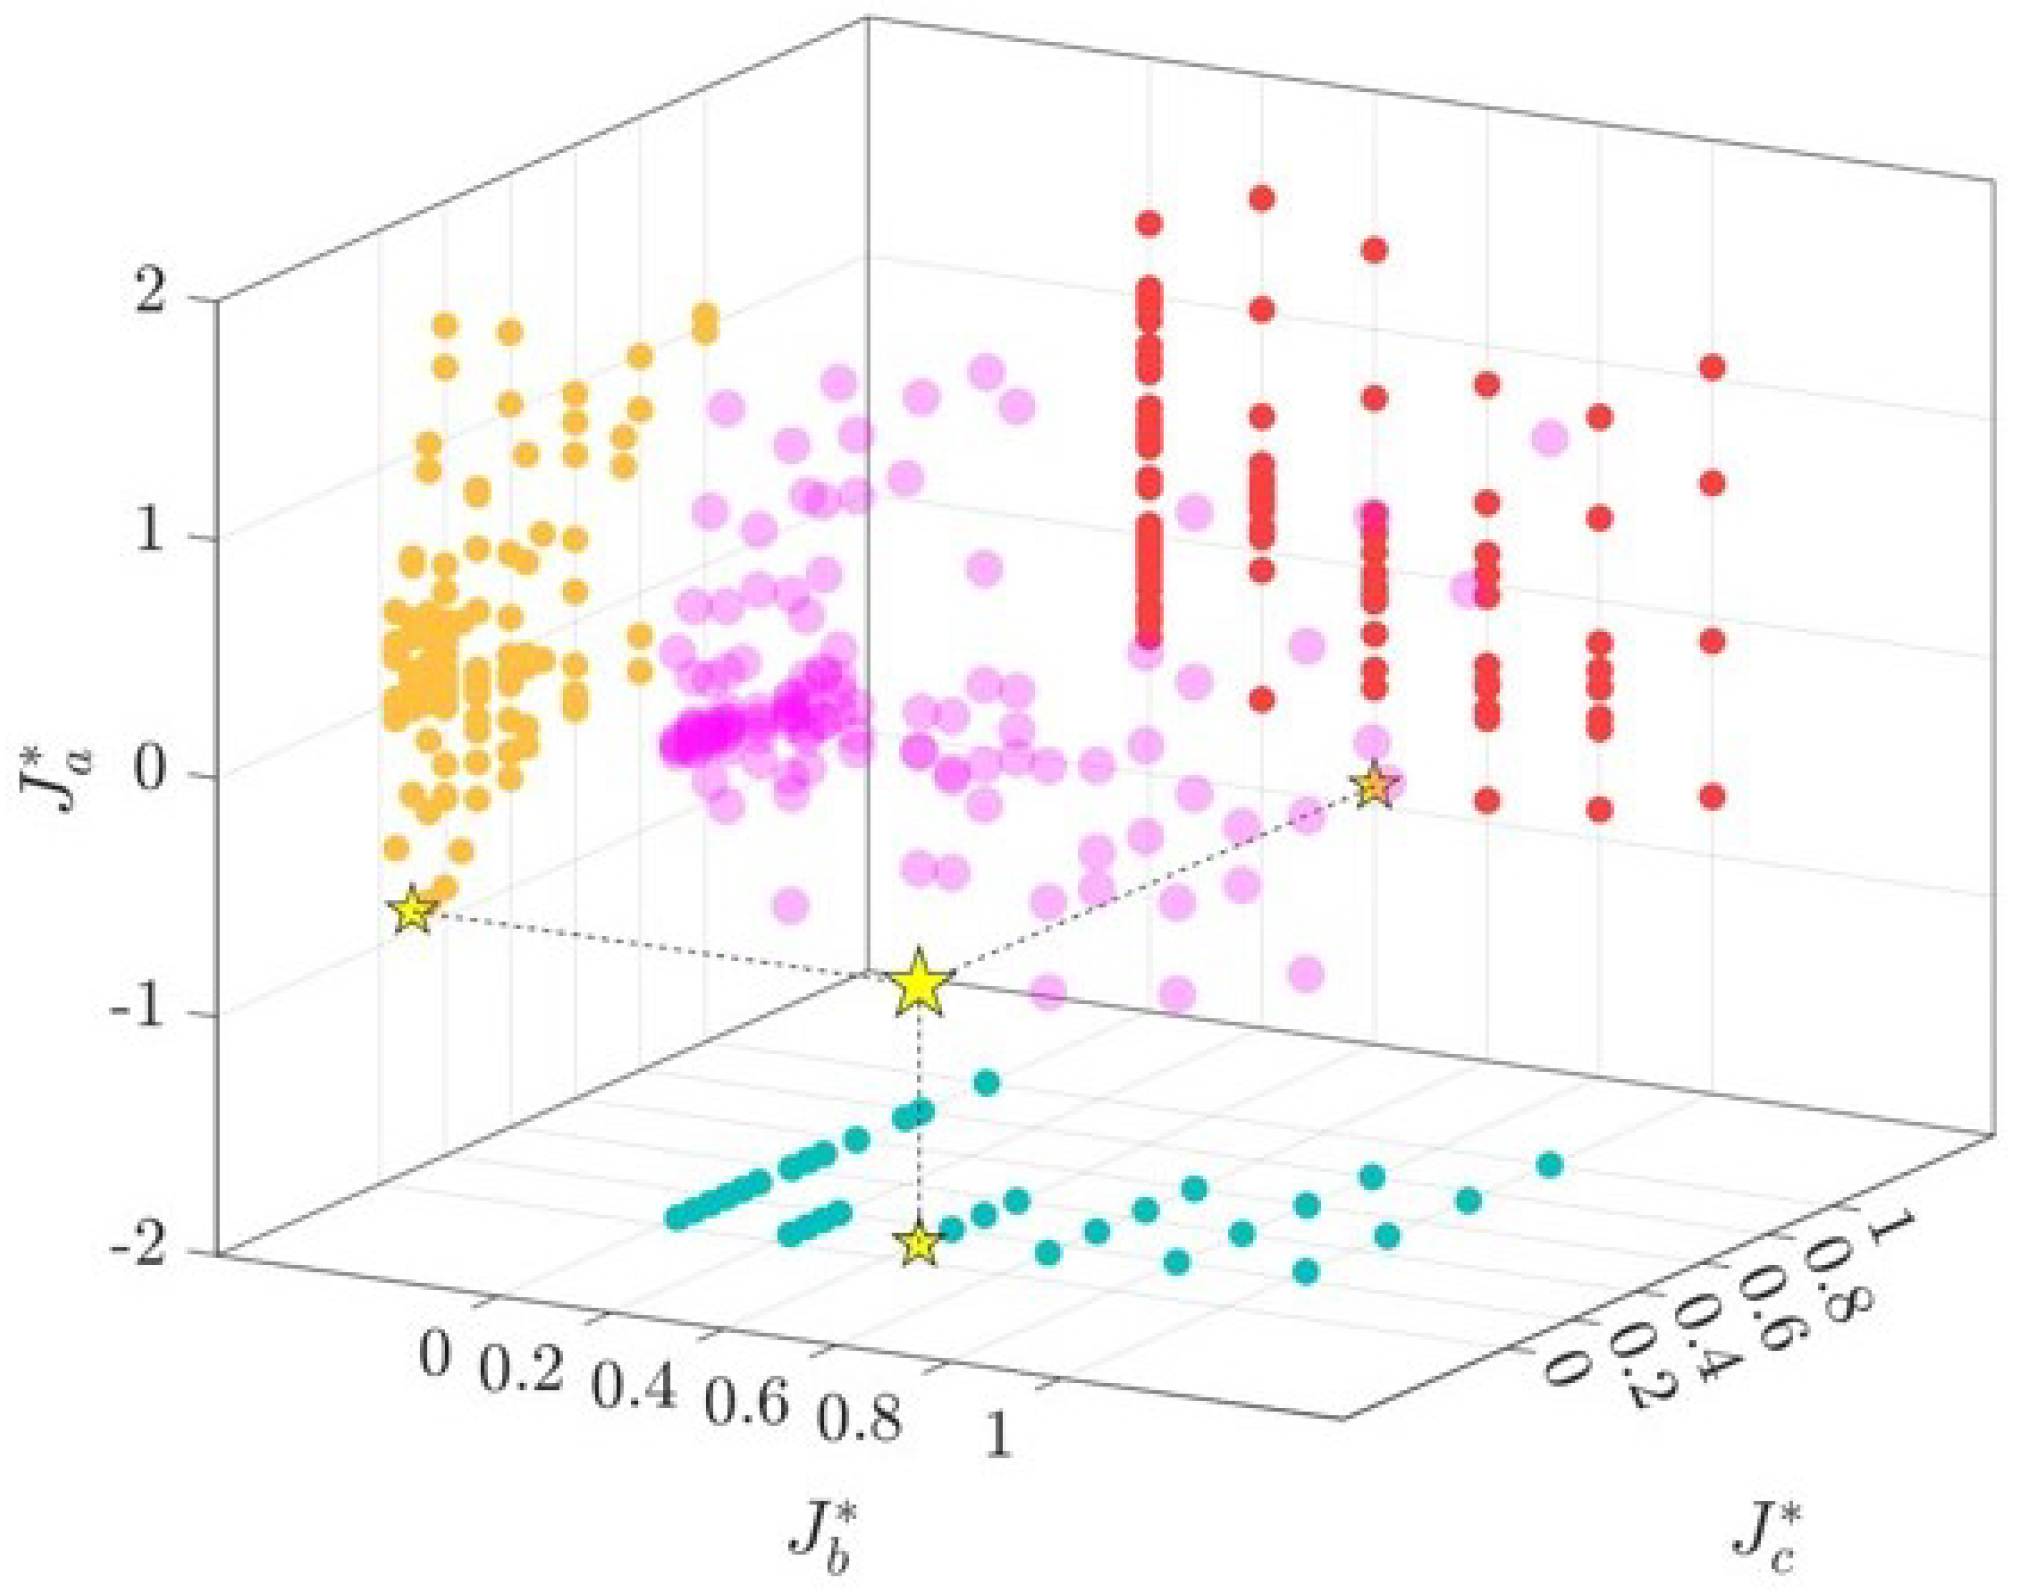
In the parametric study, we also define the equivalent micro-jet usage rate and the equivalent actuator height . The definition of both parameters follows the following two equations:
In these equations, represents the average over all actuator elements and is the maximum height of the actuators. Figure 10 illustrates the interplay between , , and resulting from the hybrid passive and active parametric investigation. Notably, distinct Pareto frontiers emerge from the relationships between () and pairs. This visualization underscores the intricate balance between the effectiveness of passive and active control strategies. Specifically, each value of corresponds to a range of possible values, suggesting that the spatial distribution of actuators holds more influence than the sheer number of actuators. Conversely, elevating the equivalent number of actuators, as represented by , is found to detrimentally impact flow control efficiency. This observation insight highlights the inherent complexity of flow control mechanisms using hybrid passive and active control strategies.

Figure 10.
Three-dimensional visualization of the relationship between the cost function , equivalent duty cycle , and the equivalent actuator height from the parametric study. The location of the best-performed case is denoted by a yellow star. Different colors represent the projection of data onto different two-dimensional planes.
Flow measurements are conducted to enhance our understanding of the flow control outcomes, focusing on the optimal parametric case identified in Figure 9, where the first two rows are activated at a height of 2 . Figure 11 displays the pressure coefficient profiles () measured on the ramp surface under the best-controlled case. Close to the leading edge of the ramp, exhibits a gradual decrease towards the ramp surface, indicative of a favorable pressure gradient induced by active blowing. Subsequently, a sudden pressure drop occurs, followed by a steady recovery of pressure along the streamwise direction. Notably, at , the pressure coefficient reaches approximately at , while registering about across all other spanwise locations. The slightly lower pressure recovery observed on the sidewalls is attributed to the absence of corresponding actuators in those regions.

Figure 11.
Pressure distribution on the ramp surface under the best parametric case. Different symbol lines represent different spanwise locations.
Figure 12 showcases the streamwise velocity contours and corresponding 2D streamlines captured under the optimal parametric conditions. A significant reduction in flow separation is evident compared to the baseline results depicted in Figure 3. Particularly at locations , , and , flow separation is nearly eliminated, with no discernible recirculated streamlines. Instead, low-speed regions are observed to form a very thin layer closely attached to the ramp wall. Although small recirculation regions persist at locations and , they are notably restricted, underscoring the effectiveness of the flow control. However, at near-wall locations and , evident separation regions remain, attributed to the absence of corresponding actuators near the wall. Nonetheless, it is apparent that the streamwise extent of the recirculation region is reduced with the implementation of single-side actuation. For a more detailed comparison of streamwise velocity profiles between the baseline and optimal parametric cases, Figure 13 provides additional insights.

Figure 12.
Streamwise velocity contours and the superpositioned 2D streamlines measured at 7 spanwise locations with particle image velocimetry (PIV) under the best parametric case. The spanwise locations are aligned with the locations of the pressure taps. The z locations 1 to 7 correspond to −1.8, 1.2, 0.6, 0, 0.6, 1.2, and 1.8, respectively.
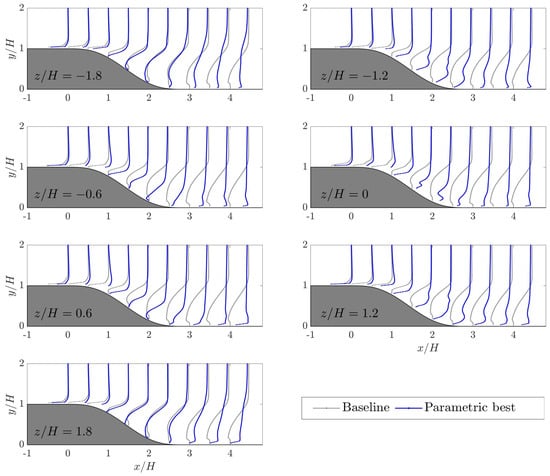
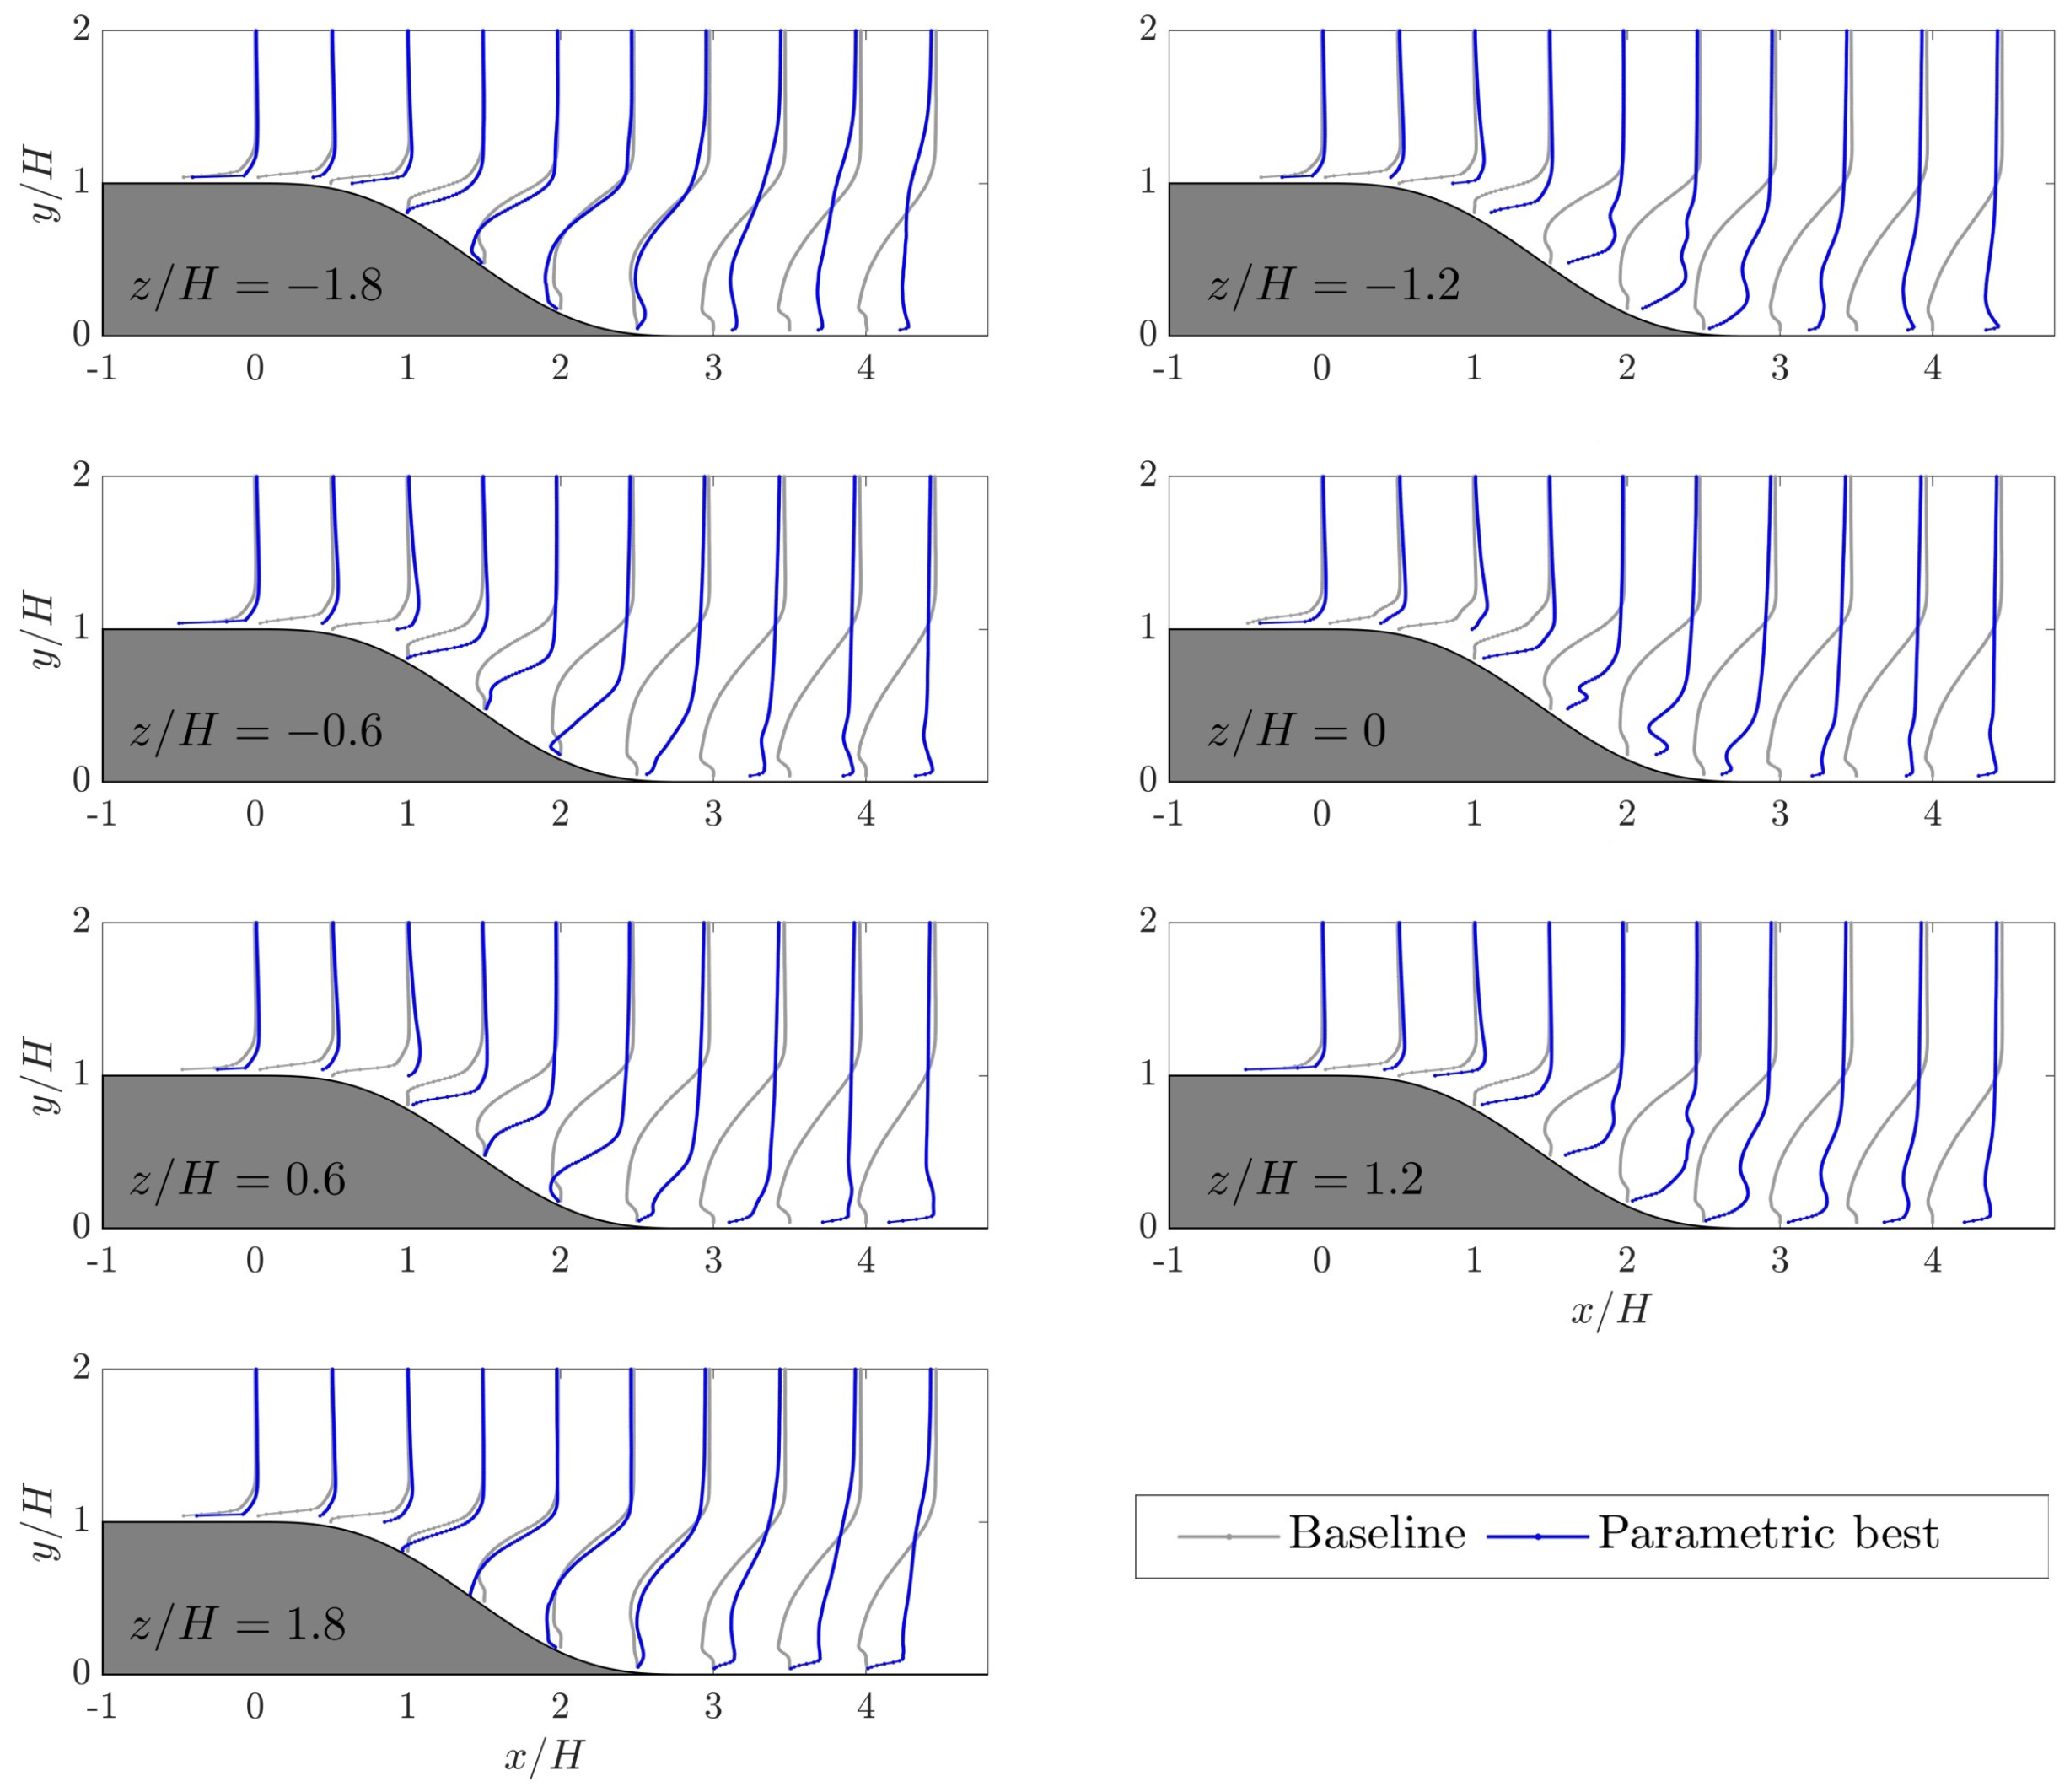
Figure 13.
Comparison of streamwise velocity profiles at different spanwise locations under the baseline and the best parametric cases.
4. Conclusions
In this study, we design and validate a novel separation control platform featuring a hybrid passive and active actuator matrix on a backward-facing ramp. Each actuator unit is composed of a height-adjustable vortex generator and a built-in micro-jet actuator, leveraging the combined benefits of both passive and active control strategies. The individual control of each hybrid unit can lead to a wide spectrum of control law patterns. In this study, we conduct a comprehensive parametric study comprising 120 test cases to evaluate the performance of various flow control strategies. Specifically, we investigate the effectiveness of both purely passive and hybrid passive–active patterns, with the spanwise rows uniformly activated. Flow measurements under the baseline case reveal complex dynamics with oscillating and convective turbulent structures at different scales. Our parametric investigation unveiled a nuanced interplay between passive and active actuations, highlighting the importance of actuator placement and height in influencing flow control outcomes. Notably, we identified specific actuation patterns that yielded substantial improvements in pressure recovery on the ramp surface, with the optimal configuration achieving a remarkable 91% pressure recovery compared to the baseline case. Flow measurements provided further details of the flow field under the best-controlled case. The streamwise velocity contours and 2D streamlines under the optimal parametric case underscored a remarkable reduction in flow recirculation region at all spanwise locations. Pressure measurements also reveal enhanced pressure on the ramp surface compared to the unforced case. Overall, this study underscores the promising potential of deploying hybrid passive and active actuator matrices in optimizing aerodynamic performance and enhancing the efficiency of various engineering applications.
Building on the success of our parametric studies and flow measurements, future research will undertake a comprehensive comparison of the flow control outcomes between this novel strategy and traditional setups. This comparison will significantly enhance our understanding of the effectiveness of the proposed hybrid actuator matrix. In addition, numerical simulations will deepen our comprehension of this distributed flow control paradigm. Time- and scale-resolved simulations, such as detached eddy simulations [63], will be crucial for understanding the interactions between the hybrid actuator elements and the incoming flow, as well as for interpreting and distilling effective flow control mechanisms. Meanwhile, future work will dive into the optimization of control laws for individual actuator units. Since parametric studies cannot guarantee optimal flow control efficiency, cutting-edge optimization algorithms powered by machine learning, such as genetic algorithms [64,65] and reinforcement learning [66,67], will be employed to obtain the optimum open-loop and closed-loop control laws. These algorithms will help fine-tune control strategies to maximize flow control effectiveness and advance the frontier of flow control using a hybrid actuator matrix.
Author Contributions
Conceptualization, S.L. and P.Z.; methodology, S.L. and P.Z.; formal analysis, S.L. and P.Z.; investigation, S.L. and P.Z.; writing, S.L.; funding acquisition, S.L. All authors have read and agreed to the published version of the manuscript.
Funding
This work is supported by the China Aerospace Science and Technology Corporation (CASC) Innovative Research Project XFX20220401.
Data Availability Statement
The raw data supporting the conclusions of this article will be made available by the authors on request.
Conflicts of Interest
Author Songqi Li was employed by the company BYD Auto Industry Co., Ltd. Author Songqi Li declares that the research was conducted in the absence of any commercial or financial relationships that could be construed as a potential conflict of interest.
References
- Baker, C.J. A review of train aerodynamics Part 2—Applications. Aeronaut. J. 2014, 118, 345–382. [Google Scholar] [CrossRef]
- Raina, A.; Harmain, G.; Haq, M.U. Numerical investigation of flow around a 3D bluff body using deflector plate. Int. J. Mech. Sci. 2017, 131–132, 701–711. [Google Scholar] [CrossRef]
- Zhang, J.; Wang, J.; Wang, Q.; Xiong, X.; Gao, G. A study of the influence of bogie cut outs’ angles on the aerodynamic performance of a high-speed train. J. Wind. Eng. Ind. Aerodyn. 2018, 175, 153–168. [Google Scholar] [CrossRef]
- Yang, G.; Guo, D.; Yao, S.; Liu, C. Aerodynamic design for China new high-speed trains. Sci. China Technol. Sci. 2012, 55, 1923–1928. [Google Scholar] [CrossRef]
- Yu, Y.; Liu, T.; Xia, Y.; Yang, M.; Liu, H. Development and prospect of aerodynamic drag-reduction technologies for trains at higher speed (400+ km/h). Acta Aerodyn. Sin. 2021, 39, 83–94. [Google Scholar]
- Sudin, M.; Abdullah, M.; Shamsuddin, S.; Ramli, F.; Tahir, M. Review of research on vehicles aerodynamic drag reduction methods. Int. J. Mech. Mechatron. Eng. 2014, 14, 37–47. [Google Scholar]
- Altaf, A.; Omar, A.; Asrar, W. Passive drag reduction of square back road vehicles. J. Wind. Eng. Ind. Aerodyn. 2014, 134, 30–43. [Google Scholar] [CrossRef]
- Geropp, D.; Odenthal, H.J. Drag reduction of motor vehicles by active flow control using the Coanda effect. Exp. Fluids 2000, 28, 74–85. [Google Scholar] [CrossRef]
- Kourta, A.; Gilliéron, P. Impact of the automotive aerodynamic control on the economic issues. J. Appl. Fluid Mech. 2012, 2, 69–75. [Google Scholar]
- Hucho, W.; Sovran, G. Aerodynamics of Road Vehicles. Annu. Rev. Fluid Mech. 1993, 25, 485–537. [Google Scholar] [CrossRef]
- Gad-el Hak, M. Modern Developments in Flow Control. Appl. Mech. Rev. 1996, 49, 365–379. [Google Scholar] [CrossRef]
- Selby, G.; Lin, J.; Howard, F. Control of low-speed turbulent separated flow using jet vortex generators. Exp. Fluids 1992, 12, 394–400. [Google Scholar] [CrossRef]
- Lin, J.; Robinson, S.; McGhee, R.; Valarezo, W. Separation control on high-lift airfoils via micro-vortex generators. J. Aircr. 1994, 31, 1317–1323. [Google Scholar] [CrossRef]
- Lake, J.; King, P.; Rivir, R. Low Reynolds number loss reduction on turbine blades with dimples and V-grooves. In Proceedings of the 38th Aerospace Sciences Meeting and Exhibit. American Institute of Aeronautics and Astronautics, Reno, NV, USA, 10–13 January 2000. [Google Scholar] [CrossRef]
- Ballerstein, N.; Horst, P. Manipulation of the aerodynamic behavior of the DrivAer model using dimple patterns. J. Wind. Eng. Ind. Aerodyn. 2023, 233, 105216. [Google Scholar] [CrossRef]
- Camacho-Sánchez, J.M.; Lorite-Díez, M.; Jiménez-González, J.I.; Cadot, O.; Martínez-Bazán, C. Experimental study on the effect of adaptive flaps on the aerodynamics of an Ahmed body. Phys. Rev. Fluids 2023, 8, 044605. [Google Scholar] [CrossRef]
- Mariotti, A.; Buresti, G.; Gaggini, G.; Salvetti, M.V. Separation control and drag reduction for boat-tailed axisymmetric bodies through contoured transverse grooves. J. Fluid Mech. 2017, 832, 514–549. [Google Scholar] [CrossRef]
- Viswanathan, H. Aerodynamic performance of several passive vortex generator configurations on an Ahmed body subjected to yaw angles. J. Braz. Soc. Mech. Sci. Eng. 2021, 43, 131. [Google Scholar] [CrossRef]
- Cattafesta, L.N.; Sheplak, M. Actuators for Active Flow Control. Annu. Rev. Fluid Mech. 2011, 43, 247–272. [Google Scholar] [CrossRef]
- Raghu, S. Fluidic oscillators for flow control. Exp. Fluids 2013, 54, 1455. [Google Scholar] [CrossRef]
- Metka, M.; Gregory, J. Drag Reduction on the 25-deg Ahmed Model Using Fluidic Oscillators. J. Fluids Eng. 2015, 137, 051108. [Google Scholar] [CrossRef]
- Gilarranz, J.L.; Traub, L.W.; Rediniotis, O.K. A New Class of Synthetic Jet Actuators—Part II: Application to Flow Separation Control. J. Fluids Eng. 2005, 127, 377–387. [Google Scholar] [CrossRef]
- Kim, S.; Kim, C. Separation control on NACA23012 using synthetic jet. Aerosp. Sci. Technol. 2009, 13, 172–182. [Google Scholar] [CrossRef]
- Post, M.; Corke, T. Separation Control Using Plasma Actuators: Dynamic Stall Vortex Control on Oscillating Airfoil. AIAA J. 2006, 44, 3125–3135. [Google Scholar] [CrossRef]
- Roupassov, D.V.; Nikipelov, A.A.; Nudnova, M.M.; Starikovskii, A.Y. Flow Separation Control by Plasma Actuator with Nanosecond Pulsed-Periodic Discharge. AIAA J. 2009, 47, 168–185. [Google Scholar] [CrossRef]
- Zigunov, F.; Sellappan, P.; Alvi, F. A bluff body flow control experiment with distributed actuation and genetic algorithm-based optimization. Exp. Fluids 2022, 63, 23. [Google Scholar] [CrossRef]
- Collis, S.; Joslin, R.; Seifert, A.; Theofilis, V. Issues in active flow control: Theory, control, simulation, and experiment. Prog. Aerosp. Sci. 2004, 40, 237–289. [Google Scholar] [CrossRef]
- Yagiz, B.; Kandil, O.; Pehlivanoglu, Y. Drag minimization using active and passive flow control techniques. Aerosp. Sci. Technol. 2012, 17, 21–31. [Google Scholar] [CrossRef]
- Liesner, K.; Meyer, R. Combination of Active and Passive Flow Control in a High Speed Compressor Cascade. In Proceedings of the Volume 2A: Turbomachinery, Düsseldorf, Germany, 16–20 June 2014; American Society of Mechanical Engineers: NewYork, NY, USA, 2014. [Google Scholar] [CrossRef]
- Sipp, D.; Marquet, O.; Meliga, P.; Barbagallo, A. Dynamics and Control of Global Instabilities in Open-Flows: A Linearized Approach. Appl. Mech. Rev. 2010, 63, 030801. [Google Scholar] [CrossRef]
- Nair, A.; Taira, K.; Brunton, B.; Brunton, S. Phase-based control of periodic flows. J. Fluid Mech. 2021, 927. [Google Scholar] [CrossRef]
- Samimy, M.; Debiasi, M.; Caraballo, E.; Serrani, A.; Yuan, X.; Little, J.; Myatt, J.H. Feedback control of subsonic cavity flows using reduced-order models. J. Fluid Mech. 2007, 579, 315–346. [Google Scholar] [CrossRef]
- Sasaki, K.; Cavalieri, A.; Jordan, P.; Schmidt, O.; Colonius, T.; Brès, G. High-frequency wavepackets in turbulent jets. J. Fluid Mech. 2017, 830. [Google Scholar] [CrossRef]
- Toedtli, S.; Luhar, M.; McKeon, B. Predicting the response of turbulent channel flow to varying-phase opposition control: Resolvent analysis as a tool for flow control design. Phys. Rev. Fluids 2019, 4, 073905. [Google Scholar] [CrossRef]
- Becker, R.; King, R.; Petz, R.; Nitsche, W. Adaptive Closed-Loop Separation Control on a High-Lift Configuration Using Extremum Seeking. AIAA J. 2007, 45, 1382–1392. [Google Scholar] [CrossRef]
- Mueller-Vahl, H.; Pechlivanoglou, G.; Nayeri, C.N.; Paschereit, C.O. Vortex Generators for Wind Turbine Blades: A Combined Wind Tunnel and Wind Turbine Parametric Study. In Proceedings of the Volume 6: Oil and Gas Applications; Concentrating Solar Power Plants; Steam Turbines; Wind Energy, Copenhagen, Denmark, 11–15 June 2012; American Society of Mechanical Engineers: New York, NY, USA, 2012. [Google Scholar] [CrossRef]
- Jukes, T.; Choi, K.S. Dielectric-barrier-discharge vortex generators: Characterisation and optimisation for flow separation control. Exp. Fluids 2011, 52, 329–345. [Google Scholar] [CrossRef]
- Lardeau, S.; Leschziner, M.A. The interaction of round synthetic jets with a turbulent boundary layer separating from a rounded ramp. J. Fluid Mech. 2011, 683, 172–211. [Google Scholar] [CrossRef]
- Kourta, A.; Thacker, A.; Joussot, R. Analysis and characterization of ramp flow separation. Exp. Fluids 2015, 56, 104. [Google Scholar] [CrossRef]
- Dandois, J.; Garnier, E.; Sagaut, P. Numerical simulation of active separation control by a synthetic jet. J. Fluid Mech. 2007, 574, 25–58. [Google Scholar] [CrossRef]
- Cheawchan, A.u.; Mohamed, M.A.; Ng, B.F.; New, T.H. A numerical investigation on flow past skewed vortex generators ahead of a backward facing ramp. Aerosp. Sci. Technol. 2022, 123, 107435. [Google Scholar] [CrossRef]
- Cheawchan, A.u.; Wen, Y.; Teo, Z.W.; Ng, B.F.; New, T.H. Flow behavior of skewed vortex generators on a backward-facing ramp. Proc. Inst. Mech. Eng. Part G J. Aerosp. Eng. 2021, 235, 2299–2314. [Google Scholar] [CrossRef]
- Priyanka, K.S.; Vihar, R.S.; Jeyan, M.L. Delaying the flow separation by using passage and vortex generator techniques. In AIP Conference Proceedings; AIP Publishing: Melville, NY, USA, 2024; Volume 3037. [Google Scholar]
- Asgari, E.; Tadjfar, M. Active control of flow over a rounded ramp by means of single and double adjacent rectangular synthetic jet actuators. Comput. Fluids 2019, 190, 98–113. [Google Scholar] [CrossRef]
- Asgari, E.; Tadjfar, M. Role of phase-difference between two adjacent rectangular synthetic jet actuators in active control of flow over a rounded ramp. Phys. Fluids 2022, 34, 025101. [Google Scholar] [CrossRef]
- Ramaswamy, D.P.; Hinke, R.; Schreyer, A.M. Influence of jet spacing and injection pressure on separation control with air-jet vortex generators. In Proceedings of the New Results in Numerical and Experimental Fluid Mechanics XII: Contributions to the 21st STAB/DGLR Symposium, Darmstadt, Germany, 2018; Springer: Berlin/Heidelberg, Germany, 2020; pp. 234–243. [Google Scholar]
- Ramaswamy, D.P.; Schreyer, A.M. Separation control with elliptical air-jet vortex generators. Exp. Fluids 2023, 64, 105. [Google Scholar] [CrossRef]
- Pour Razzaghi, M.J.; Masoumi, Y.; Rezaei Sani, S.M.; Huang, G. Controlling flow separation over a curved ramp using vortex generator microjets. Phys. Fluids 2022, 34, 115114. [Google Scholar] [CrossRef]
- He, S.; Zhang, K.; Song, Y.; Zhou, Y. Control of flow separation from a curved ramp using a steady-blowing jet. Phys. Fluids 2023, 35, 045139. [Google Scholar] [CrossRef]
- Tian, M.W.; Khorasani, S.; Moria, H.; Pourhedayat, S.; Dizaji, H. Profit and efficiency boost of triangular vortex-generators by novel techniques. Int. J. Heat Mass Transf. 2020, 156, 119842. [Google Scholar] [CrossRef]
- ASME PTC 19.1-2005; Test Uncertainty. American Society of Mechanical Engineers: New York, NY, USA, 2005.
- Wieneke, B. PIV uncertainty quantification from correlation statistics. Meas. Sci. Technol. 2015, 26, 074002. [Google Scholar] [CrossRef]
- Hildebrand, N.; Choudhari, M.; Paredes, P. Predicting Boundary-Layer Transition over Backward-Facing Steps via Linear Stability Analysis. AIAA J. 2020, 58, 3728–3734. [Google Scholar] [CrossRef]
- Spalding, D. A Single Formula for the “Law of the Wall”. J. Appl. Mech. 1961, 28, 455–458. [Google Scholar] [CrossRef]
- Schlatter, P.; Örlü, R. Assessment of direct numerical simulation data of turbulent boundary layers. J. Fluid Mech. 2010, 659, 116–126. [Google Scholar] [CrossRef]
- Graftieaux, L.; Michard, M.; Grosjean, N. Combining PIV, POD and vortex identification algorithms for the study of unsteady turbulent swirling flows. Meas. Sci. Technol. 2001, 12, 1422–1429. [Google Scholar] [CrossRef]
- Lumley, J. The structure of inhomogeneous turbulent flows. Atmos. Turbul. Radio Wave Propag. 1967, 7, 166–178. [Google Scholar]
- Sirovich, L. Turbulence and the dynamics of coherent structures. I. Coherent structures. Q. Appl. Math. 1987, 45, 561–571. [Google Scholar] [CrossRef]
- Thacker, A.; Aubrun, S.; Leroy, A.; Devinant, P. Experimental characterization of flow unsteadiness in the centerline plane of an Ahmed body rear slant. Exp. Fluids 2013, 54, 1479. [Google Scholar] [CrossRef]
- Cherry, N.J.; Hillier, R.; Latour, M.E.M.P. Unsteady measurements in a separated and reattaching flow. J. Fluid Mech. 1984, 144, 13–46. [Google Scholar] [CrossRef]
- Kiya, M.; Sasaki, K. Structure of large-scale vortices and unsteady reverse flow in the reattaching zone of a turbulent separation bubble. J. Fluid Mech. 1985, 154, 463–491. [Google Scholar] [CrossRef]
- Largeau, J.; Moriniere, V. Wall pressure fluctuations and topology in separated flows over a forward-facing step. Exp. Fluids 2006, 42, 21–40. [Google Scholar] [CrossRef]
- Squires, K.D. Detached-eddy simulation: Current status and perspectives. In Proceedings of the Direct and Large-Eddy Simulation V: Proceedings of the Fifth International ERCOFTAC Workshop on Direct and Large-Eddy Simulation Held at the Munich University of Technology, August 27–29, 2003; Springer: Berlin/Heidelberg, Germany, 2004; pp. 465–480. [Google Scholar]
- Amico, E.; Di Bari, D.; Cafiero, G.; Iuso, G. Genetic algorithm-based control of the wake of a bluff body. J. Phys. Conf. Ser. 2022, 2293, 012016. [Google Scholar] [CrossRef]
- Ren, F.; Hu, H.b.; Tang, H. Active flow control using machine learning: A brief review. J. Hydrodyn. 2020, 32, 247–253. [Google Scholar] [CrossRef]
- Ren, F.; Rabault, J.; Tang, H. Applying deep reinforcement learning to active flow control in weakly turbulent conditions. Phys. Fluids 2021, 33, 037121. [Google Scholar] [CrossRef]
- Vignon, C.; Rabault, J.; Vinuesa, R. Recent advances in applying deep reinforcement learning for flow control: Perspectives and future directions. Phys. Fluids 2023, 35, 031301. [Google Scholar] [CrossRef]


Disclaimer/Publisher’s Note: The statements, opinions and data contained in all publications are solely those of the individual author(s) and contributor(s) and not of MDPI and/or the editor(s). MDPI and/or the editor(s) disclaim responsibility for any injury to people or property resulting from any ideas, methods, instructions or products referred to in the content. |
© 2024 by the authors. Licensee MDPI, Basel, Switzerland. This article is an open access article distributed under the terms and conditions of the Creative Commons Attribution (CC BY) license (https://creativecommons.org/licenses/by/4.0/).