Article

Negative Medium-Voltage Direct Current Discharges in Air under Simulated Sub-Atmospheric Pressures for All-Electric Aircraft

by
Sai Pavan Kalakonda
,
Mohammad Hamidieh
,
Adil Bhojwani
and
Mona Ghassemi
*
Zero Emission, Realization of Optimized Energy Systems (ZEROES) Laboratory, Department of Electrical and Computer Engineering, The University of Texas at Dallas, Richardson, TX 75080, USA
*
Author to whom correspondence should be addressed.
Aerospace 2024, 11(6), 444; https://doi.org/10.3390/aerospace11060444
Submission received: 20 April 2024 / Revised: 22 May 2024 / Accepted: 29 May 2024 / Published: 30 May 2024
(This article belongs to the Special Issue Electric Power Systems and Components for All-Electric Aircraft)

Abstract

:
The increase in the global temperature due to greenhouse gas emissions is a major concern to the world. To achieve the goal of zero emissions by 2050 in the USA the practical realization of all-electric vehicles, particularly all-electric aircraft (AEA), is important. For the design of electrical power systems (EPSs) in all-electric aircraft, a bipolar medium-voltage direct current (MVDC) system of ±5 kV is being investigated. However, several challenges manifest when using such voltages in a low-pressure environment. One of the main challenges is the partial discharge (PD) behavior of the insulation. It is important to study the PD behavior of the insulation by simulating the aviation environment in the lab. This work aimed to study the partial discharge behavior of air under a negative DC voltage in a needle-to-plane electrode geometry by simulating the aviation pressures in the lab. The partial discharge inception voltage (PDIV) and the breakdown voltage (BDV) show an obvious pressure-dependent variation. Regression analysis was performed to better understand the relationship between the PDIV and pressures. Plots were drawn for the average discharge current at each voltage step until breakdown. This paper’s findings can provide valuable insight into the design of EPS for an AEA. To the best of our knowledge, such a study has not been carried out to date.

1. Introduction

Global warming due to the emission of greenhouse gases (GHGs) is a major concern that needs to be addressed as early as possible. As a countermeasure to tackle the problem of air pollution and global warming due to GHG emissions, the US government has resorted to a net zero initiative to increase the speed of global decarbonization. The goal of net zero emissions includes complete-zero-emission high-duty vehicle acquisitions by 2035.
It is reported that out of the global CO2 emissions from transportation, 10% comes from the aviation sector, that is, from commercial airplanes and large business jets, which are also responsible for 2.4% of the overall global emissions. The average increase in aviation emissions from 1990 to 2019 was 2.3%, and there was an increase of 2% in emissions in 2022 alone [1]. If not addressed, the situation will continue to worsen with the increase in air travel every year. An initial step is more electric aircraft (MEA) where non-thrust power needs are met by electricity [2,3]. The complete electrification of an aircraft or all-electric aircraft (AEA) requires the implementation of electrical power for thrust demand during takeoff as well, which is challenging since thrust demand is 25–30 times more than the total non-thrust demands. Several investigations are underway to design cables that are suitable to transmit the desired power throughout [4,5]. Studies on the management of electrical energy in EPSs for AEAs for optimal power transfer and reducing the mass of EPSs are underway, which allows for quick resolution of the faults due to possible overloads and reverting the systems to their normal operating conditions [6,7]. The greatest challenge is the behavior of insulation at aircraft aviation range pressures. The usual cruising altitude of commercial aircraft is between 33,000 ft and 42,000 ft where the atmospheric pressure is lower than 0.2 atm [8]. At such a pressure, there will be several changes in the behavior of any insulation.
Increased ampacity of conductors is not a feasible practice for achieving the power demands of AEAs, but on the other hand, increasing the voltage calls for insulation that is capable of sustaining the harsh aircraft environment [9]. At such high voltages, partial discharge is likely to pose significant challenges to the insulation, especially under low pressures of the aviation environment. The partial discharge inception voltage (PDIV) decreases as pressure decreases. Partial discharge is to be avoided because extended periods of partial discharge can tamper with the surface of the surrounding insulation, and in time, will cause it to break down [10]. Several studies report on the PD behavior under AC stress, which unlike DC PD, is determined by the permittivity of the medium having more to do with the polarization of that medium [11,12]. However, DC supply cannot polarize a medium since it does not alter between positive and negative cycles. DC stress depends on electrode geometry and electrical conductivity of the medium, which in turn determines the PD behavior of the insulation [13]. With the MVDC electrification components being designed for usage in AEA power systems [4,5], it is necessary to study the PD behavior of insulation under DC stress. Florkowski et al. [14] studied the behavior of air under negative DC stress in a needle-to-plane electrode at high pressures above atmospheric pressure, which served as a basis for this study of PD under low atmospheric pressures.
The authors previously attempted to study the PDIV at sub-atmospheric pressures in a sphere-to-sphere electrode setup [15] where they recorded the voltage corresponding to the first-occurring PD pulse above a specific charge threshold as the PDIV. However, based on the data obtained for various pressures and gap distances, it turned out to be highly stochastic, which showcased the inherent uncertainties in PDIV detection using that criterion. The present work is motivated by the fact that there is no established standard procedure and criteria for testing and identifying partial discharge under DC voltage. This work is refined to deliver a more consistent and reliable method of experimental characterization of the PD phenomena and determining the PDIV which is of the utmost importance for attaining reliable insulation for EPSs of future AEAs.
In Section 1, the authors include a literature review which was the main basis of their work. In Section 2, the authors describe their circuit, which was used for partial discharge testing and analysis. They explain each component of the circuit along with their working. The specification of the equipment is also provided. The procedure followed and necessary precautions that were taken during the experimental work are clearly and elaborately described in a step-by-step manner. Section 3 provides the reader with an analysis of the experimental data obtained, and the obtained results are discussed from the authors’ point of view. The authors use a statistical approach to analyze the data and include the equations obtained from regression analysis. There were certain constraints and difficulties faced by the authors which are also included along with their possible solutions, which the authors decided to include in their future work. Section 4 summarizes the work and includes the authors’ contributions along with insights into the future research the authors want to pursue in this line of study.

2. Materials and Methods

2.1. Materials

Figure 1 shows a single-line diagram of the test circuit used for this PD analysis. Figure 2 shows the actual setup used in the study. This section provides details about various equipment used and the procedure of PD detection and data extraction from the PD detection unit. Each component used in the circuit is explained in detail in this section. Measures were taken to maintain the same test conditions throughout.

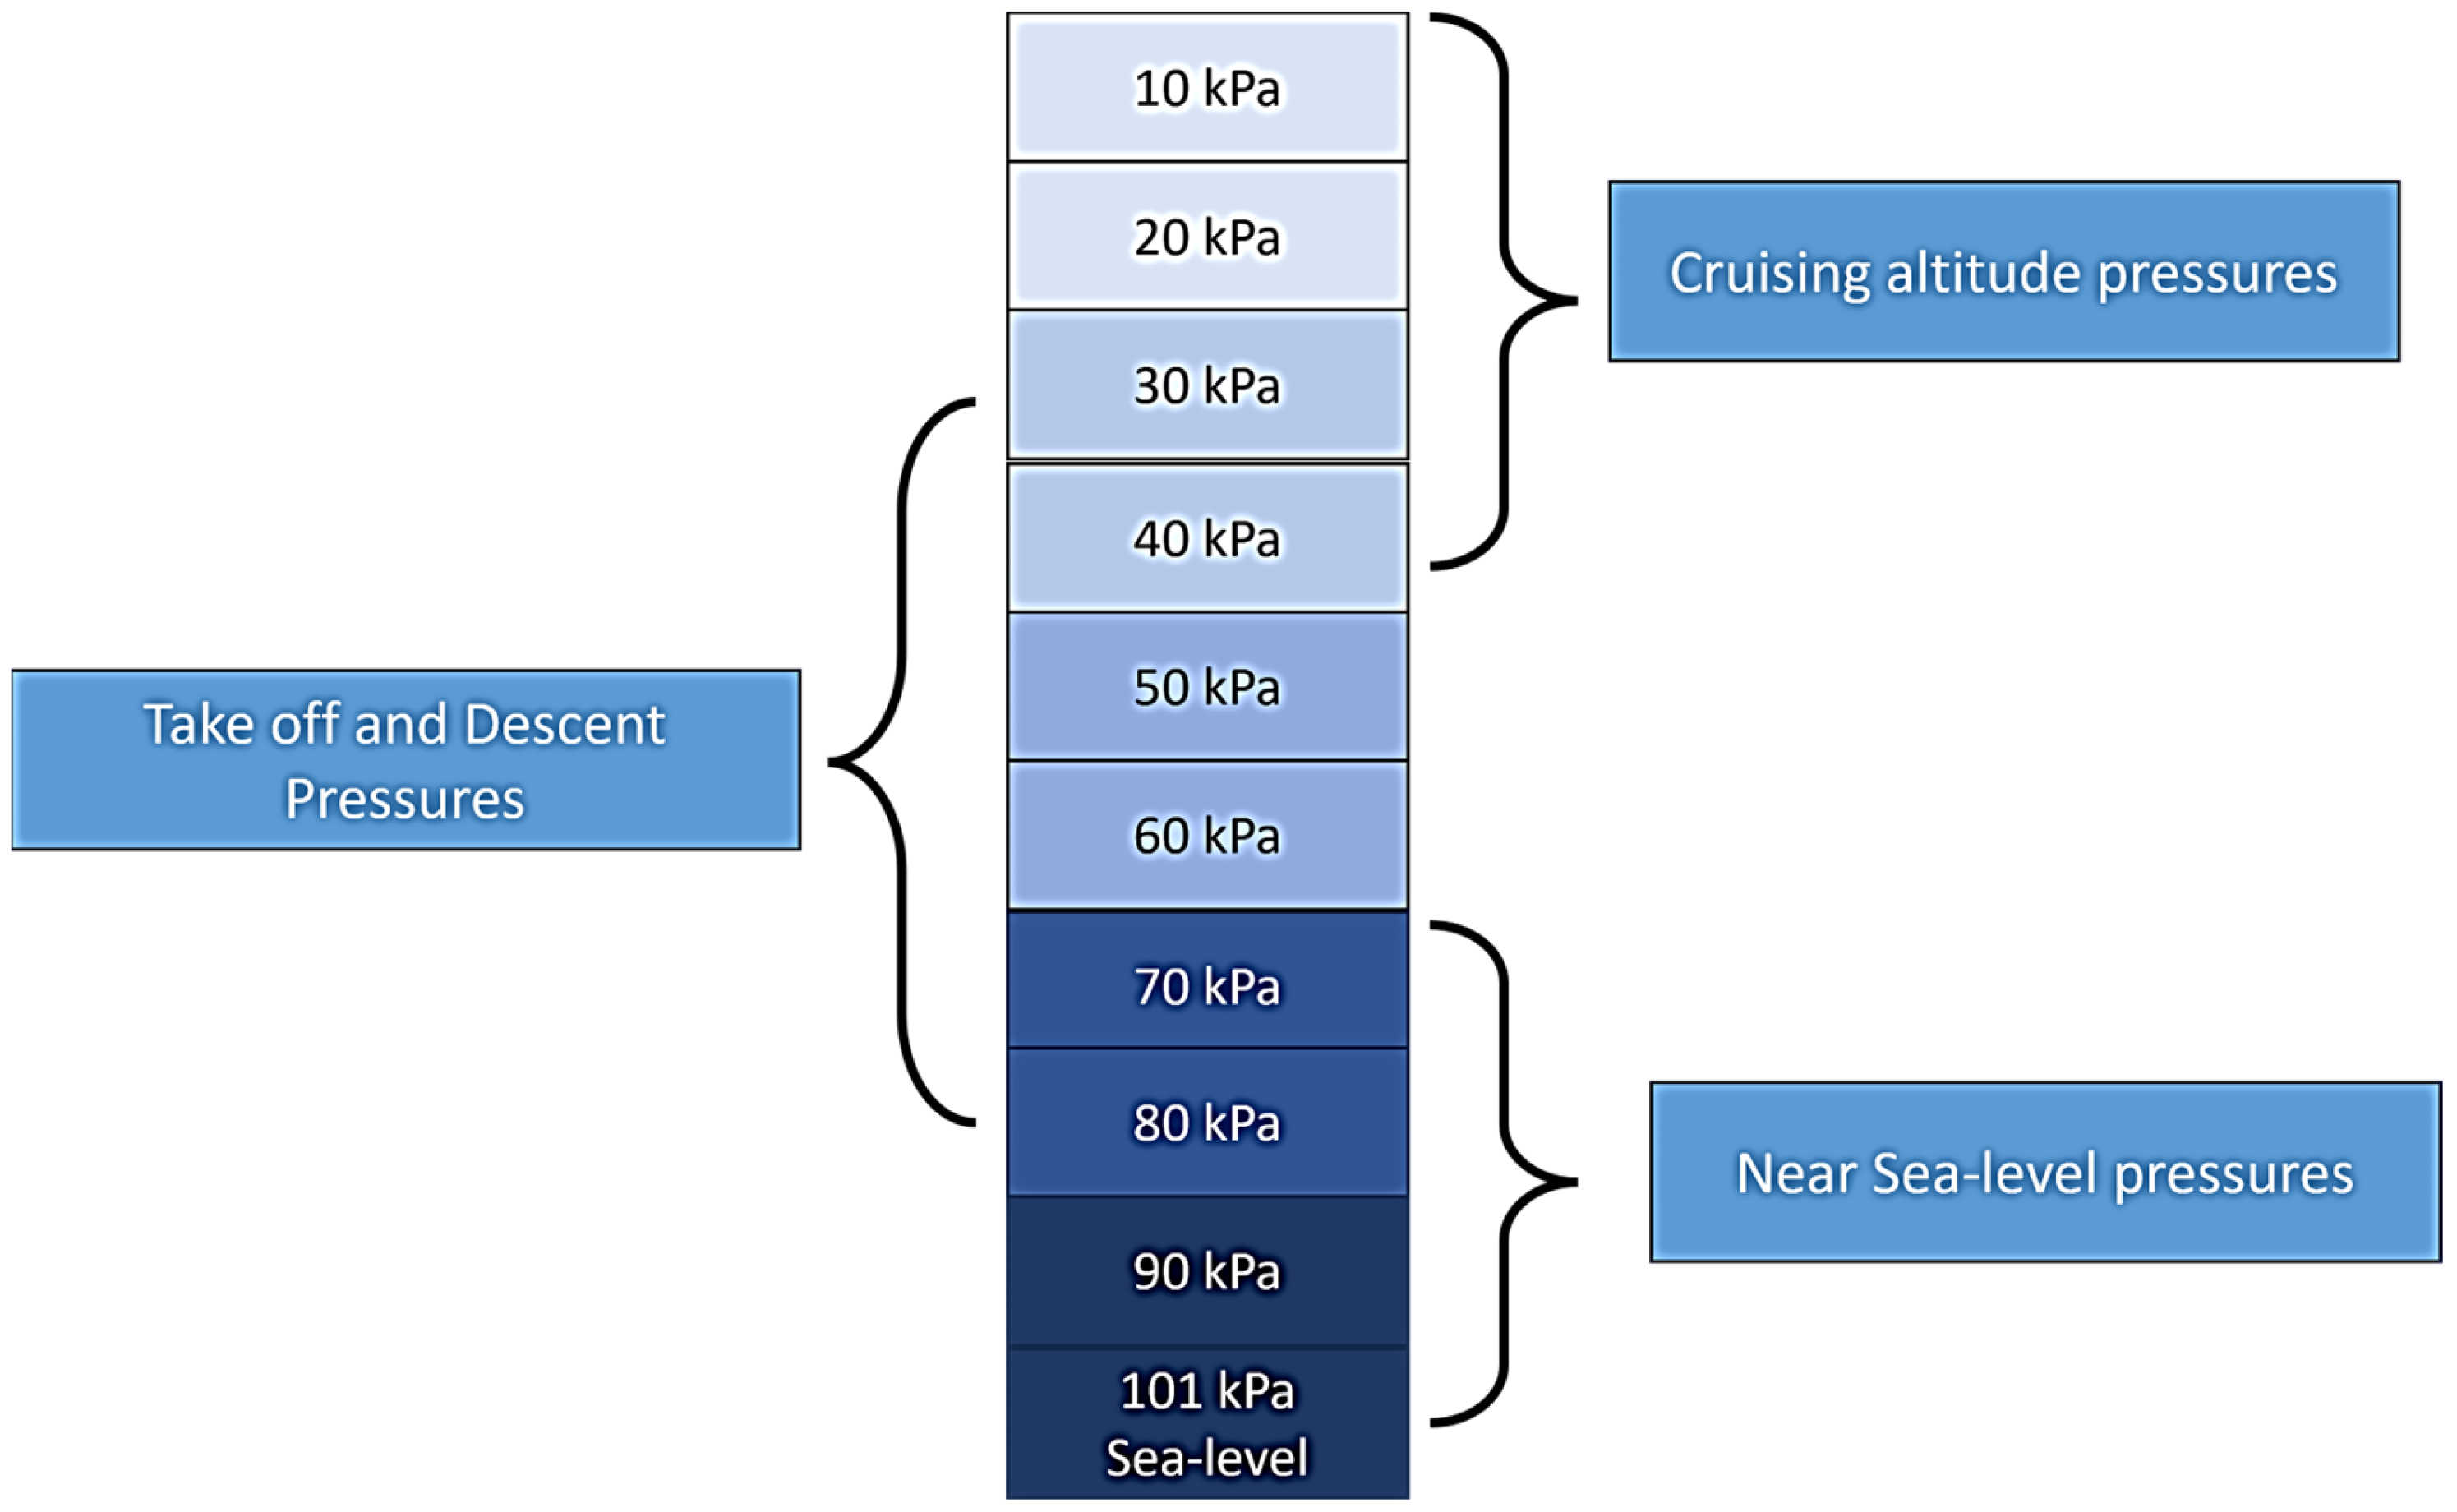
2.1.1. Simulation of Aviation Range Environment

a. Vacuum chamber: Aviation pressures were simulated using a clear cast acrylic vacuum chamber with a capacity of 65.5 L designed to sustain pressures as low as 0.075 mmHg. The chamber is equipped with nickel power feeders capable of withstanding 300 kVA at a maximum of a 15 A current rating installed in the chamber to supply high voltage to the test cell. There are two valves in the vacuum chamber; one of them is connected to the vacuum pump to draw out the air and the other is used to allow air to refill the chamber when opened.
b. Vacuum pump: A single-stage, 0.25 hp pump capable of obtaining an ultimate vacuum of 5 Pa was used to remove the air from the chamber and create a low-pressure environment. Using this pump, the pressure was varied from 101 kPa to 10 kPa.
c. Test cell: A test cell with a needle-to-plane electrode geometry was placed inside the vacuum chamber. The needle electrode is tangent circular with a 1.5 mm tip radius of curvature and an inter-tangent angle of 25°, as described in [16]. Negative DC voltage was supplied to one electrode while the other electrode was grounded.

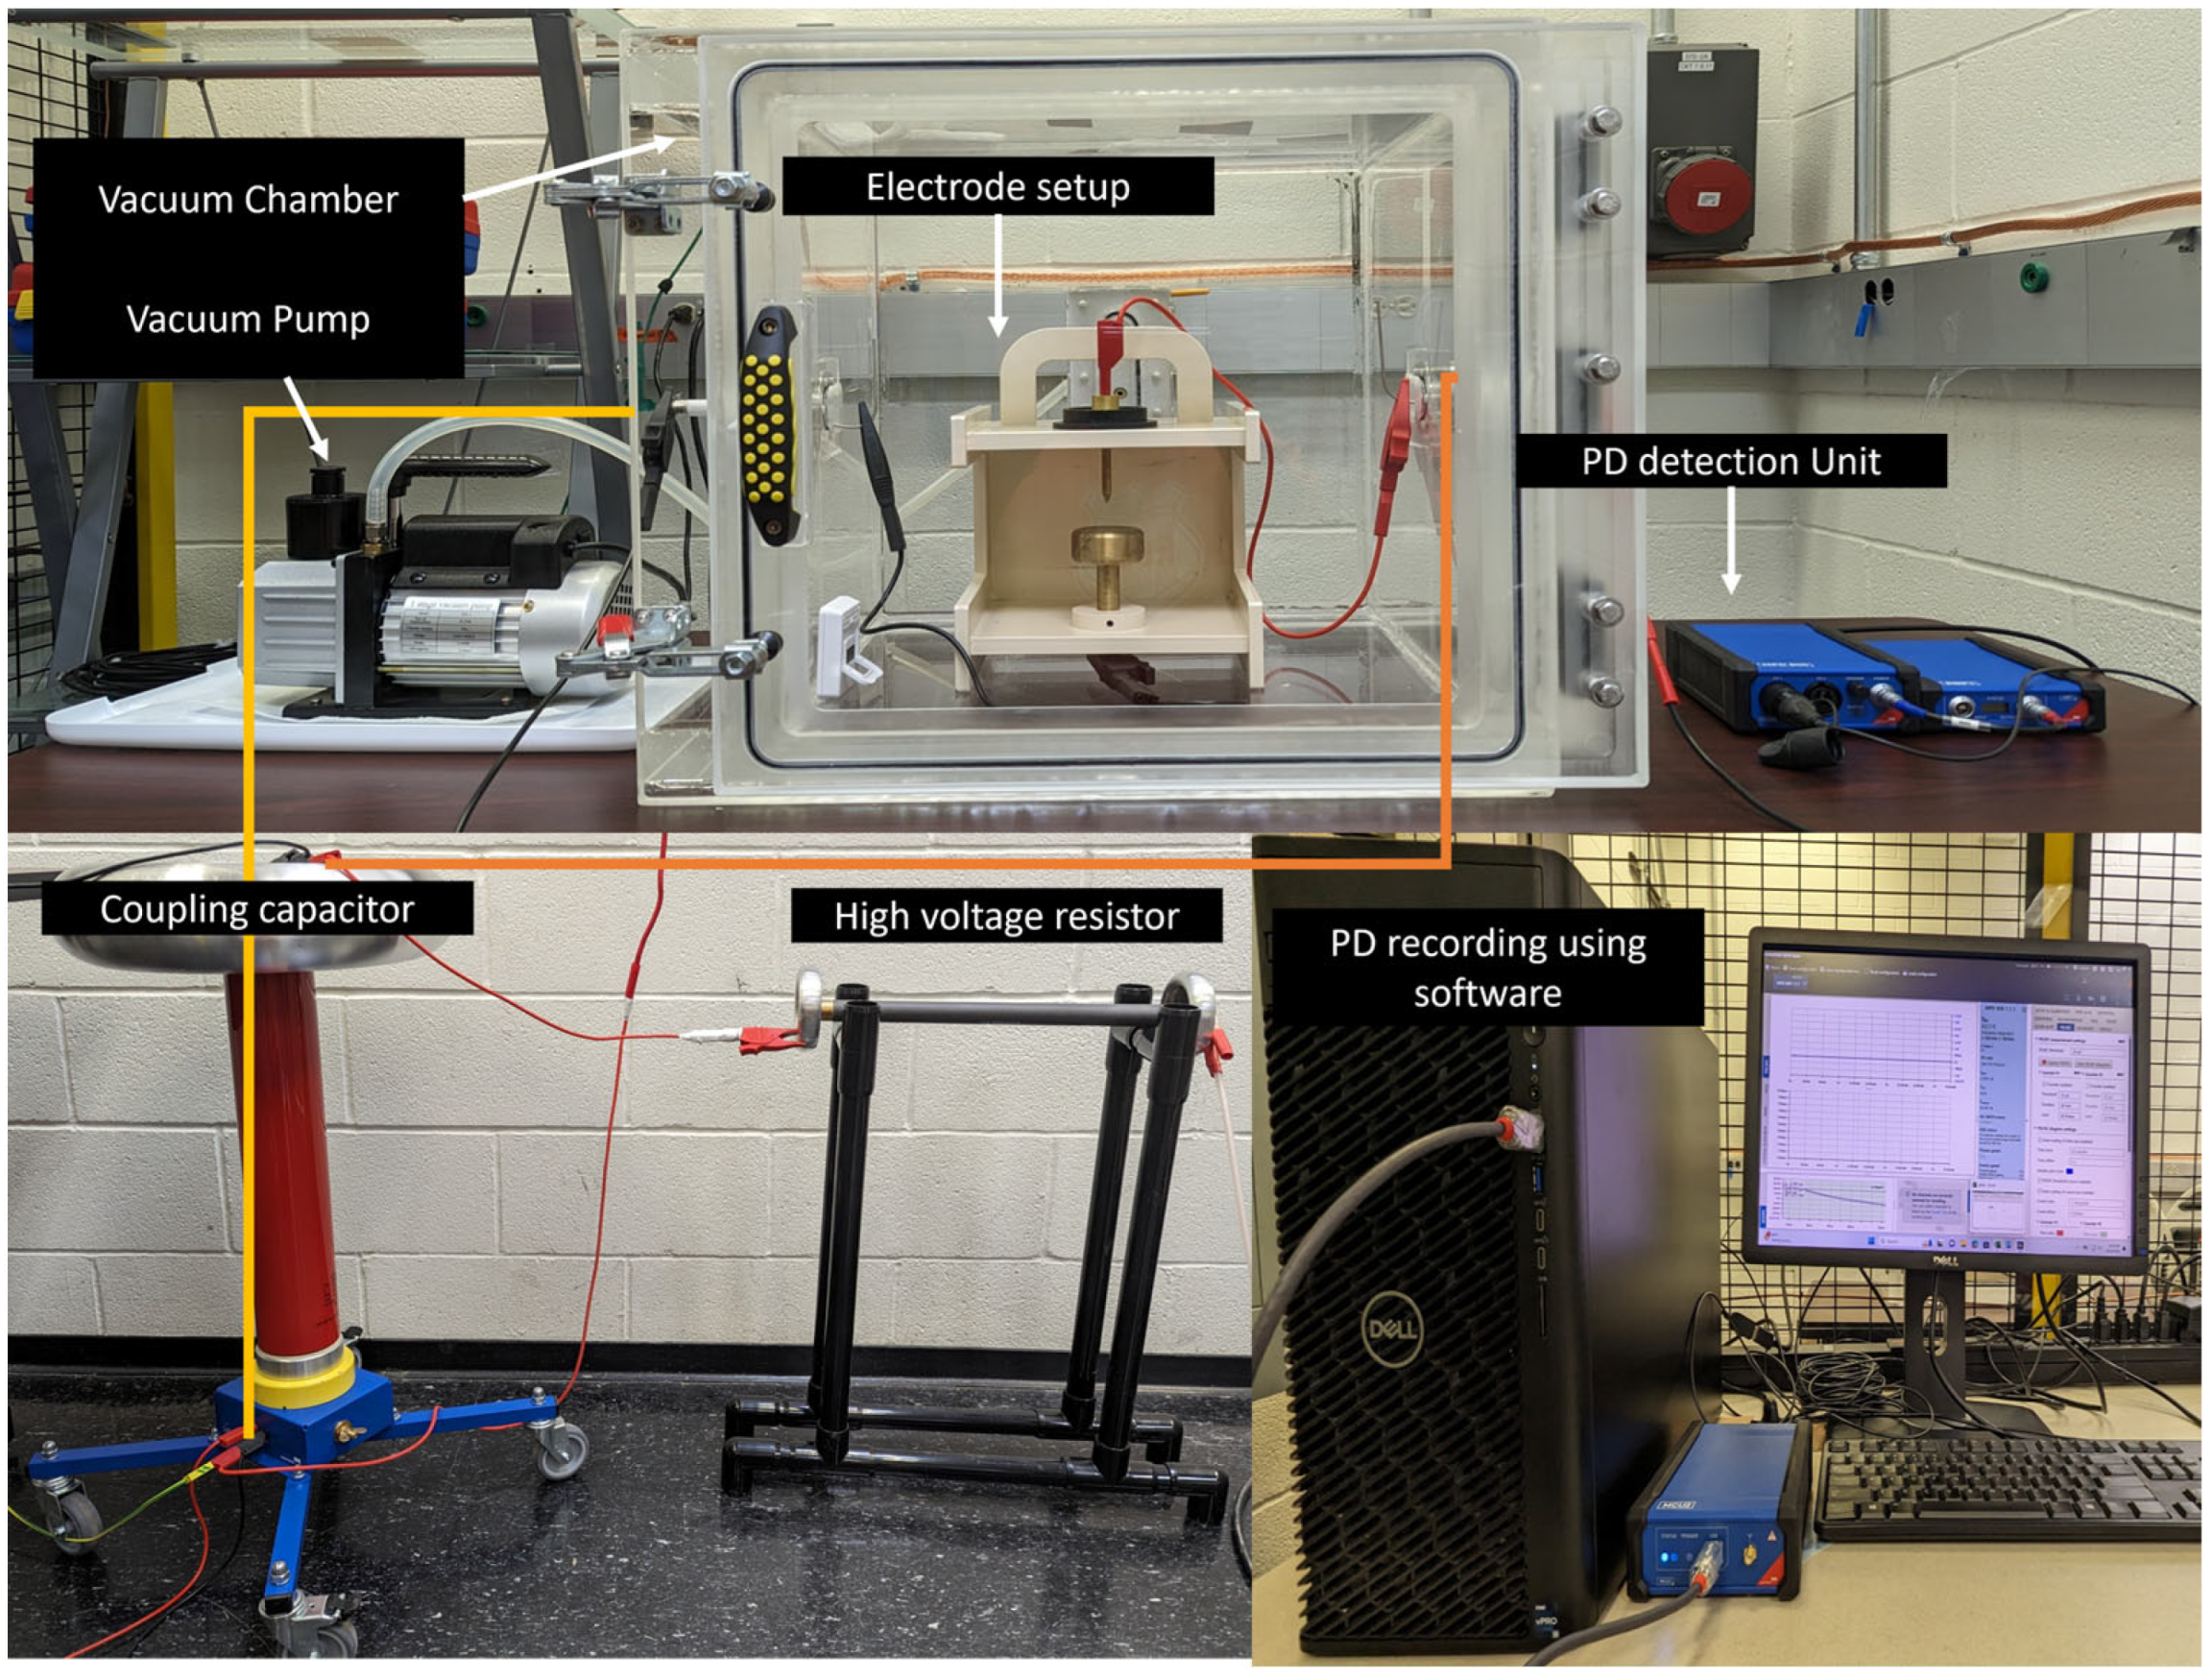
2.1.2. Partial Discharge Measurement System

d. PD detection unit: OMICRON MPD 800 PD detection system (OMICRON, Vienna, Austria) was used to detect the PD signals and analyze the discharges. The setup consists of a data acquisition unit MPD 800 that detects the signals from the coupling capacitor whenever there is a PD in the test cell and sends it to the control unit that is connected to the PD through an optic fiber. These data can be accessed in real time on a PC using the software designated for the MPD 800 detection unit. A CAL 542 calibration device (OMICRON, Vienna, Austria) helps to calibrate the setup for the desired PD value. The calibrator will send a pulse into the test cell that will be detected by the MPD800 to calibrate the charge in the setup.

2.1.3. High Voltage Equipment

e. DC Hipot: The circuit is powered by a high-voltage DC source with a negative polarity. This DC Hipot has a precision of 0.1 kV and can reach a maximum of 100 kV.
f. Current Limiting Resistor: The current through the circuit is limited by a current-limiting resistor which will restrict the current whenever there is a fault in the circuit and saves the equipment from any serious damage. A resistor with a 1 kΩ rating was installed in series with the DC Hipot in these experiments. This resistance can withstand a continuous current of 1 A.
g. Coupling Capacitor: A 1 nF coupling capacitor is connected in parallel to the test cell. This capacitor is responsible for directing the DC voltage onto the test cell and sending PD signals to the MPD 800 PD detection device.

2.2. Method

Pressure, gap distance, humidity, temperature, and the rate of voltage rise are some of the key factors that influence the PD behavior of air between the electrodes. Endeavors were taken to maintain a consistent voltage rate of 100 V/s manually. As mentioned earlier, a test cell with a needle-to-plane electrode arrangement was employed in a vacuum chamber, provided with a pump to evacuate the air inside, which allows for controlling the pressure as required. The procedure for the experiment is as follows:
  • The PD detector was calibrated after a desired gap distance and pressure were set up inside the vacuum chamber.
  • A constant voltage of 1 kV was applied to the circuit as the high voltage was turned on. After waiting for 10 s at this voltage, the applied voltage was increased at a rate of 100 V/s.
  • The criterion for PDIV was the same as the one used by [12] for determining the PDIV. The voltage was said to be PDIV if the number of pulses reached at least 30 in one minute.
  • There were many pulses before reaching the PDIV; however, the pulses were not recorded at each pulse. Only the pulses occurring close to the expected PDIV* were counted step after step, and PDIV was determined when the number of pulses in one minute exceeded 30.
  • After the PDIV was recorded, voltage increments of 5% PDIV were applied until breakdown, and the data of the number of pulses and charge for each pulse were recorded for one minute at each step.
  • The voltage was turned off after the gap between the electrodes was bridged (Figure 3) and the circuit was discharged using the discharge stick. The inlet valve was opened to release the pressure inside the vacuum chamber.
This procedure was repeated multiple times for a fixed air gap and varied pressure combination.
*Expected PDIV—prior to conducting the actual experiments, the partial discharge inception voltages were noted for each pressure without a consistent voltage increase. These voltages were noted to optimize the time taken to conduct each experiment.
To ensure the reliability of the results, the humidity and temperature were monitored, and efforts were made to maintain them at a constant level throughout. The electrodes were cleaned each time using alcohol. The data for the mentioned parameters were obtained and graphs were plotted using the obtained data. The results and plotted graphs are discussed in the next section.

3. Results and Discussion

The experiments were performed systematically by varying the pressures in the vacuum chamber and data for the partial discharge inception voltage and breakdown voltage. The obtained data are shown in Table 1.

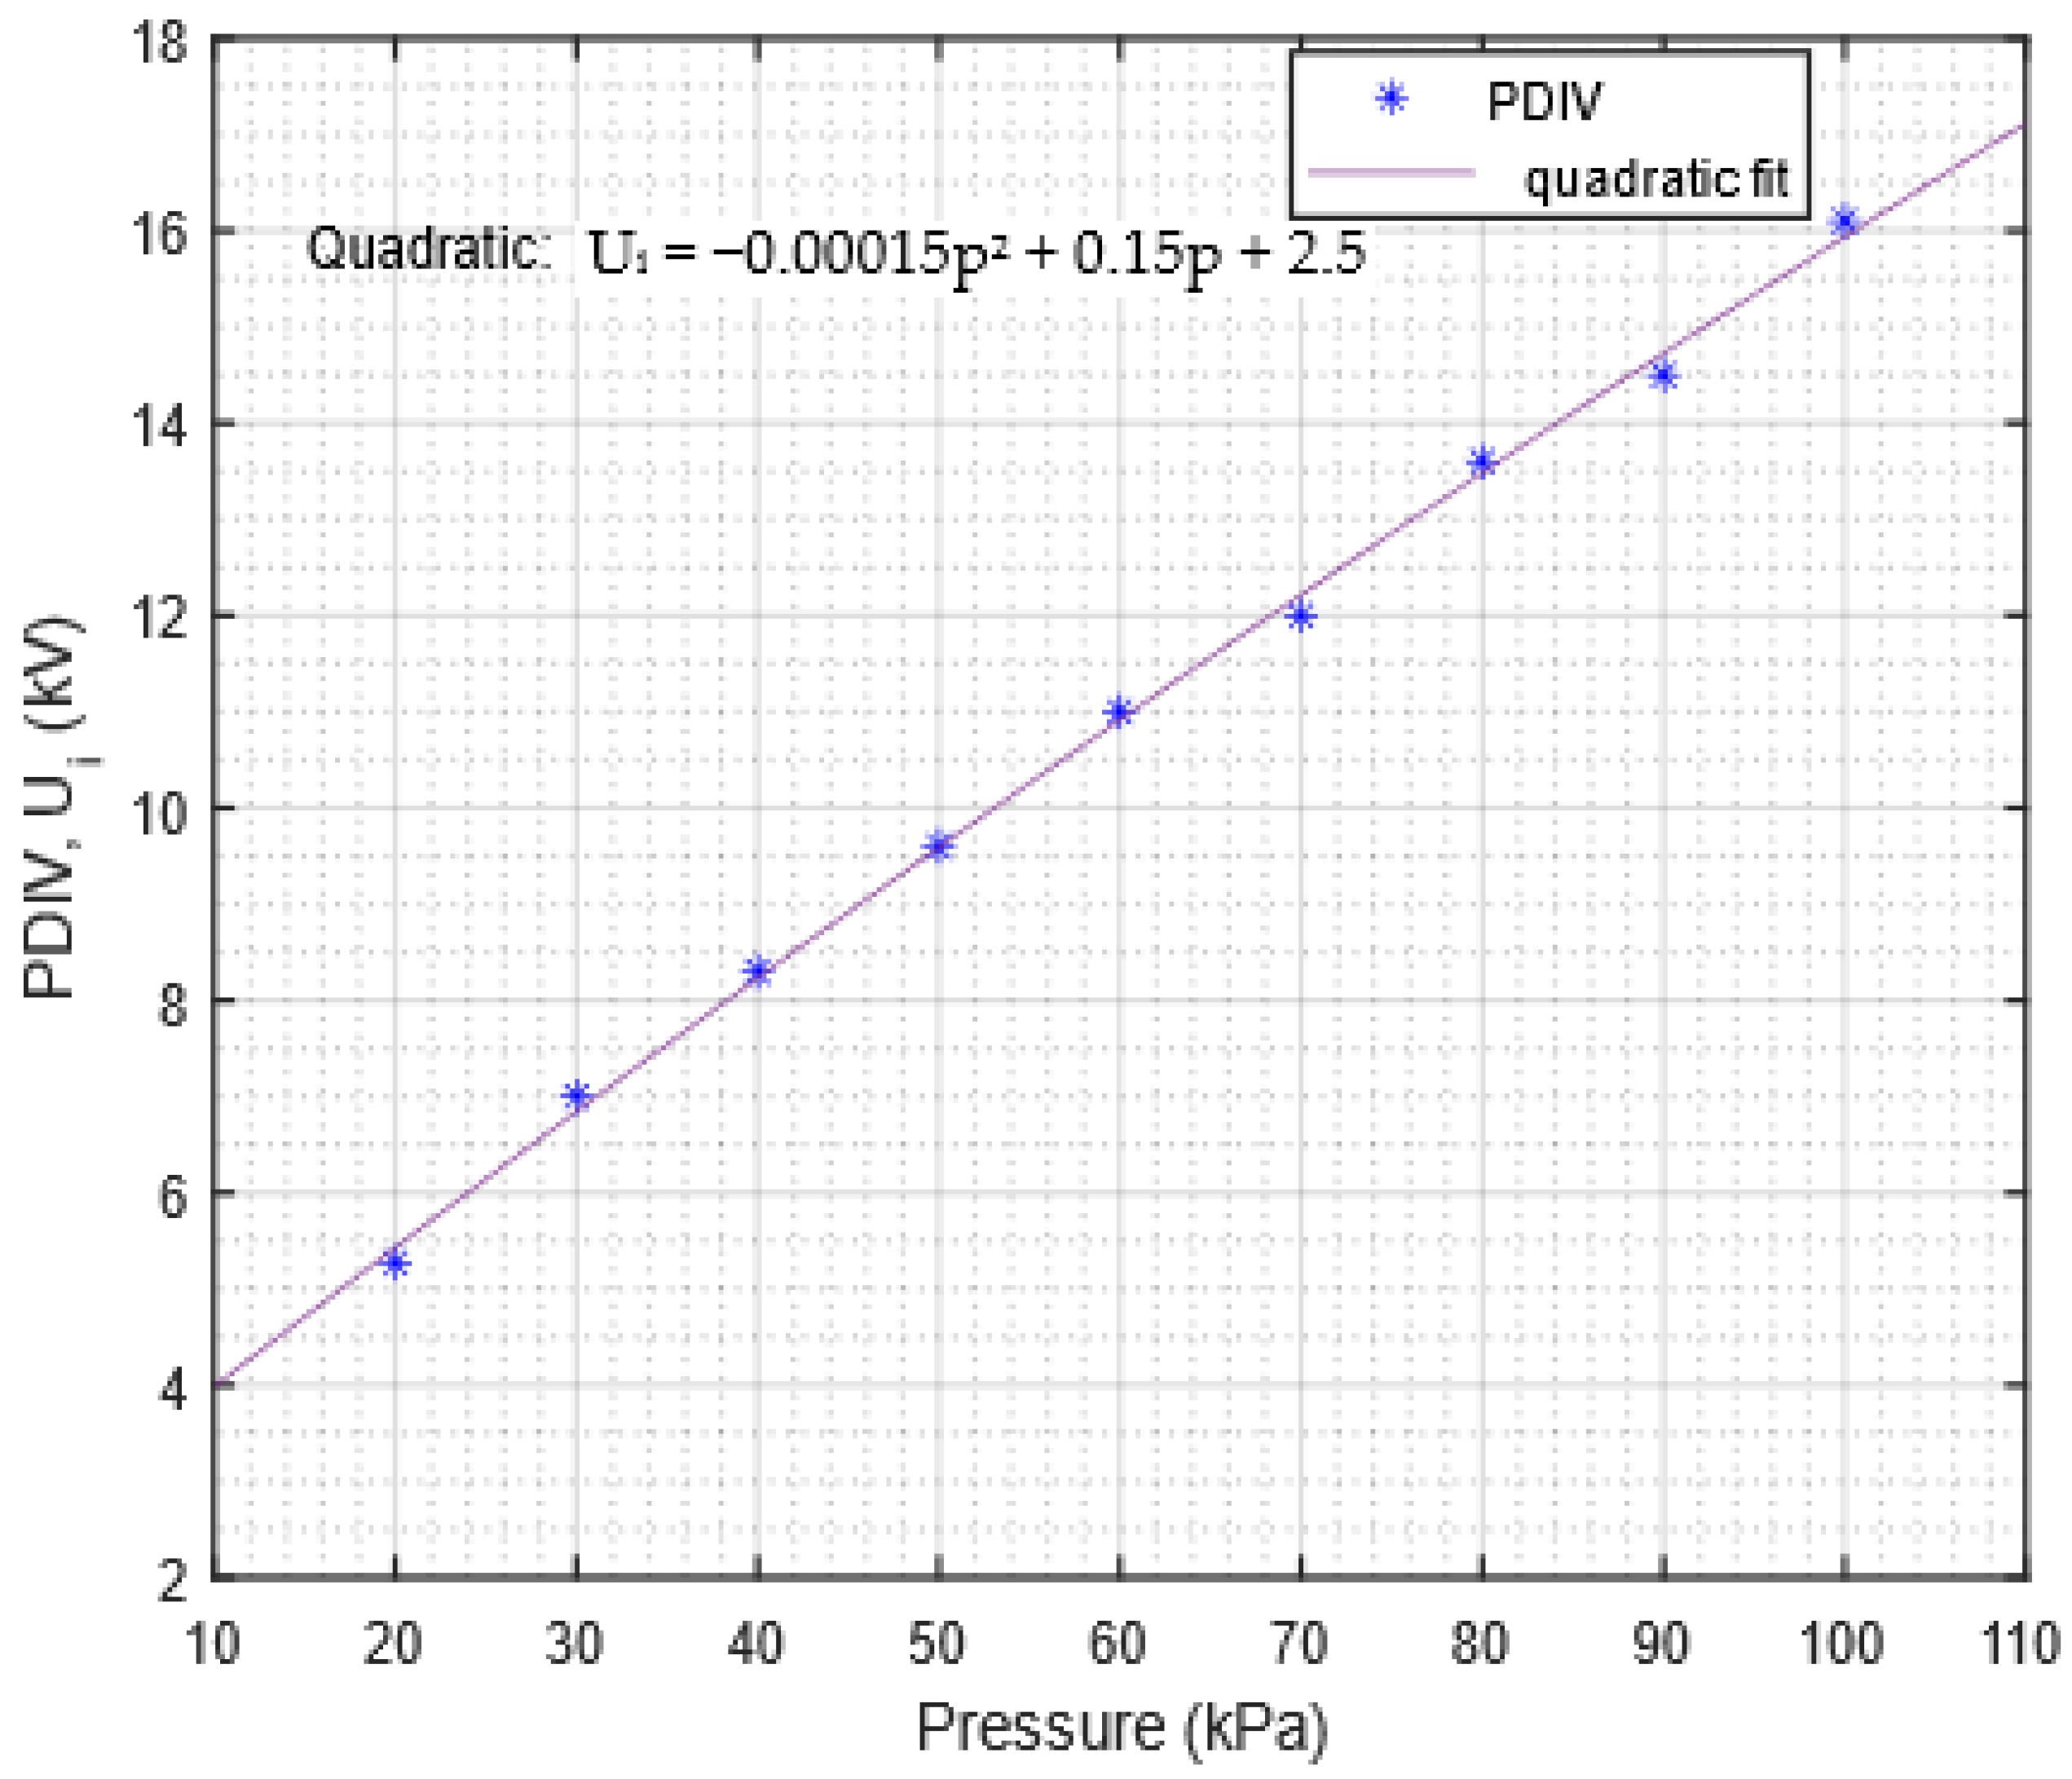
3.1. PDIV vs. Pressure

The first parameter that was determined through the experiments was the partial discharge inception voltage (PDIV), shown in Figure 4.

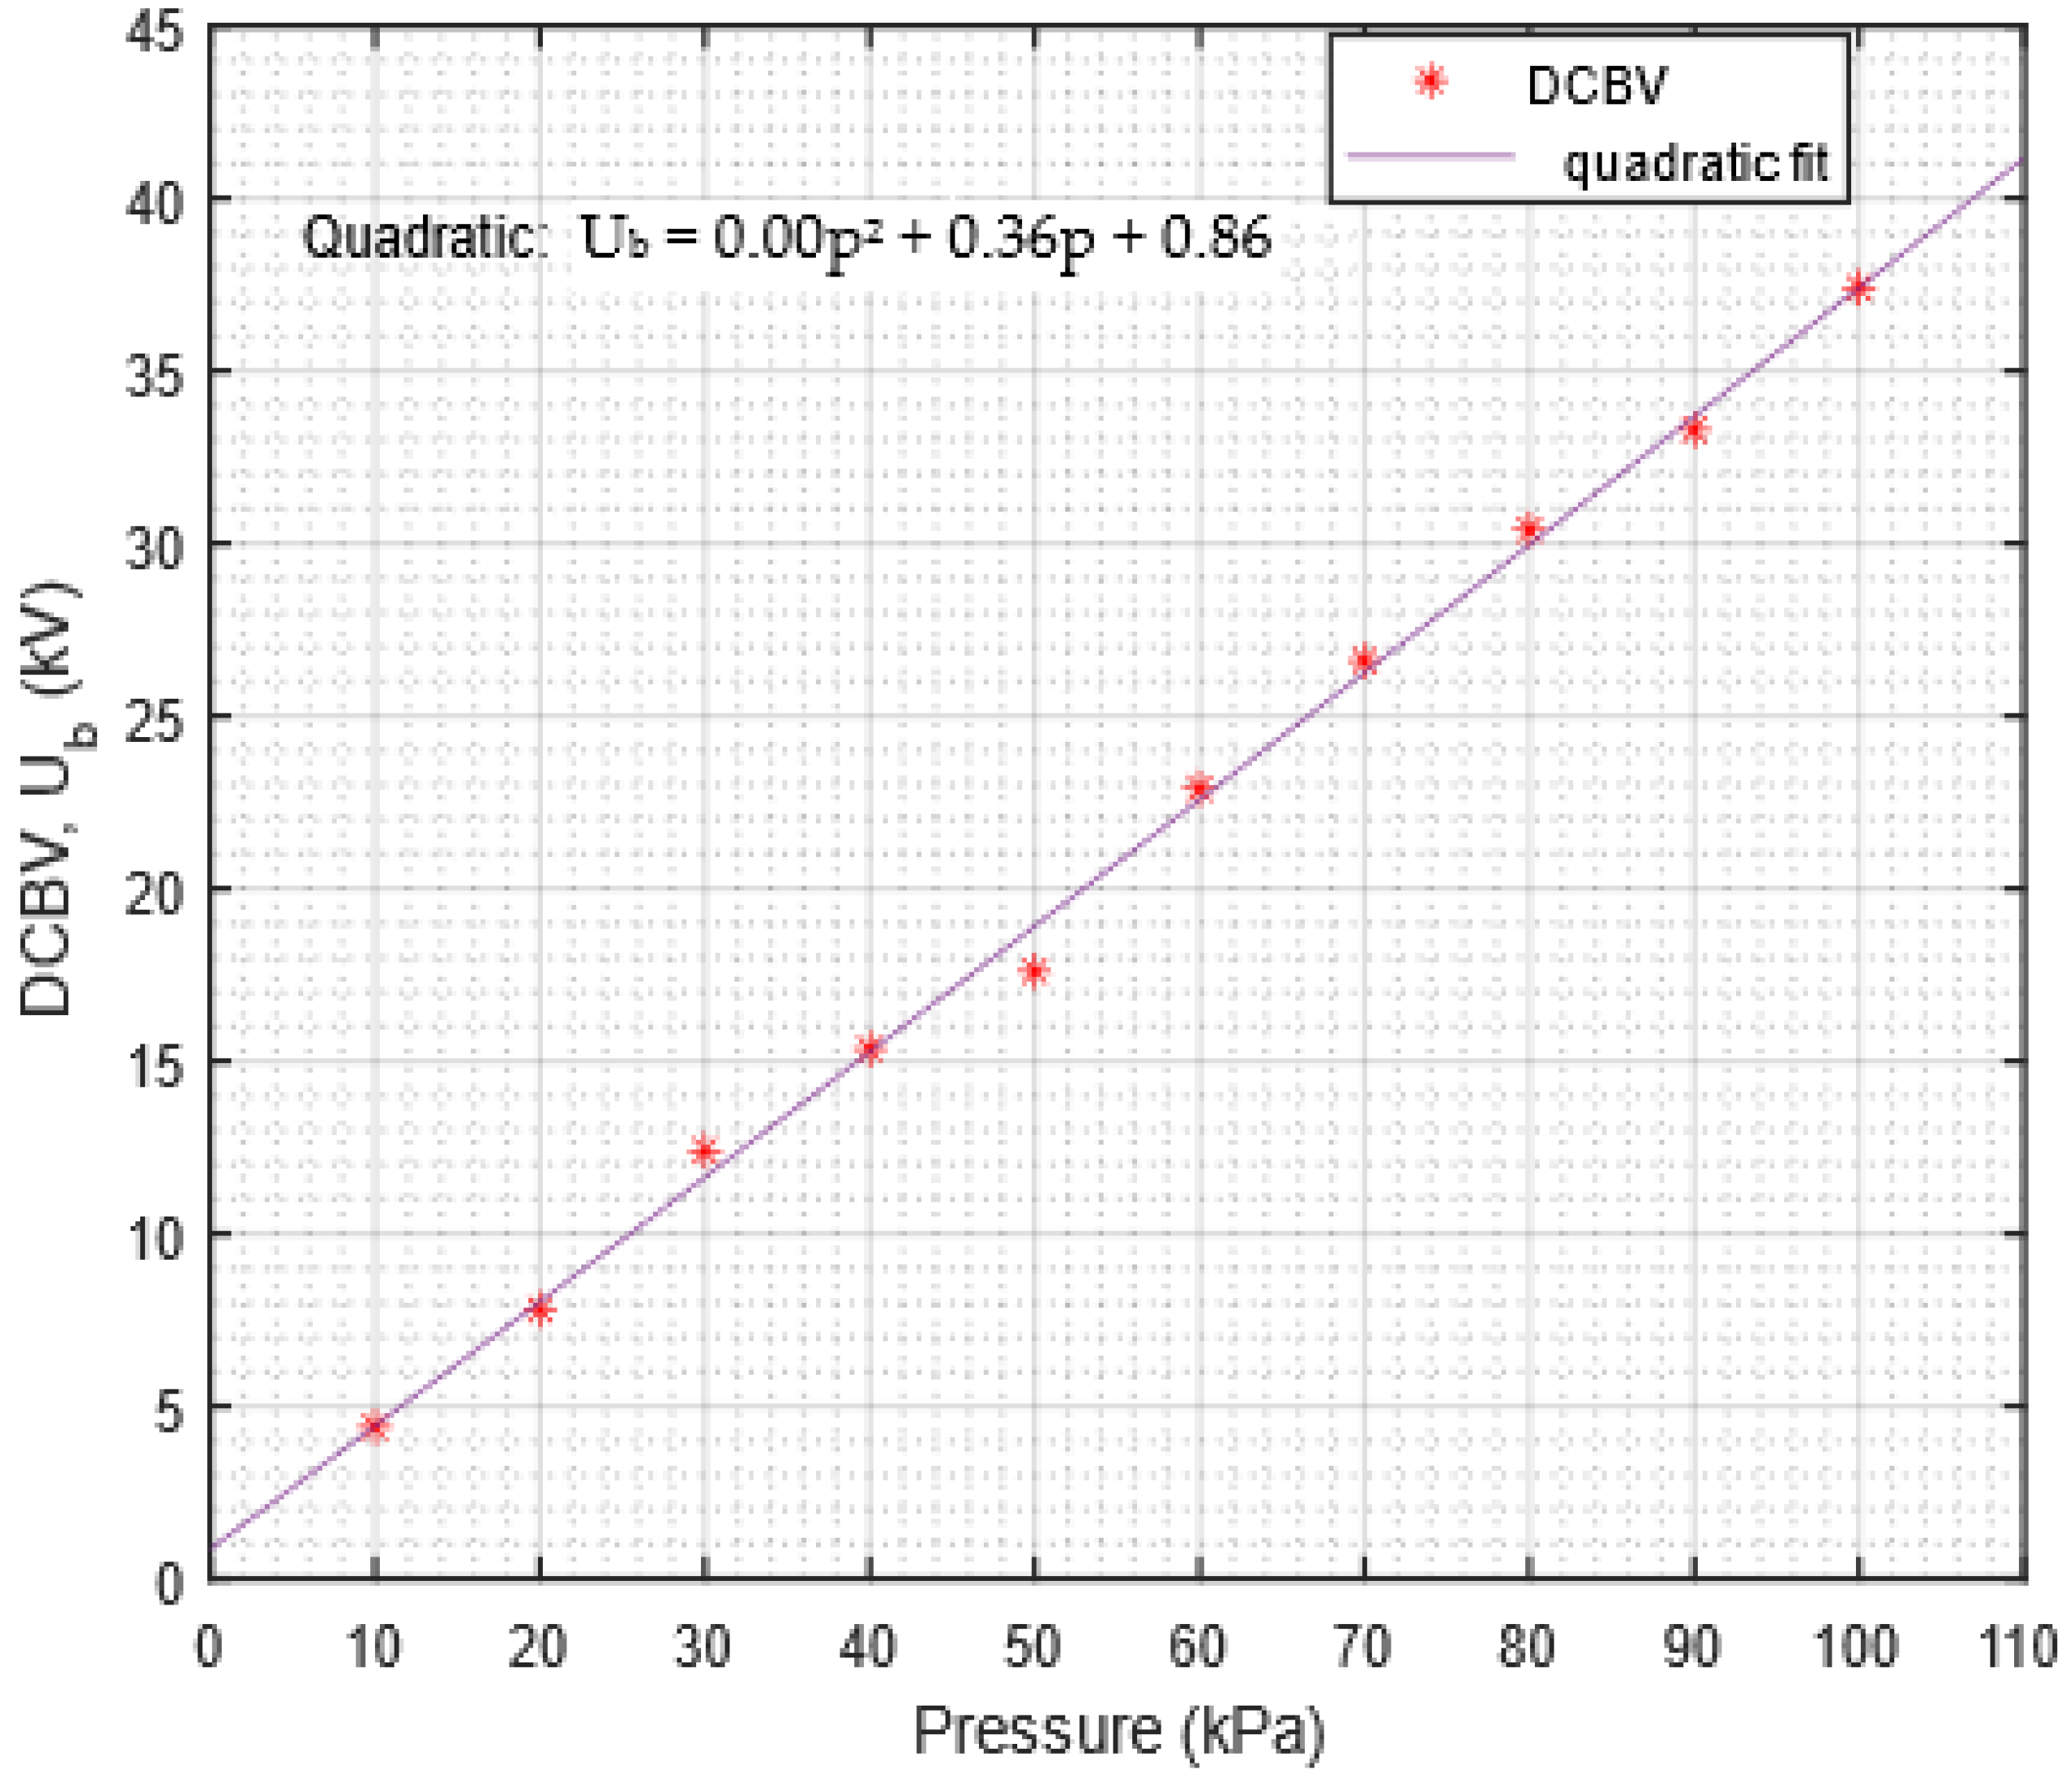
3.2. Breakdown Voltage vs. Pressure

The plot of DC breakdown voltage (DCBV) vs. pressure showed a linear increase. A polynomial in the order of 2 was fitted into the data and the coefficient of the second order term was almost zero, indicating that the increase was almost linear for the considered pressure range. The plot is shown in Figure 5.

3.3. ΔU vs. Pressure

The difference between DCBV and PDIV was calculated and plotted against pressure. This plot shows a slight dip at 50 kPa. Similar to other plots, a second-order polynomial was fitted into the data. This plot is shown in Figure 6.

3.4. Discussions

The design of insulation for various electrification components is a challenging task, especially when the behavior of the insulation is unknown. Studying the PD behavior of insulation helps in assessing its efficiency. While designing insulation for any system, air is always present, and it is also one of the major insulators. It is necessary to study the PD behavior of air at aviation range pressures to understand its restrictions and constraints better. The obtained experimental data were plotted against each pressure, and a curve of degree two was fitted. The equation for a polynomial fit model for the PDIV vs. pressure plot is as follows
Ui = −0.00015p2 + 0.15p + 2.5, 20 kPa ≤ p ≤ 101 kPa
where Ui is PDIV in kV, and pressure (p) is in kPa.
For the plot of DCBV vs. pressure, the equation of the quadratic fit is given by
Ub = 0.00p2 + 0.36p + 0.86, 20 kPa ≤ p ≤ 101 kPa
where Ub is the DCBV in kV, and pressure (p) is in kPa.
For ΔU vs. pressure, the polynomial fit equation is
ΔU = 0.00026p2 + 0.2p − 1.6, 20 kPa ≤ p ≤ 101 kPa
where ΔU is in kV, and pressure (p) is in kPa.
Using the above equations obtained from polynomial fitting, the values of PDIV and ΔU were calculated for 10 kPa pressure. The values of PDIV and ΔU, obtained from Equations (1) and (3), respectively, are 3.985 kV and 0.426 kV. When we calculate the difference between the calculated PDIV and the experimentally determined DCBV for 10 kPa pressure, we obtain a value of 0.415 kV. This value is nearly identical to the predicted value of ΔU from the model, which is 0.426 kV. This shows that the model can accurately predict PDIV and DCBV for pressures below atmospheric pressure with a plausible error of 1 kV. This can be highly beneficial when estimating the insulation requirements in an AEA. The value of R2 was also calculated for each fitting. Usually, the value of R2 is between 0 and 1. Being close to 0 means that the fitting is not the best fit, and close to 1 indicates it is the best fit. The values of R2 obtained for PDIV, DCBV, and ΔU are 0.9981, 0.9971, and 0.9921, respectively. It is evident from these values that using quadratic polynomials is the best fit for the model. This almost linear behavior of PDIV and BDV with pressure in Figure 4 and Figure 5, considering that the coefficients of the square terms are almost zero, can be attributed to the diminished dielectric strength of air in low-pressure environments. At lower air pressure, the insulation strength of any gaseous dielectric reduces, leading to lower PDIVs. The justification for the diminished dielectric strength can be sought from the ideal gas law (PV = nRT), according to which, as the pressure (P) decreases, the density (n/V) of the gas for a given volume decreases, which in turn directly affects the dielectric strength as well as the mean free path.
The plot in Figure 7 is drawn between the total charge in a one-minute duration vs. the voltage steps with increments of 5% PDIV until the breakdown is achieved. Table A1 in Appendix A provides the data for making this plot. The highest points where the charge attained its peak were marked on the plot. From observation, the range of pressures can be sub-categorized into three classes, as shown in Figure 8. The first range of pressures is the near sea-level pressures, which comprise pressures below 101 kPa, which is the normal atmospheric pressure at sea-level until 70 kPa (70 kPa ≤ p < 101 kPa). The second pressure range is the takeoff and descent pressure range (30 kPa ≤ p ≤ 80 kPa), where the aircraft spends only a few minutes of its total flight time, but the variation in pressure is very drastic. The third classification of pressures is the cruising pressures (p ≤ 40 kPa), where the aircraft dwells for most of its flight time.
In a study published by Florkowski et al., for pressures over 1 atm, it was observed that the number of pulses continues to increase to a peak value and gradually decreases before complete breakdown [14]. This was the trend that authors expected to see in this work for sub-atmospheric pressures. As expected, for pressures above 40 kPa, the authors could see a partly pulseless region, characterized by a continuous current that flows from the cathode to the ground. However, it was unprecedented not to see the partly pulseless region for the cruising altitude pressures. The authors presume that this can be due to the higher sensitivity of the PD pulsation to the applied voltage level and rate and the limitations in controlled voltage application of the DC Hipot, which can increase the voltage in steps of 0.1 kV only. The authors also consider the possibility of having a complete ionization of the interelectrode air at low pressures due to the scarcity of air molecules inside. This ionization of air inside the chamber was confirmed by the ozone formation in the chamber, which was characterized by a strong pungent smell upon opening the chamber. These variations in the behavior or air discharges at various pressures were marked in the plot of total charge vs. % PDIV in Figure 7.
It was also found that detecting PDIV required very low voltage rise rates since the difference in voltage between PD inception and breakdown was relatively low at lower pressures. It is hard to detect PDIV at lower pressures if the voltage is increased rapidly. For this reason, the authors used a voltage rise rate of 100 V/s, which they established through their previous work in [13].

4. Conclusions

This study offers crucial insights into the partial discharge (PD) behavior and breakdown voltage (BDV) of air under sub-atmospheric pressures relevant to the design of electrical power systems (EPSs) for all-electric aircraft (AEA). By simulating aviation pressures in a controlled environment, it was found that both PDIV and BDV are significantly pressure-dependent, increasing with higher pressures. The research established a polynomial regression model to predict PDIV and BDV, which can aid in designing robust insulation systems for AEAs. Based on the discharge behavior, this study defined three distinct pressure ranges with overlapping boundaries: near sea-level, takeoff and descent, and cruising altitude, each with unique PD characteristics. These findings highlight the need to carefully consider insulation requirements at various flight pressures to ensure EPS reliability. In conclusion, the pressure-dependent variations in PDIV and BDV emphasize the importance of designing insulation systems capable of withstanding high-altitude conditions. The models derived from this study help predict the insulation performance, which is crucial for the safe and efficient operation of AEAs. However, it should be noted that this model is confined and specific to the particular air gap used in the test configuration and varies when the gap distance or the electrode geometry is varied. Future research will focus on exploring the dependency of PDIV and BDV on gap distance and electrode configuration for a better understanding of the air discharge behavior to develop sustainable electrical systems for next-generation aviation technology.

Author Contributions

Conceptualization, S.P.K., M.H., A.B. and M.G.; methodology, S.P.K., M.H., A.B. and M.G.; validation, S.P.K., M.H., A.B. and M.G.; formal analysis, S.P.K., M.H., A.B. and M.G.; investigation, S.P.K., M.H., A.B. and M.G.; writing—original draft preparation, S.P.K., M.H. and A.B.; writing—review and editing, M.G.; supervision, M.G.; project administration, M.G.; funding acquisition, M.G. All authors have read and agreed to the published version of the manuscript.

Funding

This research was supported in part by the U.S. Department of Energy (DOE) Office of Science under Award DE-SC0024733.

Data Availability Statement

Data are contained within the article.

Conflicts of Interest

The authors declare no conflicts of interest.

Appendix A

Table A1. Data obtained from MPD 800 data acquisition unit.
Pressure (kPa)Voltage Step (%PDIV)Average Number of Pulses (N)Average Charge per Pulse, Q (nC)Total Charge in 1 min * (mC)
201564,3351.540.869
1.05925,2961.551.434
1.101,210,4691.491.803
1.151,632,7951.42.285
1.202,007,7631.362.730
1.252,314,6521.303.009
1.302,835,7371.193.374
1.353,413,8231.093.721
1.404,134,3950.9714.014
1.455,318,4060.8254.387
3013301.39~0.000
1.05288,6681.200.346
1.10971,8021.271.234
1.151,332,1171.171.558
1.201,691,1771.131.911
1.251,980,4001.082.138
1.302,349,2621.032.419
1.352,691,5080.982.637
1.403,166,3800.953.008
1.453,587,0330.893.192
1.504,328,7640.803.463
1.555,000,2090.713.550
1.605,993,1300.633.775
1.657,388,5220.594.359
1.709,244,2250.524.806
1.7511,058,5690.475.197
4011861.01~0
1.0511,2461.220.013
1.10611,2181.270.776
1.15865,7021.231.064
1.201,336,3111.031.376
1.251,585,8511.031.633
1.301,893,6160.971.836
1.352,228,6370.932.072
1.402,556,4010.902.300
1.452,914,9710.872.536
1.503,204,5590.842.691
1.553,669,9390.792.899
1.604,094,8150.743.030
1.654,756,8630.663.139
1.7025,6330.600.0153
1.7590.23~0
1.80180.23~0
5012780.54~0
1.0525,6381.330.034
1.10212,5401.270.269
1.15905,1831.241.122
1.201,278,0201.161.482
1.251,649,7660.951.567
1.301,881,6230.901.693
1.352,123,6880.871.847
1.402,340,5400.751.755
1.453,055,0660.662.016
1.504,588,9370.462.110
1.554,534,5460.492.221
1.60160.24~0
1.65220.22~0
1.70270.23~0
1.75290.24~0
1.80420.23~0
6013120.09~0
1.0514,8400.460.006
1.10500,4450.4320.216
1.15579,8610.500.289
1.20791,1130.500.395
1.251,237,9540.4320.534
1.301,689,0840.3560.601
1.352,008,4120.3170.636
1.402,400,9420.2940.705
1.452,657,1590.2780.738
1.502,878,2600.2690.774
1.553,129,3250.2580.807
1.603,485,9410.2460.857
1.654,310,6570.2000.862
1.705,370,7180.1670.896
1.7510.08~0
1.80220.103~0
1.8565600.1950.001
1.9080310.080.000
1.9514,4410.0770.001
2.0021,4290.0750.001
2.0529,0450.0740.002
701300.6220
1.0564960.9880.006
1.1061,6561.110.068
1.15126,3091.150.145
1.20221,0231.140.251
1.251,075,3930.9881.062
1.301,386,7230.9291.288
1.351,795,3400.7821.403
1.402,156,0080.6691.442
1.452,418,5090.6221.504
1.502,627,2850.6031.584
1.552,852,6600.5851.668
1.603,027,8240.5631.704
1.653,422,3390.5211.783
1.704,171,8170.4141.727
1.75000
1.80000
1.85000
1.901030.551~0
1.9512070.650~0
2.0070630.3280.002
2.0522,9700.1680.003
2.1035,3670.1650.005
2.1547,1550.1620.007
2.2057,8880.1580.009
801320.56~0
1.0556010.930.005
1.1049,1070.9750.047
1.15154,2401.090.168
1.20549,8210.680.373
1.25997,3870.9480.945
1.301,389,5270.9081.261
1.351,794,8530.8031.441
1.402,274,7600.6591.499
1.452,580,3790.6041.558
1.502,787,2120.5781.611
1.553,063,3250.5501.684
1.603,399,3670.5091.730
1.653,930,6910.4671.835
1.704,180,1360.4241.772
1.7519690.4920.000
1.8010,9240.3620.003
1.8514,1140.1510.002
1.9022,5680.1490.003
1.9533,0670.1470.004
2.0040,8900.1460.005
2.0552,2630.1450.007
2.1062,9720.1420.008
2.1575,0120.1400.010
2.2090,2840.1370.012
901800.067~0
1.0545,4110.0870.003
1.10160,6280.1050.016
1.15364,0790.1120.040
1.20923,8330.0520.048
1.251,309,1250.0410.053
1.301,381,3990.0530.073
1.351,662,0930.04650.077
1.401,907,1030.04150.079
1.452,488,5560.06220.154
1.502,810,0460.05670.159
1.553,160,3820.05330.168
1.603,709,4010.04880.181
1.653,921,1240.04570.179
1.704,281,2770.04320.184
1.754,653,5660.04020.187
1.80386,2800.0380.014
1.8574470.041~0
1.9014,2500.0159~0
1.9521,0050.0158~0
2.0028,8250.0157~0
2.0538,8570.0155~0
2.1045,3490.0153~0
2.1530,9320.0151~0
2.201430.0155~0
2.25250.0169~0
1011.00430.424~0
1.0515,0630.632~0
1.10352,1230.6150.216
1.15247,7620.8770.217
1.201,973,3140.2110.416
1.252,013,7530.3460.696
1.307,528,5630.04860.365
1.356,679,2250.1030.687
1.404,987,3750.2331.162
1.453,977,9230.3411.356
1.503,334,0840.4361.453
1.553,369,3540.4401.482
1.603,946,0070.3951.558
1.654,465,6410.3651.629
1.705,016,7480.3411.710
1.755,458,8600.3111.697
1.805,708,2300.2921.666
1.8596,1710.005160.000
1.9013,9990.1060.001
1.9521,7900.1060.002
2.0031,0000.1060.003
2.0541,5150.1060.004
2.10450,9160.1060.047
2.1561,1190.1040.006
2.2076,5680.1030.007
2.2593,7250.1020.009
2.30110,6190.09970.011
*—As recorded by the PD detection unit. (This might not be the actual scenario).

References

  1. IEA. Aviation. Available online: https://www.iea.org/energy-system/transport/aviation (accessed on 4 March 2024).
  2. Wheeler, P.; Bozhko, S. The More Electric Aircraft: Technology and challenges. IEEE Electrific. Mag. 2014, 2, 6–12. [Google Scholar] [CrossRef]
  3. Jones, R.I. The More Electric Aircraft: The past and the future? In Proceedings of the IEE Colloquium on Electrical Machines and Systems for the More Electric Aircraft, London, UK, 9 November 1999. [Google Scholar]
  4. Saha, A.; Azizi, A.; Ghassemi, M. Optimal Bipolar MVDC Power Cable Designs for Future Wide-Body All Electric Aircraft. IEEE Trans. Dielectr. Electr. Insul. 2024. [Google Scholar] [CrossRef]
  5. Saha, A.; Ghassemi, M. Optimized Design of ±5 kV, 1 kA Rectangular Power Cable for a Low Pressure of 18.8 kPa for Envisioned All-Electric Wide-Body Aircraft. IEEE Access 2024, 12, 28654–28665. [Google Scholar] [CrossRef]
  6. Sumsurooah, S.; He, Y.; Torchio, M.; Kouramas, K.; Guida, B.; Cuomo, F.; Atkin, J.; Bozhko, S.; Renzetti, A.; Russo, A.; et al. ENIGMA—A Centralised Supervisory Controller for Enhanced Onboard Electrical Energy Management with Model in the Loop Demonstration. Energies 2021, 14, 5518. [Google Scholar] [CrossRef]
  7. Russo, A.; Guida, B.; Canciello, G.; Cavallo, A. 13—Energy system management for aeronautic and aerospace applications: Demonstration and study cases, Hybrid Technologies for Power Generation. In Hybrid Energy Systems; Faro, M.L., Barbera, O., Giacoppo, G., Eds.; Academic Press: New York, NY, USA, 2022; pp. 373–418. [Google Scholar]
  8. Air—Density and Specific Volume, vs. Altitude. Available online: https://www.engineeringtoolbox.com/air-altitude-density-volume-d_195.html (accessed on 4 March 2024).
  9. Borghei, M.; Ghassemi, M. Insulation Materials and Systems for More- and All-Electric Aircraft: A Review Identifying Challenges and Future Research Needs. IEEE Trans. Transp. Electrif. 2021, 7, 1930–1953. [Google Scholar] [CrossRef]
  10. Arora, R.; Mosch, W. Field Dependent behavior of Air and Other Gaseous Dielectrics. In High Voltage and Electrical Insulation Engineering; John Wiley & Sons, Ltd.: New York, NY, USA, 2011. [Google Scholar]
  11. Driessen, A.B.J.M.; van Duivenbode, J.; Wouters, P.A.A.F. Partial discharge detection for characterizing cable insulation under low and medium vacuum conditions. IEEE Trans. Dielectr. Electr. Insul. 2018, 25, 306–315. [Google Scholar] [CrossRef]
  12. Jiang, J.; Zhang, B.; Li, Z.; Zhang, C.; Ranjan, P.; Zhang, X. Partial Discharge Investigation under Low Air Pressure and Variable Frequency for More-Electric-Aircraft. IEEE Trans. Dielectr. Electr. Insul. 2021, 28, 1793–1801. [Google Scholar] [CrossRef]
  13. Götz, T.; Kosse, M.; Riechert, U.; Abbasi, A.; Castellon, J.; Cavallini, A.; Esterl, F.; Geissler, M.; Hochbrückner, B. Interim Report of WG D1.63: Progress on Partial discharge detection under DC voltage stress. In Proceedings of the International Colloquium on Power Transformers & Reactors, Overhead Lines; and Materials and Emerging Test Techniques (Under the Aegis of CIGRE SC A2 on Transformers; B2 on Overhead Lines and D1 on Materials), New Delhi, India, 21–22 November 2019. [Google Scholar]
  14. Florkowski, M.; Florkowska, B.; Zydron, P. Partial discharge forms for DC insulating systems at higher air pressure. IET Sci. Meas. Amp Technol. 2016, 10, 150–157. [Google Scholar] [CrossRef]
  15. Hamidieh, M.; Kalakonda, S.P.; Ghassemi, M. Influence of Aircraft-Environment Pressure Range on Negative DC Partial Discharge Inception Voltage. In Proceedings of the IEEE Texas Power and Energy Conference (TPEC), College Station, TX, USA, 2 December 2024; pp. 1–6. [Google Scholar]
  16. Hamidieh, M.; Ghassemi, M. Conic Cross-Sectional Electrodes and Their Influence on Negative Corona Discharge and Trichel Pulse Characteristics. IEEE Trans. Dielectr. Electr. Insul. 2024. [Google Scholar] [CrossRef]
Figure 1. Single-line diagram of the test circuit.
Aerospace 11 00444 g001
Figure 2. Actual test circuit.
Aerospace 11 00444 g002
Figure 3. Bridge between the electrodes.
Aerospace 11 00444 g003
Figure 4. PDIV vs. pressure.
Aerospace 11 00444 g004
Figure 5. DCBV vs. pressure.
Aerospace 11 00444 g005
Figure 6. ΔU vs. pressure.
Aerospace 11 00444 g006
Figure 7. Total charge vs. % PDIV.
Aerospace 11 00444 g007
Figure 8. Classification of sub-atmospheric pressures.
Aerospace 11 00444 g008
Table 1. Breakdown voltage and partial discharge inception voltage for different pressures obtained experimentally for a needle-to-plane electrode geometry with a 20 mm gap distance.
Pressure (kPa)Ui (kV), PDIVUb (kV), Breakdown VoltageΔU = Ub − Ui (kV)
104.4
205.277.82.53
30712.45.4
408.315.357.05
509.617.68
601122.911.9
701226.614.6
8013.630.416.8
9014.533.318.8
10116.137.421.3
Disclaimer/Publisher’s Note: The statements, opinions and data contained in all publications are solely those of the individual author(s) and contributor(s) and not of MDPI and/or the editor(s). MDPI and/or the editor(s) disclaim responsibility for any injury to people or property resulting from any ideas, methods, instructions or products referred to in the content.

