Abstract
During the high-speed flight of a vehicle in the atmosphere, surface friction with the air generates aerodynamic heating. The aerodynamic heating phenomenon can create extremely high temperatures near the surface. These high temperatures impact material properties and the structure of the aircraft, so thermal deformation measurement is essential in aerospace engineering. This paper revisits high-temperature deformation measurement using the digital image correlation (DIC) technique under high-intensity blackbody radiation with a precise speckle pattern fabrication and a heat haze reduction method. The effects of the speckle pattern on the DIC measurement have been thoroughly studied at room temperature, but high-temperature measurement studies have not reported such effects so far. We found that the commonly used methods to reduce the heat haze effect could produce incorrect results. Hence, we propose a new method to mitigate heat haze effects. An infrared radiation heater was employed to make an experimental setup that could heat a specimen up to 950 °C. First, we mitigated image saturation using a short-wavelength bandpass filter with blue light illumination, a standard procedure for high-temperature DIC deformation measurement. Second, we studied how to determine the proper size of the speckle pattern in a high-temperature environment. Third, we devised a reduction method for the heat haze effect. As proof of the effectiveness of our developed experimental method, we successfully measured the deformation of stainless steel 304 specimens from 25 °C to 800 °C. The results confirmed that this method can be applied to the research and development of thermal protection systems in the aerospace field.
1. Introduction
The significance of high-temperature deformation measurements is well known in the aerospace industry in the high-temperature environments encountered during flight. This includes the internal engine, aerodynamic heat on the aircraft’s skin during high-speed flight, and the elevated temperatures faced upon re-entry into the atmosphere. Understanding and quantifying the behavior and performance of materials in such high-temperature situations is critical [1,2]. High-temperature deformation measurements can explain important aspects of a material’s behavior under extreme thermal conditions. These measurements can derive the coefficient of thermal expansion (CTE), stress–strain relationships, and other pivotal material characteristics. These valuable data are instrumental in material selection, design, and use. They assist engineers in identifying materials optimally suited for high-temperature environments, designing components resilient to thermal stress, and making predictive assessments of material behavior in actual flight scenarios [3].
Traditional methods for measuring deformation, such as the use of strain gauges [4] and linear variable differential transformers (LVDTs) [5], face limitations in high-temperature environments [6]. Recently, the application of digital image correlation (DIC) systems for deformation measurement [7,8] in high-temperature conditions has gained increasing prominence among researchers [9,10,11,12,13,14,15]. DIC provides several advantages, including full-field measurements for capturing comprehensive deformation data, insensitivity to vibration to minimize external interference, the ability to measure large strain and significant rigid body motion, and adaptability to various specimen shapes. For instance, Lyons et al. employed DIC to measure full-field and in-plane deformation at 600 °C [16]. However, in high-temperature DIC deformation measurement, when the temperature of the specimen exceeds 600 °C, it is particularly critical to solve the high-intensity blackbody radiation problem. Grant et al. successfully mitigated the blackbody radiation issue by integrating a short-wavelength bandpass filter and monochromatic light illumination [17]. Based on that method, Pan et al. measured the deformation, Young’s modulus, and CTE of nickel-based alloys at 1000 °C [18]. Berke et al., Dong et al., and Dong and Pan conducted measurements at 1125 °C, 1400 °C, and 1868 °C using UV-DIC [19,20,21]. Furthermore, Pan et al. investigated the deformation of tungsten metal using DIC in an ultra-high-temperature environment of 3000 °C [22].
In this study, we performed high-temperature DIC deformation measurement under high-intensity blackbody radiation with a precise speckle pattern fabrication and a heat haze reduction method. An infrared radiation heater was employed to make an experimental setup that could heat a specimen to 950 °C. First, we mitigated image saturation caused by high-intensity blackbody radiation using a short-wavelength bandpass filter with blue light illumination, a standard procedure for high-temperature DIC deformation measurement. Second, we studied how to determine the proper size of the speckle pattern in a high-temperature environment. Third, we invented a reduction method for the heat haze effect. As proof of our developed experimental method, we successfully measured the deformation of stainless steel 304 specimens from 25 °C to 800 °C, which confirmed that this method can be applied to the research and development of thermal protection systems (TPSs) in the aerospace field.
2. Theory
Three key issues are encountered in the application of high-temperature DIC deformation measurements under high-intensity blackbody radiation: image saturation, reduced speckle pattern contrast, and the heat haze effect.
Image saturation is caused by thermal radiation emitted from a specimen at high temperatures. Thermal radiation, an electromagnetic emission from all objects above absolute zero, encompasses a broad spectrum, from infrared to ultraviolet wavelengths, with behavior consistent with the principle of blackbody radiation. With an increasing temperature, the peak of the emitted radiation moves to shorter wavelengths, and its intensity is amplified. This behavior has a significant impact on image capturing, such as DIC, since the CCD cameras used in this study are particularly sensitive to certain radiation wavelengths. Thus, understanding and solving the effects of high-intensity radiation is critical in ensuring accurate high-temperature DIC measurements.
Figure 1a plots the thermal radiation in the range of 500 to 1000 °C, displaying varying wavelengths and spectral radiance. With an increasing temperature, the emitted radiation shifts towards shorter wavelengths, and the spectral radiance rises. Planck’s blackbody radiation law, Equation (1), provides a clear expression of the relationship between the spectral radiance and the wavelength of an object at temperature T, thus elucidating the phenomenon of thermal radiation:
where I(λ,T) denotes the spectral radiance as a function of wavelength and temperature T, represents Planck’s constant, stands for the speed of light, is the Boltzmann constant, and is the base of the natural logarithm.
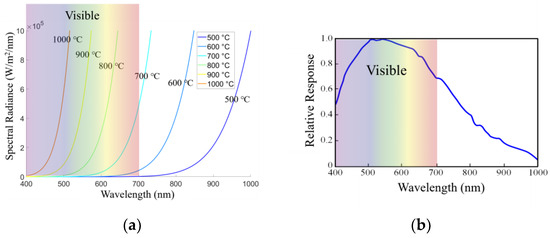
Figure 1.
Image saturation phenomenon: (a) spectral radiance versus wavelength in terms of surface temperature; (b) spectral response of a CCD camera sensor.
Figure 1b shows the CCD camera’s spectral response. CCD camera sensors exhibit distinct sensitivity to wavelengths of light, primarily within the range of 400 nm to 1000 nm, with a high response to visible light spanning 400 nm to 700 nm. As an object’s temperature increases and its thermal radiation enters the CCD’s sensitive range, the sensor may be overloaded, which creates a phenomenon called saturation. Saturation drastically reduces the contrast of captured images. This limitation is particularly problematic for DIC measurement. DIC relies heavily on high-contrast images for accurate measurements. Therefore, the sensor saturation and consequent contrast reduction impair the effectiveness of DIC [18].
Starting at 600 °C, the object emits visible light that the CCD camera sensor is sensitive to, which creates image saturation. Several researchers, including Grant et al. [17] and Pan et al. [18], addressed the image saturation issue by employing short-wavelength bandpass filters and monochromatic illumination. This effectively prevents light with high radiation intensity from entering the camera sensor. In this study, we used the same method to solve the image saturation with a short-wavelength bandpass filter and blue light illumination.
Second, the accuracy of DIC measurements depends significantly on the quality of the high-contrast speckle patterns [23]. To preserve these patterns from oxidation and debonding induced by high temperatures, various techniques have been employed by researchers: for instance, techniques such as automotive paint used by Turner and Russell [24], silicon carbide paper employed by Grant for grinding nickel-based superalloy specimens [17], and tungsten carbide applied by Guo for creating speckle patterns [25].
Typically, a speckle pattern is devised using black and white paint, one serving as the background and the other as randomly distributed dots. The size of the random dots in the speckle pattern is a critical requirement, and according to Equation (2), the dimension of the random dots should be 3~5 times the spatial resolution [26], where s is the dot size, V is the measuring volume, and r is the camera resolution. These parameters can be defined by calibration parameters. However, this approach has been used only in normal-temperature DIC measurements, without any existing research or utilization in the field of high-temperature DIC analysis. Based on the above, we created a high-contrast speckle pattern with an appropriate size that is suitable for high-temperature DIC measurements.
The final challenge is the heat haze effect. In high-temperature experiments, the heating apparatus not only elevates the specimen’s temperature but also impacts the surrounding air, which produces air turbulence [27]. This interference induces variations in the air’s refractive index, distorting light propagation, which is called the ‘heat haze effect’. This effect may significantly compromise the accuracy of imaging results, presenting a substantial challenge in high-temperature DIC measurements. Established solutions for mitigating this issue include the use of pneumatic devices [28], air knives [29], and electric fans [30]. However, these methods may change the airflow around the specimen, causing a decrease in the surrounding temperature. This difference can lead to an underestimation of the specimen’s actual temperature during measurements. Hence, we developed a novel approach to mitigate the heat haze effect by integrating a thick layer of thermal insulation in front of the experimental fixture.
3. Experimental Setup
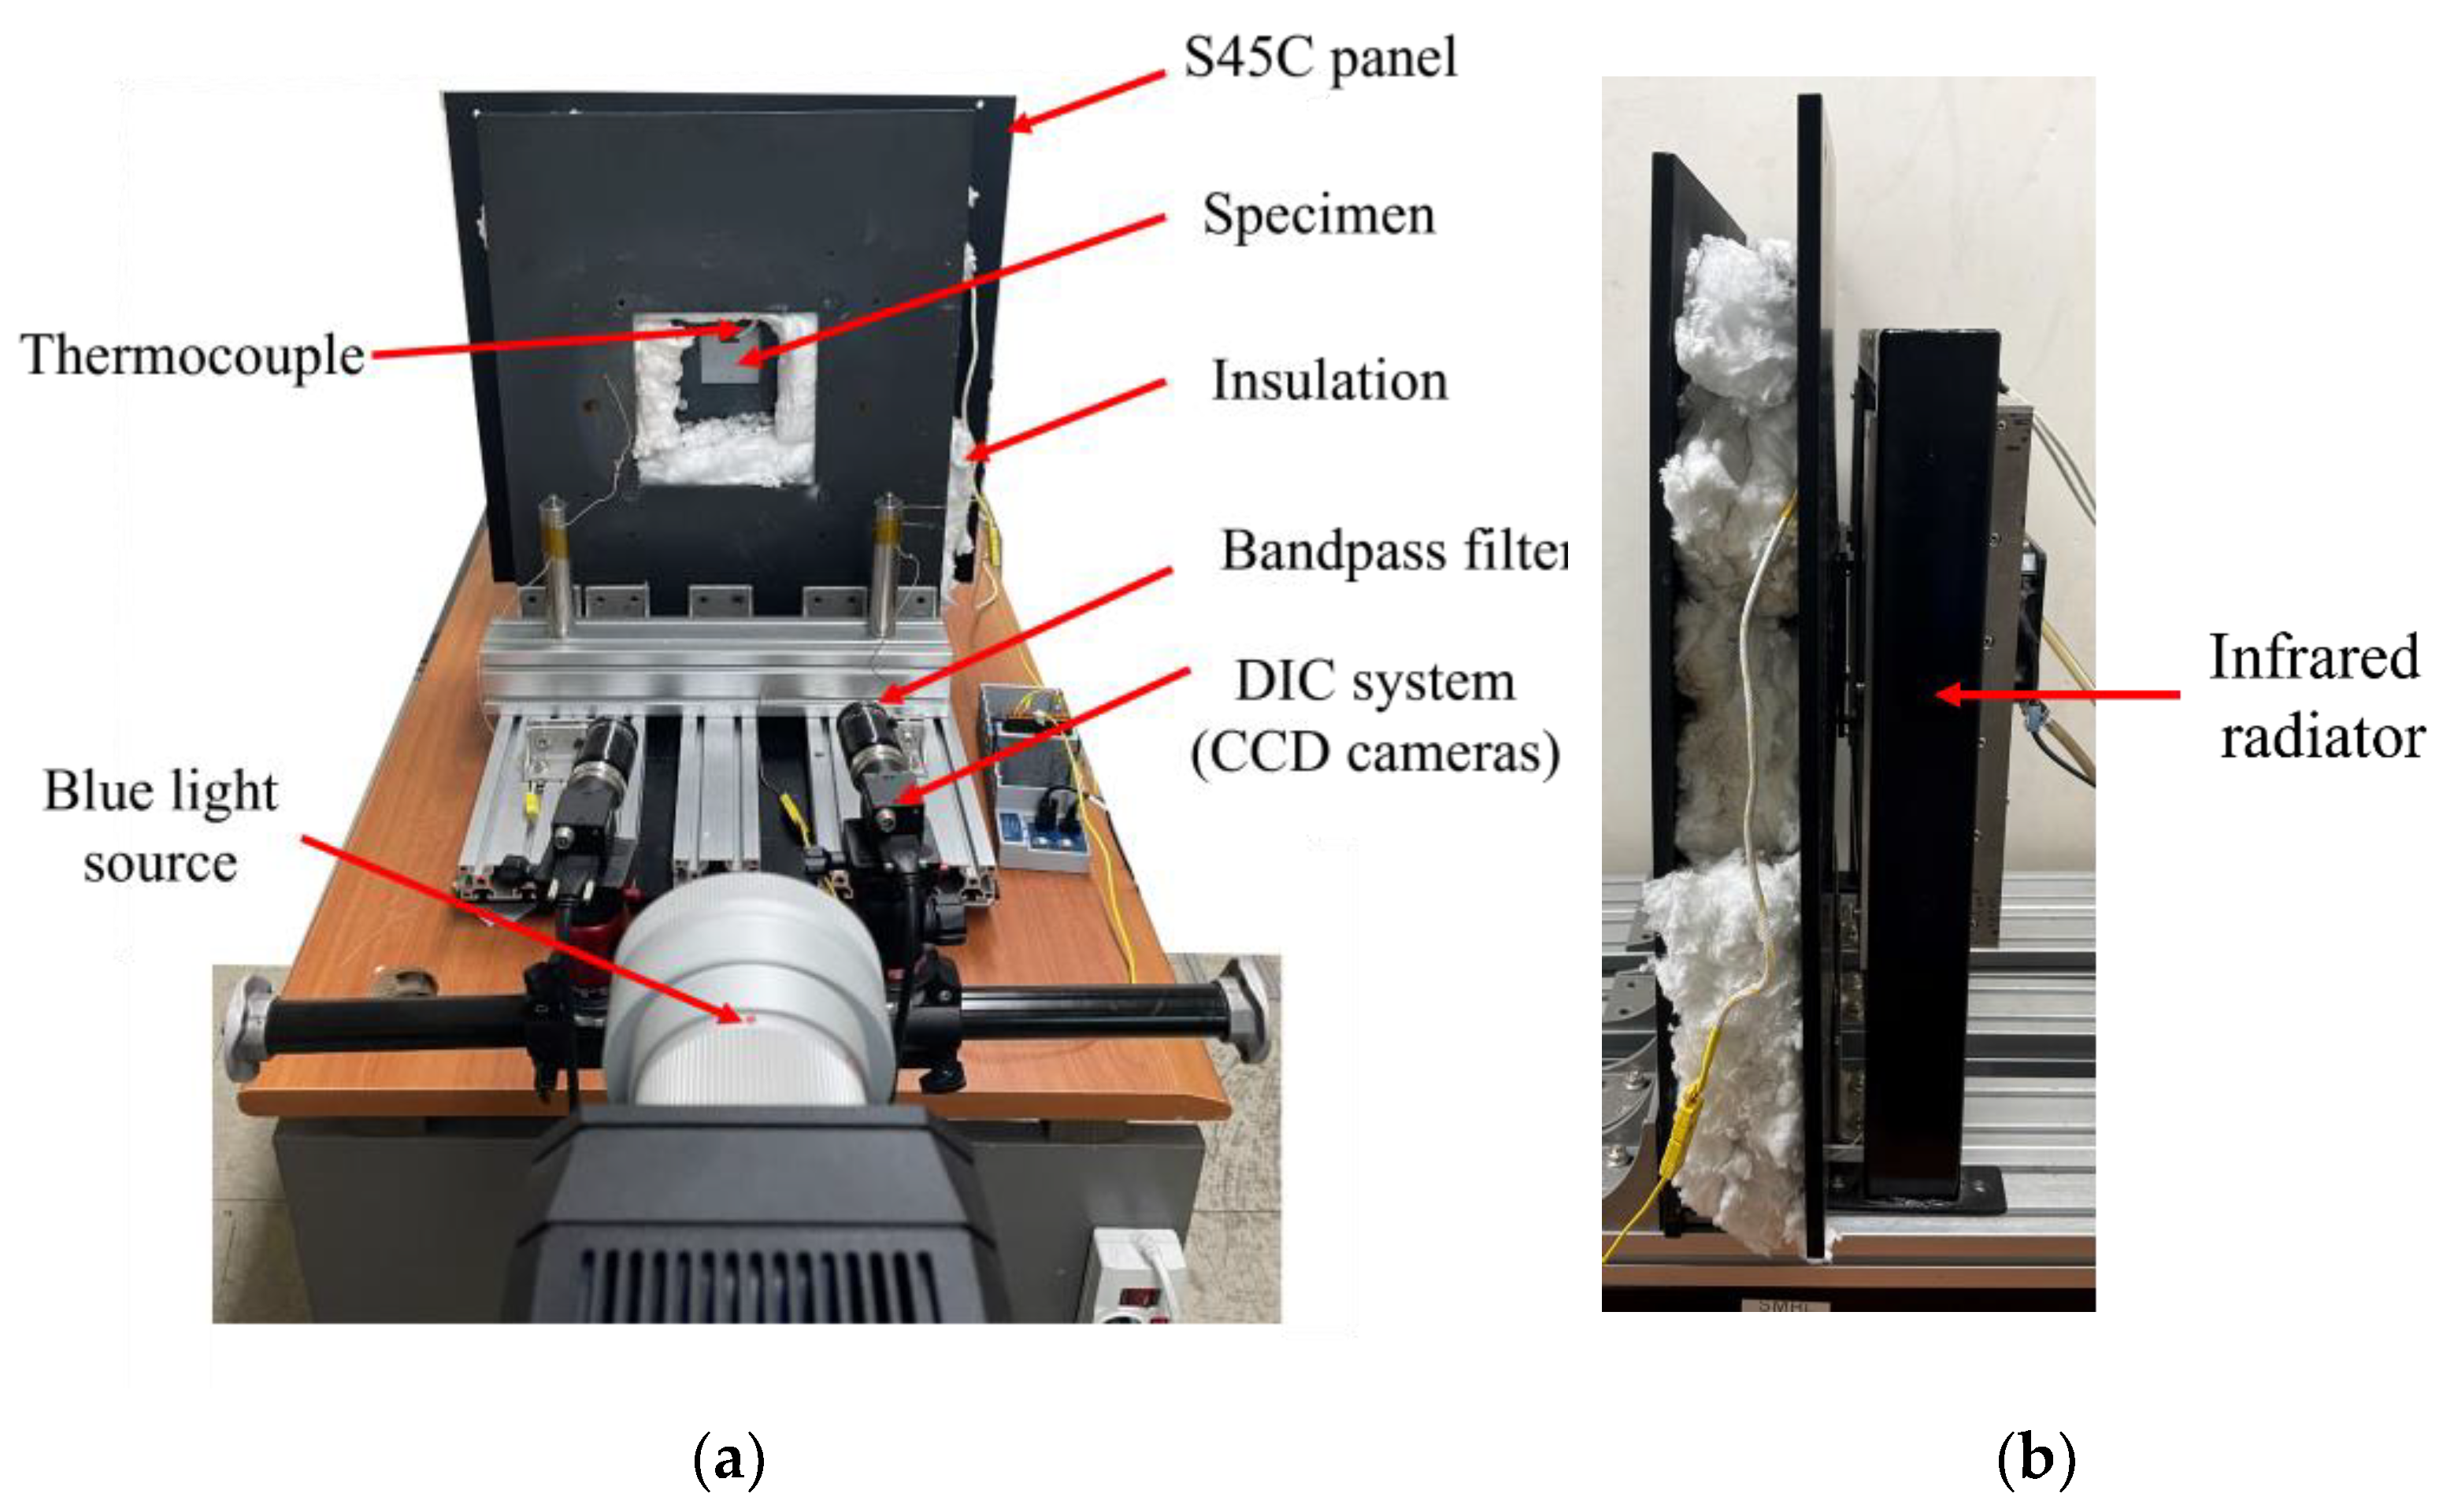
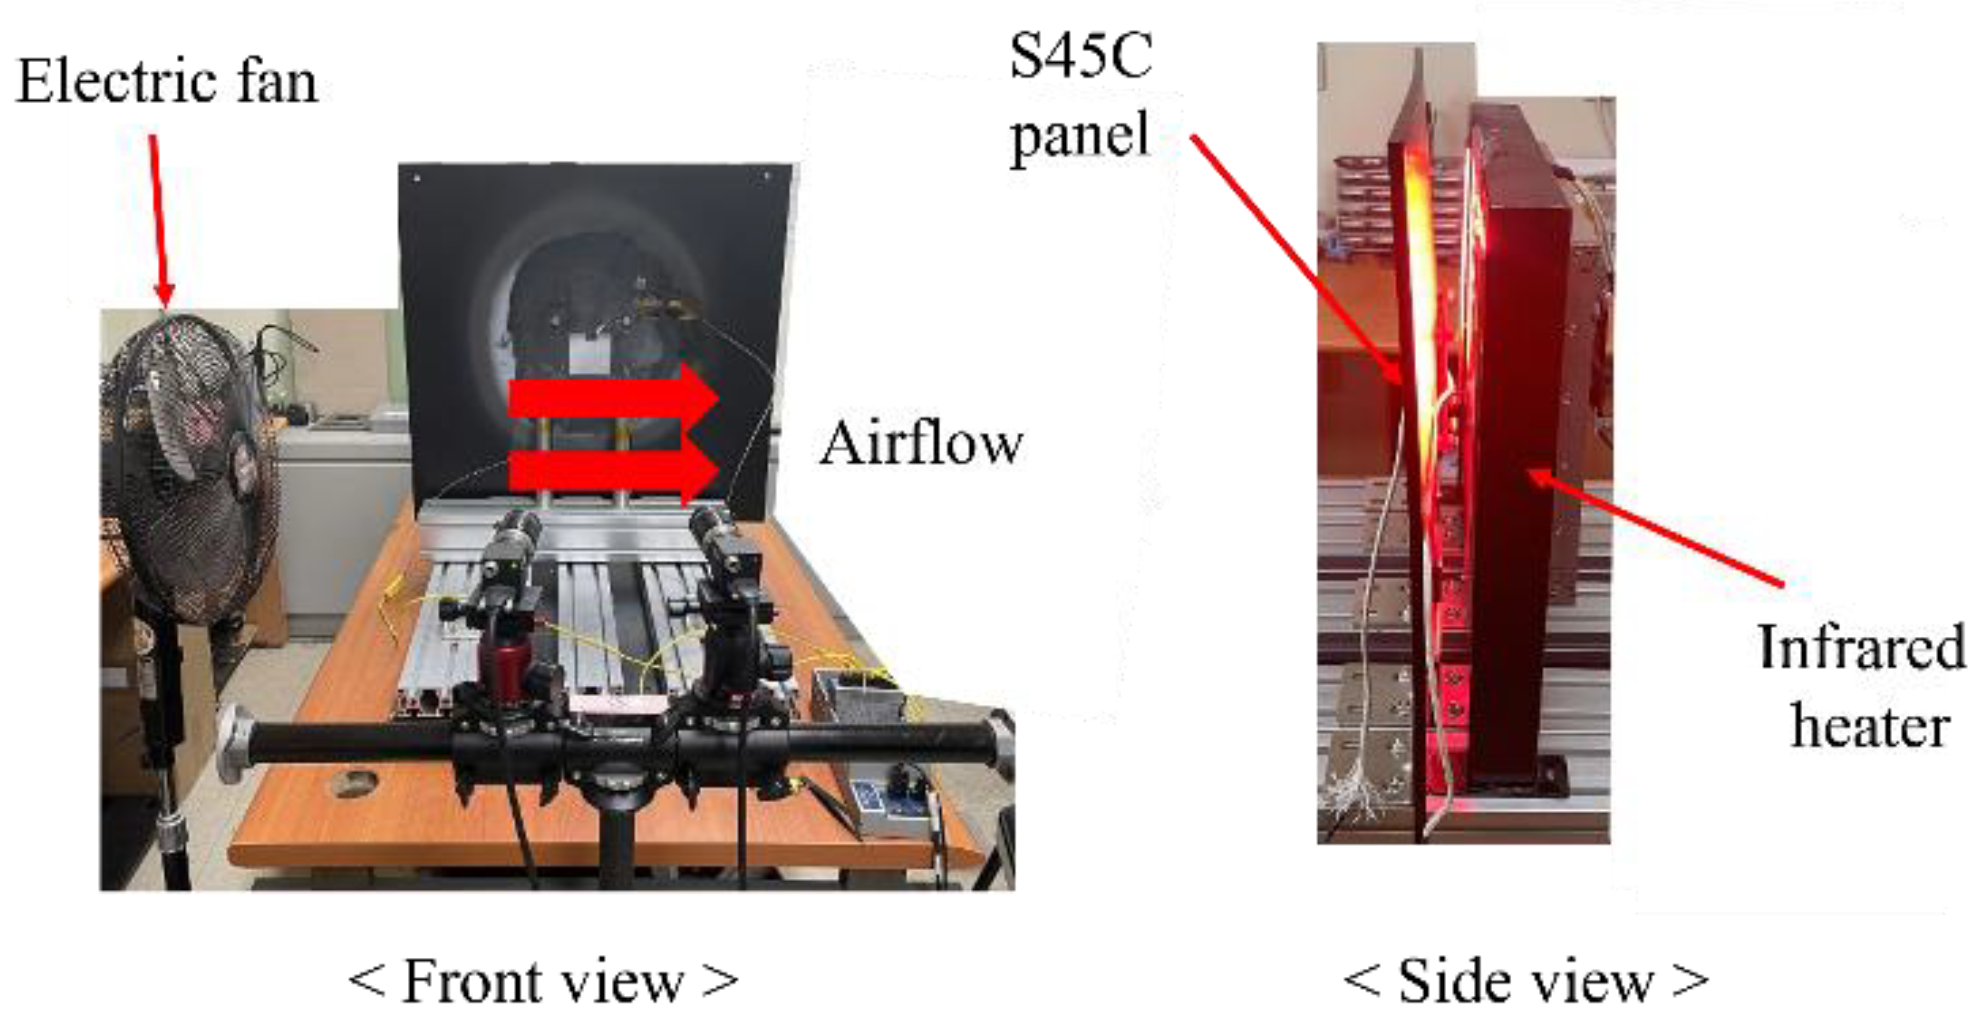
As shown in Figure 2a, an infrared radiation heater (Figure 2b) with ten 220 V, 1000 W quartz lamp tubes heated the specimen, with a maximum temperature of 950 °C. The specimen was placed vertically in the clamp on the S45C panel. Temperature data were gathered by a K-type thermocouple welded to the specimen. The front side thermocouple controlled the infrared heater during the experiment, while the back side thermocouple provided temperature data for DIC analysis. Insulation was added in front of the S45C panel. Two Blackfly S USB3, 35FPS Sony IMX264 monochrome CCD cameras (2448 × 2048 pixels, Wilsonville, OR, USA) from FLIRTM, with 50 mm lenses were positioned 0.9 m from the specimen. These cameras were equipped with bandpass filters and blue light illumination to capture image data. The heating process progressed at a rate of 100 °C/min. This study utilized a stainless steel 304 specimen, measuring 100 mm × 100 mm × 2 mm, to verify the accuracy of the high-temperature DIC measurements. Stainless steel 304, owing to its superior corrosion resistance, remarkable strength at low temperatures, high melting point, and beneficial cost-effectiveness, has found extensive applications in the aerospace industry. In this study, for safety considerations, the specimen was heated up to 800 °C, and it is noted that 800 °C is a high enough temperature to show blackbody radiation.
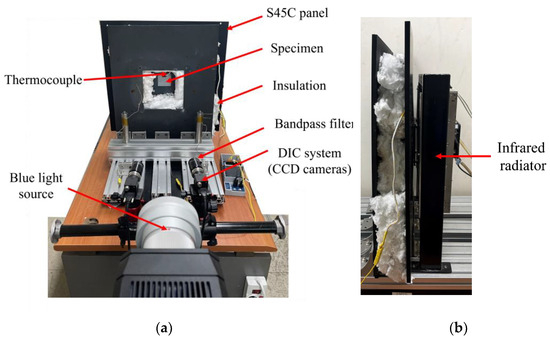
Figure 2.
Experimental setup: (a) front view; (b) side view.
Before using the DIC system, camera calibration is necessary. Camera calibration is a crucial step to accurately relate the captured 2D images to the corresponding 3D world points. The calibration process involves determining the intrinsic and extrinsic parameters of the cameras used in the DIC setup. Intrinsic parameters include the camera’s focal length, aperture, and measuring volume, which are essential for converting pixel coordinates to real-world measurements. Extrinsic parameters define the camera’s position and orientation relative to the specimen or object being studied. Table 1 presents the camera calibration parameters using ARAMIS® 2018 software.

Table 1.
Calibration parameters.
In DIC analysis, obtaining accurate displacement and strain results heavily depends on the facet (subset) size. For this experiment, the facet size was set at 25 × 25 pixels, with a step size of 7 pixels. These parameters were selected based on experimental image analysis. We selected a facet size of 25 × 25 pixels for analyzing the obtained deformation images baesed on our experience and several tests, which consistently showed reliable experimental results.
4. Results and Discussion
4.1. Image Saturation Phenomenon
This research utilized stainless steel specimens, the images of which were recorded at various temperatures, 25 °C, 650 °C, and 725 °C, using the same CCD camera. As shown in Figure 3, it becomes evident that when the specimen’s temperature increases to 650 °C, saturation begins to manifest in the upper left corner of the images. As the temperature further increases to 725 °C, the blackbody radiation intensity surges significantly, rendering the image increasingly saturated, which is consistent with the results in reference [16]. The sharp increase in thermal radiation intensity not only leads to image saturation but also significantly diminishes its contrast, making DIC measurements impossible. Thus, overcoming image saturation induced by intensified thermal radiation becomes one of the key issues in high-temperature DIC measurements.
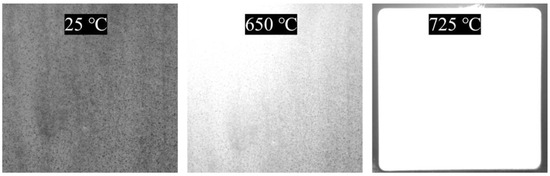
Figure 3.
Captured images using the same CCD camera at various temperatures without a bandpass filter and blue light illumination.
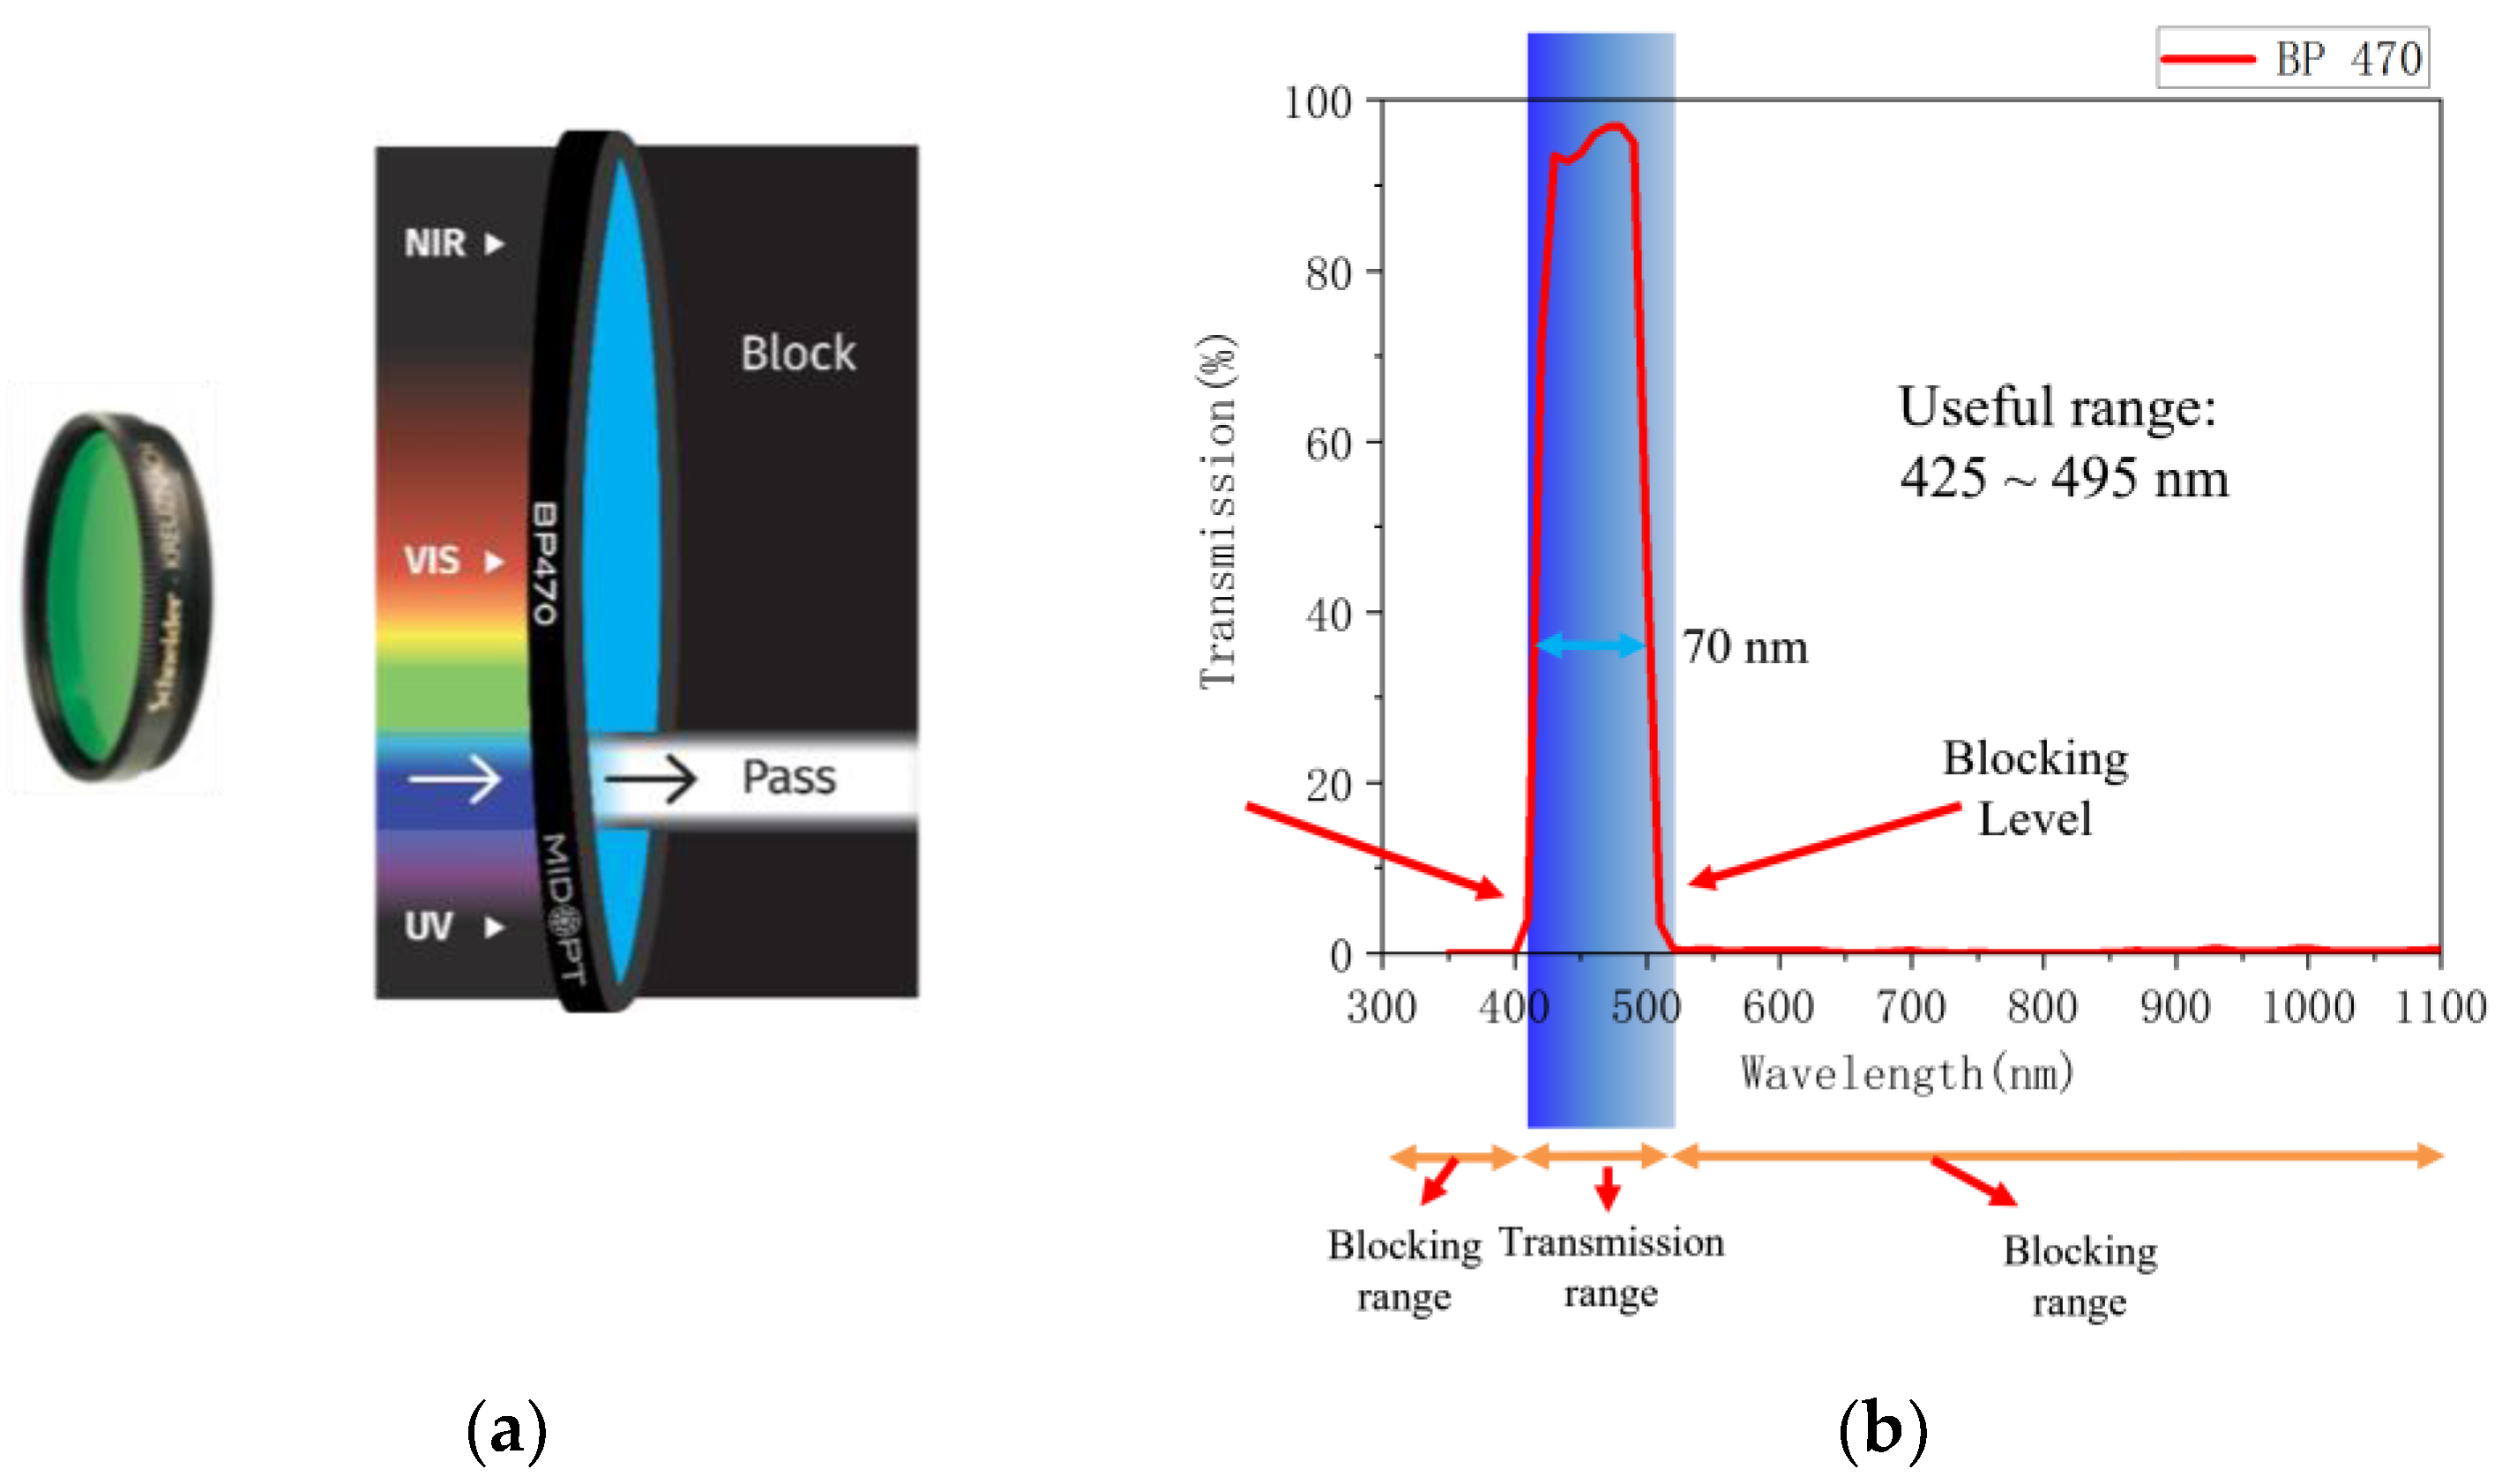
To effectively counteract image saturation caused by thermal radiation, the employment of a short-wavelength bandpass filter, paired with monochromatic light illumination, has proven beneficial [18]. We used a blue light bandpass filter, BP470-30.5 broad bandwidth blue bandpass filter manufactured by MidOpt®, Palatine, USA, as depicted in Figure 4a, with its operating principle illustrated in Figure 4b. The BP-470 filter permits light within the range of 425 to 495 nm, effectively blocking all other wavelengths. This specific wavelength range corresponds to the spectrum of blue light. When combined with blue light illumination, the BP-470 filter allows for the achievement of optimal image brightness, demonstrating a practical solution for mitigating the challenges posed by thermal radiation in high-temperature DIC measurements. After using the BP 470 bandpass filter and blue light illumination, the information of the image is clearly visible, and there is no saturation phenomenon, as shown in Figure 5. This re-confirms the efficacy of employing bandpass filters and blue light illumination as an effective method for mitigating image saturation.

Figure 4.
A bandpass filter to mitigate image saturation: (a) the schematic of a bandpass filter and (b) the transmission vs. wavelength graph of the BP-470 filter.
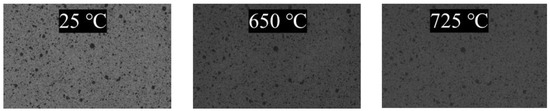
Figure 5.
Captured images using the same CCD camera at various temperatures with a bandpass filter and blue light illumination.
4.2. Proper Speckle Pattern Fabrication
To ensure the success of the DIC measurement, a high-contrast speckle pattern needs to be created on the specimen surface. The speckle pattern plays a crucial role in the measurement process, as it provides unique and identifiable features that are tracked and analyzed during deformation. Proper preparation of the high-contrast speckle pattern is essential for obtaining accurate and reliable results in the DIC analysis [23]. For a suitable speckle pattern, we used High Heat Spray paint manufactured by RUST-OLEUM®, Vernon Hills, USA to create high-contrast random dots by spraying them onto the surface. We ensured the prepared speckle size matched the specified size by employing a spray nozzle of specific dimensions. In this study, the speckles ejected from the nozzle of the High Heat paint, RUST-OLEUM®, Vernon Hills, USA, were attached to the surface of the specimens, and they met the required size criteria.
The measuring volume was 130 × 110 × 90 mm3. The spatial resolution was 53.1 μm/pix (measuring volume length, 130 mm divided by camera resolution, 2448 pixels), and the camera deviation was 1.54 μm (calibration deviation, 0.029 pixels times spatial resolution, 53.1 μm/pix). Based on the criterion defined in Equation (2), the diameter of the dots in the specimen’s speckle pattern should range from 0.16 mm to 0.27 mm, equivalent to 3~5 times the spatial resolution [26].
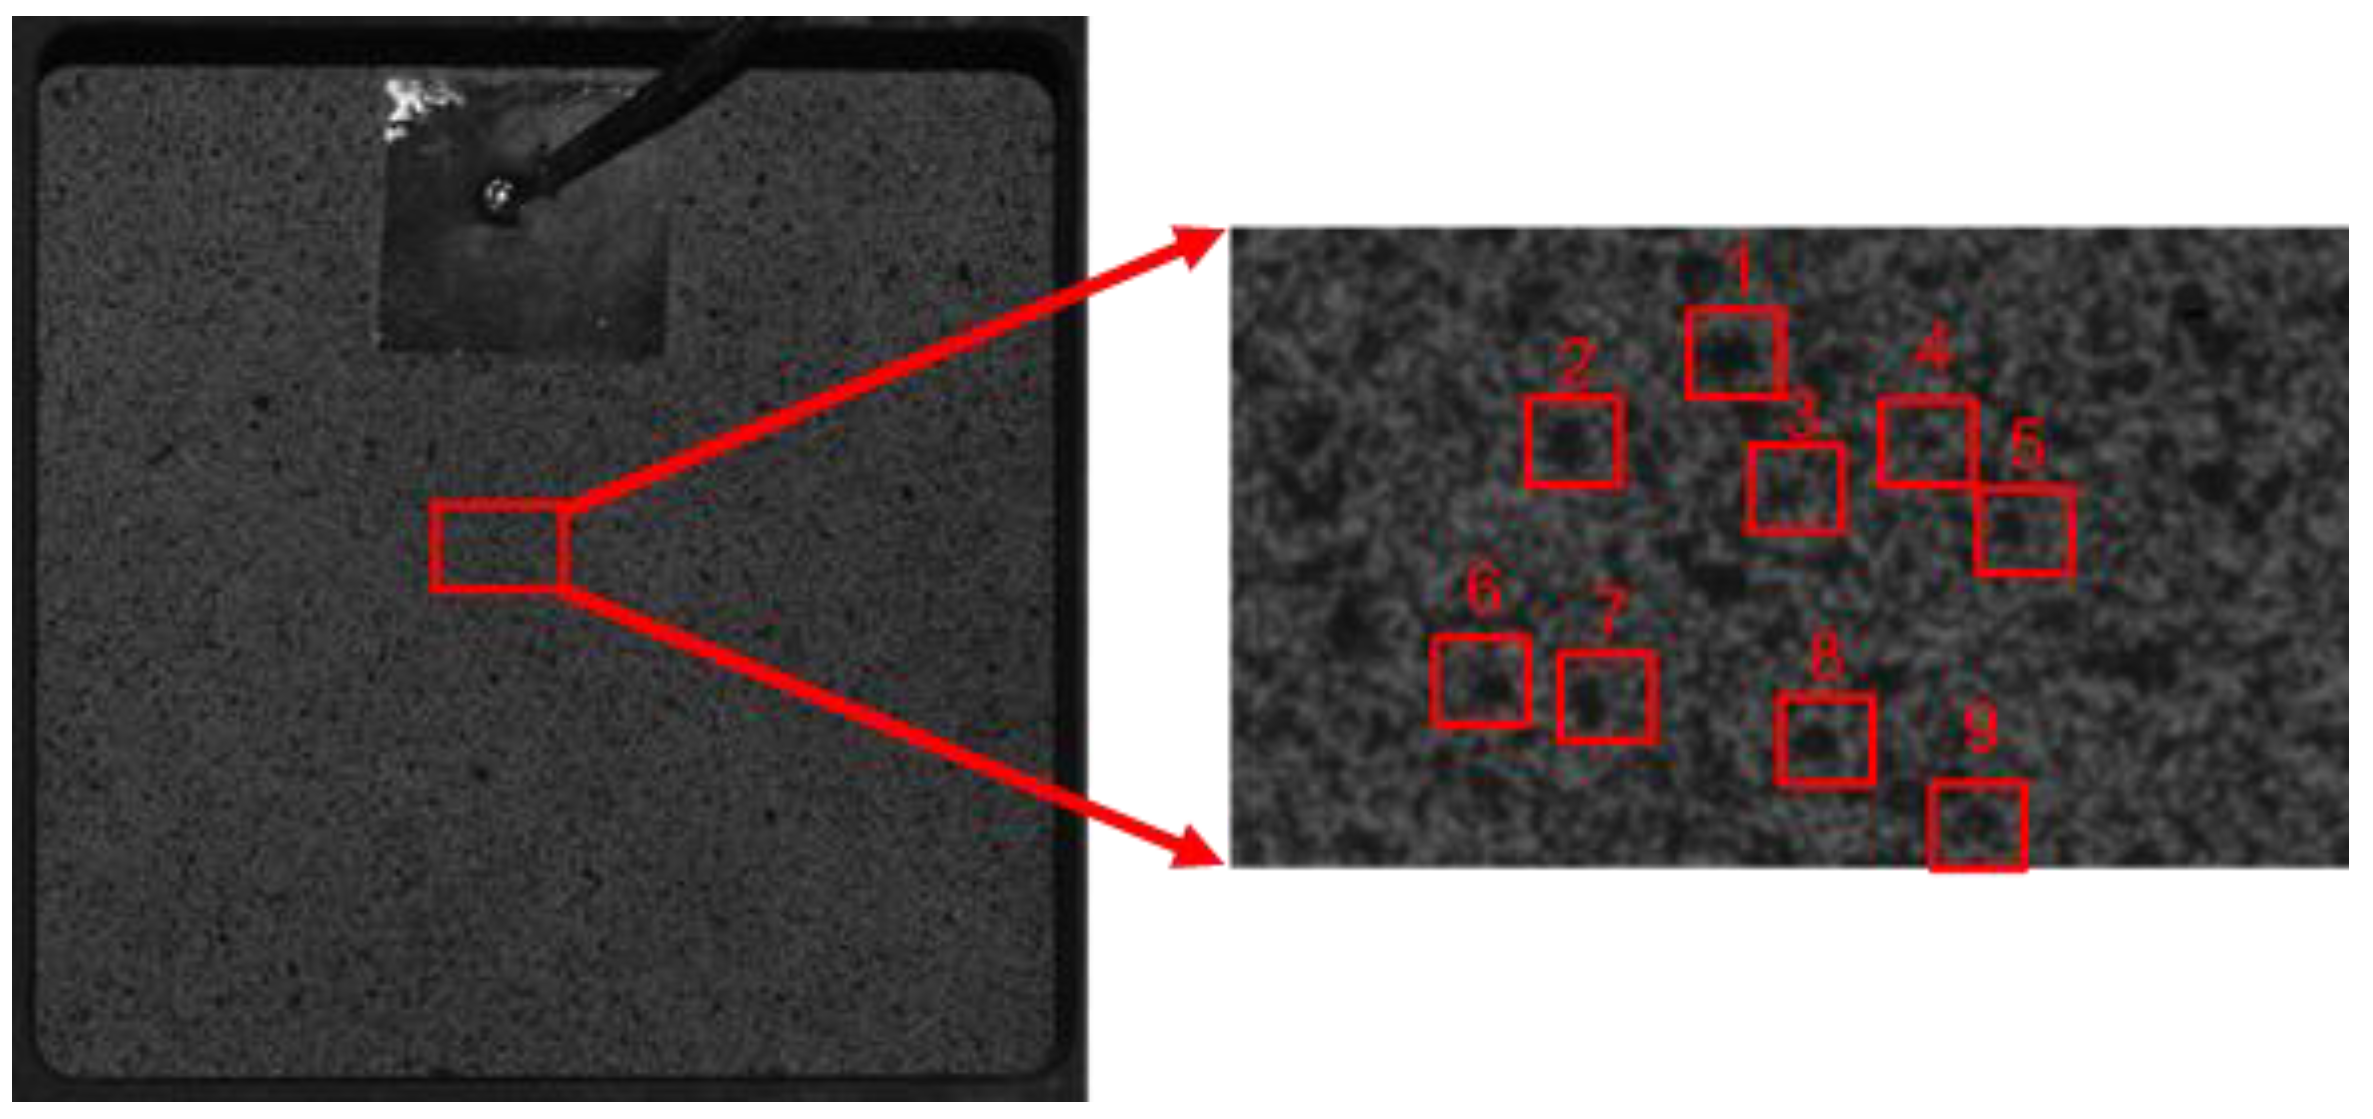
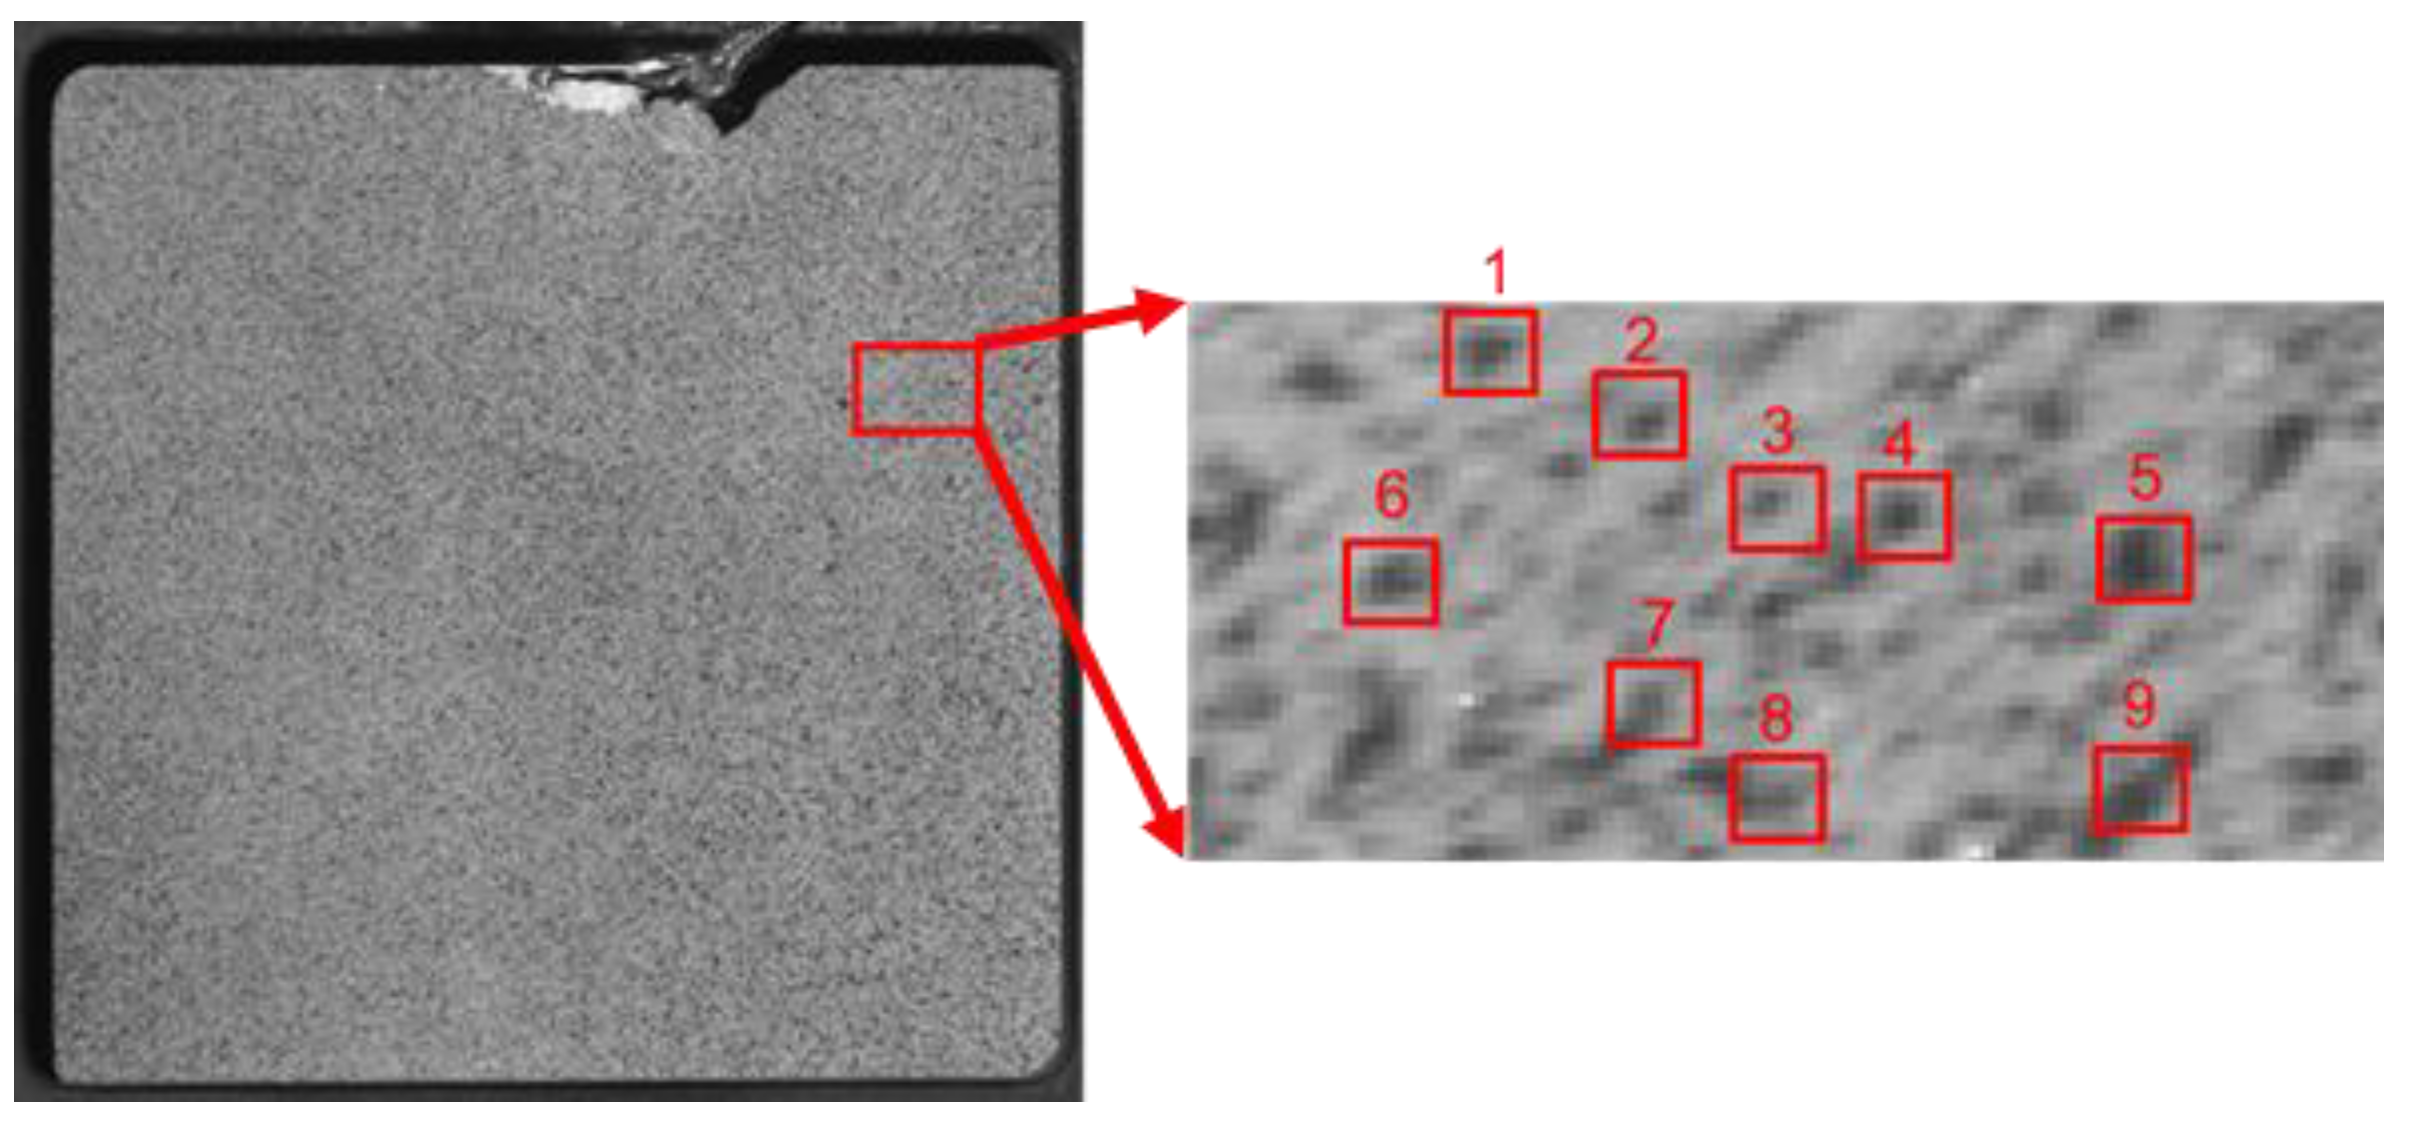
To consider the effect of speckle pattern size, we fabricated two types of speckle patterns, one with an appropriate size (Figure 6) and the other with a smaller size (Figure 7). To accurately measure the diameter of the dots in each specimen’s speckle pattern, we used ImageJ 1.54b software, selecting nine points randomly in an area. Table 2 lists the diameters of these dots. As seen in Table 2, the diameters of the points in Figure 6 fell within the range of 0.16 mm to 0.27 mm. On the other hand, Figure 7 shows a smaller diameter of dots, which meant the speckle pattern did not meet the criterion. In DIC analysis, if the speckle pattern’s dot size is appropriate, the 3D measuring view of the object in the ARAMIS® 2018 software appears smooth and flat. However, if the dot size is inappropriate, it leads to insufficient contrast, resulting in an incomplete 3D measuring view.
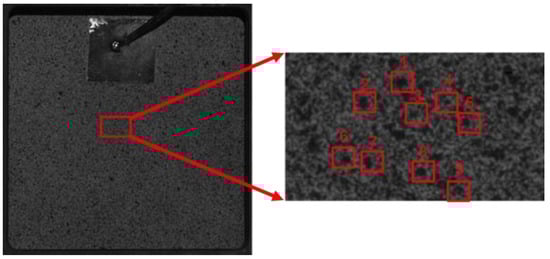
Figure 6.
Nine randomly selected points in an area (appropriate dot size).

Figure 7.
Nine randomly selected points in an area (inappropriate dot size).
Table 2.
Diameters of 9 randomly selected points in an area.
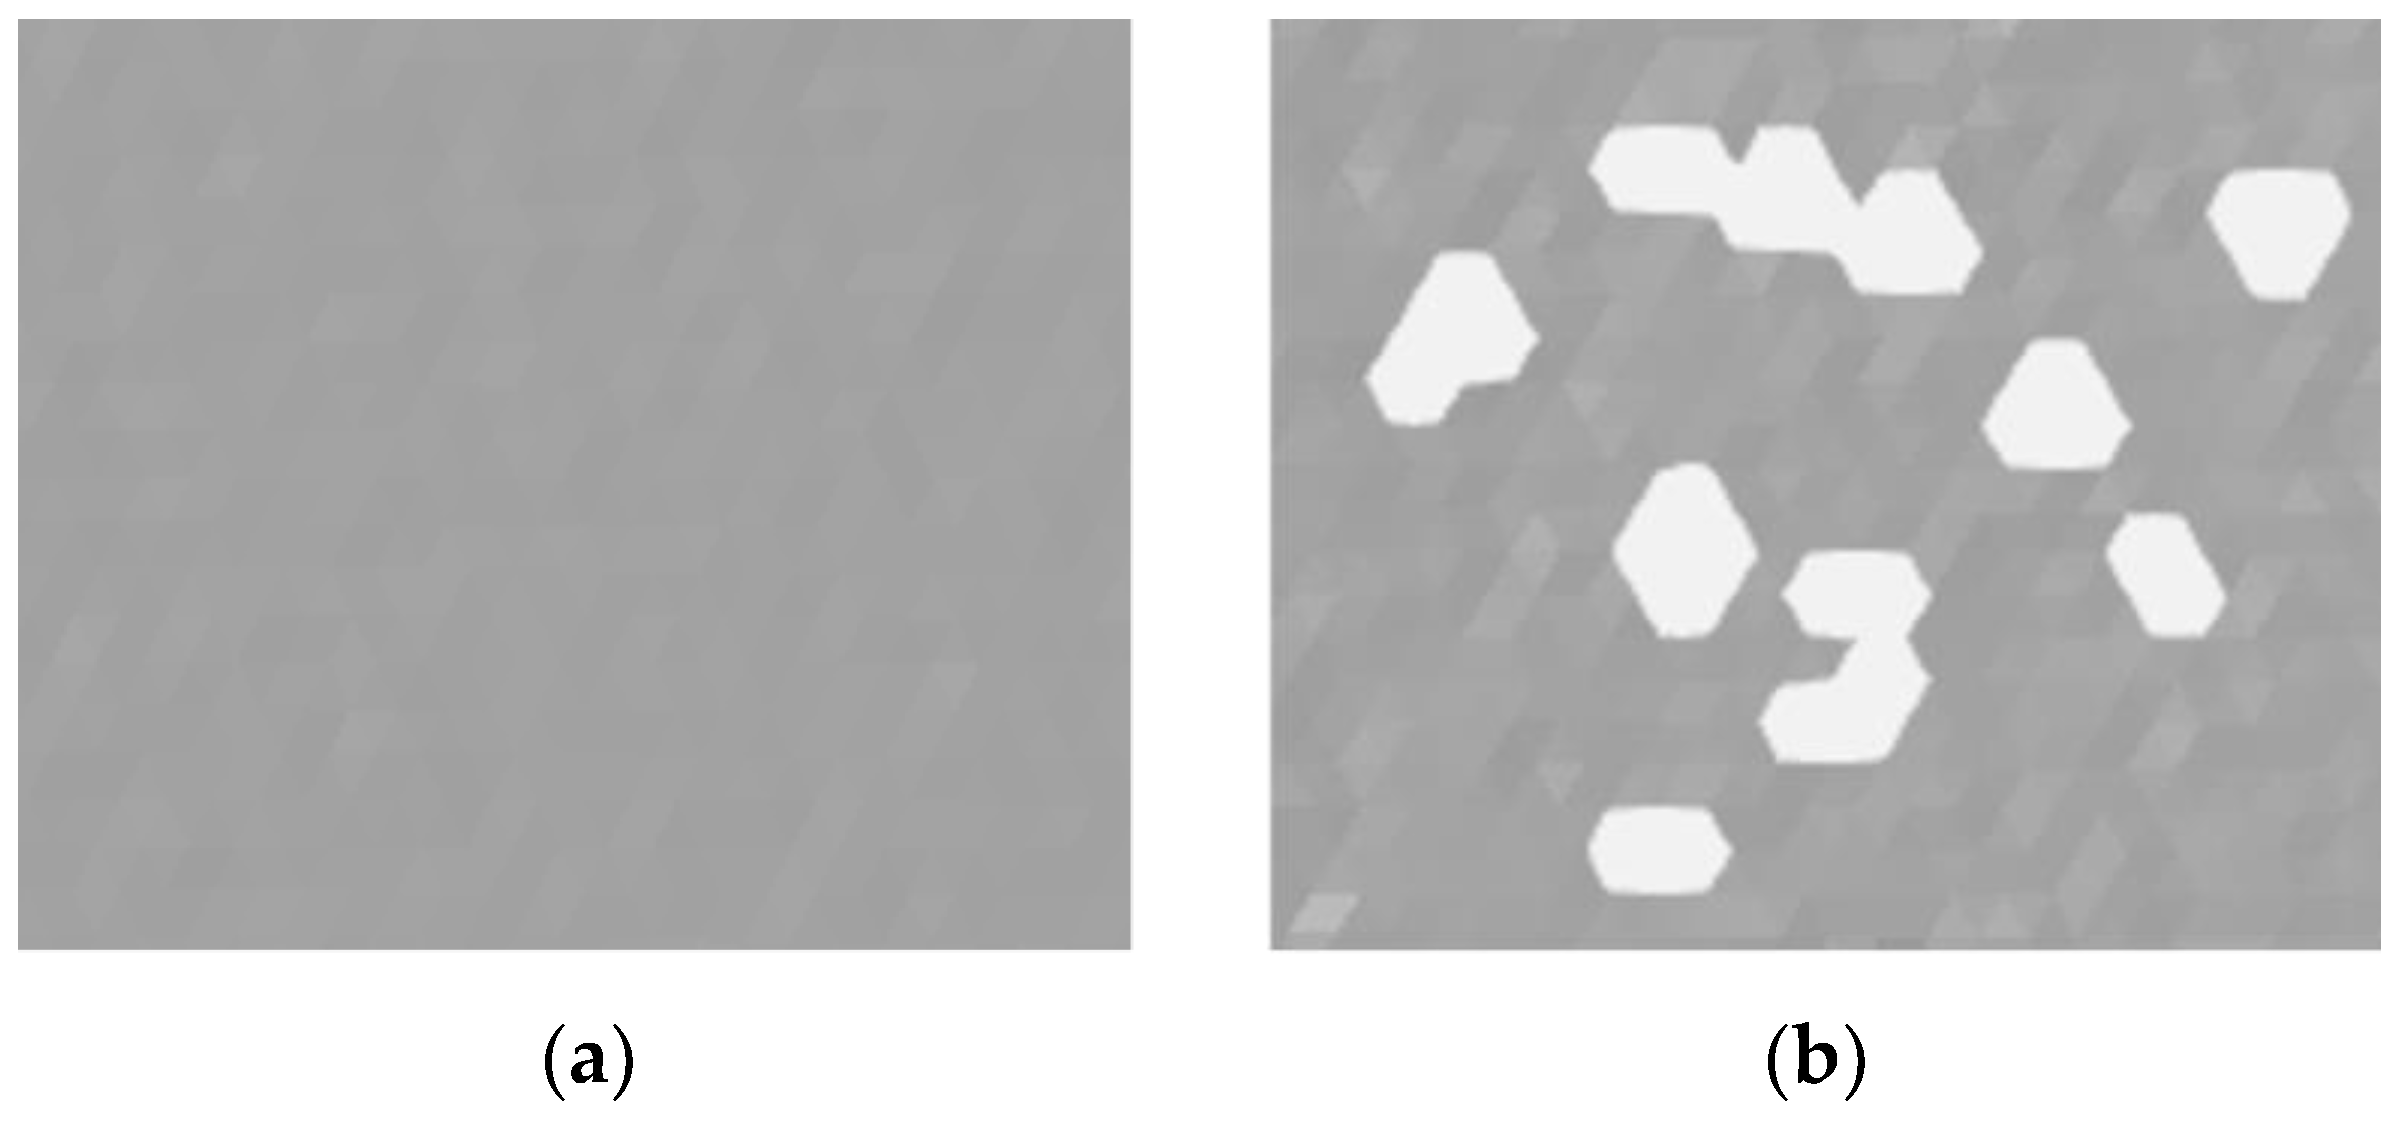
Figure 8a shows the 3D measuring view of a speckle pattern with an appropriately sized dot in an 800 °C environment, exhibiting a smooth and flat view. In contrast, Figure 8b presents the view for a pattern with undersized points in the same environment and displays an incomplete 3D measuring view with insufficient data. Consequently, the missing area lacks measurable data, thereby affecting the accuracy of the analysis.

Figure 8.
3D measuring view in ARAMIS® 2018 software in an 800 °C environment: (a) appropriate dot size: smooth and flat, and (b) inappropriate dot size: missing area.
In DIC analysis, the effectiveness is influenced not only by the size of the speckle pattern but also by the density of the speckles within the facets. According to the standard, each facet should ideally contain 3 to 5 speckles. An enlarged view of the speckle pattern we created is shown in Figure 9, where there are four speckles within a 25 × 25 pixel facet, confirming that the speckles meet the required standards.
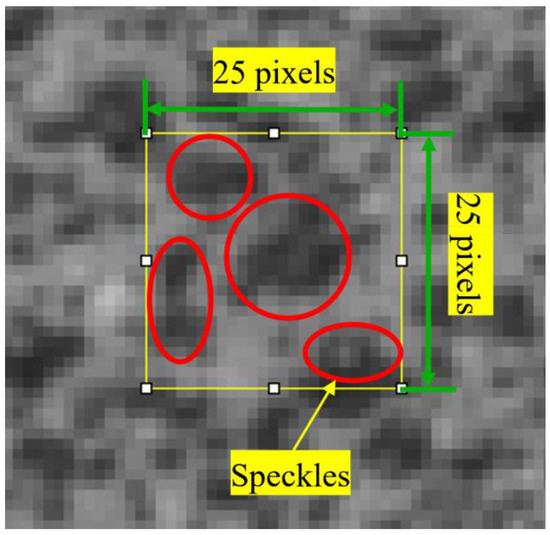
Figure 9.
An enlarged view of the speckle pattern.
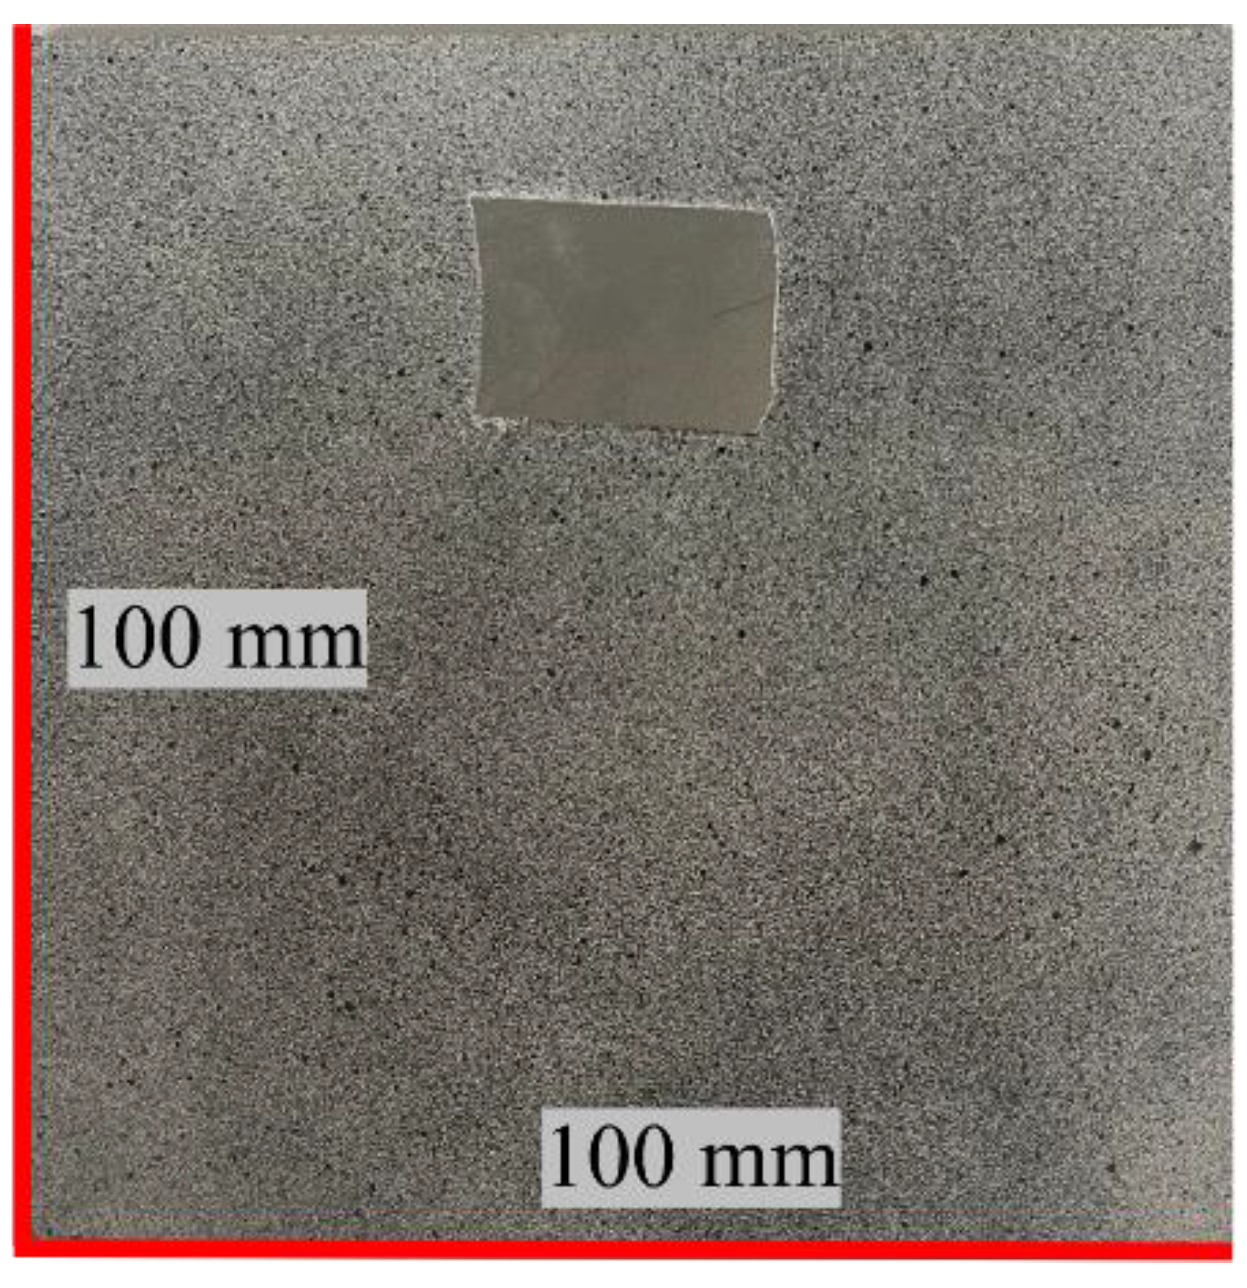
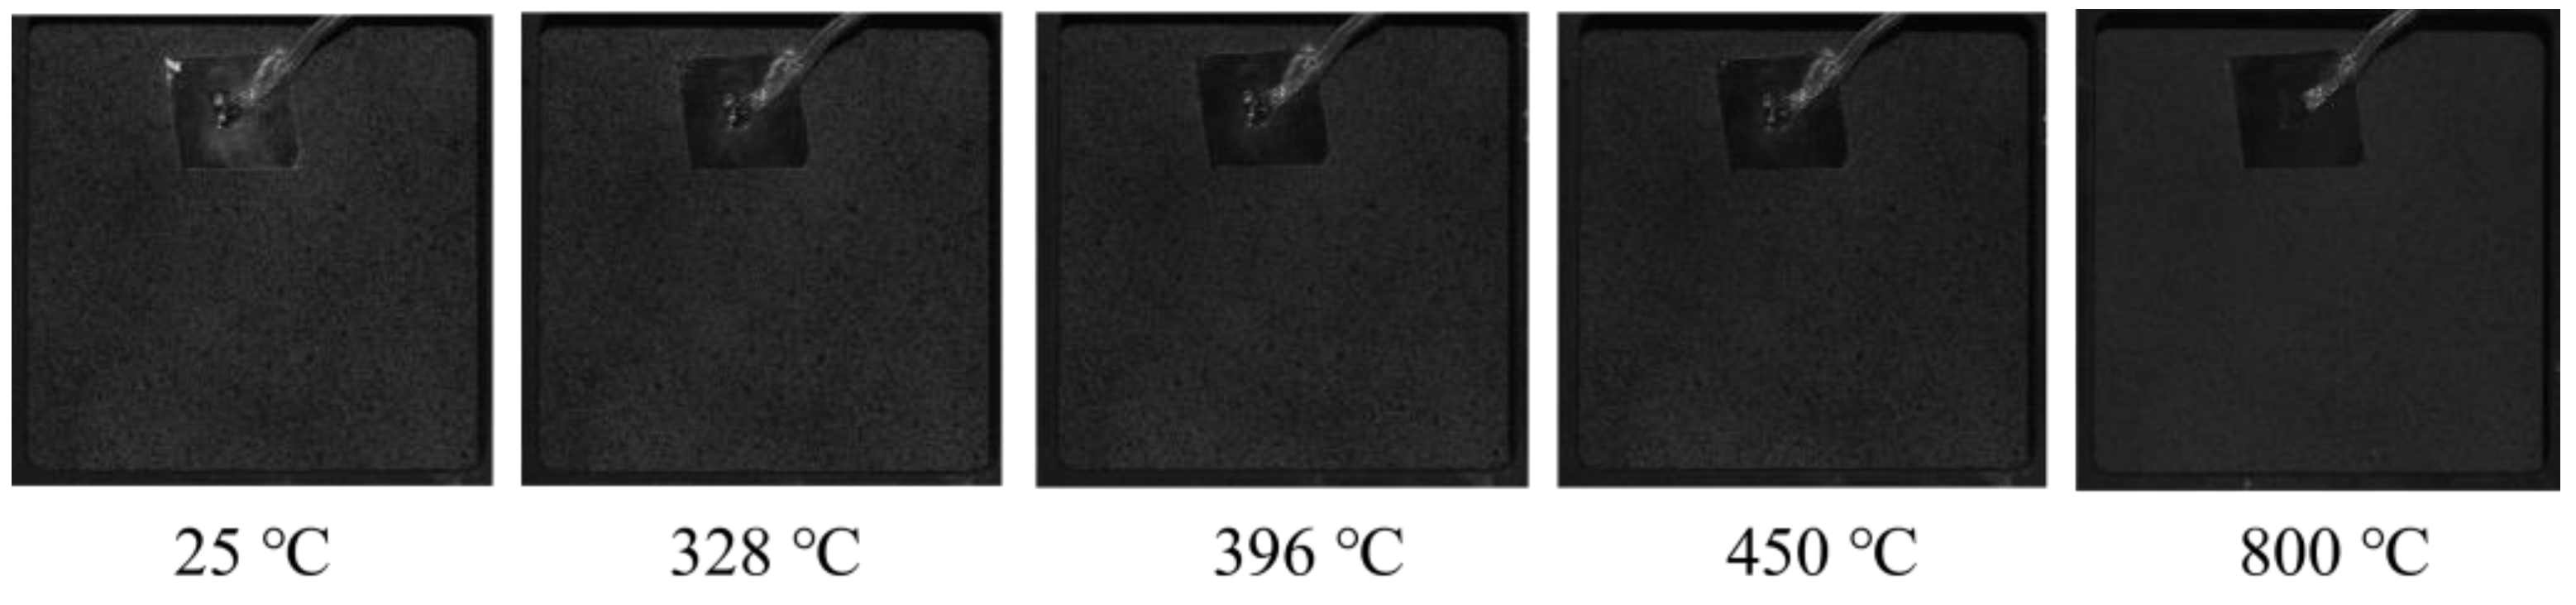
The elevated temperature during heating can result in oxidation and debonding of the speckle pattern on the sample surface, leading to a reduction in image contrast. Thus, preserving the high-contrast speckle pattern on the specimen surface during the heating process becomes a key issue in high-temperature DIC measurements. In this study, a high-temperature-resistant black and white paint was applied to the surface of a 2 mm thick stainless steel 304 specimen, which created high-contrast random dots measuring 0.16~0.27 mm, as shown in Figure 10. Figure 11 shows the analysis of the high-temperature-resistant speckle pattern variation at different temperatures. The observation reveals that the high-temperature-resistant speckle pattern still maintains high contrast even in an 800 °C environment.
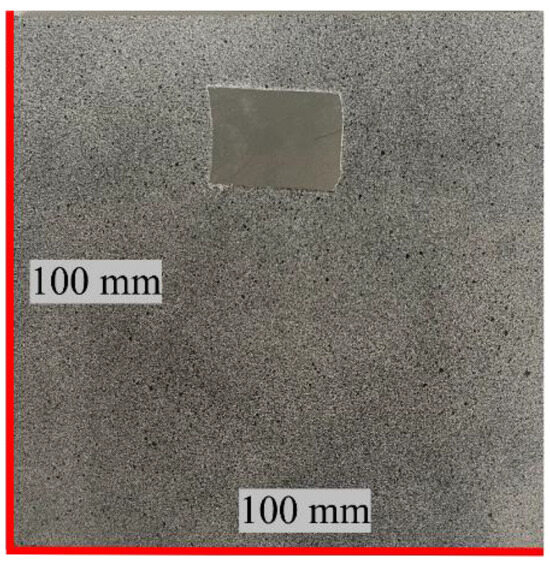
Figure 10.
The specimen with a high-contrast speckle pattern.
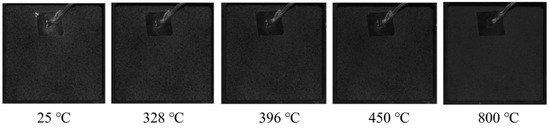
Figure 11.
High-temperature-resistant speckle pattern variation at different temperatures.
4.3. Heat Haze Effect
The specimen that was subjected to heating was stainless steel 304, an isotropic material. In an ideal situation without heat haze or other constraints, the specimen solely under thermal load would exhibit a uniform thermal deformation pattern. This results in consistent, unidirectional deformations in the X and Y directions, the magnitude exhibiting uniform concentric circles in a displacement field, as shown in Figure 12a. However, under the influence of the heat haze, the thermal deformation pattern of the stainless steel 304 specimen deviates from uniformity, as shown in Figure 12b.
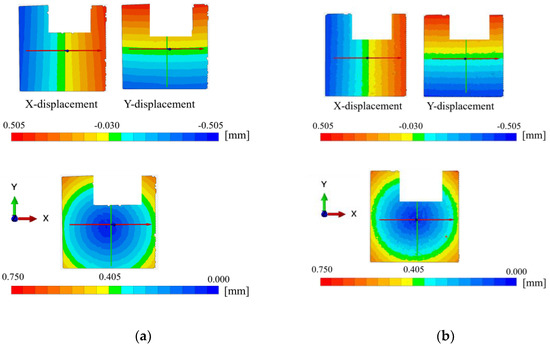
Figure 12.
The displacement field pattern (a) without heat haze effect and (b) with heat haze effect.
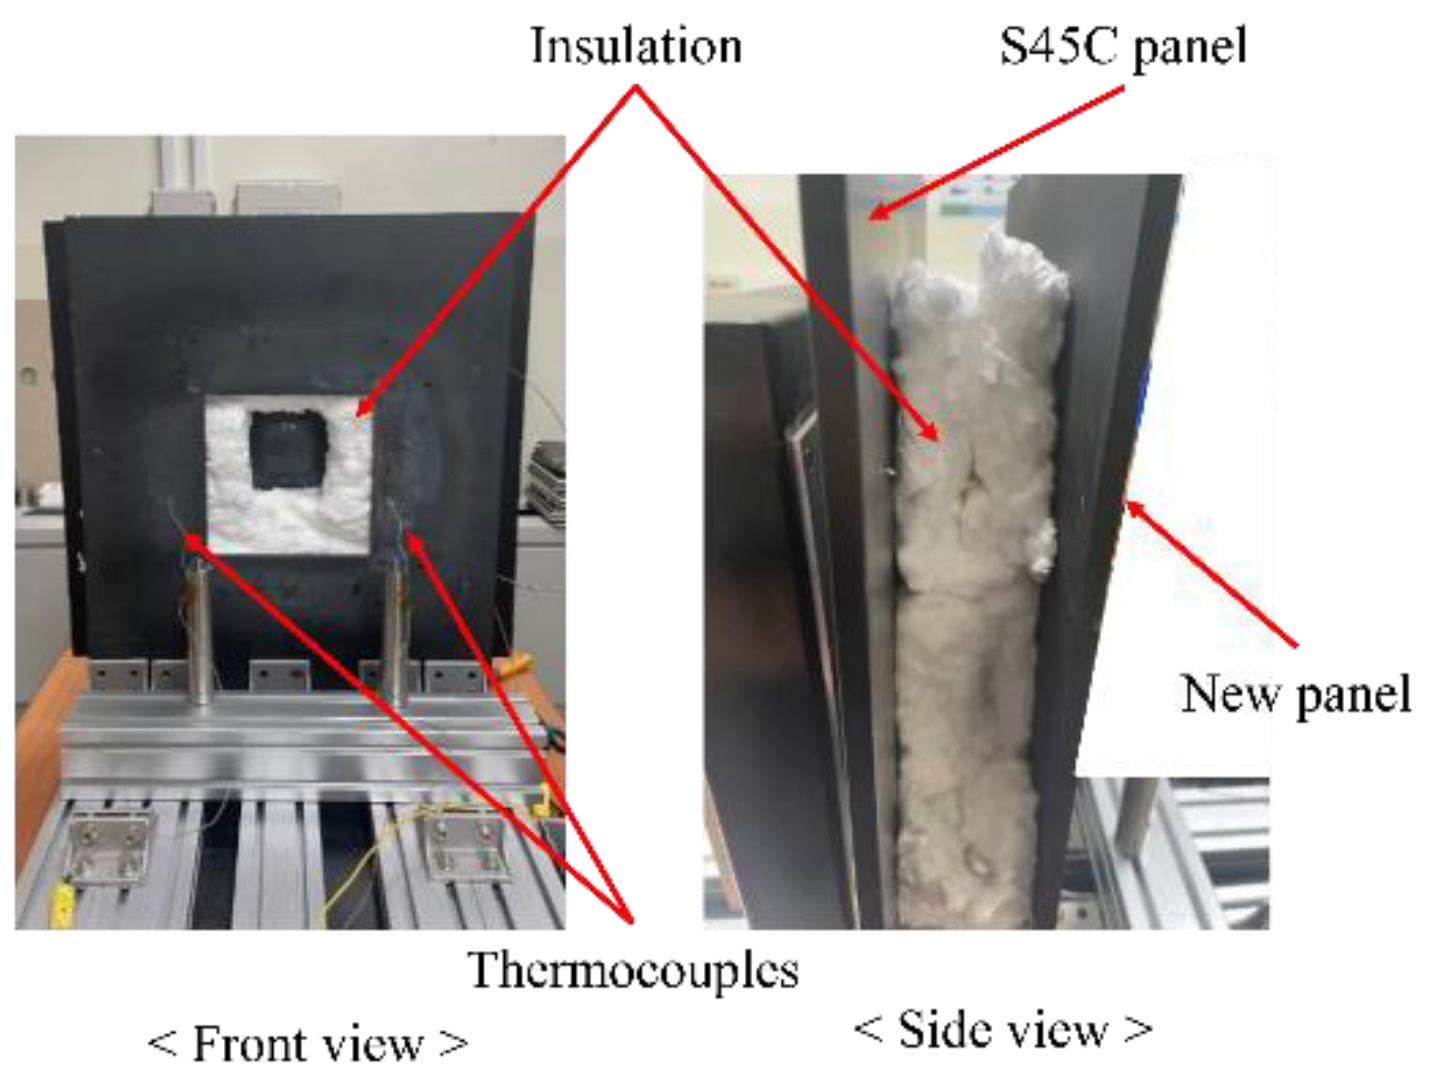
In this study, to account for the heat haze effect, two experimental setups were employed and compared: using an electric fan [30] and using insulation. The setup involved an observation window incorporated into an S45C panel, and the specimen was vertically placed on an infrared radiator for heating. The thermocouples were placed in front of the S45C panel to monitor the temperature of the surrounding environment. An electric fan was placed in front of the devices to blow away the heat flow to reduce the heat haze effect, as shown in Figure 13. Figure 14 shows the experimental setup with insulation. This configuration introduced a new panel in front of the existing S45C panel, with a thick layer of Saffil insulation placed between the two panels. The insulation was used to minimize thermal convection between the panel and surrounding air, thereby reducing the heat haze effect.
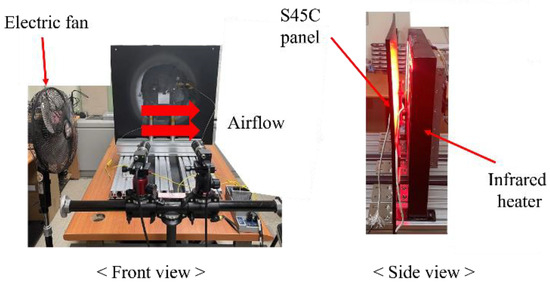
Figure 13.
The experimental setup with an electric fan.

Figure 14.
The experimental setup with insulation.
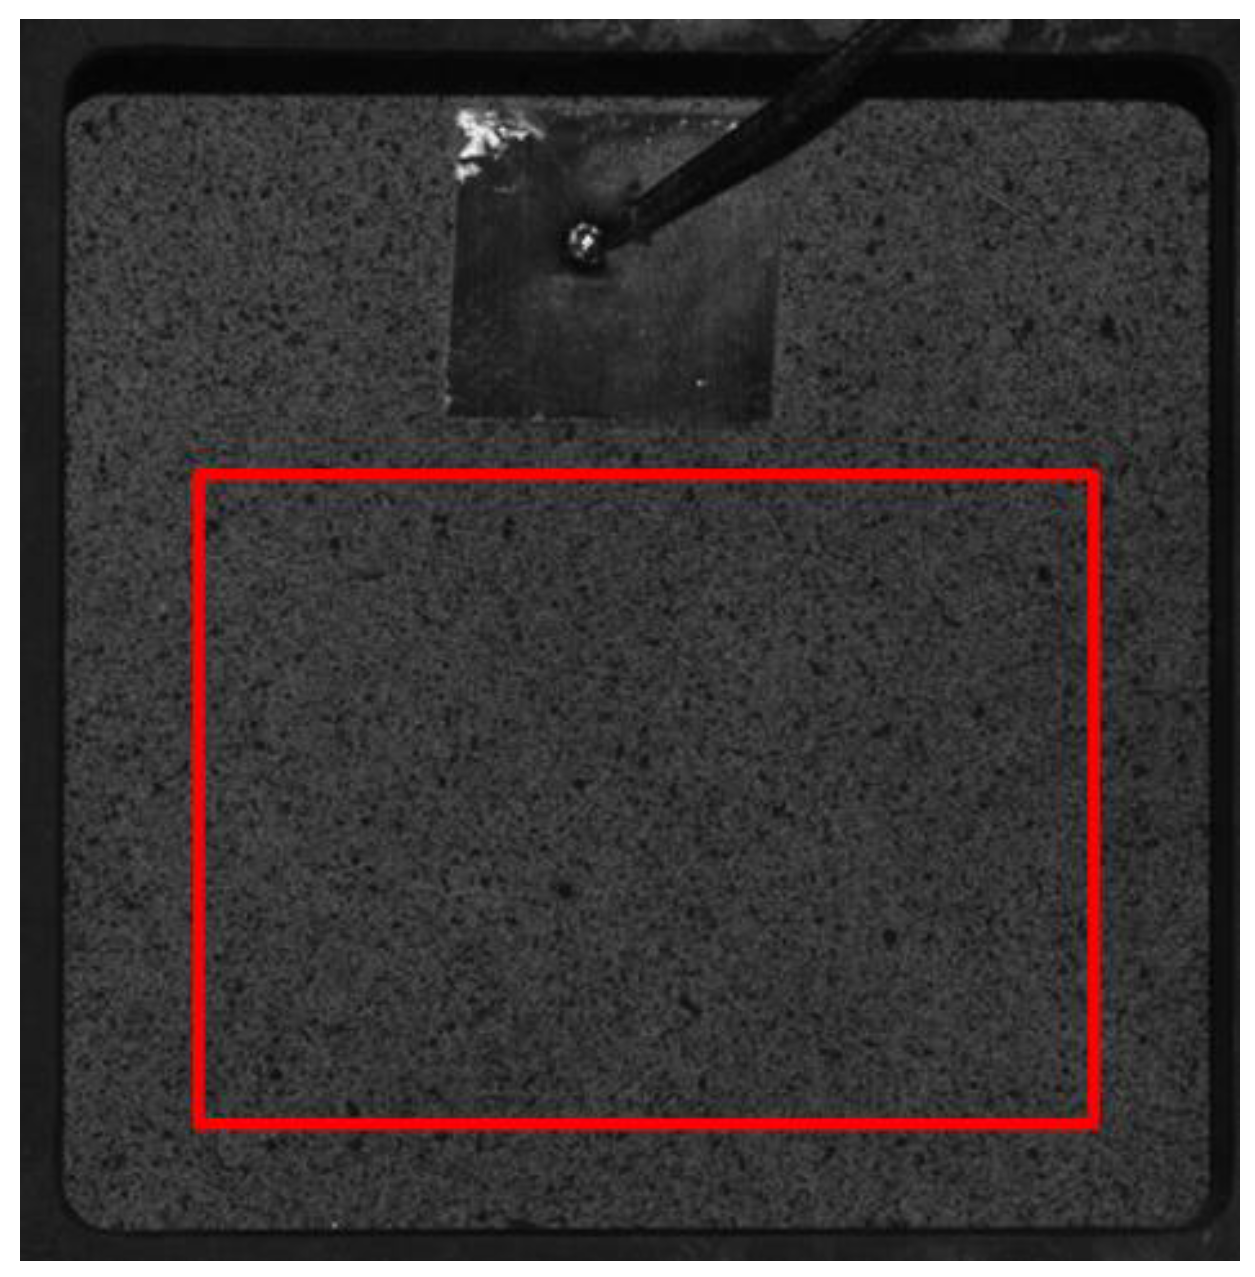
To better understand the influence of the heat haze effect on measurement results, we compared specimen deformation on the back side at 500 °C under three conditions: without any devices, with an electric fan, and with insulation. We measured the average of X-directional strain in a specific region, as shown in Figure 15, under the three conditions. Table 3 shows that the εxx was 1.20% for the “without any devices” condition, 1.12% for the “with a fan” condition, and was reduced to 0.84% for the “with insulation” condition. Compared to the “with insulation” condition, the strains for the “without any device” and “with the fan” conditions increased by 42.9% and 33.3%, respectively.
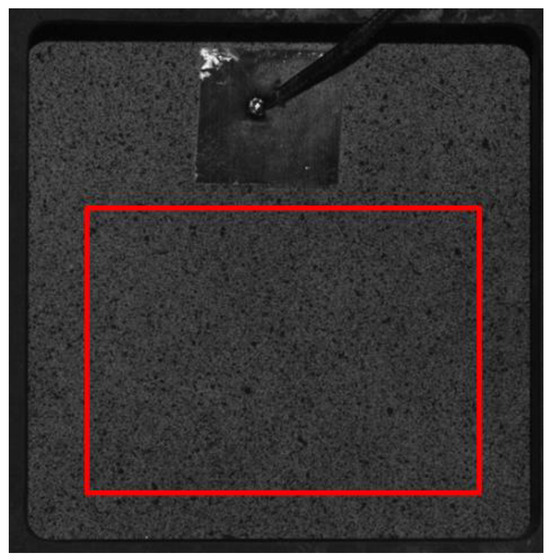
Figure 15.
Selected region on the specimen.
Table 3.
Comparison of deformation under three conditions.
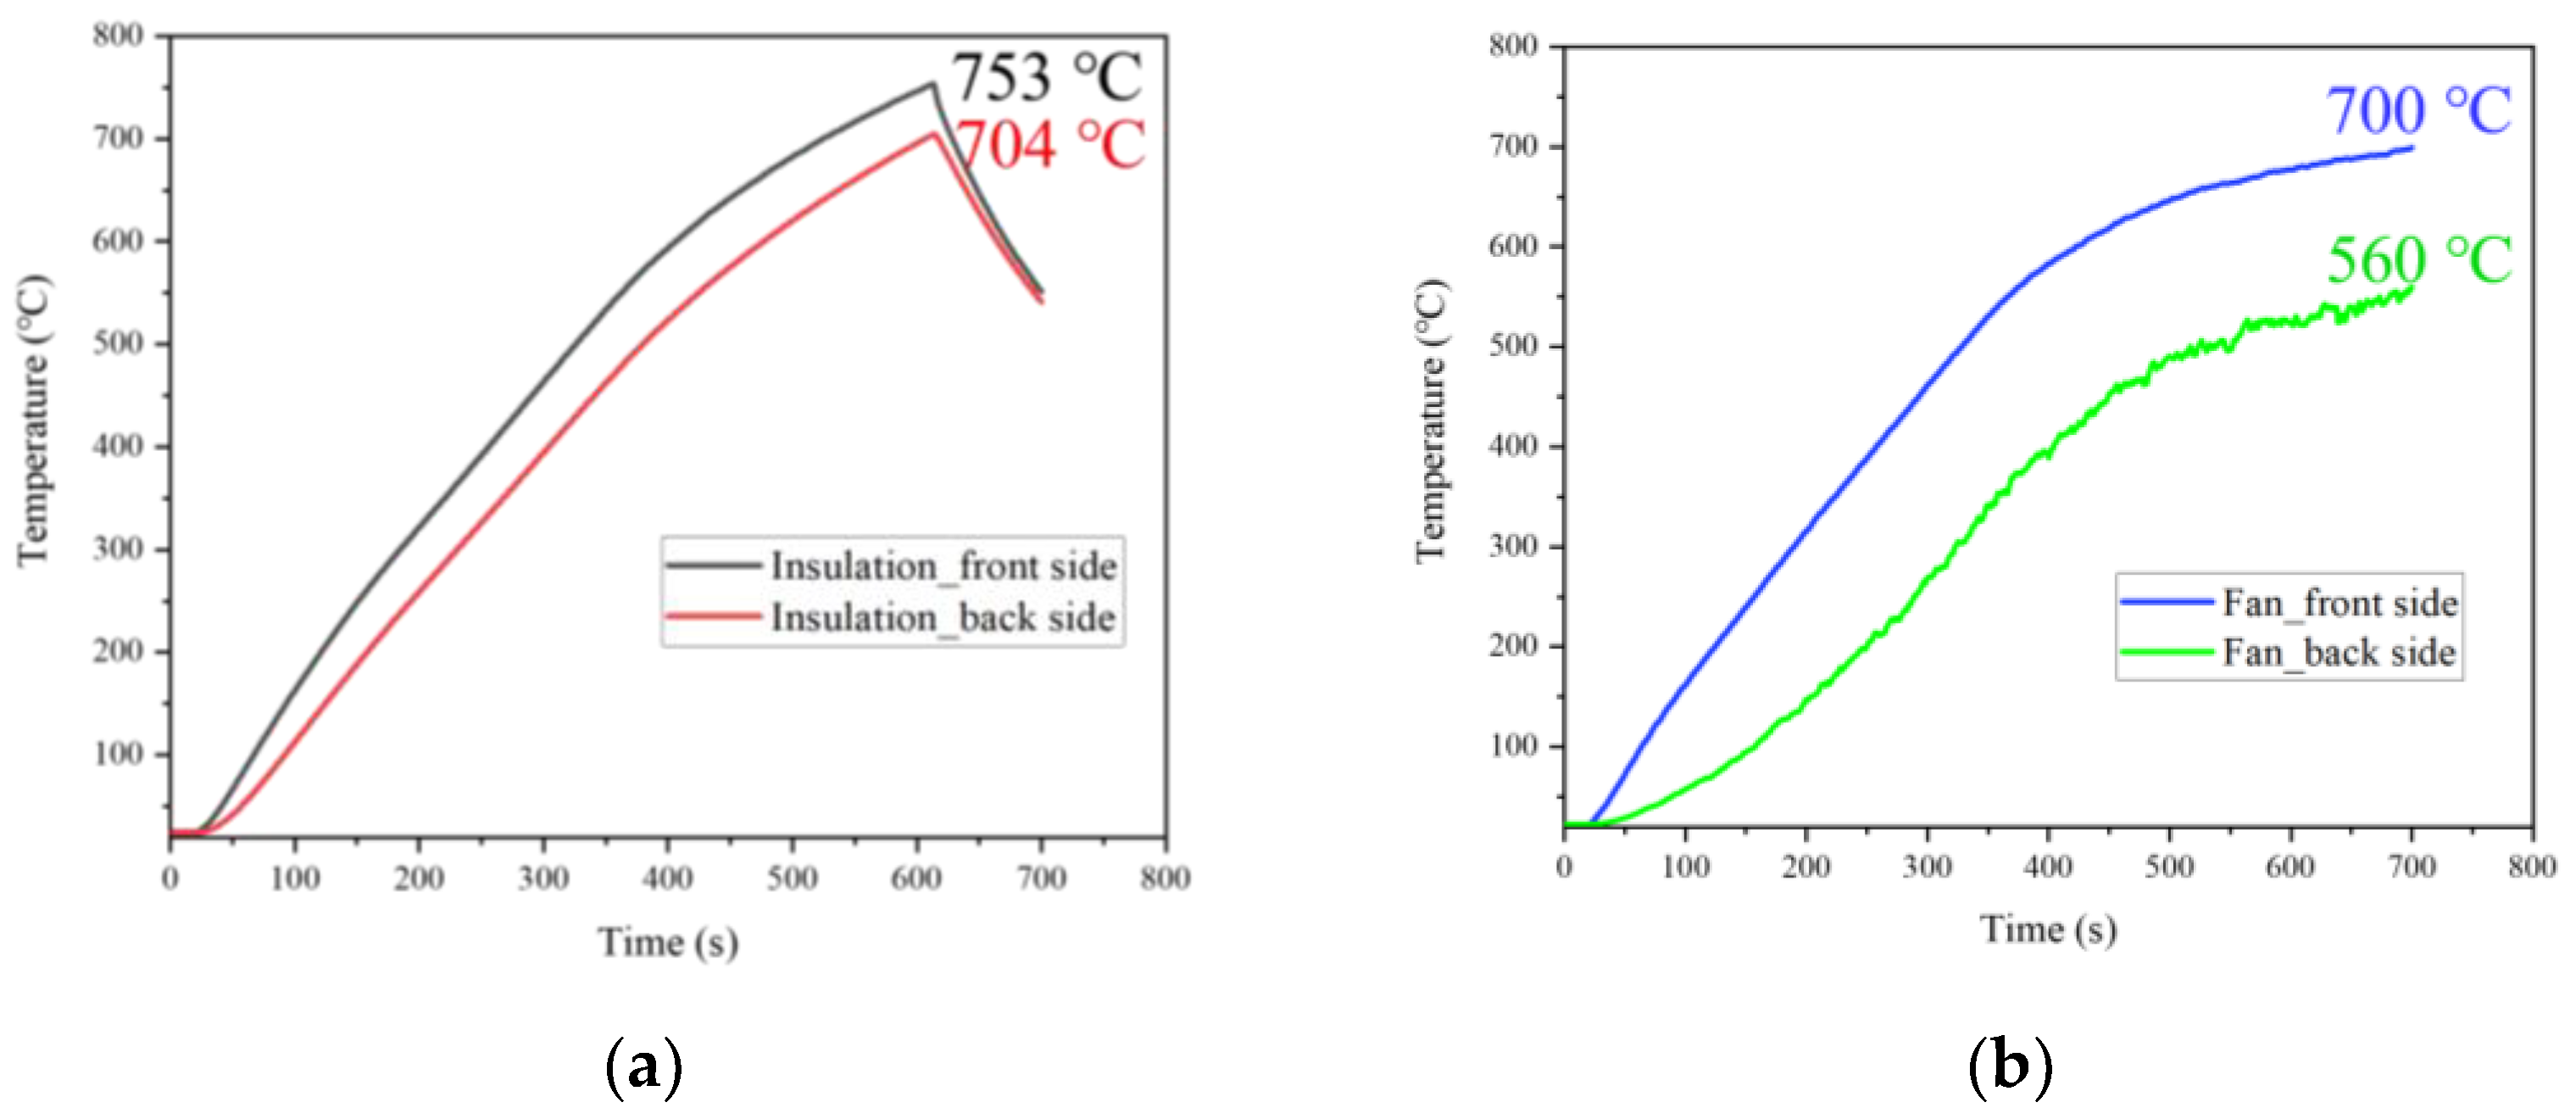
When an electric fan was used, the heat haze effect was greatly alleviated, but the airflow caused a large temperature difference between the front and back sides of the specimen during the heating process. Figure 16 shows the temperature curve with the fan and insulation at a set temperature of 800 °C. During the heating process, when the insulation layer was used, the temperature difference between the front and back sides of the specimen remained relatively small, as shown in Figure 16a. Conversely, when an electric fan was used, a significant temperature difference was observed, and the temperature on the back side of the specimen fluctuated, as shown in Figure 16b. A larger temperature difference between the front and back sides will lead to greater deformation of the specimen, even when the back surface temperature remains the same. Figure 17 shows the temperature difference between the two experimental setups during the heating process. When an electric fan was used, the maximum temperature difference between the front and back sides reached 202 °C. Specifically, the back surface temperature reached 280 °C, while the front surface temperature was 482 °C. Concurrently, the strain observed was 0.55% (Table 4). In contrast, with the utilization of an insulation layer and the same back surface temperature, the front surface temperature was 343 °C, much lower than that of the fan setup, resulting in a smaller strain of 0.43%. The strain difference between the two cases was 27.9%. Based on the above observation, we used the insulation layer as a solution to reduce the heat haze effect instead of the electric fan.
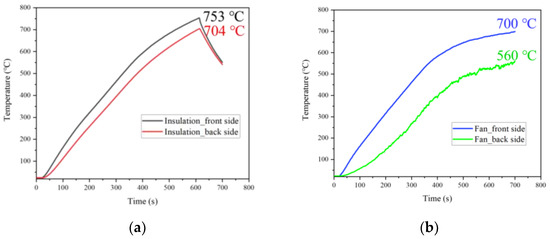
Figure 16.
The temperature curve when using (a) insulation and (b) a fan.
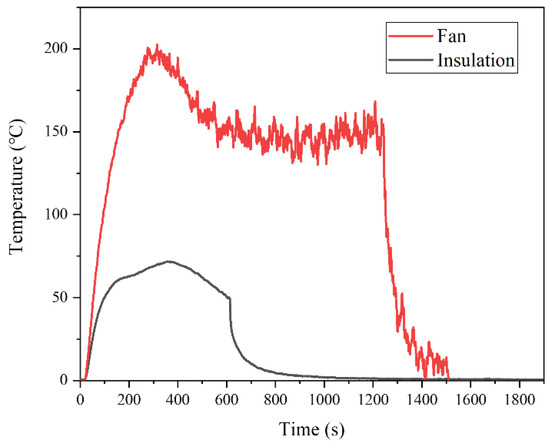
Figure 17.
The temperature difference between the two setups during the heating process.
Table 4.
Comparison of temperatures and strain between the two setups during the heating process.
4.4. CTE of a Stainless Steel 304 Specimen
To prove the accuracy and effectiveness of the proposed method, we heated the stainless steel 304 specimen to temperatures ranging from 25 to 800 °C and measured its thermal strain, CTE, and thermal deformation field. Figure 18a,b show the displacement fields in the X and Y directions measured by the DIC system at 800 °C. Given that the specimen in this study underwent free expansion devoid of any external constraints, it exhibits uniform thermal expansion.
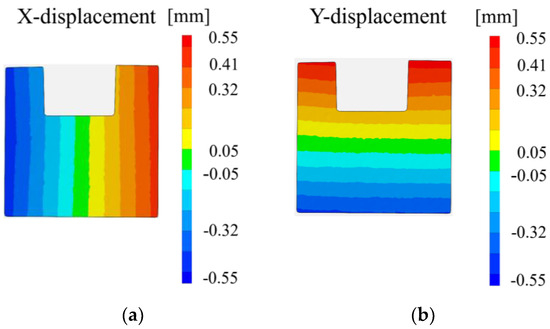
Figure 18.
Displacement field at 800 °C. (a) X-direction. (b) Y-direction.
By designating two sections within the region, the spatial distance between these sections was calculated at each temperature increment [12]. Subsequently, the strain was determined using Equation (3).
where represents the initial length between the two defined sections, while corresponds to the specific length between these sections at each targeted temperature.
Utilizing Equation (3), we evaluated the thermal strain measured along the X and Y directions, transitioning from 25 to 800 °C. The results show that the strains are almost the same, with εxx and εyy values standing at 0.0148 and 0.0149, respectively, at 800 °C.
The mean CTE was computed by linearizing the measured strain across the temperature range of 25 to 800 °C. The mean CTE for the specimen was 19.3 ppm/°C. Furthermore, to measure the mean CTE for other temperature ranges, we performed measurements in the ranges of 25 to 500 °C, 25 to 600 °C, and 25 to 700 °C. When compared with established handbook data and present data, these results demonstrated substantial agreement, which confirmed the reliability of the measurements (Table 5) [31,32,33].
Table 5.
Comparison of reference CTE and experimental CTE in various temperature ranges.
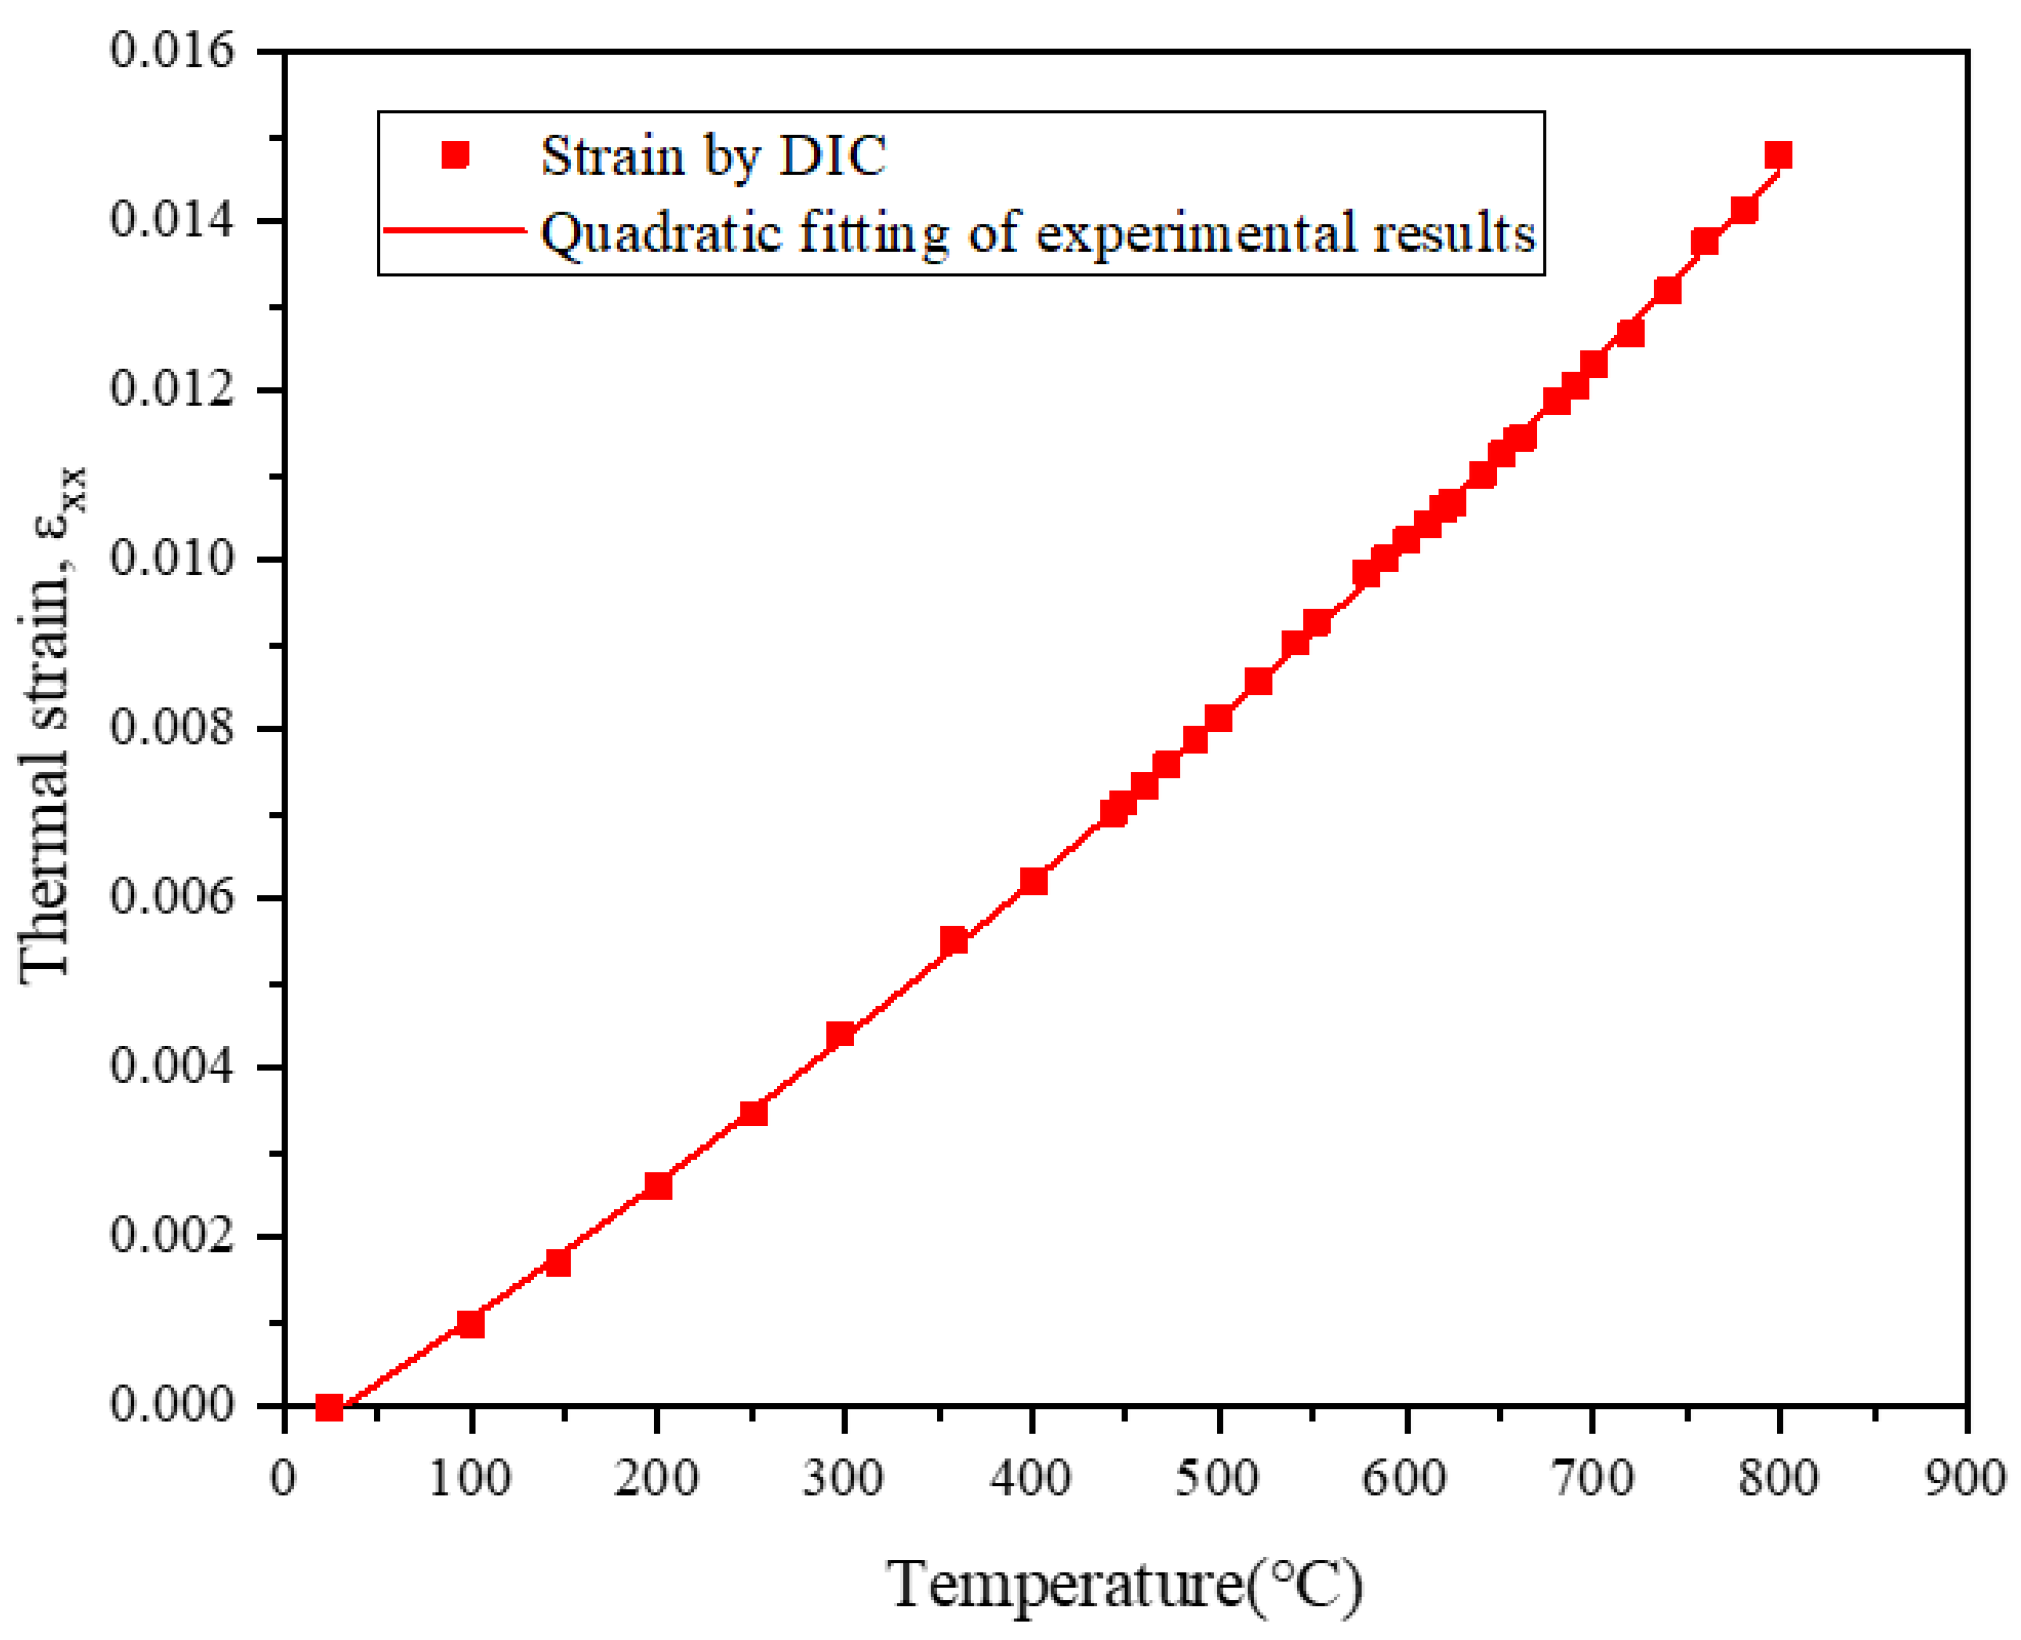
Indeed, a material’s CTE is temperature-dependent and can be specified at a particular temperature using the concept of instantaneous CTE. To pinpoint the instantaneous CTE of stainless steel 304 within the 25 to 800 °C range, a quadratic polynomial was used to fit the strain data, as shown in Figure 19. This fitting curve, represented by the equation ε(T) = 5.5767 × + 1.477 × −, provides a means to ascertain the CTE at T temperature. The expression of an instantaneous CTE is Equation (4), where α(T) is the instantaneous CTE.
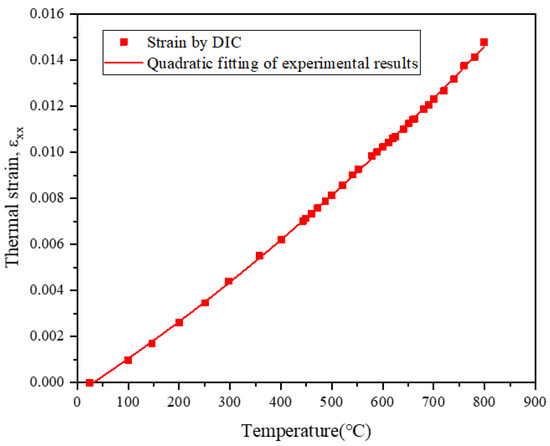
Figure 19.
The quadratic fitting curve of strain data.
Our present results confirmed the effectiveness and validity of the proposed method and demonstrated its potential for application in the research and development of thermal protection systems in the aerospace field, which is an ongoing project of our research team. Its applicability in the field of thermal protection systems can guide the design and optimization of these systems in the aerospace industry, potentially leading to improved safety and performance of spacecraft during re-entry and in other high-temperature scenarios.
5. Conclusions
This study presents an improved method for high-temperature measurement using the DIC technique under high-intensity blackbody radiation, with a focus on the effects of speckle patterns and mitigation of heat haze effects. Initially, we developed a precise speckle pattern that ensured high contrast and accurate measurements under extreme thermal conditions. Additionally, we integrated a thermal insulation layer into the experimental setup using a new approach, which significantly reduced the heat haze effect. Simultaneously, we employed the standard method of short-wavelength bandpass filters and blue light illumination to mitigate image saturation caused by high-intensity blackbody radiation. To validate the proposed method, we heated a stainless steel 304 specimen from 25 °C to 800 °C using an infrared radiation heater. The thermal deformation distribution was measured, and the CTE was compared with handbook data and the existing literature data. The validated reliability and precision of the proposed method confirmed its applicability to the research and development of thermal protection systems in the aerospace domain.
Author Contributions
Conceptualization, N.S.G.; methodology, N.S.G. and S.M.H.; software, S.M.H.; validation, S.M.H.; formal analysis, N.S.G.; investigation, S.M.H.; resources, N.S.G.; data curation, N.S.G.; writing—original draft preparation, S.M.H.; writing—review and editing, N.S.G.; visualization, S.M.H.; supervision, N.S.G.; project administration, N.S.G.; funding acquisition, N.S.G. All authors have read and agreed to the published version of the manuscript.
Funding
This research was funded by [Reusable Unmanned Space Vehicle Research Center, 2023] grant number [No. KRIT-CT-22-030].
Data Availability Statement
The raw/processed data required to reproduce these findings will be made available on request.
Acknowledgments
This work was supported by the Korea Research Institute for Defense Technology planning and advancement (KRIT) grant funded by the Korea government (DAPA (Defense Acquisition Program Administration)) (No. KRIT-CT-22-030, Reusable Unmanned Space Vehicle Research Center, 2023). The authors are grateful for the financial support.
Conflicts of Interest
The authors declare no conflict of interest.
References
- Pineau, A.; Antolovich, S.D. High temperature fatigue of nickel-base superalloys—A review with special emphasis on deformation modes and oxidation. Eng. Fail. Anal. 2009, 16, 2668–2697. [Google Scholar]
- Thornton, E.A. Thermal Structures for Aerospace Applications; AIAA: Reston, VA, USA, 1996. [Google Scholar]
- Sziroczak, D.; Smith, H. A review of design issues specific to hypersonic flight vehicles. Prog. Aerosp. Sci. 2016, 84, 1–28. [Google Scholar] [CrossRef]
- Kayser, P.; Godefroy, J.; Leca, L.J.S.; Physical, A.A. High-temperature thin-film strain gauges. Sens. Actuators A Phys. 1993, 37, 328–332. [Google Scholar] [CrossRef]
- Lee, S.-K.; Yoo, J.-H.; Yang, M.-S. Effect of thermal deformation on machine tool slide guide motion. Tribol. Int. 2003, 36, 41–47. [Google Scholar] [CrossRef]
- Yu, L.; Pan, B. Overview of high-temperature deformation measurement using digital image correlation. Exp. Mech. 2021, 61, 1121–1142. [Google Scholar] [CrossRef]
- Sivanandi, P.; Gupta, C.; Durai, H. A review on evolution of aeroelastic assisted wing. Int. J. Aeronaut. Space Sci. 2023, 24, 652–688. [Google Scholar] [CrossRef]
- Yang, J.S.; Choi, M.K.; Kim, C.-G. Numerical Prediction of the Impact Fracture of a Projectile Through Oblique Target. Int. J. Aeronaut. Space Sci. 2023, 24, 798–811. [Google Scholar] [CrossRef]
- Le, V.T.; Goo, N.S. Dynamic characteristics and damage detection of a metallic thermal protection system panel using a three-dimensional point tracking method and a modal assurance criterion. Sensors 2020, 20, 7185. [Google Scholar] [CrossRef] [PubMed]
- Meyer, P.; Waas, A.M. Measurement of in situ-full-field strain maps on ceramic matrix composites at elevated temperature using digital image correlation. Exp. Mech. 2015, 55, 795–802. [Google Scholar] [CrossRef]
- Liang, J.; Wang, Z.; Xie, H.; Li, X. In situ scanning electron microscopy-based high-temperature deformation measurement of nickel-based single crystal superalloy up to 800 °C. Opt. Lasers Eng. 2018, 108, 1–14. [Google Scholar] [CrossRef]
- Ha, N.S.; Le, V.T.; Goo, N.S.; Kim, J.Y. Thermal strain measurement of austin stainless steel (ss304) during a heating-cooling process. Int. J. Aeronaut. Space Sci. 2017, 18, 206–214. [Google Scholar] [CrossRef]
- Jin, T.; San Ha, N.; Le, V.T.; Goo, N.S.; Jeon, H.C. Thermal buckling measurement of a laminated composite plate under a uniform temperature distribution using the digital image correlation method. Compos. Struct. 2015, 123, 420–429. [Google Scholar] [CrossRef]
- Jin, T.L.; Ha, N.S.; Goo, N.S. A study of the thermal buckling behavior of a circular aluminum plate using the digital image correlation technique and finite element analysis. Thin-Walled Struct. 2014, 77, 187–197. [Google Scholar] [CrossRef]
- Jin, T.L.; Lee, S.H.; Goo, N.S. Thermal stress measurement of a double ring structure using digital image correlation method. Exp. Tech. 2016, 40, 195–205. [Google Scholar] [CrossRef]
- Lyons, J.S.; Liu, J.; Sutton, M.A. High-temperature deformation measurements using digital-image correlation. Exp. Mech. 1996, 36, 64–70. [Google Scholar] [CrossRef]
- Grant, B.M.B.; Stone, H.J.; Withers, P.J.; Preuss, M. High-temperature strain field measurement using digital image correlation. J. Strain Anal. Eng. Des. 2009, 44, 263–271. [Google Scholar] [CrossRef]
- Pan, B.; Wu, D.; Wang, Z.; Xia, Y. High-temperature igital image correlation method for full-field deformation measurement at 1200 °C. Meas. Sci. Technol. 2010, 22, 015701. [Google Scholar] [CrossRef]
- Dong, Y.; Kakisawa, H.; Kagawa, Y. Optical system for microscopic observation and strain measurement at high temperature. Meas. Sci. Technol. 2013, 25, 025002. [Google Scholar] [CrossRef]
- Berke, R.B.; Lambros, J. Ultraviolet digital image correlation (UV-DIC) for high temperature applications. Rev. Sci. Instrum. 2014, 85, 045121. [Google Scholar] [CrossRef] [PubMed]
- Dong, Y.; Pan, B. In-situ 3D shape and recession measurements of ablative materials in an arc-heated wind tunnel by UV stereo-digital image correlation. Opt. Lasers Eng. 2019, 116, 75–81. [Google Scholar] [CrossRef]
- Pan, Z.; Huang, S.; Su, Y.; Qiao, M.; Zhang, Q. Strain field measurements over 3000 C using 3D-Digital image correlation. Opt. Lasers Eng. 2020, 127, 105942. [Google Scholar] [CrossRef]
- Pan, B.; Lu, Z.; Xie, H. Mean intensity gradient: An effective global parameter for quality assessment of the speckle patterns used in digital image correlation. Opt. Lasers Eng. 2010, 48, 469–477. [Google Scholar] [CrossRef]
- Turner, J.L.; Russell, S.S. Application of digital image analysis to strain measurement at elevated temperature. Strain 1990, 26, 55–59. [Google Scholar] [CrossRef]
- Guo, X.; Liang, J.; Tang, Z.; Cao, B.; Yu, M. High-temperature digital image correlation method for full-field deformation measurement captured with filters at 2600 C using spraying to form speckle patterns. Opt. Eng. 2014, 53, 063101. [Google Scholar] [CrossRef]
- Xin, R.; Le, V.T.; Goo, N.S. Buckling identification in composite cylindrical shells with measured imperfections using a Multi-DIC method and finite element analysis. Thin-Walled Struct. 2022, 177, 109436. [Google Scholar] [CrossRef]
- Leplay, P.; Lafforgue, O.; Hild, F. Analysis of asymmetrical creep of a ceramic at 1350 C by digital image correlation. J. Am. Ceram. Soc. 2015, 98, 2240–2247. [Google Scholar] [CrossRef]
- Wang, Y.G.; Tong, W. A high resolution DIC technique for measuring small thermal expansion of film specimens. Opt. Lasers Eng. 2013, 51, 30–33. [Google Scholar] [CrossRef]
- Novak, M.D.; Zok, F.W. High-temperature materials testing with full-field strain measurement: Experimental design and practice. Rev. Sci. Instrum. 2011, 82, 115101. [Google Scholar] [CrossRef]
- Yuile, A.; Schwerz, R.; Röllig, M.; Metasch, R.; Wiese, S. Heat haze effects in thermal chamber tensile tests on Digital Image Correlation. In Proceedings of the 2018 19th International Conference on Thermal, Mechanical and Multi-Physics Simulation and Experiments in Microelectronics and Microsystems (EuroSimE), Toulouse, France, 15–18 April 2018; IEEE: Piscataway, NJ, USA, 2018. [Google Scholar]
- Davis, J.R. Stainless Steels; ASM International: Almere, The Netherlands, 1994. [Google Scholar]
- Shrivastava, A.; Lambade, V.; Chaudhuri, P. Measurement of Thermal Expansion for Stainless Steel 304, Copper, Aluminium and Brass by Push Rod Dilatometry; Technical report; IPR/TR-603; Institute for Plasma Research: Gandhinagar, India, 2020. [Google Scholar]
- Gschneidner, K.A.; Beaudry, B.J.; Capellen, J. Properties and selection: Nonferrous alloys and special-purpose materials. In Metals Handbook, 10th ed.; ASM International: Almere, The Netherlands, 1990; Volume 2, pp. 720–732. [Google Scholar]


Disclaimer/Publisher’s Note: The statements, opinions and data contained in all publications are solely those of the individual author(s) and contributor(s) and not of MDPI and/or the editor(s). MDPI and/or the editor(s) disclaim responsibility for any injury to people or property resulting from any ideas, methods, instructions or products referred to in the content. |
© 2024 by the authors. Licensee MDPI, Basel, Switzerland. This article is an open access article distributed under the terms and conditions of the Creative Commons Attribution (CC BY) license (https://creativecommons.org/licenses/by/4.0/).