Article

Role of Partial Flexibility on Flow Evolution and Aerodynamic Power Efficiency over a Turbine Blade Airfoil

by
Kemal Koca
1,2 and
Mustafa Serdar Genç
1,3,4,*
1
Wind Engineering and Aerodynamic Research Laboratory, Department of Energy Systems Engineering, Erciyes University, 38039 Kayseri, Turkey
2
Department of Mechanical Engineering, Abdullah Gül University, 38080 Kayseri, Turkey
3
Energy Conversion Research and Application Center, Erciyes University, 38039 Kayseri, Turkey
4
MSG Teknoloji Ltd. Şti., Erciyes Teknopark, Tekno-1 Binası 61/20, 38039 Kayseri, Turkey
*
Author to whom correspondence should be addressed.
Aerospace 2024, 11(7), 571; https://doi.org/10.3390/aerospace11070571
Submission received: 27 April 2024 / Revised: 8 July 2024 / Accepted: 9 July 2024 / Published: 11 July 2024

Abstract

:
In this study, the aerodynamic performance of a cambered wind turbine airfoil with a partially flexible membrane material on its suction surface was examined experimentally across various angles of attack and Reynolds numbers. It encompassed physical explanation at the pre/post-stall regions. The results of particle image velocimetry revealed that the laminar separation bubble was diminished or even suppressed when a local flexible membrane material was employed on the suction surface of the wind turbine blade close to the leading edge. The results of the deformation measurement indicated that the membrane had a range of flow modes. This showed that the distribution of aerodynamic fluctuations due to the presence of LSB-induced vortices was reduced. This also led to a narrower wake region occurring. Aerodynamic performance improved and aerodynamic vibration significantly lowered, particularly at the post-stall zone, according to the results of the aerodynamic force measurement. In addition to the lift force, the drag force was enormously reduced, corroborating and matching well with the results of PIV and deformation measurements. Consequently, significant benefits for a turbine blade were notably observed, including aerodynamic performance enhancement, increased aerodynamic power efficiency, and reduced aerodynamic vibration.

1. Introduction

The turbine blade is one of the most important components for wind turbines. Nowadays, the sector of modern wind turbines has opted for laminar airfoils since the desired angle of attack without influencing the drag force can be effectively operated. Notwithstanding its positive effect, viscous forces play a dominant role in flow formed over these airfoils at typical Reynolds numbers, resulting in the existence of unsteady flow structures such as boundary layer separation or an LSB [1,2,3]. To physically account for the formation of an LSB, flow at a low Reynolds number (Rec < 5 × 10⁵) remains laminar beyond the point of minimum pressure and it is therefore liable to separate from the surface because of adverse pressure gradients (APGs). The separated shear layer is innately unsteady and undergoes the transition phenomenon, which might or might not cause flow reattachment to the surface. The stall phenomenon occurs if flow reattachment does not exist, which is widespread for larger angles of attack or lower Reynolds number regimes. If the flow can reattach, the recirculating fluid in the closed region is composed and is named an LSB [4]. The presence of an LSB provides poor aerodynamic performance by causing some unfavorable situations such as aerodynamic noise, vibration, and pressure drag rise [5,6,7,8].
Therefore, comprehending the progress of the formation of an LSB is a hot spot and an ongoing case for micro aerial vehicles (MAVs), unmanned aerial vehicles (UAVs), and urban wind turbines, even though a lot of studies have been carried out to ensure better solutions. So far, numerous flow control techniques have been studied and employed to prohibit the negative effects of an LSB. In the literature, the flow control techniques can be split up into two categories, as follows: (i) passive [9] and (ii) active [10] control techniques. Recently, the passive control techniques have been frequently selected more than active ones since they have simple strategies, enhancing lift force and delaying stall without spending external energy. These passive controllers may be categorized as follows: implementing vortex generators (VGs) [11], employing control rods [12], applying slots [13], utilizing suction and blowing [14,15], using roughness material [16] and riblets [17], employing trailing-edge flaps [18,19], considering dimples [20] and grooves [21], using bio-inspired applications [22,23,24,25,26,27,28,29,30], integrating together passive flow controllers [31], and utilizing concentrators, deflectors, and combined systems [32,33,34,35,36], to name but a few.
Beyond these passive control techniques, considering flexible material or flexible blades to enhance the aerodynamic performance and ensure more energy output for wind turbines [37] and have less vibration and more stable flight for UAVs and MAVs [38,39,40,41] has been a recent hot-topic investigation area. On the other hand, the implementation of flexible material over the local area of a wind turbine blade surface is rare in the literature. As a numerical attempt using computational fluid dynamics (CFD), the study performed by Kang et al. [42] revealed that a greater lift–drag ratio was ensured compared to a rigid airfoil when studying a locally flexible airfoil at a low Reynolds number. Flow on a NACA0012 airfoil at a Reynolds number of 0.5 × 10⁴ in the laminar flow regime and flow on an LH37 airfoil at a Reynolds number of 1.1 × 10⁶ were simulated by Naderi and Mojtahedpoor [43]. Their result clearly showed that stall was delayed, and flow separation and the formation of an LSB were suppressed, allowing the provision of an increased aerodynamic performance. A local oscillating flexible surface positioned between x/c = 0.1 and x/c = 0.3 over the surface of a NACA0015 airfoil at a Reynolds number of 1 × 10⁶ was studied by Wang et al. [44]. The oscillation form of the flexible area was identified by a user-defined function (UDF). The results expressly pointed out that the oscillation of local flexibility may induce new and small vortex structures near the flow separation point, improving the lift coefficient of the NACA0015 airfoil. Both a large eddy simulation (LES) and an experimental investigation were conducted to understand the effects of local vibration on the drag reduction of NACA0012 airfoil at a Reynolds number of 0.75 × 10⁶ (Lou et al. [45]). The optimal frequency of vibration was found near the dominant frequency of the shear layer and wake vortices. These local vibrations could improve the aerodynamic performance and they could mitigate the drag thanks to the vortex’s generation patterns. In experimental investigations, a local flexible membrane (LFM) was studied by the current authors at the suction [46] and pressure surfaces [47] of different airfoils at various Reynolds numbers and angles of attack to control the progress of an LSB and have less vibration. The results obtained from the experimental investigations pointed out that the formation of an LSB was primarily suppressed and the size of the wake region was minimized, indicating that lower drag as well as higher lift coefficients occurred.
In this study, the flow phenomena formed on the suction surface of an FX 84-W-150 airfoil with and without partial flexibility were investigated in detail using PIV at Reynolds numbers of 1.05 × 10⁵ and 1.4 × 10⁵ (they were higher than the Reynolds numbers of the experiment) [47]. Moreover, fastidious experimental measurements including deformation measurement and aerodynamic tests were carried out. In contrast to the previous study [47], the influences of an LFM on the formation and progress of an LSB and its interaction with LSB-induced deformations measured utilizing the DIC system were explained rather than its effects on aerodynamic performance. Moreover, employing an LFM at the local part of the suction surface as a flow control technique is rare in the literature.
Related to the essential path of this study, the introduction of the flow control techniques with detailed literature research are provided in Section 1. Then, experimental arrangements are described in Section 2. Section 3 consists of the experimental results and a few comparisons enabled by the literature review. The mechanism of an LFM's effect on flow is also analyzed in this section. Finally, the critical conclusions are provided in Section 4.

2. Experimental Setup

To examine the influence of the progress of the LSB and boundary layer separation formed over the suction surfaces of an airfoil with and without an LFM and to clearly understand how the membrane material responded to the flow–membrane interaction, the experimental setup is discussed in this section as follows:

2.1. Test Model

Regarding the test model, an FX 84-W-150 wind turbine airfoil was selected. The choice of this airfoil was based on two factors. One of them is that no specific research or findings were documented in the literature, and secondly it was appropriate for wind turbine applications, particularly near the blade’s root area. Its maximum thickness was 15% at 37.1% of the chord, whereas the maximum camber was 4.2% at 40.2% of the chord. The chord length of the airfoil was 200 mm, while its span length was 300 mm. As a result of an experimental optimization study for a suitable location of the flexible membrane [47], the local area on the suction surface between x/c = 0.2 and x/c = 0.4 was determined as the optimum place for the membrane. As shown in Figure 1, FX 84-W-150 airfoil with LFM material was modelled using the SolidWorks program and it was then manufactured via a 3D printer. Their roughened surfaces were rubbed with sandpaper (first P400 and then P2000) to ensure a smoother surface and dyed with black spray. After providing all necessaries, double-sided tape with 0.05 mm thickness, which did not disturb the flow characteristics, was pasted at all tips of the airfoil to mount the flexible membrane. The membrane which was utilized in the current study was a latex rubber sheet with a height of 0.2 mm (referred to as ‘k’ throughout the rest of the study) and with a Young’s modulus (E) of 2.2 MPa and a density ( ρ m ) of 1 g/cm3. To ensure a homogeneous flow structure on all surfaces of the controlled airfoils, the flexible membrane material was used to cover both the pressure and the suction surfaces.

2.2. Experimental Techniques and Apparatus

Experimental arrangements were carried out in two different aerodynamic laboratories for this study, as follows: (i) The aerodynamic force measurements were fulfilled in a low-speed and suction-type wind tunnel constructed by the Wind Engineering and Aerodynamic Research (WEAR) Group at Erciyes University, Türkiye. The technical specification belonging to the wind tunnel was provided, as seen in Table 1. (ii) The particle image velocimetry (PIV) as well as deformation measurements were conducted in the Atmospheric Wind Tunnel at the Bundeswehr University, Munich, Germany. The velocity contours as well as turbulent statistics such as Reynolds stresses and turbulent kinetic energy (TKE) were obtained by PIV measurements, while flow-induced deformations formed over flexible membrane were visualized by means of deformation measurements.
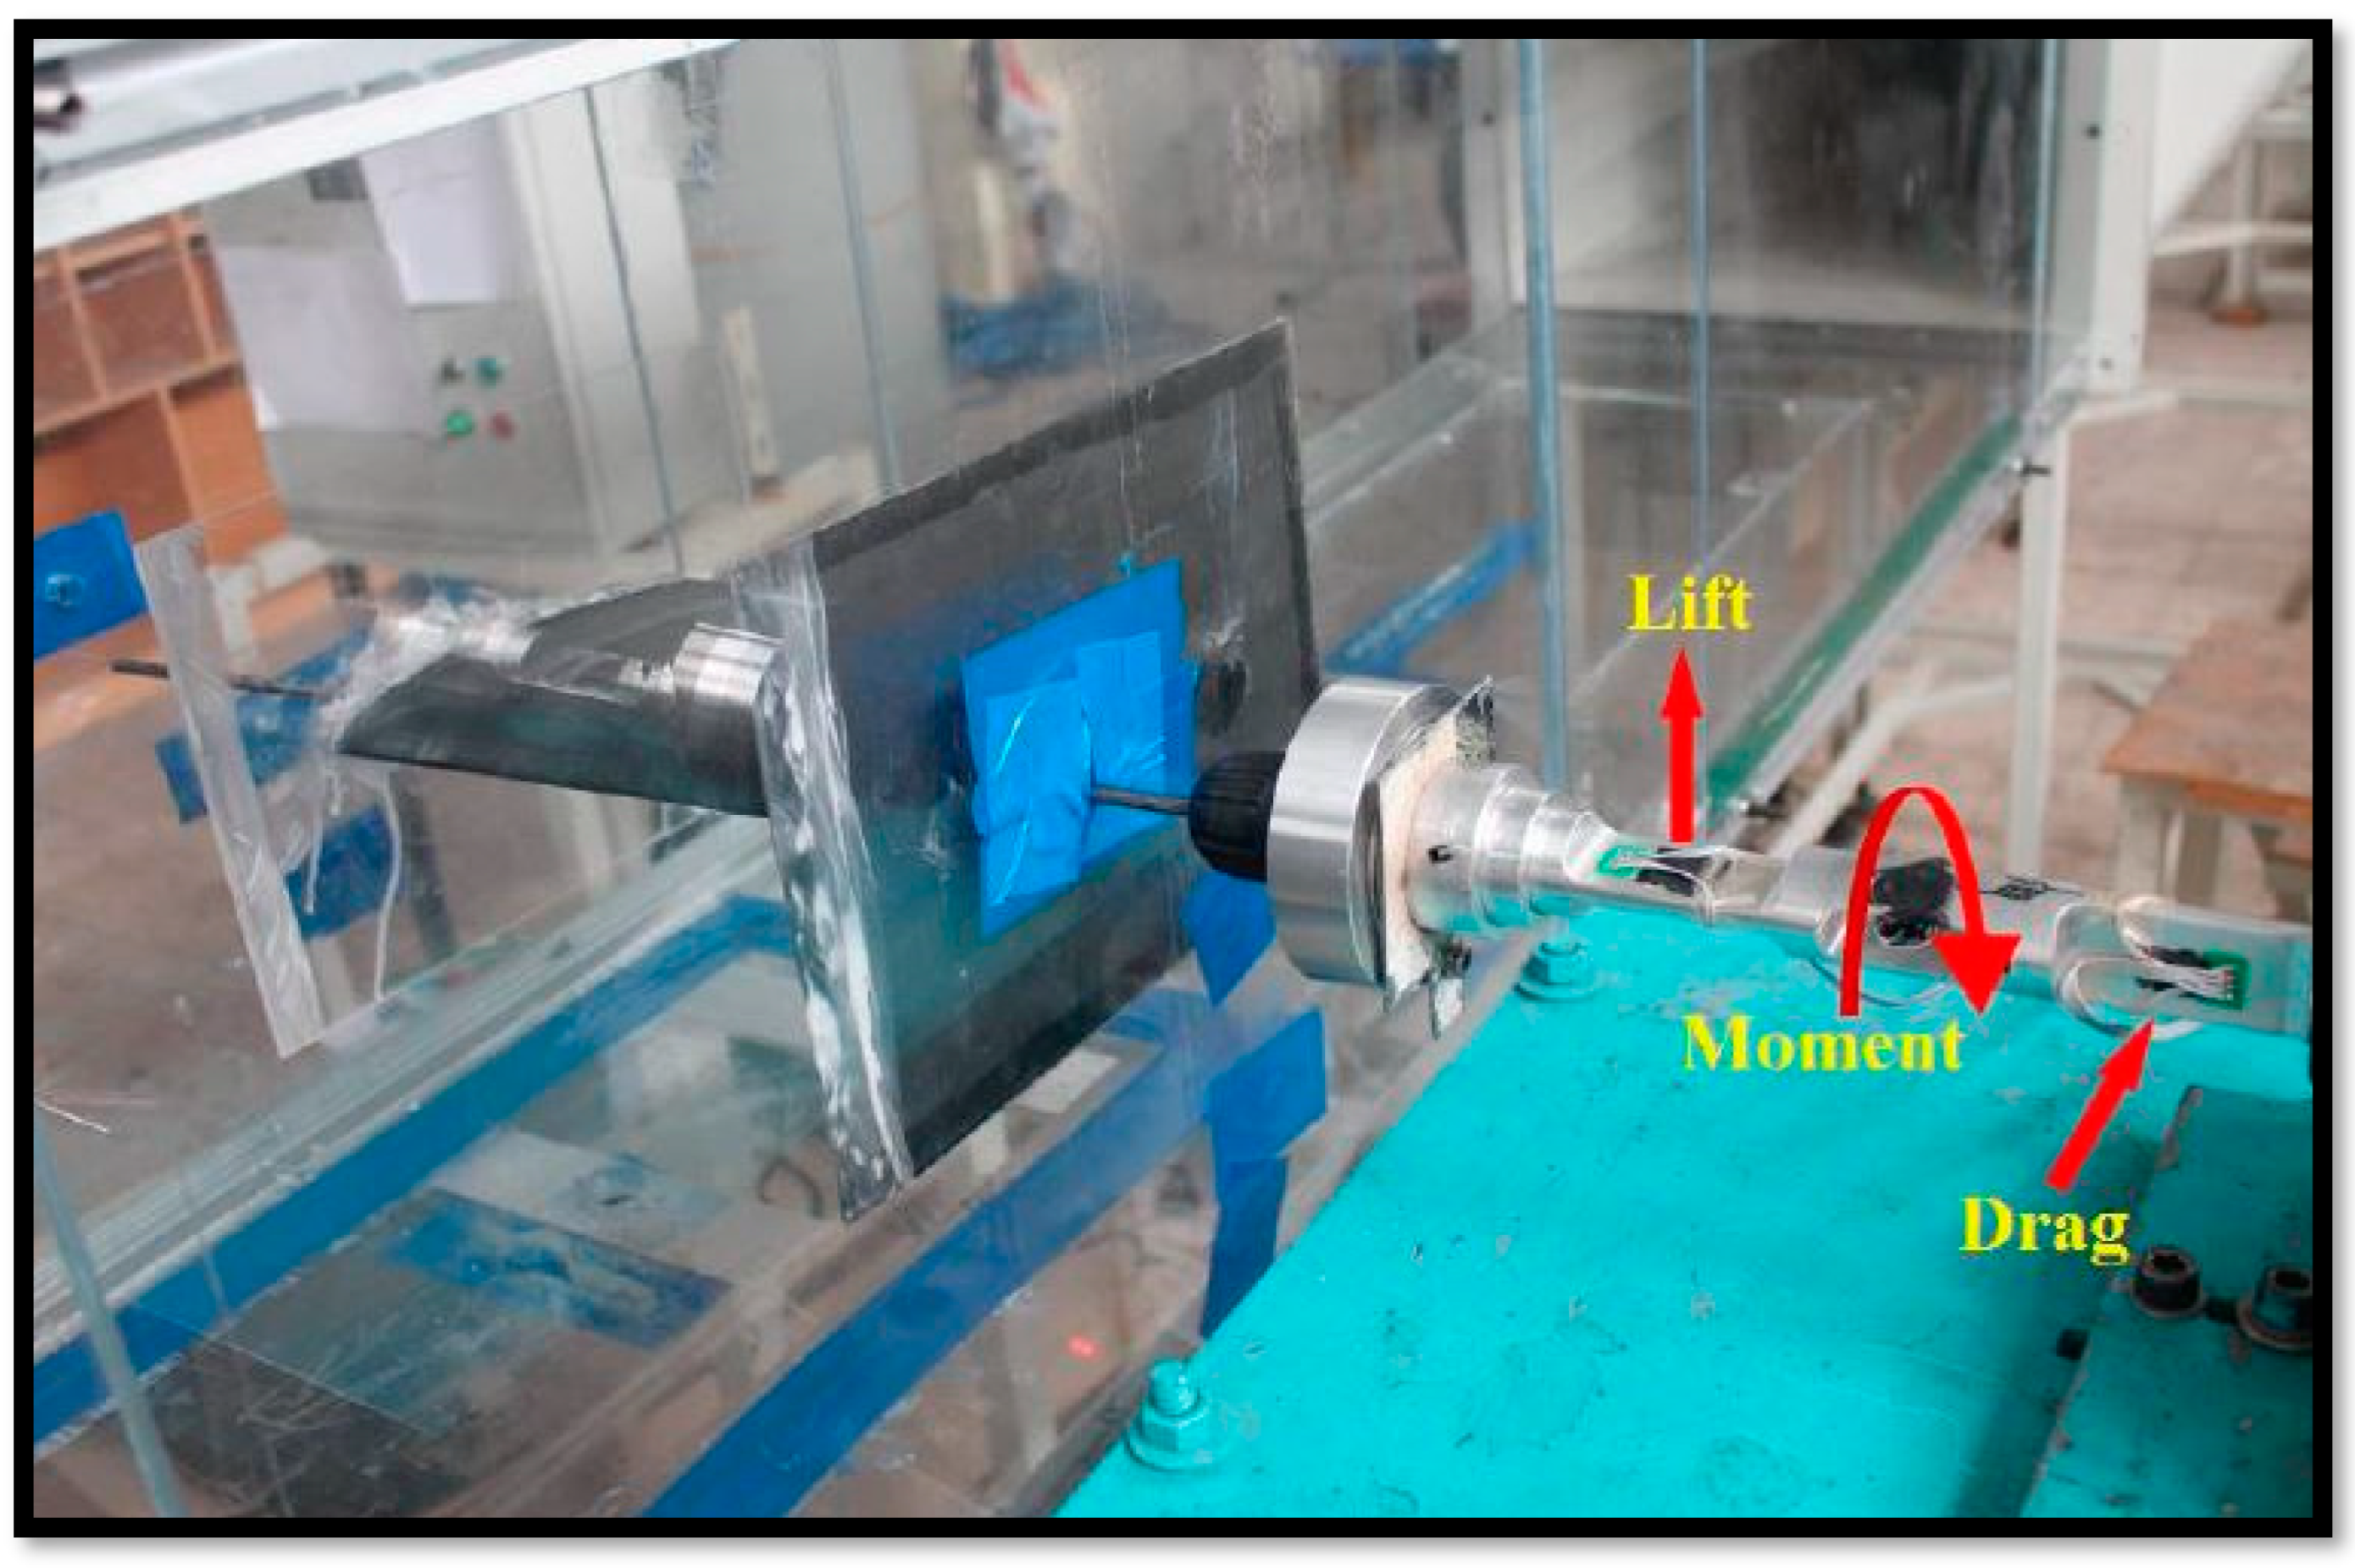
As shown in Figure 2, during the tests, a time-dependent force-measuring apparatus was utilized to calculate the lift (CL) and drag (CD) coefficients of the controlled and uncontrolled airfoil. To improve accuracy, the equipment was calibrated before the experiment. The uncertainty values in the lift force coefficient and drag force coefficient were approximately 5% between Re = 1 × 10⁵ and 2 × 10⁵ [48]. Two strain gauges positioned on the system were used to measure the lift (FL) and drag (FD) forces. One strain gauge was used for the lift and the other was for the drag. In every example, data were collected for 10 s at a sampling rate of 1000 Hz. A total of 10,000 items of data were recorded. The fluctuation and vibration analyses were investigated by means of time-dependent results, whereas the CL and CD curves were composed with the instantaneous results. Following the test, power efficiency (PE) [49] as well as CL and CD were post-processed by using the following equations:
C L = 2 F L ρ U 2 s c
C D = 2 F D ρ U 2 s c
P E = C L 3 2 C D
where U is velocity, ρ is air density, s is the span length and c is the chord length of the airfoil.
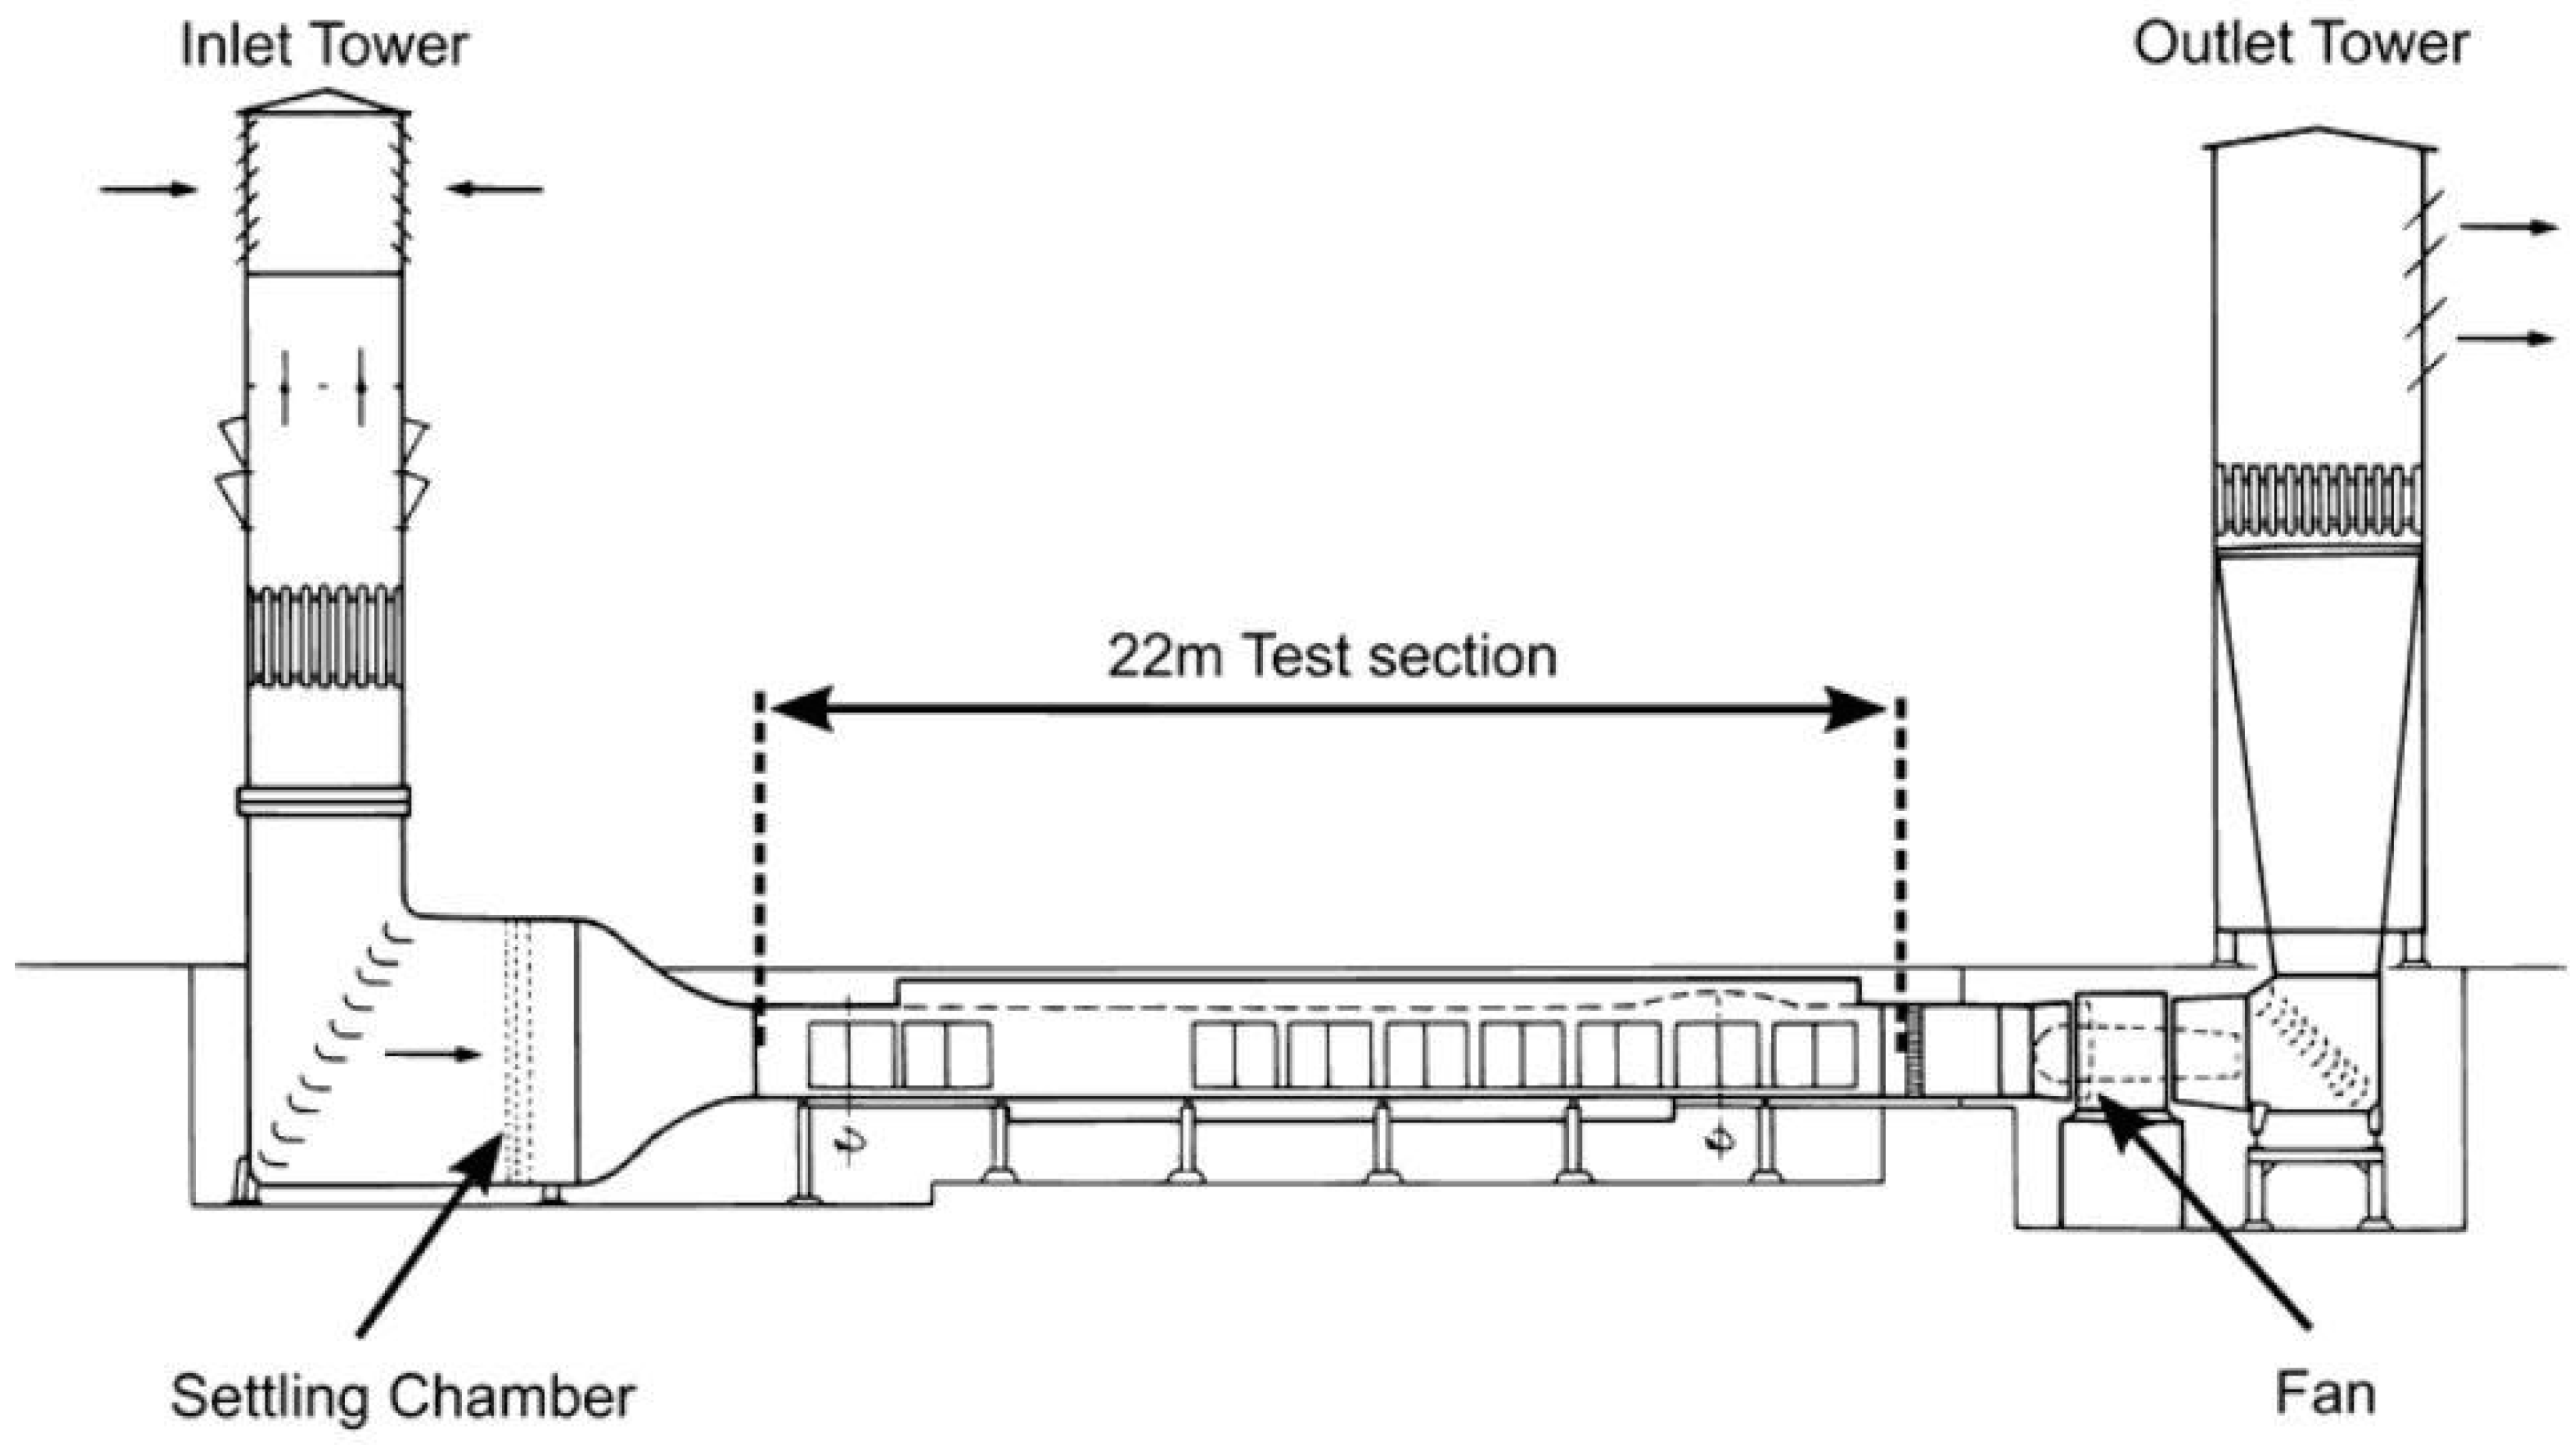
A sketch of the atmospheric wind tunnel is illustrated in Figure 3. The Atmospheric Wind Tunnel in Munich (AWM) used an Eiffel-type design. The wind tunnel was an open loop, i.e., the intake of the tunnel gathered air from outside and blew the air back outside from the outlet tower after passing it through a nozzle and test section. The closed test section had a height-adjustable flexible ceiling used to generate a specified pressure gradient (e.g., dp/dx = 0) along the flow direction. The length of the test section was L = 22 m. The cross-section of the measuring section was approximately 4 m². The flow velocity in the test section was adjustable between 2 m/s and 45 m/s. An electrical heater (N = 1.2 MW) in the intake duct could be used to control the air temperature to the maximum of 80 °C at a flow velocity of 4.0 m/s. Further information is shown in Table 2.
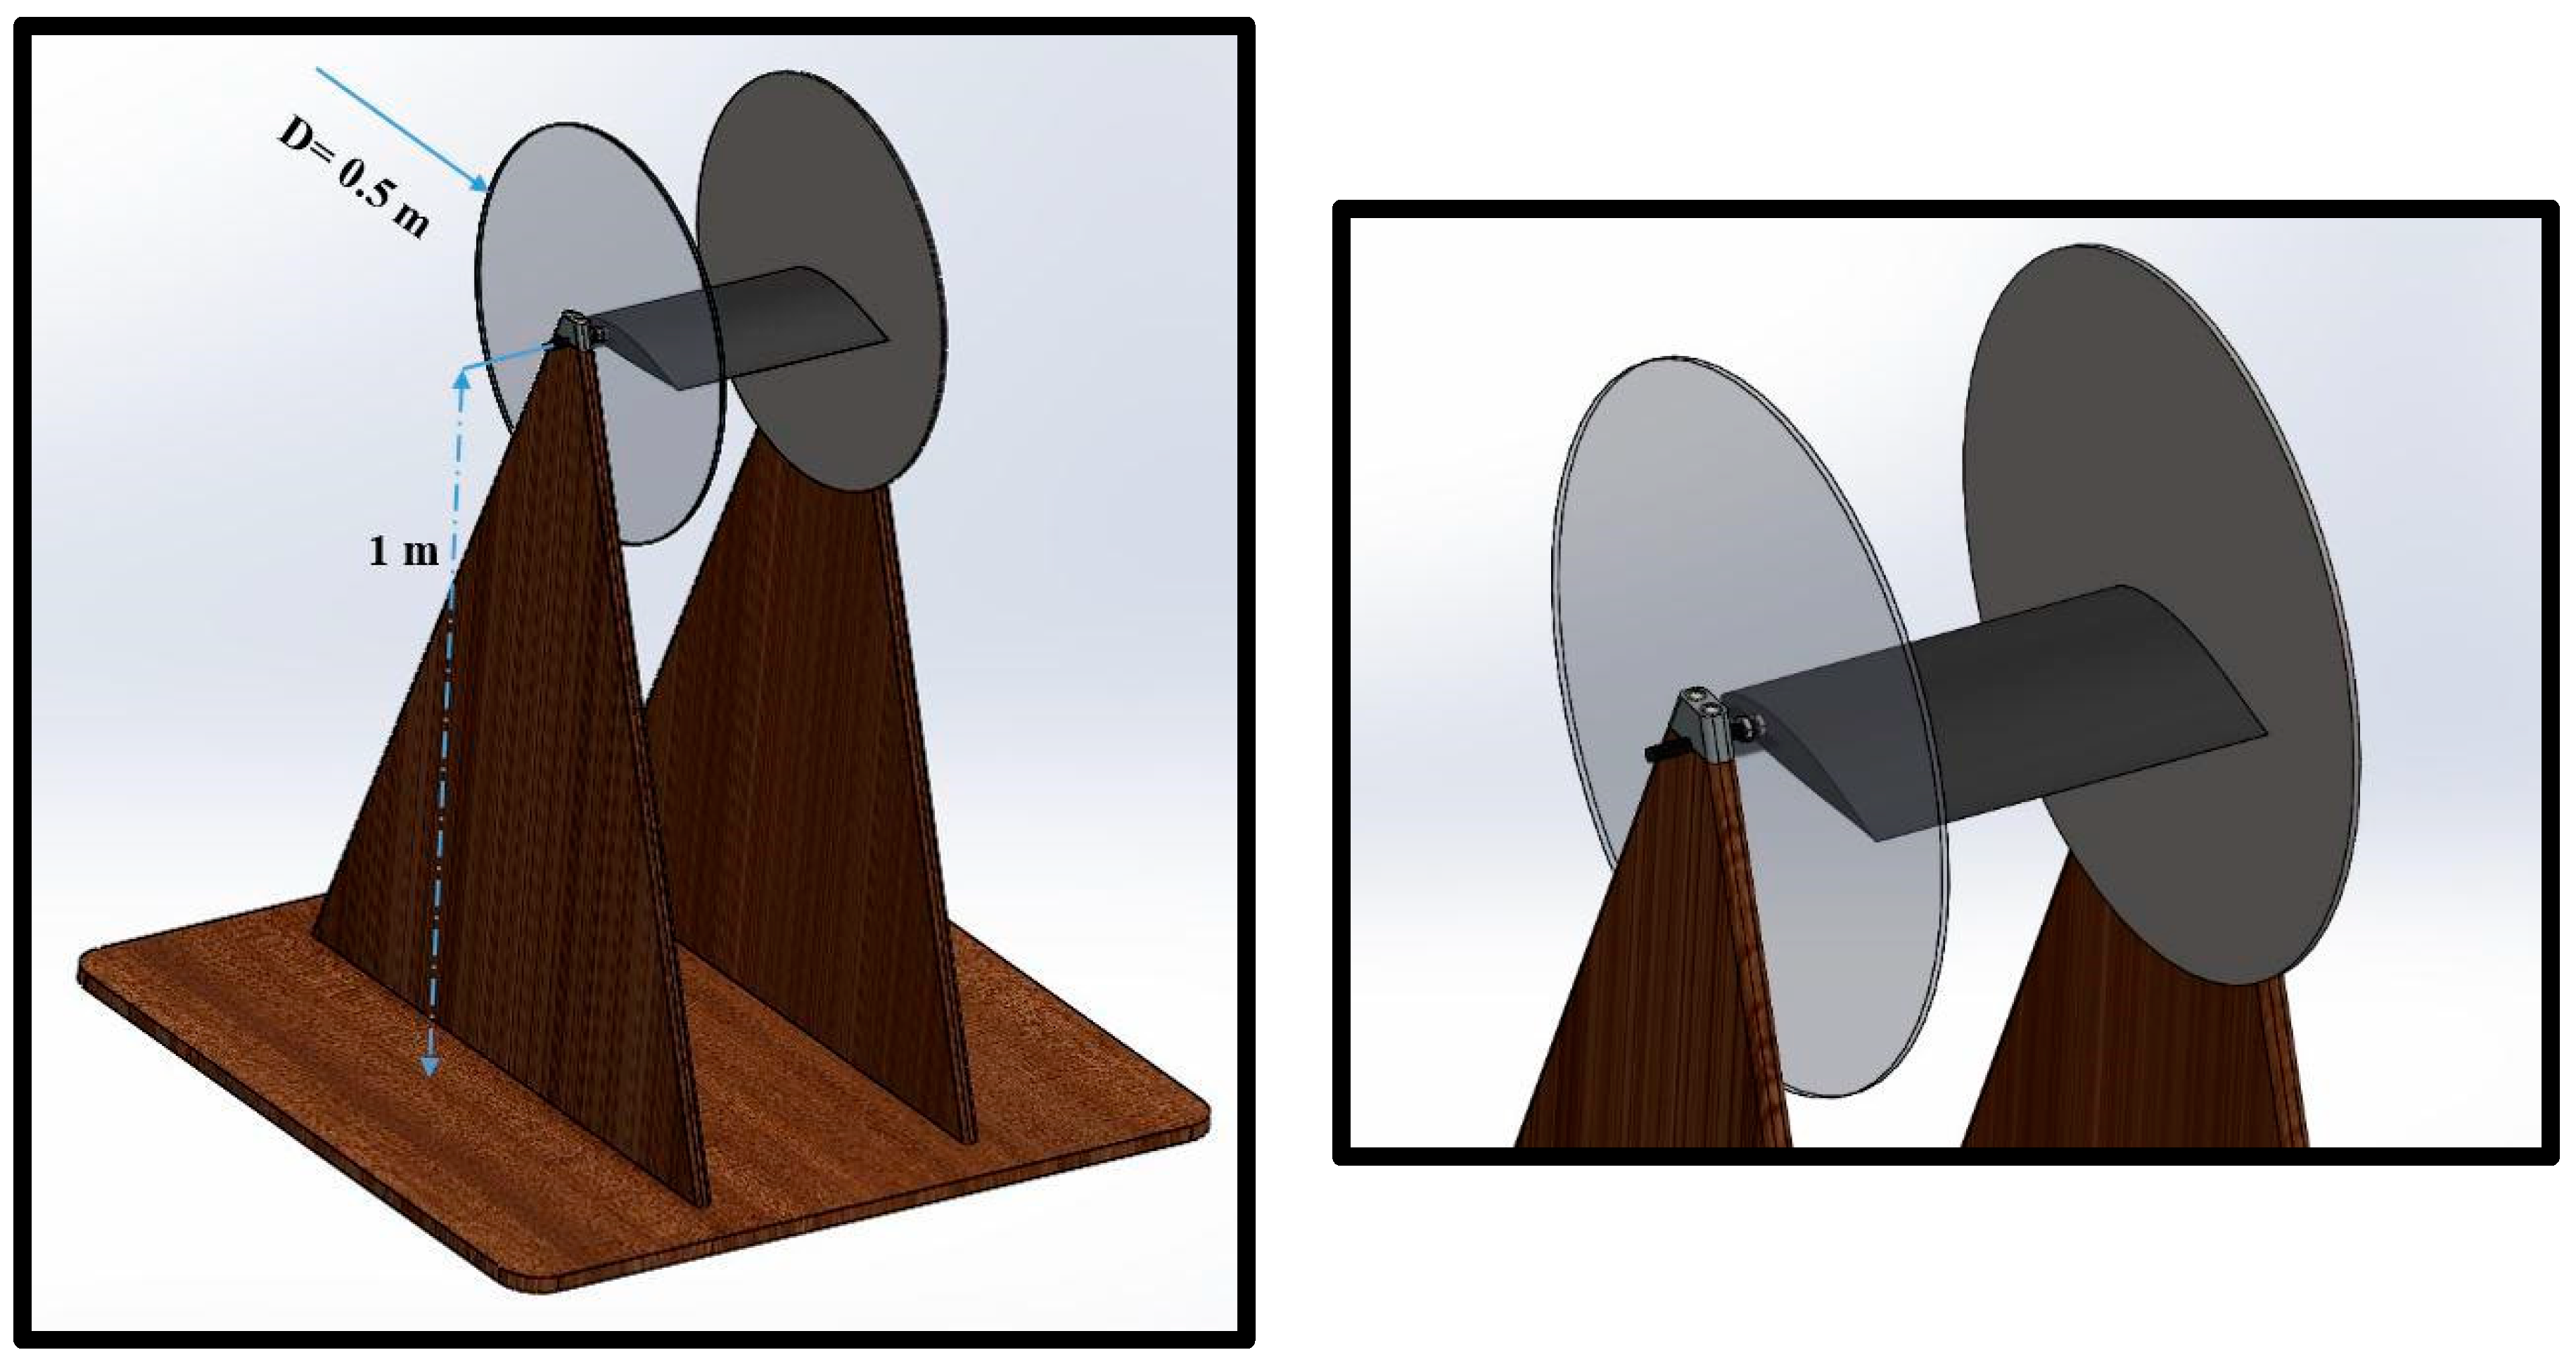
The apparatus shown in Figure 4 was fabricated to hold the airfoils in a stable manner and to perform the experiments in the Atmospheric Wind Tunnel. The length of the apparatus was 1 m from the fixing point of the airfoil towards the ground. In addition, circular materials with a diameter of 0.5 m, one made from transparent glass and the other from wood, were prepared to protect the airfoil from the effects of tip vortices.
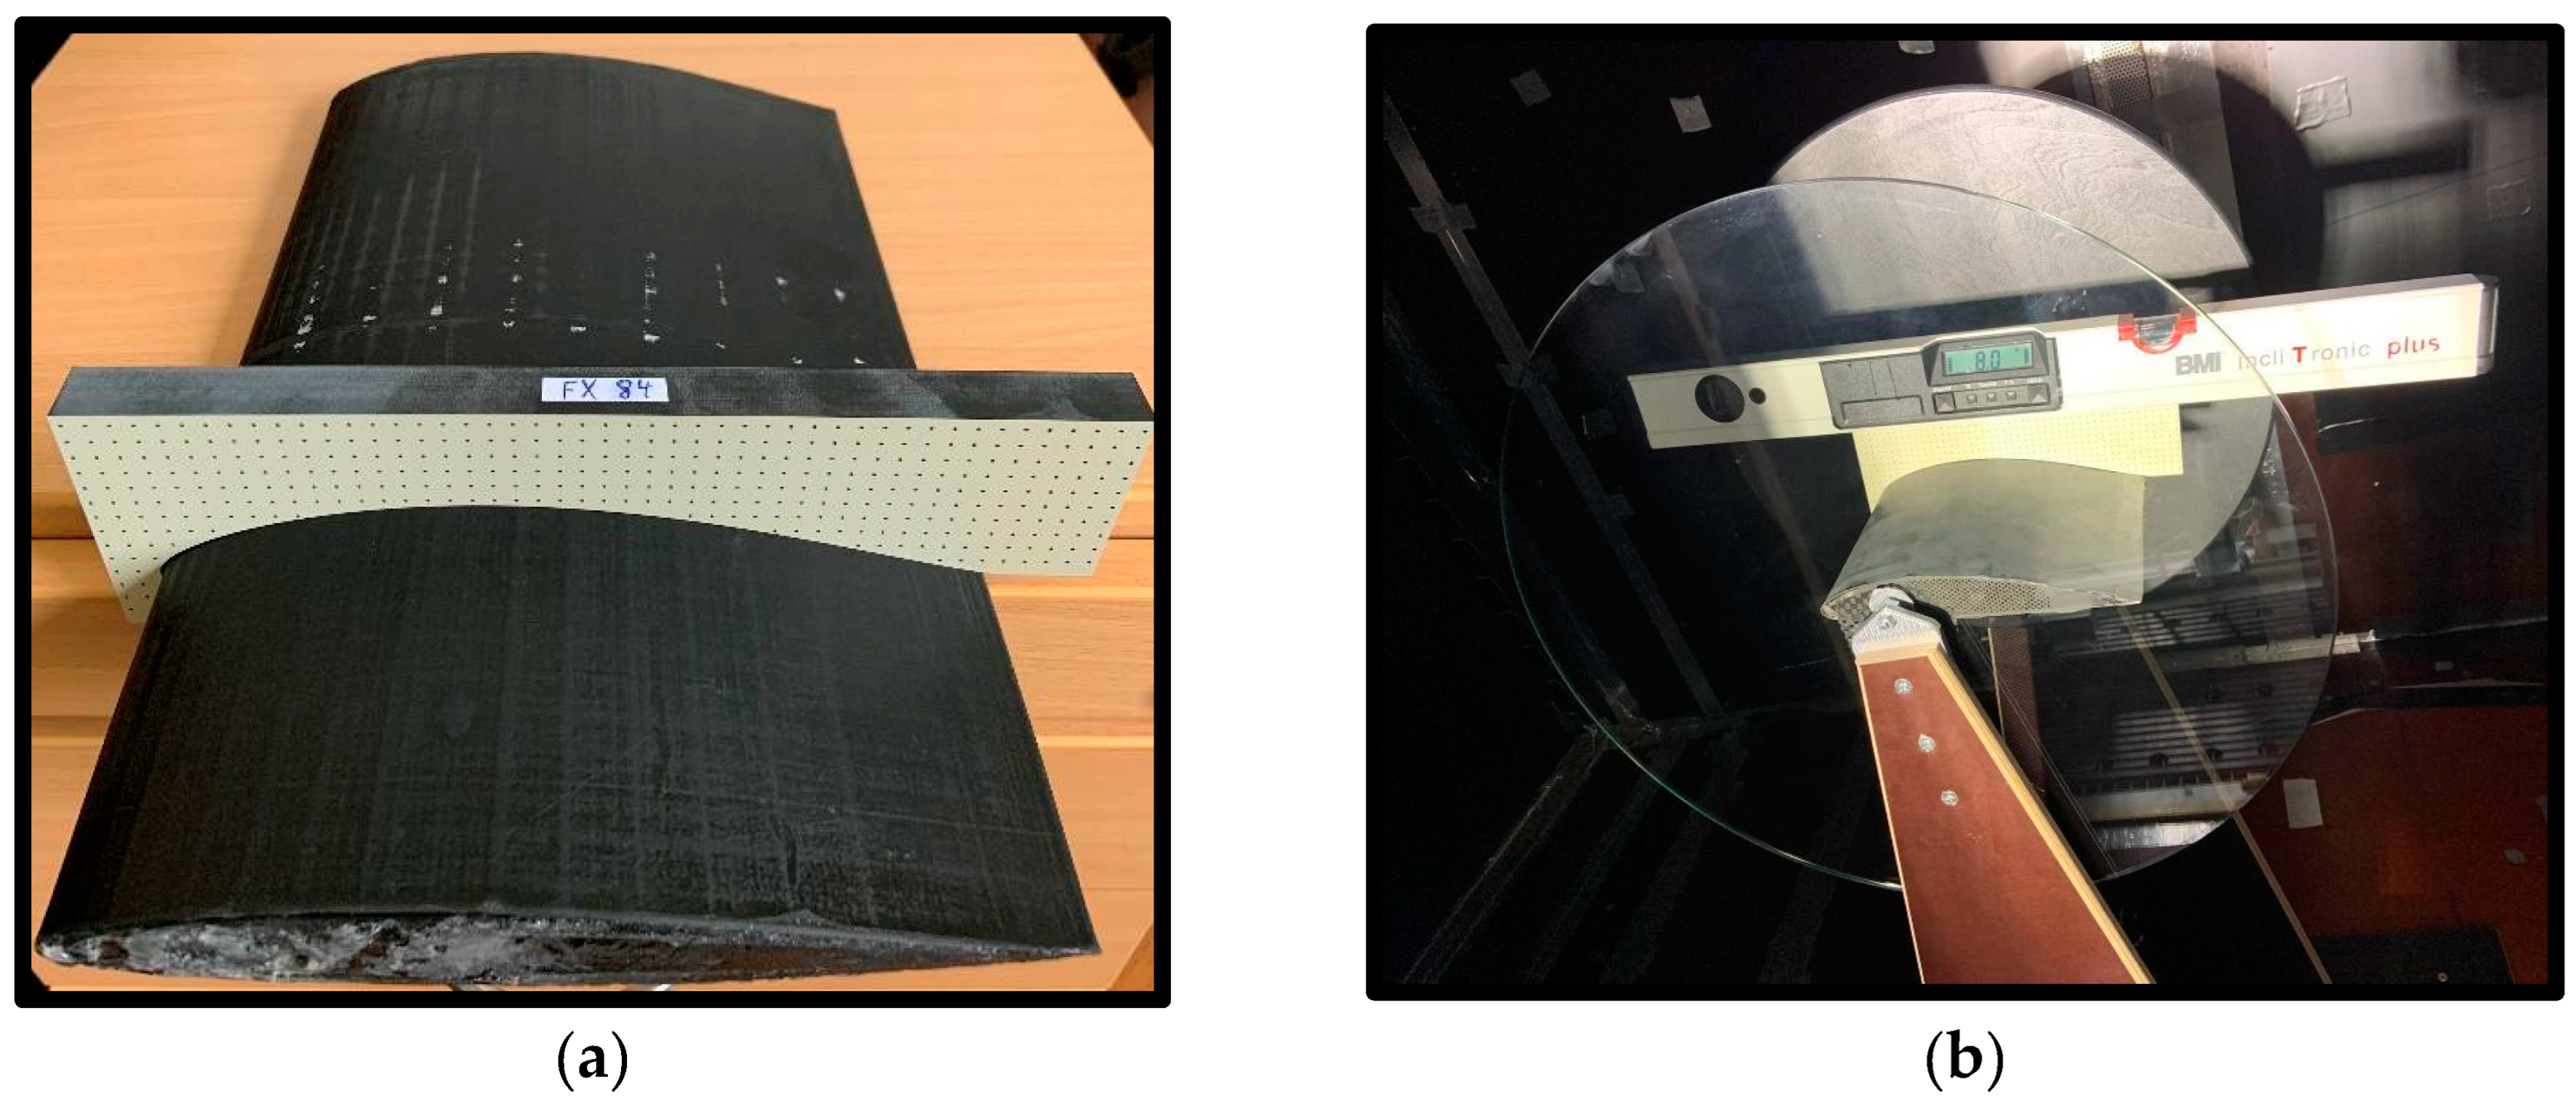
Related to the calibration target of PIV, the front surface of the calibration target was equipped with a regular dot pattern with a distance of 5 mm from dot to dot and a dot diameter of 1 mm. The distance between the two holes was 5 mm, as illustrated in Figure 5.
The angle of attack of the airfoil was adjusted, as shown in Figure 6. As mentioned before, the PIV calibration target was positioned on the airfoil surface. Hereby, it both served as a calibration process and enabled the adjustment of the angle of attack easily. Additionally, an electronic spirit level was placed on the calibration target and the desired angle of attack was adjusted.
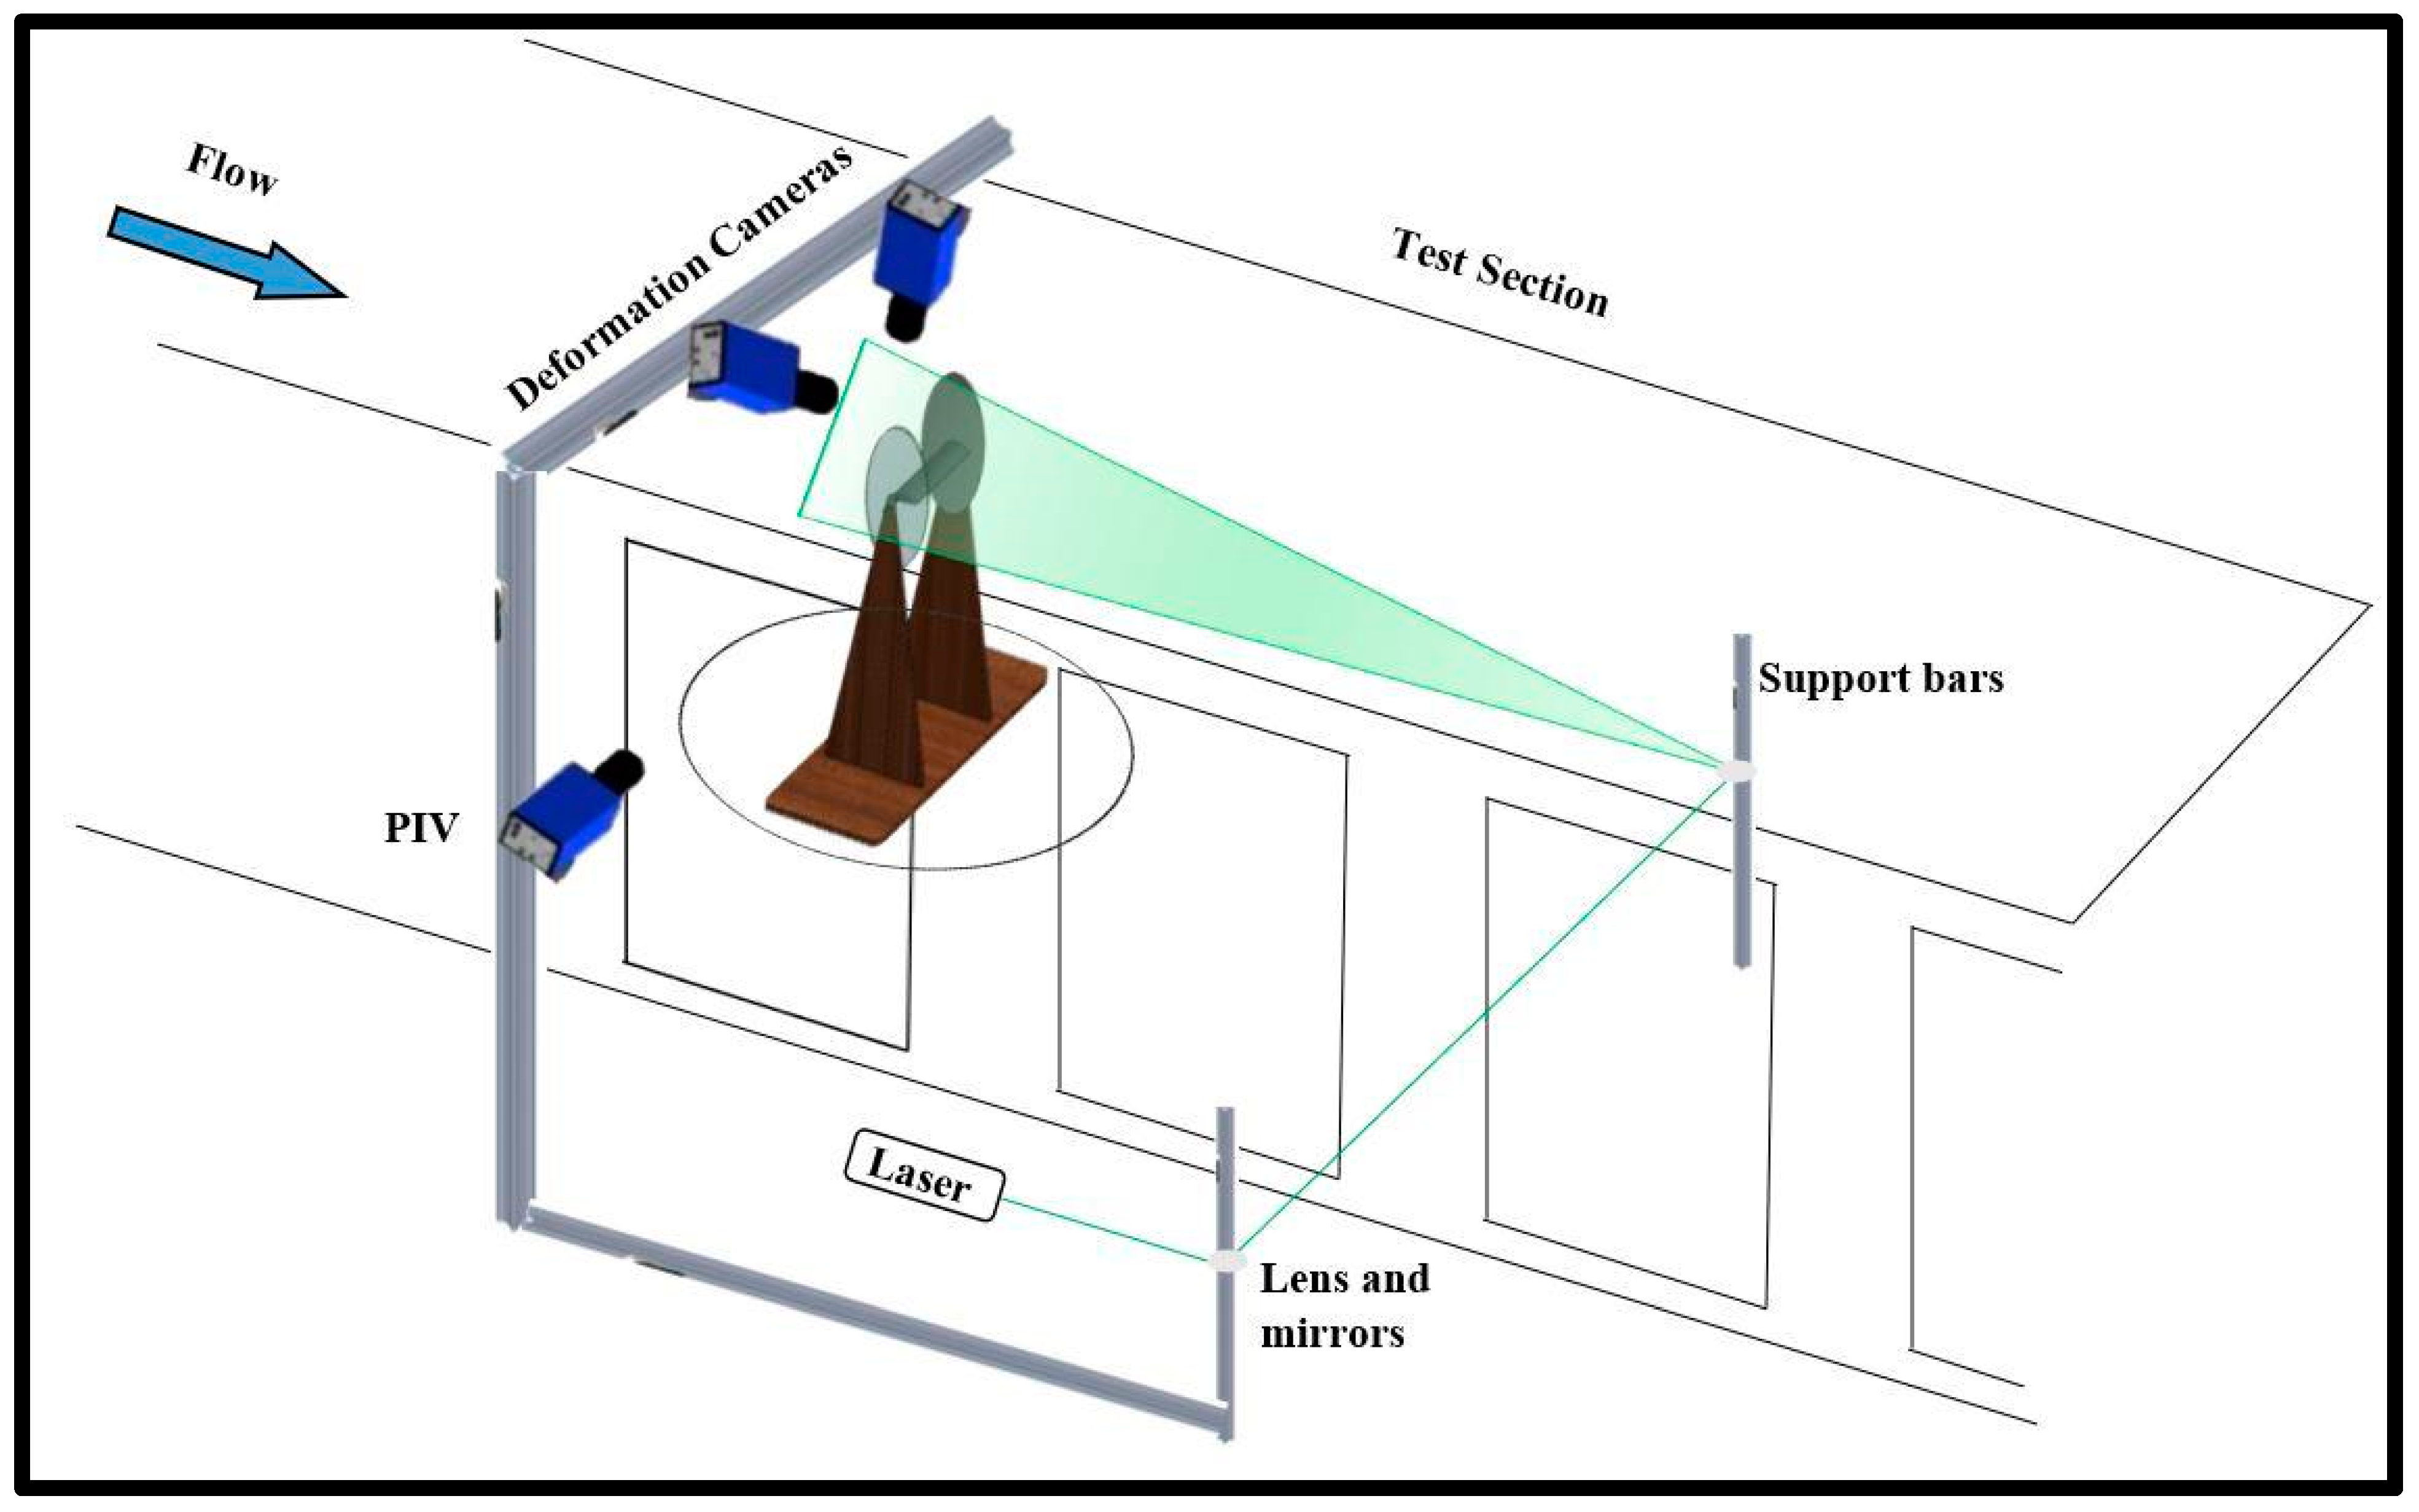
In Figure 7, a sketch is provided to better understand the experiments carried out in the Atmospheric Wind Tunnel. In addition to the deformation measurement for the controlled airfoil with an LFM, velocity measurements on the airfoils were carried out with PIV simultaneously. Two cameras were positioned above the model and outside the wind tunnel. These cameras were utilized to measure flow-induced vibrations and deformations. In addition, a high-speed camera was used for PIV measurements. As indicated in the figure, the light sheet required for PIV was ensured from a laser outside the tunnel. Lenses and mirrors were used to form the light sheet. The technical specifications of the PIV and deformation measurements are shown in Table 3 and in Table 4, respectively.
For the deformation measurements, 2 cameras were positioned at the top and outer part of the tunnel. The sensor resolutions were 2016 × 2016 and 2016 × 1100. Also, the pixel size was 11 μm × 11 μm. During the test, the sampling rate was 1000 Hz, while the sampling time was 2 s. For every correlation, a square region of interest in the image’s center was employed. Each experiment was repeated for each angle of attack and Reynolds number. In the PIV experiments, data with a sampling time of 2 s were taken with a 1000 Hz sampling rate and an average of 2000 items of data were taken with the software of the PIV test system.
Equations were used to find the necessary parameters before the experiments. The dynamic viscosity of the flow was calculated with the Sutherland formula, as given in Equation (4). The density of air was found with the general gas equation, as provided by Equation (5). The kinematic viscosity of the flow was as ensured by Equation (6). Then, the flow velocity was obtained with the Reynolds number formula given by Equation (7). Since the tunnel type was an atmospheric wind tunnel and the first measured temperature and pressure values were variable, the desired kinematic viscosity and velocity values were obtained at the desired pressure and temperature in conjunction with the equations.
μ = μ 0   ( T T 0 ) 3 2   ( T 0 + S μ T + S μ )
ρ = P R .   T
ϑ = μ ρ
U = R e .   ϑ c

3. Experimental Results and Discussion

In this section, all results obtained from the PIV tests will be discussed. Additionally, attempts at understanding flow–structure interactions will be carried out using both deformation and force measurement results.

3.1. PIV Results

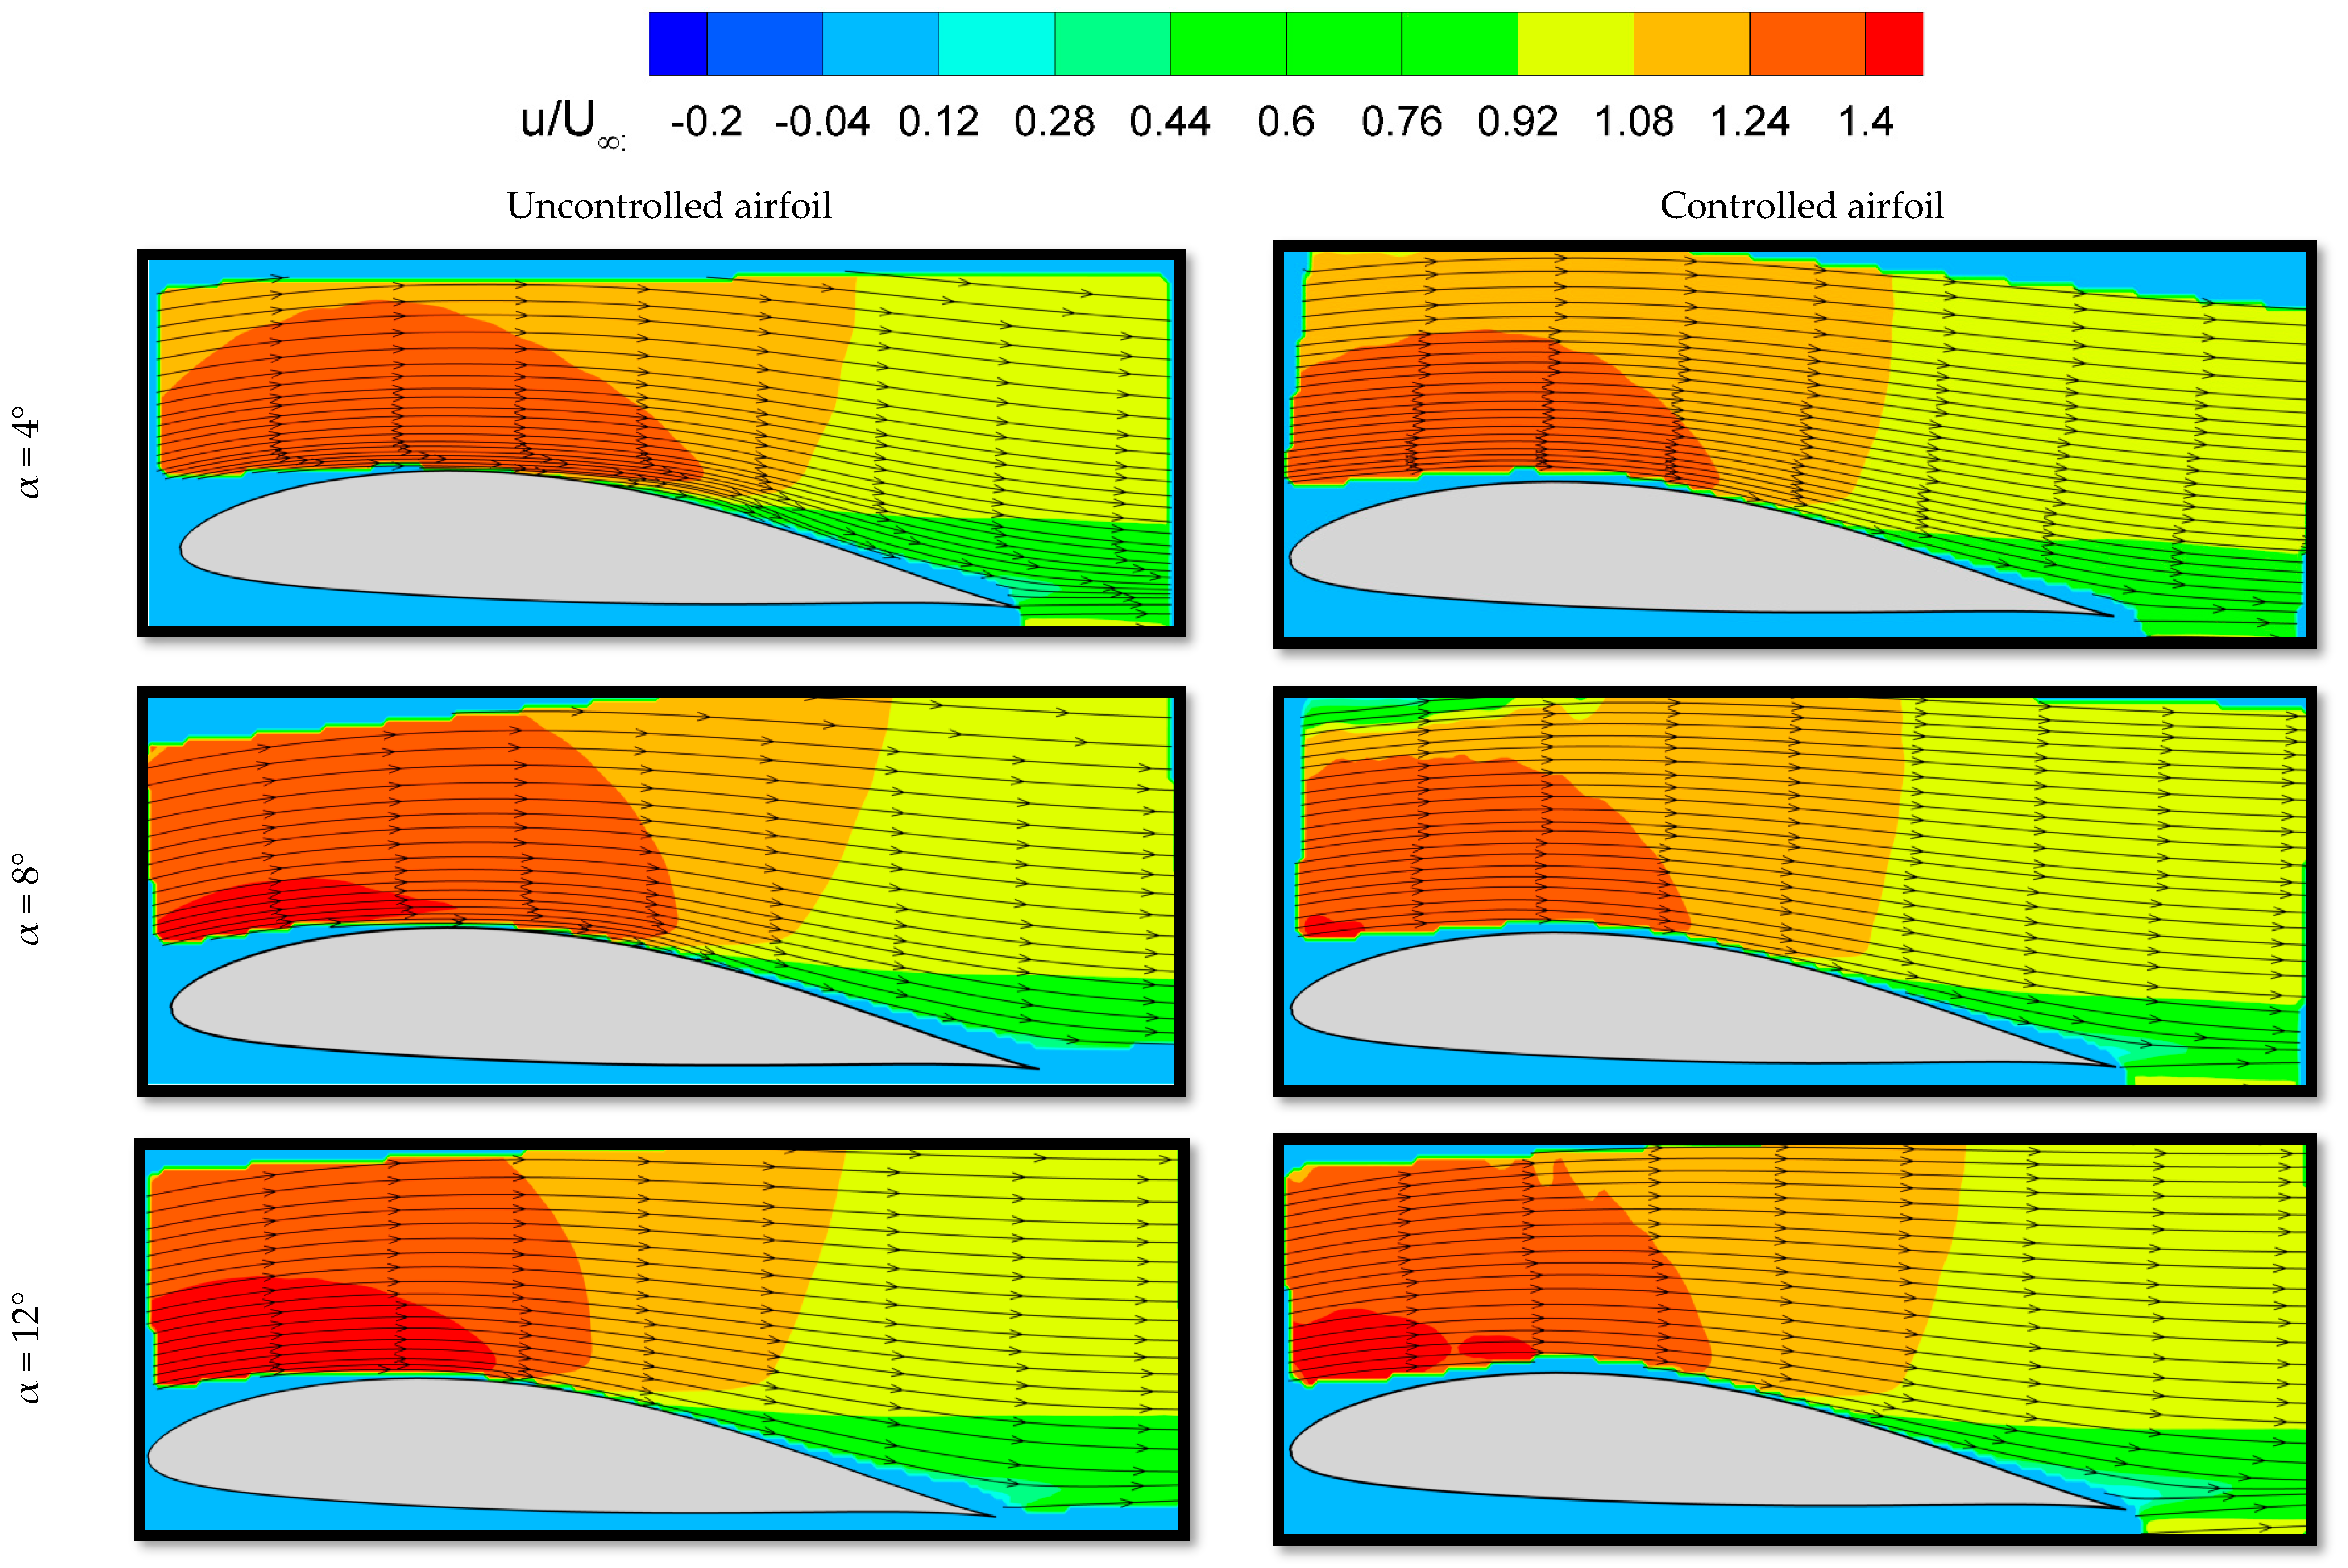
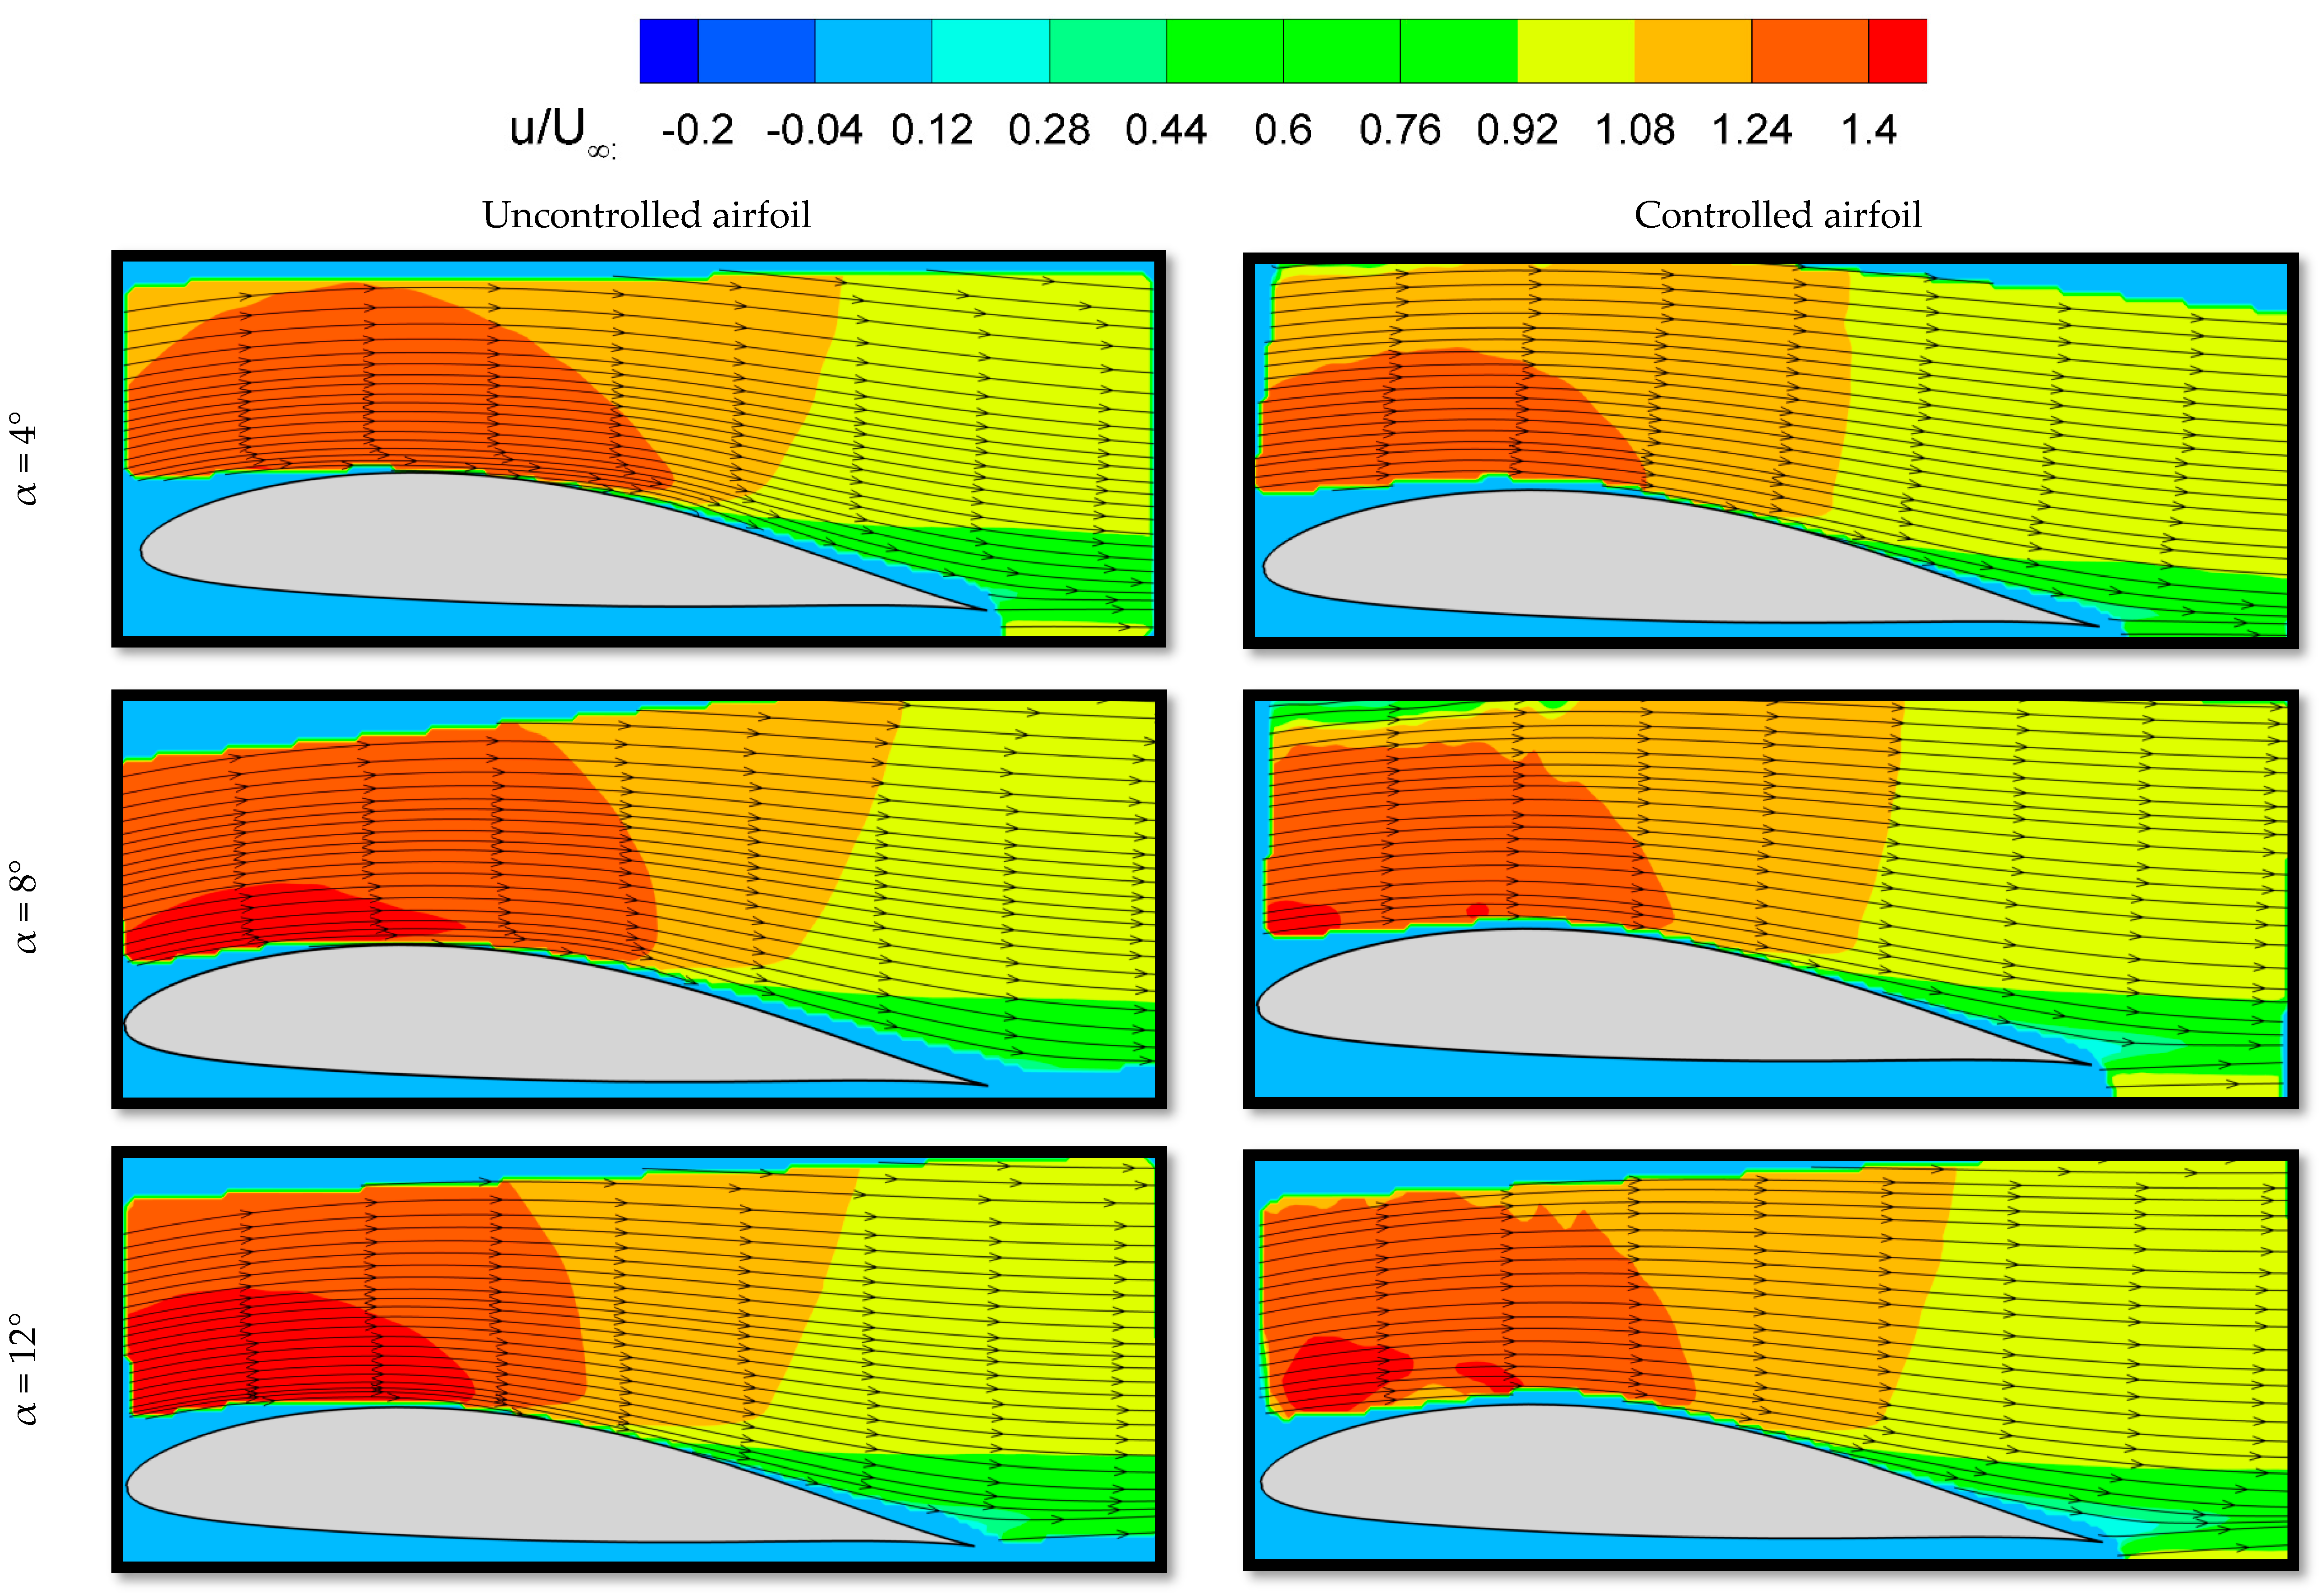
This section will consist of the results obtained from the PIV tests for both uncontrolled and controlled airfoils at Reynolds numbers of 1.05 × 10⁵ and 1.4 × 10⁵ and different angles of attack (4° ≤ α ≤ 12°). Moreover, instantaneous u/U values and instantaneous Reynolds stresses, as well as instantaneous standard deviations of u/U, will be clearly discussed in terms of better understanding how an LSB formed. In Figure 8 and Figure 9, the streamlines revealed that the LSB formed close to the trailing edge of the airfoil at α = 12°. As expected, its size reduced when the Reynolds number increased, resulting in the presence of more dominant inertial forces than viscous forces in the boundary layer. Additionally, the position of the LSB moved towards the leading-edge part of the uncontrolled airfoil when the angle of attack was increased with intervals of 4°. For the controlled cases in the same figures, it was pointed out that utilizing membrane material on the suction surface of the airfoil created passive flow control mechanics. This led to either the size of the LSB shrinking or its disappearance.
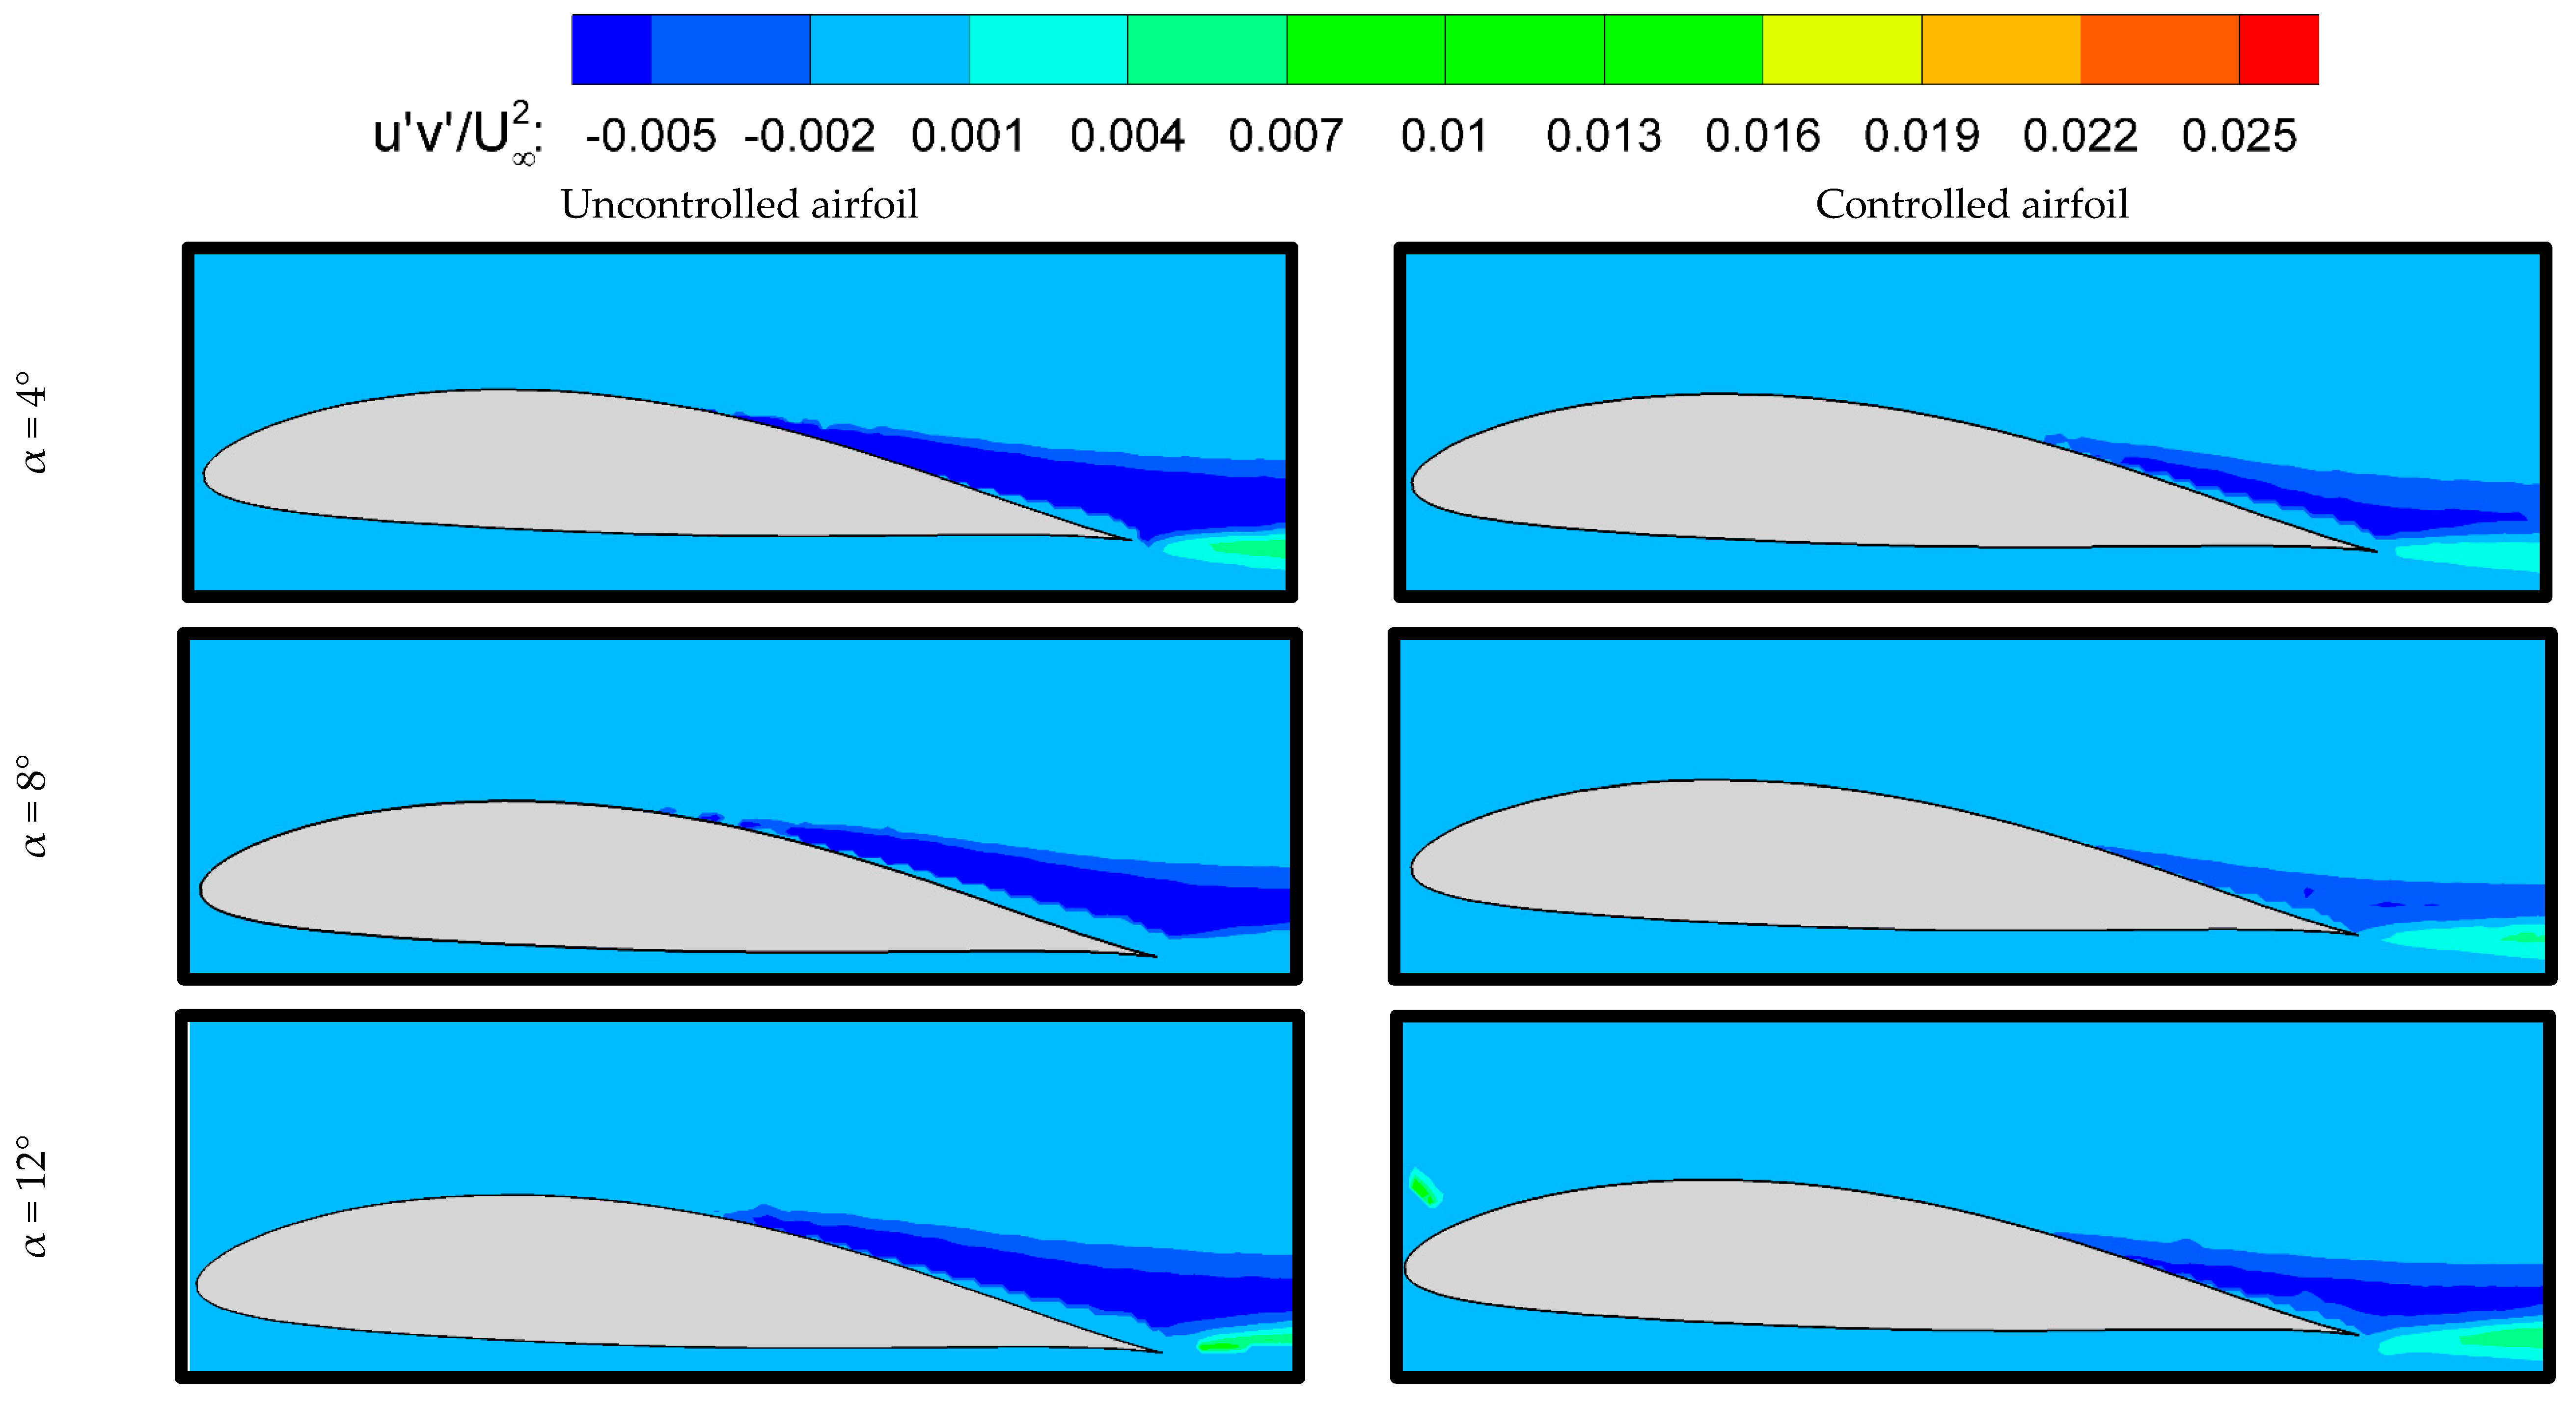
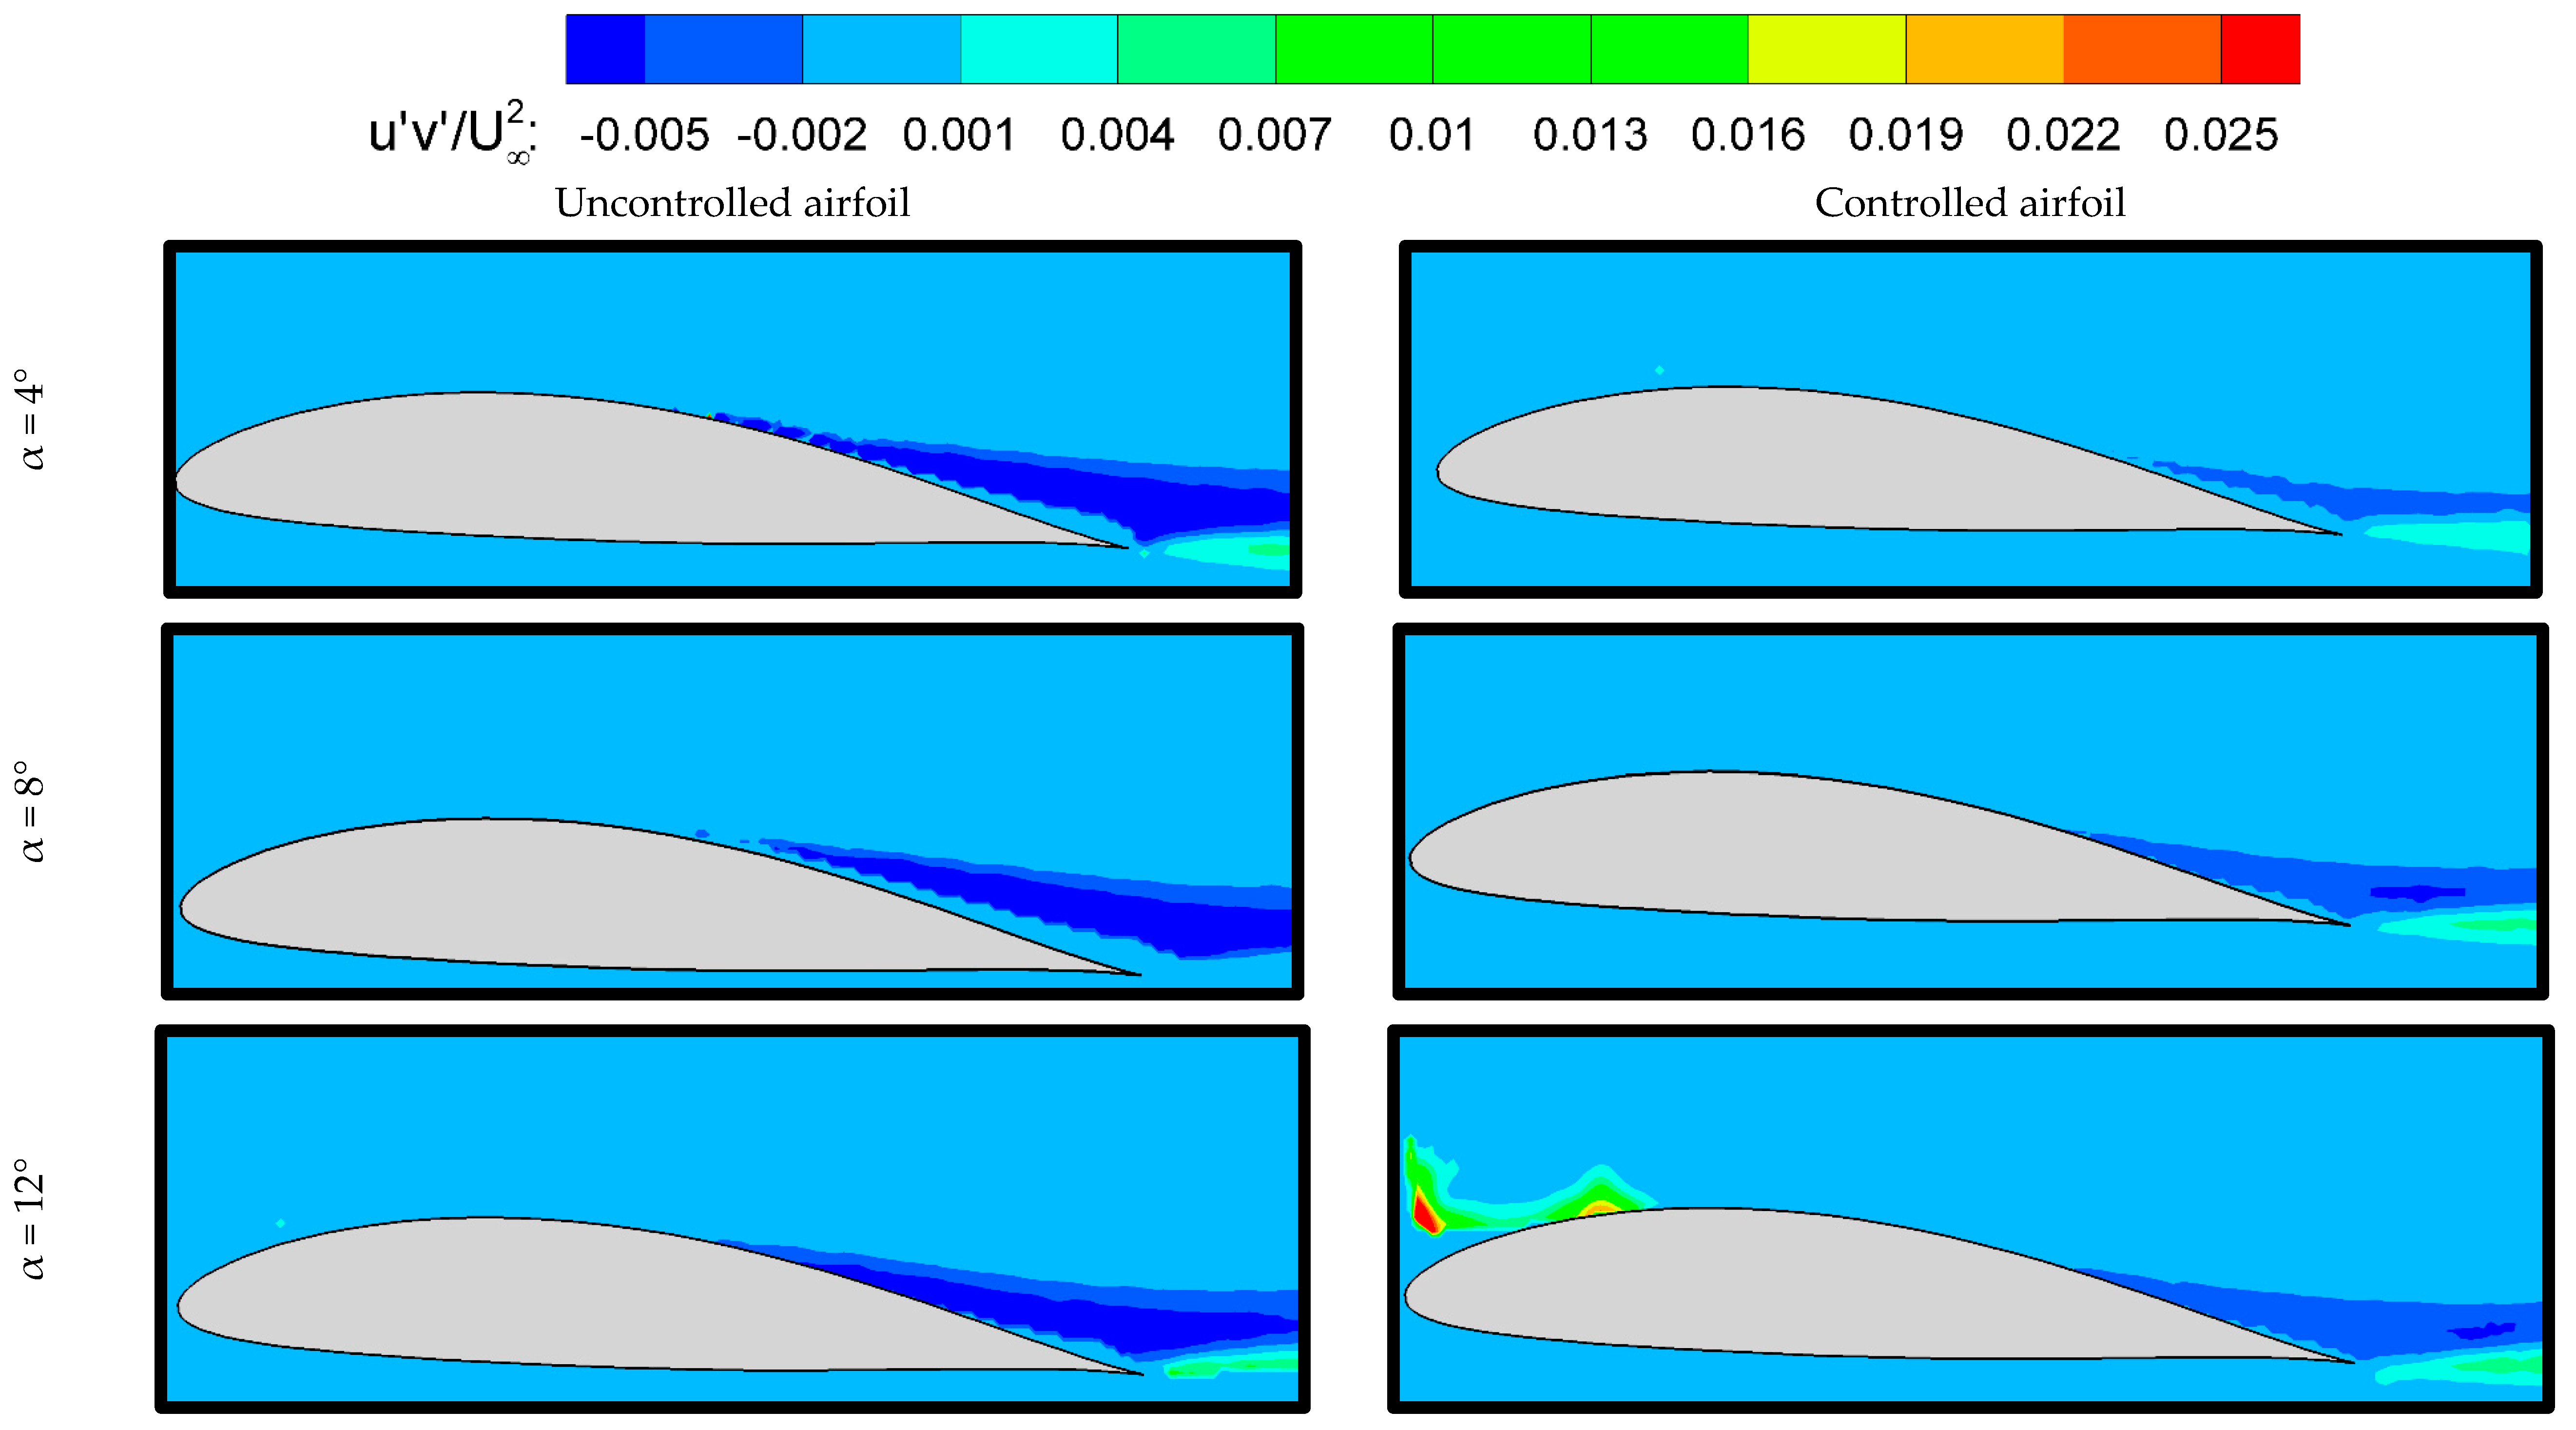
In terms of a better understanding of vortex fluctuations formed on both uncontrolled and controlled airfoils, the contours of Reynolds stresses were obtained by post-processing the PIV results, as illustrated in Figure 10 and Figure 11. At a lower AoA, it was notably seen that vortex-induced fluctuations were higher for the uncontrolled cases. The number of fluctuations gradually reduced when the AoA increased. In what follows, these structures moved towards the trailing edge of the airfoil at a higher AoA. Regarding the results belonging to the controlled cases, it was pointed out that the fluctuations were reduced by employing flexible material, agreeing with the findings of Ref. [51]. As a physical explanation, APGs played dominant roles (dP/dx > 0 or dU/dx < 0) in flow in the boundary layer for the uncontrolled cases, resulting in the presence of either the formation of the LSB or the separated shear layer. These flow structures led to the vortex shedding that moved along chordwise. Therefore, the separated region (determined as a dark blue color) was wider because of the dominant characteristics of vortex shedding in the separated shear layer. However, the dark blue area (fluctuations) reduced when the flexible membrane was mounted, and the onset of fluctuations shifted closer to the leading edge. This was believed to be mainly due to the interaction of the membrane material with the flow. These interactions provided benefits as follows: (i) the formation of the LSB was suppressed, (ii) the transition to turbulence occurred earlier, and (iii) these flow structures moved towards to trailing edge, causing smaller fluctuation regions. In addition to the distribution of flow fluctuations, local flexibility impacts on the flow structures were revealed by the wake width. In other words, the long LSB’s effect on the uncontrolled case’s vortex shedding increased the size of eddy vortices, causing them to flow in a clockwise way towards the wake region. These structures, therefore, caused the wake width to be wider, which increased the drag force (this will also be discussed on the CL-CD graph). However, the long LSB turned into short ones by utilizing a local flexible membrane, since the wake width of the controlled case was narrower compared to the uncontrolled case.
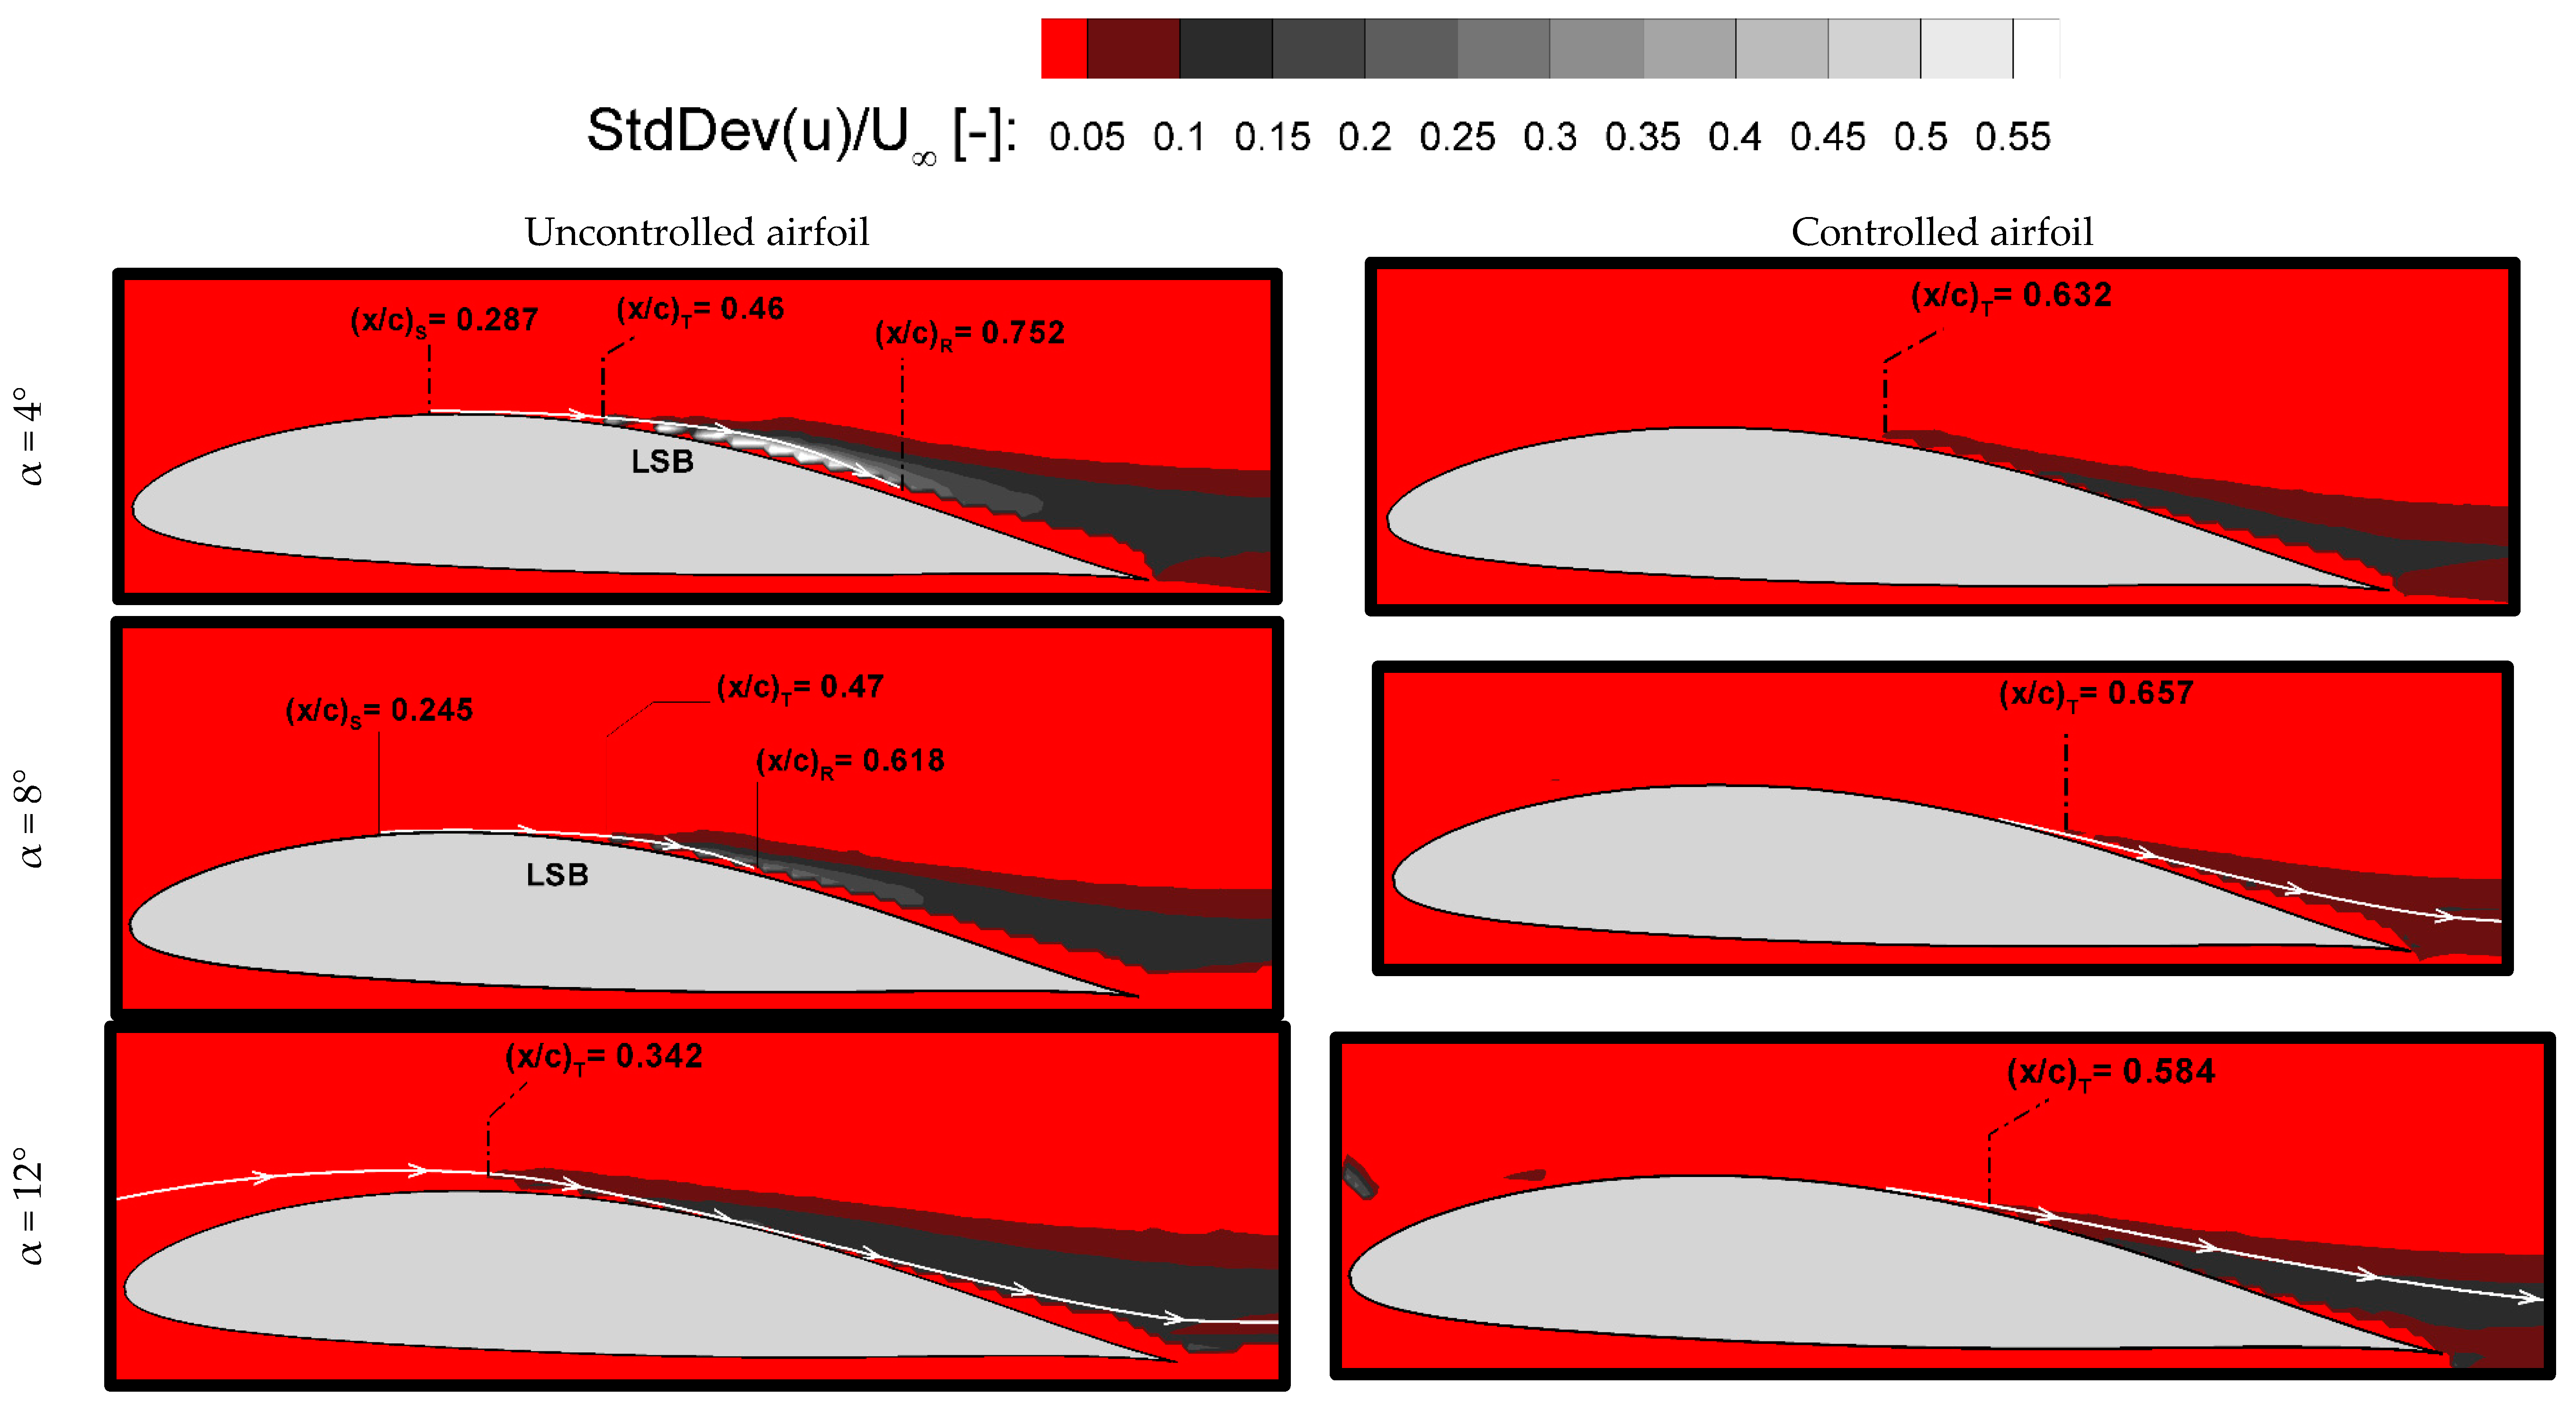
Apart from instantaneous u/U and Reynolds stress values, instantaneous standard deviations of u/U values were provided by PIV post-processing at different AoAs and Reynolds numbers, as seen in Figure 12 and Figure 13. In contrast to the contours of Reynolds stresses, the LSB progress and transition to turbulence phenomenon were presented by combining the streamlines and contour colors. For both Figures, the progress of the LSB was changed by influencing the flow control with flexible material. In particular, using flexibility enabled the suppression of the LSB, resulting in the presence of fewer vortices and vortex-induced LSBs closer to the trailing edge. This led to the formation of a narrower wake region. This also exhibited strong agreement with the findings of the Reynolds stresses’ results. Physically speaking again, the effects of APGs on flow in the boundary layer were enormously altered by utilizing a local flexible membrane, since the separation and reattachment points were replaced on the suction surface. Additionally, it was noticed that the progress of transition to turbulence was another indicator of how the local flexibility affected the flow phenomenon. This is because it was clearly indicated that the onset of transition was altered when a local flexible membrane was employed. Specifically, its trend tends to move towards to trailing-edge part at Re = 1.05 × 10⁵.

3.2. Deformation Results

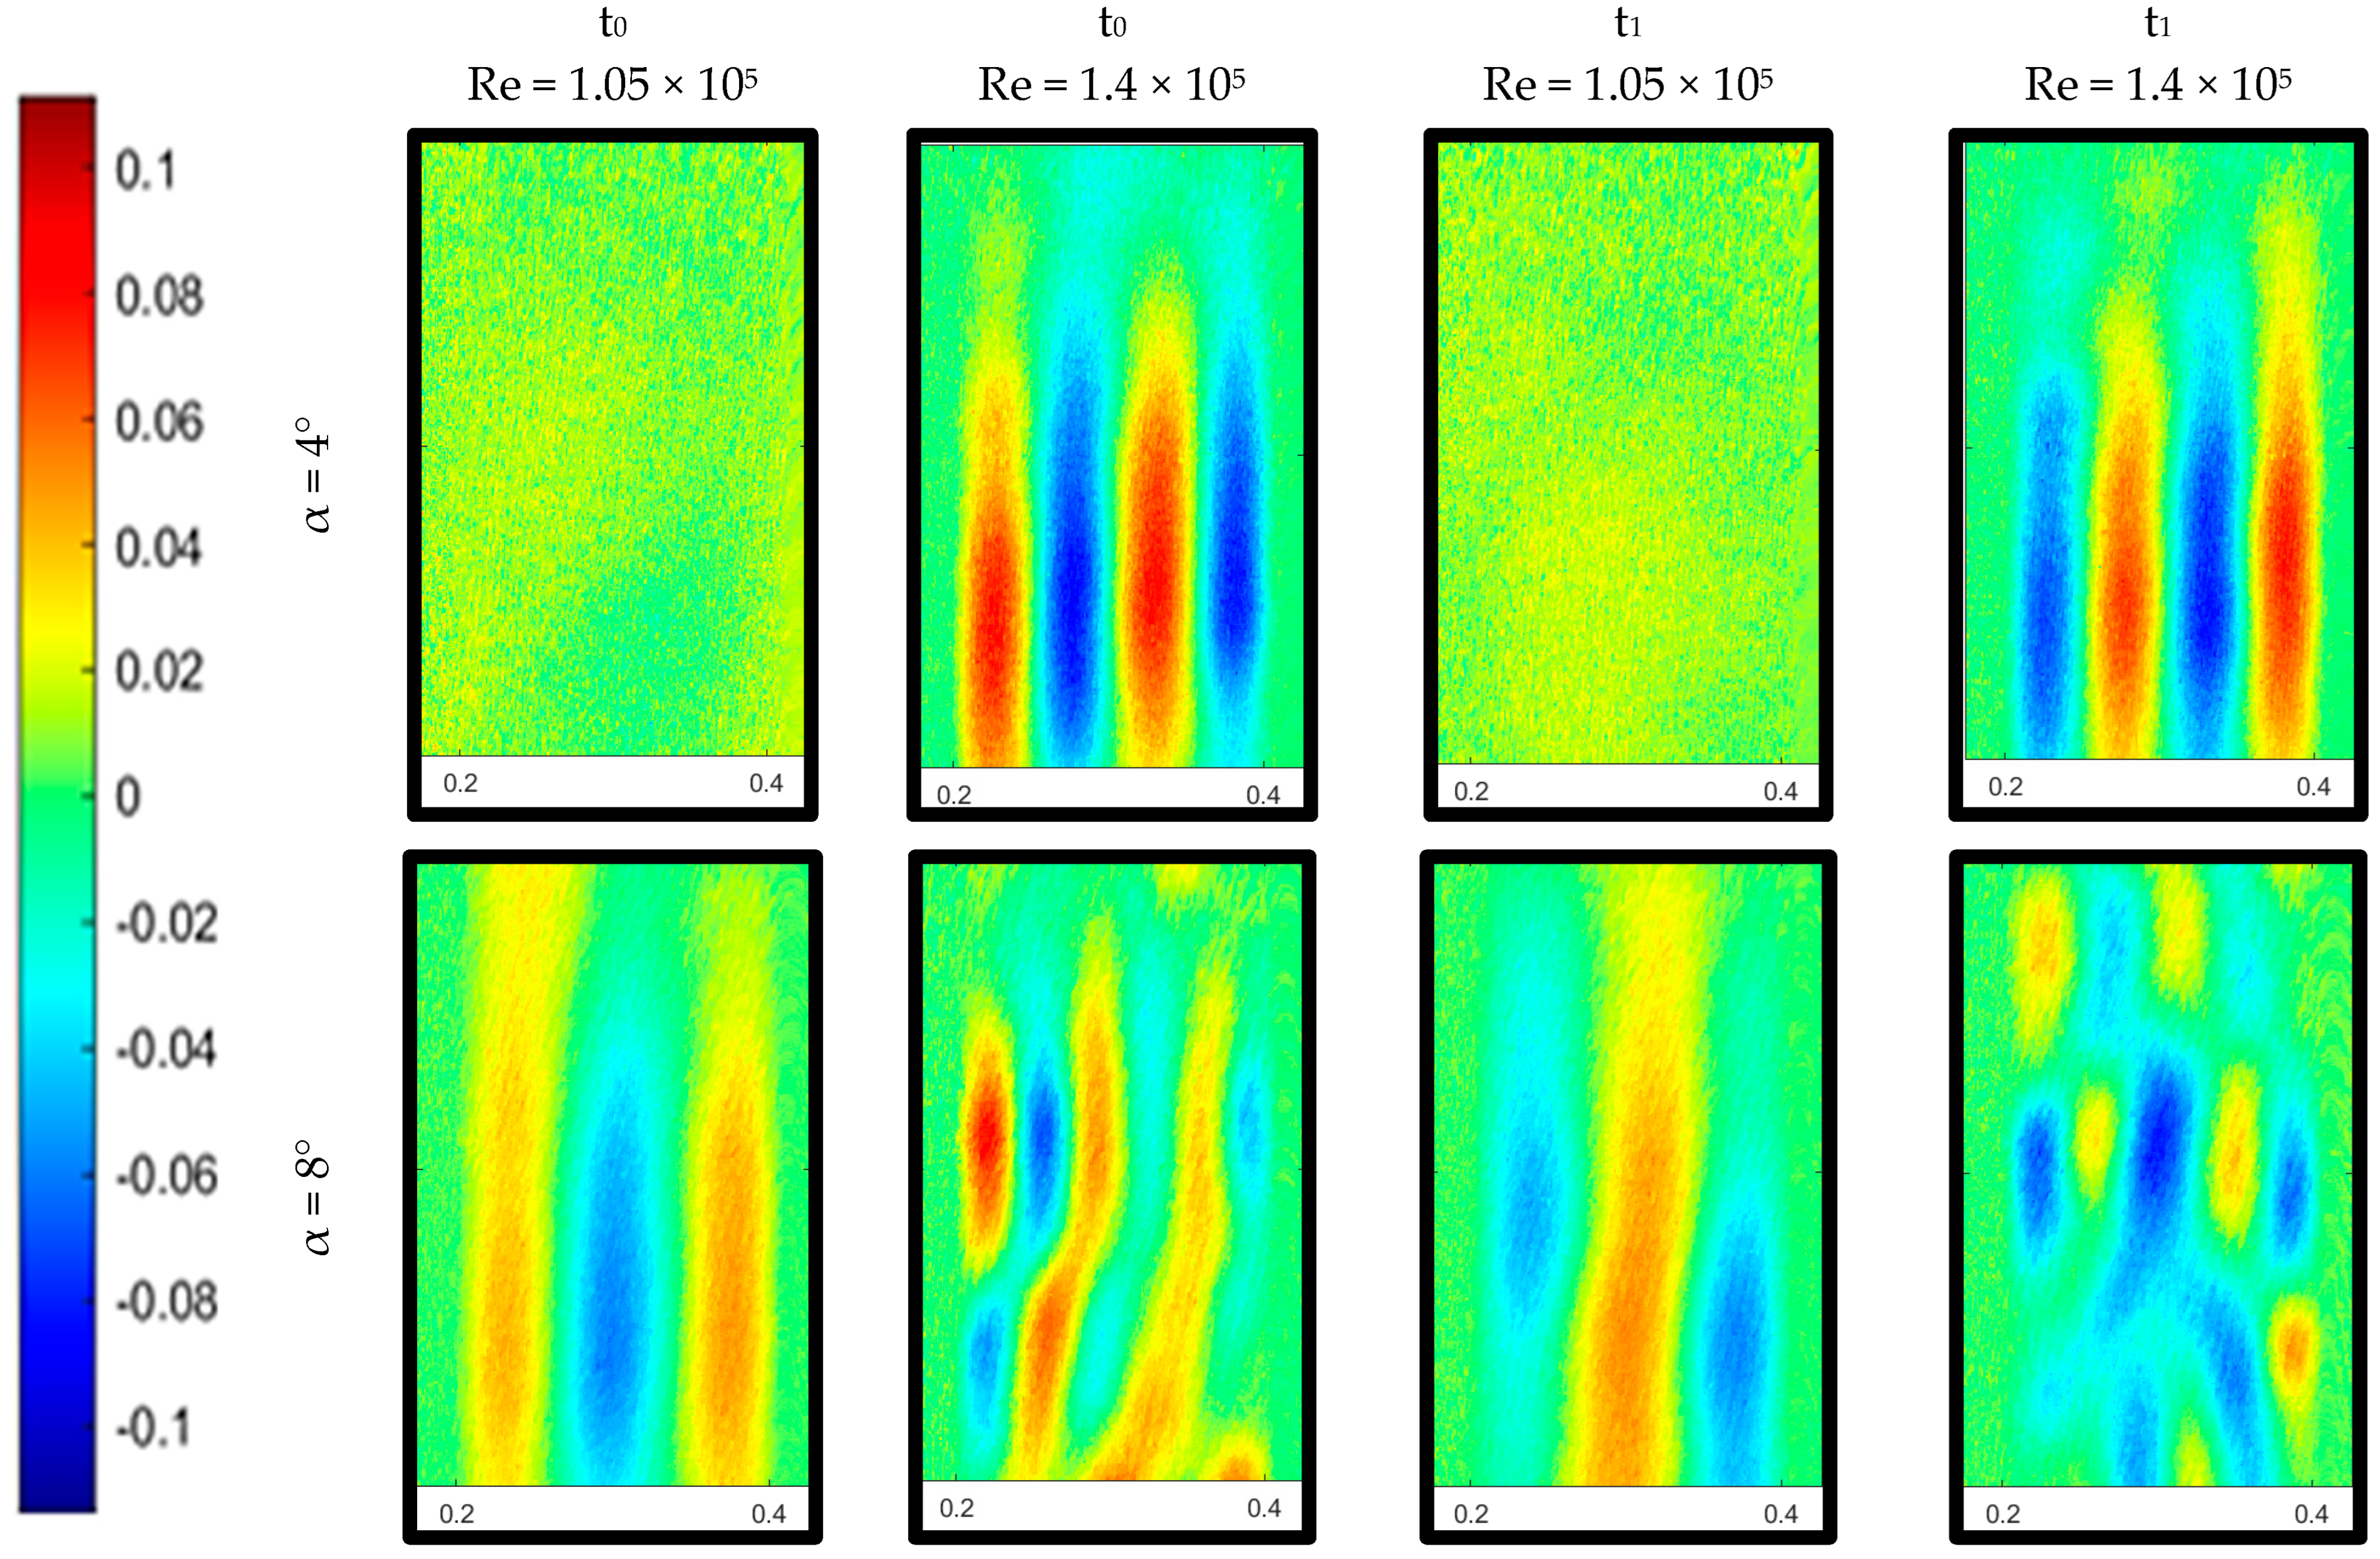
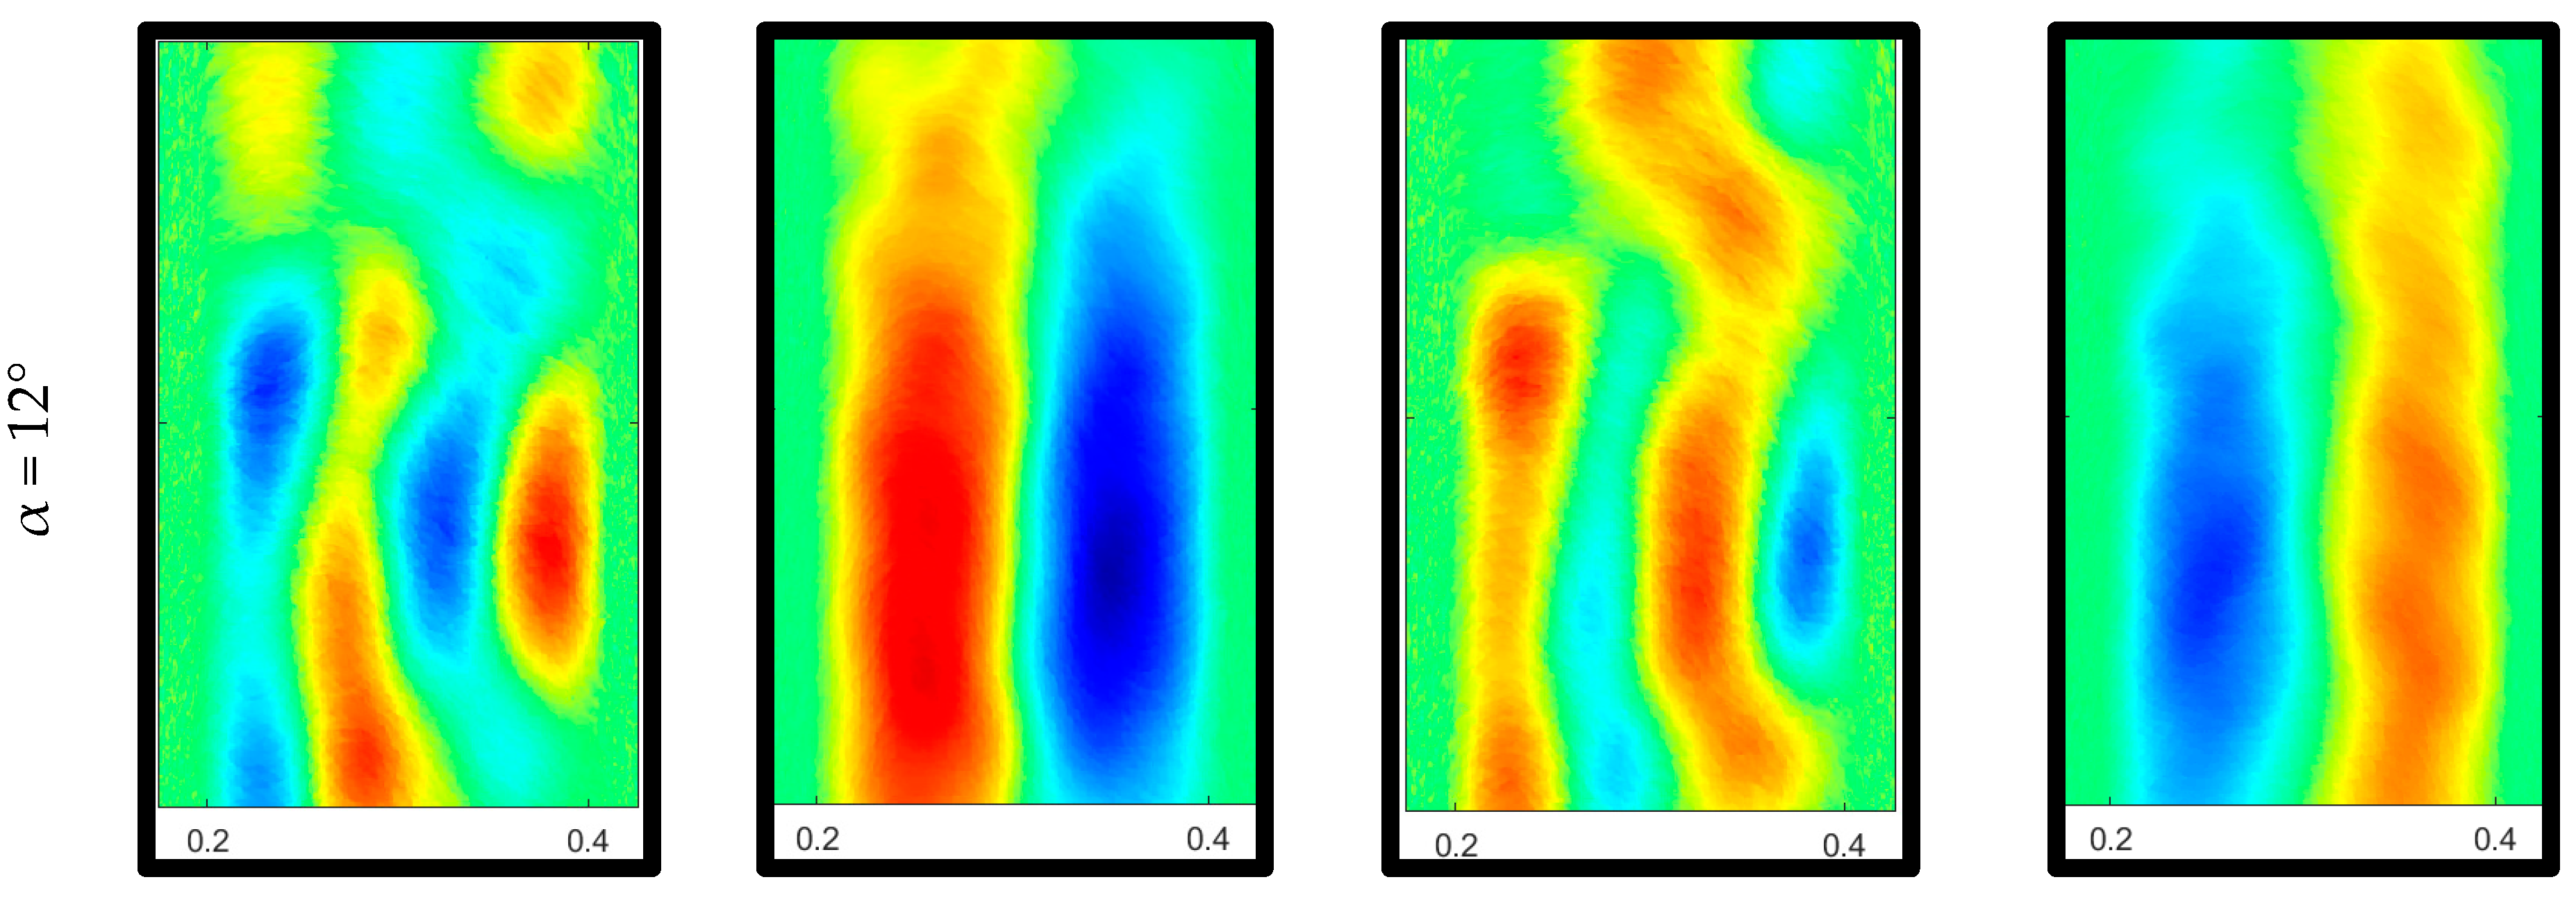
Figure 14 demonstrates the results of local flexible membrane deformation at different Reynolds numbers and time intervals. The same as the one Genç et al. [51] performed in their experimental study, this method was the best way in terms of clearly understanding fluid–structure interactions. By carefully looking at the location of the local membrane, it was mounted either before or right above the formation of the LSB. The small vortices were mainly due to the LSB or boundary layer separation touching the local membrane, causing vibration on the membrane. These vibrations caused various deformation modes to form. The indicator of these different deformation modes clearly showed that mod number at the same Reynolds number increased when the AoA increased gradually. This was associated with the vortices shedding because of LSB formation and boundary layer separation. At a lower AoA, the size of the vortices is comparatively larger, resulting in the presence of two modes. At a moderate AoA (8° ≤ α ≤ 12°), the mode number increased with an increasing AoA at Re = 1.05 × 10⁵. This showed that LSB-induced vortices became smaller than those that occurred at a lower AoA and this caused more modes to form on the flexible membrane. This also showed that the frequency of these smaller vortices was higher than that of larger vortices. At Re = 1.4 × 10⁵, the mode number was more obvious. There were four modes at α = 4°, whereas five modes occurred at α = 8°. The modes’ numbers at Re = 1.4 × 10⁵ were obviously higher than with a lower Reynolds number, since more inertial forces caused smaller vortices to form. Conversely, it was observed that there were two modes at α = 12°. This was most probably observed because the fully separated flow occurred at this angle of attack, resulting in the existence of larger vortices that had smaller frequencies.

3.3. The Results of Aerodynamic Force Measurement

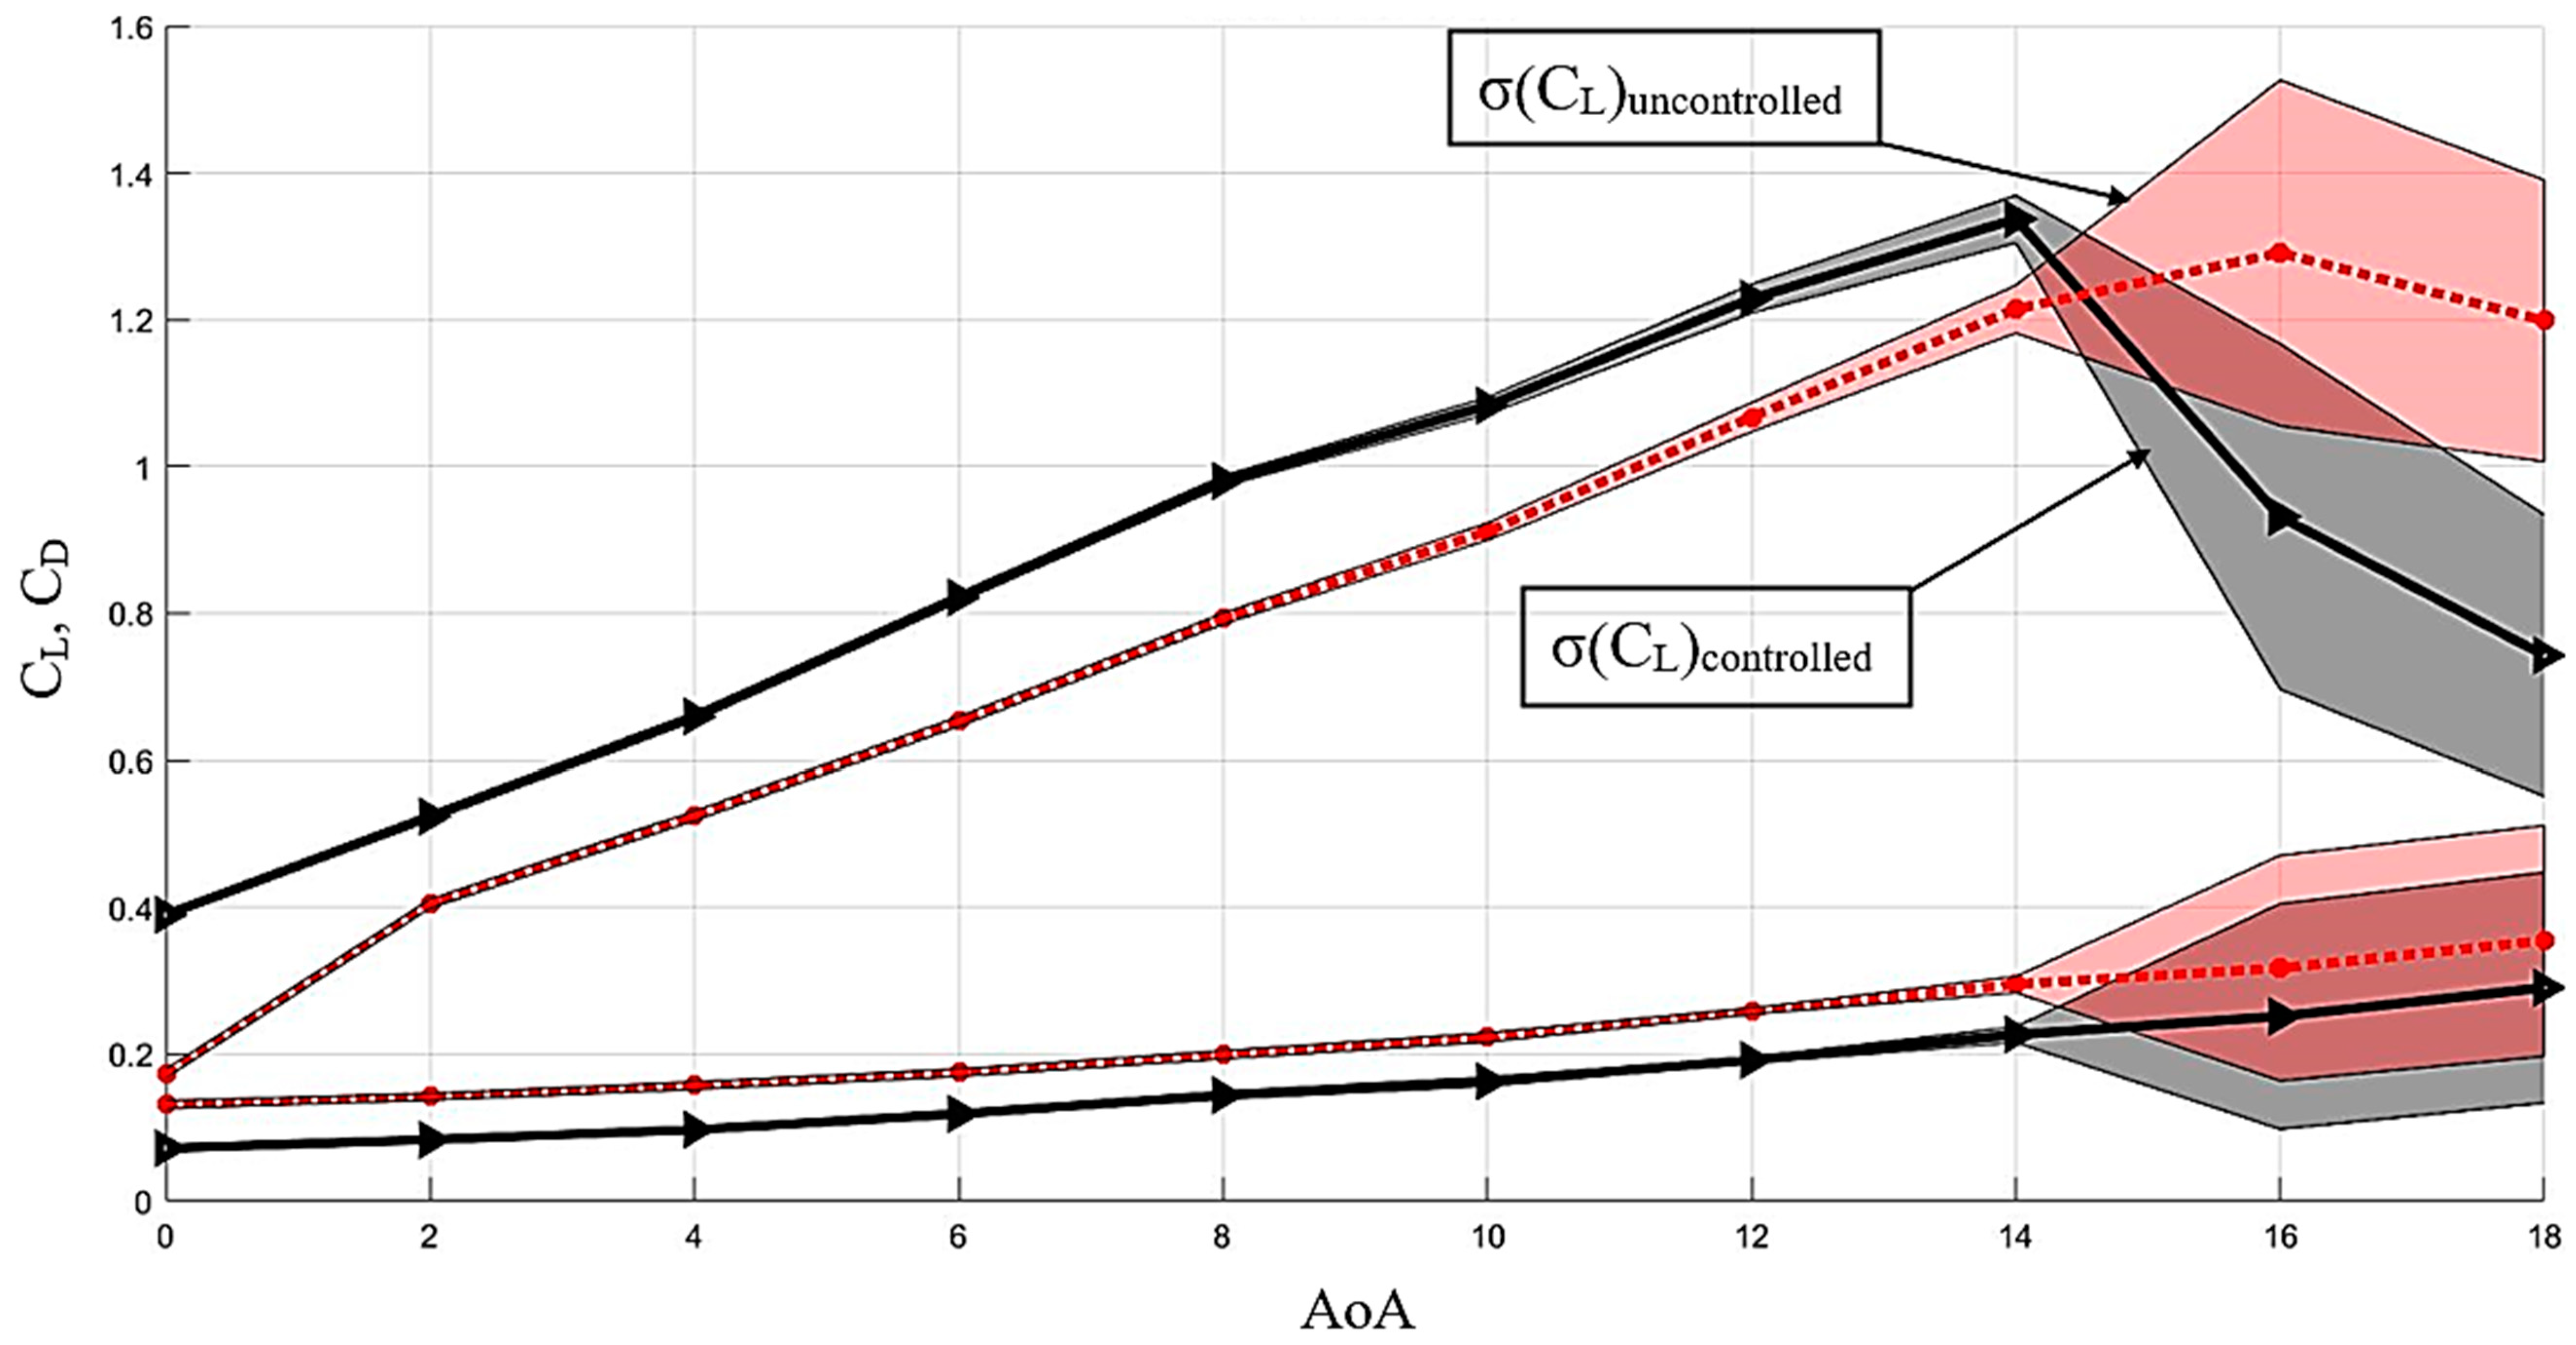
The results of the aerodynamic force coefficients at a Reynolds number of 1.05 × 10⁵ and 1.4 × 10⁵ for the controlled airfoil (grey straight line) and the uncontrolled case (red dotted line) are depicted on the charts in Figure 15 and Figure 16, respectively. Additionally, the charts’ shaded regions suggested that vibration-induced fluctuations were presented. At Re = 1.05 × 10⁵, the maximum lift coefficient (CL,max) was 1.29 at α = 16° implying that the flow could not reattach the suction surface due to APGs, resulting in the stall phenomenon for the uncontrolled case at this angle of attack. For the controlled case, CL,max is nearly 1.35 at α = 14°. Despite an observation of a 2 deg. reduction in stall angle, it was pointed out that CL,max increased by around 4.65%. Moreover, there was a mild stall in the uncontrolled case, whereas a sharp reduction occurred at the lift curve of the controlled case. Further, the red-shaded area belonging to the uncontrolled airfoil was broader than the grey-shaded area for the controlled case. This obviously implied that flow-induced vibration for the uncontrolled airfoil was higher than that which occurred for the controlled case, especially at the post-stall region. At Re = 1.4 × 10⁵, CL,max was 1.37 for the controlled airfoil at α = 14°, whereas it was 1.26 for the controlled cases at α = 16°. As results occurred at Re = 1.05 × 10⁵, there was an improvement in lift coefficient of nearly 8.73%. Furthermore, it was seen that the flow-induced vibration at the lift curve of the controlled airfoil was enormously reduced. For both graphs, utilizing a local flexible membrane both provided a higher lift coefficient and less flow-induced vibration. Additionally, the results of drag coefficients provided important evidence. For both results of drag coefficients in the graphs, the drag coefficient of the controlled case was less than that belonging to the uncontrolled airfoil. These results well matched and corroborated with the results obtained from the PIV contours. This is because the size of the LSB-induced vortices was reduced by means of utilizing a local flexible membrane on the suction surface, resulting in the presence of a narrower wake region and inherently fewer drag forces.
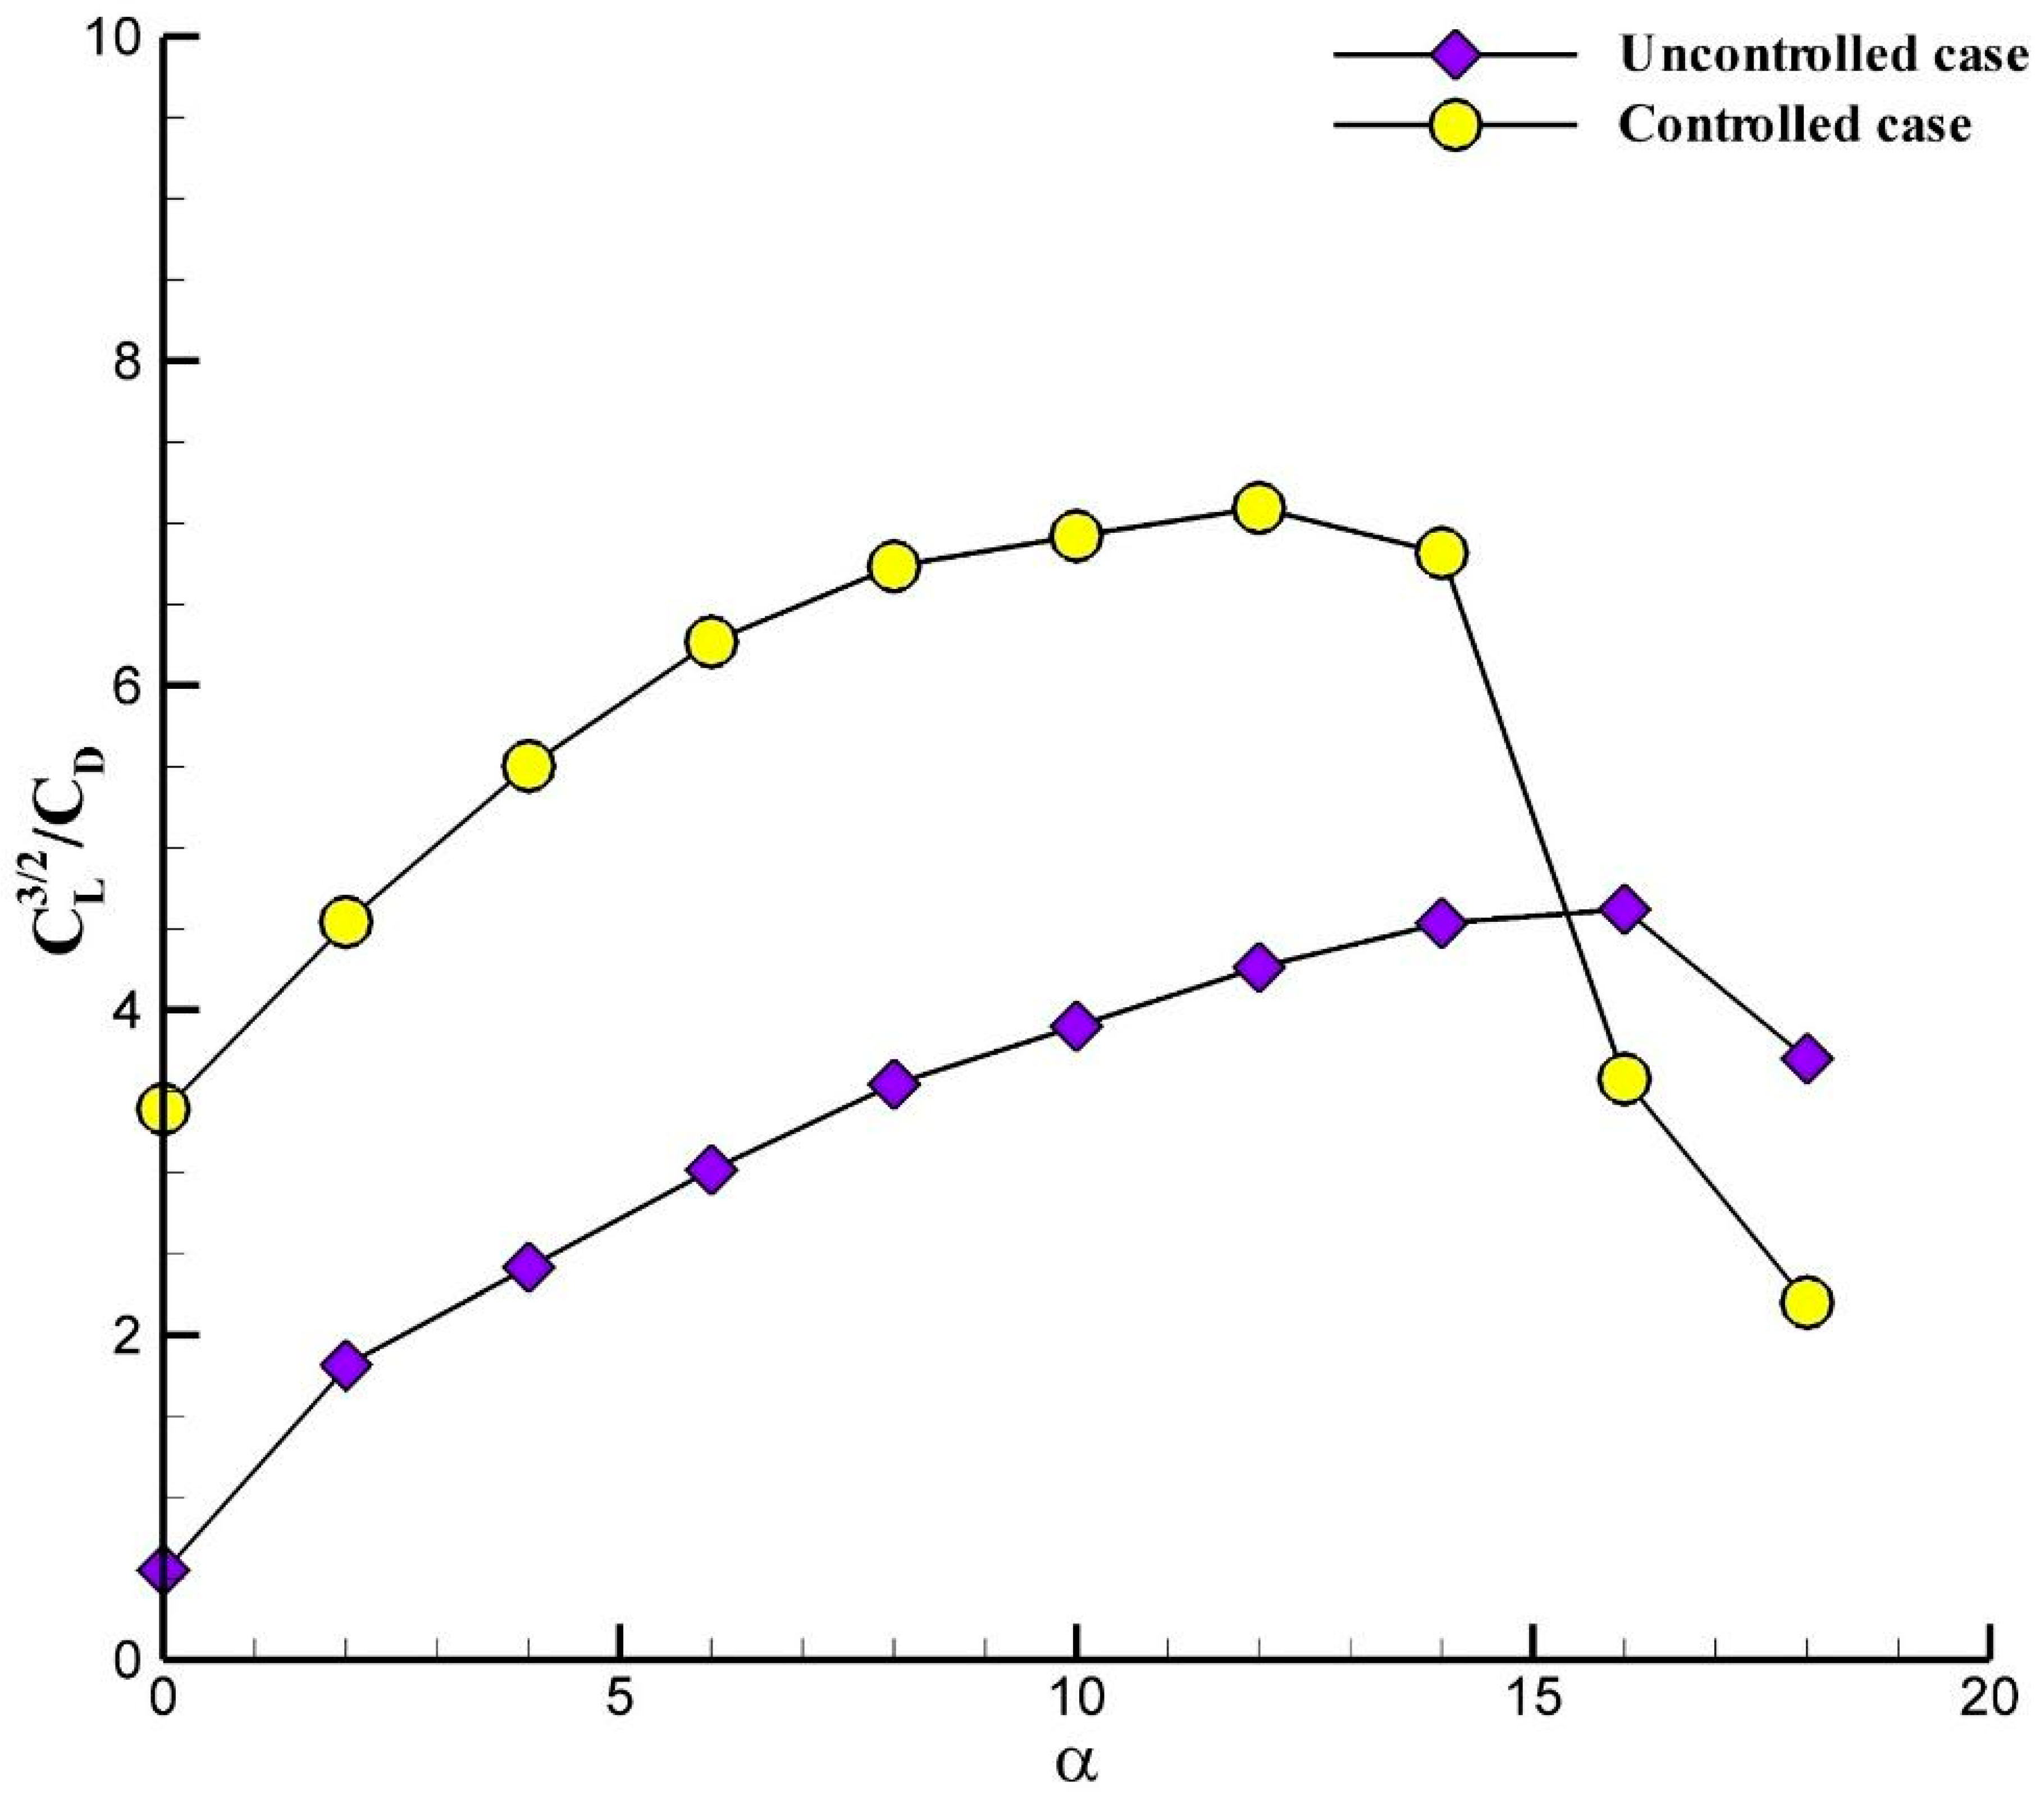
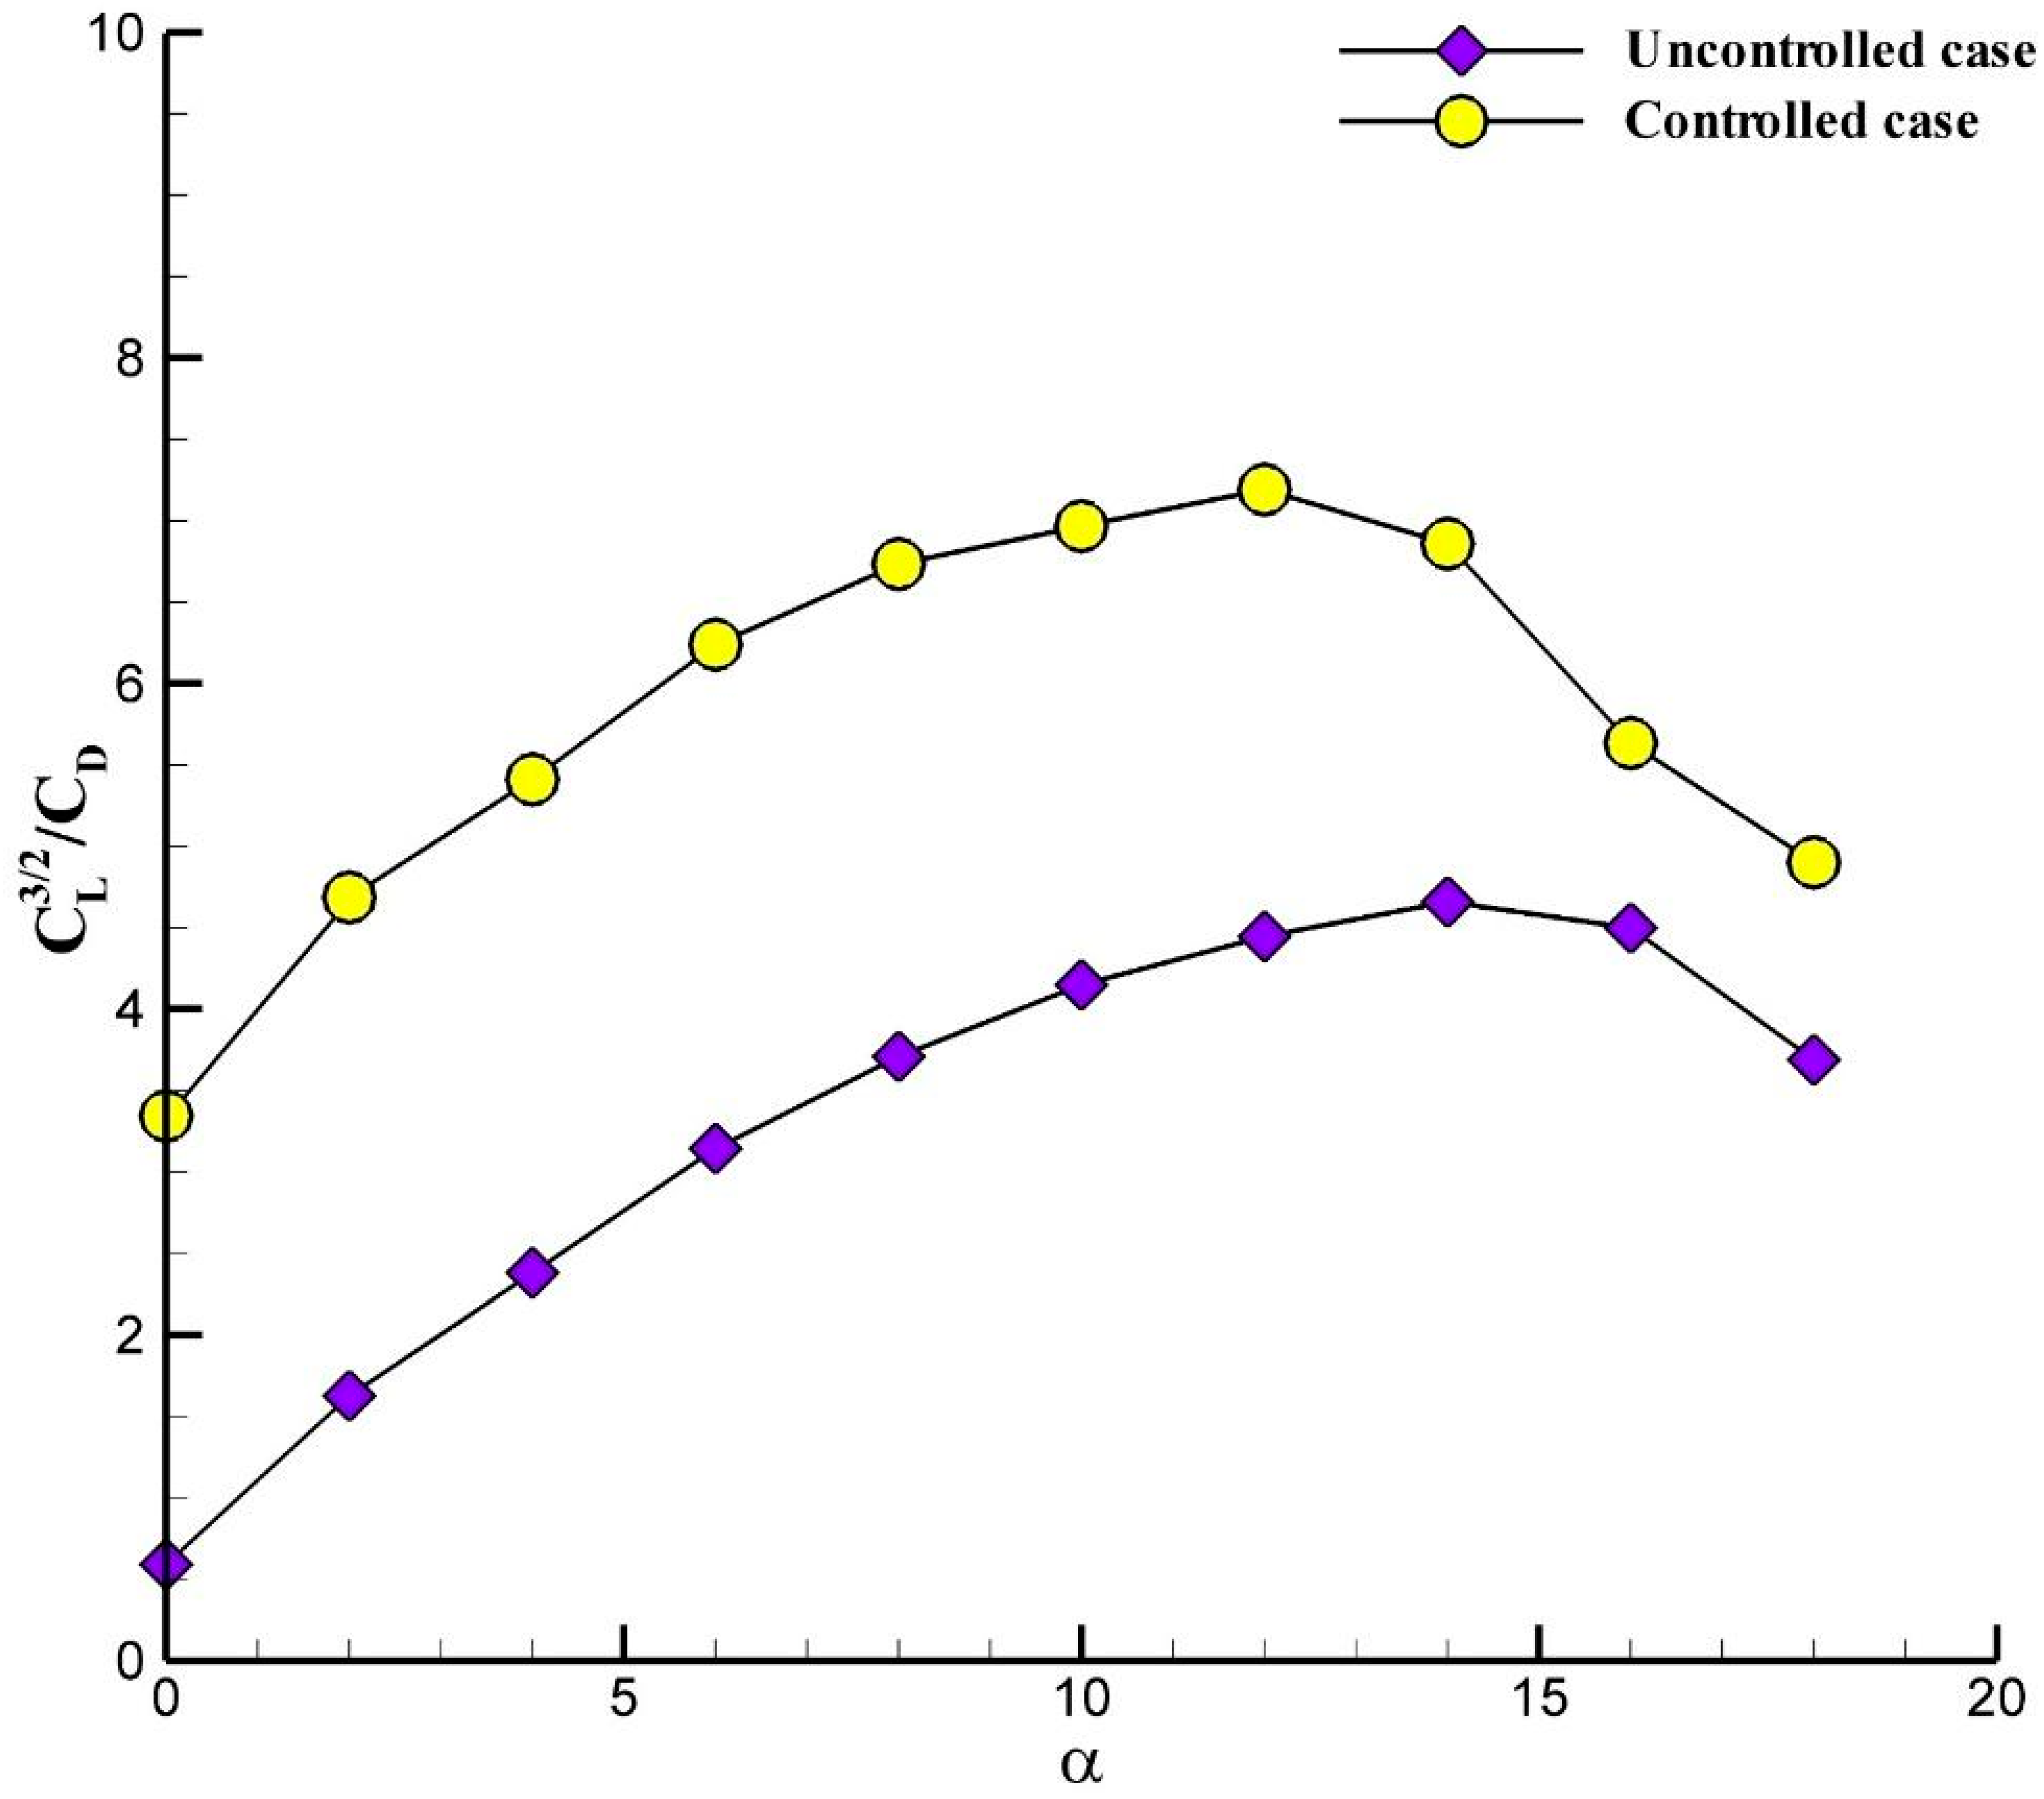
In terms of better understanding how employing a local flexible membrane affects the FX 84-W-150 wind turbine blade aerodynamically, aerodynamic power efficiency graphs were provided at different Reynolds numbers, as denoted in Figure 17 and Figure 18. This allows us to associate the power-raising aerodynamics of wind energy conversion systems with the endurance and flying time of aeronautic objects such as micro-air vehicles [46,47]. For both Reynolds numbers, employing a local flexible membrane as a passive flow control exhibited better aerodynamic performance compared to the uncontrolled airfoil. Specifically, at the pre-stall region, local flexibility ensured good performance, resulting in providing aerodynamic benefits up to approximately two times the power efficiency curve for both Reynolds numbers.

4. Conclusions

Extracting more energy from an energy conversion system is a hot-topic issue for aerodynamic researchers and the renewable energy community nowadays. Employing local flexible materials on a wind turbine blade is a new method in terms of establishing higher aerodynamic performance (inherently more energy output) and reducing weight. Therefore, rigorous experimental measurements are lacking to date in the context of utilizing local flexible material on the surface of an airfoil. In this study, this research gap was tackled so as to figure out how local flexible materials impact the aerodynamic performance of airfoils. Based on fastidious experimental measurements including PIV, deformation, and aerodynamic tests at higher Reynolds numbers than the literature, remarkable conclusions were revealed as follows:
-
The use of the flexible membrane significantly hampered the development of the LSB. Improvement of CL,max was provided at the level of around 4.65% and 8.73% at Re = 1.05 × 10⁵ and Re = 1.4 × 10⁵, respectively. This indicated that aerodynamic performance was remarkably increased, resulting in the presence of more energy output under the same conditions. This can be seen from the aerodynamic power efficiency. While the maximum aerodynamic power efficiency was 4.5 at both Reynolds numbers, this value increased to 7 in the controlled case.
-
Its positive effects were twofold when aerodynamic lift curves were investigated regionally: (i) at the pre-stall region, membrane material ensured a positive role in terms of increasing aerodynamic performance, and (ii) at the post-stall region, aerodynamic flow-induced vibrations were enormously diminished.
-
Not only did the local flexibility affect the formation of the LSB, but also caused the location of the transition phenomenon to alter, providing the occurrence earlier.
-
In addition to aerodynamic lift coefficient improvement, the drag coefficient was enormously reduced, resulting in increased power efficiency.
Consequently, this research study is anticipated to be very informative for wind turbine designers, aerodynamic researchers, and the renewable energy community. This will result in more effective, inventive, and performance-improving airfoils in terms of the advances in energy efficiency in an energy conversion system.

Author Contributions

Conceptualization, K.K. and M.S.G.; Methodology, K.K. and M.S.G.; Validation, K.K.; Formal analysis, K.K.; Investigation, K.K.; Resources, K.K. and M.S.G.; Data curation, K.K.; Writing—original draft, K.K.; Writing—review & editing, M.S.G.; Visualization, K.K. and M.S.G.; Supervision, M.S.G.; Project administration, K.K. and M.S.G.; Funding acquisition, K.K. and M.S.G. All authors have read and agreed to the published version of the manuscript.

Funding

The authors thank the Scientific Research Projects Unit of Erciyes University under the contract number FDK-2019-8726 for funding; and also thank the Scientific and Technological Research Council of Turkey (TÜBİTAK) for providing scholarships of the 2211-C (Doctoral Scholarship for Priority Areas Program) and the 2214-A (International Research Fellowship Program) for Kemal Koca.

Data Availability Statement

Data is contained within the article.

Acknowledgments

The authors thank Christian J. Kahler and his team for providing laboratory facilities and assistance with instrument use within the scope of the 2214-A program.

Conflicts of Interest

Author Mustafa Serdar Genç was also employed by the company MSG Teknoloji Ltd. Şti. The remaining author declares that the research was conducted in the absence of any commercial or financial relationships that could be construed as a potential conflict of interest.

Nomenclature

Abbreviation
LSBLaminar Separation Bubble
MAVsMicro aerial vehicles
UAVsUnmanned aerial vehicles
APGAdverse pressure gradient
CFDComputational fluid dynamics
UDFUser-defined function
AoAAngle of attack
LESLarge eddy simulation
PIVParticle image velocimetry
LFMLocal flexible membrane
PEPower efficiency
TKETurbulence kinetic energy
AWMAtmospheric wind tunnel
Subscripts
LLift
DDrag
maxMaximum
L, maxMaximum lift
Symbols
ReReynolds number
cChord length
sSpan length
μDynamic viscosity
RUniversal gas constant
FLLift force
FDDrag force
CLLift coefficient
CDDrag coefficient
αAngle of attack
EYoung’s modulus
CL,maxMaximum lift coefficient
ρAir density
ρmFlexible membrane density
UVelocity of potential flow
σStandard deviation
TuTurbulence level
uıVelocity component at direction-x
vıVelocity component at direction-y

References

  1. Su, R.; Gao, Z.; Chen, Y.; Zhang, C.; Wang, J. Large-eddy simulation of the influence of hairpin vortex on pressure coefficient of an operating horizontal axis wind turbine. Energy Convers. Manag. 2022, 267, 115864. [Google Scholar] [CrossRef]
  2. Karasu, İ.; Sahin, B.; Tasci, M.O.; Akilli, H. Effect of yaw angles on aerodynamics of a slender delta wing. J. Aerosp. Eng. 2019, 32, 04019074. [Google Scholar] [CrossRef]
  3. Miao, W.; Liu, Q.; Xu, Z.; Yue, M.; Li, C.; Zhang, W. A comprehensive analysis of blade tip for vertical axis wind turbine: Aerodynamics and the tip loss effect. Energy Convers. Manag. 2022, 253, 115140. [Google Scholar] [CrossRef]
  4. Liu, Q.; Miao, W.; Bashir, M.; Xu, Z.; Yu, N.; Luo, S.; Li, C. Aerodynamic and aeroacoustic performance assessment of a vertical axis wind turbine by synergistic effect of blowing and suction. Energy Convers. Manag. 2022, 271, 116289. [Google Scholar] [CrossRef]
  5. Karasu İ Genç, M.S.; Açıkel, H.; Akpolat, M.T. An experimental study on laminar separation bubble and transition over an aerofoil at low Reynolds number. In Proceedings of the 30th AIAA Applied Aerodynamics Conference, AIAA-2012-3030, New Orleans, LA, USA, 25–28 June 2012. [Google Scholar]
  6. Durhasan, T.; Karasu, İ. Dye visualization over double delta wing with various kink angles. J. Vis. 2019, 22, 669–681. [Google Scholar] [CrossRef]
  7. Demir, H.; Genç, M.S. An experimental investigation of laminar separation bubble formation on flexible membrane wing. Eur. J. Mech. -B/Fluids 2017, 65, 326–338. [Google Scholar] [CrossRef]
  8. Koca, K.; Genç, M.S.; Özkan, R. Mapping of laminar separation bubble and bubble-induced vibrations over a turbine blade at low Reynolds numbers. Ocean Eng. 2021, 239, 109867. [Google Scholar] [CrossRef]
  9. Karasu, İ. Flow control over a diamond-shaped cylinder using slits. Exp. Therm. Fluid Sci. 2020, 112, 109992. [Google Scholar] [CrossRef]
  10. Collis, S.S.; Joslin, R.D.; Seifert, A.; Theofilis, V. Issues in active flow control: Theory, control, simulation, and experiment. Prog. Aerosp. Sci. 2004, 40, 237–289. [Google Scholar] [CrossRef]
  11. Ghosh, S.; Choi, J.I.; Edwards, J.R. Numerical simulations of effects of micro vortex generators using immersed-boundary methods. AIAA J. 2010, 48, 92–103. [Google Scholar] [CrossRef]
  12. Igarashi, T.; Terachi, N. Drag reduction of flat plate normal to airstream by flow control using a rod. J. Wind. Eng. Ind. Aerodyn. 2002, 90, 359–376. [Google Scholar] [CrossRef]
  13. Attie, C.; ElCheikh, A.; Nader, J.; Elkhoury, M. Performance enhancement of a vertical axis wind turbine using a slotted deflective flap at the trailing edge. Energy Convers. Manag. 2022, 273, 116388. [Google Scholar] [CrossRef]
  14. Genç, M.S.; Kaynak, Ü. Control of flow separation and transition point over an aerofoil at low Re number using simultaneous blowing and suction. In Proceedings of the 19th AIAA Computational Fluid Dynamics, AIAA-3672, San Antonio, TX, USA, 22–25 June 2009. [Google Scholar]
  15. Genç, M.S. Control of Low Reynolds Number Flow over Aerofoils and Investigation of Aerodynamic Performance. Ph.D. Thesis, Graduate School of Natural and Applied Sciences, Erciyes University, Kayseri, Turkey, 2009. [Google Scholar]
  16. Chakroun, W.; Al-Mesri, I.; Al-Fahad, S. Effect of Surface Roughness on the Aerodynamic Characteristics of a Symmetrical Airfoil. Wind Eng. 2004, 28, 547–564. [Google Scholar] [CrossRef]
  17. Miao, X.; Zhang, Q.; Wang, L.; Jiang, H.; Qi, H. Application of riblets on turbine blade endwall secondary flow control. J. Propuls. Power 2015, 31, 1578–1585. [Google Scholar] [CrossRef]
  18. Özden, K.S.; Karasu, İ.; Genç, M.S. Experimental investigation of the ground effect on a wing without/with trailing edge flap. Fluid Dyn. Res. 2020, 52, 045504. [Google Scholar] [CrossRef]
  19. Genç, M.S.; Ozisik, G.; Kahraman, N. Investigation of aerodynamics performance of NACA00-12 aerofoil with plain. ISI BILIM TEK DERG-J. Therm. Sci. Technol. 2008, 28, 1–8. [Google Scholar]
  20. Sedighi, H.; Akbarzadeh, P.; Salavatipour, A. Aerodynamic performance enhancement of horizontal axis wind turbines by dimples on blades: Numerical investigation. Energy 2020, 195, 117056. [Google Scholar] [CrossRef]
  21. Seo, S.H.; Hong, C.H. Performance improvement of airfoils for wind blade with the groove. Int. J. Green Energy 2016, 13, 34–39. [Google Scholar] [CrossRef]
  22. Hansen, K.L.; Kelso, R.M.; Dally, B.B. Performance variations of leading-edge tubercles for distinct airfoil profiles. AIAA J. 2011, 49, 185–194. [Google Scholar] [CrossRef]
  23. Ni, Z.; Su, T.C.; Dhanak, M. An empirically-based model for the lift coefficients of twisted airfoils with leading-edge tubercles. AIP Adv. 2018, 8, 045123. [Google Scholar] [CrossRef]
  24. Johari, H.; Henoch, C.; Custodio, D.; Levshin, A. Effects of leading-edge protuberances on airfoil performance. AIAA J. 2007, 45, 2634–2642. [Google Scholar] [CrossRef]
  25. Malipeddi, A.K.; Mahmoudnejad, N.; Hoffmann, K.A. Numerical analysis of effects of leading-edge protuberances on aircraft wing performance. J. Aircr. 2012, 49, 1336–1344. [Google Scholar] [CrossRef]
  26. Wang, Z.; Wang, Y.; Zhuang, M. Improvement of the aerodynamic performance of vertical axis wind turbines with leading-edge serrations and helical blades using CFD and Taguchi method. Energy Convers. Manag. 2018, 177, 107–121. [Google Scholar] [CrossRef]
  27. Cai, C.; Zuo, Z.; Morimoto, M.; Maeda, T.; Kamada, Y.; Liu, S. Two-step stall characteristic of an airfoil with a single leading-edge protuberance. AIAA J. 2018, 56, 64–77. [Google Scholar] [CrossRef]
  28. Corsini, A.; Delibra, G.; Sheard, A.G. On the role of leading-edge bumps in the control of stall onset in axial fan blades. J. Fluids Eng. 2013, 135, 081104. [Google Scholar] [CrossRef]
  29. Rostamzadeh, N.; Kelso, R.M.; Dally, B.B.; Hansen, K.L. The effect of undulating leading-edge modifications on NACA 0021 airfoil characteristics. Phys. Fluids 2013, 25, 117101. [Google Scholar] [CrossRef]
  30. Skillen, A.; Revell, A.; Pinelli, A.; Piomelli, U.; Favier, J. Flow over a wing with leading-edge undulations. AIAA J. 2015, 53, 464–472. [Google Scholar] [CrossRef]
  31. Özden, M.; Genç, M.S.; Koca, K. Investigation of the effect of hidden vortex generator-flap integrated mechanism revealed in low velocities on wind turbine blade flow. Energy Convers. Manag. 2023, 287, 117107. [Google Scholar] [CrossRef]
  32. Zhao, P.; Jiang, Y.; Liu, S.; Stoesser, T.; Zou, L.; Wang, K. Investigation of fundamental mechanism leading to the performance improvement of vertical axis wind turbines by deflector. Energy Convers. Manag. 2021, 247, 114680. [Google Scholar] [CrossRef]
  33. Jiang, Y.; Zhao, P.; Stoesser, T.; Wang, K.; Zou, L. Experimental and numerical investigation of twin vertical axis wind turbines with a deflector. Energy Convers. Manag. 2020, 209, 112588. [Google Scholar] [CrossRef]
  34. Heragy, M.; Kono, T.; Kiwata, T. Investigating the effects of wind concentrator on power performance improvement of crossflow wind turbine. Energy Convers. Manag. 2022, 255, 115326. [Google Scholar] [CrossRef]
  35. Hosseini, A.; Goudarzi, N. Design and CFD study of a hybrid vertical-axis wind turbine by employing a combined Bach-type and H-Darrieus rotor systems. Energy Convers. Manag. 2019, 189, 49–59. [Google Scholar] [CrossRef]
  36. Saleem, A.; Kim, M.H. Effect of rotor tip clearance on the aerodynamic performance of an aerofoil-based ducted wind turbine. Energy Convers. Manag. 2019, 201, 112186. [Google Scholar] [CrossRef]
  37. MacPhee, D.W.; Beyene, A. Performance analysis of a small wind turbine equipped with flexible blades. Renew. Energy 2019, 132, 497–508. [Google Scholar] [CrossRef]
  38. Genç, M.S. Unsteady aerodynamics and flow-induced vibrations of a low aspect ratio rectangular membrane wing with excess length. Exp. Therm. Fluid Sci. 2013, 44, 749–759. [Google Scholar] [CrossRef]
  39. Özden, M.; Genç, M.S.; Koca, K. Passive flow control application using single and double vortex generator on S809 wind turbine airfoil. Energies 2023, 16, 5339. [Google Scholar] [CrossRef]
  40. Lian, Y.; Shyy, W.; Viieru, D.; Zhang, B. Membrane wing aerodynamics for micro air vehicles. Prog. Aerosp. Sci. 2003, 39, 425–465. [Google Scholar] [CrossRef]
  41. Koca, K.; Genç, M.S.; Ertürk, S. Impact of local flexible membrane on power efficiency stability at wind turbine blade. Renew. Energy 2022, 197, 1163–1173. [Google Scholar] [CrossRef]
  42. Kang, W.; Zhang, J.Z.; Feng, P.H. Aerodynamic analysis of a localized flexible airfoil at low Reynolds numbers. Commun. Comput. Phys. 2012, 11, 1300–1310. [Google Scholar] [CrossRef]
  43. Naderi, A.; Mojtahedpoor, M. Numerical solution of unsteady flow on airfoils with local membrane in transient and laminar flows. J. Theor. Appl. Vib. Acoust. 2016, 2, 21–34. [Google Scholar]
  44. Wang, L.; Cao, S.; Li, Y.; Zhang, J. On synchronization in flow over airfoil with local oscillating flexible surface at high angle of attack using Lagrangian coherent structures. Eur. Phys. J. Spec. Top. 2019, 228, 1515–1525. [Google Scholar] [CrossRef]
  45. Lou, B.; Ye, S.; Wang, G.; Huang, Z. Numerical and experimental research of flow control on an NACA 0012 airfoil by local vibration. Appl. Math. Mech. 2019, 40, 1–12. [Google Scholar] [CrossRef]
  46. Koca, K.; Genç, M.S.; Bayır, E.; Soğuksu, F.K. Experimental study of the wind turbine airfoil with the local flexibility at different locations for more energy output. Energy 2022, 239, 121887. [Google Scholar] [CrossRef]
  47. Koca, K.; Genç, M.S.; Veerasamy, D.; Özden, M. Experimental flow control investigation over suction surface of turbine blade with local surface passive oscillation. Ocean Eng. 2022, 266, 113024. [Google Scholar] [CrossRef]
  48. Genç, M.S.; Karasu, İ.; Açıkel, H.H. An experimental study on aerodynamics of NACA2415 aerofoil at low Re numbers. Exp. Therm. Fluid Sci. 2012, 39, 252–264. [Google Scholar] [CrossRef]
  49. Bleischwitz, R.; de Kat, R.; Ganapathisubramani, B. Aspect-ratio effects on aeromechanics of membrane wings at moderate Reynolds numbers. AIAA J. 2015, 53, 780–788. [Google Scholar] [CrossRef]
  50. Available online: https://www.unibw.de/lrt7-en/equipment/atmospheric-windtunnel (accessed on 25 April 2024).
  51. Genç, M.S.; Demir, H.; Özden, M.; Bodur, T.M. Experimental analysis of fluid-structure interaction in flexible wings at low Reynolds number flows. Aircr. Eng. Aerosp. Technol. 2021, 93, 1060–1075. [Google Scholar] [CrossRef]
Figure 1. Close view of the controlled FX 84-W-150 airfoil with LFM.
Aerospace 11 00571 g001
Figure 2. The picture of the wind tunnel’s aerodynamic force measuring test.
Aerospace 11 00571 g002
Figure 3. Sketch of the Atmospheric Wind Tunnel [50].
Aerospace 11 00571 g003
Figure 4. Apparatus to keep the airfoil fixed in the tunnel.
Aerospace 11 00571 g004
Figure 5. Technical drawings of the calibration target for PIV.
Aerospace 11 00571 g005
Figure 6. (a) The calibration target for PIV and (b) adjustment of the angle of attack in the wind tunnel.
Aerospace 11 00571 g006
Figure 7. The sketch of the experiments carried out in the wind tunnel.
Aerospace 11 00571 g007
Figure 8. PIV results of instantaneous u/U values, Re = 1.05 × 1.05.
Aerospace 11 00571 g008
Figure 9. PIV results of instantaneous u/U values, Re = 1.4 × 1.05.
Aerospace 11 00571 g009
Figure 10. PIV results of instantaneous Reynolds stress values, Re = 1.05 × 10⁵.
Aerospace 11 00571 g010
Figure 11. PIV results of instantaneous Reynolds stress values, Re = 1.4 × 10⁵.
Aerospace 11 00571 g011
Figure 12. PIV results of instantaneous standard deviations of u/U values, Re = 1.05 × 1.05.
Aerospace 11 00571 g012
Figure 13. PIV results of instantaneous standard deviations of u/U values, Re = 1.4 × 1.05.
Aerospace 11 00571 g013
Figure 14. Time-dependent deformation results of the controlled FX 84-W-150 airfoil (unit is mm).
Aerospace 11 00571 g014aAerospace 11 00571 g014b
Figure 15. Results of aerodynamic force measurements, Re = 1.05 × 10⁵.
Aerospace 11 00571 g015
Figure 16. Results of aerodynamic force measurements, Re = 1.4 × 10⁵.
Aerospace 11 00571 g016
Figure 17. Aerodynamic power efficiency graph, Re = 1.05 × 10⁵.
Aerospace 11 00571 g017
Figure 18. Aerodynamic power efficiency graph, Re = 1.4 × 10⁵.
Aerospace 11 00571 g018
Table 1. Technical specification of WEAR Group’s wind tunnel.
DesignSuction-Type and Low-Speed
Length of test section~2.5 m (closed type)
Length of tunnel13 m
Test section Length (~2.5 m), Height (0.5 m), Width (0.5 m)
MotorType: DC motor, Power: 15 kW, Frequency: 50 Hz
ModelH4, 1000/15A
Capacity45,000 m3/h, 450 PA
Flow velocity5 m/s < U < 40 m/s
Turbulence level0.3% < Tu < ~0.9%
NozzleContraction cone: 9:1
Table 2. Technical specifications of Atmospheric Wind Tunnel [50].
DesignEiffel-Type
Test section Length (22 m), Height (1.85 m), Width (1.85 m)
MotorType: DC motor, Power: 350 kW
Flow velocity2 m/s < U < 45 m/s
Turbulence levelTu < 0.5%
NozzleContraction: 9
HeatingInlet: 1.2 MW, Bottom: heated/cooled
Table 3. Technical specifications of PIV.
ParameterPIV
Camera pco.dimax S4
Sensor resolution, pixels 2016 × 2016; 2016 × 1100 used
Pixel size11 μm × 11 μm
LaserPhotonics DM150-532-DH
(Photonics Industries International, Inc., Ronkonkoma, NY, USA)
Light sheet thickness2 mm
PIV modeDouble Frame
Sampling rate, Hz 1000
Sampling time, s2
Seeding particlesDEHS, mean diameter ca. 0.4 µm
Table 4. Technical specifications of the deformation measurement.
ParameterDeformation Measurement
Camera pco.dimax S4 (2 cameras)
Sensor resolution, pixels 2016 × 2016; 2016 × 1100 used
Pixel size11 μm × 11 μm
Illumination Hardsoft ILM-501CG
(HARDsoft Mikroprocessor Systems, Kraków, Poland)
Sampling rate, Hz 1000
Sampling time, s2
Disclaimer/Publisher’s Note: The statements, opinions and data contained in all publications are solely those of the individual author(s) and contributor(s) and not of MDPI and/or the editor(s). MDPI and/or the editor(s) disclaim responsibility for any injury to people or property resulting from any ideas, methods, instructions or products referred to in the content.