Article

Research on a Honeycomb Structure for Pyroshock Isolation at the Spacecraft–Rocket Interface

1
School of Electromechanical and Automotive Engineering, Yantai University, Yantai 264005, China
2
Beijing Institute of Nuclear Engineering, Electrical Design Department, China Nuclear Power Engineering Co., Ltd., Beijing 100840, China
3
Department of Mechanical Engineering, Tsinghua University, Beijing 100084, China
*
Author to whom correspondence should be addressed.
Aerospace 2024, 11(9), 756; https://doi.org/10.3390/aerospace11090756 (registering DOI)
Submission received: 8 July 2024 / Revised: 3 September 2024 / Accepted: 4 September 2024 / Published: 14 September 2024
(This article belongs to the Special Issue Dynamics, Guidance and Control of Aerospace Vehicles)

Abstract

:
Honeycomb is a splendid kind of structure for aerospace engineering with the advantages of light weight, good shock absorption, and good structural stability. This article aims to provide methods to isolate Pyroshocks based on a honeycomb structure and guarantee the safety of such equipment against a high-frequency shock response. According to stress wave theory, an equation for stress wave transmittance of the honeycomb structure is derived considering the effect of cell wall length and thickness, where desirable honeycomb parameters are obtained. The complexity of the transfer path of the honeycomb structure is exploited to build the spacecraft–rocket interface, which could increase the impedance of the stress wave dramatically. Both finite element analysis and experiments are carried out to validate the shock isolation strategies. The influence of parameters, such as cell wall length and the thickness of the stainless-steel honeycomb, on the isolation performance is analyzed. It is revealed that the honeycomb structure has a significant effect on Pyroshock isolation performance when the wall length of the honeycomb cell is 8 mm and the thickness of the cell is 0.1 mm.

1. Introduction

In aerospace engineering, a large number of Pyroshock devices are installed on spacecraft to complete the action of spacecraft–rocket separation, booster separation, and deployment of the appendage, as shown in Figure 1 [1]. Therefore, a high shock transient response is generated during the separation of the release components, which can generally cause damage to the nearby micro-mechanisms and hardware such as relays, electronics, and crystals. Consequently, large numbers of Pyroshock issues have been observed in space engineering practice causing launch delays or flight failures [2]. Because of the significance of Pyroshocks, a great deal of studies have been carried out by the National Aeronautics and Space Administration (NASA) [3], the European Space Agency (ESA) [4], Sandia National Laboratories (SNL) [5,6], and the United States Military (USM) [7] to provide experiment standards, modeling methods, and shock isolation strategies for Pyroshock issues since 1960s.
In recent years, a number of studies have been investigated for Pyroshock response prediction [8,9], Pyroshock experiments [10], and shock isolation [11,12,13,14]. For Pyroshock response prediction, Yan [8] used laser excitation to experimentally investigate the dynamic response of aluminum honeycomb panels under high-frequency shock loads. The Iwasa [9] analytical model may be used to predict the actual Pyroshock response, and also raises several technical issues for the estimation of Pyroshock test specifications in the initial design stages. For Pyroshock experiments, Velmurugan [10] identified composite panels with regions having a high Pyroshock so that the composite panels could be used as test benches for testing of tiny components such as spacecraft electronics.
For shock isolation, the main ways to reduce the shock response are shock absorption by damping and shock isolation. The published literature on Pyroshock isolation has proposed two spacecraft–rocket interface structures. It has been shown that the interim segment structure shows better Pyroshock isolation performance for spacecraft satellite launchers with increased weight [11]. In order to achieve highly reliable separation of structural components, Su [12] proposed a novel sandwich insertion design to improve shock attenuation without shock isolators. Damping elements crafted with rubber, polyurethane, and silicone have been proposed and utilized for shock absorption by NASA since the 1970s [9]. Lu [14] designed a device using a thin-walled circular tube as an energy absorber to isolate Pyroshock. Nevertheless, previous published studies on shock isolation have some significant limitations, namely, decreasing the connection stiffness between the satellite and rocket (for damping methods) and increasing the weight of the spacecraft (for isolation methods).
With the development of material preparation, porous materials like honeycomb structures have been proposed and well established in recent years [15], as shown in Figure 2. The honeycomb structure is a bionic structure with high strength and high stability, proposed since 1944 [16]. It shows excellent performance with a light weight, good shock absorption, good structural stability, and low cost [17]. For energy absorption in honeycomb structures, Venugopal [18] investigated the energy absorption capacity of aluminum 5056 (Al 5056) alloy honeycomb cores under a vehicle impact. Qi [19] argued that honeycomb has excellent mechanical properties, which is mainly due to their unit cell configurations rather than the properties of matrix materials.
The honeycomb structure not only ensures the transmission of forces, but also has a damping effect. Consequently, the honeycomb structure is able to fulfill both shock absorption and isolation roles, making it an ideal structure for reducing Pyroshock response. The complexity of the honeycomb material transfer path could be used to construct the spacecraft–rocket interface, increase the stress wave impedance, reduce the stress wave transmittance, and achieve Pyroshock isolation. However, although there are some applications of honeycomb structures to absorb energy by principle of plastic deformation in vehicles and weapon engineering, relatively few studies have been conducted on the isolation properties of honeycomb structures.
In this article, firstly a Pyroshock isolation method based on stress wave theory is introduced and modified in order to evaluate the propagation of the stress wave through a honeycomb structure. Furthermore, a new kind of isolation device consisting of a honeycomb structure based on this theory is designed to achieve shock isolation. Then, in order to obtain the optimal solution for the isolation structure, parametric analysis of the cell wall thickness and length of the honeycomb are explored. Pyroshock isolation effects are evaluated by numerical calculations and experimental studies. Ultimately, suggestions for design optimization of the Pyroshock isolation method are presented.

2. Transmission Mechanism of Pyroshock

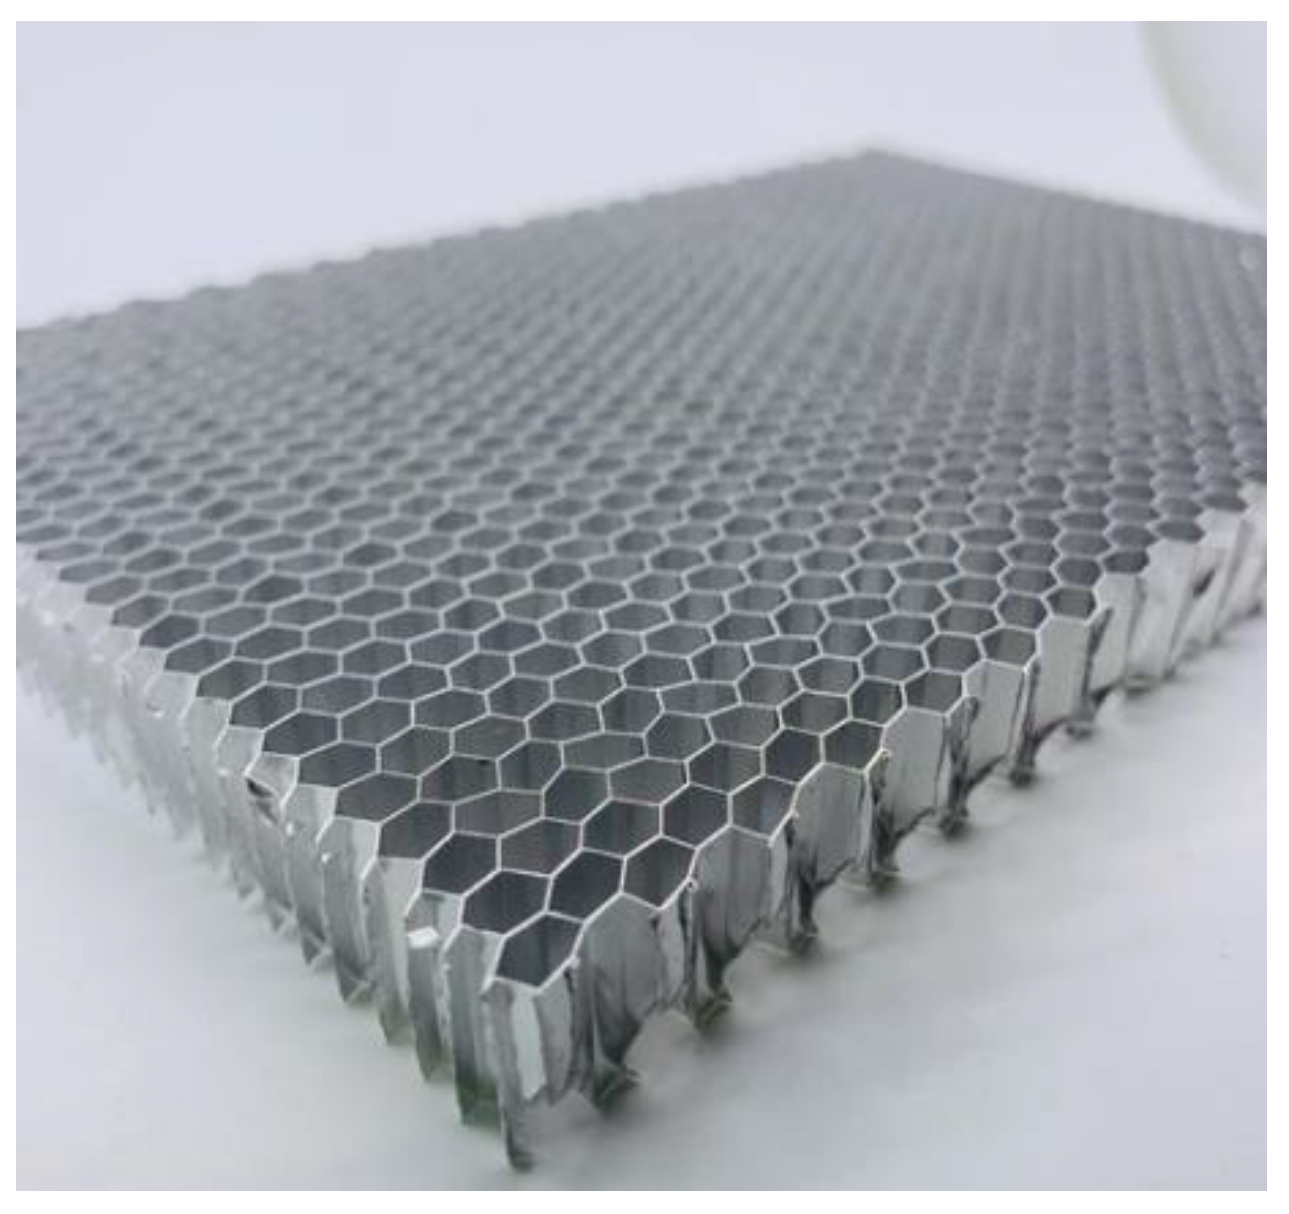
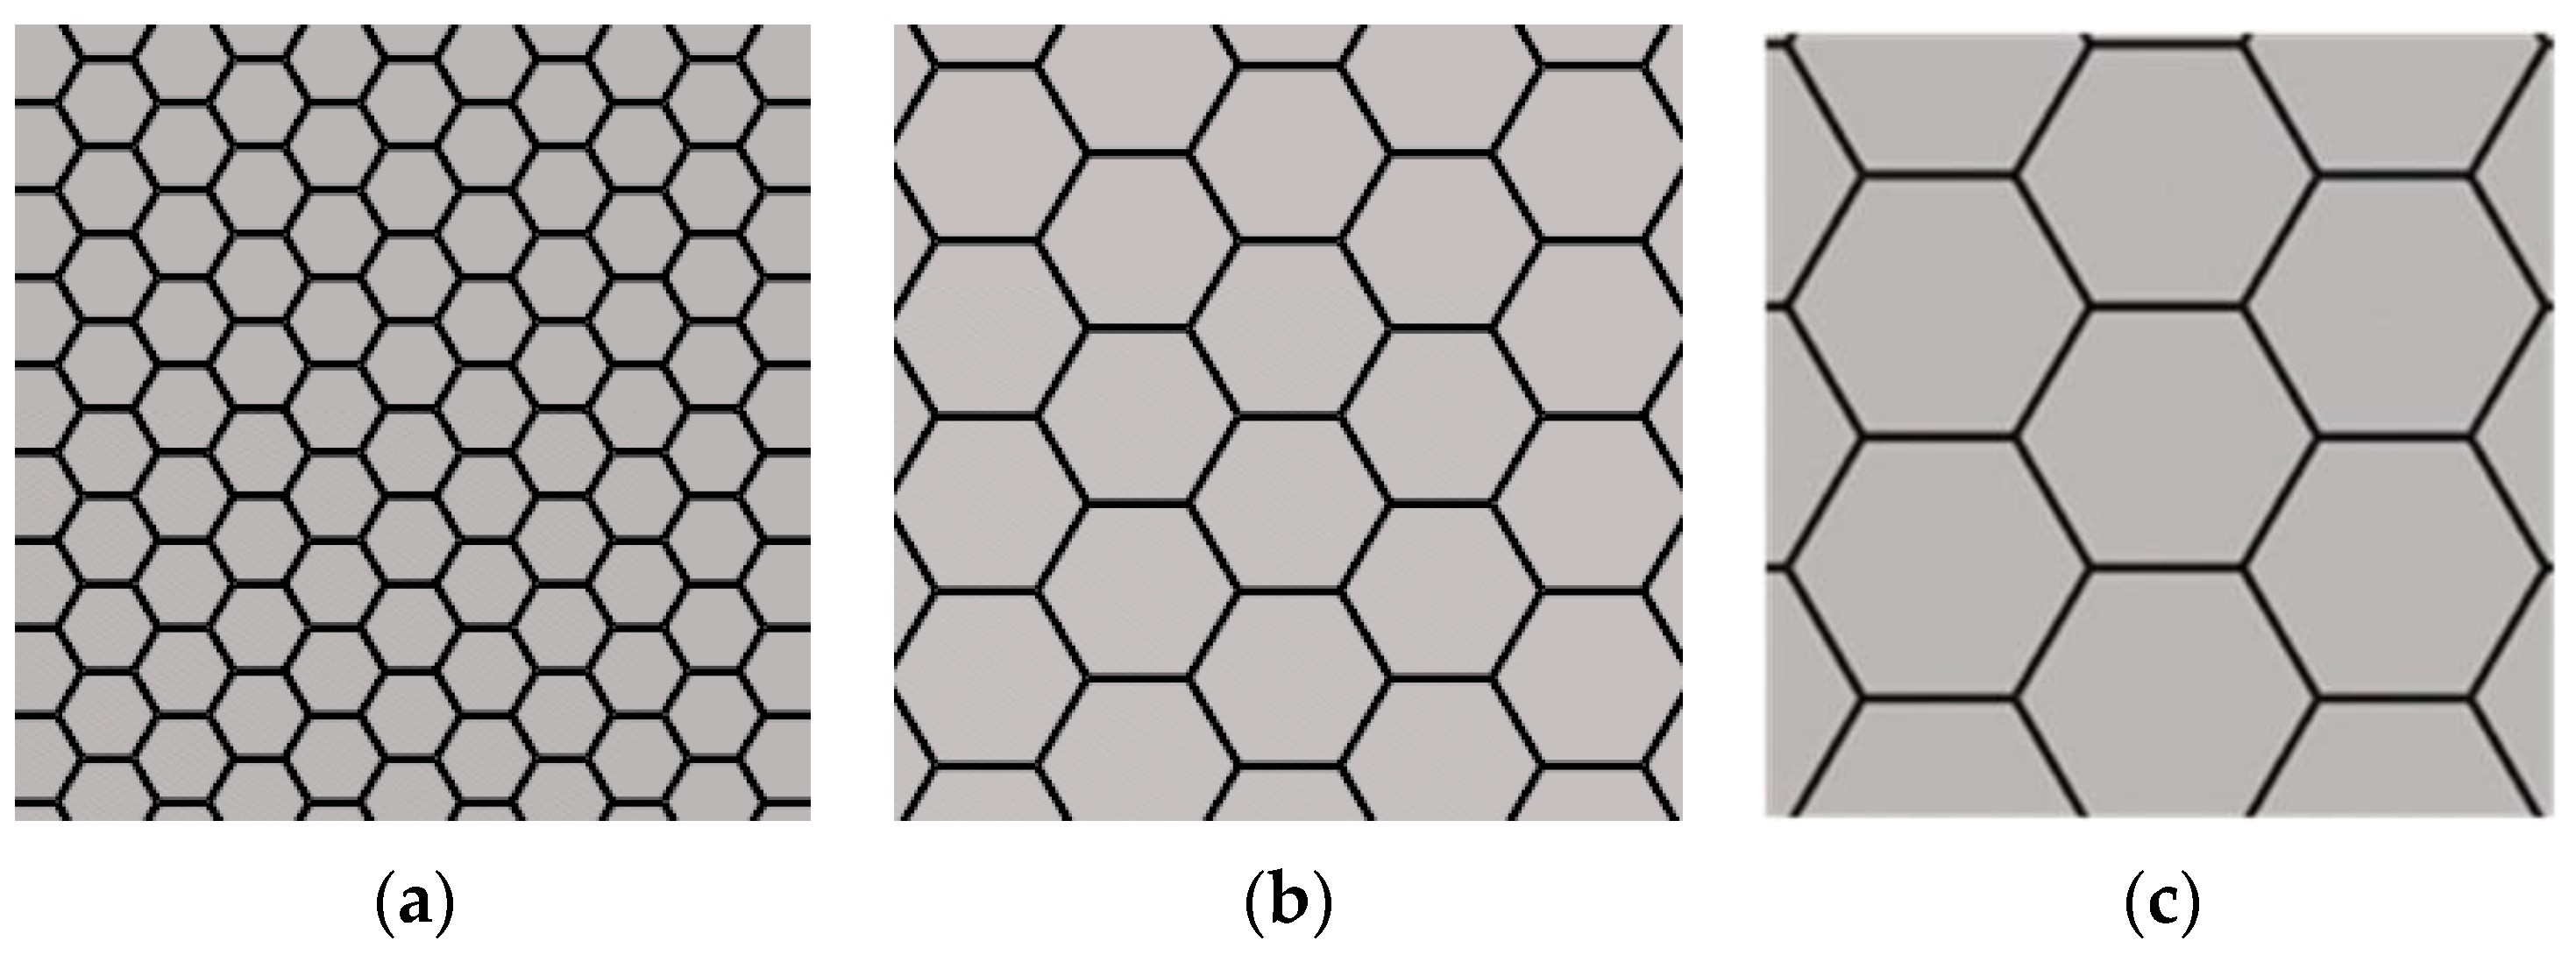
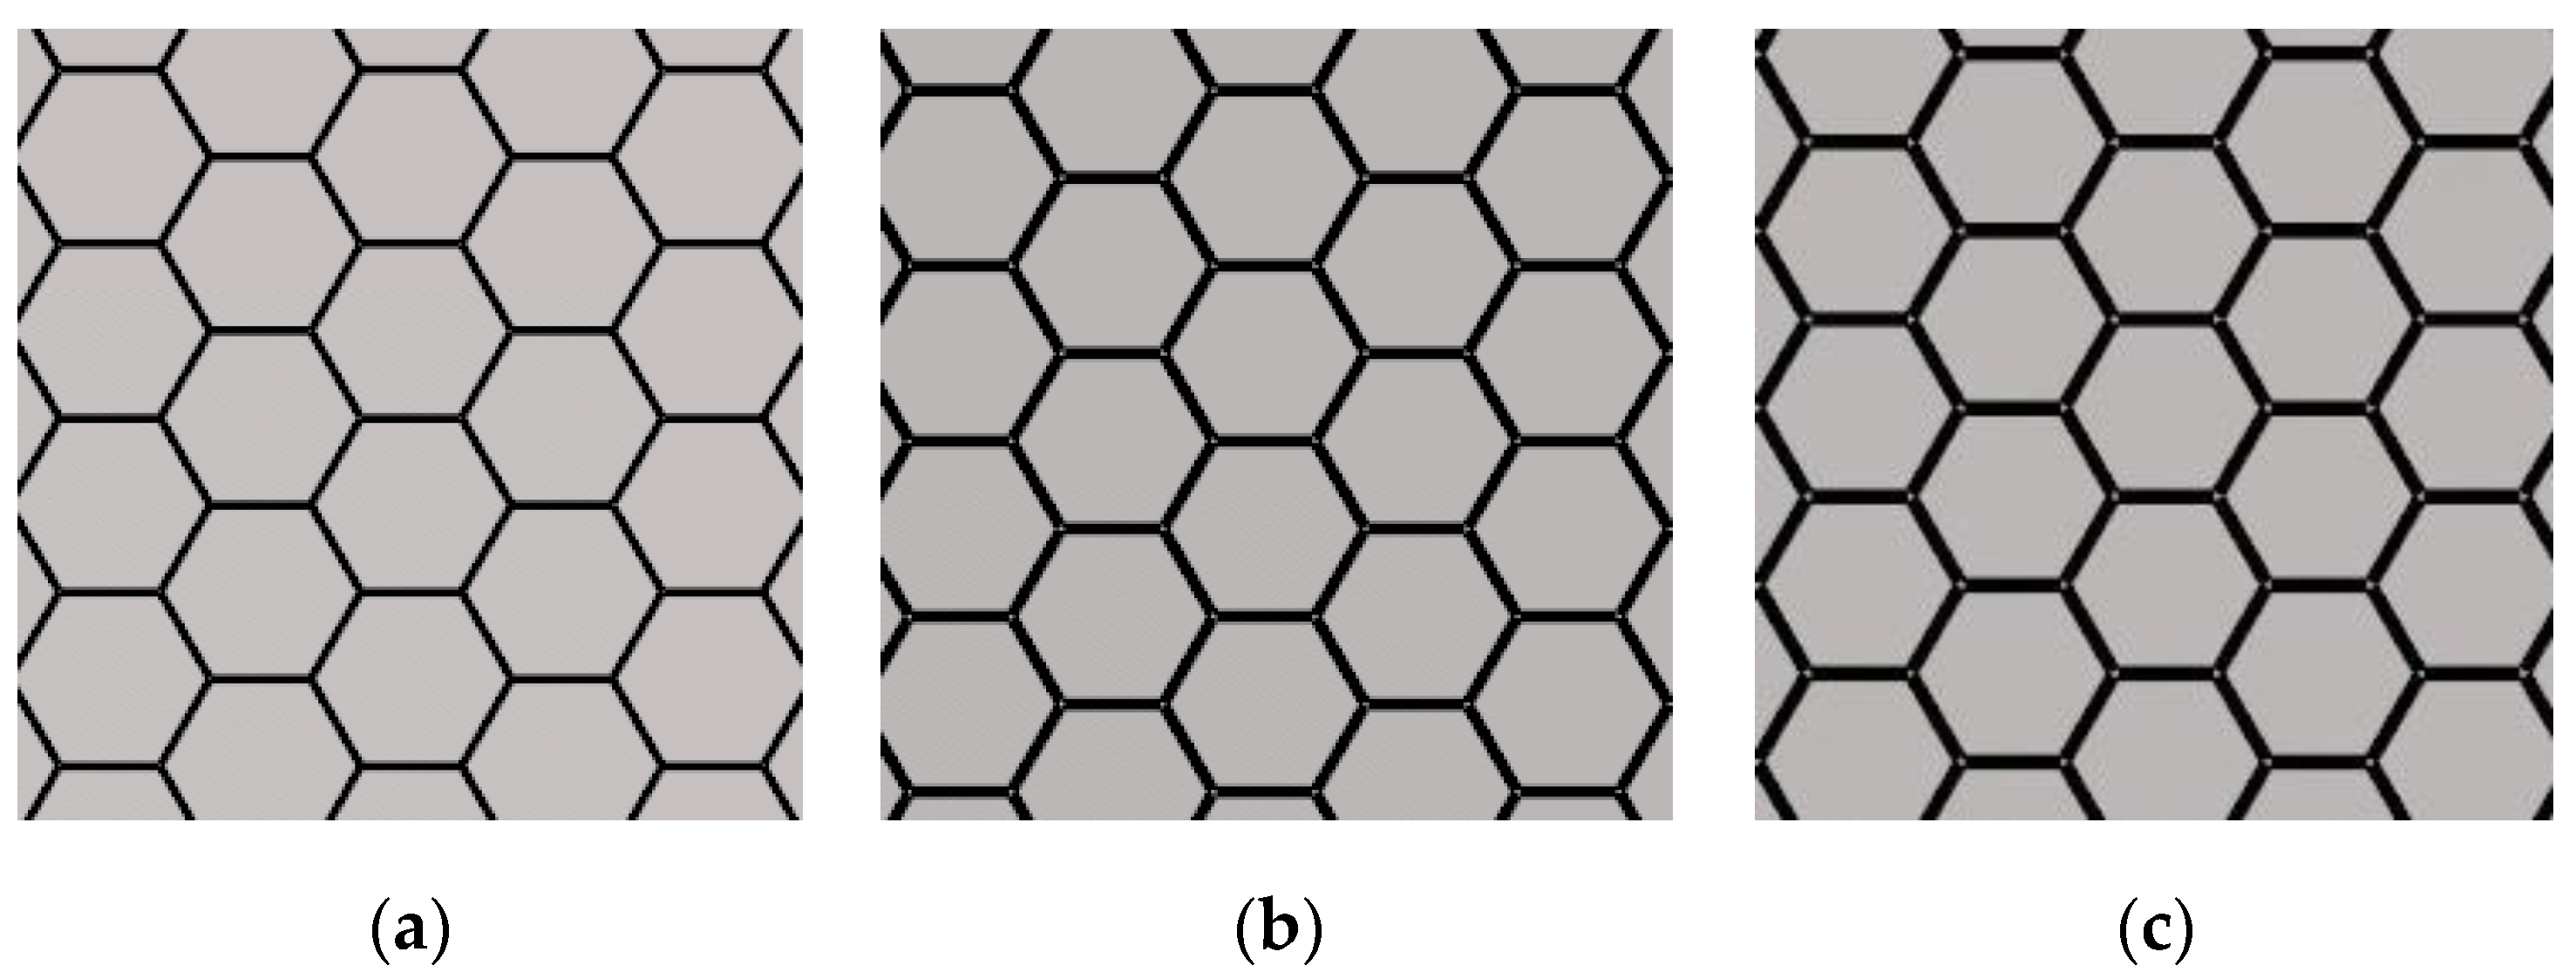
2.1. Theoretical Analysis of Honeycomb Structure

During the process of Pyroshock, the stress waves generate on the rocket side and transmit through the interface to the other side of the spacecraft. Therefore, the Pyroshock response is much larger along the x-direction than the y- and z-directions, as shown in Figure 3. The propagation of stress waves in the y- and z-directions is not taken into account. The shock load generated in a Pyroshock propagates through the object in form of stress waves. The transmission and attenuation properties of the stress wave will vary due to differences in the structure and materials of the object. It is revealed that a long distance is beneficial to reducing the shock response [1,20]. Furthermore, the one-dimensional (1D) rod model of Equation (1) is commonly utilized to evaluate the Pyroshock.
2 u t 2 = c 2 2 u x 2
where wave velocity is defined as c = E / ρ , E is the modulus of elasticity, and ρ is the density. The general solution of Equation (1) can be expressed as:
u ( x , t ) = f 1 ( x c t ) + f 2 ( x + c t )
For the right-hand working condition, the velocity v and strain ε of the single-stage rod in Figure 4a of the diagram can be obtained:
v = u t = c f ( x , t )
ε = u x = f ( x , t )
v = σ ρ c
The boundary condition of the discontinuous interface can be expressed by the balance of equilibrium and material speed:
A 1 ( σ I + σ R ) = A 2 σ T V I + V R = V T
where σI, σR, and σT are the stresses of incident, reflected, and transmitted waves and VI, VR, and VT are corresponding speeds, respectively, and A1 and A2 are the cross-sectional areas of the different interfaces of the stepped rod. The incident wave propagates from the wave source to the step bar boundary, and the reflected and transmitted waves propagate at the step bar interface. By combining Equations (5) and (6), the stress transmission rate σT/σI and stress reflectivity rate σR/σI can be written as:
σ T σ I = 2 ρ 2 c 2 A 1 ρ 2 c 2 A 2 + ρ 1 c 1 A 1 σ R σ I = ρ 2 c 2 A 2 ρ 1 c 1 A 1 ρ 2 c 2 A 2 + ρ 1 c 1 A 1
For a constant material, ρ1 = ρ2, c1 = c2. Then, Equation (7) can be simplified as:
σ T σ I = 2 R A + 1 σ R σ I = R A 1 R A + 1
where RA = A2/A1 is area rate.
In addition, for the necked rod illustrated in Figure 4b, the stress transmittance and reflectance of the necked rod can be expressed as:
σ T σ I = 4 R A ( R A + 1 ) 2 σ R σ I = ( 1 R A ) 2 ( R A + 1 ) 2
For the purpose of analyzing the effect of the stress transmission rate on the shock response, parameter analysis of the area rate is carried out, as shown in Figure 5. For a honeycomb structure that can be simplified using necked rods, the stress transmission rate first increased then decreased by the increase in the area rate. The increasing rate slowed down after RA reached 4. In addition, the extreme and maximal value σT = σI is achieved at RA = 1, indicating that all stress waves transmit without any reflectance. In that case, the stepped rod can become a continuous rod. Since a big RA could be obtained more easily via honeycomb structures than a traditional interface, honeycomb structures have enormous potential for shock isolation.
Although the stress wave theory has been developed in a mature way in terms of isolation methods for Pyroshocks, this theory is unable to evaluate the stress wave transfer for honeycomb structures. The key problem with this explanation is that the area rate RA of honeycomb structures should be obtained in order to evaluate its stress transmittance.
Stress waves are generated on one side of the honeycomb structure and propagate through the core of the honeycomb structure to the other side. Therefore, the hexagonal honeycomb structure conforms to the design characteristics of the necked rod. The honeycomb cores are arranged in a linear combination in plywood, as shown in Figure 6. The cellular shape of a honeycomb can be represented by six trapezoids, as illustrated in Figure 7. In order to estimate the stress transmission, the relationship between cell wall thickness t and cell wall length l is investigated.
After simplification, the RA of the honeycomb structure can be expressed as:
R A = 2 l + t tan π 6 × t 2 l + t tan π 6 2 × cos π 6
Substituting into σT/σI:
σ T σ I = 8 t 2 l + t tan π 6 × l + t tan π 6 2 × cos π 6 2 l + t tan π 6 2 × cos π 6 + 2 l + t tan π 6 × t 2 + Δ
Parametric analysis is carried out for t and l, respectively, and their theoretical and actual data are obtained as shown in Figure 8.
For the honeycomb structure, with the increase in cell thickness, the stress wave transmittance increases almost linearly. This indicates that increasing wall thickness is not conducive to achieving Pyroshock isolation, as shown in Figure 8. As the cell length of the honeycomb increases, the stress wave transmittance first rapidly decreases and then slowly reduces. When the cell wall thickness t = 0.1, the cell wall length decreases rapidly from 2 to 8 mm, as shown in Figure 9. Additionally, the increasing rate slows down after l reaches 8 mm. A correction factor = 0.001 is adopted to modify Equation (11), where the margin of error can be controlled within 5%.

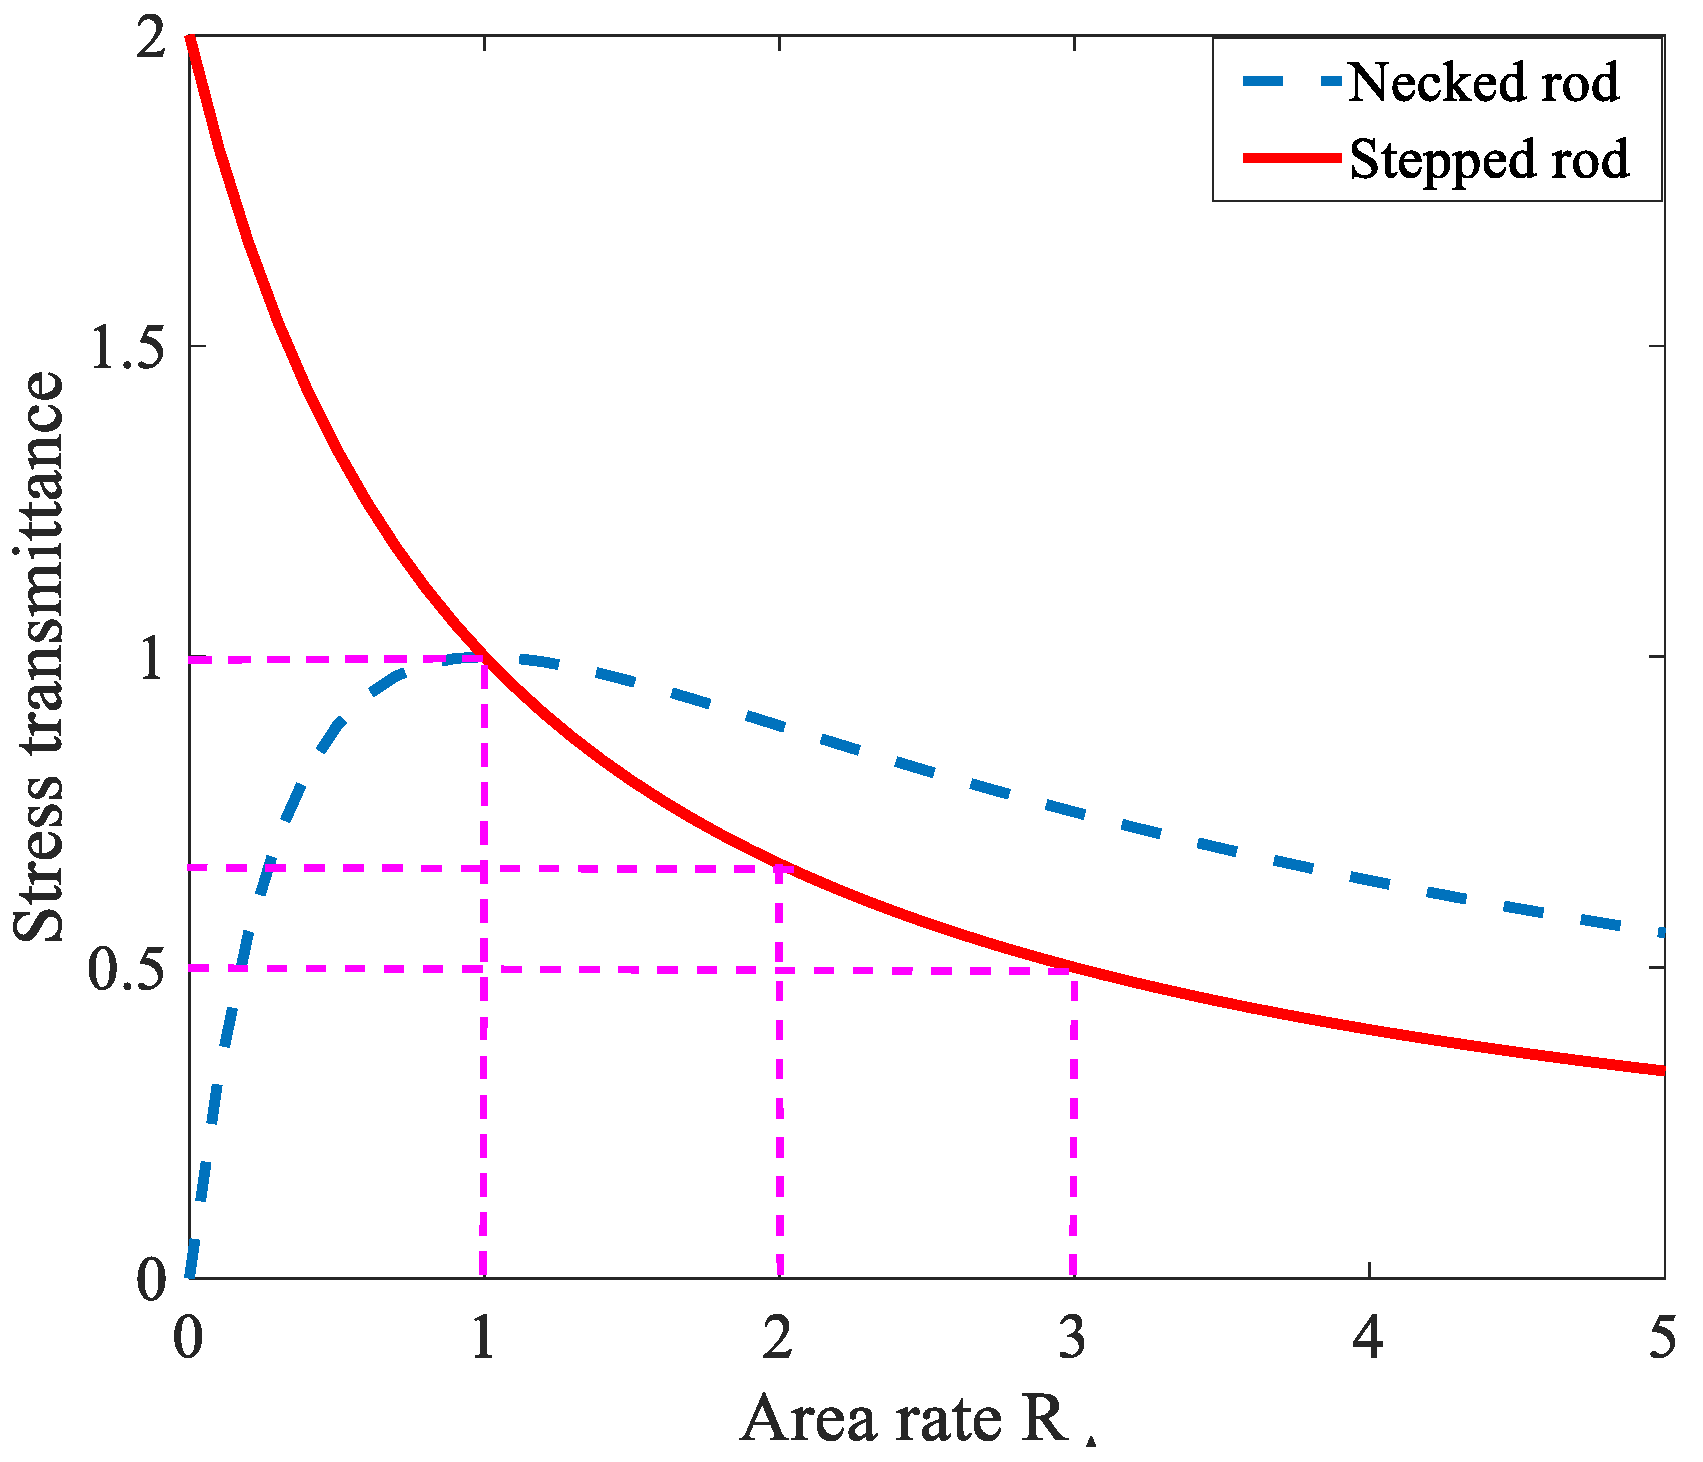
2.2. Pyroshock Isolation Strategies

It can be seen from the results of Section 2.1 that the cell wall thickness and length of honeycomb have a great influence on the stress wave transmission rate. As shown in Figure 10, a new kind of spacecraft–rocket interface is designed based on honeycomb structures. The complexity of the transfer path of the honeycomb structure is exploited to build the spacecraft–rocket interface, which can increase the impedance of the stress wave dramatically. In order to find a reasonable honeycomb size, the dimensions of the honeycomb wall are adjusted depending on the cell wall thickness and length of the honeycomb.
Furthermore, in aerospace engineering, the selection of appropriate materials is crucial for ensuring the performance and safety of spacecraft, particularly for critical components such as structural frames, engine components, and rocket interfaces. While aluminum honeycomb is widely adopted due to its lightweight characteristics, there are scenarios where materials with higher strength and rigidity are required to withstand the extreme conditions encountered during space launches and operations. In this study, the honeycomb structure deployed between the satellite and the rocket is affixed based on explosive bolts bearing significant shock loads upon detonation. To address the stringent requirements for enhanced strength and rigidity, stainless steel was utilized as the material for the honeycomb structure, thereby ensuring the structural integrity and stability of the spacecraft.

3. Finite Element Analysis

In this section, finite element (FE) models are utilized for both the original and modified honeycomb structure presented in Section 2.2 to analyze and evaluate their isolation performance.

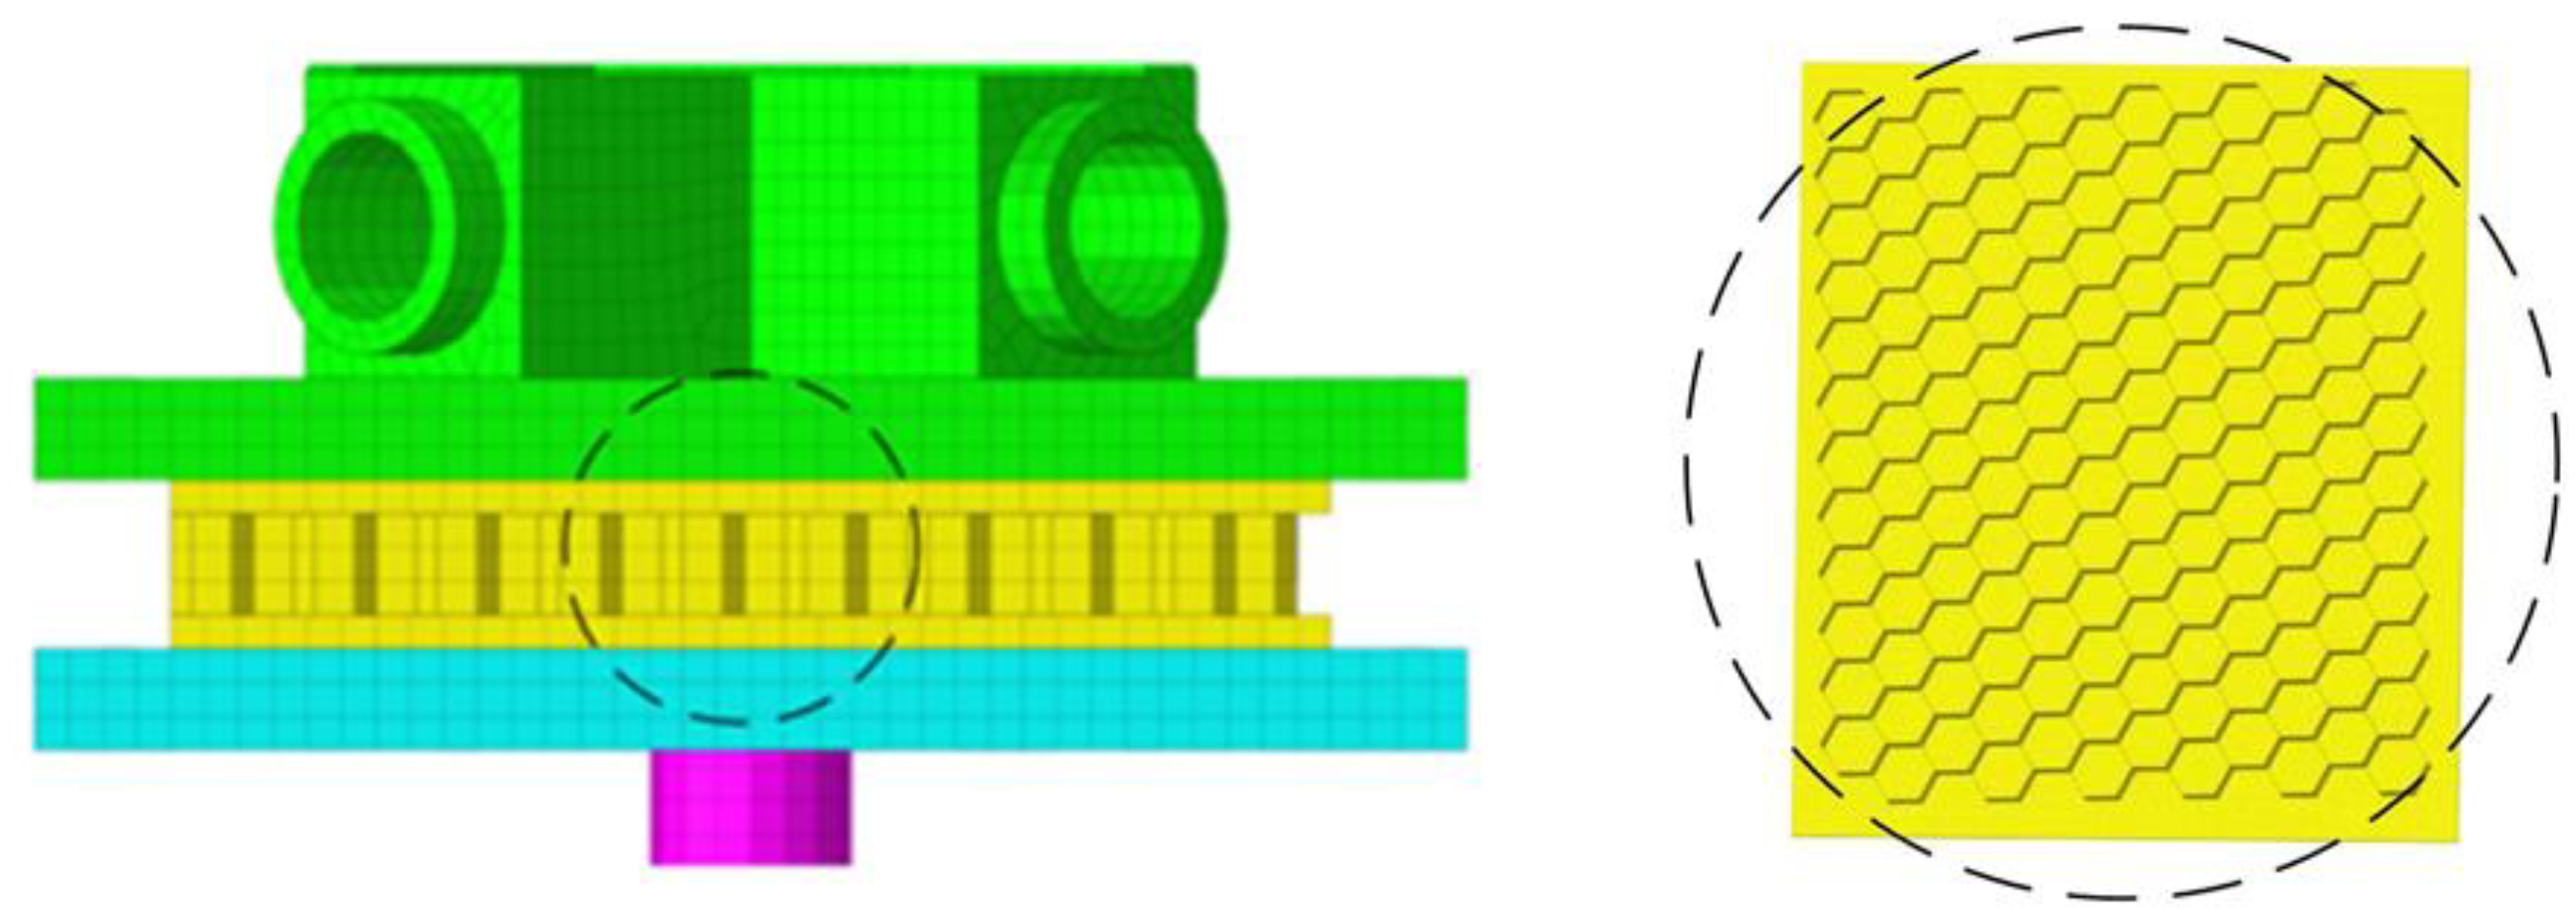
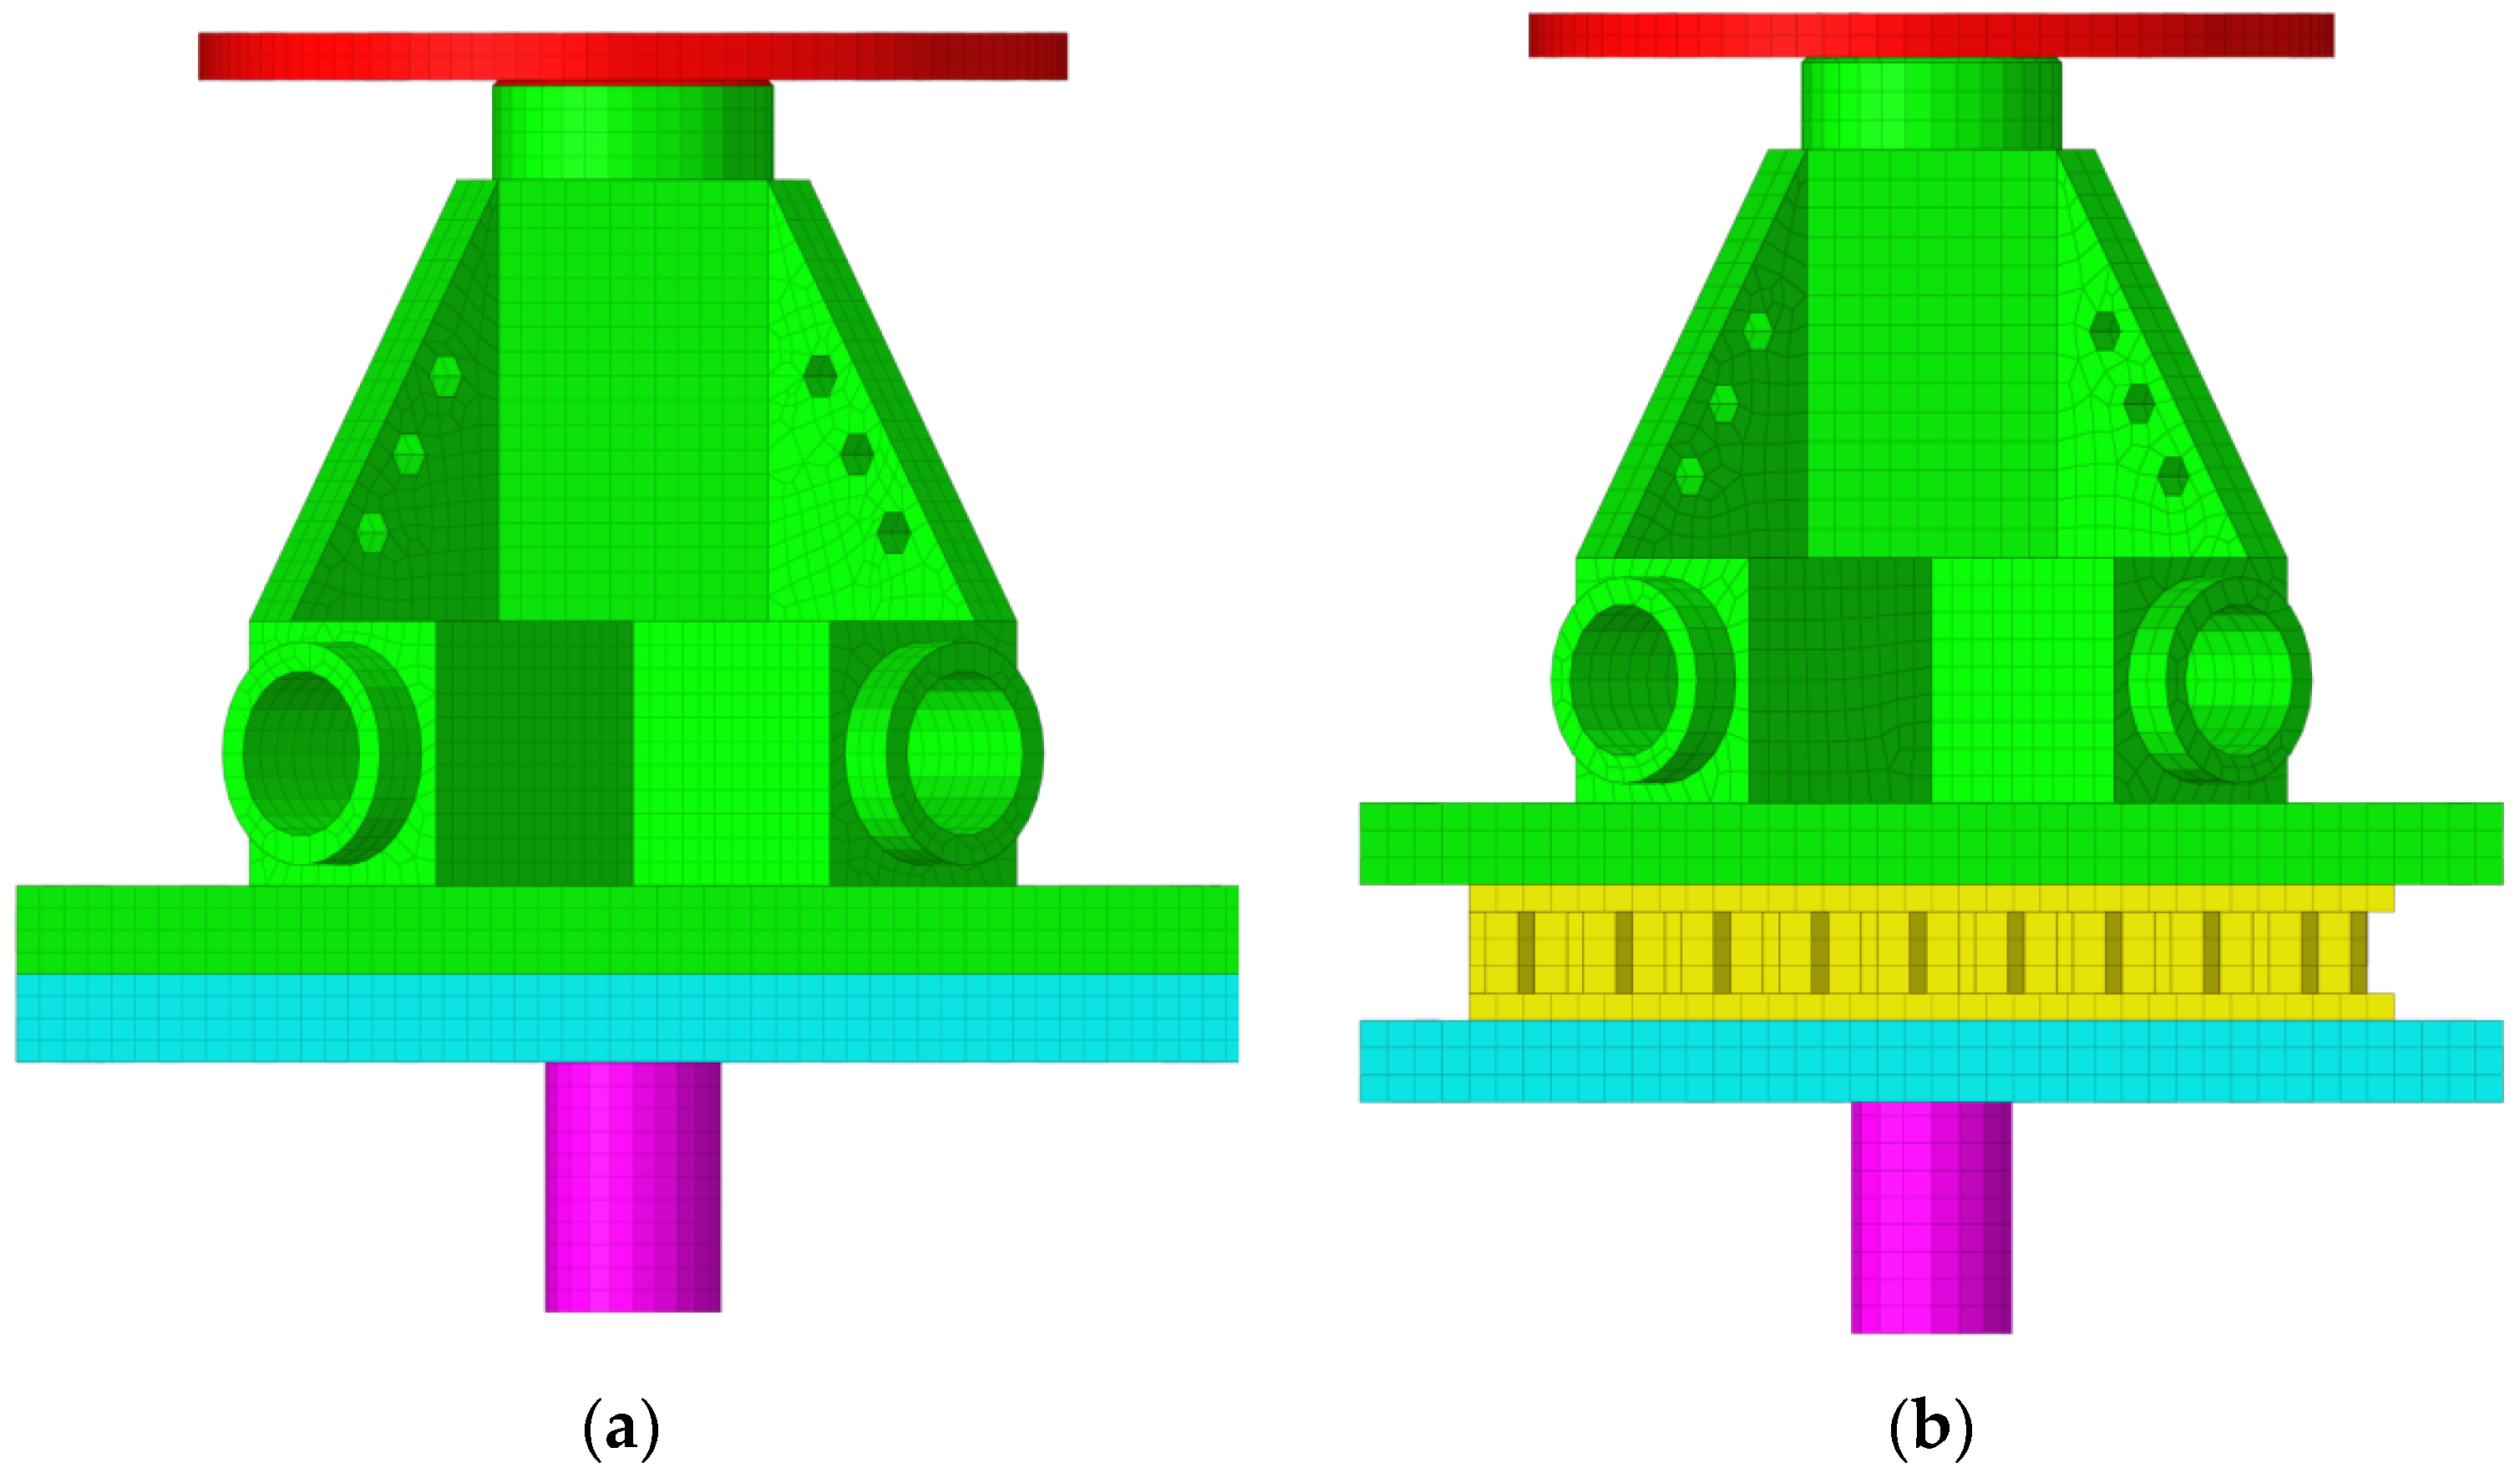
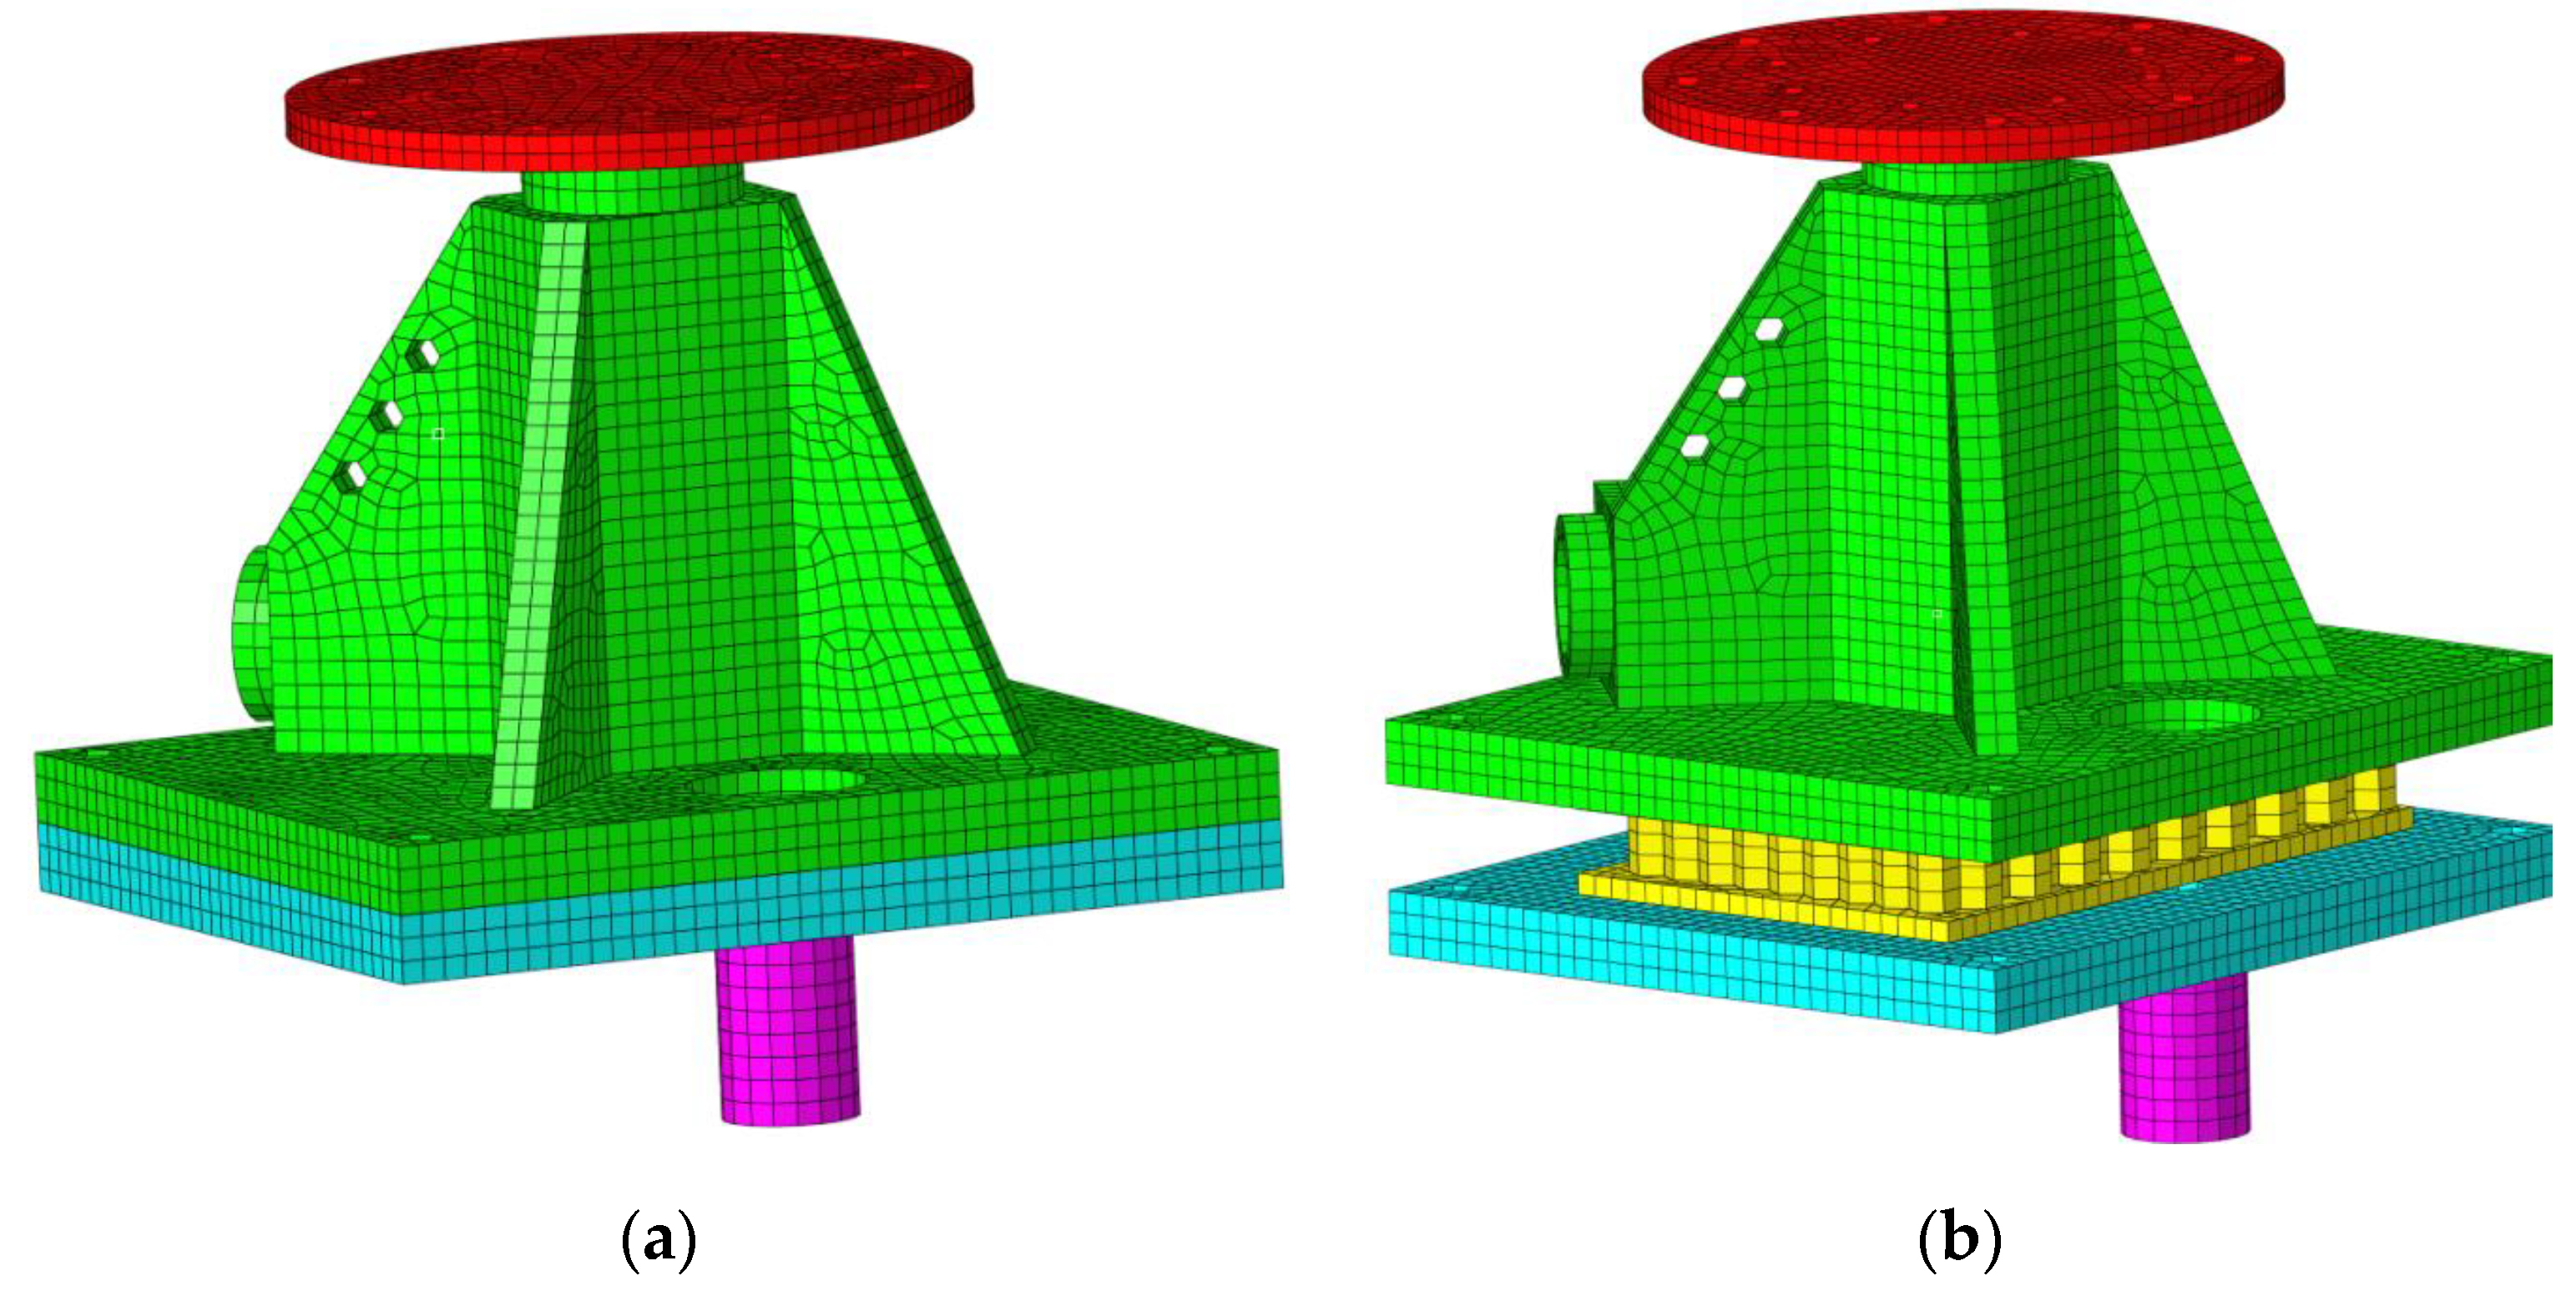
3.1. Model Description

The explicit dynamics software ANSYS (2020R2)/LS-DYNA (R7) is utilized to model the spacecraft–rocket interface. A high-quality hexahedral mesh with 27,287 nodes and 130,296 elements in the original structure is adopted in all components for the calculation of transient shock problems, as shown in Figure 11 and Figure 12. The modified structure consists of 43,707 nodes and 208,700 elements. A bilinear isotropic strengthening (BISO) model is used for the constitutive equation, where the material parameters are illustrated in Table 1 and whose geometric dimensions are summarized in Table 2.
A triangle wave excitation with a period of 400 μs and a peak value of 2 kN is adopted to simulate the blast separation shock load during spacecraft–rocket separation. In order to make the computational results more realistic and accurate, Rayleigh mass and stiffness damping are adopted to realize damping simulation with a damping ratio of 0.001 for all of the solid elements. The mass damping α = 7.464 and stiffness damping β = 3.15 × 10⁻⁸ are utilized in this manuscript.
The size of the mesh has a relatively large effect on the computational results of the model. In order to obtain realistic model calculation results and to save computational resources, it is necessary to perform a mesh sensitivity analysis of the model to obtain a suitable mesh size. A recommended mesh size can be estimated based on the relationship between wave length and frequency:
λ = c f
where f is the frequency. The minimum wave length λ = 517.9 mm as f = 20,000 Hz can be obtained by Equation (12). In this study, the mesh size from 3 to 9 mm is investigated, which is much less than one-tenth of the minimum wave length λ. In order to realize the mesh sensitivity analysis, some parameters of shock response spectrum (SRS), Er and Mr, are necessary and introduced as follows:
S R S = max ( R 0 f )
where R0f is the response of a series of a single-degree-of-freedom (SDOF) system with frequency f sweeping from 0 to the maximum analysis frequency.
The following two dimensionless coefficients are introduced, which do not take into account the frequency [21]:
E r = f = f 0 f N S R S a ( f ) f = f 0 f N S R S b ( f ) , M r = M a x ( S R S a ( f ) ) M a x ( S R S b ( f ) )
where Er is the mean relative coefficient of SRS in the whole frequency range, Mr is the maximum relative coefficient of SRS, SRSa (f) is the analyzed SRS, and SRSb (f) is the base SRS of the original structure in this article.
A reasonable vale of mesh size of 5 mm could be obtained from the results of mesh sensitivity analysis, as shown in Figure 13, where an error less than 5 percent can be observed. If the mesh size continues to decrease, the computational cost increases significantly.

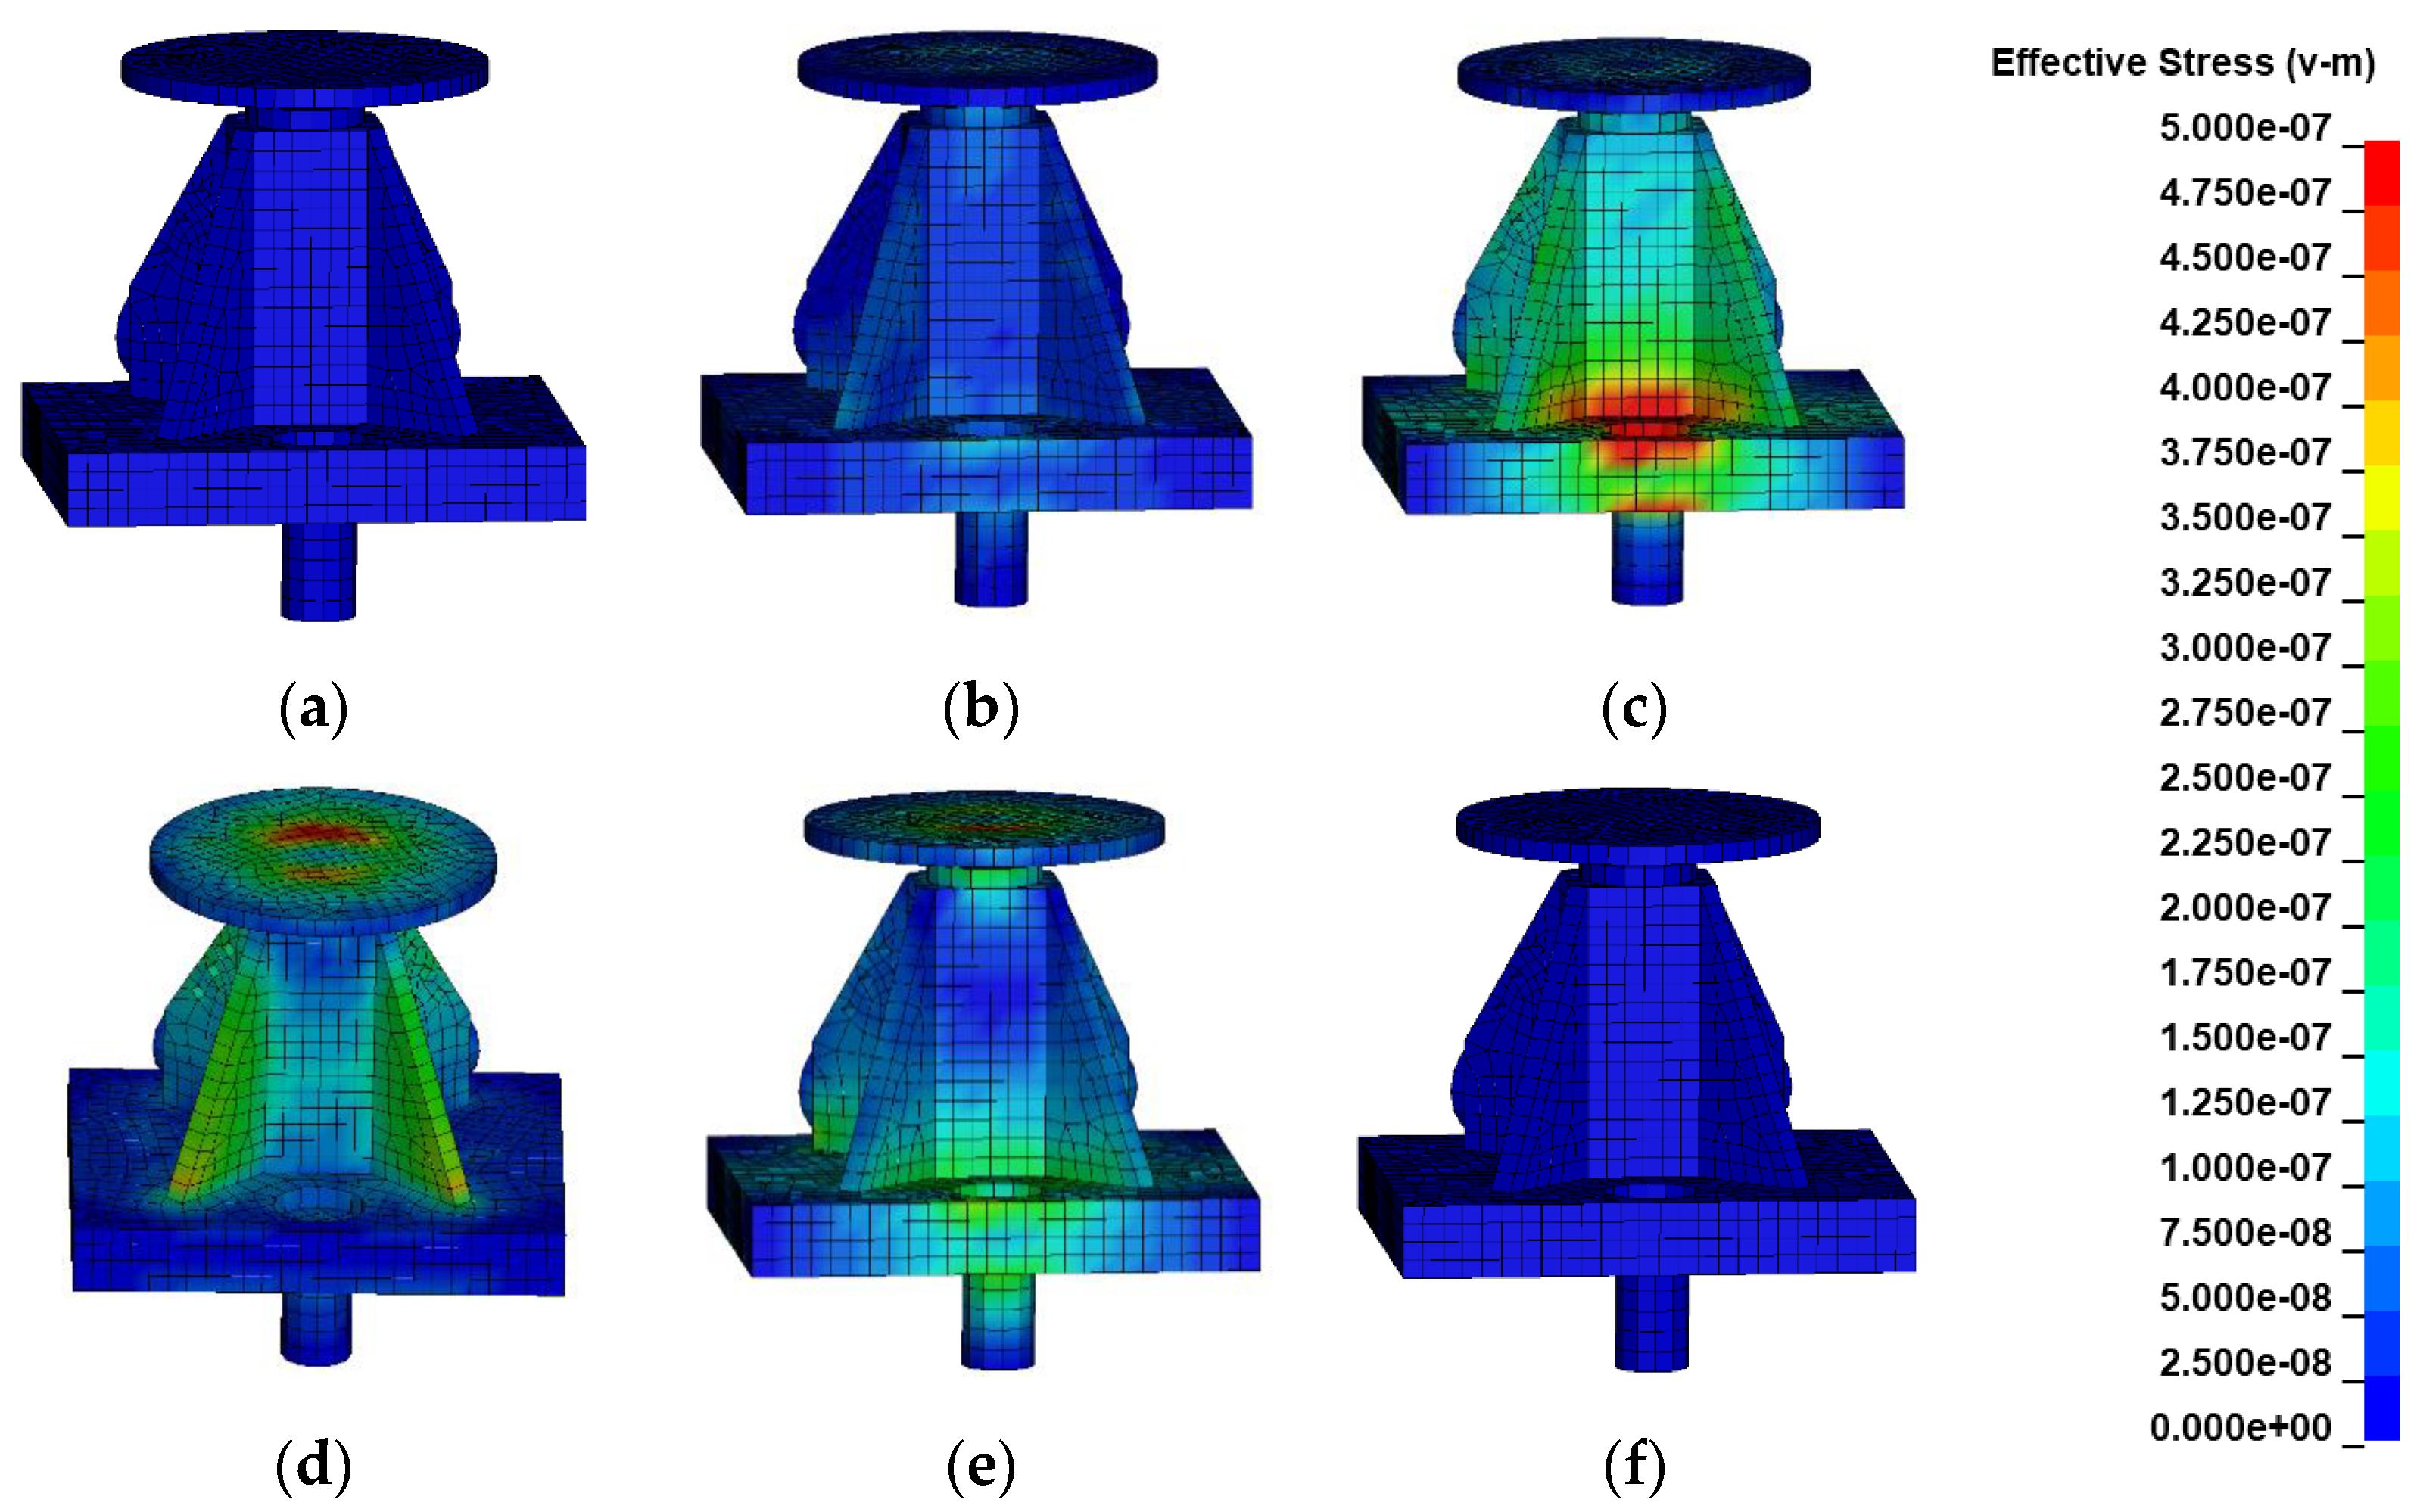
3.2. Simulation and Discussion

The von Mises stress contours of the original structure are shown in Figure 14. The simulation starts with a shock from the excitation. As the time increases from 200 to 700 μs, the stress wave spreads from the excitation point to the top of the structure with little resistance. Then, the forced vibration stage terminates and the vibration energy of the system reaches a peak value close to 700 μs. After that, the free vibration stage starts without any external load. During this phase, stress waves reflect and transmit in the structure, and energy is reduced by the damping effect. When computation time is increased to 10,000 μs, most of the response is dissipated and stress remains at a very low level.
A similar phenomenon can be observed with the modified structure from Figure 15. Under the load boundary condition, a forced vibration process begins along with stress wave generation and propagation. After loading, the free vibration process occurs while the damping of the vibration energy is dissipated. However, the change in geometry affects the propagation of the stress wave causing a wave reflection at 1800 μs, where the reflection of stress waves can be clearly observed. A shock response is prevented through the honeycomb interface and suppressed at very low level on the satellite side, which indicates that the honeycomb structure is beneficial for shock isolation.

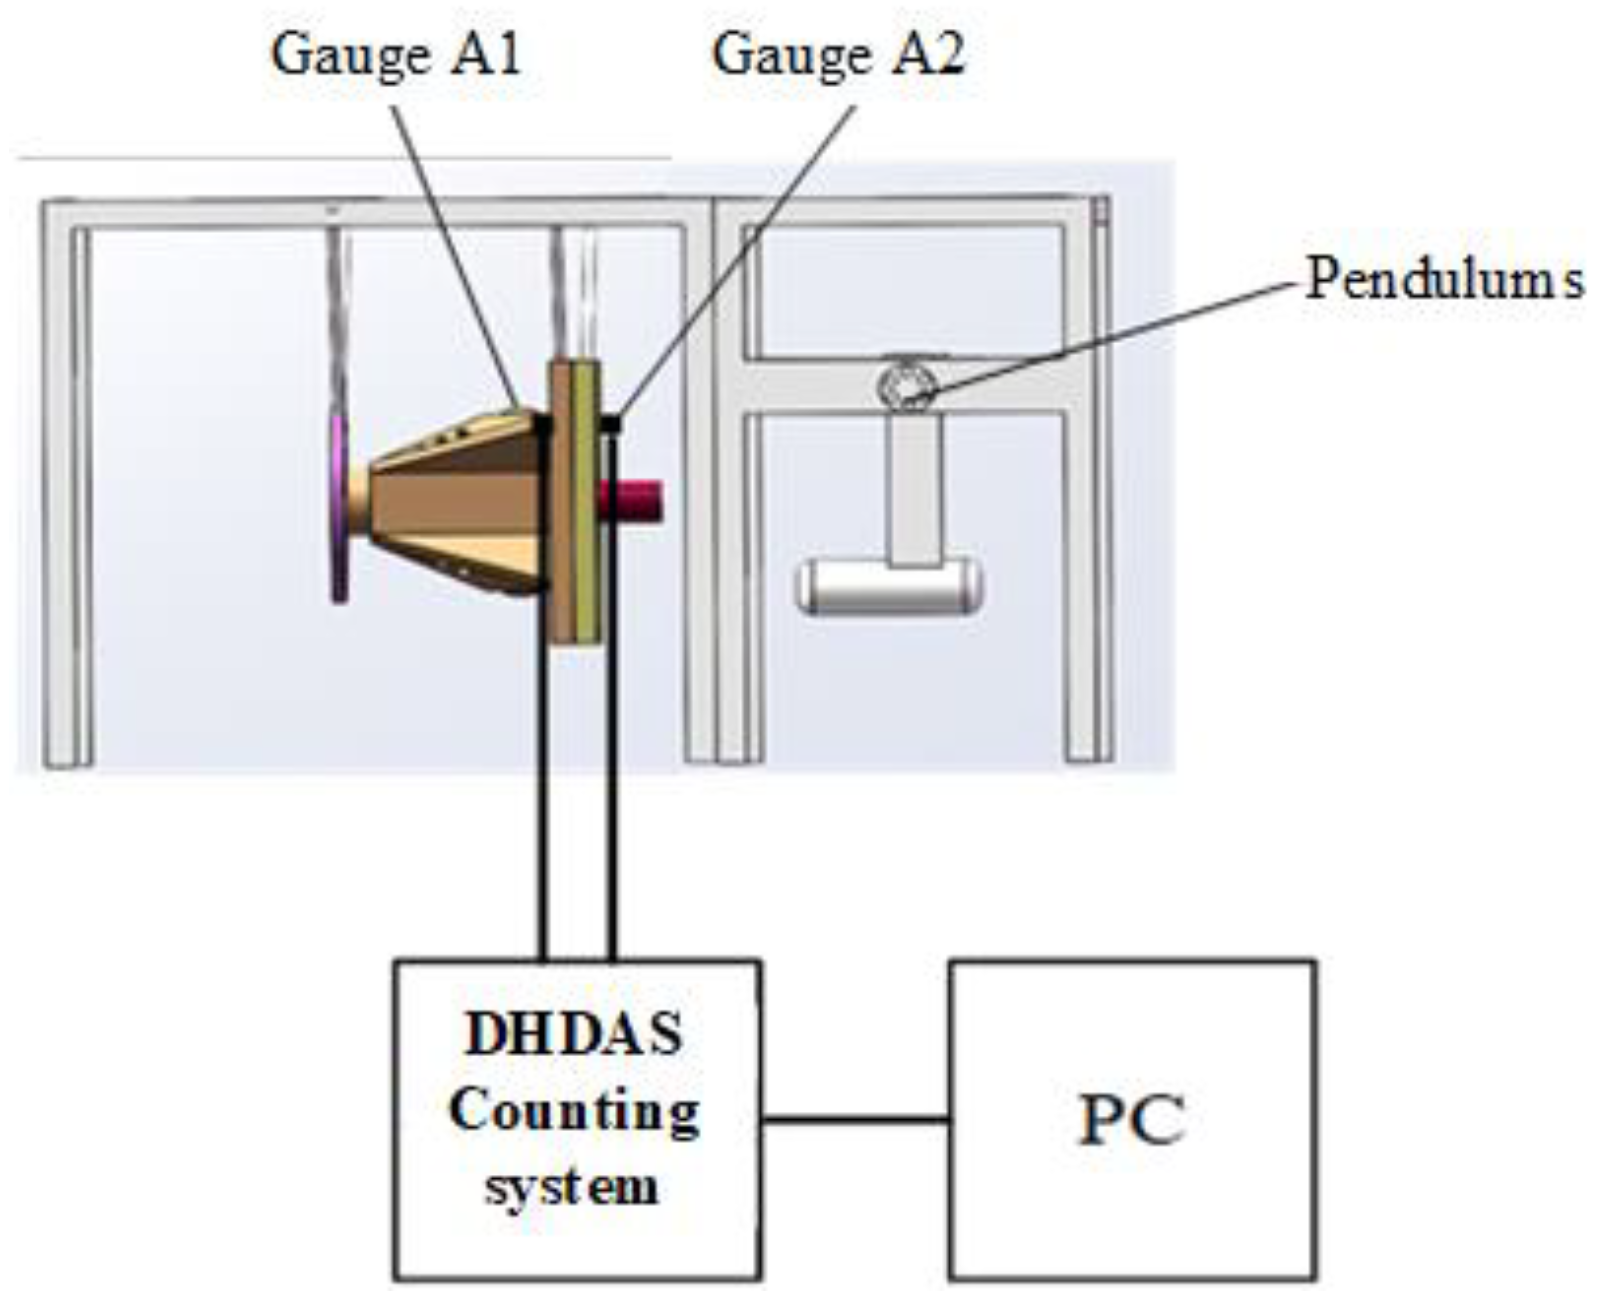
3.3. Experimental Setup

To validate the accuracy of the FE model, an experimental system for a 1/4 spacecraft–rocket with different interfaces with the free boundary condition was used, as shown in Figure 16 and Figure 17, where two accelerometers were mounted on both sides, A1 and A2, of the spacecraft–rocket interface. An authentic interface containing the original and incorporated honeycomb structures is connected under a flange structure. The honeycomb panel we utilized is composed of cells from an open-cell honeycomb structure. In the experimental setup, this panel was clamped between the spacecraft and the rocket interface using four bolts, which simulate the connection of explosive bolts in practical applications. A pendulum was adopted as excitation to simulate the Pyroshock environment during spacecraft–rocket separation [22,23,24].
Table 3 shows the parameters of accelerometers, named 3200B4 and provided by Dytran instrument, Inc. (Chatsworth, CA, USA) The data acquisition system is a DHDAS dynamic signal acquisition and analysis system provided by Jiangsu Donghua Test Technology Co. (Jingjiang, China) The sampling frequency is set to 20 kHz.
One of the major causes of shock signal data failure is the presence of low-frequency trend terms. The trend term between the measured signal and the real signal can originate from a variety of factors, such as resonance of the sensor or noise interference. When using convolution integration to solve the shock response spectrum, the low-frequency trend term may be amplified, leading to zero drift problems. This affects the accuracy of the test data. Due to the limitations of the test conditions, the shock acceleration data commonly contain low-frequency trend terms, leading to inaccurate test data. A validity analysis of the signal is required to correct the signal and eliminate the integral zero shift [25,26,27].
If zero shift trends are observed in the velocity or displacement responses integrated by the original Pyroshock acceleration signals, as shown in Figure 18, the Pyroshock test data are identified to be corrupted or contaminated [1,28]. As shown in Figure 18, the difference between the positive and negative SRS is significant since the process of the Duhamel integral enhances the effect of zero shift [3,29]. The two phenomena described above reveal that the Pyroshock data require validation and correction to avoid the integral zero shift. Based on the existing studies [30,31], the range of the decomposition level is further determined by three correlation coefficients (3–7). After comparative analysis, a decomposition level of 5 is determined. A Db5 wavelet basis function is adopted to correct the data. In Figure 19, the comparison of the corrected and original signals in the time domain reveals that the acceleration curves of the original signal S1 and the corrected signal fd are nearly superimposed. This indicates a strong correlation between the pre- and post-correction signals, suggesting that the main energy components present in the original signal S1 are retained in the corrected signal fd. Upon performing two successive time-domain integrations on the corrected signal fd, the resulting velocity and displacement converge to zero, which signifies that the zero-drift phenomenon has been effectively mitigated.
The comparison of the original and corrected SRS is illustrated in Figure 20. It can be observed that the difference between the SRS before and after correction is 1–2 orders of magnitude in the frequency band [1, 200]. The data trend term of the shock signal seriously interferes with the prediction of the SRS for the shock environment. The corrected data are valid and facilitate the next experimental study.

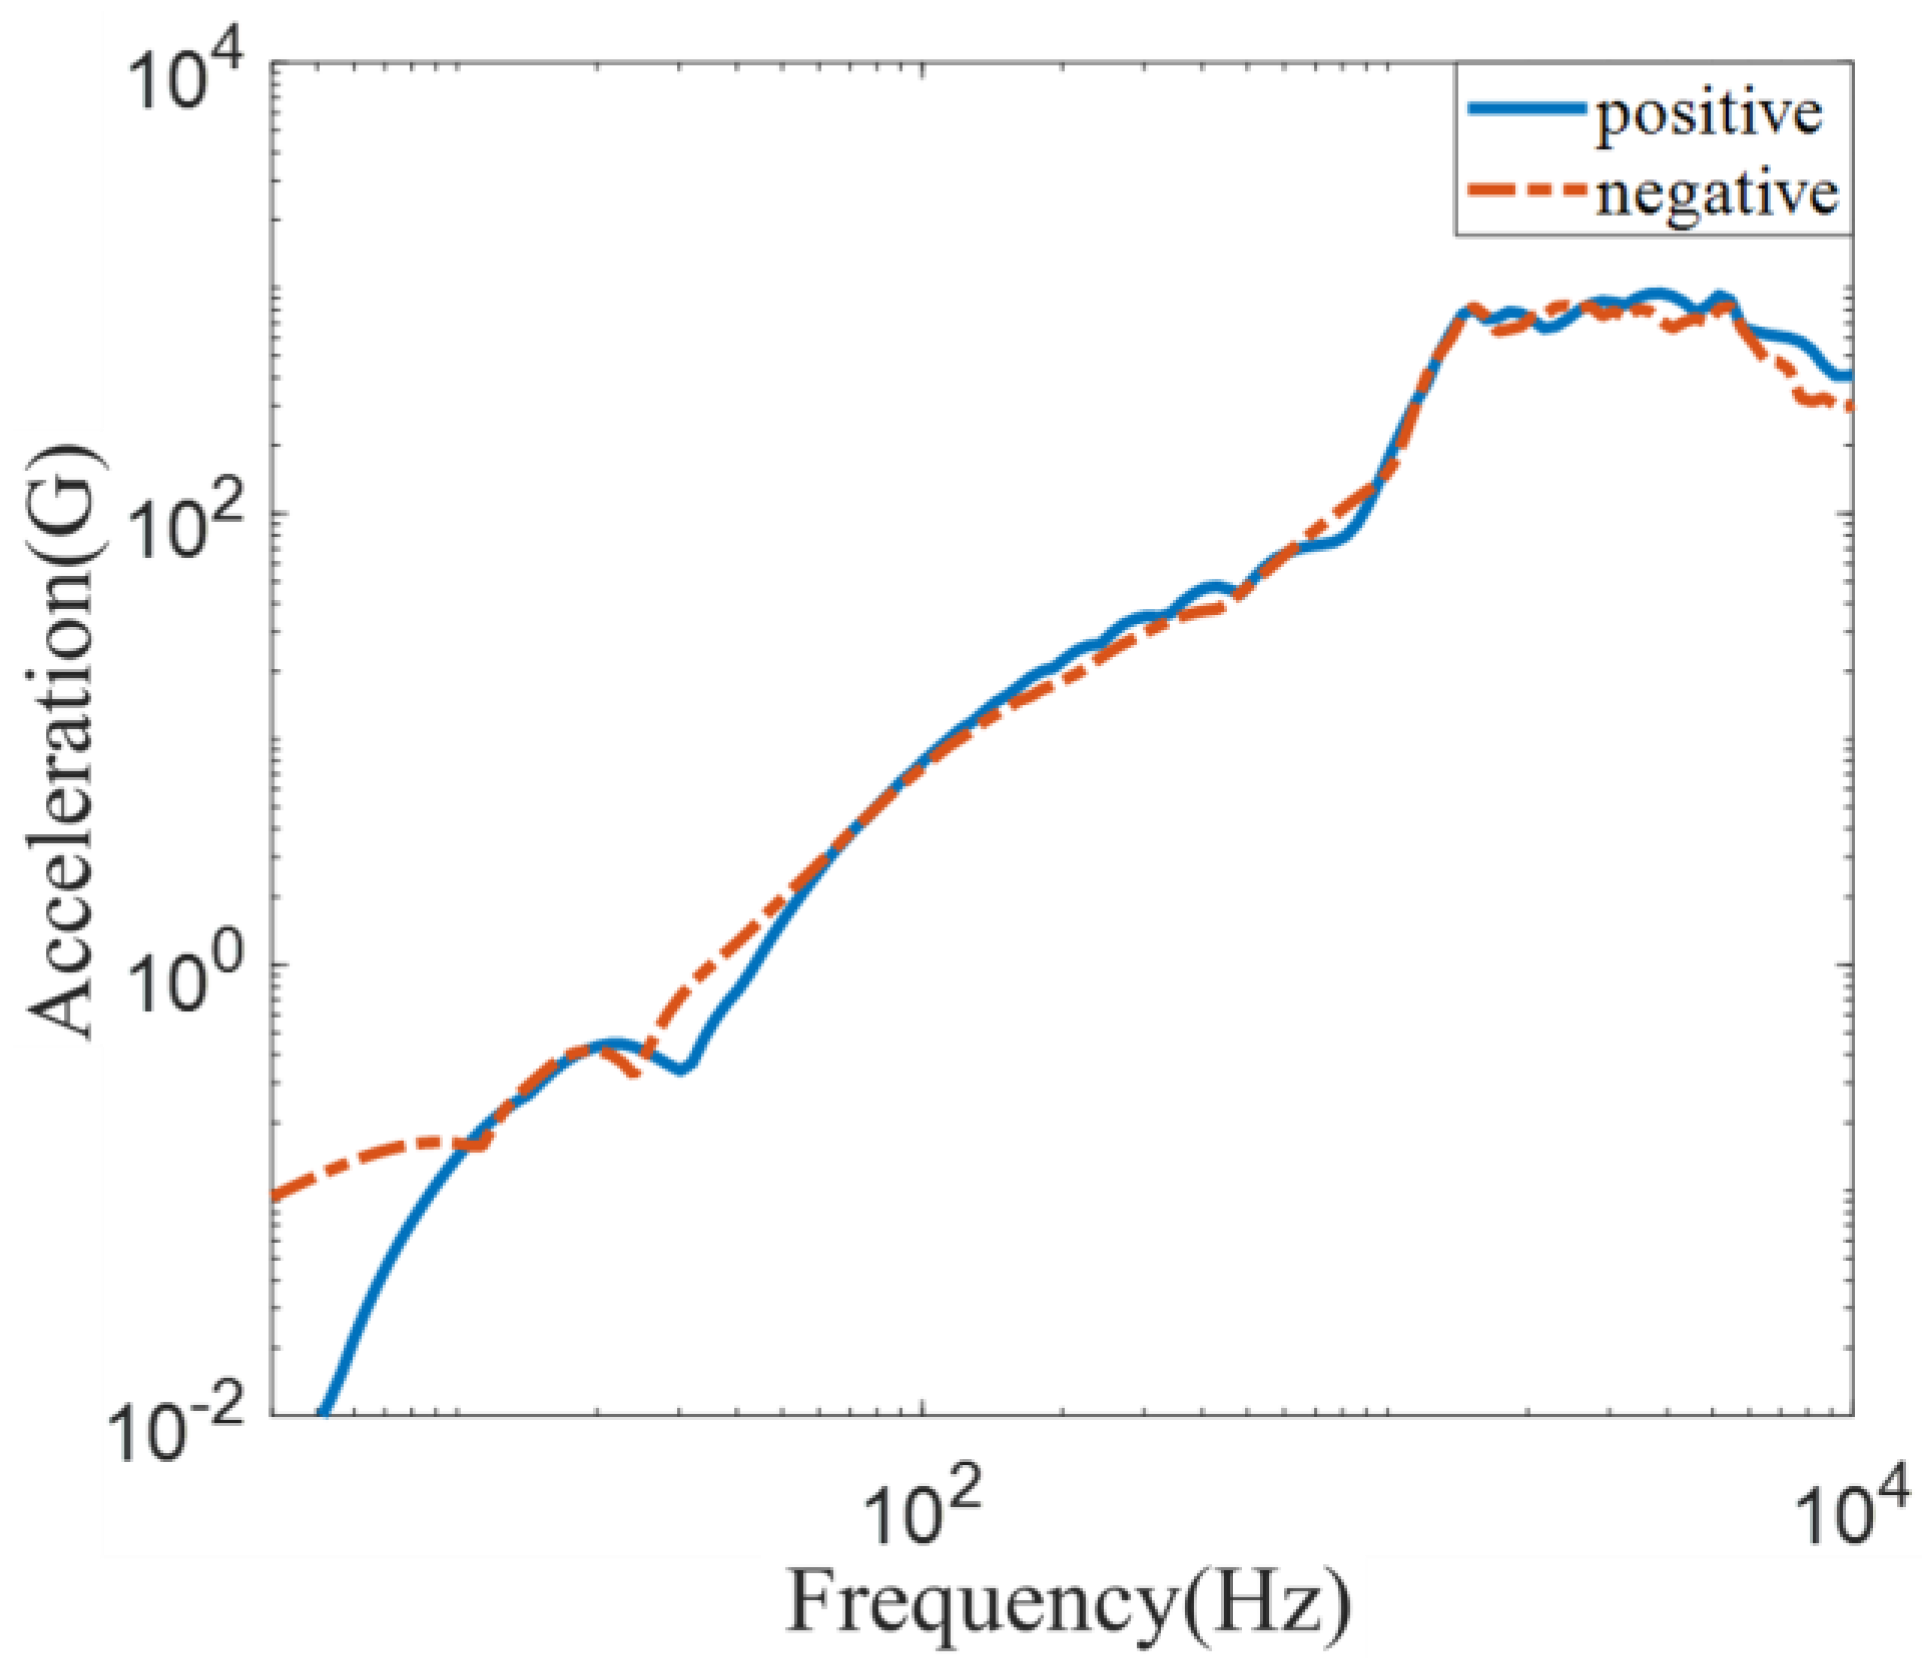
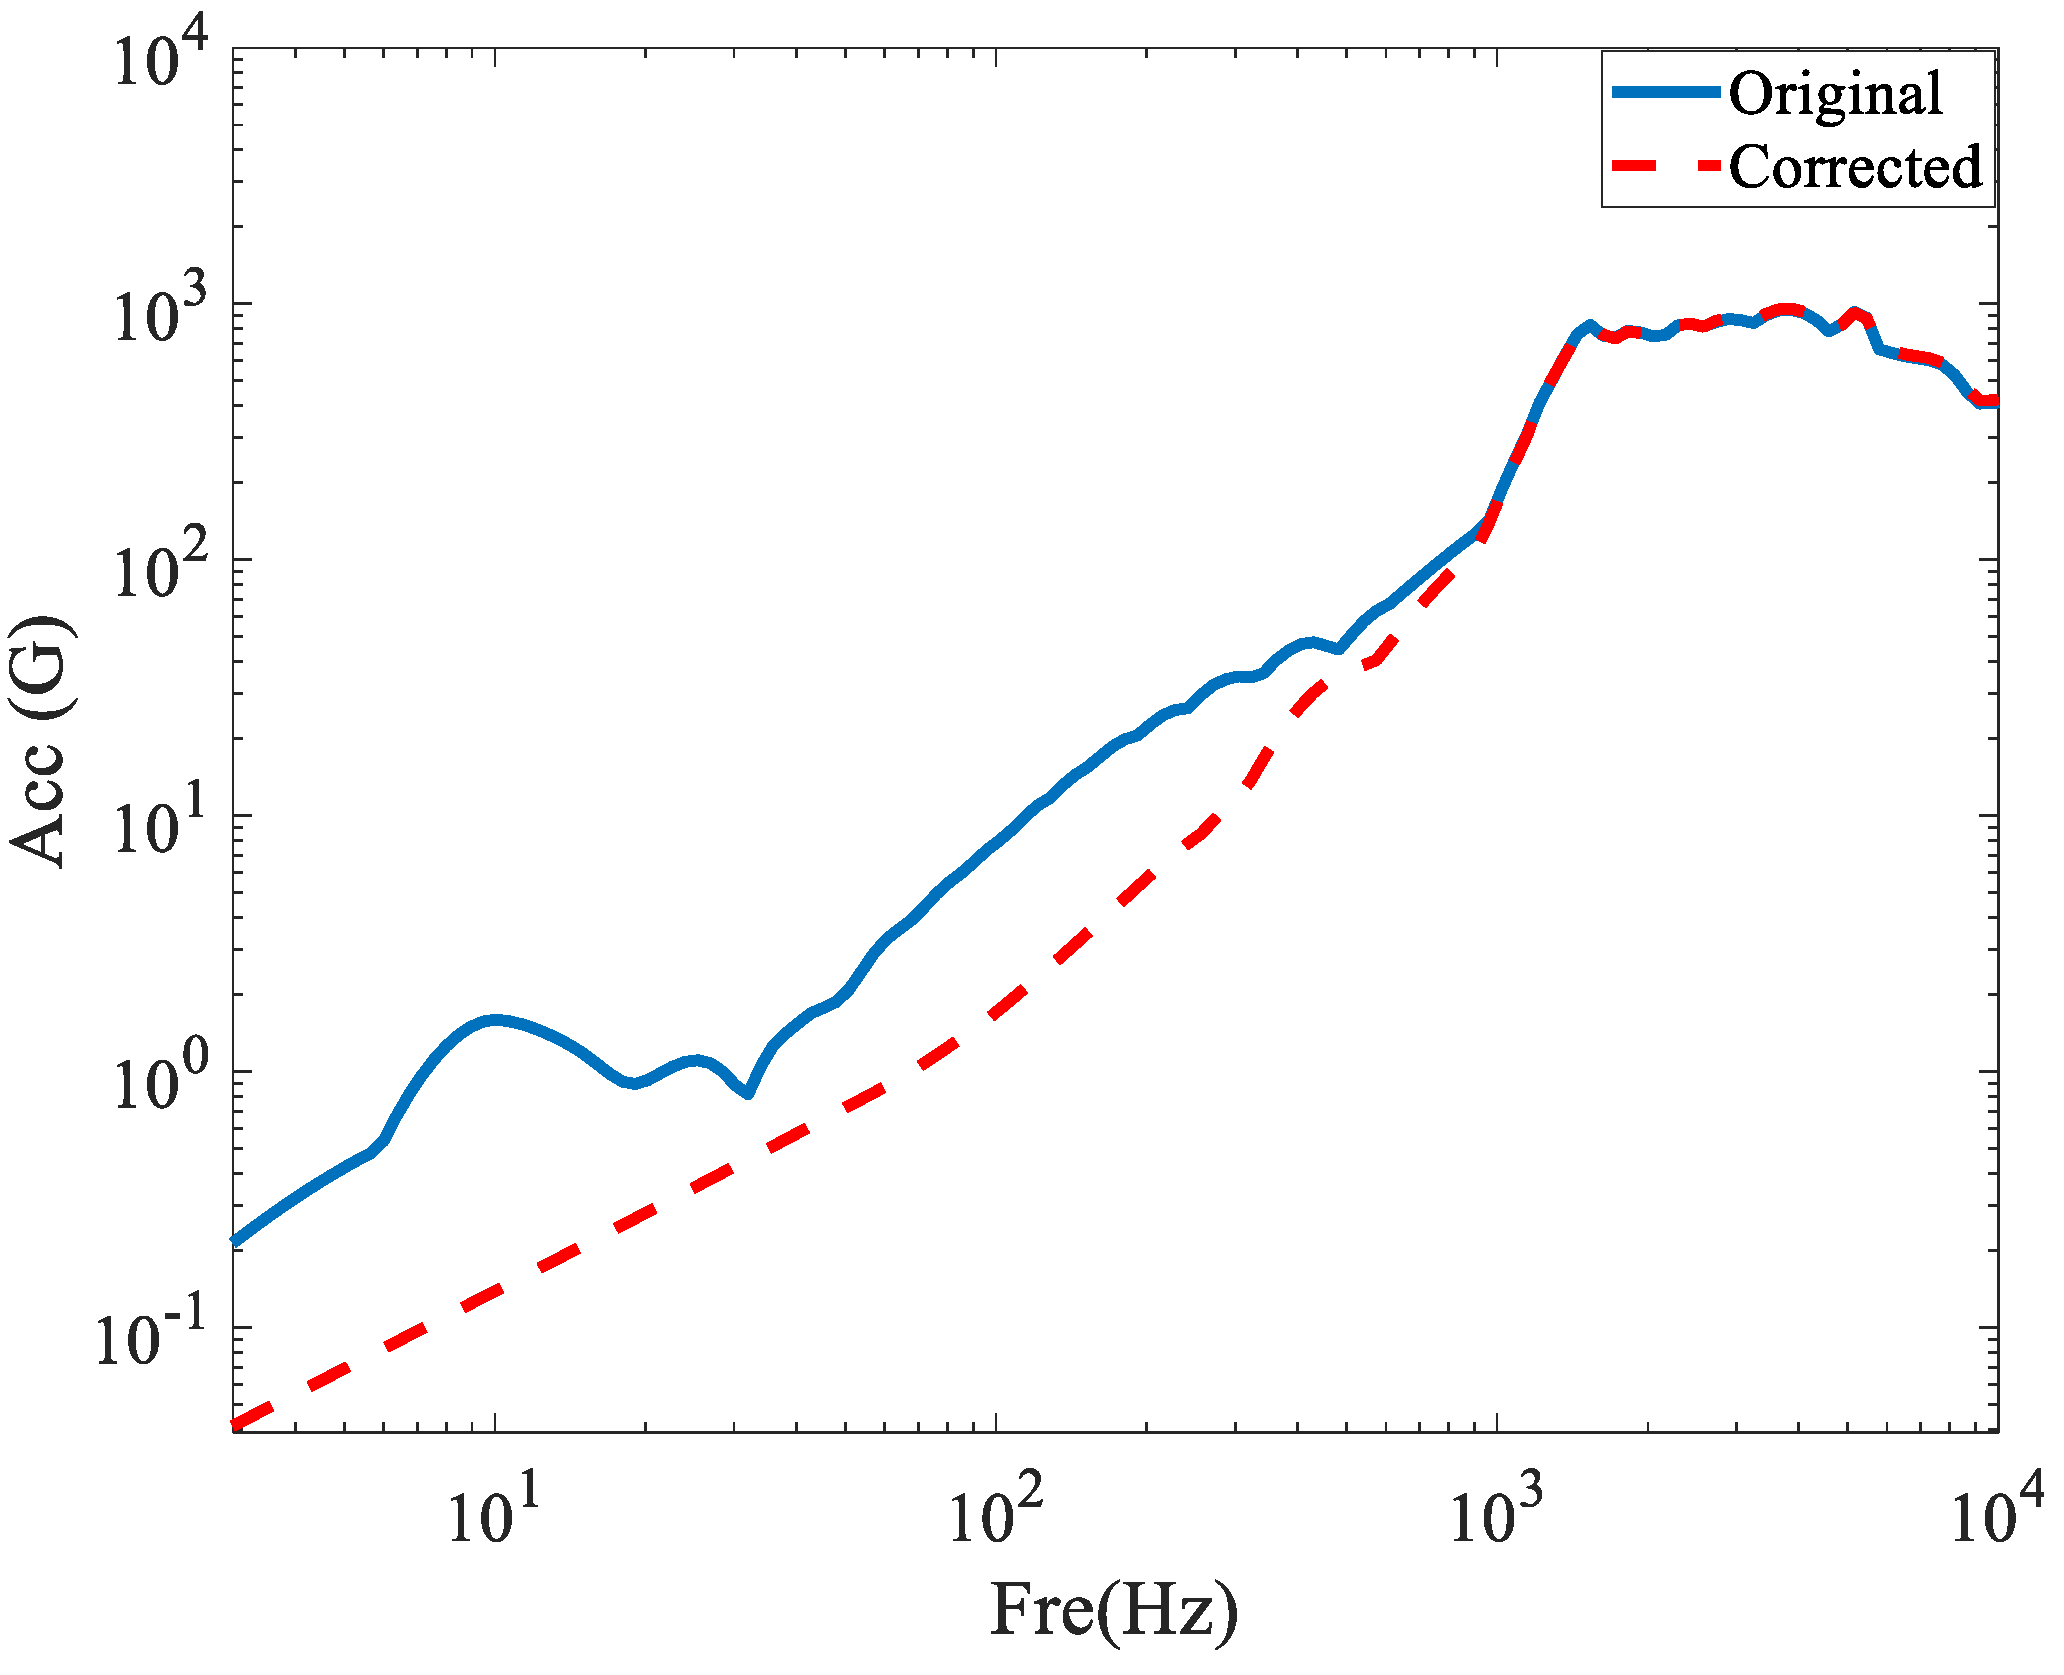
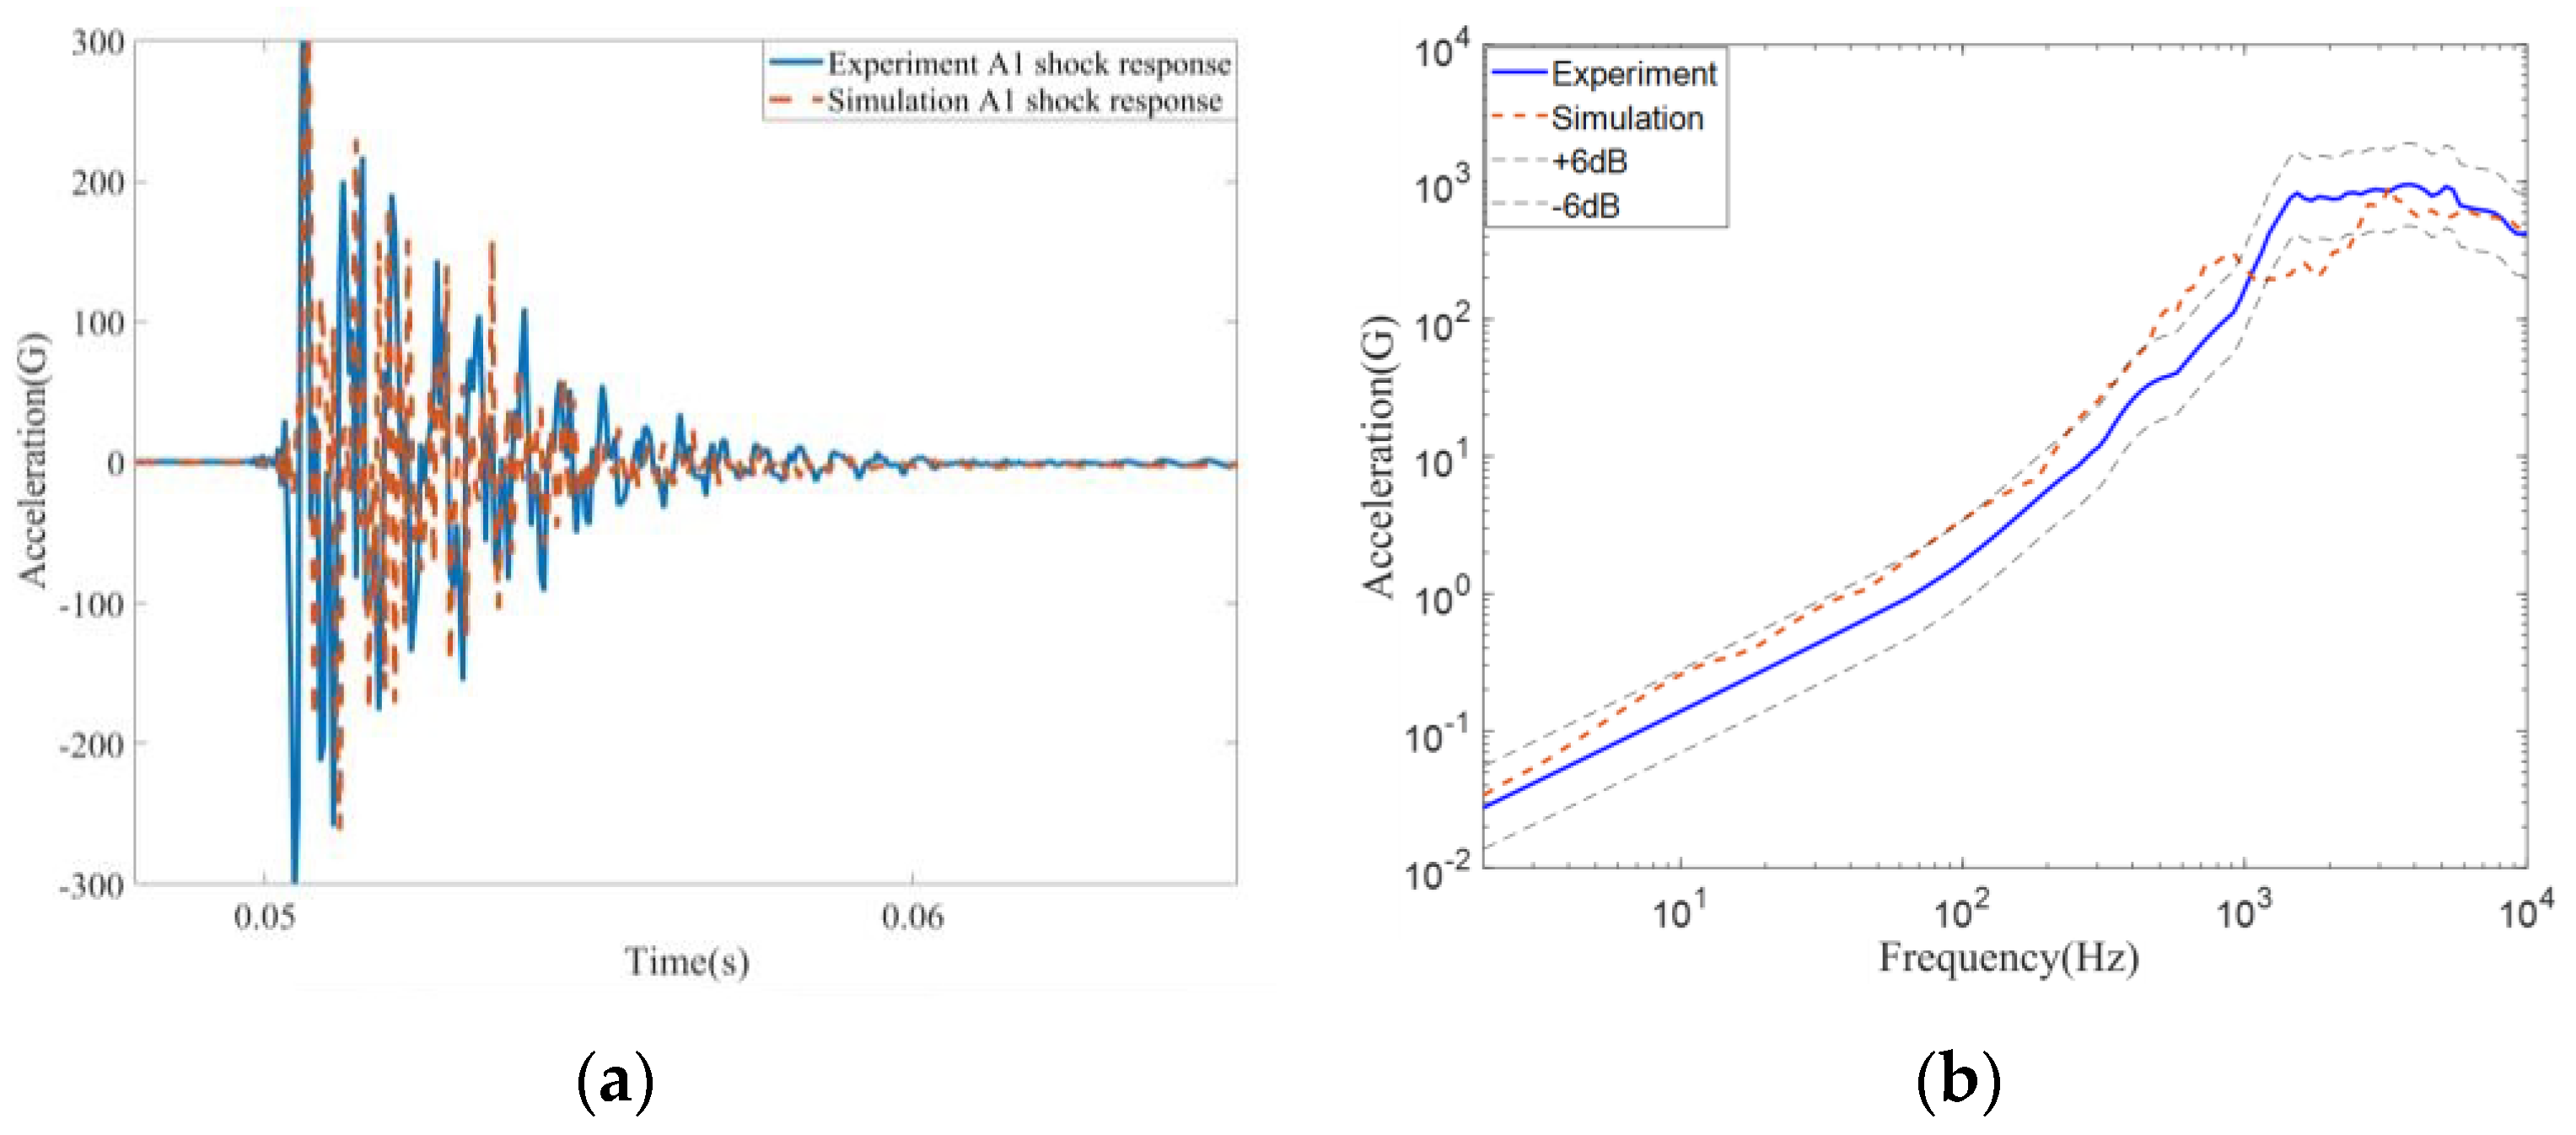
3.4. Experimental Results

Figure 21 shows numerical and experimental results of the original interface at gauge A1. The accuracy of the FE model can be verified, with the SRS calculated by simulations enveloped by a ±6 dB offset of SRSs from experiments for most of the frequency range. Although some frequency ranges exhibit deviations from the envelope due to FE modeling simplifications, the consistency between simulation and test experiment results is satisfactory for aerospace engineering.
To deal with the typical time-varying shock signals via the spacecraft–rocket interface, the short time Fourier transform (STFT) is also utilized in this article, where Figure 22a shows an attenuated signal of the original structure with high magnitude, a very short duration, and a wide frequency range from 0 to 9000 Hz. The modified structure exhibits dynamic responses primarily concentrated within the frequency ranges of [0–800] Hz and [2500–7000] Hz, as shown in Figure 22b. The energy at [1000–2200] Hz and beyond 7000 Hz in the response is essentially eliminated.
The results show that the Pyroshock response dissipates as the stress wave propagates through the structural interface. Due to the change in the structure on the interface, the original structure has limited capacity to suppress the Pyroshock response.
In addition, Figure 23 compares the SRSs of the original and modified structures of the spacecraft–rocket interface. The attenuation of the relative coefficients Er and Mr from the interface from A2 to A1 is 70.61% for the mean value and 65.03% for the maximum value. The declining rate of Er and Mr is significantly increased, which indicates that the honeycomb structure has sufficient capacity for Pyroshock. It also demonstrates the feasibility of the modified structure for aerospace engineering applications.

4. Results and Discussion

In this section, FE models of honeycomb structures with different wall length l and thickness t of the cell element are established to investigate the Pyroshock isolation strategies proposed in Section 2.2 and to find its optimal solution.

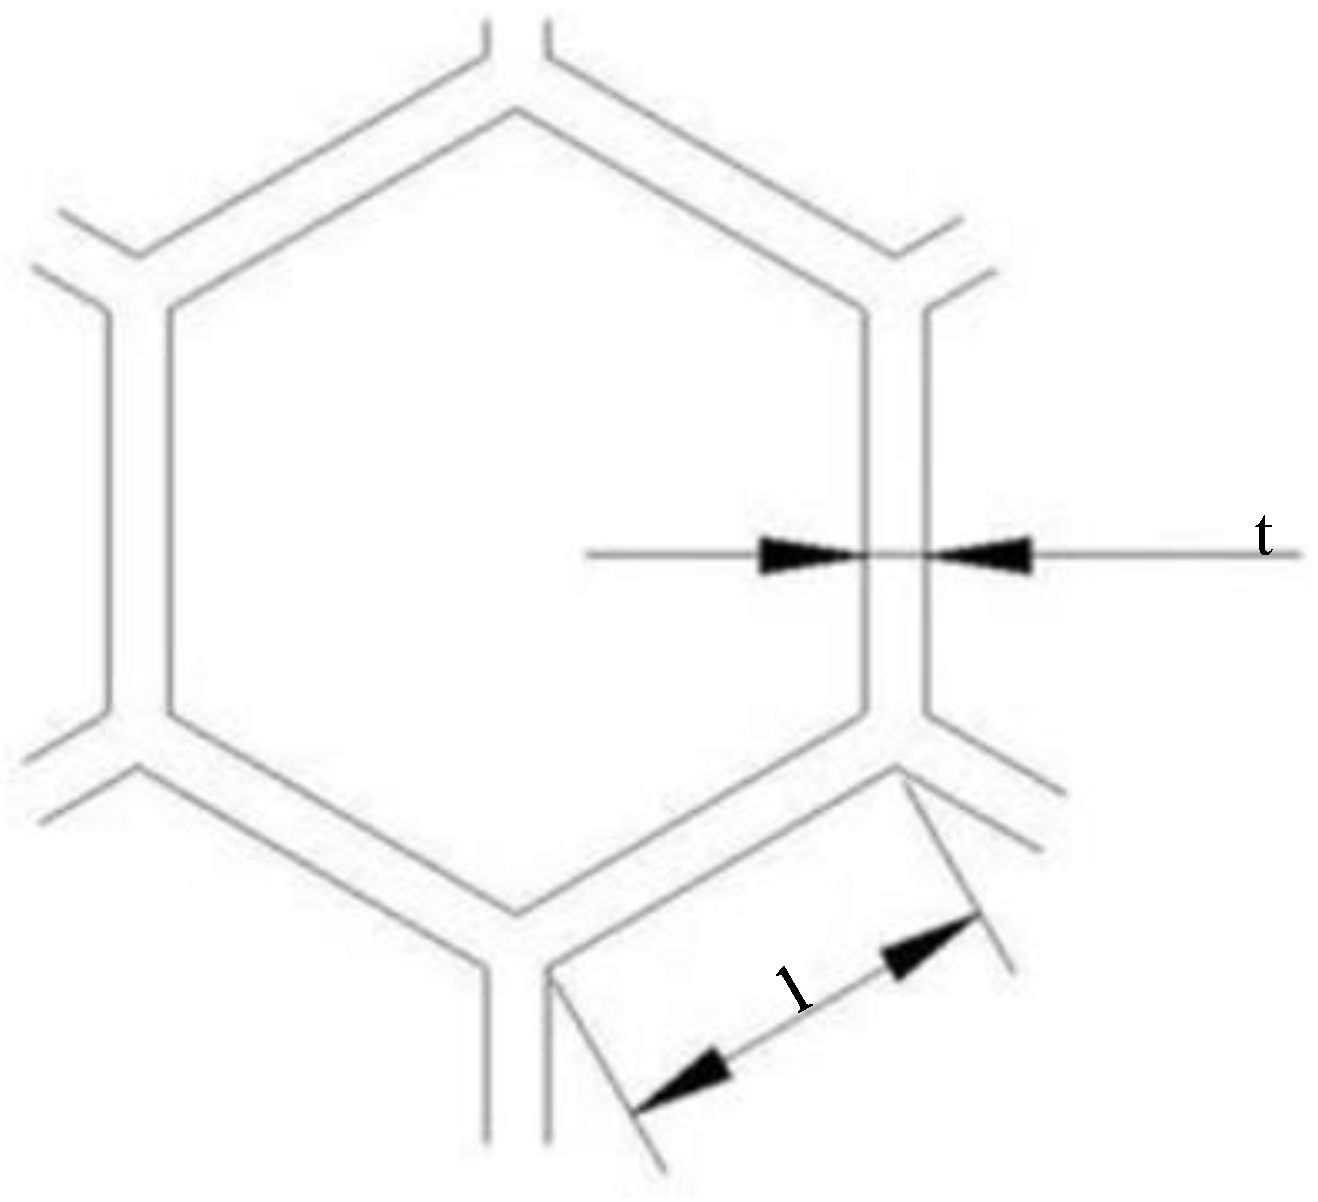
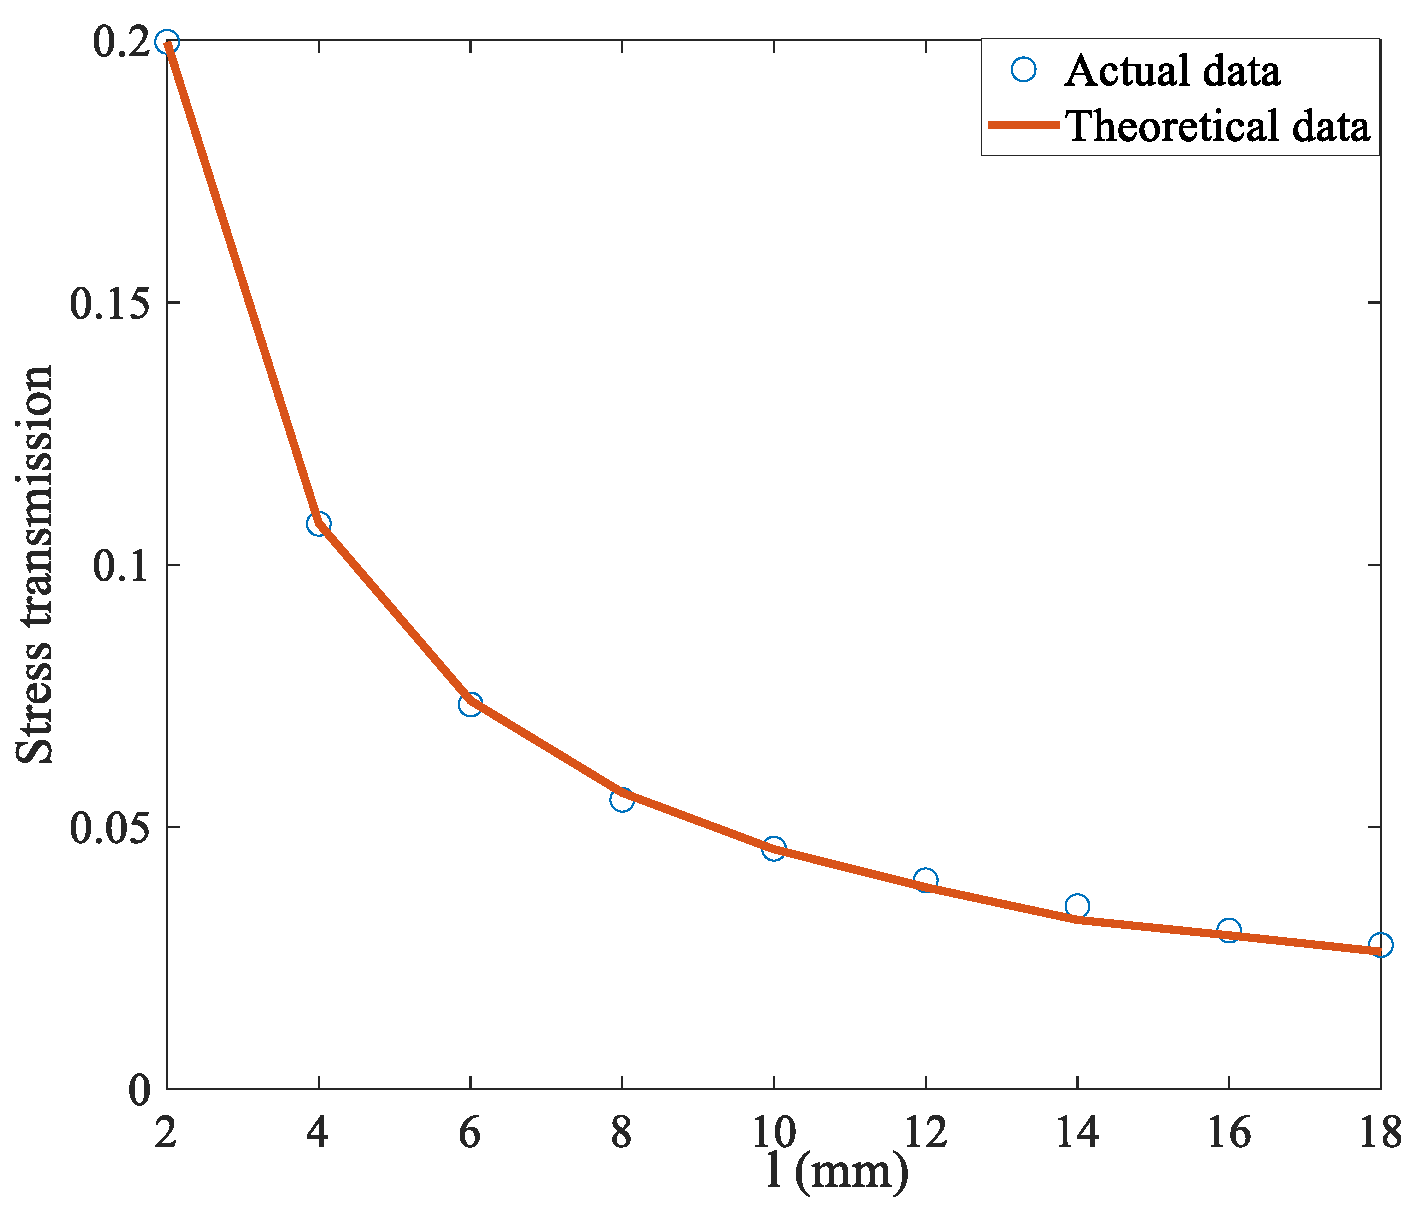
4.1. Effect of Honeycomb Cell Wall Length on Stress Propagation

To clearly study the effect, the wall length l is set up from 4 to 12 mm with the step size of 2 mm, as shown in Figure 24. Other geometrical parameters are assigned as a constant valve, that is, the cell wall thickness as 0.1 mm and height as 15 mm.
The results obtained from the parameter analysis of l are presented in Figure 25. As the cell wall length of the honeycomb increases, the honeycomb panel gradually increases its ability to weaken stress waves and then tapers to a flattening. Using the results in Equation (12), we can obtain the stress transmission rate of different wall lengths. The stress transmission rate decreases gradually with the increase in the cell element wall length. When the cell wall thickness t = 0.1, the cell wall length of the honeycomb decreases rapidly in the range of 2 to 8 mm, and the rate of decay becomes slower after 8 mm. This is because the area of a single cell becomes larger as the length of the cell wall increases, resulting in an increase in the area ratio. Since the stiffness of the honeycomb structure becomes inadequate to ensure the bearing load and base frequency for l ≥ 10 mm, the wall length l should not be too large. The results of Figure 25b indicate that a wall length value of 8 mm is recommended for both good shock isolation performance and reasonable dimension for manufacture.

4.2. Effect of Honeycomb Cell Wall Thickness on Stress Propagation

In this section, as shown in Figure 26, the height of the honeycomb cell structure is 15 mm, the wall length of the cell is 8 mm, and the cell wall thickness of the honeycomb is assigned as 0.05, 0.1, 0.2, 0.3, and 0.4 mm.
As shown in Figure 27, as the cell wall thickness increases, both Er and Mr increase. An approximate positive correlation could be found between thickness t, and Er and Mr. The above phenomenon indicates that as the cell wall thickness of the honeycomb structure increases, the honeycomb panel gradually decreases its ability to weaken stress waves. As the wall thickness of the honeycomb structure increases, the weight of the honeycomb structure also increases considerably. The transmittance of different cell wall thicknesses can be obtained from the calculation of Equation (11). The stress transmission rate gradually increases with the increase in cell wall thickness, which is not beneficial to Pyroshock isolation. The main goal of incorporating a honeycomb structure into a spacecraft is to achieve a more desirable shock isolation effect with low weight gain. It is important to note that the cell wall thickness t of the honeycomb structure should only be sufficient to meet operational requirements. For this reason, a cell wall thickness t of 0.1 mm is selected.

5. Conclusions

In this article, the Pyroshock isolation strategies of a kind of spacecraft–rocket interface using honeycomb are investigated based on FE simulation and experimental methods to evaluate their Pyroshock isolation performance. The shock resistance characteristics are also analyzed for different parameters, such as cell wall length and thickness of the honeycomb structure, via the average relative coefficient Er and the maximum relative coefficient Mr of the SRS. From the results of the analytical solutions, the following conclusions are drawn:
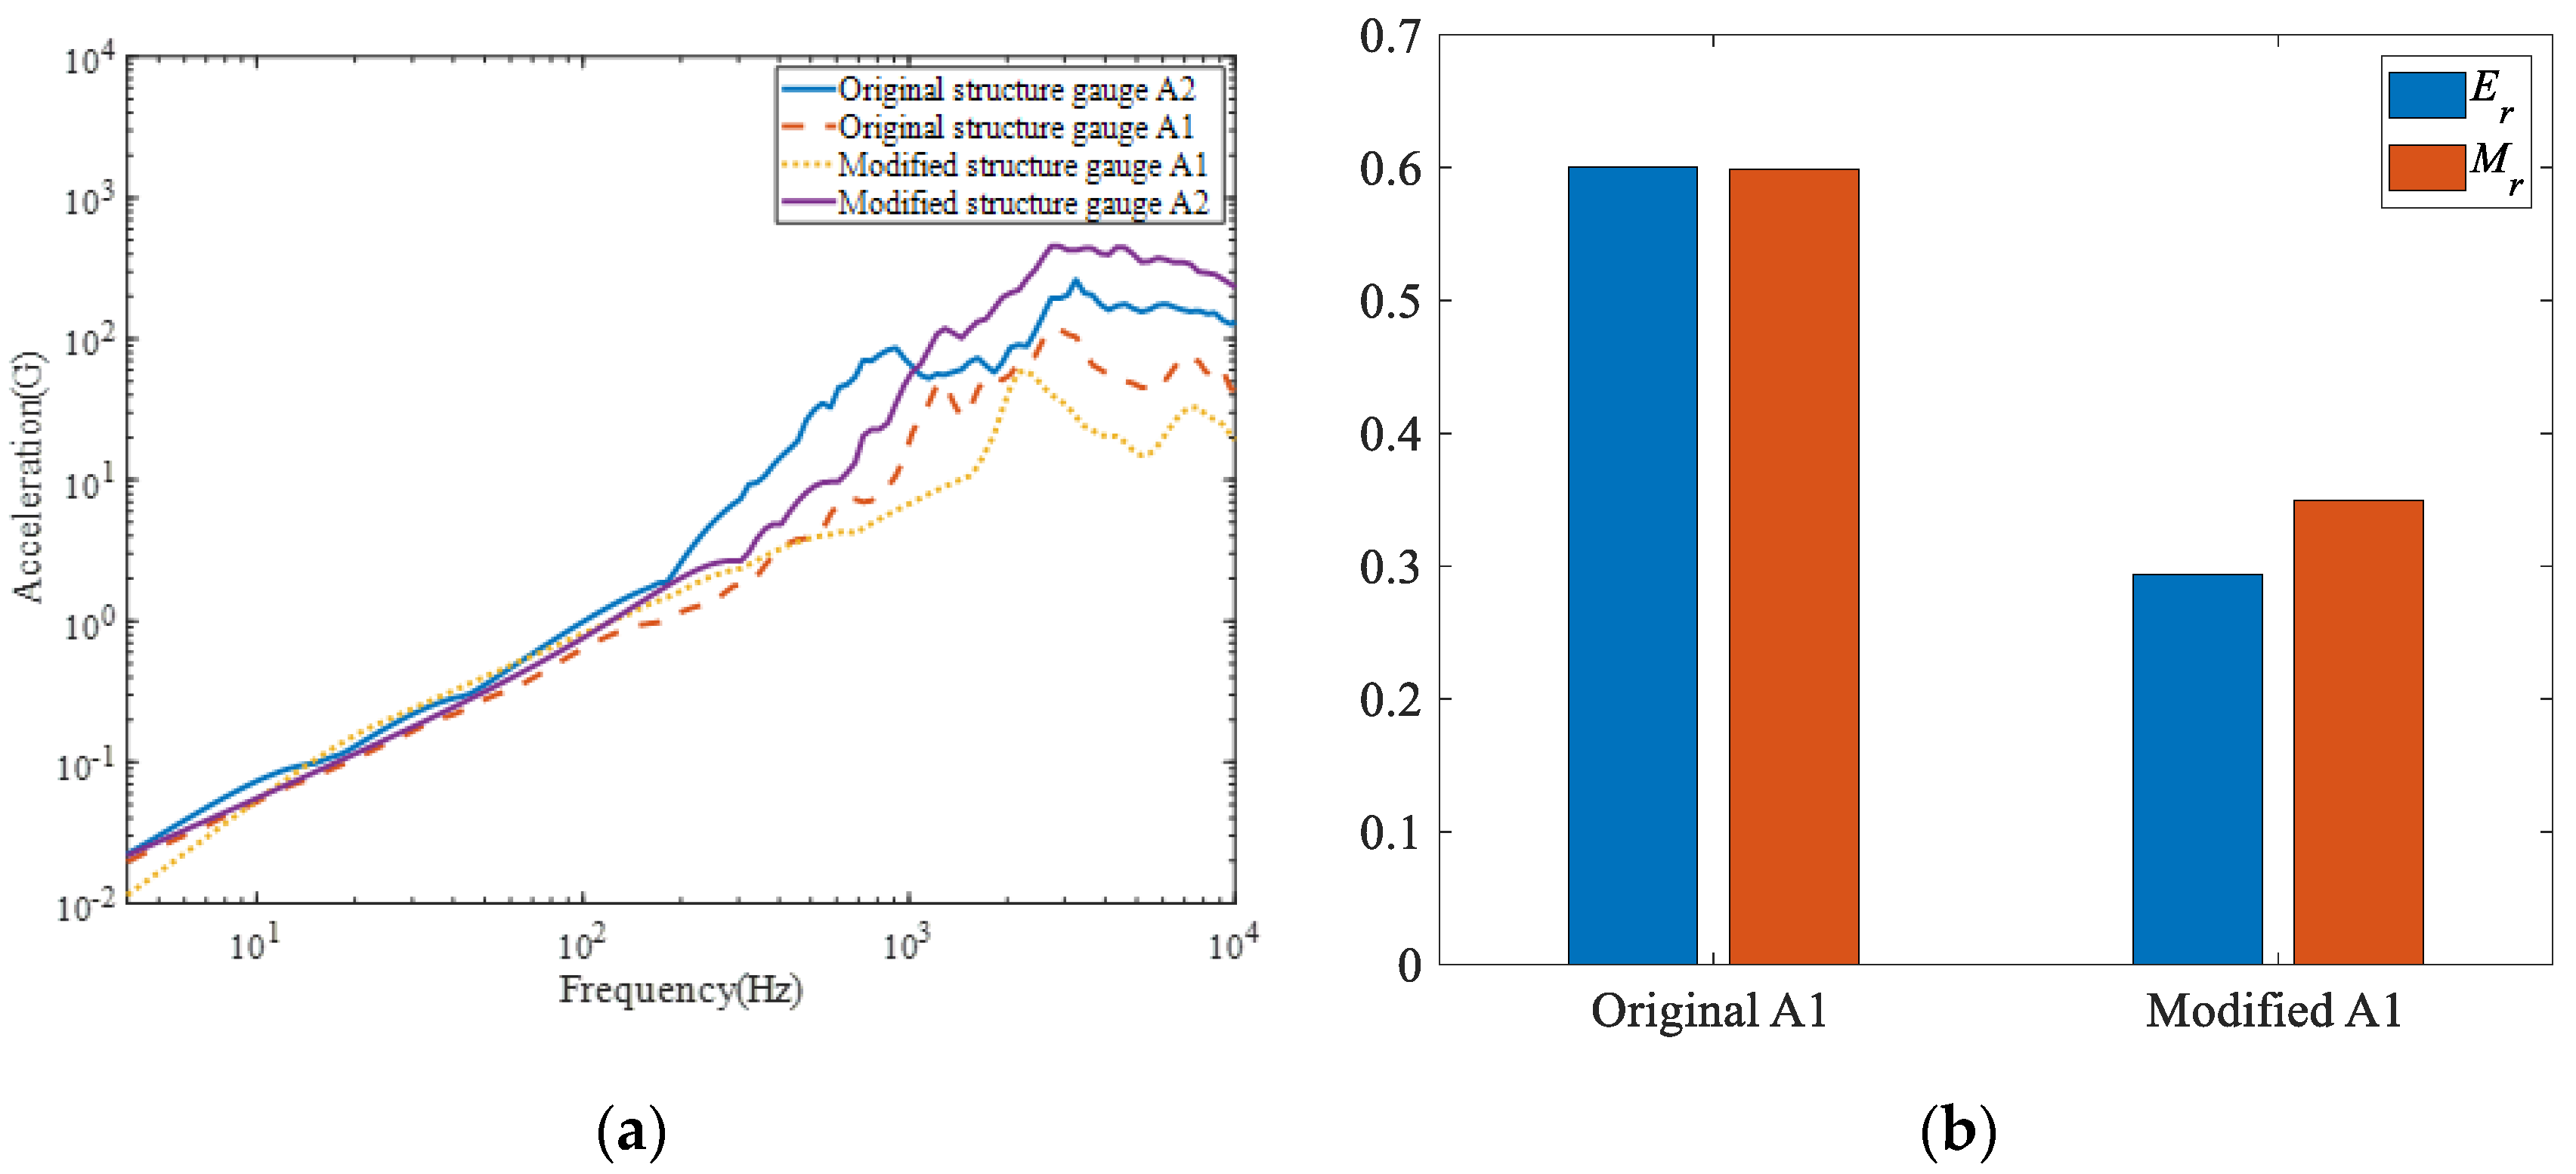
  • The new kind of spacecraft–rocket interface is conducive to achieving shock isolation, and the results of the FE model and the experimental results are in good agreement. The honeycomb structure can effectively reduce the propagation of stress waves, which can achieve a reduction in Mr of more than 65%.
  • The SRS decreases with the increase in cell wall length thickness and the decrease in cell wall length, which indicates that small thickness and greater length is beneficial for shock isolation.
  • Based on this study, the optimized geometric dimension of the honeycomb structure against Pyroshock is obtained when the cell wall length and cell wall thickness of the honeycomb are 8 mm and 0.1 mm, respectively.

Author Contributions

Methodology, X.W.; Validation, D.C.; Formal analysis, Z.G.; Investigation, X.W.; Writing—original draft, Z.G.; Writing—review & editing, X.W., D.C., X.D., T.Y., Z.Q. and F.C.; Funding acquisition, X.W. and Z.Q. All authors have read and agreed to the published version of the manuscript.

Funding

This work was supported by Science and Technology Support Plan for Youth Innovation of Colleges and Universities of Shandong Province of China (Grant No. 2023KJ240) and the National Natural Science Foundation of China (Grant Nos. 11902286 and 11972204).

Data Availability Statement

The original contributions presented in the study are included in the article, further inquiries can be directed to the corresponding author.

Conflicts of Interest

Author Xuchen Deng was employed by the company China Nuclear Power Engineering Co., Ltd. The remaining authors declare that the research was conducted in the absence of any commercial or financial relationships that could be construed as a potential conflict of interest.

References

  1. Lee, J.R.; Chia, C.C.; Kong, C.W. Review of Pyroshock wave measurement and simulation for space systems. Measurement 2012, 45, 631–642. [Google Scholar] [CrossRef]
  2. Moening, C. Pyrotechnic shock flight failures. In Institute of Environmental Sciences Pyrotechnic Shock Tutorial Program, 31st Annual Technical Meeting; Citeseer: Las Vegas, NV, USA, 1985; pp. 4–5. [Google Scholar]
  3. Daniel, R. Pyroshock Test Criteria. NASA-STD-7003A; NASA Technical Standard; NASA: Washington, DC, USA, 2011. Available online: https://www.docin.com/p-369312963.html (accessed on 3 September 2024).
  4. Girard, A.; Pont, C.; Courau, E. Very first results from pyroshock database for satellites, Spacecraft Structures. In Proceedings of the Spacecraft Structures, Materials and Mechanical Testing 2005, Noordwijk, The Netherlands, 10–12 May 2005; p. 127. [Google Scholar]
  5. Smallwood, D.O. An Improved Recursive Formula for Calculating Shock Response Spectra; S.N. Laboratories: Albuquerque, NM, USA, 1981. [Google Scholar]
  6. Bateman, V.; Merritt, R. Validation of Pyroshock Data. J. IEST 2012, 55, 40–56. [Google Scholar] [CrossRef]
  7. Anderson, A.; Bait, J.; Bell, D. MIL-STD-810F-2000 Test Method Standard for Environmental Engineering Considerations and Laboratory Tests; The US Department of Defense: Washington, DC, USA, 2000.
  8. Yan, H.; Qin, Z.; Chu, F.; Zhang, W.; Yang, Z.; Ming, A.; Wang, X. Dynamic Response of Aluminum Honeycomb Panels to High-Frequency Laser Shock Excitations. J. Spacecr. Rocket. 2020, 57, 198–201. [Google Scholar] [CrossRef]
  9. Iwasa, T.; Shi, Q. Simplified Analysis Model for Predicting Pyroshock Responses on Composite Panel. J. Space Eng. 2008, 1, 79–90. [Google Scholar] [CrossRef]
  10. Velmurugan, R.; Najeeb, E.M. Study of Far-Field Pyroshock Responses of Composite Panels. J. Vib. Acoust.-Trans. ASME 2014, 136, 031014. [Google Scholar] [CrossRef]
  11. Ding, J.F. Shock isolation of satellite-rocket separation and its test verification. Struct. Environ. Eng. 2016, 43, 17–24. [Google Scholar]
  12. Park, H.S.; Hwang, D.H.; Han, J.H.; Yang, J.Y. Development of shock-absorbing insert for honeycomb sandwich panel. Aerosp. Sci. Technol. 2020, 104, 105930. [Google Scholar] [CrossRef]
  13. Ma, Y.; Zhang, Q.; Zhang, D.; Scarpa, F.; Liu, B.; Hong, J. The mechanics of shape memory alloy metal rubber. Acta Mater. 2015, 96, 89–100. [Google Scholar] [CrossRef]
  14. Lu, X.; Jiang, K.; Cheng, S.; Su, D.; Wang, H. Prediction and isolation of pyroshock in typical pyrotechnic device based on coupled modeling technique. Thin-Walled Struct. 2022, 177, 109393. [Google Scholar] [CrossRef]
  15. Ciepielewski, R.; Gieleta, R.; Miedzinska, D. Experimental Study on Static and Dynamic Response of Aluminum Honeycomb Sandwich Structures. Materials 2022, 15, 1793. [Google Scholar] [CrossRef] [PubMed]
  16. Norris, C.B. An Analysis of the Compressive Strength of Honeycomb Cores for Sandwich Construction; No. NACA-TN-1251; National Advisory Committee for Aeronautics: Washington, DC, USA, 1947. [Google Scholar]
  17. Gunes, R.; Arslan, K. Development of numerical realistic model for predicting low-velocity impact response of aluminium honeycomb sandwich structures. J. Sandw. Struct. Mater. 2016, 18, 95–112. [Google Scholar] [CrossRef]
  18. Venugopal, A.; Venugopal, P.; Thomas, B.G.; Koshy, C.P.; Varghese, J.T. Numerical Study on Aluminium 5056 Alloy Hexagonal Honeycomb Cells as a Possible Material for Energy Absorption During Vehicle Crash. Trans. Indian Inst. Met. 2023, 76, 2515–2524. [Google Scholar] [CrossRef]
  19. Qi, C.; Jiang, F.; Yang, S. Advanced honeycomb designs for improving mechanical properties: A review. Compos. Part B-Eng. 2021, 227, 109393. [Google Scholar] [CrossRef]
  20. Lin, Y.L.; Zhang, Z.F.; Chen, R.; Li, Y.; Wen, X.J.; Lu, F.Y. Cushioning and Energy Absorbing Property of Combined Aluminum Honeycomb. Adv. Eng. Mater. 2015, 17, 1434–1441. [Google Scholar] [CrossRef]
  21. Najeeb, E.M.; Velmurugan, R. Effect of fiber orientations of composite panels under far-field Pyroshock. Polym. Compos. 2019, 40, 255–262. [Google Scholar] [CrossRef]
  22. NASA-HDBK-7005; Dynamic Enviromental Criteria. Jet Propulsion Laboratory, National Aeronautics and Space Administration: Pasadena, CA, USA, 2017. Available online: https://www.abbottaerospace.com/downloads/nasa-hdbk-7005/ (accessed on 3 September 2024).
  23. Mao, Y.J.; Yue, X.H.; Huang, H.Y.; Niu, B.L.; Huang, H.J. Experimental study on Pyroshock responses of a conical shell. Appl. Mech. Mater. 2010, 20, 1458–1462. [Google Scholar] [CrossRef]
  24. Bement, L.J.; Schimmel, M.L. A Manual for Pyrotechnic Design, Development and Qualification; NASA Technical Reports Server: Hampton, VA, USA, 1995.
  25. Harris, C.M. Harris’ Shock and Vibration Handbook; McGraw-Hill: New York, NY, USA, 2017. [Google Scholar]
  26. Lyu, X.; Sheng, H.; He, M.; Ding, Q.; Tang, L.; Yang, T. Satellite vibration isolation using periodic acoustic black hole structures with ultrawide bandgap. J. Vib. Acoust. 2023, 145, 014501. [Google Scholar] [CrossRef]
  27. Lee, J.; Han, J.H.; Lee, Y.; Lee, H. Separation characteristics study of ridge-cut explosive bolts. Aerosp. Sci. Technol. 2014, 39, 153–168. [Google Scholar] [CrossRef]
  28. IEST-RP-DTE032; IEST Design, Test, and Evaluation Division (WG-DTE032). Pyroshock Testing Techniques. 2. Recommended Practice for Pyroshock Testing. ANSI: Washington, DC, USA, 2009. Available online: https://webstore.ansi.org/standards/iest/iestrpdte032 (accessed on 3 September 2024).
  29. MIL-STD-810G; Environmental Test Methods and Engineering Guides. United States Military Standard: Washington, DC, USA, 2009.
  30. Thomson, W. Theory of Vibration with Applications; CRC Press: Boca Raton, FL, USA, 1996. [Google Scholar]
  31. Qin, Z.Y.; Yan, S.Z.; Chu, F.L. Analytical modeling of clamp band joint under external bending moment. Aerosp. Sci. Technol. 2013, 25, 45–55. [Google Scholar] [CrossRef]
Figure 1. Pyroshock separators and installation locations.
Aerospace 11 00756 g001
Figure 2. Honeycomb structure.
Aerospace 11 00756 g002
Figure 3. The original spacecraft–rocket interface. For stress wave theory of the 1D rod model, longitudinal displacements are assumed to be constant at all points along the cross-section and are expressed as a variate in the form of u = u(x,t) related to time t and coordinate x. The governing equation of free longitudinal vibrations can be obtained as:.
Aerospace 11 00756 g003
Figure 4. Schematic of a stepped rod: (a) single-step rod; (b) necked rod.
Aerospace 11 00756 g004
Figure 5. Stress transmittance rate by area rate.
Aerospace 11 00756 g005
Figure 6. Honeycomb cores are arranged in plywood.
Aerospace 11 00756 g006
Figure 7. Schematic diagram of a single cell.
Aerospace 11 00756 g007
Figure 8. Effect of honeycomb cell thickness on actual and theoretical data.
Aerospace 11 00756 g008
Figure 9. Effect of honeycomb cell wall length on actual and theoretical dates.
Aerospace 11 00756 g009
Figure 10. Assembly of the spacecraft–rocket interface with the honeycomb structure.
Aerospace 11 00756 g010
Figure 11. Front view of the model: (a) original structure; (b) modified structure.
Aerospace 11 00756 g011
Figure 12. Side view of the model: (a) original structure; (b) modified structure.
Aerospace 11 00756 g012
Figure 13. Er and Mr at A2.
Aerospace 11 00756 g013
Figure 14. Von Mises stress in the original structure: (a) t = 0 μs; (b) t = 200 μs; (c) t = 700 μs; (d) t = 900 μs; (e) t = 1800 μs; (f) t = 10,000 μs.
Aerospace 11 00756 g014
Figure 15. Von Mises stress in the modified structure: (a) t = 0 μs; (b) t = 200 μs; (c) t = 700 μs; (d) t = 900 μs; (e) t = 1800 μs; (f) t = 10,000 μs.
Aerospace 11 00756 g015
Figure 16. Schematic diagram of experiments: (a) original structure; (b) modified structure.
Aerospace 11 00756 g016
Figure 17. Test schematic diagram.
Aerospace 11 00756 g017
Figure 18. Differences between positive and negative SRS.
Aerospace 11 00756 g018
Figure 19. Comparison of original and corrected signals.
Aerospace 11 00756 g019
Figure 20. Comparison of original and corrected SRS.
Aerospace 11 00756 g020
Figure 21. Result comparison between experiment and simulation at the A1 Gauge: (a) time history; (b) SRS.
Aerospace 11 00756 g021
Figure 22. Time–frequency analysis of A2: (a) original structure; (b) modified structure.
Aerospace 11 00756 g022
Figure 23. The original and modified structure: (a) SRSs; (b) Er and Mr at A1.
Aerospace 11 00756 g023
Figure 24. Different honeycomb cell wall lengths: (a) l = 4 mm; (b) l = 6 mm; (c) l = 12 mm.
Aerospace 11 00756 g024
Figure 25. Effect of honeycomb cell wall length: (a) SRS of different lengths; (b) Er and Mr of different lengths.
Aerospace 11 00756 g025
Figure 26. Different honeycomb cell wall thicknesses: (a) t = 0.1 mm; (b) t = 0.2 mm; (c) t = 0.4 mm.
Aerospace 11 00756 g026
Figure 27. Effect of cell wall thickness: (a) SRS of different thicknesses; (b) Er and Mr of different thicknesses.
Aerospace 11 00756 g027
Table 1. Material parameters for honeycomb structures.
ParametersAISI1045ASTM201Units
Density (ρ)7.87.8g/cm3
Elasticity moduls (E)210190GPa
Poisson ratio (μ)0.330.305
Yield stress (σY)0.3550.269GPa
Tangential moduls2119GPa
Table 2. Geometric dimensions.
ParametersSymbolValueUnits
Height of connectionHj145mm
Length of interfaceLj210mm
Width of interfaceWj180mm
Thickness of interfaceTj15mm
Diameter of interfacej45mm
Interface areaAo37,800mm2
Thickness of the honeycomb cell wallT0.8mm
Length of the honeycomb cell wallL8mm
Heihgt of the honeycomb cell wallH15mm
Thickness of the honeycomb damping insertTh139mm
Length of the honeycomb damping insertLh169mm
Heihgt of the honeycomb damping insertHh240mm
Table 3. Parameters of accelerometers.
ParametersValueUnits
Sensitivity ± 10%0.5mV/g
Sampling Frequency20kHz
Maximum Range10,000g
Mounted Resonant Frequency>90kHz
Frequency Response, ±5%0.49–10,000Hz
Frequency Response, ±10%0.33–20,000Hz
Frequency Response, ±3 db0.16–50,000Hz
Disclaimer/Publisher’s Note: The statements, opinions and data contained in all publications are solely those of the individual author(s) and contributor(s) and not of MDPI and/or the editor(s). MDPI and/or the editor(s) disclaim responsibility for any injury to people or property resulting from any ideas, methods, instructions or products referred to in the content.

