Abstract
A model-based surface fluvial erosion and deposition approach was adapted to Martian conditions to forecast the potential locations for shallow subsurface sampling by the Rosalind Franklin ExoMars rover at Oxia Planum. While remote and on-site images show only the surface visible features, former fluvial-related accumulation sites might be hidden. During the fluvial activity, most accumulation-related areas are interesting with regard to clay-like sediments, which could adsorb organics effectively—such sites could be identified by modeling. By applying the SIMWE fluvial erosion/deposition model, substantial variability in accumulation and deposition-dominated areas with their specific pattern and spatial distribution could be outlined, indicating that sophisticated targeting of future sampling could use such a model-based approach. At the main valley-like feature, former water flow tracks were identified, as well as deposition-dominated locations, which are the best targets for shallow subsurface sampling. Joint evaluation of safety aspects like slope angle and loose sand dunes with scientific aspects provide the best sampling locations. Such model-based targeting is important as by using only orbital images, these locations could not be identified.
1. Introduction
The sampling of shallow subsurface regions on Mars is important because of better preservation and the occurrence of salts and ice there [1,2,3,4], although their access is difficult and requires energy and advanced technology. However, such drilling has been planned for several next missions, including the ESA-produced Franklin Rosalind ExoMars rover, as well as further missions [5]. Because of the difficulties, specific targeting even for a moderately shallow 1–2 m deep drill is important. These sampling attempts are mainly driven by astrobiology-related projects and aims [6,7,8], which usually target former wet locations, like fluvial valleys, lake sediments, and wet weathering-produced minerals.
As the surface of Mars is exposed to UV radiation, and without a global magnetic field or dense atmosphere, charge particles also bombard it; for an intact sample, roughly 1–2 m of deep drilling is required. However, the observable targets are visible only as surface landforms and often covered by dust or other recent aeolian sediments; thus, during the targeting of sampling, extrapolation to the shallow subsurface is needed. This work provides such a case study using fluvial erosion–deposition modeling surveys at a potential target region of Oxia Planum (the proposed landing site of the ExoMars rover), to see the differences in sedimentation and erosion-dominated locations by the modeled early fluvial processes.
The aim of this work is to test the Mars-adopted version of the presented SIMWE-based modified model, in order to support the targeting of shallow subsurface sampling at former accumulation-dominated fluvial sites, where the finest grains and possible adsorbed organics are present. However, as modeling of high spatial resolution and large areal data requires much time, effort, and computer power, the related model has not been applied to Mars before (being not in a mature state); here, the full landing area was not considered: only a smaller terrain section as a characteristic example of surface features types was considered, which provides a case study for further development.
The Target Area
The rationality of using the observable surface features is the following. As the duration and possible temporal recurrence of the flowing water-dominated period(s) are unknown, the hypothesis that followed here considers the last fluvial episode, which is representative of the topmost observable features in the area, as any deposits from any earlier flow events might have been transported and redeposited elsewhere. The localization of the finest-grained deposit is important because fine grains (clay category) composed of sediment have such a small grain size that absorbs the most effective organics and shows the highest potential to keep them intact at 1–2 m or deeper below the surface for a long period. The reason for this ideal shallow location type comes from the modeling and laboratory analysis of organic degradation processes, which are strong at the surface by ultraviolet radiation [9] and by the penetrating charged particle irradiation down to roughly about 1 m depth, [10] where the ionizing radiation decreases substantially. However, the exact depth values depend on several factors [10], mainly on the density of the regolith. Because of this effect, the drilling depth of the Rosalind Franklin ExoMars rover developed down to 2 m; here, we used it only for the scale of the order of the indicated 1 m.
At Oxia Planum, there is a Noachian-aged layered [11] phyllosilicate-rich bedrock at the bottom, see Figure 1 [12]. There, the area witnessed fluvial activity periods, producing a delta [13] and the long-lived Coogoon Vallis system [14] beside sinuous fluvial ridges [15] and paleolake signatures [16]. The importance of deposition-dominated terrains at Oxia Planum is that fine-grained phyllosilicates are expected to accumulate there, which supports an elevated concentration of the eroded Oxia Planum-based material. The estimation of the subsurface structure there is important as samples from at least 1 m depth are expected to have much better preservation potential of early bio-relevant materials. Outcrops at crater walls were surveyed previously at Oxia Planum [17]; here, a different model-based approach was applied to identify potential targets there and support such meter-scale deep drilling, which was planned to be realized by the ExoMars rover [18].

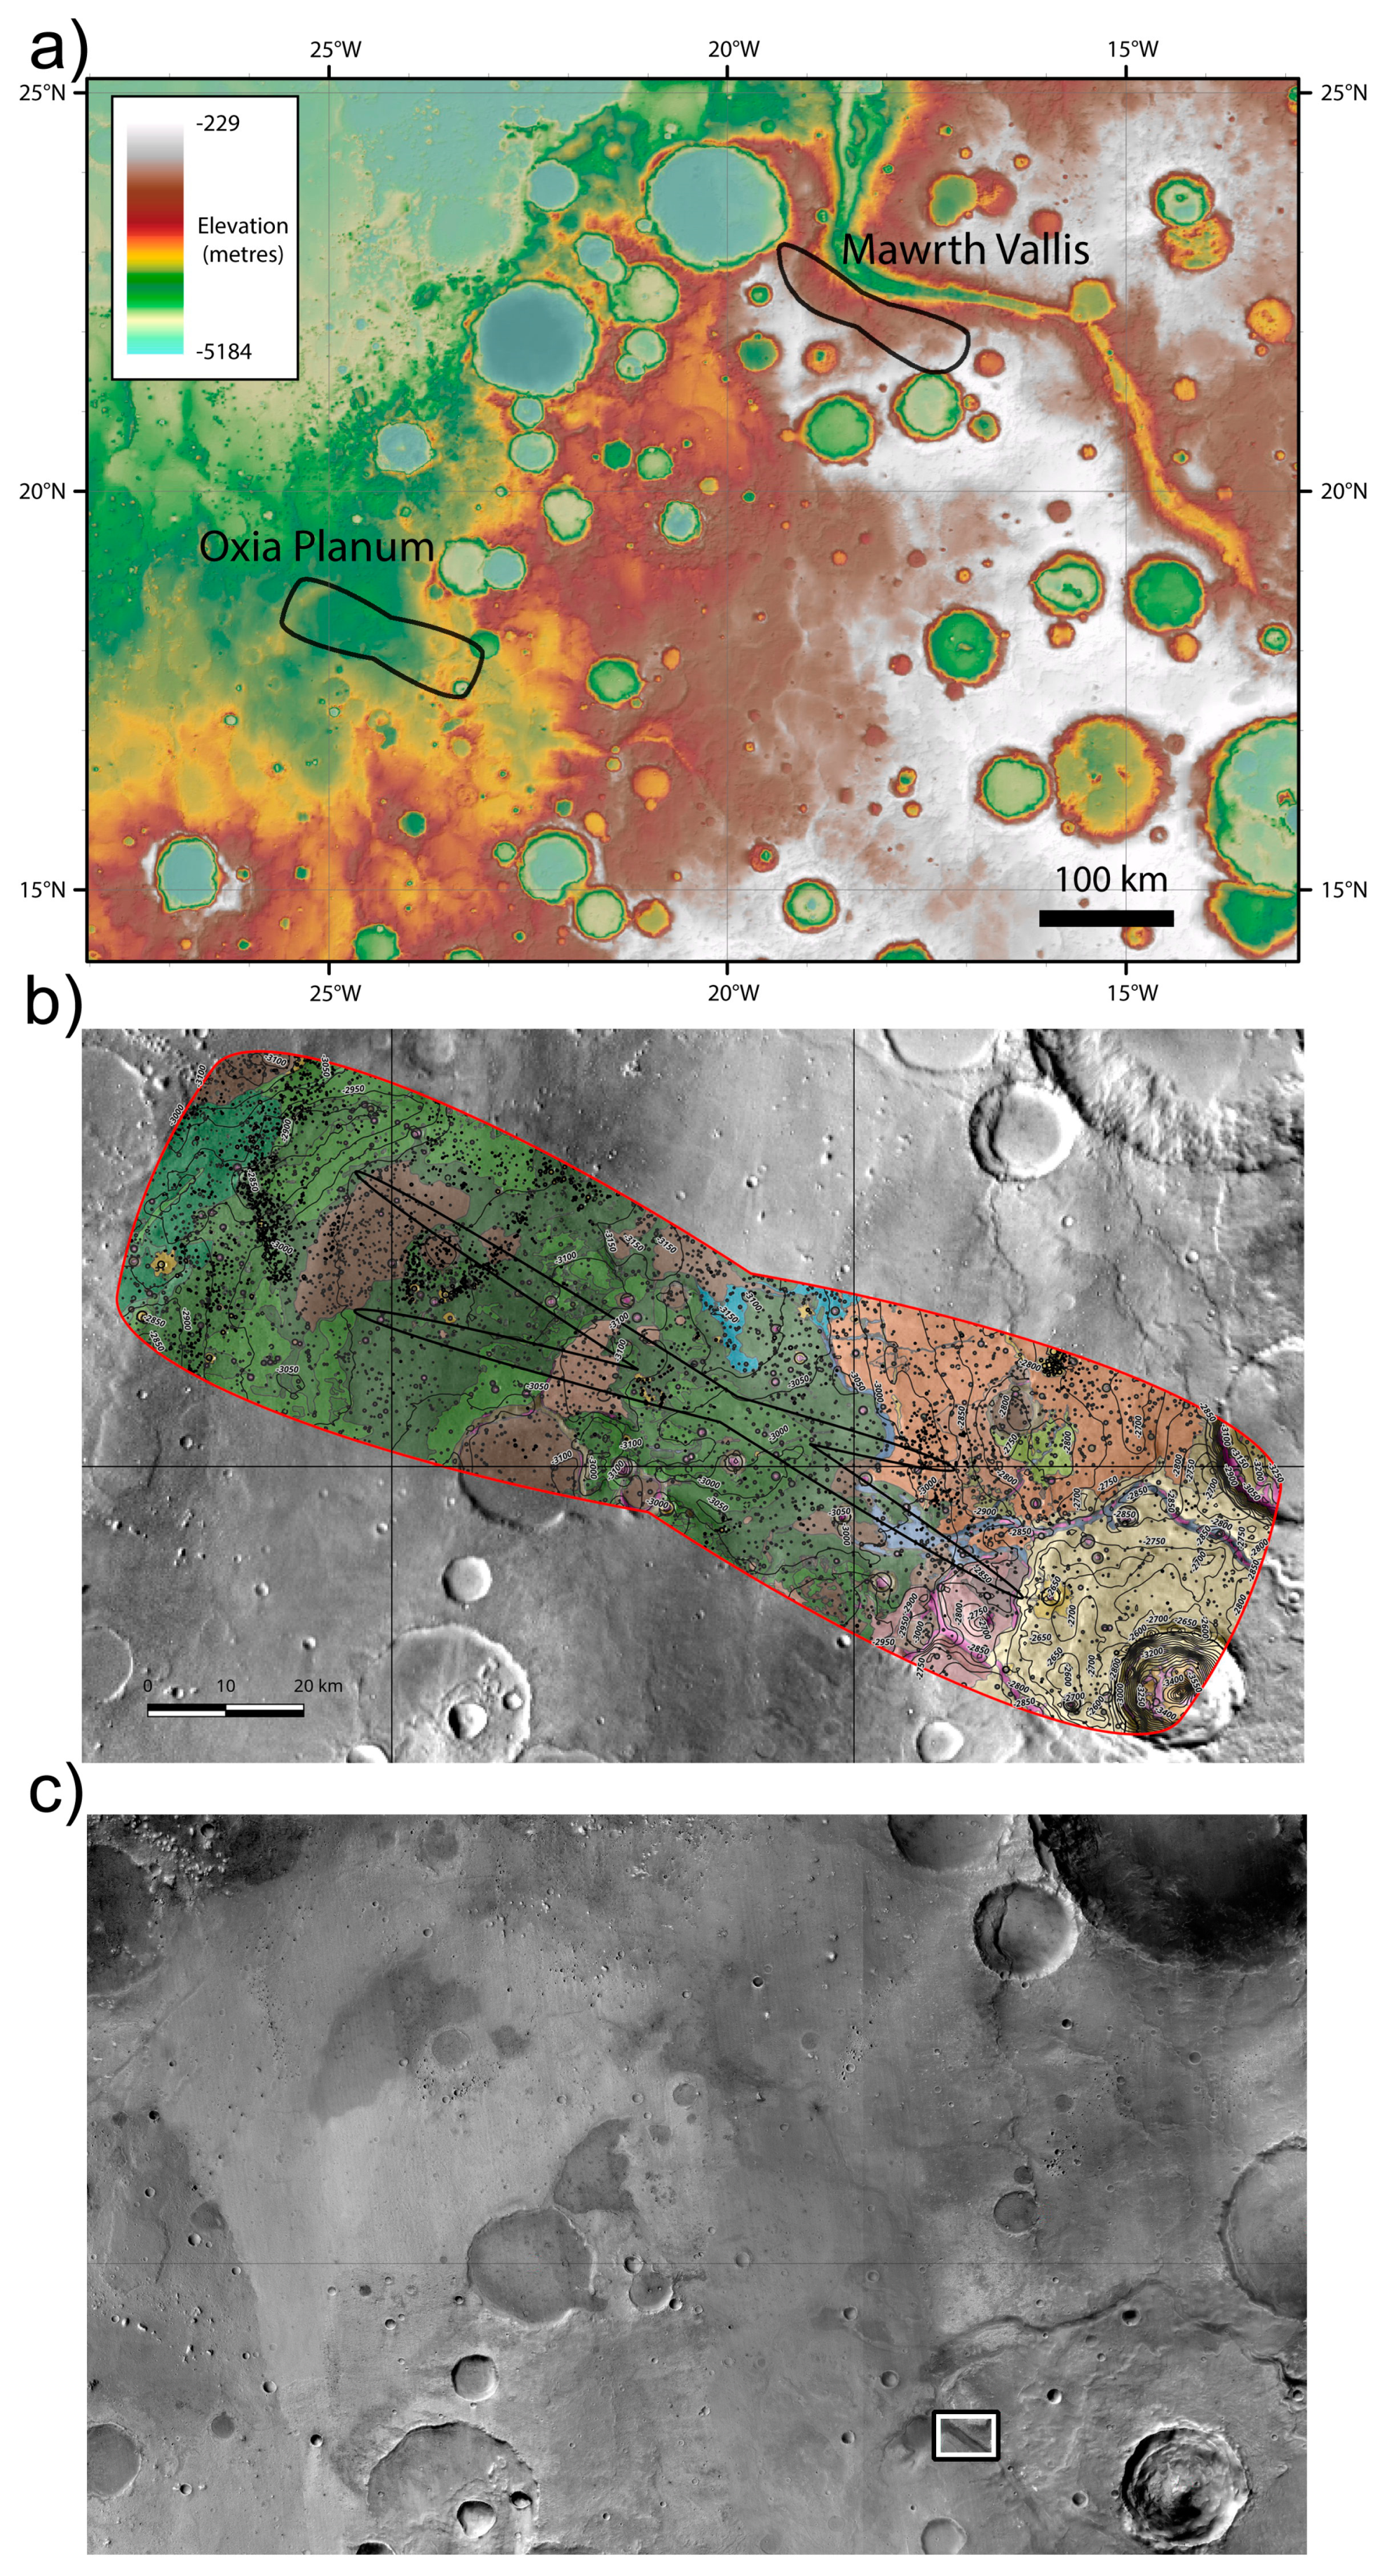
Figure 1.
Overview of the target area: (a) the surrounding terrain of the candidate landing ellipses for the ExoMars rover at left, (b) a magnified map of the landing ellipses, and (c) the location of the terrain analyzed in this work at fluvial valley characterized region (boxed area at the bottom right) (ESA).
2. Materials and Methods
In this work, the presented model approach used here is the SIMWE-based modified model, which could estimate runoff and related precipitation from the topography, and the eroded/deposited volumes without the direct measurement of precipitation (which is unknown for past Mars). The precipitation data came from a well-measured rain event in a desert area of the Earth from Izrael. There are multiple models for investigating and simulating the short- or long-term evolution of the surface; however, this one offers several advantages compared to others (see the Discussion section for details). This section provides a short general overview of the SIMWE model, the dataset of the used topography of the target area, the specific numerical values used, and finally, the example of an Earth-based precipitation event as an example from a desert area.
The SIMWE model [19,20] serves as the base for the model employed in this study, which is a surface modeling software of fluvial erosion, transport, and deposition, integrated into a sophisticated GIS environment. It comprises two principal components: estimation of surface properties related to water movement and estimation of water flow produced grain movement. In the initial phase, the model employs the provided precipitation data and surface-derived data (slope and aspect) to ascertain the flow depth and flow discharge values resulting from precipitation within the area over a specified time interval for each pixel. The model employs the principle of path sampling to calculate the aforementioned values using Green’s function [21]. The remaining half of the model determines the erosion/accumulation values through the same process used to ascertain the flow depth values. It should be noted that the variables utilized in this process are more intricate and are associated not only with the surface but also with the rock that composes it. The model presented here employs a comparable methodology to determine the flow depth values for each pixel. However, in contrast to the path sampling method, the flow accumulation values serve to quantify the volume of water that flows into a given pixel, as the flow accumulation values per pixel are proportional to the local catchment area above that pixel.
The current topography was used to reconstruct former processes as no better is available. Earlier surface material transport models for Mars have also been applied to understand precipitation, infiltration, and runoff, various aspects of fluvial systems [22,23,24,25], sediment deformation [26], and sediment deposition. Surface evolution models emphasizing erosion and deposition balance have been applied and validated in terrestrial contexts [27,28,29] and further improvements are needed to apply them to another planet.
A 25 m per pixel (m/px) high-resolution stereo camera (HRSC) digital terrain model (DTM) was used for the test in this work, covering the exploration area of the future rover mission within the Oxia Planum region. The DTM was used in the EQUIDISTANT MARS coordinate system [30]. For the simulation, the following parameters were applied, which are visible in Table 1.

Table 1.
The parameters used in the model.
To apply the model for Mars, upon entering the requisite input parameters (highlighted in Table 1), the DTM will be prepared to run the flow tracing. It should be noted that small enclosed depressions can be identified as artifacts and their interiors are filled artificially in the DTM in order to maintain flow along the whole region. The flow accumulation tool is employed to estimate the upflow area in square meters of each pixel in the DTM. Prior to this, the model calculates the slope in radians of the filled (modified) DTM using the slope, aspect, and curvature [31]. The model then corrects for areas with a slope (S) value of 0, as these would introduce errors during further operations. Subsequently, the model determines the theoretical maximum of the flow depth from precipitation using the following Equation (1), where I is the rainfall intensity in m/h, A is the upslope area in square meters, n is the Manning’s n roughness, and S is the local slope.
the flow velocity can be determined from the calculated flow depth values using the Darcy–Weisbach Equation (3), which requires a friction factor (2). The value of the friction factor [32] depends on the previously calculated flow depth, the slope, and the particle transported by the water (D50). For simplicity, the value of the flow width in the model is always equal to the spatial resolution of the digital elevation model used.
The selection of a probable Kt value allows the estimation of the specific volumetric transport rate (SVTR). The Kt value can be obtained from the SVTR value by dividing the SVTR with the spatial resolution value. In order to determine SVTR (5), the shear stress (4) and the derived shield parameter are required, which is a prerequisite for the determination of a dimensionless coefficient (qnondim) to derive SVTR (6).
The method presented in this paper is based on stream power, as the stream power index (SPI) has been demonstrated to be an exceptionally effective predictor in surface erosion and accumulation models [28,33]. After Mitasova, the SPI correlated transport rate is more accurate than the shear stress (7).
Kt is the transport coefficient of the soil and the variables m and n represent the water depth and slope weights, respectively. Based on several sources, Kt is the product of the Universal Soil Loss Equation (USLE) factors K (Soil Erodibility Index), P (Land Use and Land Cover Change Factor), and C (Land Cover Index). In the present study, the coefficient Kt was derived by a method other than the USLE equation, as no relevant data were available for the calculation of the C and P factors for Mars. Furthermore, the model presented here attempts to avoid the inclusion of non-physical but empirical parameters.
As an early step, a water-flow network exposure map should be defined, which can be calculated using the X and Y axis partial derivatives in every pixel, or estimated using the r.slope.aspect tool. The change in sediment transport capacity is given and can be expressed by a directional function. The erosion/deposition rate (ED) (8) indicates the amount of erosion or deposition in the area under consideration. The ED value is to determine the vertical change in the surface caused by erosion and deposition by the produced runoff, which could be extrapolated to year-long timescales.
Considering the erosion and deposition aspects, it is worth mentioning the following aspects. This model evaluates the grain transport (movement) versus grain settling (accumulation) by complex formulae, where pressure is involved under four aspects: critical shield parameter, friction factor for flow velocity, friction factor for shield stress, and shear stress itself. The movement of grains occurs when the shear-related pressure exerted by the water is greater than the resistance that its surrounding provides. The pressure difference that emerges from the flowing liquid between grains might initiate the movement of grains; however, besides the pressure differences, the initiation is inversely proportional to the size of grains (smaller grains produce stronger adhesion) and also with the mass of the given grain (heavier grains require larger pressure to initiate movement). However, this model is not dynamic: it is static in serval aspects and thus, pressure fluctuation-driven changes are poorly considered.
In the course of testing the model, it proved impossible to utilize authentic precipitation data from Mars. Accordingly, an effort was made to identify a region exhibiting a climate partly comparable to that of the Martian sample area, which could serve as a potential Mars analog. The Zin watershed in the Negev desert [34] in Israel, an area characterized by extreme aridity, offers a useful setting for testing hypotheses about Mars. Flash floods have been analyzed here to understand natural hazards, which is a 1200 km2 almost vegetation-free barren rock desert area [34] in southern Israel, Negev Desert. It has less than 100 mm/year of precipitation, with a few hours of rain occasionally. The basin is elongated from southwest to northeast with an elevation decrease from 1000 m above sea level to 380 m below sea level. The slopes are low to moderate (0–10°) for 75% of the basin but can be as high as 60° locally (e.g., Figure 1c). The surface is mainly exposed lithology limestone and chalk plus chert [35]. This Zin basin is a well-studied region, with comprehensive rainfall data available [36]. Consequently, precipitation data from this area were employed in the research. Rainfall measurements in the Zin basin were obtained during a three-hour storm, with an average rainfall rate of 18 mm per hour.
3. Results
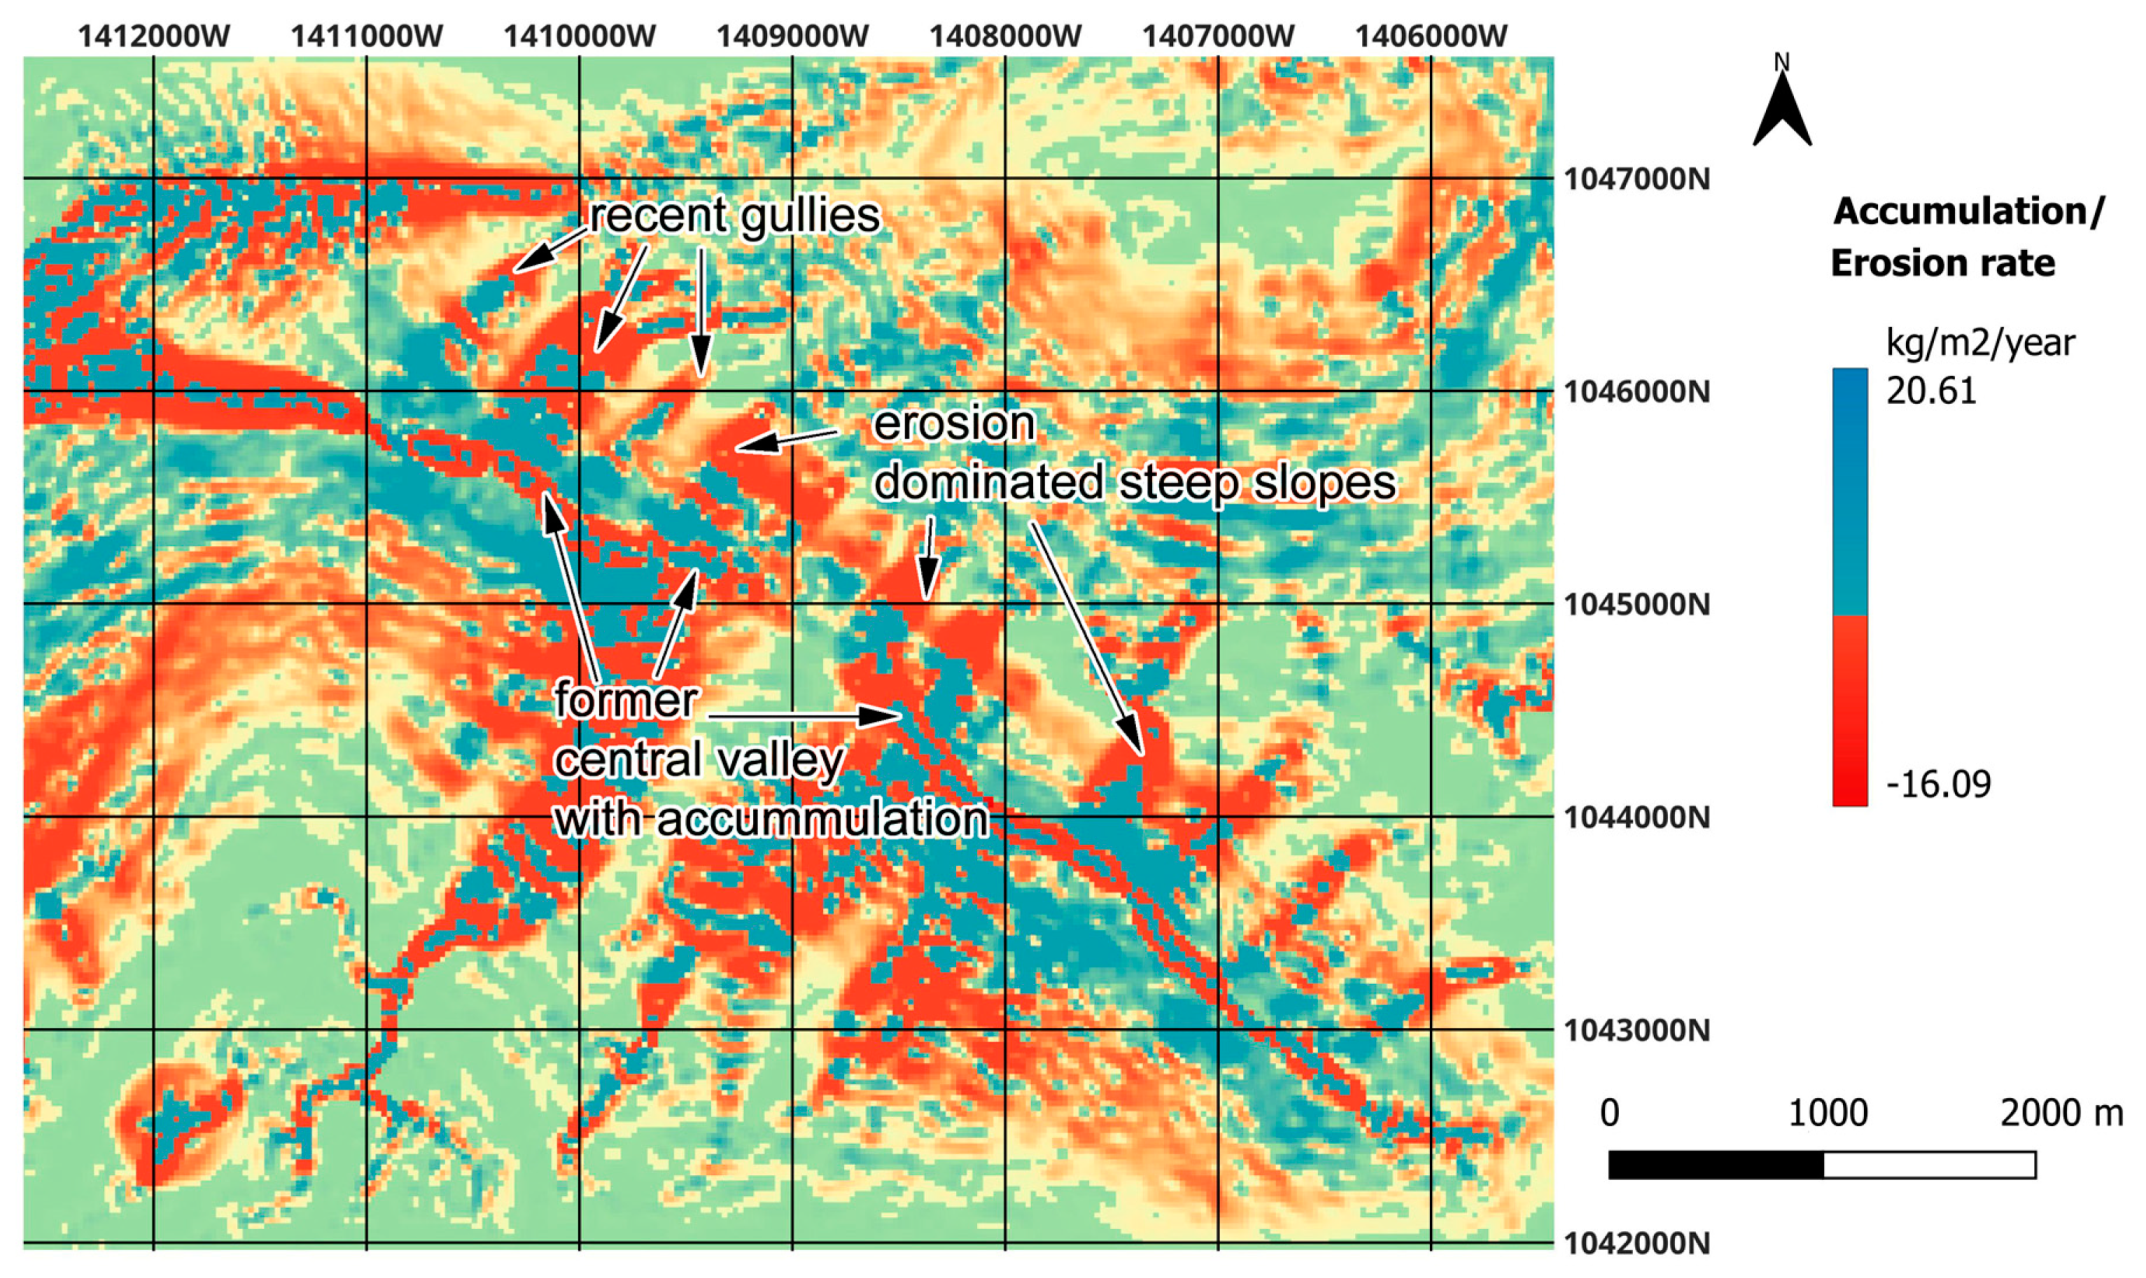
The model-generated pattern of accumulation vs. erosion-dominated areas follows the surface topography as grain transport or settling was related mainly to the speed of the water flow, which arises from the local slope angle. Being a new method that has been applied to Mars, characteristics examples are presented below only at 17.63 N 336.221 E, and not using a large regional survey. Figure 2 shows the net erosion and deposition of the model run. These indicate calculations based on ancient surface grain transport or settling. The accumulation-dominated areas are located on the flat parts of the study area, at the bottom of the depressions and after the inflection point of the slopes, according to the theoretical expectations.
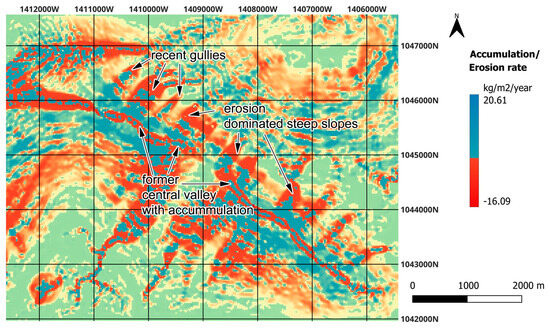
Figure 2.
The accumulation (blue) and erosion (red) dominated areas with their values, which are represented in kg/m2/year.
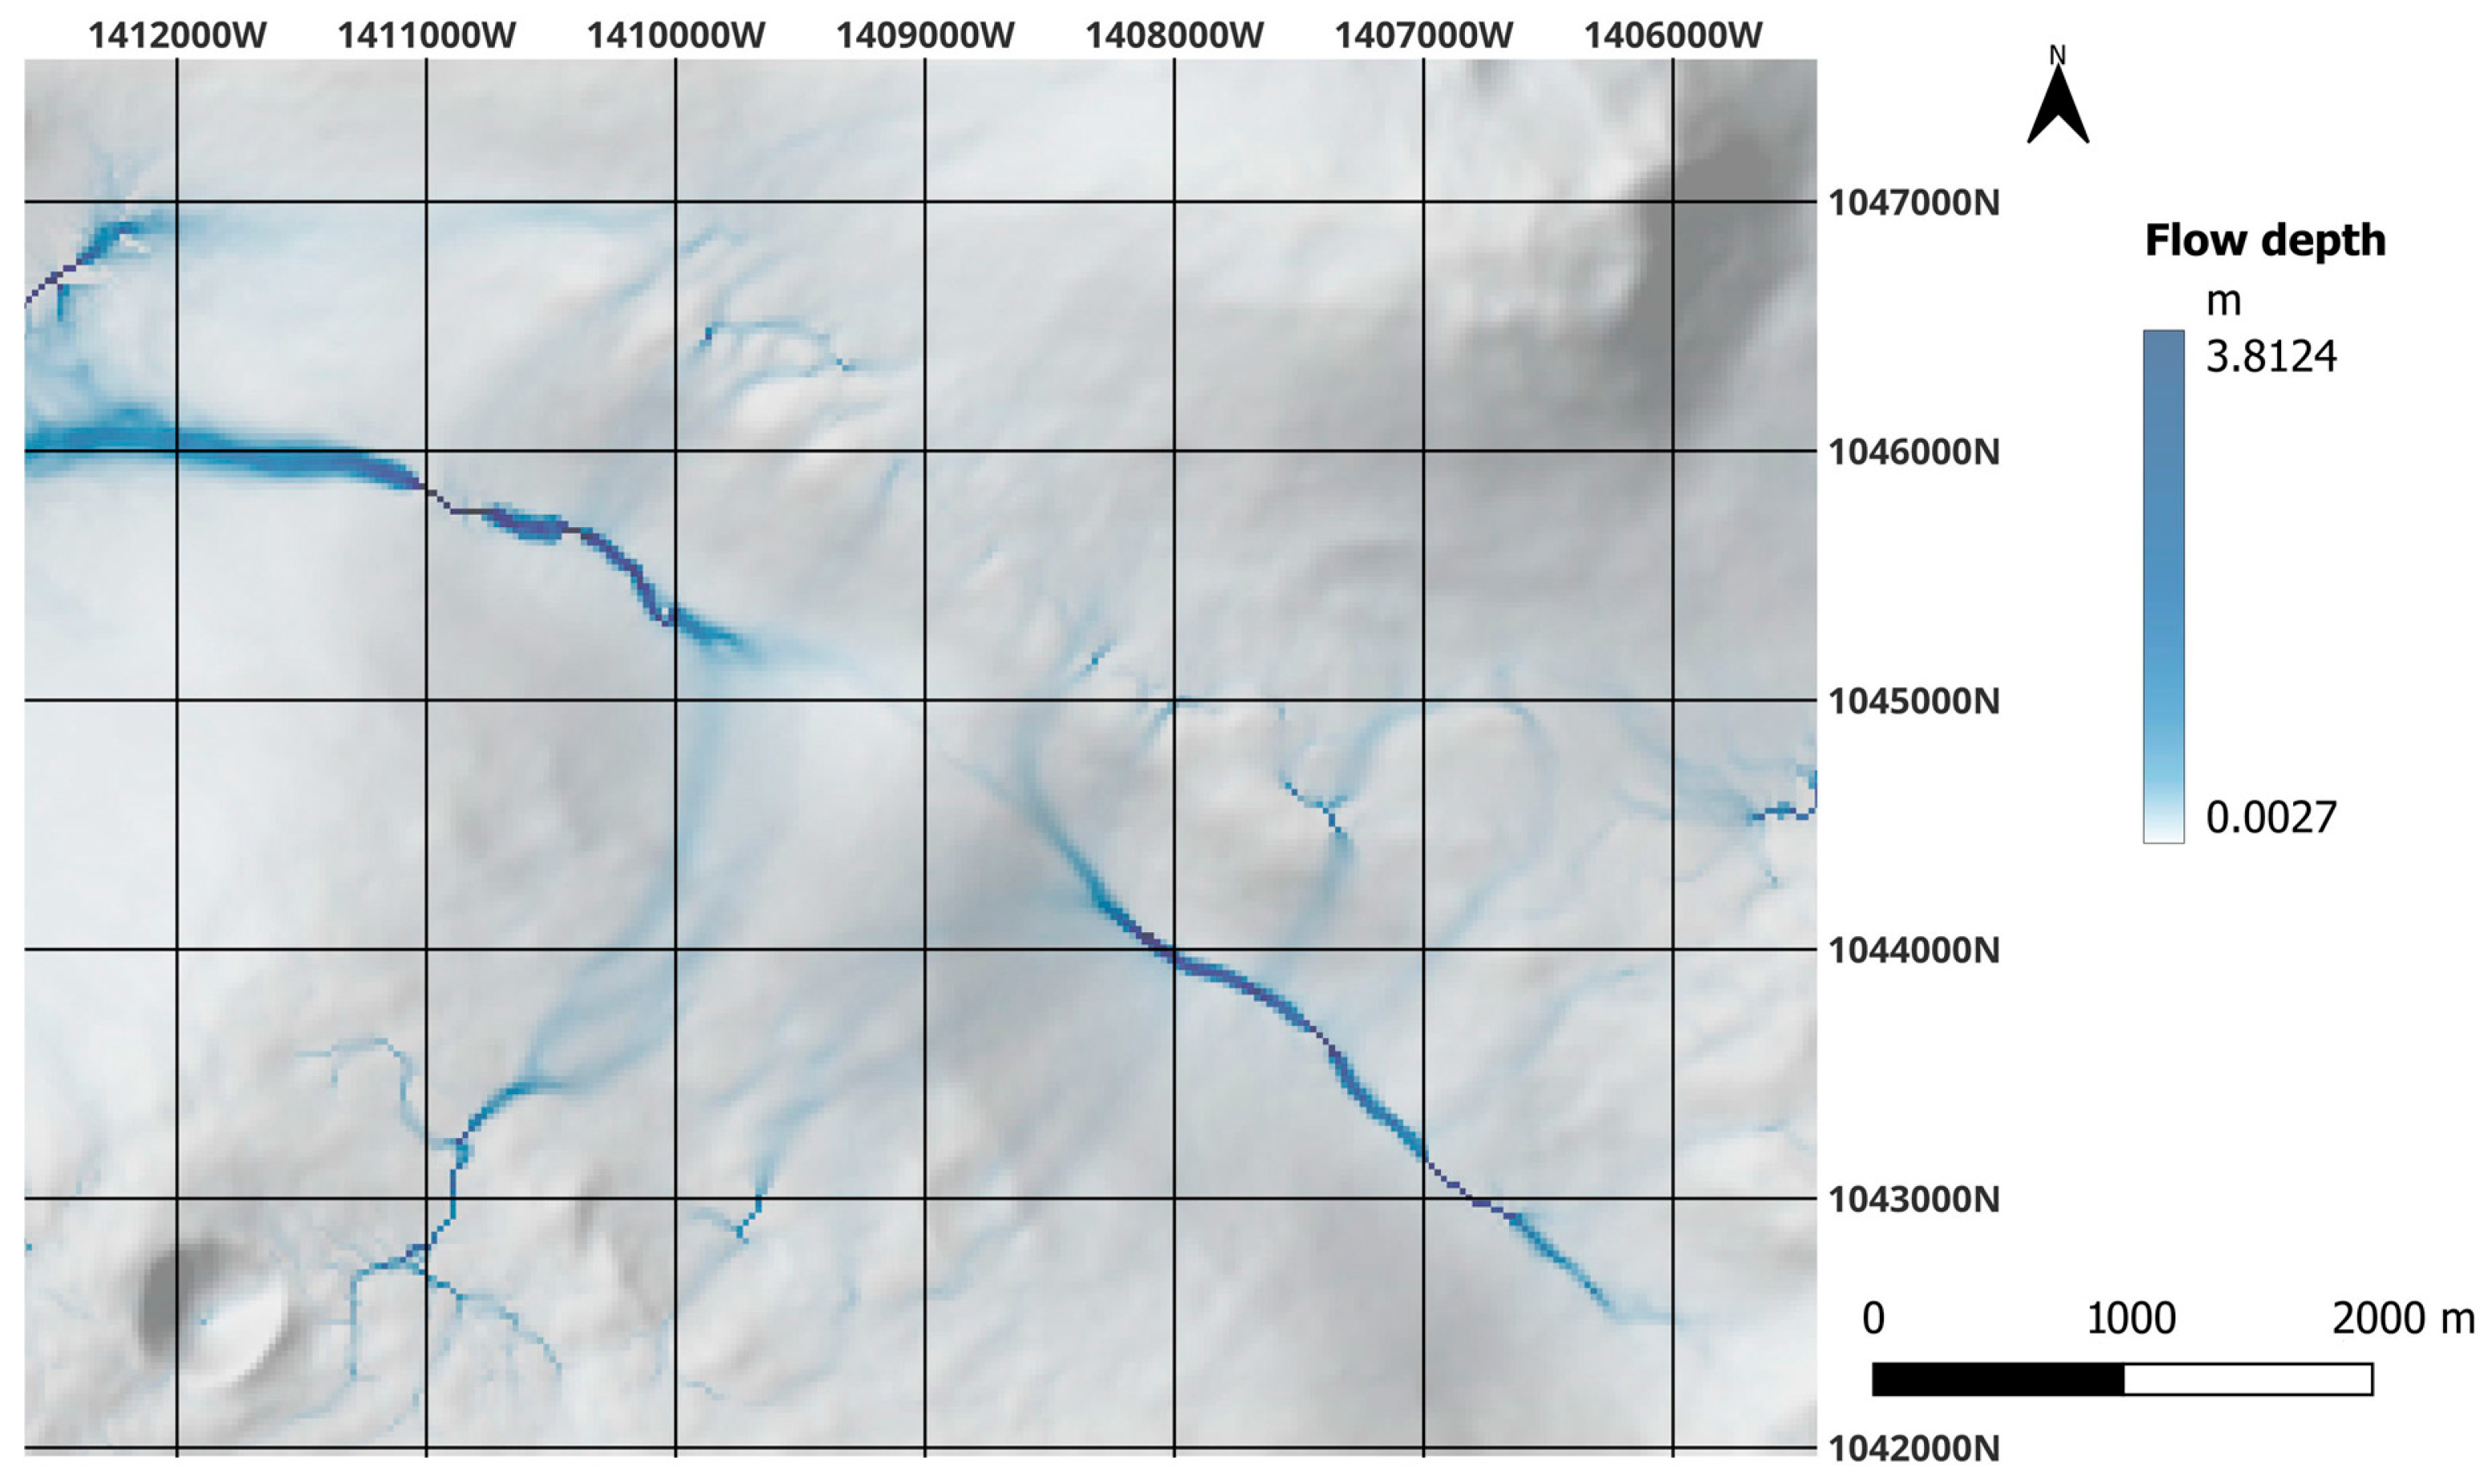
The model provided numerical values, although these are hypothetical ones related to the potential precipitation event based on the Earth-related analog desert rain event, which does not need to be realistic for Mars but is a useful approach. However, the spatial pattern does matter in this research. During the three-hour storm, the maximum flow depth was recorded at 3.8 m, while the minimum flow depth was 0.002 m. The accumulation-dominated areas correspond up to the maximal accumulation value of 20.61 kg/m2/yr. The areas dominated by erosion are located on steep slopes and show maximal erosion of 16.09 kg/m2/year.
Two surface feature types were analyzed below: where fluvial activity has obviously happened at the gullies [37] on the steep slopes (however, these are recent features) and the valley between the northern and southern elongated hill features, which might have been a location of the former flow track that emerged early at the area. The water flow tracks indicated as blue lines in Figure 3 mark those locations where the largest liquid water volume was accumulated (water flow depth in this model); however, these do not necessarily mean fast flow, but slow flow and related deposition could also happen there.

Figure 3.
Model calculations based on the flow depth map of the target area, which indicates the thickness of transported water from upper areas to lower terrains. The blue color marks the probable former flow tracks. Please note that the blurred area in the center is a partly elevated (but not steep) region, where the topography inhibits the formation of a well-separated flow track.
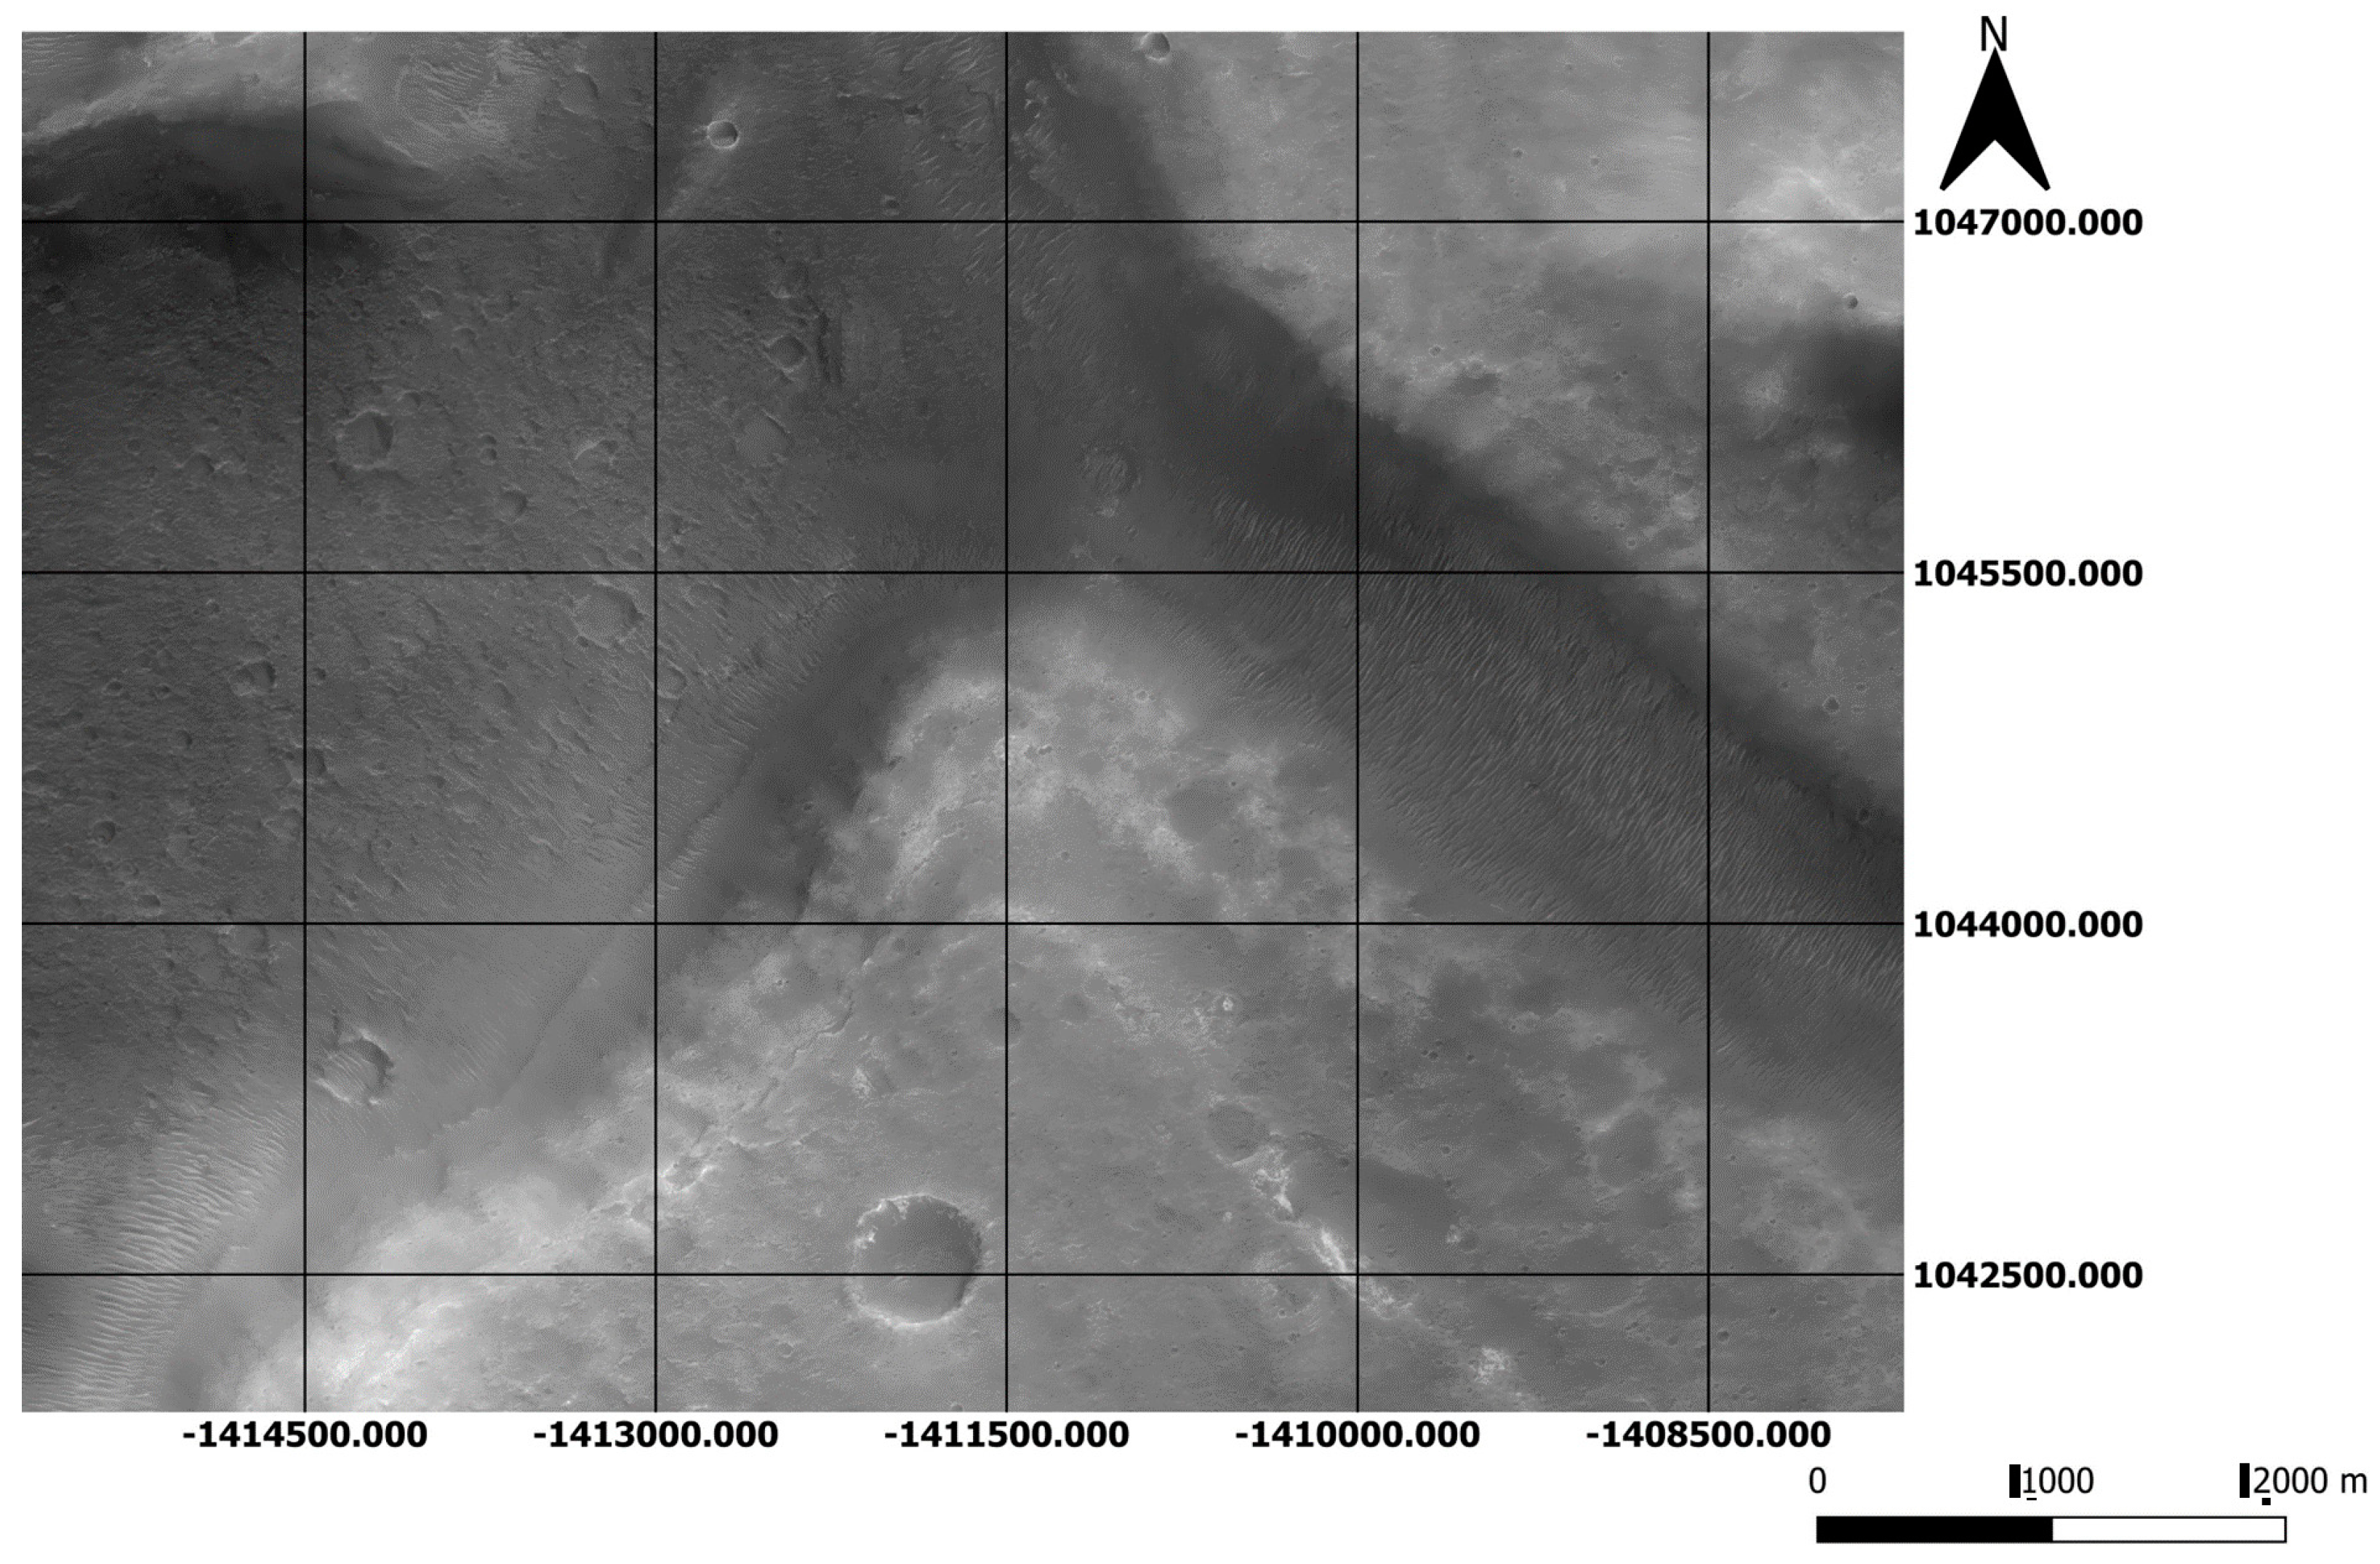
The erosion and deposition happened in the gullies where the model shows the following according to the expectations: erosion at their upper alcove-like source depression and accumulation at lower parts. However, these features re-deposit the formerly located sediment and are usually steep terrains, which are difficult to reach by any rover because of safety reasons. At the central and wide valley-like depression, the pattern not only shows deposition of materials eroded from the wall sides, but some accumulation also happens there (Figure 2). The latter is the result of the changing slope angle there; however, most erosion happened in those areas. The central part is mainly a deposition-dominated area but here, some erosion-related features are also present; however, these might be related to some model-specific approaches. Accumulation-related areas could be defined in the deeper sections, despite the fact that no related surface features could be found by the optical images (Figure 4). Thus, here, the model provides more information on the targeting of sampling than purely relying on the surface pattern visible from above, as the former riverbed is not visible already.

Figure 4.
CaSSIS orbital image on part of the target area, which demonstrates that no optically well-visible valley could be identified at the site of the model-based flow tracks.
The ideal target sites should also fulfill technical constraints besides scientific interest, e.g., the need to provide safe site access for rovers; thus, they should have a moderately low slope angle (<5°) without slippery sand dunes at the area [38].
The optimal sampling areas for the rover could be selected using GIS-based methods with a low slope angle and minimal current surface sand occurrence, ensuring convenient and secure access. In the study area, there is a considerable area of sites with accumulated material at or above 0.5 kg/m2/yr; however, it would be too dangerous to reach. Using these constraints, the size of useful areas is significantly reduced (Figure 5).
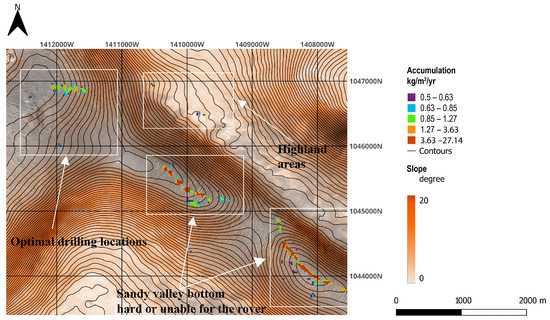
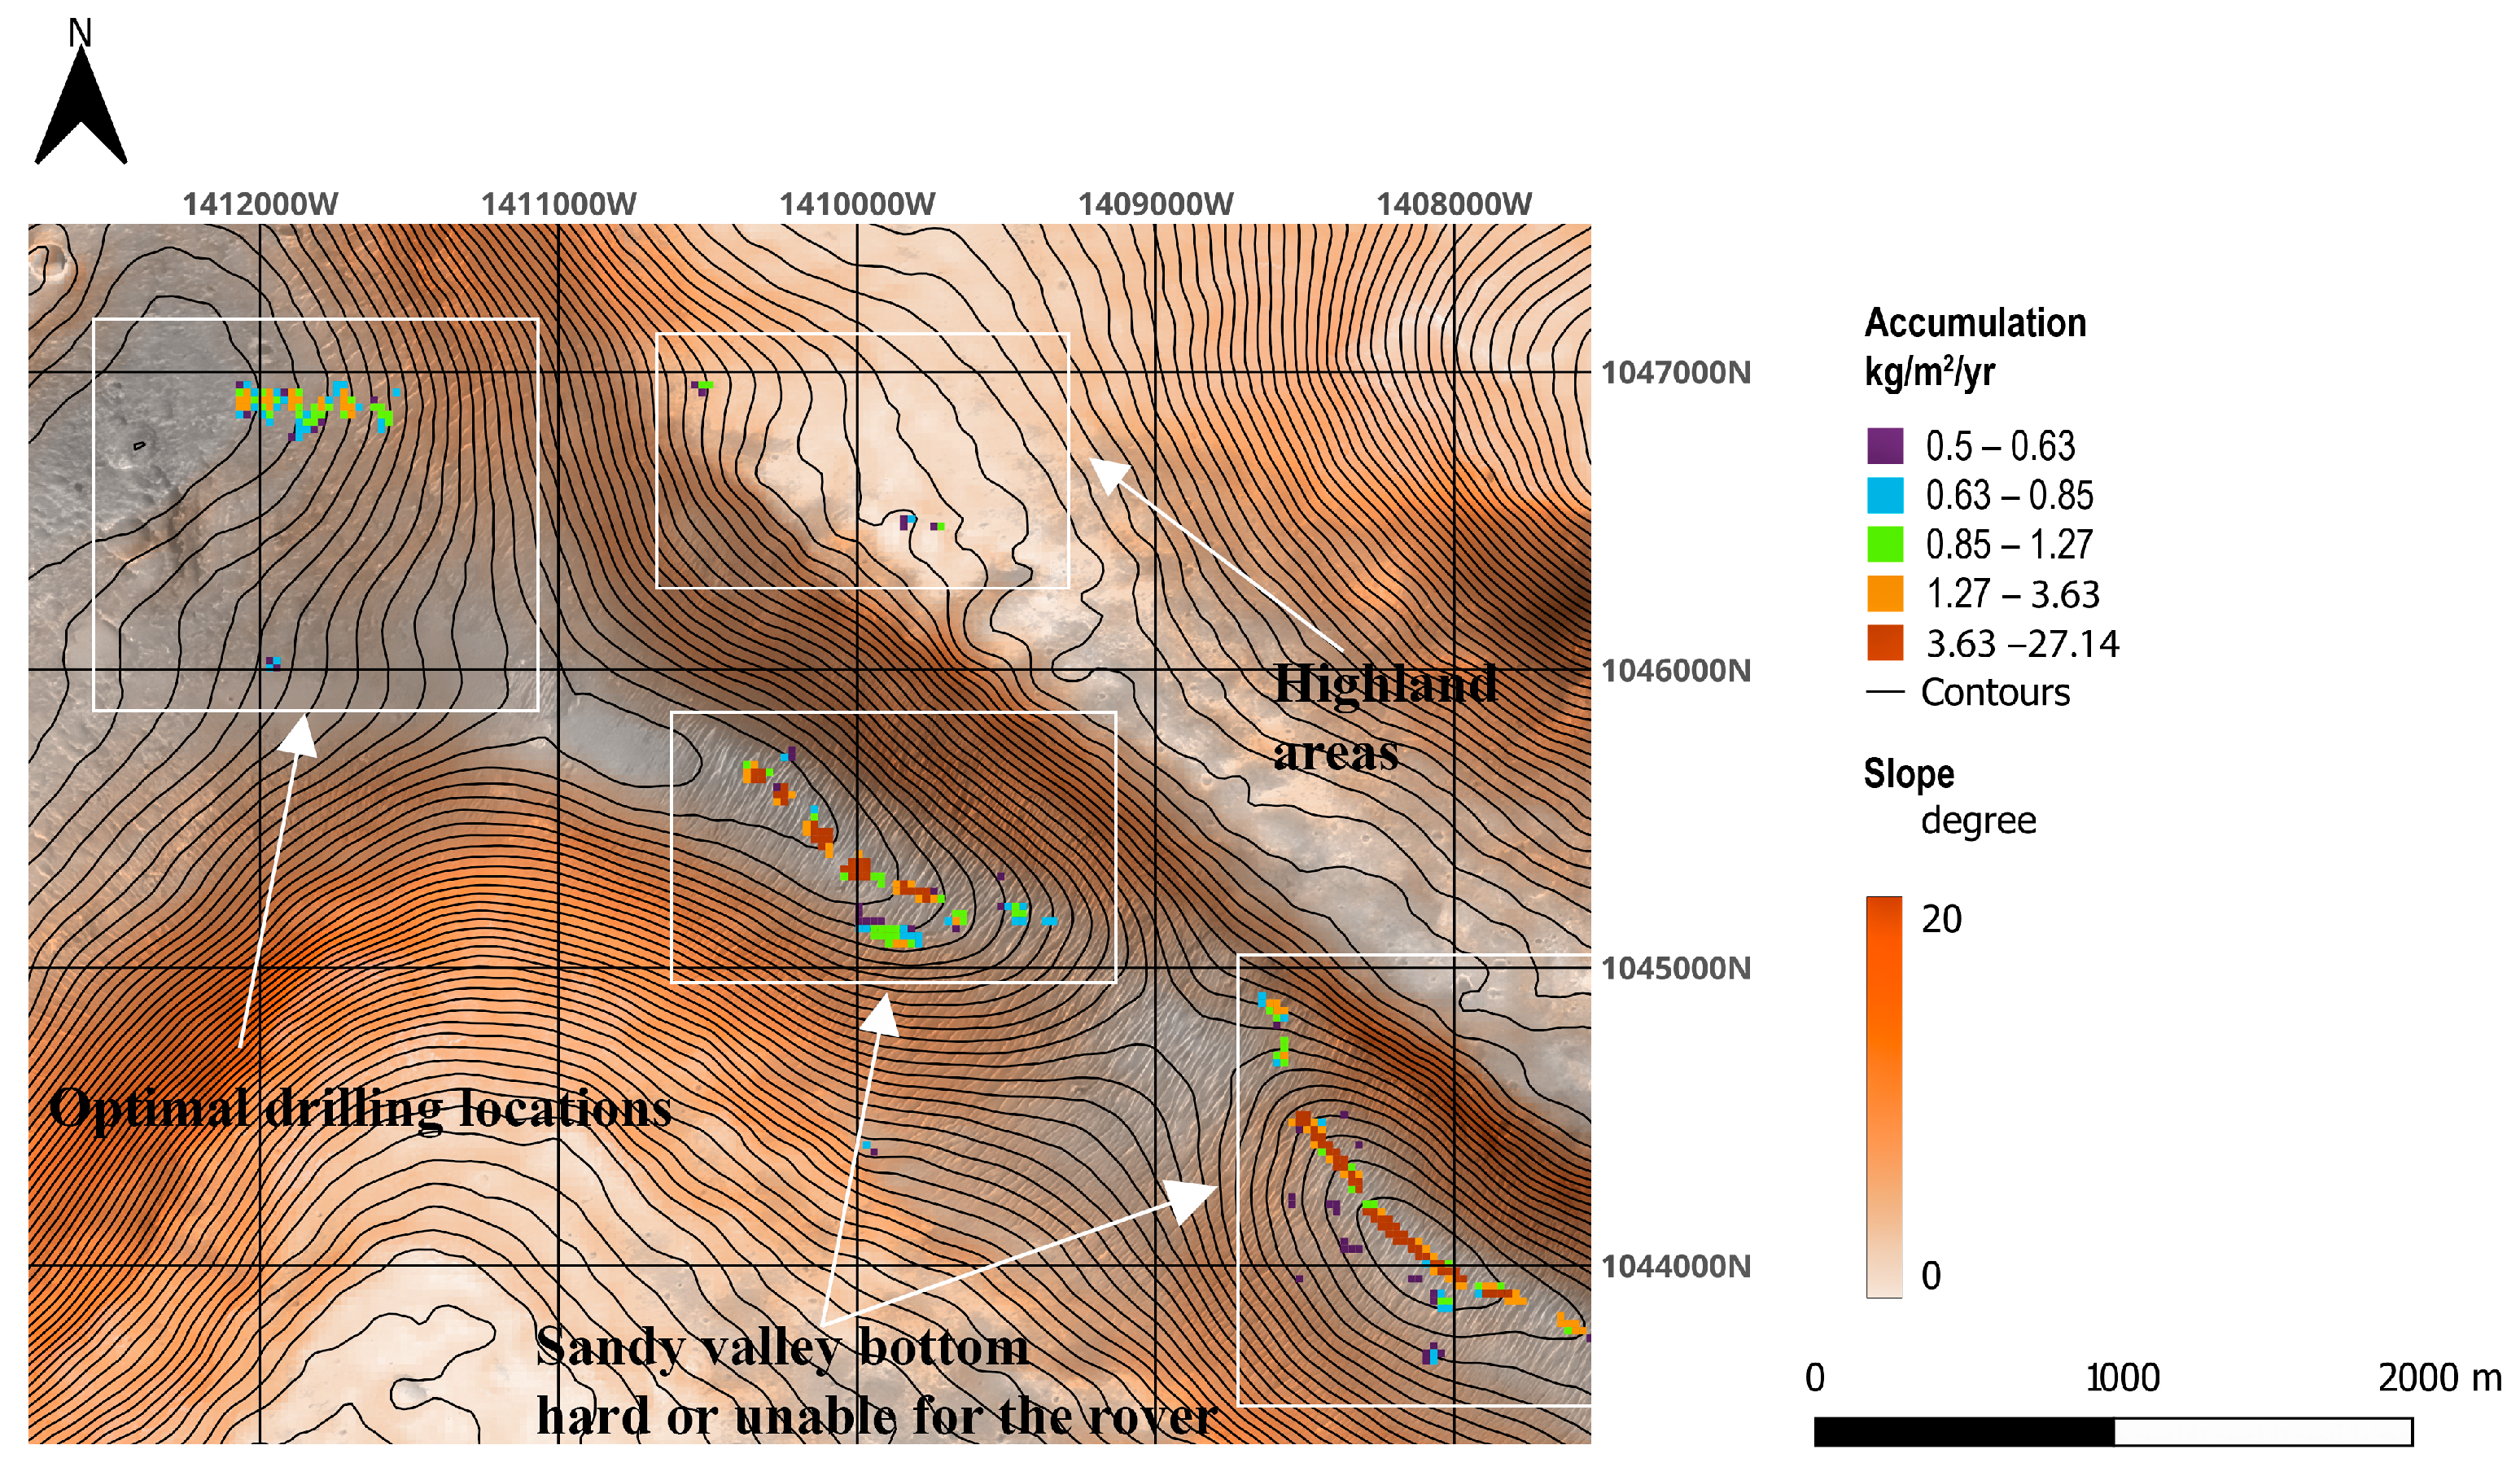
Figure 5.
Map of the ranked potential sampling locations, where the color coding of the keys at the top right marks the accumulation rate at reachable locations. Reachable sites are characterized by a slope angle that is less or equal to 5° and the fluvial accumulation is equal or more than 0.5 kg/m2/yr. The contour lines show the steepness of the terrain with shades from white (horizontal) to deep red (steep). Four example area types are marked with rectangles.
Four different area types were compared in the above-mentioned aspects: one hillside region and three valley bottom locations (see the boxed A, B, C, and D areas in Figure 5). An approximate area of 81,875 m2 was identified as an optimal drilling area at the surveyed total of approximately 300,000 m2 terrain, as visualized in Figure 5. At the hillside area (A), no sand accumulation or substantial fine-grained fluvial material accumulation was present, and it was not too steep. Valley bottom location types turned out to be safer regarding slopes but often served as accumulation sites for recent dunes and also proved to be dangerous. There is a substantial difference that could be observed in the total mass of formerly accumulated fluvial sediment, indicated by color coding with a range of 0.5–27.1 kg/m2/yr corresponding to the range from deep blue to deep red colors. An example of the best location type is marked by D in Figure 5, where fine-grained fluvial sediment has accumulated 0.6-1-27 kg/m2/yr rate with safe access, with a low slope angle, and with no dangerous sand dunes.
Considering the safety aspects, the locations of the former sites of the finest and largest mass of fluvial grain accumulation are characterized by the presence of clay-sized grains. This grain fraction exhibits high adhesion properties, particularly in the absence of significant ponding water, which results in the formation of a hardened material. The wet phase is dangerous as it is swampy, but in the current dry state, clay fraction provides safe traversing related to the strong intermolecular and intergranular bonds for any rover. This phenomenon is partly present.
4. Discussion
Applying the SIMWE-based modified model to a small part of the Oxia Planum candidate landing area on Mars, a complex pattern of accumulation vs. erosion-dominated sites are present close to each other. The pattern fits with the expectations, e.g., steeper areas are usually erosion-dominated. To focus on the potentially most accumulation-dominated area with fine-grained clays of fluvial context, two surface feature types were selected: the recent gullies and the proposed ancient river valley.
Comparing the model-based approach of the ideal accumulated sites’ location and the observable surface morphology, the following could be identified. There is a variable pattern of accumulation and erosion-dominated terrains, indicating high spatial variability on the surface at 10–100 m distance. This pattern emerged as a result of the model run, indicating that there are substantial differences in sampling attempts if one aims to understand the erosion/accumulation rate at the given location. Different terrain types could be found at driving distance from each other, e.g., the rover would have the possibility to select them and visit the ideal one during a surface operation activity of months. To select the ideal drilling site for the purpose of acquiring fine-grained clay-like material (together with possible bound organics), the model indicated that accumulation locations could be accurately targeted by a rover with drilling capability.
While the model is obviously useful for the relative comparison and ranking of different sites, the absolute numerical values have not been confirmed yet and require further development. Besides the benefits of the presented model, there are potential weaknesses, including the not well-known model parameters, which should be improved by future laboratory tests, theoretical calculations, and, in some cases, further Mars surface observations. Here, only a moderately small area was evaluated, the features observed seem to be relevant examples for the whole area; the survey of the whole landing site was beyond the scope of this work. The GIS-compatible results of former accumulation/erosion calculations provide a possibility to involve safety considerations. It was possible to select the low slope angle terrains without observable swampy sand dunes, supporting safe traversing and rover access, together with the elevated amount of former clay fraction as an important target. The joint evaluation of our model results and the safety access aspects together with scientific relevance provide a useful joint tool for targeting future sampling missions.
The calculations on water flow could use only the current surface, which does not need to be the same as the early topography, which influenced the ancient flow; however, it is a rational approach as no better estimation on the original surface topography is available. A further reason to use the current surface is that no strong post-fluvial accumulation can be observed at the target area, except for some small aeolian features; however, these are much smaller than the large-scale surface undulations.
Earth-based analogs should be further exploited to correlate modeling results and the in-situ test sampling process. For example, the carbonate-rich Salda Lake delta has been also considered a Mars-relevant target site as it is partly similar to the Jezero crater delta with regard to carbonates [5], with astrobiology relevance [39], where chemical analog aspects including hydromagnesite could be involved beside surface runoff estimations, supporting this lake.
5. Conclusions
In this work, a SIMWE model-based surface fluvial erosion and deposition approach was adapted to Martian conditions in order to forecast the best potential locations for shallow subsurface sampling planned to be realized by the Rosalind Franklin ExoMars rover at Oxia Planum. Remote and on-site images could provide information only on the surface visible features, while former fluvial-related accumulation sites might be hidden; thus, they could be identified by a modeling approach. During the fluvial activity, the most accumulation-related areas are interesting as the smallest grain size grain fraction deposits there, and this clay-like sediment could adsorb many organics effectively. While organics could be easily decomposed by atmospheric oxidants, surface UV, and ionizing radiations, shallow drills might acquire almost intact organics.
By applying the fluvial erosion/deposition model for an example subarea of the planned landing site, the fine-grained material produced accumulation-dominated locations that could be determined. The substantial variability of accumulation and deposition-dominated areas with their visible pattern and spatial distribution could be outlined, indicating that the sophisticated targeting of future sampling could use such a model-based approach. Two dominant water flow-related landform types could be selected for more detailed analysis. The recent gullies show a strong trend with erosion at their top alcove-like depressions and accumulation at the lower more horizontal sections. At the main valley-like feature, former water flow tracks could be identified, as well as deposition-dominated locations, which are the best targets for shallow subsurface sampling. The optimal sampling areas for the rover could be selected at the target terrain, where the slope angle is below 5°, no substantial dangerous dunes are present, and accumulated fluvial material is above 0.5 kg/m2/yr. Although only a sample terrain was evaluated in the landing area of the Franklin Rosalind ExoMars rover, the method was demonstrated to provide a new aspect of targeting ancient fine-grained sedimentary material, where the duration of wet coverage was the longest and the organic preservation is elevated. Such model-based targeting is important as, by using only orbital images, these locations could not be identified. Erosion–deposition models for the Martian surface should be further developed as they could effectively support future Marian sampling attempts, including the sophisticated targeting of material for the next Mars sample return projects and possibly even find the ideal targets of future manned base sites there.
Author Contributions
The model calculation was conducted by V.S. and supervision was performed by Á.K. All authors have read and agreed to the published version of the manuscript.
Funding
This research has received no external funding.
Data Availability Statement
Data are contained within the article.
Conflicts of Interest
The authors have no conflicts of interest.
References
- Soare, R.J.; Conway, S.J.; Godin, E.; Hawkswell, J.; Osinski, G.R.; Bina, A. Possible ice-wedge polygonisation in utopia planitia, mars, and its poleward latitudinal-gradient. In Proceedings of the 49th Lunar and Planetary Conference, Houston, TX, USA, 19–23 March 2018. [Google Scholar]
- Conway, S.J.; Stillman, D.E.; Conway, S.J.; Stillman, D.E. Chapter 9—The role of liquid water in recent surface processes on Mars. In Mars Geological Enigmas; Elsevier: Amsterdam, The Netherlands, 2021; pp. 207–261. [Google Scholar] [CrossRef]
- Sokołowska, A.; Thomas, N.; Wünnemann, K.; Sokołowska, A.; Thomas, N.; Wünnemann, K. Effects of surface and subsurface water/ice on spatial distributions of impact crater ejecta on Mars. Icarus 2024, 420, 116150. [Google Scholar] [CrossRef]
- Nikiforov, S.Y.; Djachkova, M.V.; Gellert, R.; Mitrofanov, I.G.; Lisov, D.I.; Litvak, M.L.; Sanin, A.B.; Vasavada, A.R. Water and Chlorine in the Martian Subsurface Along the 27 km Traverse of NASA’s Curiosity Rover According to DAN Measurements: 2. Results for Distinct Geological Regions. J. Geophys. Res. Planets 2024, 129, e2022JE007731. [Google Scholar] [CrossRef]
- Altieri, F.; Frigeri, A.; Lavagna, M.; Le Gall, A.; Nikiforov, S.Y.; Stoker, C.; Ciarletti, V.; De Sanctis, M.C.; Josset, J.-L.; Mitrofanov, I.; et al. Investigating the Oxia Planum subsurface with the ExoMars rover and drill. Adv. Space Res. 2023, 71, 4895–4903. [Google Scholar] [CrossRef]
- Adeli, S.; Hauber, E.; Kleinhans, M.; Le Deit, L.; Platz, T.; Fawdon, P.; Jaumann, R. Amazonian-aged fluvial system in the southern mid-latitude regions, Mars. In Proceedings of the 48th Lunar and Planetary Science Conference, The Woodlands, TX, USA, 20–27 March 2017. [Google Scholar]
- Hargitai, H.I.; Gulick, V.C.; Glines, N.H. Evolution of the Navua Valles region: Implications for Mars’ paleoclimatic history. Icarus 2019, 330, 91–102. [Google Scholar] [CrossRef]
- Pajola, M.; Rossato, S.; Baratti, E.; Mangili, C.; Mancarella, F.; McBride, K.; Coradini, M. The Simud-Tiu Valles hydrologic system: A multidisciplinary study of a possible site for future Mars on-site exploration. Icarus 2016, 268, 355–381. [Google Scholar] [CrossRef]
- Dartnell, L.R.; Patel, M.R. Degradation of microbial fluorescence biosignatures by solar ultraviolet radiation on Mars. Int. J. Astrobiol. 2014, 13, 112–123. [Google Scholar] [CrossRef]
- Dartnell, L.R.; Desorgher, L.; Ward, J.M.; Coates, A.J. Martian sub-surface ionising radiation: Biosignatures and geology Martian sub-surface ionising radiation: Biosignatures and geology. Biogeosciences 2007, 4, 545–558. Available online: www.biogeosciences.net/4/545/2007/ (accessed on 26 August 2024). [CrossRef]
- Mandon, L.; Bowen, A.P.; Quantin-Nataf, C.; Bridges, J.C.; Carter, J.; Pan, L.; Beck, P.; Dehouck, E.; Volat, M.; Thomas, N.; et al. Morphological and Spectral Diversity of the Clay-Bearing Unit at the ExoMars Landing Site Oxia Planum. Astrobiology 2021, 21, 464–480. [Google Scholar] [CrossRef]
- Davis, J.M.; Balme, M.R.; Fawdon, P.; Grindrod, P.M.; Favaro, E.A.; Banham, S.G.; Thomas, N. Ancient alluvial plains at Oxia Planum, Mars. Earth Planet. Sci. Lett. 2023, 601, 117904. [Google Scholar] [CrossRef]
- Quantin-Nataf, C.; Carter, J.; Mandon, L.; Thollot, P.; Balme, M.; Volat, M.; Pan, L.; Loizeau, D.; Millot, C.; Breton, S.; et al. Oxia Planum: The Landing Site for the ExoMars ‘rosalind Franklin’ Rover Mission: Geological Context and Prelanding Interpretation. Astrobiology 2021, 21, 345–366. [Google Scholar] [CrossRef]
- Molina, A.; López, I.; Prieto-Ballesteros, O.; Fernández-Remolar, D.; de Pablo, M.Á.; Gómez, F. Coogoon Valles, western Arabia Terra: Hydrological evolution of a complex Martian channel system. Icarus 2017, 293, 27–44. [Google Scholar] [CrossRef]
- McNeil, J.D.; Fawdon, P.; Balme, M.R.; Coe, A.L. Morphology, Morphometry and Distribution of Isolated Landforms in Southern Chryse Planitia, Mars. J. Geophys. Res. Planets 2021, 126, e2020JE006775. [Google Scholar] [CrossRef]
- Fawdon, P.; Balme, M.R.; Bridges, J.; Davis, J.M.; Gupta, S.; Quantan-Nataf, C. The ancient fluvial catchment of Oxia Planum: The ExoMars 2020 rover landing site. In Proceedings of the 50th Annual Lunar and Planetary Science Conference, The Woodlands, TX, USA, 18–22 March 2019. [Google Scholar]
- Srivastava, A.; Tornabene, L.L.; Osinski, G.R.; Caudill, C.M.; Fawdon, P.; Grindrod, P.; Hauber, E.; Davis, J.; Pajola, M.; Soukup, M.A.; et al. Reconstruction of the subsurface stratigraphy of the exomars oxia planum landing site through investigations of exposed bedrock within crater walls. In Proceedings of the Tenth International Conference on Mars, Pasadena, CA, USA, 22–25 July 2024. [Google Scholar]
- Vago, J.L.; Westall, F.; Coates, A.J.; Jaumann, R.; Korablev, O.; Ciarletti, V.; Mitrofanov, I.; Josset, J.-L.; De Sanctis, M.C.; Bibringet, J.-P.; et al. Habitability on Early Mars and the Search for Biosignatures with the ExoMars Rover. Astrobiology 2017, 17, 471–510. [Google Scholar] [CrossRef]
- Li, H.; Gao, H.; Zhou, Y.; Xu, C.Y.; Rengifo, M.; Sælthun, N.R. Usage of SIMWE model to model urban overland flood: A case study in Oslo. Hydrol. Res. 2020, 51, 366–380. [Google Scholar] [CrossRef]
- Fernandes, J.; Bateira, C.; Soares, L.; Faria, A.; Oliveira, A.; Hermenegildo, C.; Moura, R.; Gonçalves, J. SIMWE model application on susceptibility analysis to bank gully erosion in Alto Douro Wine Region agricultural terraces. Catena 2017, 153, 39–49. [Google Scholar] [CrossRef]
- Mitas, L.; Mitasova, H. Distributed soil erosion simulation for effective erosion prevention. Water Resour. Res. 1998, 34, 505–516. [Google Scholar] [CrossRef]
- Lapôtre, M.G.A.; Ielpi, A.; Lamb, M.P.; Williams, R.M.E.; Knoll, A.H. Model for the Formation of Single-Thread Rivers in Barren Landscapes and Implications for Pre-Silurian and Martian Fluvial Deposits. J. Geophys. Res. Earth Surf. 2019, 124, 2757–2777. [Google Scholar] [CrossRef]
- Gundersen, D.G.; Christensen, K.; Blois, G. Measurements of intracrater flow dynamics utilizing a mound-bearing crater in a refractive index matched environment. In Proceedings of the 14th International Symposium on Particle Image Velocimetry, Chicago, IL, USA, 1–4 August 2021; Volume 1. [Google Scholar] [CrossRef]
- Warren, A.O.; Holo, S.; Kite, E.S.; Wilson, S.A. Overspilling small craters on a dry Mars: Insights from breach erosion modeling. Earth Planet. Sci. Lett. 2021, 554, 116671. [Google Scholar] [CrossRef]
- Kim, J.R.; Schumann, G.; Neal, J.C.; Lin, S.Y. Megaflood analysis through channel networks of the Athabasca Valles, Mars based on multi-resolution stereo DTMs and 2D hydrodynamic modeling. Panet Space Sci. 2014, 99, 55–69. [Google Scholar] [CrossRef]
- Pozzobon, R.; Pesce, D.; Massironi, M. 3D geomodel of the deformed deposits in Crommelin Crater (Mars). In Proceedings of the 14th Europlanet Science Congress 2020, Virtual, 21 September–9 October 2020. [Google Scholar] [CrossRef]
- Takáts, T.; Albert, G. Szőlőterületek eróziójának térbeli modellezése a Neszmélyi borvidéken felszínközeli távérzékelés segítségével. Geod. Kartogr. 2021, 73, 26–36. [Google Scholar] [CrossRef]
- Mitasova, H.; Barton, M.; Ullah, I.; Hofierka, J.; Harmon, R.S. 3.9 GIS-Based Soil Erosion Modeling. In Treatise on Geomorphology: Volume 1–14; Elsevier: Amsterdam, The Netherlands, 2013; pp. 228–258. [Google Scholar] [CrossRef]
- Willgoose, G. Mathematical modeling of whole landscape evolution. Annu. Rev. Earth Planet. Sci. 2005, 33, 443–459. [Google Scholar] [CrossRef]
- Tao, Y.; Muller, J.P.; Conway, S.J.; Xiong, S. Large area high-resolution 3d mapping of oxia planum: The landing site for the exomars rosalind franklin rover. Remote Sens. 2021, 13, 3270. [Google Scholar] [CrossRef]
- Zevenbergen, L.W.; Thorne, C.R. Quantitative analysis of land surface topography. Earth Surf. Process. Landf. 1987, 12, 47–56. [Google Scholar] [CrossRef]
- Kleinhans, M.G. Flow discharge and sediment transport models for estimating a minimum timescale of hydrological activity and channel and delta formation on Mars. J. Geophys. Res. Planets 2005, 110, 1–23. [Google Scholar] [CrossRef]
- Mitasova, H.; Thaxton, C.; Hofierka, J.; McLaughlin, R.; Moore, A.; Mitas, L. Path sampling method for modeling overland water flow, sediment transport, and short term terrain evolution in Open Source GIS. Dev. Water Sci. 2004, 55, 1479–1490. [Google Scholar] [CrossRef]
- Schwartz, U. Factors affecting channel infiltration of floodwaters in Nahal Zin basin, Negev desert, Israel. Hydrol. Process. 2016, 30, 3704–3716. [Google Scholar] [CrossRef]
- Israel’s 1:200,000 Geological Map Geological Survey of Israel. Available online: https://www.gov.il/en/pages/israel-map-1-200k (accessed on 26 August 2024).
- Rinat, Y.; Marra, F.; Armon, M.; Metzger, A.; Levi, Y.; Khain, P.; Vadislavsky, E.; Rosensaft, M.; Morin, E. Hydrometeorological analysis and forecasting of a 3 d flash-flood-Triggering desert rainstorm. Nat. Hazards Earth Syst. Sci. 2021, 21, 917–939. [Google Scholar] [CrossRef]
- Dundas, C.M.; Conway, S.J.; Cushing, G.E. Martian gully activity and the gully sediment transport system. Icarus 2022, 386, 115133. [Google Scholar] [CrossRef]
- Keszthelyi, L.; Dundas, C.; Fergason, R.; Archinal, B.; Kirk, R. Some requirements for future orbital assets to support safe and productive landed missions. In Proceedings of the Concepts and Approaches for Mars Exploration, Houston, TX, USA, 12–14 June 2012. [Google Scholar]
- Garczynski, B.; Horgan, B.; Kah, L.C.; Balci, N.; Gunes, Y. Searching for potential biosignatures in Jezero Crater with Mars 2020—A spectral investigation of terrestrial lacustrine carbonate analogs. In Proceedings of the Ninth International Conference on Mars, Pasadena, CA, USA, 22–26 July 2019. [Google Scholar]
Disclaimer/Publisher’s Note: The statements, opinions and data contained in all publications are solely those of the individual author(s) and contributor(s) and not of MDPI and/or the editor(s). MDPI and/or the editor(s) disclaim responsibility for any injury to people or property resulting from any ideas, methods, instructions or products referred to in the content. |
© 2024 by the authors. Licensee MDPI, Basel, Switzerland. This article is an open access article distributed under the terms and conditions of the Creative Commons Attribution (CC BY) license (https://creativecommons.org/licenses/by/4.0/).